sampela health programme 2007 - opwall.com · for tukak lambung for the oldest two age groups....
TRANSCRIPT

Sampela Health Program 2007 (C. Crawford, J. Wallace, R. Watson, C. Young)
Introduction
“When the earth is sick and polluted, human health is impossible.... To heal ourselves we must heal our planet,
And to heal our planet we must heal ourselves.” Bobby McLeod (Koori activist, aboriginal)
Environmental health comprises those aspects of human health and disease that are determined by factors in the environment. It also refers to the theory and practice of assessing and controlling factors in the environment that can potentially affect health. In recent years, my studies in anthropology have made me question not only the role of the environment in human affaires, but also the impact of human activity on the environment. Within the developing world, the majority of infectious diseases are directly related to people’s lifestyle practices in the context of their surrounding environment. For example, leaving stagnant water uncovered, which then becomes a vital breeding site for mosquito larvae and a possible host for diseases such as Malaria or Dengue Fever. The prevalence of disease increases amongst more rural, impoverished and uneducated societies. Thus there is a need to investigate and understand these communities within the context of both their culture and their environment to ensure better healthcare methods and approaches.
In this aspect, I investigated the medical beliefs of the Bajau (a rural, sea‐faring) society in Southeast Sulawesi, Indonesia and then analyzed the Bajau perceptions of their surrounding environment’s purpose and importance to their health and well‐being. The major aims of my project included the following:
From a health perspective…
• To understand perceptions of health and causation of illness in the Bajau community.
• To understand the Bajau communities’ knowledge of modern medicine.
• To study the contribution of cultural beliefs in the choice of a medical remedy by members of the Bajau community.
From an environmental perspective…
• To explore current attitudes, environmental knowledge and perceptions held by the Bajau on ecosystem structures and functions and how they perceive their place within that environmental system.
From an environmental health perspective…
Focus 1: To evaluate water/wastewater impacts
What is the relation between daily lifestyle practices based on the context of their surrounding environment and the incidence of waterborne disease (Ex. Are the Bajau using latrines? Where is the fresh water supply? Do they use cyanide in fish harvesting? How might the prevalence of disease differ between land and sea‐based communities?)

Focus 2: To investigate local uses of marine resources for health‐related purposes
To what extent might local medicinal practices be affecting the resource abundance or decline? (Ex. Are the Bajau harvesting a resource which might disrupt the ecosystem for their health needs? How might this affect Bajau livelihood needs of food security in the future?)
The project was conducted through Operation Wallacea which has been working in a remote corner of Southeast Sulawesi in Indonesia since 1995 to develop research centers in the Lambusango forest in South Buton Island and on Hoga Island in the Wakatobi Marine National Park. Within the Wakatobi region, I lived in the Bajau Village of Sampela for duration of six weeks while completing my research. Since my time in the village was limited, only Focus 1 of my above pre‐research proposal was investigated. It would be strongly recommended that if the Sampela Health Program were to continue in the following year, that researchers also look into Focus 2. Interview questionnaires as well as raw data have been included within this report to aid future efforts. Please feel free to contact me if you have any questions or concerns.
While conducting research within the village, I was also simultaneously creating a student‐organized group between anthropology students and medical electives at the site to analyze and discuss primary health issues in Sampela and Kaledupa. In the final weeks before my departure, the Sampela Health Program was created as a response to the lack of formalized knowledge between local government, community leaders, and researchers.
Camia Crawford Brown University, RI, USA Anthropology 08
Aims and objectives
The aims and objectives of the Health Issues in Sampela and Kaledupa (HISK) aspect of the Sampela Health Program (SHP) are to investigate the prevalence of hygiene and water quality related health issues on Kaledupa and Sampela, as well as the most important health issues to the Sampela community, with respect to waterborne illnesses and risk associated with daily activities. The aim of these following studies is to enable an understanding of the gaps in the community’s knowledge of healthy behavior, in order to create and deliver an education/information program to reduce the prevalence of water borne diseases. In addition to this, the Sampela Health Program aims to continue annual collections of health and water‐quality data by students of Operation Wallacea. Eventually the program will aim to incorporate community members and train them in the process of data collection and further advance independent community monitoring.
Background
Sama Bahari (otherwise referred to as Sampela) is a village built up from a coral reef flat of approximately 1300 inhabitants lying to the north east of Kaledupa Island, in the Wakatobi region of South East Sulawesi, Indonesia. It is populated by the Bajau people, who are known as the ‘sea gypsies’ since before a government settlement initiative in the 1950’s they lived on house boats and roamed the open seas around the Wakatobi region. Their religion is mostly Muslim, however there is a strong belief in sea and land spirits which take a large role in many households’ central beliefs.
Sama Bahari has 286 households split into three sub dusuns (communities) with an average of four children per household. The majority of the village population is female or under 20 due to the migrant worker nature of the Bajau men. The village is governed locally by a headman, the Kepala Desa, and his family with a close network of

influential mothers and traditional healers, the Sandro/Sanjo. However, on a more regional level there is a local Camat (pronounced chamat), equivalent to a council, which reports to various government officials on the island and region. (put in square footage or kilometers to estimate population density, some more on demographics, number of children, number of people per household).
The structure of the village and its buildings are mostly built atop coral platforms, hacked from the reef itself, or on stilts that rise 8 feet above the low tide. Walkways span across the common paths but individual houses are linked by planks of wood or bamboo poles. However at low tide one can witness local children playing in amongst the coral platforms. The worrying feature of this building strategy is that the toilets and washing facilities perch precariously above channels flowing between houses, which means that due to the flow systems and tides one can regularly see human waste collecting in bottlenecks or even floating out to sea.
The sea gypsy nature of the Bajau people means their main food and income source is the sea and reef itself, and in order to utilize this vast commodity they fish by boat using nets, fences, gleaning at low tide and at times bomb fishing. Another good source of income is agar fishing to sell to multinational corporations for biochemical use, as well as participating as informants in research through the Operation Wallacea program.
It should also be noted that there is no fresh water supply to the village, therefore locals must collect it from a well or spring on Kaledupa for a small price. Although fresh clean water is not a relatively expensive commodity, it must be transported from the mainland to the village offshore. The difficulty in transportation results in limited use of clean water for things other than drinking/cooking such as washing plates/utensils or bathing.
The following sections of the paper will look at the three major sources of data collected by myself and others involved in the HISK study. It begins first with an analysis if data collected from the Kaledupa Medical Center, followed by responses from community informant interviews, and finally water quality data comprised within spatial mapping.
HISK study 1) Kaledupa Medical Center reports Data from the Kaledupa Medical Center’s records, in a town half a mile from Sama Bahari, was entered into an excel document, by monthly presentations of each illness by age groups, which were 0‐4, 5‐14, 15‐44 and 45‐59 years of age. From May 2006 until June 2007 the reported illnesses were
• Diarrhea • Dysentery • Tuberculosis • Malaria • Worms • Respiratory infection • Diabetes • Anemia
• Hypertension • Tukak Lambung (?) • Accidental injuries • Skin infection • Skin Allergy • Bronchitis • Asthma • Eye infections
This data was analyzed by;
• Annual distribution of all illnesses • Annual distribution by age group, of illnesses related to water and hygiene
Diarrhea Dysentery Malaria
Worms Skin infection Skin allergy
• Annual distribution of the most prevalent water and hygiene related illnesses

Analysis
Graph 1. Age range comparison of the total number of presentations per illness, to the Kaledupa medical centre from May 2006 until June 2007.
This graph shows that the highest number of presentations was for respiratory infections across all age groups, with the 15‐44 age group having the highest number of presentations. The second highest number of presentations was for skin allergy across all age groups but was for Tukak Lambung for the oldest two age groups. Chronic disease such as diabetes, anemia and asthma were highest amongst the oldest age group.
Graph 2. Annual distribution of hygiene
This graph shows that the most significant
there is
Graph 3. Annual distribution of hygiene
By contrast to graph 2, the illness with the
n
are
e highest number ).
related illness presentations in the 0‐4 agegroup.
illness in this age group is diarrhea with a peak number of presentations in November (12). At the same time a corresponding increase in the second most prevalent illness; skin infections, which have three annual peaks in June, November and the most significant peakin February (5). Overall the trend is for a steady increase in cases of diarrhea from July to November and then a decline until February.
related illness presentations in the 5‐14 age group.
most presentations is skin infection, however with a similar time course as diarrhea in graph 2. There are three peaks, the first in June and July, and thean increase to the highest number of presentations in November (10) whichvery similar in both time and number to diarrhea cases in graph 2. Comparatively diarrhea has few cases with th
of presentation in December (3

Graph 4. Annual distribution of hygiene related illness presentations in the 15‐44 age group.
infection throughout the year; however there were more cases of
r
.
raph 5. Annual distribution of hygiene related illness presentations in the 45‐59
ows that the illness with the highest number of presentations is again
d 4
of diarrhea presentations across all age groups
youngest age group (0‐4 years) and has a peak number of
mber
This graph shows that the most prevalent illness is skin
eye infection in may (4 cases compared to 3). Similarly to graph 3 there are three peaks of skin infection presentations, the first in September ( 5 cases) the second has a similar but longer time course to graph 3 from November until January (5 cases).However the highest number of cases was at the same time as a peak ingraph 3 during April, however the numbeof cases was 8 compared to 5 in graph 3
G
age group.
This graph sh
skin infection. Similarly to graph 4, there is a high number of eye infections in May (7)cases, and there are three annual peaks ofskin infection presentations. Each peak occurs at very similar times of year to those in graphs 3 and 4, the highest however is at a different time, occurring inSeptember (15 cases) followed by a second in December (9 cases). With thelast peak earlier than in graphs 3 anoccurring in March (7 cases).
Graph 6. Annual distribution of the number
Graph 6 shows that diarrhea is the most prevalent in the
presentations in November (12). The other age groups have a peak one month later in December, however the nuof presentations is much less (1,2 and three cases in increasing age groups)

Graph 7. Annual distribution of the number of skin infection presentations
skin infection has varying rates of presentation amongst the
f
and in
late
shows that the two most significant water and hygiene related illnesses are diarrhea and skin infection. It also shows that the prevalence of each differs between age groups, with diarrhea cases being higher in the 0‐4 age group and
groups, with peak numbers of presentations occurring between September to December and February to April, for most water and hygiene related illnesses, but more
rs between age groups, but one can assume that the youngest age group are more susceptible to poor water quality and rely on others for their personal hygiene, therefore the
e and
ave limitations, as the Kaledupa medical centre only has a small percentage of patients from Sama Bahari, and there is also massive under reporting of illnesses amongst the Bajau people, not only to the Kepala Desa but also to
ealth related data from the region and is therefore useful in identifying major diseases and their effect on health by age group and season, and owing to the close proximity and interactions between Sama Bahari
across all age groups
This graph shows that
age groups as well as at different times othe year. The highest number of presentations is in September, December and March in the eldest age groupNovember and April by the two middle age groups. Surprisingly the youngest age group does not have as high numbers ofpresentations as other age groups. The are two rough peaks during the year, between September and December, andfrom March to May. These could correwith changes in season, water flow and
Conclusions
wind direction altering the type of pathogen/route of transmission.
The data collected
skin infections having similar numbers of cases in the other three age groups.
There is also a pattern in the annual distribution of illnesses throughout all age
specifically for diarrhea and skin infections across all age groups.
There is no definite reason why the number of presentations diffe
prevalence of diarrhea is higher but skin infections is lower. Conversely older age groups are more self reliant on hygienare able to obtain cleaner water, therefore reducing the number of diarrhea presentations. However they have a more activelifestyle leading to a higher risk of injury with a complicating skin infection, giving a higher number of skin infections in the oldest three age groups.
Limitations
This study does h
government and health care officials.
However it is the largest collection of h
and Ambewa (where the medical centre is located) we can assume that the same seasons, tides and reef structure affect each village similarly.

HISK study 2) Community Interviews
The second part of the HISK study was on a one to one basis in the community. It was in the form of an interview and questionnaire with the head of a household (usually the wife/mother) using several interpreters. In‐depth interviews were conducted with 39 people throughout the village and took approximately one hour long. The structure of the interviews and questionnaires were to:
1. Introduce ourselves to the community
2. Discuss and record health beliefs and behavior
3. Identify differences or unconventional views on health, hygiene and risk taking behavior
The questionnaire included sections and questions on • Water and sanitation
– Where they get water from
– Do they boil it, and why?
• Sickness and disease
– Recent illnesses by season
– What causes illness
– Recent family deaths
• Medical treatment
– Ranking what services they use by illness
• Government health program
– What they know about it
– If they use it, why so/not
At the end of the questionnaire was a risk assessment of various daily activities, which each interviewee was asked to rank as high, medium, low or no risk at all. Three sets of interviewees were sought out for this section including normal members of the community, local experts by profession and foreign experts by educational level (Opwall volunteers/staff). The areas assessed were;
• Collecting firewood in the mangroves
• Falling from a bridge
• Night gleaning
• Bomb fishing
• Walking/swimming at high tide
• Getting a vaccine
• Walking/swimming at low tide
• Drinking un‐boiled water
• Drinking coffee
• Drinking alcohol
• Smoking
• Eating sweets
• Eating raw fish
• Cooking a meal
• Disposing of waste around the house
• Getting malaria
• Having diarrhea
• Socializing with people with diarrhea

Results
Water and Sanitation
Graph 8. Percentage distribution of interviewee’s water related behaviors
There are two significant things to observe in this graph. 1.) Although the majority of individuals claim to always boil their water, many of them are only boiling their water until they see bubbles (and not for the recommended5 minutes by WHO). Additionally, while individuals acknowledge boiling water prevents them fromgetting generally sick, only a few were able to specifically list commowaterborne illnesses.
that
n
Sickness and disease
Graph 9. Reported dry season illnesses
During the dry season, a majority of
Graph 10. Reported wet season
In contrast to Graph 9, major illnesses
y
individuals claimed that headache andflu were the most common illnesses. This may due to over exhaustion and dehydration from diarrhea. Increase inFlu could be due to even less sanitary conditions.
illnesses
of the wet season were diarrhea and malaria thus suggesting that there mabe a correlation between prevalence of specific illnesses and type of season.

Graph 11. Reported frequency of diarrhea per interviewee and their family
Due to a lack of inconsistency in answers and the possible sensitive or embarrassing nature of the question, there are no conclusions that can be concretely made.
Graph 12. Various causes given by interviewees for diarrhea
The top two reasons for causes of diarrhea given by individuals were associated with eating invertebrates or the wet season. Interestingly, if fecal matter is being disposed into the surrounding reef flat where Bajau villagers collect invertebrate species from, a direct link can be identified between people’s waste and eating patterns in relation to diarrhea.
Graph 13. Percentage of total deatper age group, and the main causes of death.
hs
Although the study focused deeply on water and diarrheal patterns, during interviews it was discovered that “yellow sickness” which was linked with black magic had symptoms which closely related Hepatitis B (perhaps an even graver danger and public health concern for the village).

First treatment choice per illness
0102030405060708090
Malaria
Diarrhoea
Skin rashes
Ear infections
Stomach ache
Eye infections
FeverPe
rcen
tage
of interview
ees
doctor/hospital
traditional healer
self remedy
Medical Treatment
Graph W. First Treatment Choice per Illness
The following graph demonstrates a high preference for self remedy for the majority of common illnesses related to poor water quality. While preference for traditional healers and doctors vary depending on illness, they are sought almost equally in cases of diarrhea. A public health program targeted will thereby need to include both practices for it to be effective.
Graph X. Combined risk assessment score of daily acby the Sampela communit
tivities y
While Diarrhea is easily identified
vities
l,
Thus
t
Graph Y. Combined risk
Interestingly this illustrates how
as a high risk amongst the community, behavioral actiwhich may cause diarrhea (i.e. Walking low tide, waste disposaraw fish, interacting with people who have diarrhea) are not acknowledge as major risks. the link between disease and related causal behavior are noidentified in the population.
assessment score
culture and education can influence perceived risk. Asshown, local and western expertsnoted waste disposal and walking in low tide far more dangerous than the local non‐expert.

Conclusions
in this aspect of the HISK study reveal several important findings. Most importantly we discovered that diarrhea was most prevalent during the wet season and that there is little understanding amongst
rease
finitive source of treatment sought when people experienced signs of diarrhea. Since the majority of water‐borne illness symptoms were reportedly treated by self‐remedy, it could mean an
.
al limitations within this study that are difficult to know the depths of, but should surely be acknowledged. Like any interview it is challenging to know whether the interviewee is being completely honest
ate a
y given a
ulture will inherently place different risk values on different things based upon their familiarity with the thing/experience or
rrhea,
h
each of the three sub‐dusuns throughout the village asking whether they had experienced Malaria, Hepatitis B, Cholera, Flu, or Diarrhea within the last six
t to h
The data collected
the community between diarrhea and other water‐borne related illnesses and the behaviors which may incrisk – such as, walking through the channels at low tide when feces have yet to be flushed, not boiling water for a long enough period of time or not at all, and eating raw invertebrate species which may be contaminated with human feces in the environment.
In addition to this, there was no de
under reporting in the incidence of disease. Additionally, since both traditional healers and Kaledupan doctors are sought by depending upon a family’s wealth or cultural preference, there can be no clear way for a public health approach within the village. Telling people to change certain behaviors will not be the answer, since the Bajau, a nomadic people, have never listened to any outside body other than the spirits which they feel akin to
Limitations
There were sever
regarding sensitive and personal questions. Although every effort was made to ensure confidentiality and crespace where interviewees to feel comfortable, nonetheless, our most inaccuracy was regarding the number of times an individual experiences symptoms of diarrhea in the month. It should also be acknowledged, that although a sensitive question to be asked by a foreign stranger, the Bajau people do not quantify experiences bdays or times as we in the western world do. Instead they might classify things in terms of happening morecertain season and happening less in a different season (as seen in the wet/dry season graphs).
Finally, the concept of risk is difficult t describe and also to measure cross‐culturally since each c
their educational knowledge of it. For example, the Bajau may not cite mangrove harvesting as particularlydangerous because they are well skilled in the art of using a knife to chop down trees, whereas a foreigner might find this task incredibly dangerous. Similarly, the Bajau might acknowledge malaria as a greater risk than diabecause if an individual contracts malaria even just once, they may die. Yet, an individual can contract diarrhea numerous times throughout their lifetime and not die due to it. Child mortality, common and often caused by diarrhea is widely accepted amongst the community and thereby often to be expected among one to several of awoman’s births. The risk assessment thereby aids us in understanding these social and cultural differences whicmay dictate the need for multi‐faceted public health approaches.
*Note: A basic questionnaire was distributed to each household in
months. This was done under insistence of the Kepala Desa. While our team attempted to make the rounds among the village, the Kepala Desa insisted to organize the event himself and give me the results. When I wencollect the result, all forms were filled out the same, with alarmingly high reports of cholera and malaria, whicwould assume everyone in the village had cholera and should therefore be dead or incredibly ill. The documents were falsified – for what reason I am unaware. Most likely, I believe, it was a claim of strong desire for more medical attention to be brought to the community. We did not use this data in our final summaries.

HISK study 3) Water Quality and Spatial Mapping
The third aspect of the HISK study is quantitative in comparison to the other components but aids in spatially diagnosing environmental health hazards within the landscape of the community. For the period of my stay, there were several main factors that were being measured or monitored on a regular basis. They were the following:
• Recording % Dissolved Oxygen on both a high and low tide
• Mapping bridges and major pathways throughout the community
• New houses which have yet to be recorded in the last two years
• Areas of large debris or build‐up
• Surrounding landscape around the village (deep channel, reef flat)
• Weather patterns in different seasons
The compilation of all of these factors allowed us to create a series of spatial maps which allow us to correlate increasing population with an already strained ecosystem and the health consequences which arise due to these impacts.
Map 1. Sama Bahari Village
Here one can see the existing village in beige, major roads and paths in gray, smaller paths in navy as well as new houses in navy. The predominant expansion of houses now reaches further out onto the reef flat in the northeastern and southeastern directions. (not to scale, approximate length)

Map 2. Transect Grid
This map clearly defines the grid amongst which the DO transects took place. Both red and blue spots correlate to sites of DO measurement.
Map 3. Physical Sightings
This map clearly indicates the locations of heavy debris buildup within certain channels as indicated by pink lines. Large presences of upside down jellyfish of trash build‐up are marked by small pink dots and indicate stagnant pools of water. Additionally listed are the common swimming areas for children and the present wind direction during the wet and windy season.

Map 4. DO Results
Each DO testing site (indicated by the blue dot) shows both low tide and high tide testing results. The darkest shades of blue indicate a healthy/normal DO reading while the lightest shades of blue indicate the worst areas. What can be inferred from this data are the locations where areas of the village are flushing on a high tide or due to wind, but whereto other central areas arnot (1. quadrants quadrants A6‐A7)
e
C7‐C8 2.
DO monitor reading:
sub optimal <6.0ppm optimal 6‐9.0ppm above optimal >9.0ppm
Map 5. Final Compilation
This final lap overlays the s
wind
to
blem
transect points, with debrisightings, wind direction, and high and low tide DO averaged results. Vis a Visthe overlay, we can demonstrate that thedirection and channel location on the westernborder of the village helpflush its outermost sections. Additionally, there is a direct correlation between debris build‐up and the worst DO results, helping us to understand where proareas exist within the village.

Limitations
this research are mostly in regard to the valuation of error in the dissolved oxygen meter and its ability to make inferences about the quality of the water alone. Typically, a traditional analysis of water quality
ing
indings and Recommendations
ns made during my brief time in Sampela, there are several recommendations I would like to make to both the community and regional government as well as the Operation
database which more accurately documents health incidents within the community
This l as well as build a database of medical history, which the community can then use when advocating for government aid. If the
ers part
ta
community health‐workers who are educated in basic public health training
Dur t mmunity health but also a high infant mortality rate. By talking to local officials and traditional healers in conjunction with our
l Bajau
as traditional healers in Sampela
Pres l from one another – the Kaledupa Health Office, the Government Sanitation worker, the traditional healers of Sampela.
ly
The limitations of
regarding health issues would incorporate DO monitoring, Nitrogen monitoring as well as fecal coli form testing. The data from the DO meter, although incomplete, still allows us to identify areas of water within the channels that are aerated more frequently or less frequently. With less aeration we can assume, that waste products are not flushing completely from the village and are present. On several occasions I noted fecal sightings while pursthe DO monitoring around the village. Additionally, while wind and debris factors are identified through observation only they help to paint the larger scenario and are important factors in understanding water quality in Sampela.
F
Based upon the data collected and observatio
Wallacea Program.
1. Creating a
wil allow medical electives with the Operation Wallacea program to increase data collections skills
community cannot show evidence of a need for more monetary support or medical supplies, the government doesnot sponsor them – with a detailed medical database, the community will have the tools necessary to advocate for aid. Overall Kaledupa medical records exist, but comparable records do not exist for Sampela. Our team’s recommendations include the monitoring of child/infant mortality data, as well as the incidence of Malaria, Hepatitis B and Diarrhea. Opwall students/researchers should work collaboratively with community membwho volunteer to be health advocators to collect this data. It would be best if community members also tookin the comparative data analysis so that they too begin to understand the importance and significance of this daand how to use it.
2. Establishing
ing he course of this study we noticed a distinct effect of water quality and use on not only co
short season in Indonesia, we feel that the most productive way to attempt to address the high prevalence of water borne diseases is to set up a community education program that is not only community run but self sustaining. Thus establishing a community health corps is vital. Basic health lessons might include training in boiltime as well as basic hand and food situation. Those designing these programs should be respectful of locaculture and not only suggest western educational techniques.
3. Coordinate with the local health clinic in Kaledupa as well
ent y, all three factions of the health and sanitation work in Kaledupa/Sampela remain separate
While all three sectors provide service to the people of Sampela, their work is not one of collaboration. By establishing a framework by which all three sectors can coordinate and collaborate with one another will greatincrease efficiency, local medical knowledge and access to resources.

4. Support and develop health infrastructure and growth within the community as part of the medical electives program
With Operation Wallacea’s vast wealth of resources, this seems like the perfect opportunity to have a fully engaging medical elective program with a local community as well as an opportunity to return vital services to the community where the extract much of their research from. It could begin with medical electives, documenting data, providing emergency service, and community awareness.
5. Invite team of environmental engineers to conduct research in flow in channels and make possible recommendations/changes to existing channel system
The issue of debris build‐up is one not to be answered by social scientists of medical electives. Instead, professionals are needed to evaluate consequential risks that unblocking the channels might due to the adjacent reef flat as well design a method for increasing water flow through the channels and preventing debris build‐up. This may pose as an attractive hands‐on opportunity to faculty and a team of students at an engineering university.
6. Discuss housing expansion with Kepala Desa and develop a plan to deal with increasing population
The rapid increase in population in such a densely packed area is undoubtedly causing detrimental affects on the people’s health that live within the area as well as the functioning of the nearby ecosystem. It would be wise to start planning for alternatives to cope with the pressure of an increasing population with the Kepala Desa – one might ask if another Bajau village could be built nearby or perhaps a better system of creating channels between houses to ensure water flow throughout the village.
7. Build freshwater tap via channel from Kaledupa to Sampela or standing reserve in community
Limited access to freshwater is one of the main reasons that the people of Sampela do not use freshwater to clean dirty dishes. Instead they opt to clean the dishes in the same salt water that feces are disposed in thereby increasing chances of fecal coli form contamination when eating. A freshwater tap or barrel reserve might help to reduce this risk.
8. Conduct testing of invertebrates for consumption of human fecal matter
Noting that many people in the community identified eating invertebrates as a source of diarrhea it would be wise and of good purpose to conduct testing of the invertebrates they are eating. If they test positive for coli form, the community should be notified and advised of other locations to glean or perhaps cook invertebrates thoroughly before eating.
9. Create composting toilets beneath stilt houses
There have been many tactics for creating composting toilets to ensure better sanitation within a village. If possible, one might want to look into the possibility of developing composting toilets beneath houses that have a coral reef platform built beneath them. Using the coral rock as a method of filtration and composting, the amount of open fecal substances into the environment can be decreased.
10. Develop reef platform where waste disposal can be burned
Presently, the method of disposing of trash and garbage is to directly throw it into the surrounding ocean, posing a major threat to surrounding animals and plants in the ecosystem. Although burning trash is often prevented due to its offset of carbon emissions, burning the trash within the village will have small effects in comparison to directly disposing of it into the ocean. It would be recommended that fires are well controlled and the platform is in a direction that will not be greatly affected by wind direction nor cause risk to burning of neighboring homes.
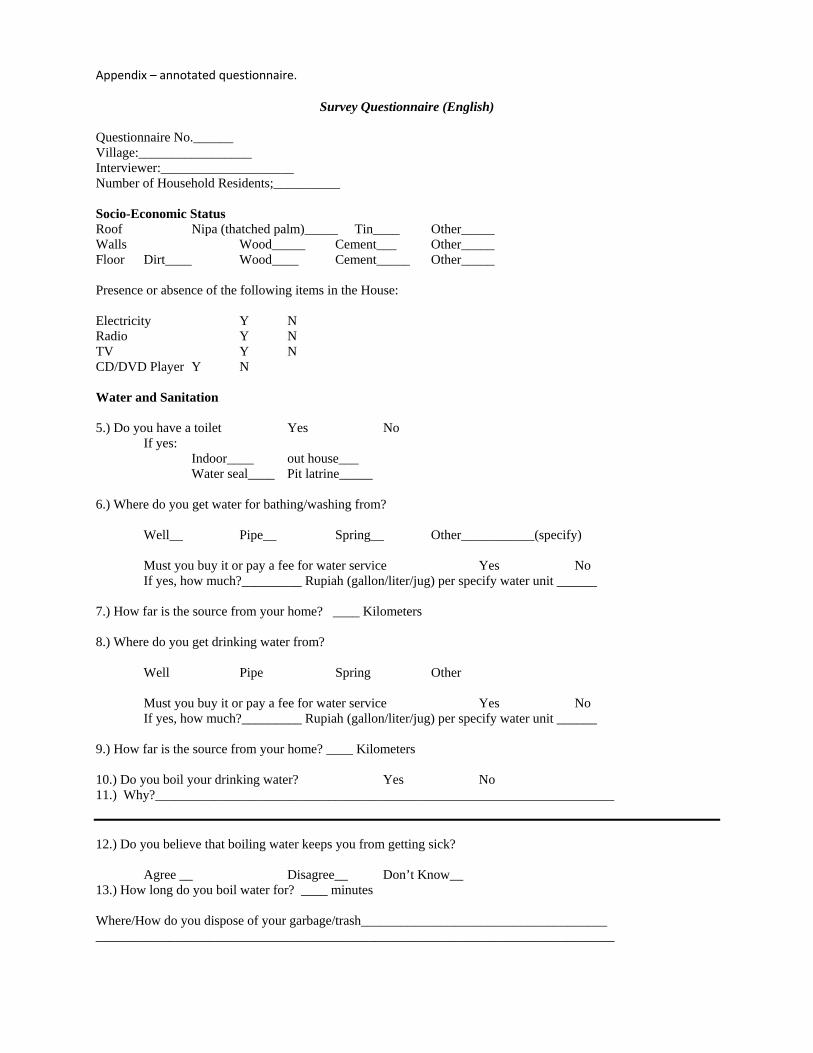
Appendix – annotated questionnaire.
Survey Questionnaire (English) Questionnaire No.______ Village:_________________ Interviewer:____________________ Number of Household Residents;__________ Socio-Economic Status Roof Nipa (thatched palm)_____ Tin____ Other_____ Walls Wood_____ Cement___ Other_____ Floor Dirt____ Wood____ Cement_____ Other_____ Presence or absence of the following items in the House: Electricity Y N Radio Y N TV Y N CD/DVD Player Y N Water and Sanitation 5.) Do you have a toilet Yes No
If yes: Indoor____ out house___ Water seal____ Pit latrine_____ 6.) Where do you get water for bathing/washing from?
Well__ Pipe__ Spring__ Other___________(specify) Must you buy it or pay a fee for water service Yes No If yes, how much?_________ Rupiah (gallon/liter/jug) per specify water unit ______
7.) How far is the source from your home? ____ Kilometers 8.) Where do you get drinking water from?
Well Pipe Spring Other Must you buy it or pay a fee for water service Yes No If yes, how much?_________ Rupiah (gallon/liter/jug) per specify water unit ______
9.) How far is the source from your home? ____ Kilometers 10.) Do you boil your drinking water? Yes No 11.) Why?_____________________________________________________________________ 12.) Do you believe that boiling water keeps you from getting sick?
Agree __ Disagree__ Don’t Know__ 13.) How long do you boil water for? ____ minutes Where/How do you dispose of your garbage/trash_____________________________________ ______________________________________________________________________________

Sickness and Disease 14.) How often do you get intestinal diarrhea sickness in one month?
Frequently Often Seldom Never (you may want to ask this differently and next question as well : How often do you get intestinal diarrhea sickness
at least once a week at least once a month less than once a month never 15.) How frequently do members of your family get intestinal diarrhea sickness in one month?
Frequently Often Seldom Never 16.) In your opinion, what causes this sickness? ____________________________________________________________________________________________________________________________________________________________ Medical Treatment 17.) Who do you see for treatment when you get sick? Health worker Traditional Healer Family Member Doctor Other _______ Nobody 18.) Do you take any medicines when sick? Yes No 19.) If yes, what kinds? First response_______________________________________________
Second response_____________________________________________ Third response______________________________________________
Do you ever use traditional or herbal remedies instead of drugs from the pharmacy? Yes No Why?__________________________________________________________________ 20.) Do you harvest any creatures from the ocean for medicinal purposes? Yes No
If yes, What kind/names of creatures?_____________________________________ 21.) Why?__________________________________________________________________ Optional/Additional Q’s: 22.) Do you cover your food after cooking? Yes No Why?__________________________________________________ 23.) How long do you leave your food out before you throw it away as “spoiled”? __________hrs Personal information 1.) Age _____ years 2.) Gender Male Female 3.) Ethnicity _______________________ (self identified) 4.) Educational level ____yrs formal schooling)

Survey Questionnaire (Bahasa Indonesia)
NO kuisioner :______ Desa:_________________ Pewawancara:____________________ Jumlah anggota keluarga:__________ Status social dan ekonomi Atap rumah Nipah_____ Seng/Genteng____ Lainnya_____ Dinding rumah Kayu_____ Semen___ Lainnya_____ Lantai rumah Kayu_____ Semen___ Lainnya_____ Ada atau tidak hal-hal dibawah ini di dalam rumah: Listrik Y N Radio Y N TV Y N CD/DVD Player Y N Air dan Kesehatan Apakah Anda mempunyai toilet (WC)? Ya Tidak
Jika Ya: Di dalam rumah ____ di luar rumah___ Jenis:
Hilang dengan disiram air______ jumbleng (lubang tanah , ditutup setelah dipakai dan kotoran dibiarkan )_____ lubang tanah_____
Dimana Anda memperoleh air untuk mandi dan mencuci?
sumur__ pipa ledeng__ air sumber __ lainnya___________(jelaskan)
Apakah Anda harus membeli air atau membayar iuran untuk layanan air? Ya Tidak Jika ya, berapa harganya?_________ Rupiah (gallon /liter /kubic ) tiap satuan unit air
Seberapa jauh tempat mengambil/membeli air dari rumah anda? ____ Kilometer Dari mana asal air minum yang Anda dapatkan?
pipa ledeng sumur air sumber lainnya___________(jelaskan)
Apakah Anda harus membeli air atau membayar iuran untuk layanan air? Ya Tidak Jika ya, berapa harganya?_________ Rupiah (gallon /liter /kubic ) tiap satuan unit air
Seberapa jauh tempat mengambil/membeli air dari rumahmu? ____ Kilometer Apakah Anda memasak air yang akan diminum? Ya Tidak Mengapa?_________________________________________________________________

Apakah Anda percaya bahwa merebus air minum akan mencegah Anda dari sakit perut?
Setuju __ Tidak setuju__ Tidak Tau__
Berapa lama Anda mererbus air ? ____ menit Dimana dan bagaimana Anda membuah sampah ? _____________________________________ ______________________________________________________________________________ Sakit dan Penyakit Seberapa sering anda mengalami diare perut dalam satu bulan?
Sangat sering ___ Sering___ Jarang____ Tidak pernah_____
Seberapa sering anggota keluarga Anda terkena penyakir diare perut dalam satu bulan?
Sangat sering ___ Sering___ Jarang____ Tidak pernah_____ Menurut Anda, apa sebab-sebab penyakit sakit perut (diare)? ____________________________________________________________________________________________________________________________________________________________ Perawatan Medis Bila Anda sakit, anda pergi ke siapa/kemana? Pegawai kesehatan Dukun Anggota keluarga Dokter Lainnya Tidak kemana-mana Apakah Anda meminum obat bila sakit? Ya tidak Jika iya, obat apa ? Tindakan pertama ____________________________________________
Tindakan kedua _____________________________________________ Tindakan ketiga _____________________________________________
Apakah Anda pernah menggunakan obat traditional atau obat dari tumbuh-tumbuhan dan hal tersebut lebih Anda Sukai daripada obat dari apotik?
Ya Tidak Mengapa?__________________________________________________________________ Apakah Anda menggunakan jenis hewan/tumbuhan dari laut untuk obat (misal rumput laut)?
Ya Tidak JIka iya, Jenis /Apa nama hewan/tumbuhan tersebut _____________________________
Mengapa?__________________________________________________________________ Pertanyaan tambahan (tidak wajib) Apakah Anda menutupi masakan anda setelah selesai memasak? Ya Tidak
Mengapa?__________________________________________________ Seberapa lama Anda membiarkan makanan Anda diluar sebelum Anda buang di tempat sampah (basi)?
__________jam Informasi pribadi

Umur _____ tahun Jenis Kelamin Laki-laki_____ Perempuan______ Suku _______________________ (self identified) Tingkat pendidikan _______tahun sekolah formal ( misal : tamat SD=6 tahun, SMP= 9 tahun, SMA = 12 tahun, Perguruan tinggi=16 tahun)