sarc report for anne darling elementary · anne darling elementary ... district's scope and...
TRANSCRIPT

Anne Darling Elementary
By February 1 of each year, every school in California is required by state law to publish a School Accountability Report Card (SARC).The SARC contains information aboutthe condit ion and performance of each California public school. Under the Local Control Funding Formula (LCFF) all local educat ional agencies (LEAs) are required toprepare a Local Control and Accountability Plan (LCAP), which describes how they intend to meet annual school-specific goals for all pupils, w ith specific act ivit ies toaddress state and local priorit ies. Addit ionally, data reported in an LCAP is to be consistent w ith data reported in the SARC.
For more information about SARC requirements, see the California Department of Educat ion (CDE) SARC Web page at http://www.cde.ca.gov/ta/ac/sa/.
For more information about the LCFF or LCAP, see the CDE LCFF Web page at http://www.cde.ca.gov/fg/aa/lc/.
For addit ional information about the school, parents/guardians and community members should contact the school principal or the district office.
DataQuest
Internet Access
California Department of Education
School Accountability Report CardReported Using Data from the 2016-17 School Year
DataQuest is an online data tool located on the CDE DataQuest Web page that contains addit ional information about this school and comparisons of the school tothe district and the county. Specifically, DataQuest is a dynamic system that provides reports for accountability (e.g., test data, enrollment, high school graduates,dropouts, course enrollments, staffing, and data regarding English learners).
Internet access is available at public libraries and other locat ions that are publicly accessible (e.g., the California State Library). Access to the Internet at librariesand public locat ions is generally provided on a first-come, first-served basis. Other use restrict ions may include the hours of operat ion, the length of t ime that aworkstat ion may be used (depending on availability), the types of software programs available on a workstat ion, and the ability to print documents.
Mr. Ronald Hammond, PrincipalPrincipal, Anne Darling Elementary
Anne Darling’s Professional Learning Community is committed to the success of every student. Our school supportsstudents’ academic skills in the classroom through different iated small group work in language arts and math, and rigorouswhole group work using culturally responsive instruct ional strategies across all content areas to help students buildconnect ions to our school community and engage in academic collaborat ive conversat ions. Instruct ion is aligned to ourdistrict 's scope and sequence and the Common Core State Standards, while ongoing assessment allows teachers to adjusttheir instruct ion to meet the needs of students throughout the school year. Teachers at Anne Darling workcollaborat ively to support high quality instruct ion for all students, incorporat ing technology, crit ical & creat ive thinking skills,collaborat ion, communicat ion skills, and problem-solving strategies to support a comprehensive global educat ion. Englishlanguage learners are given focused support in all classrooms, and in grades K-3 there is at least one Academic LanguageAcquisit ion (ALA) classroom, where primary language is supported as students acquire language skills in English. Thecampus is new ly renovated, and the site is current ly implementing consistent behavior expectat ions through a systemcalled PBIS (Posit ive Behavior Intervent ions and Supports) to further support student learning and develop a sense ofshared pride in each student ’s progress and academic success.
Anne Darling Elementary333 North 33rd St.San Jose, CA 95133-1634
Phone: 408-535-6209E-mail: [email protected]
About Our SchoolAbout Our School
ContactContact

Last updated: 1/3/2018
Last updated: 1/10/2018
About This School
Contact Information (School Year 2017-18)Contact Information (School Year 2017-18)
District Contact Information (School Year 2017-18)
District Name San Jose Unified
Phone Number (408) 535-6090
Superintendent Nancy Albarrán
E-mail Address [email protected]
Web Site http://www.sjusd.org
School Contact Information (School Year 2017-18)
School Name Anne Darling Elementary
Street 333 North 33rd St.
City, State, Zip San Jose, Ca, 95133-1634
Phone Number 408-535-6209
Principal Mr. Ronald Hammond, Principal
E-mail Address [email protected]
Web Site http://www.sjusd.org/darling/
County-District-School(CDS) Code
43696666048433
School Description and Mission Statement (School Year 2017-18)School Description and Mission Statement (School Year 2017-18)
Vision StatementPreparing today’s students to be the thinkers, leaders, and creators of tomorrow.
Mission StatementUnit ing as one community, we elevate opportunit ies for all.
Anne Darling serves a culturally and lingust ically diverse group of students w ithin an urban environment. Our school has three academic program pathways tosupport student learning outcomes. Our Academic Language Acquisit ion (ALA) program for nat ive speaking students, a modified transit ional bilingual programwith primary language maintanance and development in the K-3rd grades. Our Structures English Immersion (SEI) is our init ial placement of all English Learnerswhose parents have not requested our ALA program. Teachers focus on English language development (ELD) and SpecificallyDesigned Academic Instruct ion inEnglish (SDAIE). Our Therapuet ic Special Day Class is a fully integrated special day class in which students receive specialized small group instruct ion andtherapuet ic supports.
2016-17 SARC - Anne Darling Elementary
Page 2 of 21

Last updated: 1/5/2018
Last updated: 1/5/2018
Student Enrollment by Grade Level (School Year 2016-17)Student Enrollment by Grade Level (School Year 2016-17)
Grade Level Number of Students
Kindergarten 57
Grade 1 73
Grade 2 75
Grade 3 66
Grade 4 64
Grade 5 80
Total Enrollment 415
Kindergarten Grade 1 Grade 2 Grade 3 Grade 4 Grade 50
10
20
30
40
50
60
70
80
90
Student Enrollment by Student Group (School Year 2016-17)Student Enrollment by Student Group (School Year 2016-17)
Student Group Percent of Total Enrollment
Black or African American 1.0 %
American Indian or Alaska Nat ive 0.5 %
Asian 10.6 %
Filipino 1.2 %
Hispanic or Lat ino 79.8 %
Native Hawaiian or Pacific Islander 0.0 %
White 5.8 %
Two or More Races 1.2 %
Other -0.1 %
Student Group (Other) Percent of Total Enrollment
Socioeconomically Disadvantaged 86.0 %
English Learners 54.0 %
Students w ith Disabilit ies 9.4 %
Foster Youth 0.0 %
2016-17 SARC - Anne Darling Elementary
Page 3 of 21

Last updated: 1/24/2018
Last updated: 1/24/2018
A. Conditions of Learning
State Priority: Basic
The SARC provides the follow ing information relevant to the State priority: Basic (Priority 1):
Degree to which teachers are appropriately assigned and fully credent ialed in the subject area and for the pupils they are teaching;Pupils have access to standards-aligned instruct ional materials; andSchool facilit ies are maintained in good repair
Note: “Misassignments” refers to the number of posit ions filled by teachers who lack legal authorizat ion to teach that grade level, subject area, student group, etc.
* Total Teacher Misassignments includes the number of Misassignments of Teachers of English Learners.
Teacher CredentialsTeacher Credentials
Teachers School District
2015-16
2016-17
2017-18
2017-18
With Full Credent ial 19 23 23 1427
Without Full Credent ial 1 2 0 34
Teachers Teaching Outside SubjectArea of Competence (w ith fullcredent ial)
1 1 0 11
2015-16 2016-17 2017-180
5
10
15
20
25Teachers with Full Credential
Teachers without Full Credential
Teachers Teaching Outside Subject Area of Competence
Teacher Misassignments and Vacant Teacher PositionsTeacher Misassignments and Vacant Teacher Positions
Indicator2015-
162016-
172017-
18
Misassignments of Teachers of EnglishLearners
0 0 0
Total Teacher Misassignments* 0 0 0
Vacant Teacher Posit ions 0 0 0
2015-16 2016-17 2017-18-1.0
-0.5
0.0
0.5
1.0Misassignments of Teachers of English Learners
Total Teacher Misassignments
Vacant Teacher Positions
2016-17 SARC - Anne Darling Elementary
Page 4 of 21

Last updated: 1/16/2018
Year and month in which the data were collected: January 2018
Quality, Currency, Availability of Textbooks and Instructional Materials (School Year 2017-18)Quality, Currency, Availability of Textbooks and Instructional Materials (School Year 2017-18)
Note: Cells w ith N/A values do not require data.
SubjectTextbooks and Instructional Materials/year of
AdoptionFrom Most Recent
Adoption?Percent Students Lacking Own Assigned
Copy
Reading/Language ArtsElementary Core Curriculum
Yes 0.0 %
Mathematics Yes 0.0 %
Science Yes 0.0 %
History-Social Science Yes 0.0 %
Foreign Language Yes 0.0 %
Health Yes 0.0 %
Visual and Performing Arts Yes 0.0 %
Science Lab Eqpmt (Grades9-12)
N/A N/A 0.0 %
2016-17 SARC - Anne Darling Elementary
Page 5 of 21

Last updated: 1/12/2018
Last updated: 1/5/2018
School Facility Good Repair StatusYear and month of the most recent FIT report: September 2017
Overall Facility RateYear and month of the most recent FIT report: September 2017
School Facility Conditions and Planned ImprovementsSchool Facility Conditions and Planned Improvements
Anne Darling originally opened in 1930. The last site renovat ion was in 1972. Extensive renovat ion and construct ion has been completed as part of an overall sitemodernizat ion. New kindergarten buildings were completed during the summer of 2006. Primary grade classrooms were reconfigured for the 2006-2007 schoolyear. A new two-story classroom building and cafeteria were opened during the 2007-2008 school year. The new two-story classroom building includes newstudent bathrooms. Primary bathrooms were also renovated as part of the site modernizat ion during summer, 2008. An art ificial turf soccer field and sitelandscaping were also part of this phase of the project. A new media center and administrat ion building was completed during the 2008-2009 school year. Thereis a new blacktop area for foursquare, basketball and tetherball. The school has a full-t ime custodian. A night crew comes to the site daily to clean classrooms, anda grounds crew maintains the yard and outdoor area weekly.
The facilit ies were inspected on 9/11/16.
System Inspected Rating
Repair Needed andAction Taken or
Planned
Systems: Gas Leaks, Mechanical/HVAC,Sewer
Good
Interior: Interior Surfaces Good
Cleanliness: Overall Cleanliness,Pest/Vermin Infestat ion
Good
Electrical: Electrical Good
Restrooms/Fountains: Restrooms,Sinks/Fountains
Good
Safety: Fire Safety, Hazardous Materials Good
Structural: Structural Damage, Roofs Good
External: Playground/School Grounds,W indows/Doors/Gates/Fences
Good
Overall Rat ing Exemplary
2016-17 SARC - Anne Darling Elementary
Page 6 of 21

Last updated: 1/5/2018
B. Pupil Outcomes
State Priority: Pupil Achievement
The SARC provides the follow ing information relevant to the State priority: Pupil Achievement (Priority 4):
Statewide assessments (i.e., California Assessment of Student Performance and Progress [CAASPP] System, which includes the Smarter Balanced SummativeAssessments for students in the general educat ion populat ion and the California Alternate Assessments [CAAs] for English language arts/literacy [ELA] andmathematics given in grades three through eight and grade eleven. Only eligible students may part icipate in the administrat ion of the CAAs. CAAs items arealigned w ith alternate achievement standards, which are linked w ith the Common Core State Standards [CCSS] for students w ith the most significant cognit ivedisabilit ies); and
The percentage of students who have successfully completed courses that sat isfy the requirements for entrance to the University of California and the CaliforniaState University, or career technical educat ion sequences or programs of study.
Note: Percentages are not calculated when the number of students tested is ten or less, either because the number of students in this category is too small forstat ist ical accuracy or to protect student privacy.
CAASPP Test Results in ELA and Mathematics for All StudentsCAASPP Test Results in ELA and Mathematics for All Students
Grades Three through Eight and Grade Eleven Grades Three through Eight and Grade Eleven (School Year 2016-17)(School Year 2016-17)
Subject
Percentage of Students Meeting or Exceeding the State Standards
School District State
2015-16 2016-17 2015-16 2016-17 2015-16 2016-17
English Language Arts / Literacy (grades 3-8 and 11) 34% 32% 54% 53% 48% 48%
Mathematics (grades 3-8 and 11) 22% 20% 42% 42% 36% 37%
2016-17 SARC - Anne Darling Elementary
Page 7 of 21

Last updated: 1/5/2018
Note: ELA test results include the Smarter Balanced Summative Assessment and the CAA. The “Percent Met or Exceeded” is calculated by taking the total number ofstudents who met or exceeded the standard on the Smarter Balanced Summative Assessment plus the total number of students who met the standard (i.e., achievedLevel 3–Alternate) on the CAAs divided by the total number of students who part icipated in both assessments.
Note: Double dashes (--) appear in the table when the number of students is ten or less, either because the number of students in this category is too small forstat ist ical accuracy or to protect student privacy.
Note: The number of students tested includes all students who part icipated in the test whether they received a score or not; however, the number of students testedis not the number that was used to calculate the achievement level percentages. The achievement level percentages are calculated using only students who receivedscores.
CAASPP Test Results in ELA by Student Group CAASPP Test Results in ELA by Student Group
Grades Three through Eight and Grade Eleven (School Year 2016-17)Grades Three through Eight and Grade Eleven (School Year 2016-17)
Student Group Total Enrollment Number Tested Percent Tested Percent Met or Exceeded
All Students 214 212 99.07% 32.08%
Male 117 116 99.15% 27.59%
Female 97 96 98.97% 37.50%
Black or African American -- -- --
American Indian or Alaska Nat ive -- -- --
Asian 20 20 100.00% 65.00%
Filipino -- -- --
Hispanic or Lat ino 168 166 98.81% 28.31%
Native Hawaiian or Pacific Islander
White 18 18 100.00% 27.78%
Two or More Races -- -- --
Socioeconomically Disadvantaged 184 182 98.91% 31.32%
English Learners 151 149 98.68% 29.53%
Students w ith Disabilit ies 36 36 100.00% 11.11%
Students Receiving Migrant Educat ion Services
Foster Youth -- -- -- --
2016-17 SARC - Anne Darling Elementary
Page 8 of 21

Last updated: 1/5/2018
Note: Mathematics test results include the Smarter Balanced Summative Assessment and the CAA. The “Percent Met or Exceeded” is calculated by taking the totalnumber of students who met or exceeded the standard on the Smarter Balanced Summative Assessment plus the total number of students who met the standard (i.e.,achieved Level 3–Alternate) on the CAAs divided by the total number of students who part icipated in both assessments.
Note: Double dashes (--) appear in the table when the number of students is ten or less, either because the number of students in this category is too small forstat ist ical accuracy or to protect student privacy.
Note: The number of students tested includes all students who part icipated in the test whether they received a score or not; however, the number of students testedis not the number that was used to calculate the achievement level percentages. The achievement level percentages are calculated using only students who receivedscores.
CAASPP Test Results in Mathematics by Student GroupCAASPP Test Results in Mathematics by Student Group
Grades Three through Eight and Grade Eleven (School Year 2016-17)Grades Three through Eight and Grade Eleven (School Year 2016-17)
Student Group Total Enrollment Number Tested Percent Tested Percent Met or Exceeded
All Students 214 214 100.00% 19.63%
Male 117 117 100.00% 20.51%
Female 97 97 100.00% 18.56%
Black or African American -- -- --
American Indian or Alaska Nat ive -- -- --
Asian 20 20 100.00% 35.00%
Filipino -- -- --
Hispanic or Lat ino 168 168 100.00% 16.67%
Native Hawaiian or Pacific Islander
White 18 18 100.00% 27.78%
Two or More Races -- -- --
Socioeconomically Disadvantaged 184 184 100.00% 18.48%
English Learners 151 151 100.00% 17.88%
Students w ith Disabilit ies 36 36 100.00% --
Students Receiving Migrant Educat ion Services
Foster Youth -- -- -- --
2016-17 SARC - Anne Darling Elementary
Page 9 of 21

Last updated: 1/5/2018
Last updated: 12/18/2017
Last updated: 12/18/2017
Note: Science test results include California Standards Tests (CSTs), California Modified Assessment (CMA), and California Alternate Performance Assessment (CAPA) ingrades five, eight, and ten.
Note: Scores are not shown when the number of students tested is ten or less, either because the number of students in this category is too small for stat ist icalaccuracy or to protect student privacy.
Note:The 2016-17 data are not available. The California Department of Educat ion is developing a new science assessment based on the Next Generat ion ScienceStandards for California Public Schools (CA NGSS). The new California Science Test (CAST) was piloted in spring 2017. The CST and CMA for Science w ill no longer beadministered.
Career Technical Education Programs (School Year 2016-17)
CAASPP Test Results in Science for All StudentsCAASPP Test Results in Science for All Students
Grades Five, Eight and TenGrades Five, Eight and Ten
Subject
Percentage of Students Scoring at Proficient or Advanced
School District State
2014-15 2015-16 2014-15 2015-16 2014-15 2015-16
Science (grades 5, 8, and 10) 32.0% 42.0% 57.0% 55.0% 56% 54%
N/A
Career Technical Education Participation (School Year 2016-17)Career Technical Education Participation (School Year 2016-17)
Measure CTE Program Participation
Number of Pupils Part icipat ing in CTE
Percent of Pupils Complet ing a CTE Program and Earning a High School Diploma --
Percent of CTE Courses Sequenced or Art iculated Between the School and Inst itut ions of Postsecondary Educat ion --
Courses for University of California (UC) and/or California State University (CSU) AdmissionCourses for University of California (UC) and/or California State University (CSU) Admission
UC/CSU Course Measure Percent
2016-17 Pupils Enrolled in Courses Required for UC/CSU Admission 0.0%
2015-16 Graduates Who Completed All Courses Required for UC/CSU Admission 0.0%
2016-17 SARC - Anne Darling Elementary
Page 10 of 21

Last updated: 1/5/2018
Last updated: 1/5/2018
State Priority: Other Pupil Outcomes
The SARC provides the follow ing information relevant to the State priority: Other Pupil Outcomes (Priority 8):
Pupil outcomes in the subject area of physical educat ion
Note: Percentages are not calculated when the number of students tested is ten or less, either because the number of students in this category is too small forstat ist ical accuracy or to protect student privacy.
California Physical Fitness Test Results (School Year 2016-17)California Physical Fitness Test Results (School Year 2016-17)
Grade Level
Percentage of Students Meeting Fitness Standards
Four of Six Fitness Standards Five of Six Fitness Standards Six of Six Fitness Standards
5 19.0% 10.1% 3.8%
2016-17 SARC - Anne Darling Elementary
Page 11 of 21

C. Engagement
State Priority: Parental Involvement
The SARC provides the follow ing information relevant to the State priority: Parental Involvement (Priority 3):
Efforts the school district makes to seek parent input in making decisions for the school district and each schoolsite
Opportunities for Parental Involvement (School Year 2017-18)Opportunities for Parental Involvement (School Year 2017-18)
Monthly “Coffee w ith the Principal” is an excellent way for all parents to provide ongoing input and to learn more about the school and key school w ide topics ofinterest. Parents play a pivotal roleinthe school decision-making process. Anne Darling Elementary School has an act ive SSC (SchoolSite Council), which has a keyrole in the development, implementat ion and monitoring of the Single Plan for Student Achievement (SPSA). T it le I meetings are held annually to inform parentsabout the programs at the school site that support student success through T it le I funding. Parents of English Language Learners are encouraged to becomepart of the Site English Learners’ Advisory Committee (SELAC). A representat ive of the group is elected to part icipate in the District level group or DELAC. Thepurpose of these groups is to provide parental input and feedback on programs that support English Language Learners at the site and District levels.
Parent Volunteers are recognized annually at awards assemblies w ith a cert ificate of appreciat ion, as well as a luncheon provided by the teachers, in grat itude fortheir hours of voluntary service to Anne Darling. Anne Darling’s Parent Volunteers work t irelessly to raise money to fund a variety of extracurricular studentact ivit ies;including 5thGrade Science camp and other field trips. Parents also assist in the classroom facilitat ing work w ith small groups of students. Ana Frias, AnneDarling’s parent liaison, works closely w ith our parent community and staff and other parent outreach projects to provide ongoing support for parents andguardians. Ms. Frias can be reached during school hours at (408) 535-6209.
2016-17 SARC - Anne Darling Elementary
Page 12 of 21

Last updated: 2/1/2018
Last updated: 1/5/2018
State Priority: Pupil Engagement
The SARC provides the follow ing information relevant to the State priority: Pupil Engagement (Priority 5):
High school dropout rates; andHigh school graduat ion rates
Dropout Rate and Graduation Rate (Four-Year Cohort Rate)Dropout Rate and Graduation Rate (Four-Year Cohort Rate)
Indicator
School District State
2013-14 2014-15 2015-16 2013-14 2014-15 2015-16 2013-14 2014-15 2015-16
Dropout Rate 0.0% 0.0% 0.0% 0.0% 0.0% 0.0% 11.5% 10.7% 9.7%
Graduat ion Rate 0.0% 0.0% 0.0% 85.9% 85.4% 87.7% 81.0% 82.3% 83.8%
Dropout/Graduation Rate (Four-Year Cohort Rate) Chart
2013-14 2014-15 2015-16-1.0
-0.5
0.0
0.5
1.0Dropout Rate
Graduation Rate
2016-17 SARC - Anne Darling Elementary
Page 13 of 21

Completion of High School Graduation Requirements - Graduating Class of 2016 Completion of High School Graduation Requirements - Graduating Class of 2016
(One-Year Rate)(One-Year Rate)
Student Group School District State
All Students -- 88.4% 87.1%
Black or African American -- 85.0% 79.2%
American Indian or Alaska Nat ive -- 100.0% 80.2%
Asian -- 97.9% 94.4%
Filipino -- 90.6% 93.8%
Hispanic or Lat ino -- 83.4% 84.6%
Native Hawaiian or Pacific Islander -- 92.3% 86.6%
White -- 93.8% 91.0%
Two or More Races -- 91.3% 90.6%
Socioeconomically Disadvantaged -- 90.5% 85.5%
English Learners -- 52.6% 55.4%
Students w ith Disabilit ies -- 57.1% 63.9%
Foster Youth -- -- --
2016-17 SARC - Anne Darling Elementary
Page 14 of 21

Last updated: 1/5/2018
Last updated: 1/5/2018
Last updated: 1/9/2018
State Priority: School Climate
The SARC provides the follow ing information relevant to the State priority: School Climate (Priority 6):
Pupil suspension rates;Pupil expulsion rates; andOther local measures on the sense of safety
School Safety Plan (School Year 2017-18)
Suspensions and ExpulsionsSuspensions and Expulsions
School District State
Rate 2014-15 2015-16 2016-17 2014-15 2015-16 2016-17 2014-15 2015-16 2016-17
Suspensions 0.2% 1.9% 2.4% 3.5% 3.7% 3.6% 3.8% 3.7% 3.7%
Expulsions 0.0% 0.0% 0.0% 0.1% 0.0% 0.1% 0.1% 0.1% 0.1%
Suspensions
2014-15 2015-16 2016-170.0
0.5
1.0
1.5
2.0
2.5
3.0
3.5
4.0School Suspensions
District Suspensions
State Suspensions
Expulsions
2014-15 2015-16 2016-170.00
0.02
0.04
0.06
0.08
0.10
0.12School Expulsions
District Expulsions
State Expulsions
The school has a comprehensive safety plan which was revised in September of 2016, and updated in September of 2017. The new safety plan was reviewed bythe Leadership Team at a meeting in November, followed by a review and approval by the staff members.
Before School Supervision begins at 7:00 am. There are paid yard duty supervisors before school, at recess and luncht ime. The school site uses a “pull-up anddrop off” process to help ensure students’ safety at arrival and dismissal t imes. Anyone coming on campus during the school day is required to sign in at the officeand wear a visitor badge. Safety drills are conducted regularly, and procedures are in place in case of accidents, fire, or other emergency situat ions.
2016-17 SARC - Anne Darling Elementary
Page 15 of 21

Last updated: 1/25/2018
Last updated: 1/25/2018
D. Other SARC InformationThe information in this sect ion is required to be in the SARC but is not included in the state priorit ies for LCFF.
Average Class Size and Class Size Distribution (Elementary)
* Number of classes indicates how many classes fall into each size category (a range of total students per class).
Federal Intervention Program (School Year 2017-18)Federal Intervention Program (School Year 2017-18)
Indicator School District
Program Improvement Status In PI In PI
First Year of Program Improvement 2013-2014 2009-2010
Year in Program Improvement Year 1 Year 3
Number of Schools Current ly in Program Improvement N/A 16
Percent of Schools Current ly in Program Improvement N/A 61.5%
2014-15 2015-16 2016-17
Grade Level Average Class Size
Number of Classes *
Average Class Size
Number of Classes *
Average Class Size
Number of Classes *
1-20 21-32 33+ 1-20 21-32 33+ 1-20 21-32 33+
K 19.0 4 0 0 24.0 0 3 0 16.0 4 0 0
1 17.0 3 0 0 27.0 0 3 0 24.0 0 3 0
2 19.0 3 0 0 23.0 1 2 0 24.0 0 3 0
3 19.0 5 0 0 23.0 1 1 0 21.0 1 2 0
4 22.0 0 3 0 27.0 0 3 0 21.0 1 2 0
5 18.0 6 0 0 24.0 1 3 0 27.0 0 3 0
6 0.0 0 0 0 0.0 0 0 0 0.0 0 0 0
Other 20.0 1 0 0 10.0 1 0 0 8.0 1 0 0
2016-17 SARC - Anne Darling Elementary
Page 16 of 21

Last updated: 1/25/2018
Last updated: 1/25/2018
Last updated: 1/10/2018
* Number of classes indicates how many classrooms fall into each size category (a range of total students per classroom). At the secondary school level, this information isreported by subject area rather than grade level.
Academic Counselors and Other Support Staff (School Year 2016-17)
Note: Cells w ith N/A values do not require data.
*One Full T ime Equivalent (FTE) equals one staff member working full t ime; one FTE could also represent two staff members who each work 50 percent of full t ime.
Note: Cells w ith N/A values do not require data.
Average Class Size and Class Size Distribution (Secondary)Average Class Size and Class Size Distribution (Secondary)
2014-15 2015-16 2016-17
Subject Average Class Size
Number of Classes *
Average Class Size
Number of Classes *
Average Class Size
Number of Classes *
1-22 23-32 33+ 1-22 23-32 33+ 1-22 23-32 33+
English
Mathematics
Science
Social Science
Title Number of FTE* Assigned to School Average Number of Students per Academic Counselor
Academic Counselor 0.0 0.0
Counselor (Social/Behavioral or Career Development) 2.2 N/A
Library Media Teacher (Librarian) 0.0 N/A
Library Media Services Staff (Paraprofessional) 1.0 N/A
Psychologist 0.5 N/A
Social Worker 0.0 N/A
Nurse 0.5 N/A
Speech/Language/Hearing Specialist 1.0 N/A
Resource Specialist (non-teaching) 4.0 N/A
Other 0.1 N/A
Expenditures Per Pupil and School Site Teacher Salaries (Fiscal Year 2015-16)Expenditures Per Pupil and School Site Teacher Salaries (Fiscal Year 2015-16)
Level Total Expenditures Per PupilExpenditures Per Pupil
(Restricted)Expenditures Per Pupil
(Unrestricted) Average Teacher Salary
School Site $11509.9 $3605.1 $7904.8 $71458.2
District N/A N/A $8016.2 $72711.6
Percent Difference – School Site and District N/A N/A -1.4% -1.7%
State N/A N/A $6574.0 $79228.0
Percent Difference – School Site and State N/A N/A 18.4% -10.3%
2016-17 SARC - Anne Darling Elementary
Page 17 of 21

Last updated: 1/9/2018
For detailed information on salaries, see the CDE Cert ificated Salaries & Benefits Web page at http://www.cde.ca.gov/ds/fd/cs/ .
Types of Services Funded (Fiscal Year 2016-17)Types of Services Funded (Fiscal Year 2016-17)
GATE GATE students are ident ified in 2nd grade. Our teachers use different iated instruct ion in their classroom so ident ified GATE students’ needs are met in theclassroom on a daily basis. Special Ed A full-t ime resource specialist and 1 half- t ime speech and language specialist , assist special educat ion students in fulfilling therequirements of their Individualized Educat ion Plans (IEP). There are two Therapuet ic Special Day Classrooms servicing students w ith emotional disturbances; K-2nd grades and 3-5th grades. In each classroom there is the Classroom Teacher/ case manager, an Instruct ional Aid, a Counselor, and two Behavior Specialists.
A Student Study Team (SST) is in place to provide support for students experiencing various challenges in the general educat ion classroom. The team consists ofparents, guardians, classroom teacher, resource teachers, the counselor, the nurse, the psychologist and the principal. The team meets to ident ify strategies tobest support the academic success of the students who are experiencing challenges academically or socially.
At-risk students Students who are below grade level, as ident ified by assessment data are provided intervent ion through diferent iated classroom instruct ion in asmall group sett ing from both the classroom teacher and the Intervent ion Specialists. Intervent ion support is also provided to students after the instruct ionalday.
In addit ion, we have ALA (Academic Language Acquisit ion) classes that provide instruct ion in Spanish, and we implement an English Language Developmentprogram on a daily basis. We also have SEI (Structured English Immersion) classes where instruct ion is in English. In addit ion, our Program Assistant PrimaryLanguage teacher provides support for English Learners in the classroom sett ing and also provides support to Newcomers.
Students w ith disabilit ies Students who are ident ified w ith specific disabilit ies have Individualized Educat ion Plans (IEPs) to define and address the addit ionalsupport they need to be successful in school. There are also accommodations for students in the general educat ion classrooms through a support ive 504 Plan.
After-school programs CORAL is an after-school program that provides assistance w ith homework and enrichment act ivit ies five days per week. Studentspart icipate in the program from the end of their school day unt il 6:00 p.m., when the program ends.
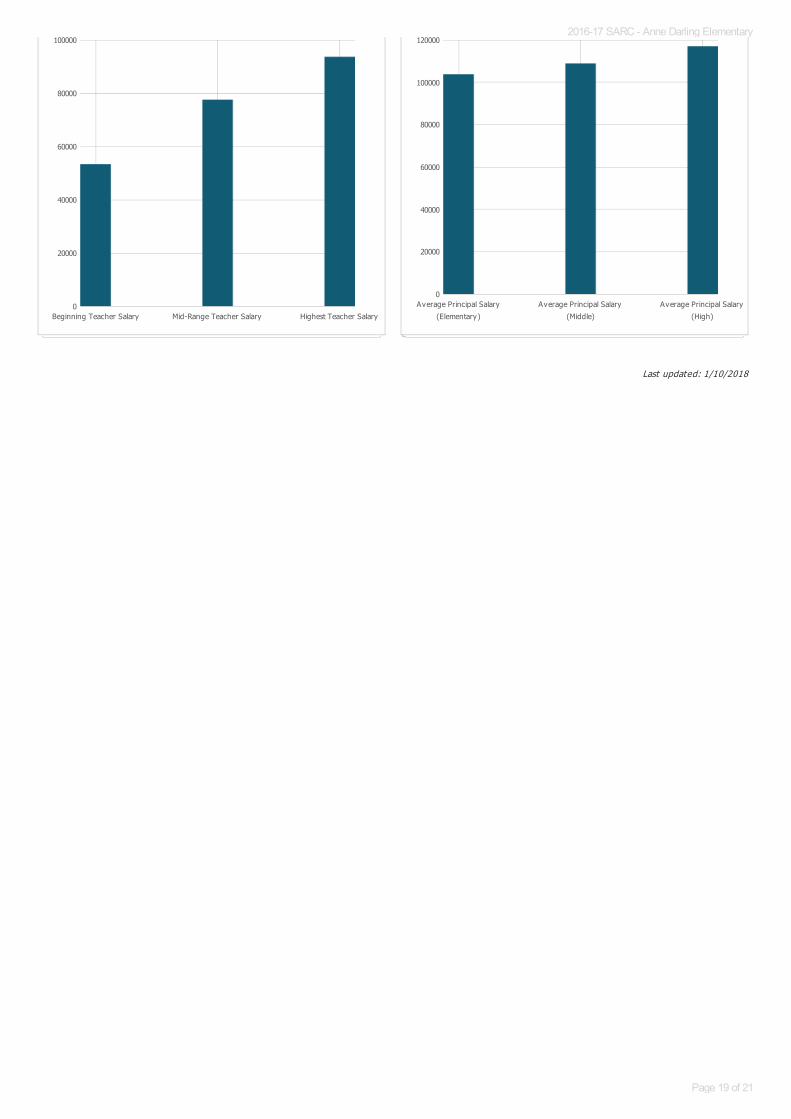
Teacher and Administrative Salaries (Fiscal Year 2015-16)Teacher and Administrative Salaries (Fiscal Year 2015-16)
Category District Amount State Average For Districts In Same Category
Beginning Teacher Salary $53,358 $47,808
Mid-Range Teacher Salary $77,532 $73,555
Highest Teacher Salary $93,642 $95,850
Average Principal Salary (Elementary) $103,741 $120,448
Average Principal Salary (Middle) $108,855 $125,592
Average Principal Salary (High) $117,012 $138,175
Superintendent Salary $263,799 $264,457
Percent of Budget for Teacher Salaries 33.0% 35.0%
Percent of Budget for Administrat ive Salaries 5.0% 5.0%
Teacher Salary Chart
100000
Principal Salary Chart
120000
2016-17 SARC - Anne Darling Elementary
Page 18 of 21
Last updated: 1/10/2018
Beginning Teacher Salary Mid-Range Teacher Salary Highest Teacher Salary0
20000
40000
60000
80000
100000
Average Principal Salary
(Elementary)
Average Principal Salary
(Middle)
Average Principal Salary
(High)
0
20000
40000
60000
80000
100000
1200002016-17 SARC - Anne Darling Elementary
Page 19 of 21

Last updated: 1/10/2018
Note: Cells w ith N/A values do not require data.
*Where there are student course enrollments of at least one student.
Professional Development
Advanced Placement (AP) Courses (School Year 2016-17)Advanced Placement (AP) Courses (School Year 2016-17)
Subject Number of AP Courses Offered* Percent of Students In AP Courses
Computer Science 0 N/A
English 0 N/A
Fine and Performing Arts 0 N/A
Foreign Language 0 N/A
Mathematics 0 N/A
Science 0 N/A
Social Science 0 N/A
All Courses 0 0.0%
Each Tuesday, Anne Darling has an early release day so teachers can part icipate in collaborat ive planning and staff development act ivit ies. During this t ime,teachers work together as a grade level to:
• Share effect ive instruct ional strategies.
• Plan different iated small group lessons
• Analyze and reflect on our assessment data including Blended Learning.
• Plan instruct ion based on District curriculum aligned to the Common Core State Standards and District Scope & Sequence.
. • Plan intervent ions.
Professional development is provided in a variety of ways:
• Tuesday Grade Level Collaborat ion,
• Staff Development Days,
• Site and District trainings, and • Coaching cycles.
The T it le I Intervent ion Specialists, The Instruct ional Coach, the principal and District Resource Staff, provide instruct ional support to teachers as a team. Theymodel lessons, coach, and provide frequent feedback to teachers on instruct ional pract ices, and provide on going professional development.
2016-17 SARC - Anne Darling Elementary
Page 20 of 21

Last updated: 1/9/2018
2016-17 SARC - Anne Darling Elementary
Page 21 of 21