secciones huecas 2nd_edt
TRANSCRIPT
HOLLOW SECTIONS INSTRUCTURAL APPLICATIONS
J. Wardenier, J.A. Packer, X.-L. Zhao and G.J. van der Vegte

ISBN 978-90-72830-86-9 © CIDECT, Geneva, Switzerland, 2010 The publisher and authors have made careful efforts to ensure the reliability of the data contained in this publication, but they assume no liability with respect to the use for any application of the material and information contained in this publication. Printed by Bouwen met Staal Boerhaavelaan 40 2713 HX Zoetermeer, The Netherlands P.O. Box 190 2700 AD Zoetermeer, The Netherlands Tel. +31(0)79 353 1277 Fax +31(0)79 353 1278 E-mail [email protected]
ii

PREFACE The global construction market requires a world-wide coordination of product-, testing-, design- and execution-standards, so that contracts for delivery of products and for engineering- and construction services can be agreed on a common basis without barriers. The mission of CIDECT is to combine the research resources of major hollow section manufacturers in order to create a major force in the research and application of hollow steel sections world wide. This forms the basis of establishing coordinated and consistent international standards. For the ease of use of such standards, it is however necessary to reduce their content to generic rules and to leave more object-oriented detailed rules to accompanying non-conflicting complementary information, that have the advantage to be more flexible for the adaptation to recent research results and to be useable together with any international code. The book by J. Wardenier, J.A. Packer, X.-L. Zhao and G.J. van der Vegte "Hollow sections in structural applications" is such a source, developed in an international consensus of knowledge on the topic. It incorporates the recently revised design recommendations for hollow sections joints of the International Institute of Welding, IIW (2009) and CIDECT (2008 and 2009). Both are consistent with each other and are the basis for the Draft ISO standard for Hollow Section Joints (ISO 14346) and may form the basis for future maintenance, further harmonisation and further development of Eurocode 3 (EN 1993-1-8), AISC (ANSI/AISC 360) and the CISC recommendations. For the use together with EN 1993-1-8 and ANSI/AISC 360, both being based on the previous IIW (1989) recommendations, the main differences to these rules are highlighted. The authors are all internationally recognized experts in the field of tubular steel structures, three of them having been chairmen of the IIW-Subcommission XV-E on "Tubular Structures" since 1981. This committee is the pre-eminent international authority producing design recommendations and standards for onshore tubular structures. This book should therefore be an invaluable resource for lecturers, graduate students in structural, architectural and civil engineering, explaining the important principles in the behaviour of tubular steel structures. It is also addressed to designers of steel structures who can find in it the special items related to the use of hollow sections, in particular joints, their failure modes and analytical models as supplements to more general design codes.
Aachen, Germany, August 2010 Prof. Dr.-Ing. Dr.h.c. Gerhard Sedlacek
iii

iv
ACKNOWLEDGEMENTS This book gives the background to design with structural hollow sections in general and in particular for joints to hollow sections. For the latter, the recently updated recommendations of the International Institute of Welding (IIW, 2009) and CIDECT (2008 and 2009) are adopted. The background to design recommendations with the relevant analytical models is especially important for students in Structural and Civil Engineering, whereas the design recommendations themselves serve more as an example. Since the available hours for teaching Steel Structures, and particularly Tubular Structures, vary from country to country, this book has been written in a modular form. The presentation generally follows European codes, but the material is readily adapted to other (national) codes. Since the first edition of this book was used not only by students but also by many designers, this second edition was needed due to the recent update of the recommendations by IIW and the subsequent revision of the CIDECT Design Guides Nos. 1 and 3 in 2008 and 2009. The new IIW (2009) recommendations and the revised CIDECT Design Guides Nos. 1 and 3 (2008 and 2009) are consistent with each other and are the basis for the Draft ISO standard for Hollow Section Joints (ISO 14346). Although the current Eurocode 3 (EN 1993-1-8, 2005) and AISC (2010) recommendations are still based on the previous IIW (1989) and CIDECT (1991 and 1992) recommendations, it is expected that in the next revision these will follow the new IIW and CIDECT recommendations presented in this book. Besides the static design recommendations and background for hollow section joints, information is given for member design in Chapter 2, composite structures in Chapter 4, and fire resistance in Chapter 5. These chapters fully comply with the latest versions of the Eurocodes (EN 1993 and EN 1994). Further, fatigue design of hollow section joints is covered in Chapter 14. We wish to thank our colleagues from the IIW Sub-commission XV-E "Tubular Structures" and from the CIDECT Project Working Group and the CIDECT Technical Commission for their constructive comments during the preparation of this book. We are very grateful that Prof. J. Stark and Mr. L. Twilt were willing to check Chapters 4 and 5 respectively on composite members and fire resistance. Appreciation is further extended to the authors of CIDECT Design Guides Nos. 1 to 9 and to CIDECT for making parts of these Design Guides or background information available for this book. Finally, we wish to thank CIDECT for the initiative to update this book.
Delft, The Netherlands, September 2010 Jaap Wardenier Jeffrey A. Packer Xiao-Ling Zhao Addie van der Vegte
CONTENTS 1. Introduction 1 1.1 History and developments 1 1.2 Designation 2 1.3 Manufacturing of hollow sections 2 2. Properties of hollow sections 9 2.1 Mechanical properties 9 2.2 Structural hollow section dimensions and dimensional tolerances 10 2.3 Geometric properties 11 2.4 Drag coefficients 14 2.5 Corrosion protection 14 2.6 Use of internal void 15 2.7 Aesthetics 15 3. Applications 29 3.1 Buildings and halls 29 3.2 Bridges 29 3.3 Barriers 29 3.4 Offshore structures 30 3.5 Towers and masts 30 3.6 Special applications 30 4. Composite structures 37 4.1 Introduction 37 4.2 Design methods 37 4.3 Axially loaded columns 37 4.4 Resistance of a section to bending 39 4.5 Resistance of a section to bending and compression 39 4.6 Influence of shear forces 39 4.7 Resistance of a member to bending and compression 39 4.8 Load introduction 41 4.9 Special composite members with hollow sections 41 5. Fire resistance of hollow section columns 49 5.1 Introduction 49 5.2 Fire resistance 50 5.3 Unfilled hollow section columns 52 5.4 Concrete filled hollow section columns 53 5.5 Water filled hollow section columns 55 5.6 Joints 56 6. Design of hollow section trusses 65 6.1 Truss configurations 65 6.2 Joint configurations 65 6.3 Limit states and limitations on materials 66 6.4 General design considerations 67 6.5 Truss analysis 68 7. Behaviour of joints 75 7.1 General introduction 75 7.2 General failure criteria 77 7.3 General failure modes 77
v

7.4 Joint parameters 77 8. Welded joints between circular hollow sections 81 8.1 Introduction 81 8.2 Modes of failure 81 8.3 Analytical models 81 8.4 Experimental and numerical verification 83 8.5 Basic joint strength formulae 83 8.6 Evaluation to design rules 84 8.7 Other types of joints 85 8.8 Design charts 86 8.9 Relation to the previous recommendations of IIW (1989) and CIDECT (1991) 87 8.10 Concluding remarks 87 9. Welded joints between rectangular hollow sections 103 9.1 Introduction 103 9.2 Modes of failure 103 9.3 Analytical models 104 9.4 Experimental and numerical verification 106 9.5 Basic joint strength formulae 106 9.6 Evaluation to design rules 107 9.7 Other types of joints or other load conditions 107 9.8 Design charts 109 9.9 Concluding remarks 109 10. Welded joints between hollow sections and open sections 129 10.1 Introduction 129 10.2 Modes of failure 129 10.3 Analytical models 129 10.4 Experimental verification 131 10.5 Evaluation to design rules 131 10.6 Joints predominantly loaded by bending moments 131 11. Welded overlap joints 141 11.1 Introduction 141 11.2 Modes of failure 141 11.3 Analytical models for RHS overlap joints 141 11.4 Analytical models for CHS overlap joints 143 11.5 Analytical models for overlap joints with an open section chord 143 11.6 Experimental and numerical verification 143 11.7 Joint strength formulae 144 12. Welded I beam-to-CHS or RHS column moment joints 151 12.1 Introduction 151 12.2 Modes of failure 151 12.3 Analytical models 151 12.4 Experimental and numerical verification 153 12.5 Basic joint strength formulae 153 12.6 Concluding remarks 154 13. Bolted joints 161 13.1 Flange plate joints 161 13.2 End joints 161 13.3 Gusset plate joints 162 13.4 Splice joints 162
vi
vii
13.5 Beam-to-column joints 162 13.6 Bracket joints 163 13.7 Bolted subassemblies 163 13.8 Purlin joints 163 13.9 Blind bolting systems 163 13.10 Nailed joints 163 14. Fatigue behaviour of hollow section joints 175 14.1 Definitions 175 14.2 Influencing factors 175 14.3 Loading effects 176 14.4 Fatigue strength 177 14.5 Partial factors 177 14.6 Fatigue capacity of welded joints 177 14.7 Fatigue capacity of bolted joints 179 14.8 Fatigue design 180 15. Design examples 193 15.1 Uniplanar truss of circular hollow sections 193 15.2 Uniplanar truss of square hollow sections 197 15.3 Multiplanar truss (triangular girder) 197 15.4 Multiplanar truss of square hollow sections 199 15.5 Joint check using the joint resistance formulae 199 15.6 Concrete filled column with reinforcement 200 16. References 209 Symbols 221 CIDECT 229
viii
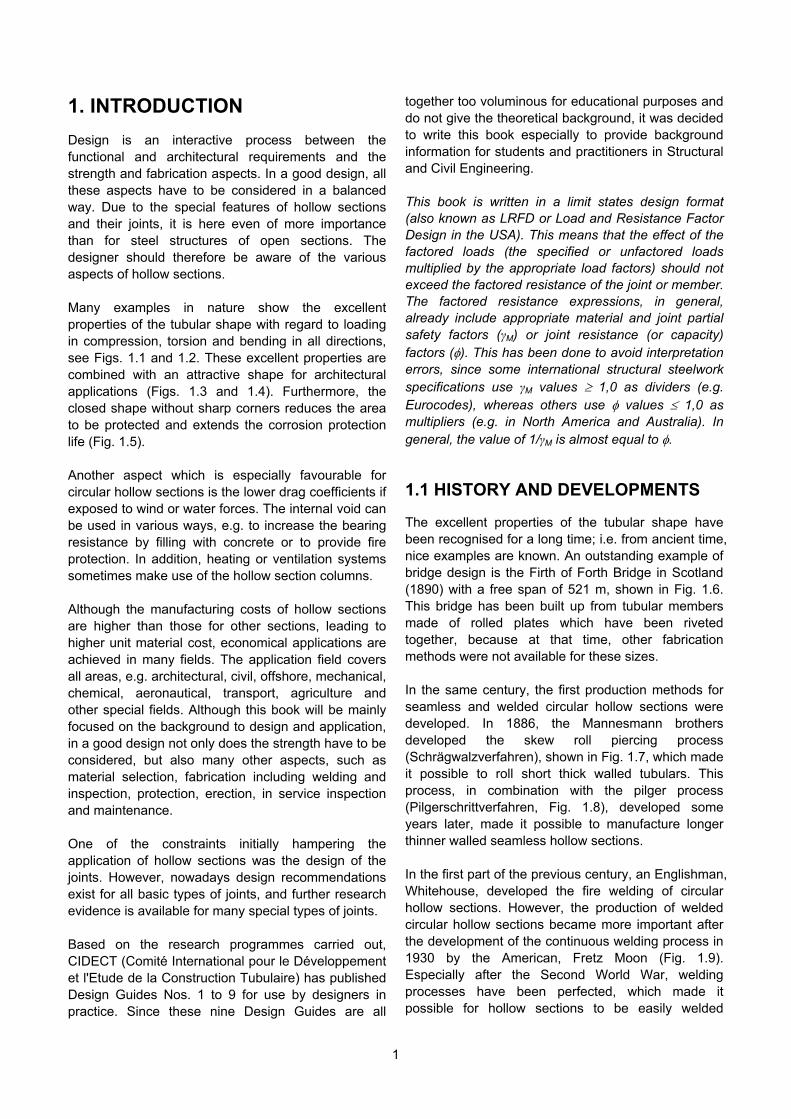
1. INTRODUCTION Design is an interactive process between the functional and architectural requirements and the strength and fabrication aspects. In a good design, all these aspects have to be considered in a balanced way. Due to the special features of hollow sections and their joints, it is here even of more importance than for steel structures of open sections. The designer should therefore be aware of the various aspects of hollow sections. Many examples in nature show the excellent properties of the tubular shape with regard to loading in compression, torsion and bending in all directions, see Figs. 1.1 and 1.2. These excellent properties are combined with an attractive shape for architectural applications (Figs. 1.3 and 1.4). Furthermore, the closed shape without sharp corners reduces the area to be protected and extends the corrosion protection life (Fig. 1.5). Another aspect which is especially favourable for circular hollow sections is the lower drag coefficients if exposed to wind or water forces. The internal void can be used in various ways, e.g. to increase the bearing resistance by filling with concrete or to provide fire protection. In addition, heating or ventilation systems sometimes make use of the hollow section columns. Although the manufacturing costs of hollow sections are higher than those for other sections, leading to higher unit material cost, economical applications are achieved in many fields. The application field covers all areas, e.g. architectural, civil, offshore, mechanical, chemical, aeronautical, transport, agriculture and other special fields. Although this book will be mainly focused on the background to design and application, in a good design not only does the strength have to be considered, but also many other aspects, such as material selection, fabrication including welding and inspection, protection, erection, in service inspection and maintenance. One of the constraints initially hampering the application of hollow sections was the design of the joints. However, nowadays design recommendations exist for all basic types of joints, and further research evidence is available for many special types of joints. Based on the research programmes carried out, CIDECT (Comité International pour le Développement et l'Etude de la Construction Tubulaire) has published Design Guides Nos. 1 to 9 for use by designers in practice. Since these nine Design Guides are all
together too voluminous for educational purposes and do not give the theoretical background, it was decided to write this book especially to provide background information for students and practitioners in Structural and Civil Engineering. This book is written in a limit states design format (also known as LRFD or Load and Resistance Factor Design in the USA). This means that the effect of the factored loads (the specified or unfactored loads multiplied by the appropriate load factors) should not exceed the factored resistance of the joint or member. The factored resistance expressions, in general, already include appropriate material and joint partial safety factors (γM) or joint resistance (or capacity) factors (). This has been done to avoid interpretation errors, since some international structural steelwork specifications use γM values 1,0 as dividers (e.g. Eurocodes), whereas others use values 1,0 as multipliers (e.g. in North America and Australia). In general, the value of 1/γM is almost equal to .
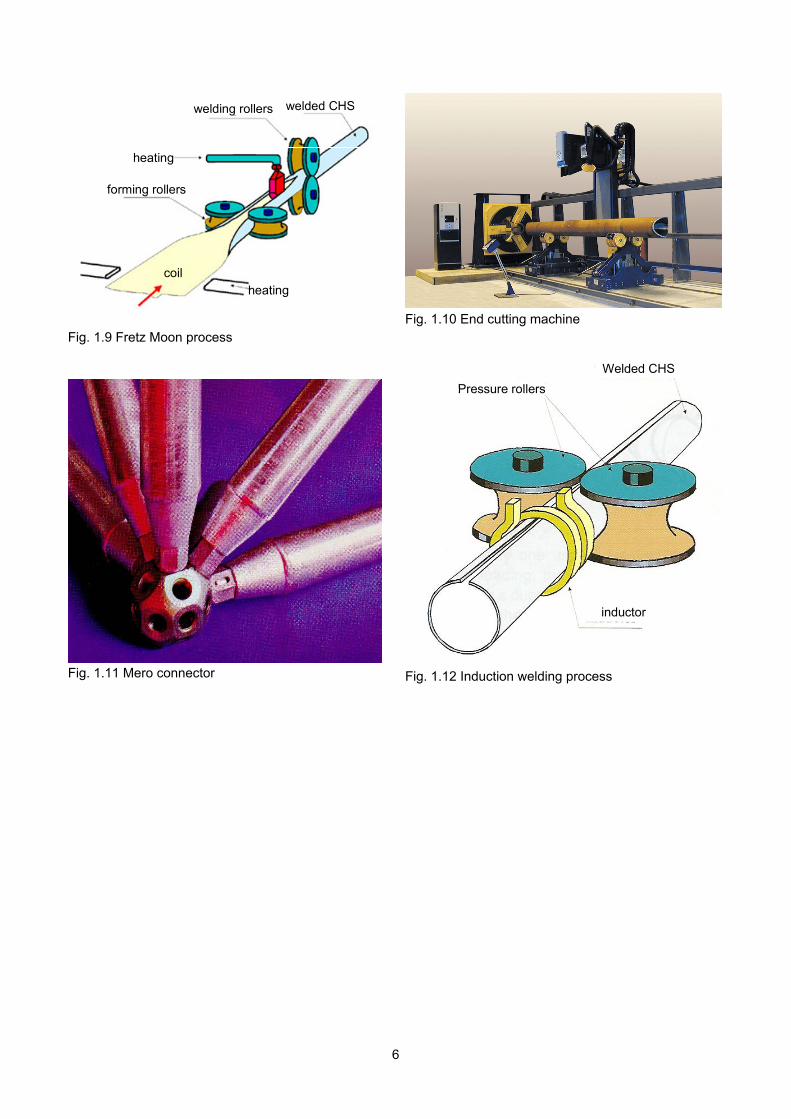
1.1 HISTORY AND DEVELOPMENTS The excellent properties of the tubular shape have been recognised for a long time; i.e. from ancient time, nice examples are known. An outstanding example of bridge design is the Firth of Forth Bridge in Scotland (1890) with a free span of 521 m, shown in Fig. 1.6. This bridge has been built up from tubular members made of rolled plates which have been riveted together, because at that time, other fabrication methods were not available for these sizes. In the same century, the first production methods for seamless and welded circular hollow sections were developed. In 1886, the Mannesmann brothers developed the skew roll piercing process (Schrägwalzverfahren), shown in Fig. 1.7, which made it possible to roll short thick walled tubulars. This process, in combination with the pilger process (Pilgerschrittverfahren, Fig. 1.8), developed some years later, made it possible to manufacture longer thinner walled seamless hollow sections. In the first part of the previous century, an Englishman, Whitehouse, developed the fire welding of circular hollow sections. However, the production of welded circular hollow sections became more important after the development of the continuous welding process in 1930 by the American, Fretz Moon (Fig. 1.9). Especially after the Second World War, welding processes have been perfected, which made it possible for hollow sections to be easily welded
1
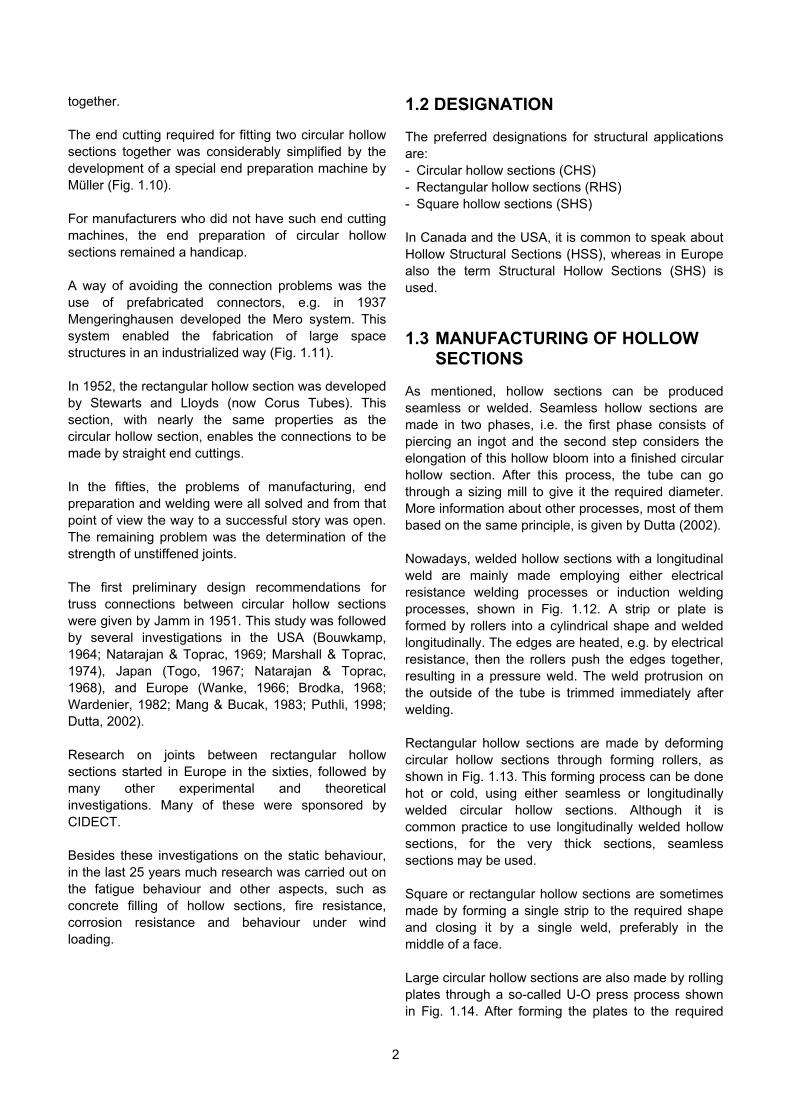
together. The end cutting required for fitting two circular hollow sections together was considerably simplified by the development of a special end preparation machine by Müller (Fig. 1.10). For manufacturers who did not have such end cutting machines, the end preparation of circular hollow sections remained a handicap. A way of avoiding the connection problems was the use of prefabricated connectors, e.g. in 1937 Mengeringhausen developed the Mero system. This system enabled the fabrication of large space structures in an industrialized way (Fig. 1.11). In 1952, the rectangular hollow section was developed by Stewarts and Lloyds (now Corus Tubes). This section, with nearly the same properties as the circular hollow section, enables the connections to be made by straight end cuttings. In the fifties, the problems of manufacturing, end preparation and welding were all solved and from that point of view the way to a successful story was open. The remaining problem was the determination of the strength of unstiffened joints. The first preliminary design recommendations for truss connections between circular hollow sections were given by Jamm in 1951. This study was followed by several investigations in the USA (Bouwkamp, 1964; Natarajan & Toprac, 1969; Marshall & Toprac, 1974), Japan (Togo, 1967; Natarajan & Toprac, 1968), and Europe (Wanke, 1966; Brodka, 1968; Wardenier, 1982; Mang & Bucak, 1983; Puthli, 1998; Dutta, 2002). Research on joints between rectangular hollow sections started in Europe in the sixties, followed by many other experimental and theoretical investigations. Many of these were sponsored by CIDECT. Besides these investigations on the static behaviour, in the last 25 years much research was carried out on the fatigue behaviour and other aspects, such as concrete filling of hollow sections, fire resistance, corrosion resistance and behaviour under wind loading.
1.2 DESIGNATION The preferred designations for structural applications are: - Circular hollow sections (CHS) - Rectangular hollow sections (RHS) - Square hollow sections (SHS) In Canada and the USA, it is common to speak about Hollow Structural Sections (HSS), whereas in Europe also the term Structural Hollow Sections (SHS) is used.
1.3 MANUFACTURING OF HOLLOW SECTIONS
As mentioned, hollow sections can be produced seamless or welded. Seamless hollow sections are made in two phases, i.e. the first phase consists of piercing an ingot and the second step considers the elongation of this hollow bloom into a finished circular hollow section. After this process, the tube can go through a sizing mill to give it the required diameter. More information about other processes, most of them based on the same principle, is given by Dutta (2002). Nowadays, welded hollow sections with a longitudinal weld are mainly made employing either electrical resistance welding processes or induction welding processes, shown in Fig. 1.12. A strip or plate is formed by rollers into a cylindrical shape and welded longitudinally. The edges are heated, e.g. by electrical resistance, then the rollers push the edges together, resulting in a pressure weld. The weld protrusion on the outside of the tube is trimmed immediately after welding. Rectangular hollow sections are made by deforming circular hollow sections through forming rollers, as shown in Fig. 1.13. This forming process can be done hot or cold, using either seamless or longitudinally welded circular hollow sections. Although it is common practice to use longitudinally welded hollow sections, for the very thick sections, seamless sections may be used. Square or rectangular hollow sections are sometimes made by forming a single strip to the required shape and closing it by a single weld, preferably in the middle of a face. Large circular hollow sections are also made by rolling plates through a so-called U-O press process shown in Fig. 1.14. After forming the plates to the required
2

shape, the longitudinal weld is made by a submerged arc welding process. Another process for large tubulars is to use a continuous wide strip, which is fed into a forming machine at an angle to form a spirally formed circular cylinder, see Fig. 1.15. The edges of the strip are welded together by a submerged arc welding process resulting in a so-called spirally welded tube. More detailed information about the manufacturing processes and the limitations in sizes can be obtained from Dutta (2002).
3
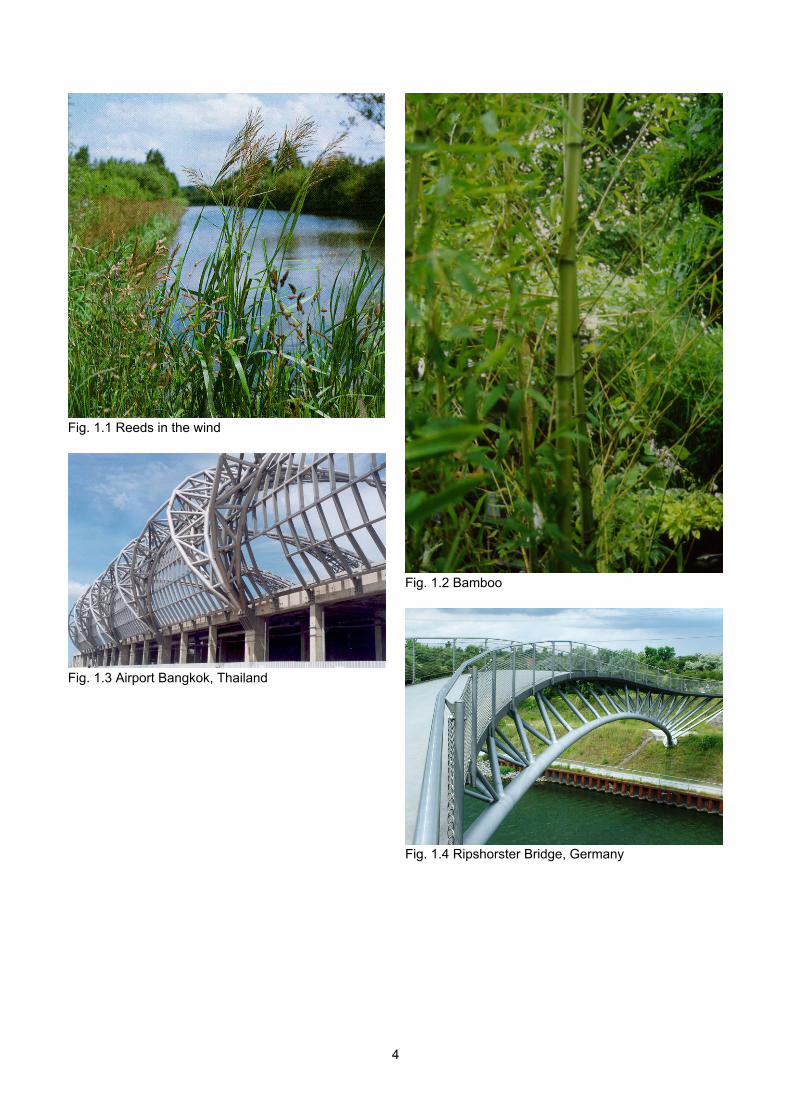
Fig. 1.1 Reeds in the wind
Fig. 1.3 Airport Bangkok, Thailand
Fig. 1.2 Bamboo
Fig. 1.4 Ripshorster Bridge, Germany
4

Fig. 1.5 Paint surface for hollow sections vs open
sections
Fig. 1.7 Skew roll piercing process
(Schrägwalzverfahren)
Fig. 1.6 Firth of Forth Bridge, Scotland
Fig. 1.8 Pilger process (Pilgerschrittverfahren)
5
forming rollers
heating
welding rollers welded CHS
heatingcoil
forming rollers
heating
welding rollers welded CHS
heatingcoil
Fig. 1.9 Fretz Moon process
Fig. 1.11 Mero connector
Fig. 1.10 End cutting machine
Pressure rollers
inductor
Welded CHS
Pressure rollers
inductor
Welded CHS
Pressure rollers
inductor
Welded CHS
Fig. 1.12 Induction welding process
6

Fig. 1.13 Manufacturing of rectangular hollow sections
Fig. 1.14 Forming of large CHS
Fig. 1.15 Spirally welded CHS
7

8
2. PROPERTIES OF HOLLOW SECTIONS
2.1 MECHANICAL PROPERTIES Hollow sections are made of similar steel as used for other steel sections, thus in principle there is no difference in mechanical properties. Tables 2.1a and 2.2a show, as an example, the mechanical properties according to the European standard EN 10210-1 (2006) for hot finished structural hollow sections of non-alloy and fine grain structural steels. The cold formed sections are given in EN 10219-1 (2006): Cold formed welded structural hollow sections of non-alloy and fine grain structural steels (see Tables 2.1b and 2.2b). As shown, the requirements of EN 10210-1 and EN 10219-1 are almost identical. Hollow sections can also be produced in special steels, e.g. high strength steel with yield strengths up to 690 N/mm2 or higher, weathering steels and steel with improved or special chemical compositions, etc. Generally, the design of members is based on the yield strength. In this chapter the recommended γM0 and γM1 factors of 1,0 are adopted for the design yield strength fyd. In statically indeterminate structures, sufficient deformation capacity or rotation capacity is required for redistribution of loads. In this case, yielding of members or yielding in the joints may provide the required rotation capacity. A tensile member made of ductile steel can be brittle if a particular cross section is weakened, e.g. by holes, in such a way that this cross section fails before the whole member yields. It is therefore required that yielding occurs first. This shows that the yield-to-ultimate tensile strength ratio is also important, especially for structures with very non-uniform stress distributions, which is a situation that occurs in tubular joints. Some codes, such as Eurocode 3 (EN 1993-1-1, 2005), specify the following requirement for the minimum ratios:
1,1f
f
yd
u (2.1a)
The IIW (2009) recommendations and many offshore codes require a higher ratio between fu and fyd:
8,0f
f or 25,1
f
f
u
yd
yd
u (2.1b)
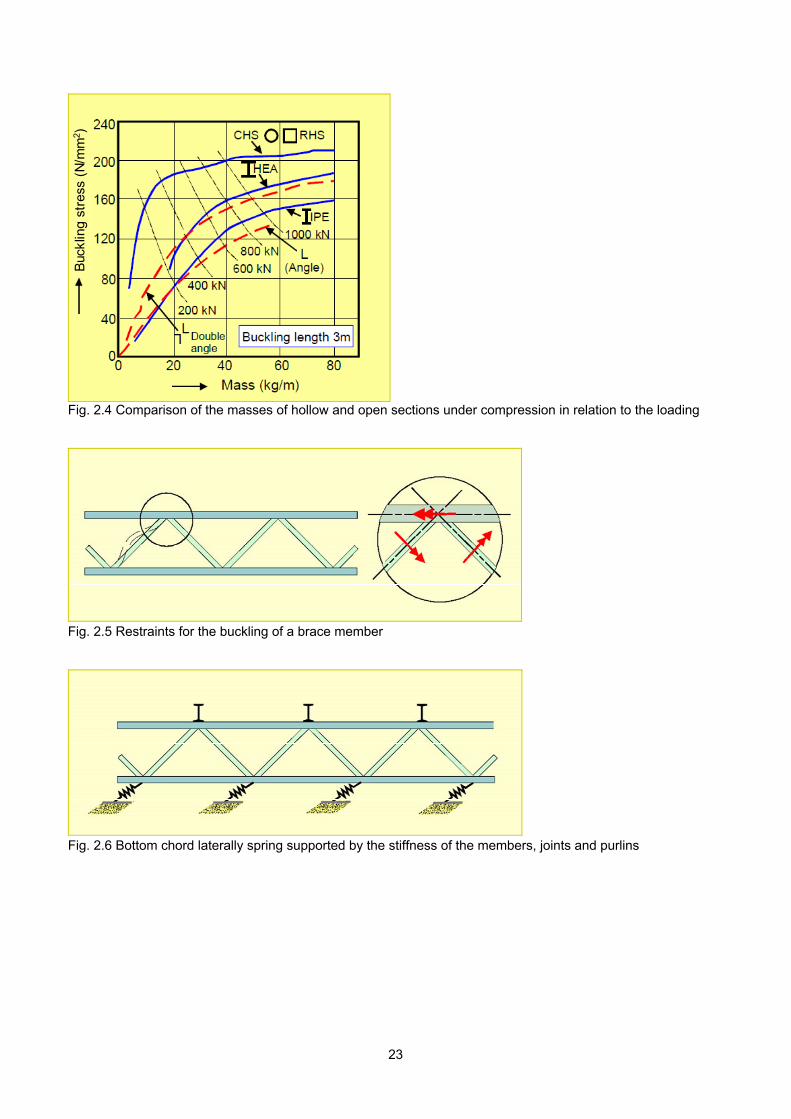
This is only one aspect for ductility. In the case of impact loading, the steel and members should also behave in a ductile manner. Hence, Tables 2.1a and 2.2a also give requirements based on the standard Charpy test to ensure adequate notch toughness. Nowadays, more refined characterisation methods exist to describe the ductility of cracked bodies, e.g. the CTOD (Crack Tip Opening Displacement) method. These characterisation methods are generally used for pressure vessels, transport line pipes and offshore applications, which are beyond the scope of this book. Another characterisation is sometimes required for thick walled sections which are loaded in the thickness direction. In this case, the strength and ductility in the thickness direction should be sufficient to avoid cracking, called lamellar tearing, see Fig. 2.1. This type of cracking is caused by non metallic manganese-sulphide inclusions. Thus, if the sulphur content is very low or the sulphur is joined with other elements such as calcium (Ca), such a failure can be avoided. Indirectly this is obtained by requiring a certain reduction of area RAZ in the tensile test. For example, RAZ = 35 means that in the tensile test the cross sectional area at failure has been reduced by 35% compared to the original cross sectional area. In most structural steel specifications the minimum required yield strength, ultimate tensile strength, elongation and the Charpy V-notch values are specified. Design standards or specifications give further limitations for the fu/fy ratio, whereas depending on the application, more restrictive requirements may be given related to CTOD values or the properties in the thickness direction (Z quality). Another aspect is the effect of cold forming on the mechanical properties of the parent steel. In the case of cold forming of hollow sections, the yield strength and to a lesser extent the ultimate tensile strength are increased, especially in the corners, as shown in Fig. 2.2. Further, the yield-to-ultimate tensile ratio is increased and the elongation slightly decreased. If the standards, e.g. EN 10210-1 and EN 10219-1, specify the properties at a particular cross section location based on the finished product, these properties have been already partly taken into account. Thus, this generally applies in Europe.
9
However, some standards outside Europe specify the material properties of the parent material. In this case, the increased yield strength can be taken into account for design. A small corner radius produces a small cold formed area with a large cold forming effect and consequently a large increase in yield strength, while a large corner radius does just the opposite. According to research work of Lind & Shroff (1971), the product of area and increase in yield strength can approximately be taken as constant. Lind & Shroff assumed that in every corner of 90 the yield strength of the parent material fyb is increased over a length of 7t to the ultimate tensile strength of the parent material fu. The total increase over the section 4(7t)t(fu
- fyb) can be averaged over the section, resulting in a design yield strength fya, as shown in Fig. 2.2.
It is noted that the cold formed sections should satisfy the requirements for minimum inside corner radius to guarantee sufficient ductility, see Table 2.3 for fully aluminum killed steel (steel with limited Si content). Part 10 of Eurocode 3 (EN 1993-1-10, 2005) specifies the material selection. Here, a permissible thickness can be determined based on a reference temperature, the steel grade and quality and the stress level. The reference temperature covers, besides the air temperature, also cold forming effects, strain rate, etc. However, the current rules cannot be adopted to cold formed hollow sections because the determination of the effect of cold forming for cold formed hollow sections is not yet clearly specified. Based on the data obtained by Soininen (1996), Kosteski et al. (2003), Björk (2005), Kühn (2005), Puthli & Herion (2005) and Sedlacek et al. (2008), presently a proposal is being worked out for an amendment of EN 1993-1-10. In this proposal of CEN/TC 250/SC 3-N 1729 (2010), it is recommended that for cold formed hollow sections according to EN 10219, the procedure for hot formed material can be used provided that for the cold forming effects the reference temperature is reduced by Tcf. For CHS, Tcf varies from 0 C to 20 C depending on the thickness and the d/t ratio. For RHS with steel qualities according to EN 10219, Tcf varies from 35 C to 45 C depending on the thickness and the ratio between the inside corner radius and the thickness. For cold formed hollow sections with Charpy impact strengths significantly exceeding the requirements of EN 10219, a lower value of Tcf is allowed.
2.2 STRUCTURAL HOLLOW SECTION DIMENSIONS AND DIMENSIONAL TOLERANCES
The dimensions and sectional properties of structural hollow sections have been standardised in EN (EN 10210-2, 2006; EN 10219-2, 2006) and ISO standards (ISO 657-14, 2000; ISO 4019, 2001) for hot finished and cold formed structural hollow sections respectively. The two applicable standards in Europe are EN 10210-2 (2006) "Hot finished structural hollow sections of non-alloy and fine grain steels – Part 2: Tolerances, dimensions and sectional properties" and EN 10219-2 (2006) "Cold formed welded structural hollow sections of non-alloy and fine grain steels – Part 2: Tolerances, dimensions and sectional properties". However, the majority of manufacturers of structural hollow sections do not produce all the sizes shown in these standards. It should be further noted that other sizes, not included in these standards, may be produced by some manufacturers. The majority of the tolerances given in EN 10219-2 are the same as those in EN 10210-2, see Tables 2.4a and 2.4b. Internationally, the delivery standards in various countries deviate considerably with respect to the thickness and mass tolerances (Packer, 1993). In most countries besides the thickness tolerance, a mass tolerance is given, which limits extreme deviations. However, in some production standards, e.g. in the USA, the thickness tolerance is not always compensated by a mass tolerance. This has resulted in associated design specifications which account for this, by designating a lower "design wall thickness" of 0,9 or 0,93 times the nominal thickness t. In Eurocode 3, where design is based on nominal thicknesses, the thickness tolerances in EN 10210-2 and EN 10219-2 are (partly) compensated by the mass tolerance. It is foreseen that in the next revision these tolerances will be tightened. Although the circular, square and rectangular hollow sections are the generally-used shapes; other shapes are sometimes available. For example, some tube manufacturers deliver the shapes given in Table 2.5. Of these, the elliptical hollow sections have become more popular for architectural designs. These shapes are not dealt with further in this book. However, more information about elliptical hollow sections can be found in Bortolotti et al. (2003), Chan & Gardner (2008), Choo et al. (2003), Martinez-Saucedo et al.
10
(2008), Packer et al. (2009b), Pietrapertosa & Jaspart (2003), Theofanous et al. (2009), Willibald et al. (2006) and Zhao & Packer (2009).
2.3 GEOMETRIC PROPERTIES 2.3.1 Tension The design capacity Nt,Rd of a member under tensile loading depends on the cross sectional area and the design yield strength, and is independent of the sectional shape. In principle, there is no advantage or disadvantage in using hollow sections from the point of view of the amount of material required. The design capacity is given by:
ydRd,t AfN (2.2)
If the cross section is weakened by bolt holes or slots, the net cross section should also be checked, in a similar way as for other sections, e.g. according to Eurocode 3 (EN 1993-1-8, 2005):
9,0 fA
N2M
u netRd,t
(2.3)
where the partial safety factor M2 = 1,25. The factor 0,9 may vary from country to country depending on the partial factor M used. Where ductile behaviour is required (e.g. under seismic loading), the yield resistance shall be less than the ultimate resistance at the net section of fastener holes. 2.3.2 Compression For centrally loaded members in compression, the critical buckling load depends on the slenderness λ and the section shape. The slenderness λ is given by the ratio of the buckling length ℓb and the radius of gyration i.
ib (2.4)
The radius of gyration of a hollow section (in relation to the member mass) is generally much higher than that for the weak axis of an open section. For a given length, this difference results in a lower slenderness for hollow sections and thus a lower mass when compared with open sections.
The buckling behaviour is influenced by initial eccentricities, straightness and geometrical tolerances as well as residual stresses, non-homogeneity of the steel and the stress-strain relationship. Based on extensive investigations by the European Convention for Constructional Steelwork (ECCS) and CIDECT, "European buckling curves" (Fig. 2.3 and Table 2.7) have been established for various steel sections including hollow sections. They are incorporated in Eurocode 3 (EN 1993-1-1, 2005). The reduction factor shown in Fig. 2.3 is the ratio of the design buckling capacity Nb,Rd to the axial plastic capacity.
yd
Rd,b
Rd,pl
Rd,b
f
f
N
N (2.5)
where:
fb,Rd = A
N Rd,b (2.6)
The non-dimensional slenderness is determined by:
E
(2.7)
where:
yE f
E (Euler slenderness) (2.8)
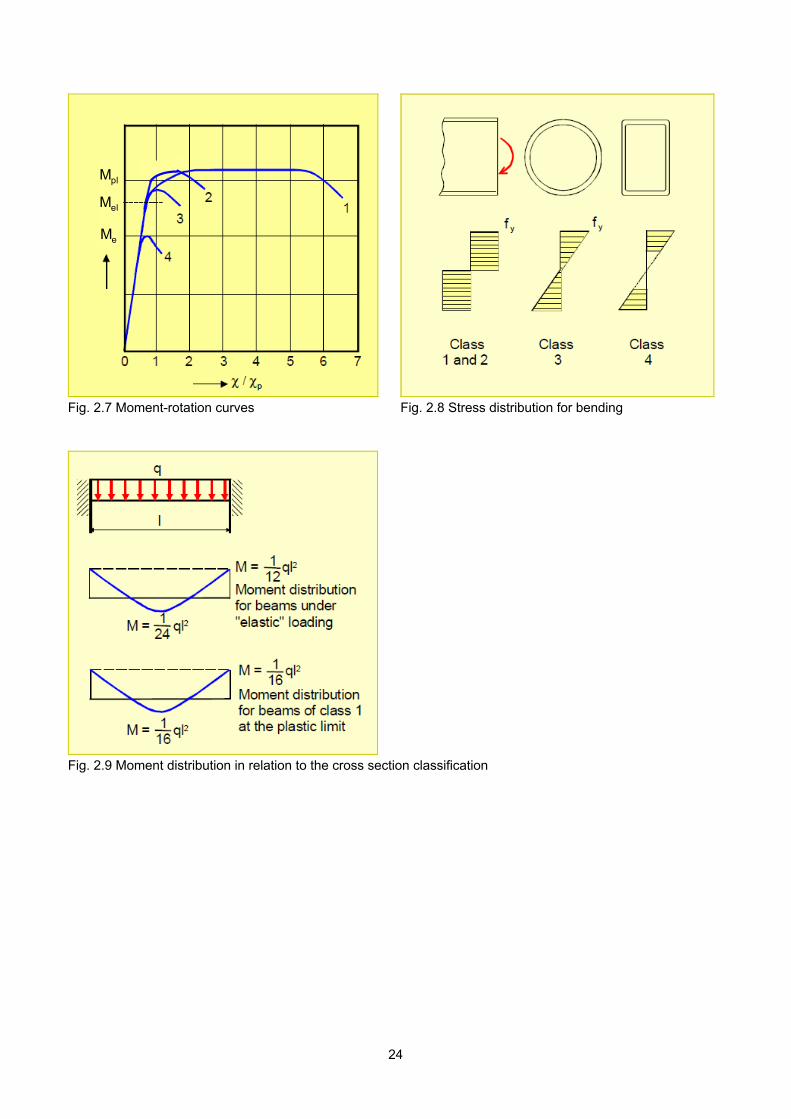
The buckling curves for the hollow sections are classified according to Table 2.6. Most open sections fall under curves "b" and "c". Consequently, for the case of buckling, the use of hot formed hollow sections generally provides a considerable saving in material. Fig. 2.4 illustrates, for a buckling length of 3 m, a comparison between the required mass of open and hollow sections for a given load. It shows that in those cases in which loads are small, leading to relatively slender sections, hollow sections provide a great advantage (considerably lower use of material). However, if loads are higher, resulting in low slenderness, the advantage (in %) will be less. The overall buckling behaviour of hollow sections improves with increasing diameter- or width-to-wall
11
thickness ratio. However, this improvement is limited by local buckling. To prevent local buckling, d/t or b/t limits are given e.g. in Eurocode 3 (EN 1993-1-1, 2005), see Table 2.7. In the case of thin walled sections, interaction between global and local buckling should be considered. In addition to the improved buckling behaviour due to the high radius of gyration and the enhanced design buckling curve, hollow sections can offer other advantages in lattice girders. Due to the torsional and bending stiffness of the members in combination with joint stiffness, the effective buckling length of compression members in lattice girders can be reduced (Fig. 2.5). Eurocode 3 (EN 1993-1-1) recommends an effective buckling length for hollow section brace members in welded lattice girders equal to or less than 0,75ℓ, in which ℓ represents the system length, see also Rondal et al. (1992). For chords, 0,9 times the system length for in-plane buckling or 0,9 times the length between the supports for out-of-plane buckling, is taken as the effective buckling length. These reductions are also based on the fact that the chord and brace members are generally not fully optimised. If for example the chord would be fully utilized with different members for every panel then these reductions would not be allowed. Laterally unsupported compression chords of lattice girders (see Fig. 2.6) have a reduced buckling length due to the improved torsional and bending stiffness of the tubular members (Baar, 1968; Mouty, 1981). These factors make the use of hollow sections in girders or trusses even more favourable. 2.3.3 Bending In general, I and H sections are more economical under bending about the major axis (Imax larger than for hollow sections). Only in those cases in which the design resistance in open sections is largely reduced by lateral buckling, hollow sections offer an advantage. It can be shown by calculations that lateral instability is not critical for circular hollow sections, square hollow sections and for the most commonly used rectangular hollow sections with bending about the strong axis. Table 2.8 shows allowable span-to-depth ratios for the most commonly used sections (EN 1993-1-1, 2005). According to a study of Kaim (2006)
these limits can be taken considerably larger. It is apparent that hollow sections are especially favourable compared to other sections if bending about both axes is present. Hollow sections used for elements subjected to bending can be more economically designed by using plastic design. However, then the sections have to satisfy more restricted conditions to avoid premature local buckling. Like other steel sections loaded in bending, different moment-rotation behaviour can be observed. Fig. 2.7 shows various moment-rotation diagrams for a member loaded by bending moments. The moment-rotation curve "1" shows a moment exceeding the plastic moment Mpl and a considerable rotation capacity. Moment-rotation curve "2" shows a moment exceeding the plastic moment capacity Mpl, but after the maximum, the moment drops immediately, so that little moment-rotation capacity exists. Moment-rotation curve "3" represents a capacity lower than the plastic moment capacity, which, however, exceeds the yield moment capacity Mel. In the moment-rotation curve "4" the capacity is even lower than the yield moment capacity Mel and failure is by elastic buckling. The effect of the moment-rotation behaviour is reflected in the classification of cross sections as shown in Fig. 2.8 and Table 2.7. The cross section classification is given in limits for the diameter- or flat width-to-thickness ratio. The limits are based on experiments and can be expressed as:
ydf
235c
t
d for CHS (2.9)
f
235c3
t
b
yd
for RHS (2.10a)
ydf
235c3
t
h for RHS (2.10b)
with fyd in N/mm2 and c depending on the section class, the cross section and the loading. For RHS, it is conservatively assumed that the width of the "flat" is equal to the external width b or depth h of the RHS minus 3t.
12
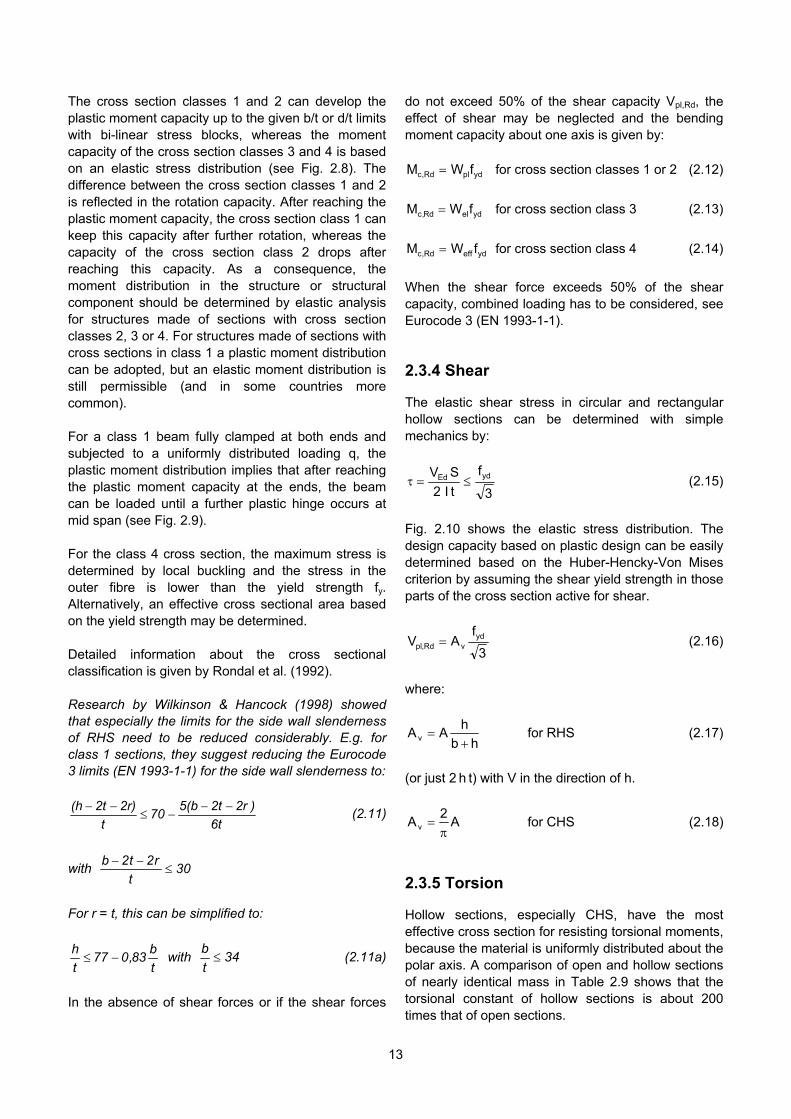
The cross section classes 1 and 2 can develop the plastic moment capacity up to the given b/t or d/t limits with bi-linear stress blocks, whereas the moment capacity of the cross section classes 3 and 4 is based on an elastic stress distribution (see Fig. 2.8). The difference between the cross section classes 1 and 2 is reflected in the rotation capacity. After reaching the plastic moment capacity, the cross section class 1 can keep this capacity after further rotation, whereas the capacity of the cross section class 2 drops after reaching this capacity. As a consequence, the moment distribution in the structure or structural component should be determined by elastic analysis for structures made of sections with cross section classes 2, 3 or 4. For structures made of sections with cross sections in class 1 a plastic moment distribution can be adopted, but an elastic moment distribution is still permissible (and in some countries more common). For a class 1 beam fully clamped at both ends and subjected to a uniformly distributed loading q, the plastic moment distribution implies that after reaching the plastic moment capacity at the ends, the beam can be loaded until a further plastic hinge occurs at mid span (see Fig. 2.9). For the class 4 cross section, the maximum stress is determined by local buckling and the stress in the outer fibre is lower than the yield strength fy. Alternatively, an effective cross sectional area based on the yield strength may be determined. Detailed information about the cross sectional classification is given by Rondal et al. (1992). Research by Wilkinson & Hancock (1998) showed that especially the limits for the side wall slenderness of RHS need to be reduced considerably. E.g. for class 1 sections, they suggest reducing the Eurocode 3 limits (EN 1993-1-1) for the side wall slenderness to:
6t
)2r2t5(b70
t
2r)2t(h
(2.11)
with 30t
r2t2b
For r = t, this can be simplified to:
t
b83,077
t
h with 34
t
b (2.11a)
In the absence of shear forces or if the shear forces
do not exceed 50% of the shear capacity Vpl,Rd, the effect of shear may be neglected and the bending moment capacity about one axis is given by:
ydplRd,c fWM for cross section classes 1 or 2 (2.12)
ydelRd,c fWM for cross section class 3 (2.13)
ydeffRd,c fWM for cross section class 4 (2.14)
When the shear force exceeds 50% of the shear capacity, combined loading has to be considered, see Eurocode 3 (EN 1993-1-1). 2.3.4 Shear The elastic shear stress in circular and rectangular hollow sections can be determined with simple mechanics by:
3
f
t I 2
SV yd
Ed (2.15)
Fig. 2.10 shows the elastic stress distribution. The design capacity based on plastic design can be easily determined based on the Huber-Hencky-Von Mises criterion by assuming the shear yield strength in those parts of the cross section active for shear.
3
fAV yd
vRd,pl (2.16)
where:
hb
hAAv
for RHS (2.17)
(or just 2 h t) with V in the direction of h.
A2
Av for CHS (2.18)
2.3.5 Torsion Hollow sections, especially CHS, have the most effective cross section for resisting torsional moments, because the material is uniformly distributed about the polar axis. A comparison of open and hollow sections of nearly identical mass in Table 2.9 shows that the torsional constant of hollow sections is about 200 times that of open sections.
13
The design capacity for torsional moments is described by:
3
fWM yd
tRd,t (2.19)
or circular hollow sections: F
t )td(2td
I2W t
t
(2.20)
here: w
ttd4
I 3t
(2.21)
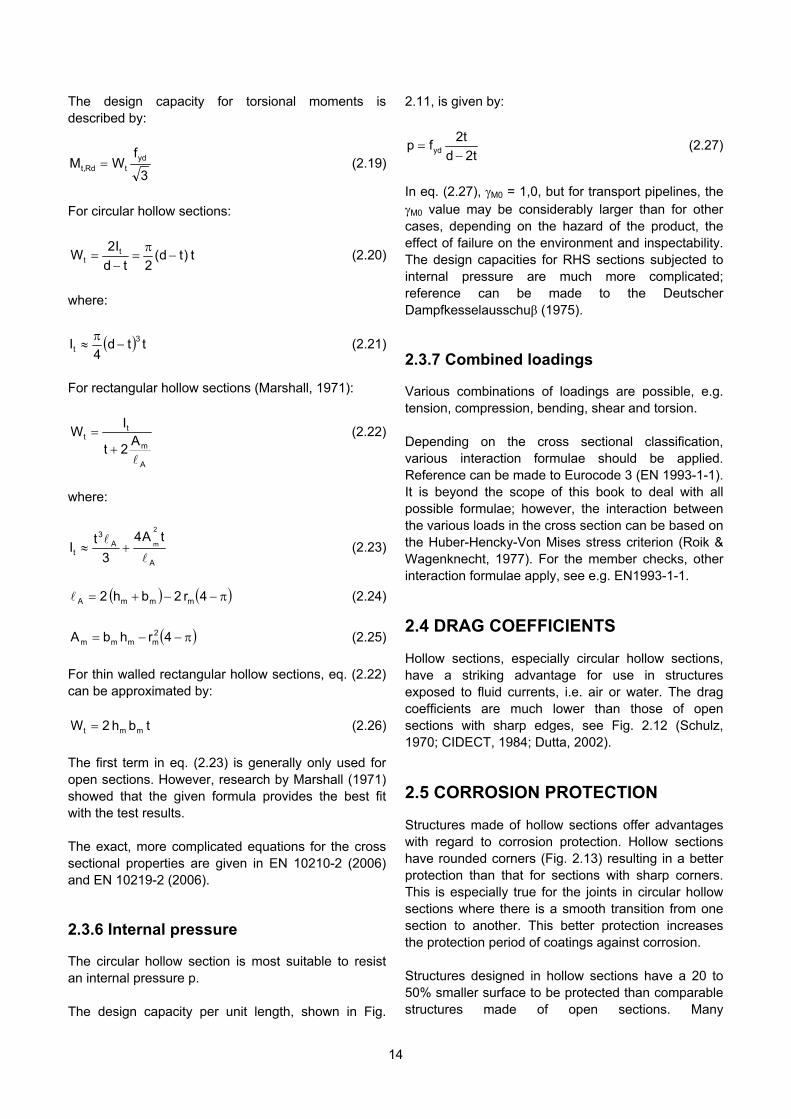
or rectangular hollow sections (Marshall, 1971): F
A
m
tt A
2t
IW
(2.22)
here: w
A
A3
t
tA4
3
tI
2
m
(2.23)
(2.24)
(2.25)
or thin walled rectangular hollow sections, eq. (2.22)
(2.26)
he first term in eq. (2.23) is generally only used for
he exact, more complicated equations for the cross
.3.6 Internal pressure
he design capacity per unit length, shown in Fig.
4r 2bh 2 mmmA
4rhbA 2mm mm
Fcan be approximated by:
tbh 2W m mt
Topen sections. However, research by Marshall (1971) showed that the given formula provides the best fit with the test results. Tsectional properties are given in EN 10210-2 (2006) and EN 10219-2 (2006). 2
he circular hollow section is most suitable to resist Tan internal pressure p. T
2.11, is given by:
t2d
t2fp yd
(2.27)
M0
ectional classification,
.4 DRAG COEFFICIENTS
hollow sections,
.5 CORROSION PROTECTION
tructures designed in hollow sections have a 20 to
eq. (2.27), = 1,0, but for transport pipelines, the In
M0 value may be considerably larger than for other cases, depending on the hazard of the product, the effect of failure on the environment and inspectability. The design capacities for RHS sections subjected to internal pressure are much more complicated; reference can be made to the Deutscher Dampfkesselausschuβ (1975). 2.3.7 Combined loadings
arious combinations of loadings are possible, e.g. Vtension, compression, bending, shear and torsion. Depending on the cross svarious interaction formulae should be applied. Reference can be made to Eurocode 3 (EN 1993-1-1). It is beyond the scope of this book to deal with all possible formulae; however, the interaction between the various loads in the cross section can be based on the Huber-Hencky-Von Mises stress criterion (Roik & Wagenknecht, 1977). For the member checks, other interaction formulae apply, see e.g. EN1993-1-1.
2
ially circular Hollow sections, espechave a striking advantage for use in structures exposed to fluid currents, i.e. air or water. The drag coefficients are much lower than those of open sections with sharp edges, see Fig. 2.12 (Schulz, 1970; CIDECT, 1984; Dutta, 2002).
2
tructures made of hollow sections offer advantages Swith regard to corrosion protection. Hollow sections have rounded corners (Fig. 2.13) resulting in a better protection than that for sections with sharp corners. This is especially true for the joints in circular hollow sections where there is a smooth transition from one section to another. This better protection increases the protection period of coatings against corrosion. S50% smaller surface to be protected than comparable structures made of open sections. Many
14
investigations, summarized by Tissier (1978), have been conducted to assess the likelihood of internal corrosion. These investigations, carried out in various countries, show that internal corrosion does not occur in sealed hollow sections. Even in hollow sections which are not perfectly
.6 USE OF INTERNAL VOID
he possibilities of using the internal space are briefly
.6.1 Concrete filling
wall thicknesses are not
very important reason for using concrete filled
oncrete filling of hollow sections contributes not only
.6.2 Fire protection by water circulation
nother method for fire protection of buildings is to
he columns are interconnected with a water storage
order to prevent freezing, potassium carbonate
.6.3 Heating and ventilation
he inner voids of hollow sections are sometimes
.6.4 Other possibilities
ometimes hollow section chords of lattice girder
.7 AESTHETICS
rational use of hollow sections leads in general to
sealed, internal corrosion is limited. If there is concern about condensation in an imperfectly sealed hollow section, a drainage hole can be made at a point where water can drain by gravity.
2
he internal void in hollow sections can be used in Tvarious ways, e.g. to increase the compressive resistance by filling with concrete, or to provide fire protection. In addition, heating or ventilation systems are sometimes incorporated into hollow section columns. Tdescribed below. 2 the commonly-availableIf
sufficient to meet the required load bearing resistance, the hollow section can be filled with concrete. For example, it may be preferable in buildings to have the same external dimensions for the columns on every floor. At the top floor, the smallest wall thickness can be chosen, and the wall thickness can be increased with increasing load for lower floors. If the hollow section with the largest available wall thickness is not sufficient for the ground floor, the hollow section can be filled with concrete to increase the load bearing resistance. Ahollow sections is that the columns can be relatively slender. Design rules are given in e.g. Eurocode 4 (EN 1994-1-1, 2004). Cto an increase in load bearing resistance, but it also improves the fire resistance duration. Extensive test projects carried out by CIDECT and the European Coal and Steel Community (ECSC) showed that reinforced concrete filled hollow section columns without any external fire protection like plaster, vermiculite panels or intumescent paint, can attain a fire life of even 2 hours depending on the cross
section ratio of the steel and concrete, reinforcement percentage of the concrete and the applied load, see Fig. 2.14 (Twilt et al., 1994). 2 Ause water filled hollow section columns. Ttank. Under fire conditions, the water circulates by convection, keeping the steel temperature below the critical value of 450 C. This system has economical advantages when applied to buildings with more than about 8 storeys. If the water flow is adequate, the resulting fire resistance time is virtually unlimited. In(K2CO3) is added to the water. Potassium nitrate is used as an inhibitor against corrosion. 2 Tused for air and water circulation for heating and ventilation of buildings. Many examples in offices and schools show the excellent combination of the strength function of hollow section columns with the integration of heating or ventilation systems. This system offers maximization of floor area through elimination of heat exchangers, a uniform provision of warmth and a combined protection against fire. 2 Sbridges are used for conveying fluids (pipe bridge). In buildings, the rain water downpipes may go through the hollow section columns or in other cases electrical wiring is located in the columns. The internal space can also be used for prestressing a hollow section.
2 Astructures which are cleaner and more spacious. Hollow sections can provide slender aesthetic columns, with variable section properties but flush external dimensions. Due to their torsional rigidity, hollow sections have specific advantages in folded structures, V-type girders, etc.
15
16
often made of hollow sections directly connected to one another without any stiffener or gusset plate, is often preferred by architects for structures with visible steel elements. However, it is difficult to express aesthetic features in economic comparisons. Sometimes hollow sections are used only because of aesthetic appeal, see e.g. Fig. 2.15, whilst at other times appearance is less important.
Lattice construction, which is
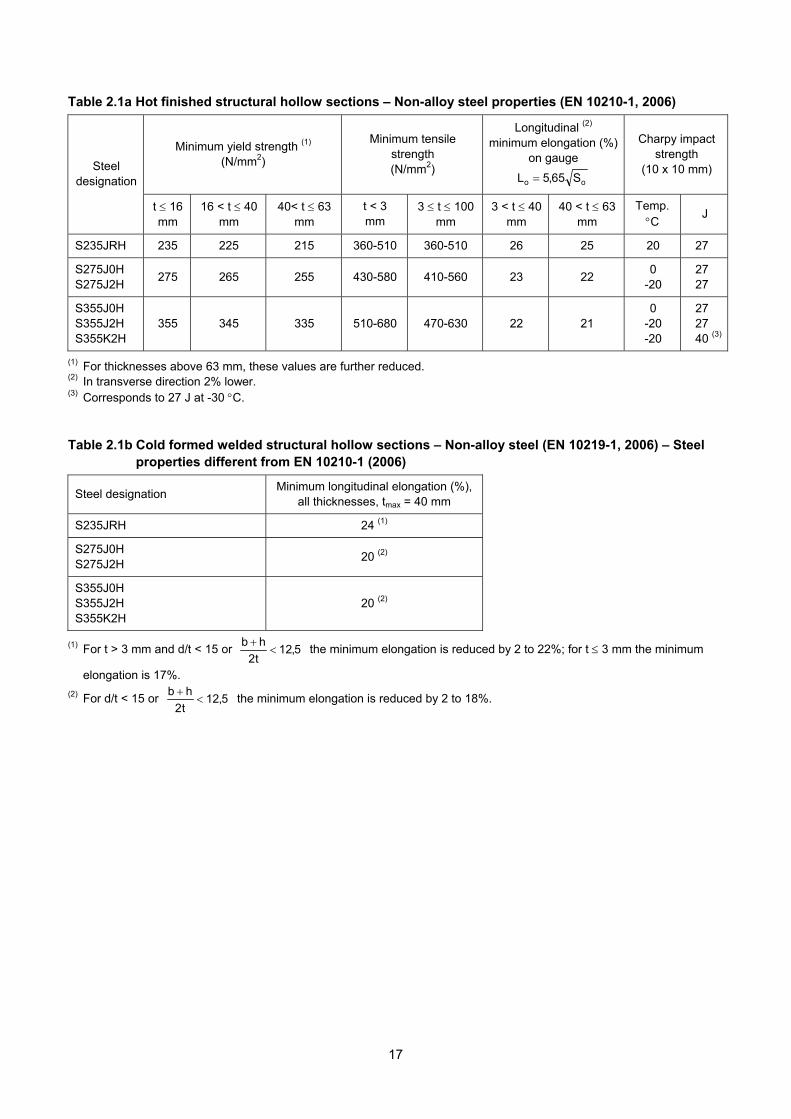
Table 2.1a Hot finished structural hollow sections – Non-alloy steel properties (EN 10210-1, 2006)
Minimum yield strength (1) (N/mm2)
Minimum tensile strength (N/mm2)
Longitudinal (2) minimum elongation (%)
on gauge
oo S65,5L
Charpy impact strength
(10 x 10 mm) Steel designation
t 16 mm
16 < t 40 mm
40< t 63 mm
t < 3 mm
3 t 100 mm
3 < t 40 mm
40 < t 63 mm
Temp. C
J
S235JRH 235 225 215 360-510 360-510 26 25 20 27
S275J0H S275J2H
275 265 255 430-580 410-560 23 22 0
-20 27 27
S355J0H S355J2H S355K2H
355 345 335 510-680 470-630 22 21 0
-20 -20
27 27 40 (3)
(1) For thicknesses above 63 mm, these values are further reduced. (2) In transverse direction 2% lower. (3) Corresponds to 27 J at -30 C.
Table 2.1b Cold formed welded structural hollow sections – Non-alloy steel (EN 10219-1, 2006) – Steel
properties different from EN 10210-1 (2006)
Steel designation Minimum longitudinal elongation (%),
all thicknesses, tmax = 40 mm
S235JRH 24 (1)
S275J0H S275J2H
20 (2)
S355J0H S355J2H S355K2H
20 (2)
(1) For t > 3 mm and d/t < 15 or 5,12t2
hb
the minimum elongation is reduced by 2 to 22%; for t 3 mm the minimum
elongation is 17%.
(2) For d/t < 15 or 5,12t2
hb
the minimum elongation is reduced by 2 to 18%.
17
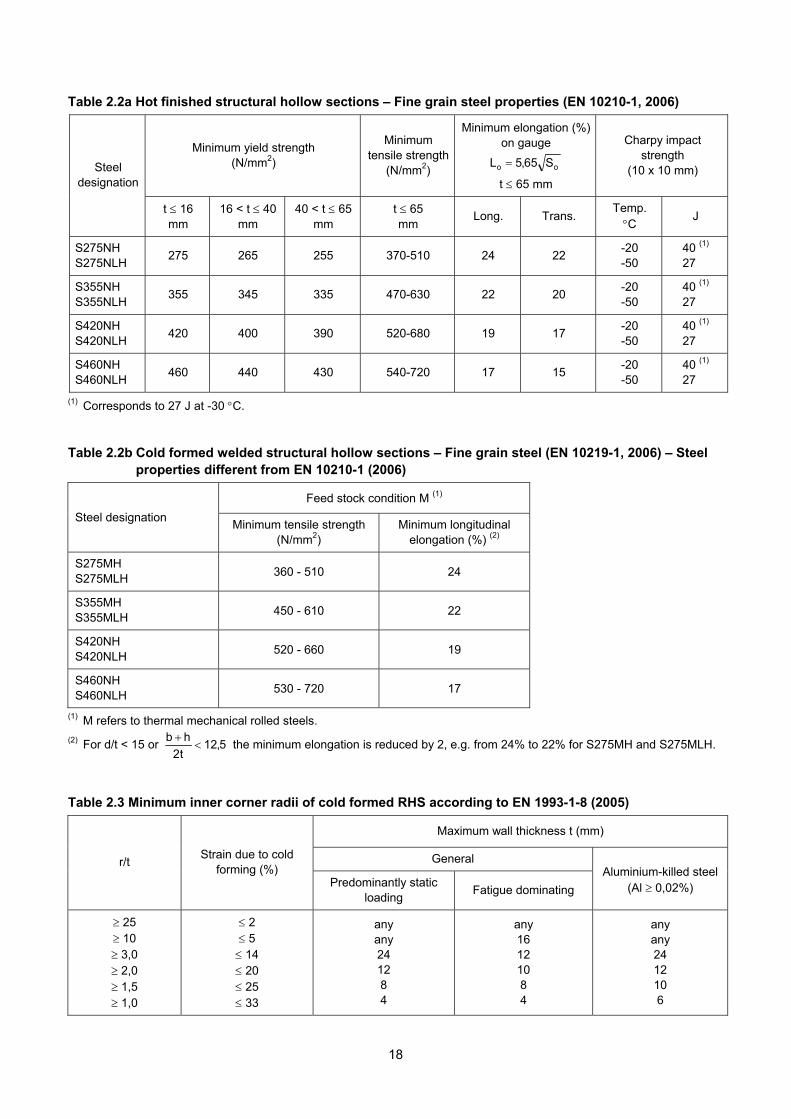
Table 2.2a Hot finished structural hollow sections – Fine grain steel properties (EN 10210-1, 2006)
Minimum yield strength (N/mm2)
Minimum tensile strength
(N/mm2)
Minimum elongation (%) on gauge
oo S65,5L
t 65 mm
Charpy impact strength
(10 x 10 mm) Steel designation
t 16 mm
16 < t 40 mm
40 < t 65 mm
t 65 mm
Long. Trans. Temp. C
J
S275NH S275NLH
275 265 255 370-510 24 22 -20 -50
40 (1) 27
S355NH S355NLH
355 345 335 470-630 22 20 -20 -50
40 (1) 27
S420NH S420NLH
420 400 390 520-680 19 17 -20 -50
40 (1) 27
S460NH S460NLH
460 440 430 540-720 17 15 -20 -50
40 (1) 27
(1) Corresponds to 27 J at -30 C. Table 2.2b Cold formed welded structural hollow sections – Fine grain steel (EN 10219-1, 2006) – Steel
properties different from EN 10210-1 (2006)
Feed stock condition M (1)
Steel designation Minimum tensile strength
(N/mm2) Minimum longitudinal
elongation (%) (2)
S275MH S275MLH
360 - 510 24
S355MH S355MLH
450 - 610 22
S420NH S420NLH
520 - 660 19
S460NH S460NLH
530 - 720 17
(1) M refers to thermal mechanical rolled steels.
(2) For d/t < 15 or 5,12t2
hb
the minimum elongation is reduced by 2, e.g. from 24% to 22% for S275MH and S275MLH.
Table 2.3 Minimum inner corner radii of cold formed RHS according to EN 1993-1-8 (2005)
Maximum wall thickness t (mm)
General r/t Strain due to cold
forming (%) Predominantly static
loading Fatigue dominating
Aluminium-killed steel (Al 0,02%)
25 10 3,0 2,0 1,5 1,0
2 5 14 20 25 33
any any 24 12 8 4
any 16 12 10 8 4
any any 24 12 10 6
18

Table 2.4a Hot finished structural hollow sections – Tolerances (EN 10210-2, 2006)
Section type Square/rectangular Circular
Outside dimension the greater of ± 0,5 mm and ± 1% (1) the greater of ± 0,5 mm and ± 1% but not more than 10 mm
Welded -10% Thickness
Seamless -10% and -12,5% at maximum 25% cross section
Welded ± 6% on individual lengths Mass
Seamless -6%; +8%
Straightness 0,2% of the total length and 3 mm over any 1 m length
Length (exact) +10 mm, -0 mm, but only for exact lengths of 2000 to 6000 mm
Out of roundness - 2% for d/t 100
Squareness of sides 90 ± 1 -
Corner radii Outside 3,0t maximum -
Concavity/convexity ± 1% of the side -
Twist 2 mm + 0,5 mm/m (1) -
(1) For elliptical hollow sections with h 250 mm, the tolerances are twice the values given in this table. Table 2.4b Cold formed welded structural hollow sections (EN 10219-2, 2006) – Tolerances different
from EN 10210-2 (2006)
Section type Square/rectangular Circular
Outside dimension b < 100 mm: the greater of ± 0,5 mm and ± 1% 100 mm h, b 200 mm: ± 0,8% b > 200 mm: ± 0,6%
± 1%, minimum ± 0,5 mm maximum ± 10 mm
Thickness Welded t 5 mm: ± 10% t > 5 mm: ± 0,5 mm
for d 406,4 mm: t 5 mm: ± 10% t > 5 mm: ± 0,5 mm for d > 406,4 mm: ± 10% with maximum ± 2,0 mm
Mass ± 6% ± 6%
Straightness 0,15% of the total length and 3 mm over any 1 m length
Outside corner radii (profile)
t 6 mm: 1,6 to 2,4t 6 mm < t 10 mm: 2,0 to 3,0t t > 10 mm: 2,4 to 3,6t
-
Concavity/convexity maximum 0,8% with a minimum of 0,5 mm -
Table 2.5 Special shapes available
Triangular Hexagonal Octagonal Flat - oval Elliptical Half-elliptical
Shape
19
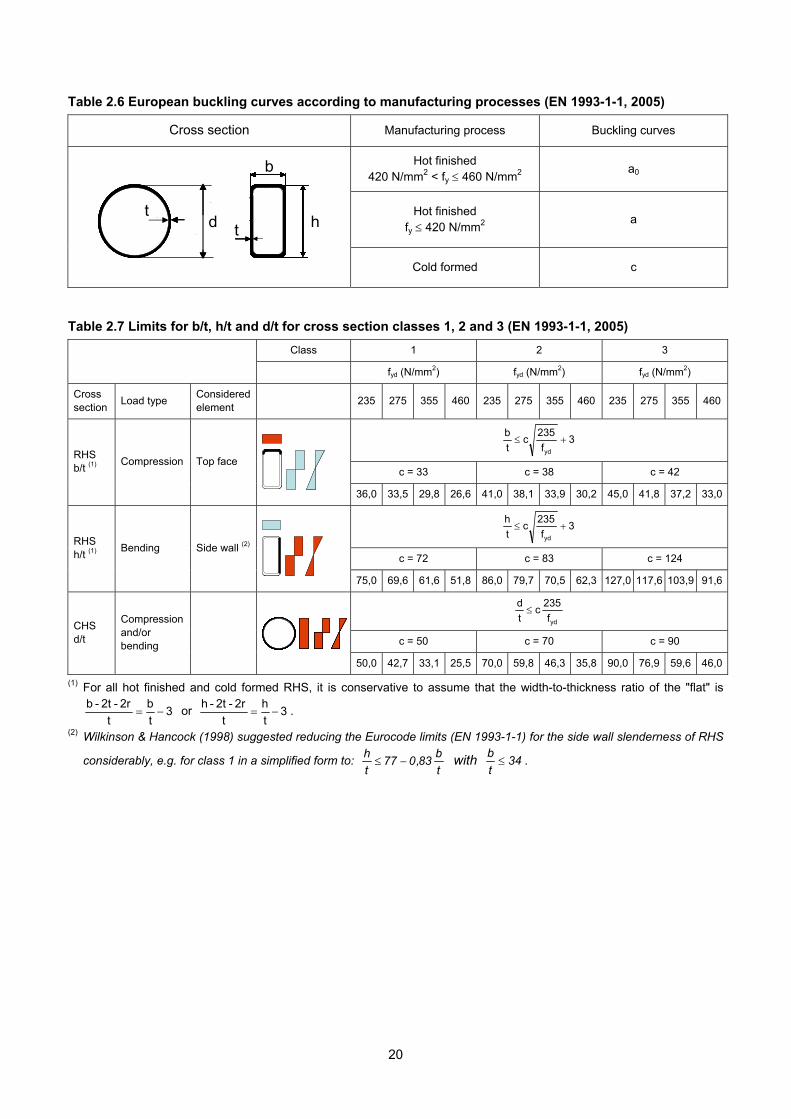
Table 2.6 European buckling curves according to manufacturing processes (EN 1993-1-1, 2005)
Cross section Manufacturing process Buckling curves
Hot finished 420 N/mm2 < fy 460 N/mm2 a0
Hot finished fy 420 N/mm2
a
Cold formed c
h
b
Flange
Web t
h
b
Flange
Webh
b
h
b
Flange
Web t
h
b
Flange
Web t
h
b
Flange
Webh
b
h
b
Flange
Web t
b
t dt dt
dt
h
b
Flange
Web t
h
b
Flange
Webh
b
h
b
Flange
Web t
h
b
Flange
Web t
h
b
Flange
Webh
b
h
b
Flange
Web t
b
t dt dt
dt
hh
Table 2.7 Limits for b/t, h/t and d/t for cross section classes 1, 2 and 3 (EN 1993-1-1, 2005)
Class 1 2 3
fyd (N/mm2) fyd (N/mm2) fyd (N/mm2)
Cross section
Load type Considered element
235 275 355 460 235 275 355 460 235 275 355 460
3f
235c
t
b
yd
c = 33 c = 38 c = 42
RHS b/t (1)
Compression Top face
36,0 33,5 29,8 26,6 41,0 38,1 33,9 30,2 45,0 41,8 37,2 33,0
3f
235c
t
h
yd
c = 72 c = 83 c = 124
RHS h/t (1)
Bending Side wall (2)
75,0 69,6 61,6 51,8 86,0 79,7 70,5 62,3 127,0 117,6 103,9 91,6
ydf
235c
t
d
c = 50 c = 70 c = 90
CHS d/t
Compression and/or bending
t tt t
50,0 42,7 33,1 25,5 70,0 59,8 46,3 35,8 90,0 76,9 59,6 46,0
(1) For all hot finished and cold formed RHS, it is conservative to assume that the width-to-thickness ratio of the "flat" is
3t
b
t
2r-2t-b or 3
t
h
t
2r-2t-h .
(2) Wilkinson & Hancock (1998) suggested reducing the Eurocode limits (EN 1993-1-1) for the side wall slenderness of RHS
considerably, e.g. for class 1 in a simplified form to: t
b83,077
t
h with 34
t
b .
20
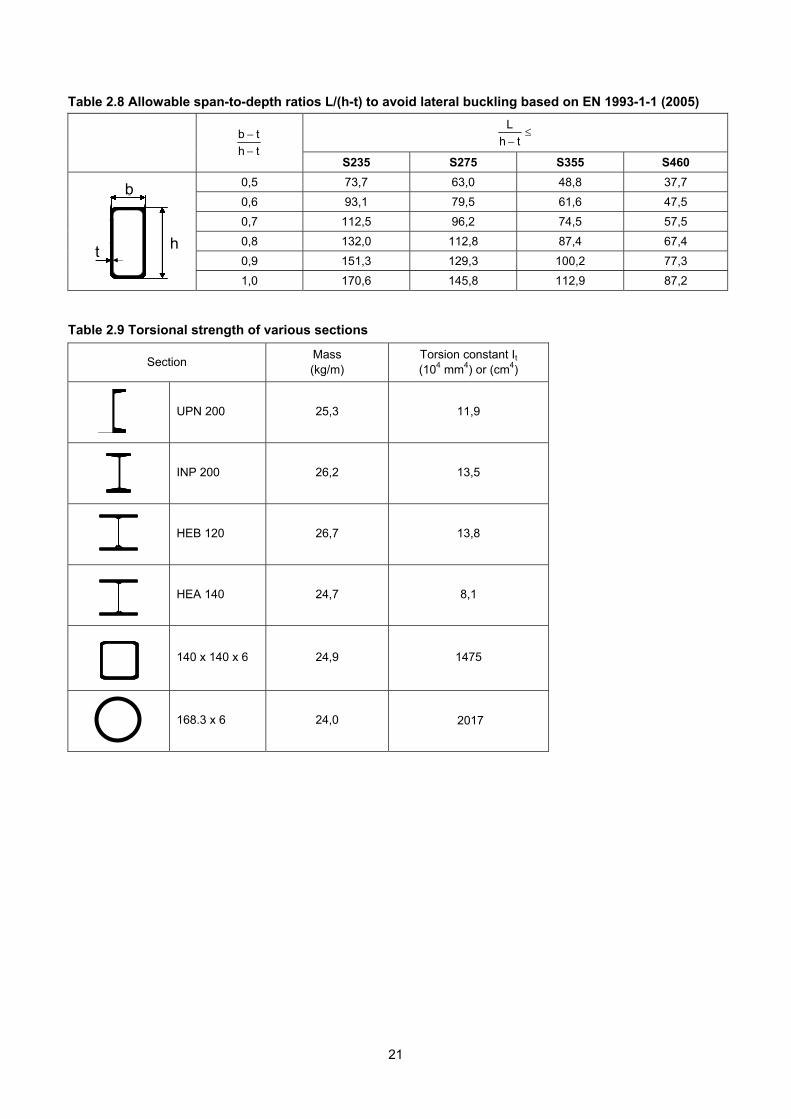
Table 2.8 Allowable span-to-depth ratios L/(h-t) to avoid lateral buckling based on EN 1993-1-1 (2005)
th
L
th
tb
S235 S275 S355 S460
0,5 73,7 63,0 48,8 37,7
0,6 93,1 79,5 61,6 47,5
0,7 112,5 96,2 74,5 57,5
0,8 132,0 112,8 87,4 67,4
0,9 151,3 129,3 100,2 77,3
1,0 170,6 145,8 112,9 87,2
h
b
Flange
b t
h
b
Flange
bh
b
h
b
Flange
b t
h
b
Flange
b t
h
b
Flange
bh
b
h
b
Flange
b t
b
ht h
b
Flange
b t
h
b
Flange
bh
b
h
b
Flange
b t
h
b
Flange
b t
h
b
Flange
bh
b
h
b
Flange
b t
b
ht
Table 2.9 Torsional strength of various sections
Section Mass (kg/m)
Torsion constant It (104 mm4) or (cm4)
UPN 200 25,3 11,9
INP 200 26,2 13,5
HEB 120 26,7 13,8
HEA 140 24,7 8,1
140 x 140 x 6 24,9 1475
168.3 x 6 24,0 2017
21
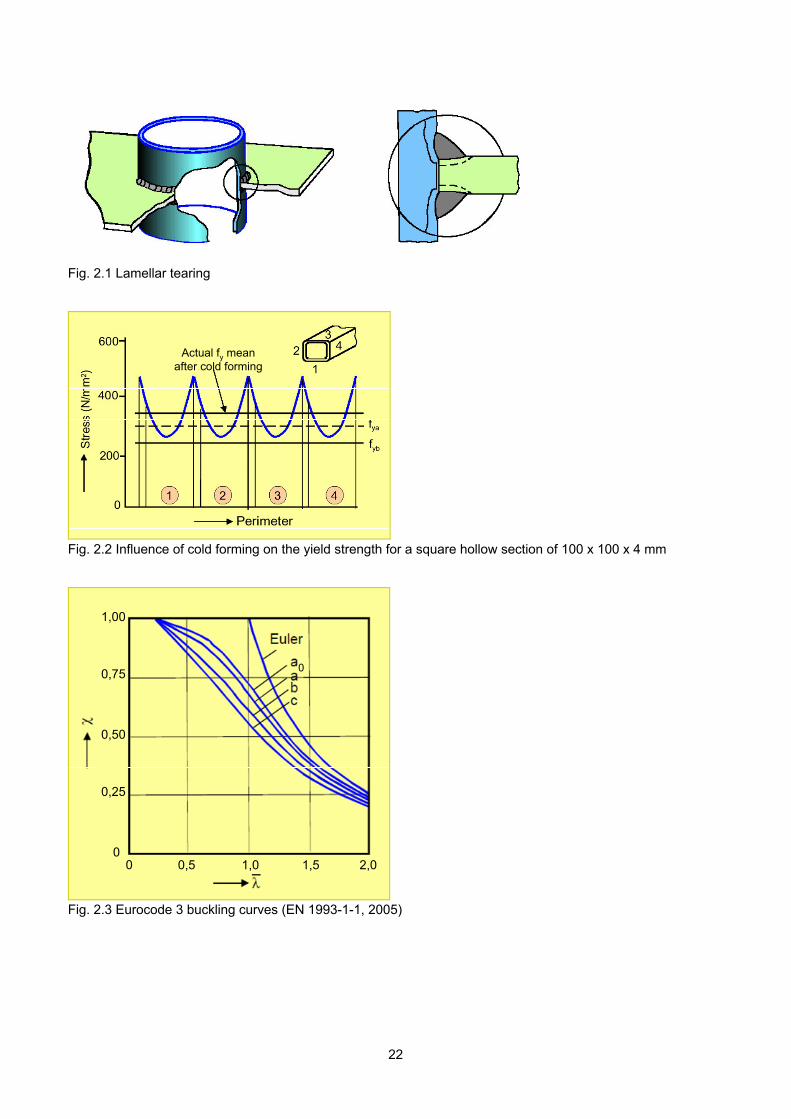
Fig. 2.1 Lamellar tearing
Actual fy meanafter cold forming
Actual fy meanafter cold forming
Actual fy meanafter cold forming
Fig. 2.2 Influence of cold forming on the yield strength for a square hollow section of 100 x 100 x 4 mm
0
1,00
0,75
0,50
0,25
00 0,5 1,0 1,5 2,0
00
1,00
0,75
0,50
0,25
00 0,5 1,0 1,5 2,0
Fig. 2.3 Eurocode 3 buckling curves (EN 1993-1-1, 2005)
22
Buc
klin
gst
ress
(N
/mm
2 )B
uckl
ing
stre
ss (
N/m
m2 )
Fig. 2.4 Comparison of the masses of hollow and open sections under compression in relation to the loading
Fig. 2.5 Restraints for the buckling of a brace member
Fig. 2.6 Bottom chord laterally spring supported by the stiffness of the members, joints and purlins
23
Mpl
Mel
Me
Mpl
Mel
Me
Fig. 2.7 Moment-rotation curves
Fig. 2.8 Stress distribution for bending
Fig. 2.9 Moment distribution in relation to the cross section classification
24
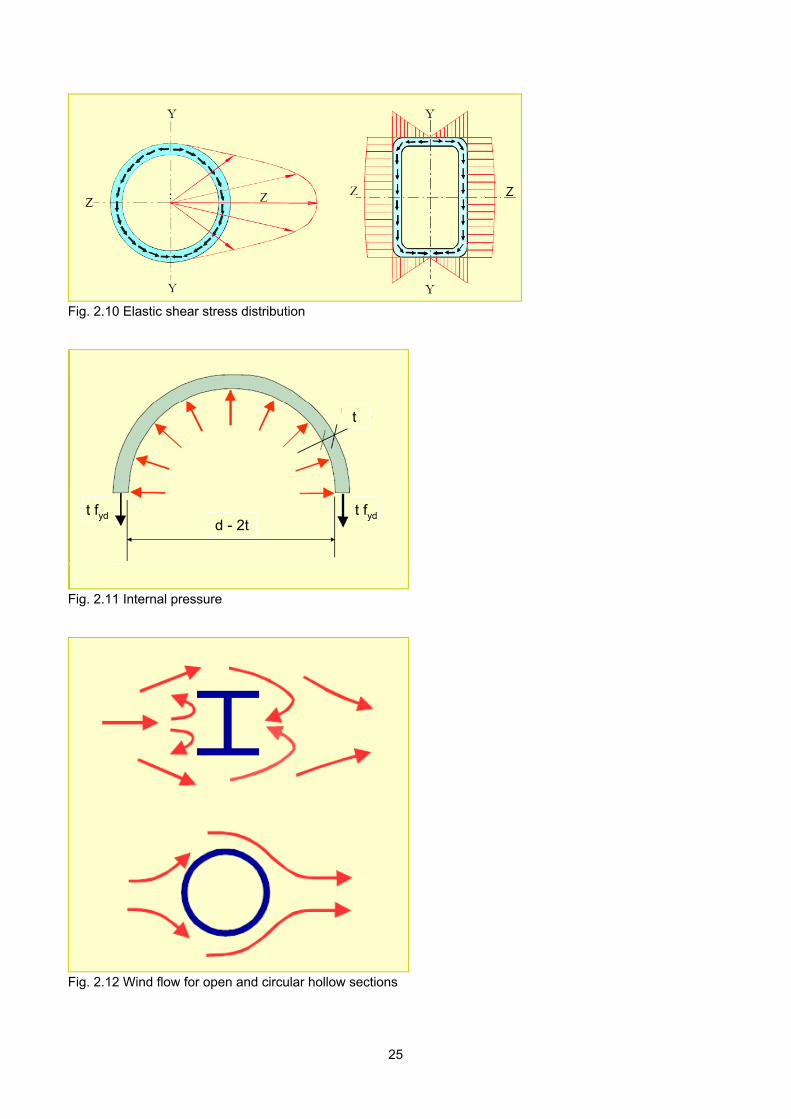
Fig. 2.10 Elastic shear stress distribution
tfydt fyd t fyd
t
d - 2t
Fig. 2.11 Internal pressure
Fig. 2.12 Wind flow for open and circular hollow sections
25

paint layers
steelsteel
corner protection for RHS and open sections
paint layers
steelsteel
corner protection for RHS and open sections
paint layers
steelsteel
corner protection for RHS and open sections
paint layers
steelsteel
corner protection for RHS and open sections
Fig. 2.13 Painted corners of RHS vs. open sections
Fig. 2.14 Fire resistance of concrete filled hollow sections
RHS 304,8x304,8x9,5
111 min.
14 min.
onlyRHS
non-reinforcedconcrete
filling
50min.
steel fibrereinforcedconcrete
filling
working load (kN)
fire
life
(min
.)
1650. 3150. 3150.
120.
60.
RHS 304,8x304,8x9,5
111 min.
14 min.
onlyRHS
non-reinforcedconcrete
filling
50min.
steel fibrereinforcedconcrete
filling
working load (kN)
fire
life
(min
.)
1650. 3150. 3150.
120.
60.
RHS 304,8x304,8x9,5
111 min.
14 min.
onlyRHS
non-reinforcedconcrete
filling
50min.
steel fibrereinforcedconcrete
filling
working load (kN)
fire
life
(min
.)
1650. 3150. 3150.
120.
60.
26
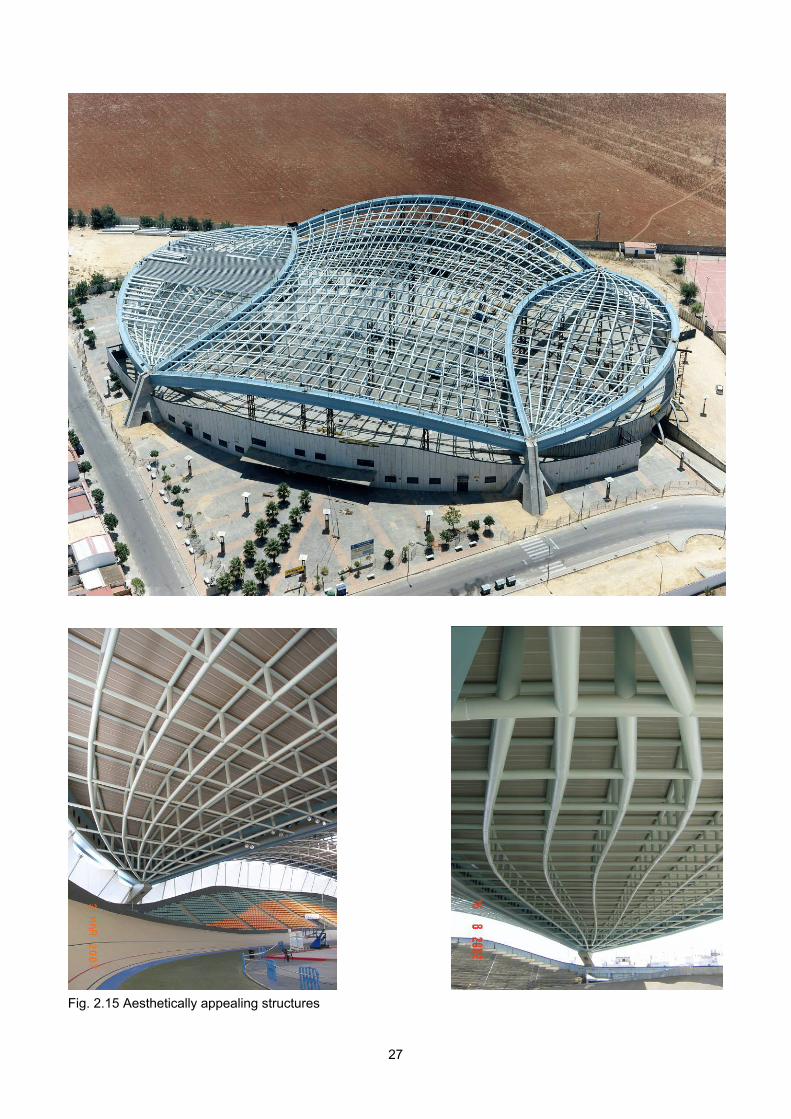
Fig. 2.15 Aesthetically appealing structures
27

28

3. APPLICATIONS The applications of structural hollow sections nearly cover all fields. Hollow sections may be used because of the beauty of their shape or to express lightness, while in other cases their geometrical properties determine their application. In this chapter, examples are given for the various fields and to show the possibilities of constructing with hollow sections.
3.1 BUILDINGS AND HALLS In buildings and halls, hollow sections are mainly used for columns and lattice girders or space frames for roofs. In modern architecture, they are also used for other structural or architectural reasons, e.g. facades. Fig. 3.1 shows a 10-storey building in Karlsruhe, Germany with rectangular hollow section columns 180 x 100. Special aspects are that the columns are made of weathering steel and are water filled to ensure the required fire protection. The columns are connected with water reservoirs to ensure circulation. Besides the fire protection, a further advantage is that due to the water circulation in the columns, the deformation of the building due to temperature differences by sunshine is limited. Fig. 3.2 shows an example of lattice girder trusses used in a roof of an industrial building. For an optimal cost effective design, it is essential that the truss joints are made without any stiffening plates. An especially appealing application is given in Fig. 3.3, showing a tree-type support of the airport departure hall in Stuttgart, Germany. For the joints, streamlined steel castings are used. Fig. 3.4 shows the roof of the terminal of Kansai International Airport in Osaka, Japan with curved triangular girders of circular hollow sections. Fig. 3.5 shows a dome under construction, whereas Fig. 3.6 illustrates a special application using columns and beams in the façade for ventilation assuring clean windows in the swimming pool. Fig. 3.7 shows a very nice architectural application in Bush Lane House in the city of London, UK. The external circular hollow section lattice transfers the façade loads and the loads on the floors to the main columns. The hollow sections are filled with water for fire protection.
Very attractive applications can be found in the halls and buildings for the Olympic Games in Athens, e.g. Fig. 3.8. Elliptical hollow sections are becoming more and more popular among architects and already several examples exist, see for example Fig. 3.9, the airport building in Madrid. Nowadays, many examples of tubular structures are found in railway stations (Figs. 3.10 and 3.11) and roofs of stadia and halls (Figs. 3.12 to 3.14). Indeed, as stated by one of the former CIDECT vice presidents, Jim Cran, at the Tubular Structures Symposium in Delft (1977) "The sky is the limit", whilst presenting beautiful applications of structural hollow sections.
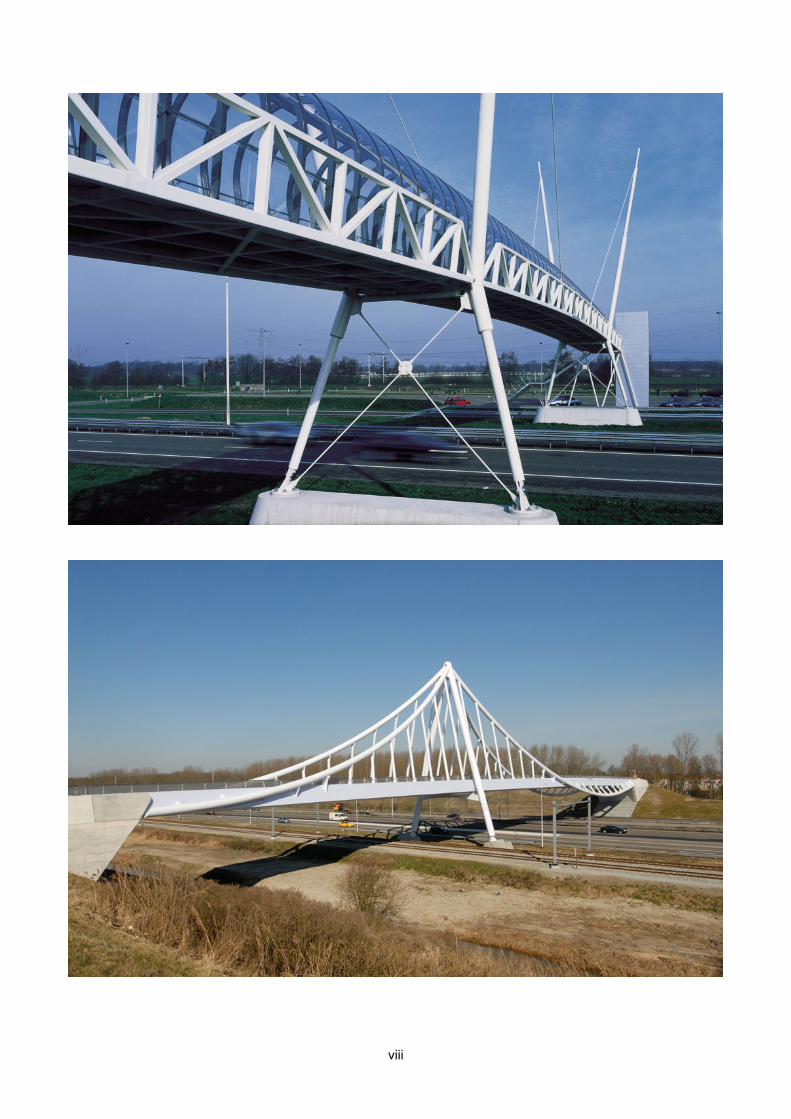
3.2 BRIDGES As mentioned in the introduction, the Firth of Forth Bridge is an excellent example of using the hollow section shape for structural applications in bridges. Nowadays, many modern examples exist (IISI, 1997). Figs. 1.4, 3.15 to 3.17 and 3.20 show various examples of pedestrian bridges; some of these are movable bridges. Circular hollow sections can also be used as a flange for plate girders, as shown in Fig. 3.17 for a triangular box girder. A very nice example of a road-pedestrian bridge is illustrated in Fig. 3.18, being a composite steel-concrete bridge with hollow sections for the arch and braces and a concrete deck. Fig. 3.19 shows a railway bridge near Rotterdam, The Netherlands with circular hollow section arches.
3.3 BARRIERS There are a few aspects which make hollow sections increasingly suitable for hydraulic structures, such as barriers. Due to environmental restrictions, the maintenance of hydraulic structures requires severe precautions, making durability an important issue. Structures of hollow sections are less susceptible to corrosion due to the rounded corners. Furthermore, especially circular hollow sections have lower drag coefficients, leading to lower forces due to wave loading. Fig. 3.21 shows a barrier with a support
29

structure of circular hollow sections. Fig. 3.22 shows the storm surge barrier near Hook of Holland with triangular arms made of circular hollow sections and a length (250 m) equal to the height of the Eiffel Tower in Paris.
3.4 OFFSHORE STRUCTURES Offshore, many application examples are available; most of them in circular hollow sections. For the support structure, the jacket or tower, not only is the wave loading important, but also other aspects are leading to the use of circular hollow sections. E.g. in jackets, the circular hollow section piles are often driven through the circular hollow section legs of the jacket, thus the pile is guided through the leg. Sometimes the internal void is used for buoyancy. Further, the durability and easy maintenance in severe environments are extremely important. Hollow section members are used in jackets, towers, the legs and diagonals in topside structures, cranes, microwave towers, flare supports, bridges, support structures of helicopter decks and further in various secondary structures, such as staircases, ladders, etc. Figs. 3.23 and 3.24 show two examples.
3.5 TOWERS AND MASTS Considering wind loading, corrosion protection and architectural appearance, there is no doubt that hollow sections are to be preferred. However, in many countries, electric power transmission towers are made of angle sections with simple bolted joints. Nowadays, architectural appearance becomes more important, while stringent environmental restrictions make protection and maintenance increasingly expensive. These factors stimulate designs made of hollow sections (Figs. 3.25 and 3.26).
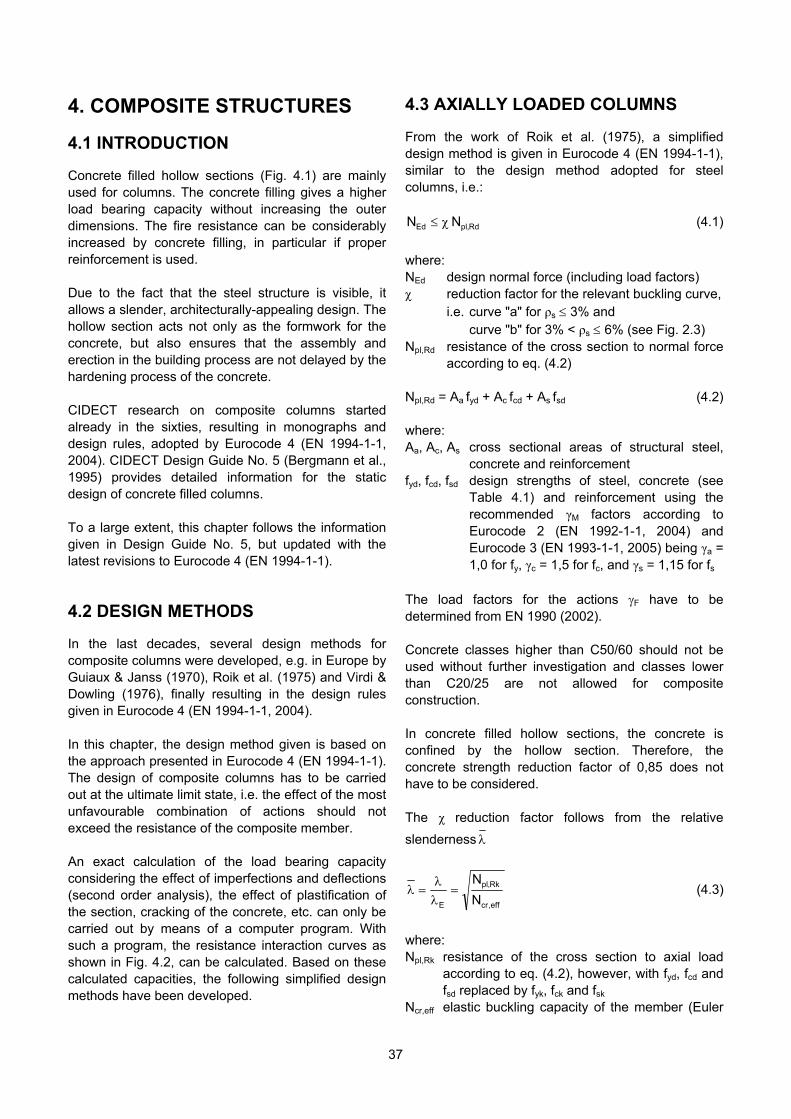
3.6 SPECIAL APPLICATIONS The field of special applications is large, e.g. along the roads, petrol stations (Fig. 3.27), sound barriers (Fig. 3.28), traffic information gantries (Fig. 3.29), guard rails, parapets and sign posts. Further, excellent application examples are found in radio telescopes (Fig. 3.30), in mechanical engineering, cranes (Fig. 3.31) and roller coasters (Fig. 3.32).
In the agricultural field, glass houses (Fig. 3.33) and agricultural machinery are typical examples. Also in transport, many examples exist but these are outside the scope of this book. Indeed, the sky is the limit.
30
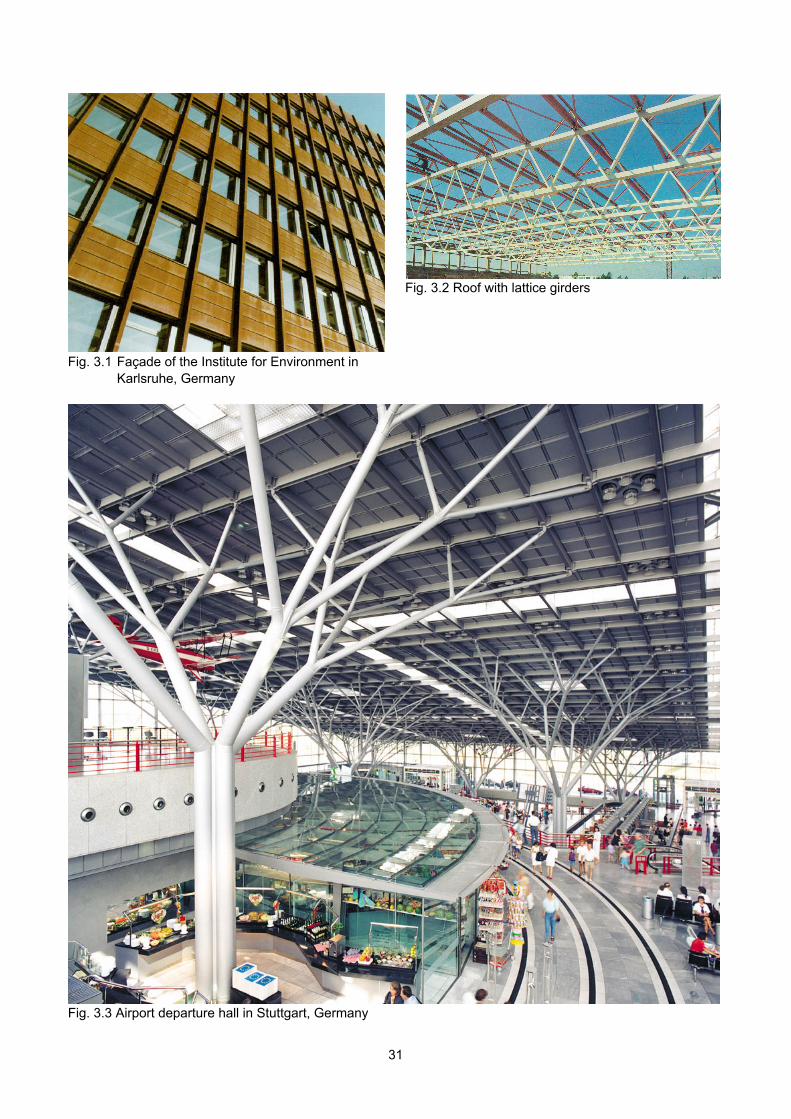
Fig. 3.2 Roof with lattice girders
Fig. 3.1 Façade of the Institute for Environment in Karlsruhe, Germany
Fig. 3.3 Airport departure hall in Stuttgart, Germany
31
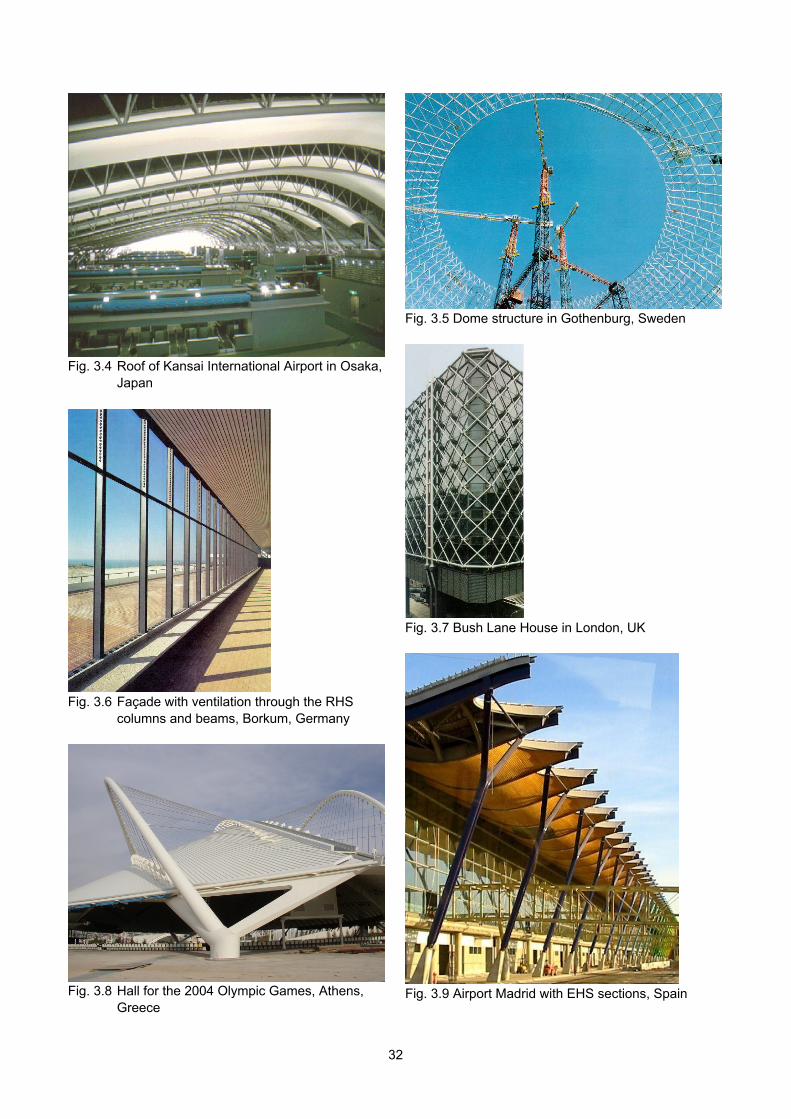
Fig. 3.4 Roof of Kansai International Airport in Osaka,
Japan
Fig. 3.6 Façade with ventilation through the RHS
columns and beams, Borkum, Germany
Fig. 3.8 Hall for the 2004 Olympic Games, Athens,
Greece
Fig. 3.5 Dome structure in Gothenburg, Sweden
Fig. 3.7 Bush Lane House in London, UK
Fig. 3.9 Airport Madrid with EHS sections, Spain
32
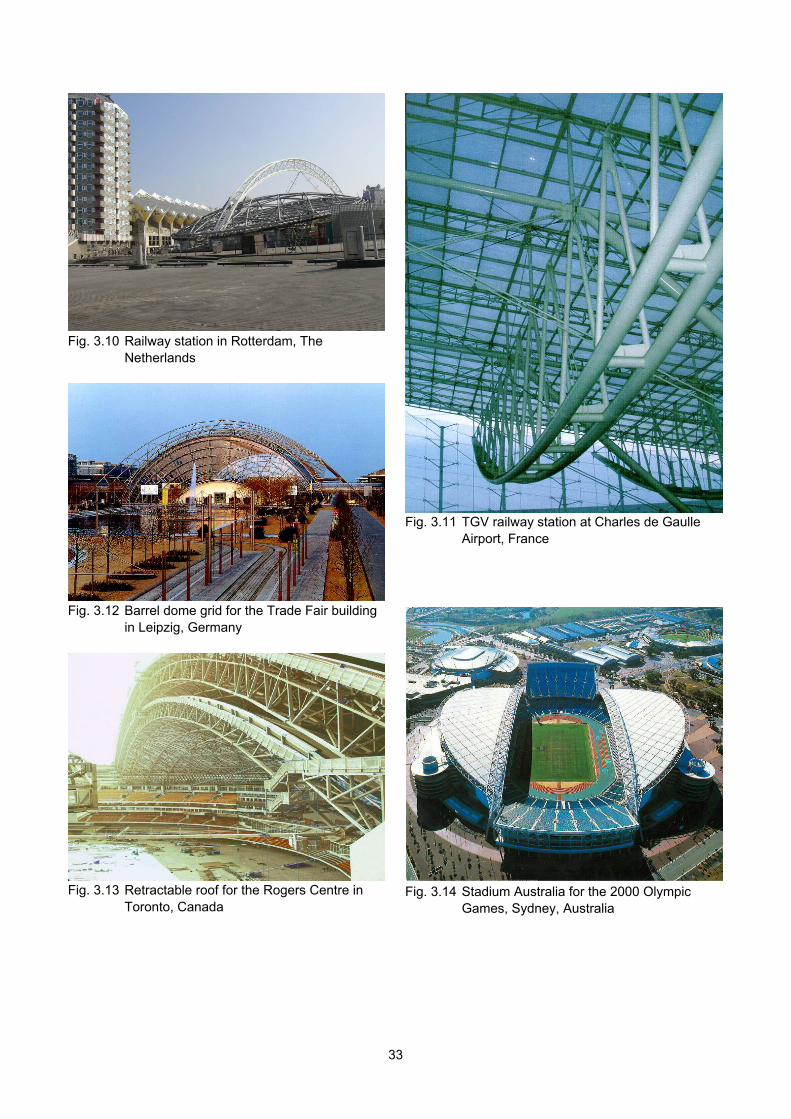
Fig. 3.10 Railway station in Rotterdam, The
Netherlands
Fig. 3.12 Barrel dome grid for the Trade Fair building
in Leipzig, Germany
Fig. 3.13 Retractable roof for the Rogers Centre in
Toronto, Canada
Fig. 3.11 TGV railway station at Charles de Gaulle
Airport, France
Fig. 3.14 Stadium Australia for the 2000 Olympic
Games, Sydney, Australia
33

Fig. 3.15 Movable pedestrian bridge in RHS, The
Netherlands
Fig. 3.17 Pedestrian bridge in Houdan, France
Fig. 3.19 Railway bridge with CHS arches, The
Netherlands
Fig. 3.21 Eastern Scheldt barrier, The Netherlands
Fig. 3.16 Movable pedestrian bridge in RHS near
Delft, The Netherlands
Fig. 3.18 Composite road bridge in Marvejols, France
Fig. 3.20 Movable pedestrian bridge in CHS near
Delft, The Netherlands
Fig. 3.22 Storm surge barrier, The Netherlands
34
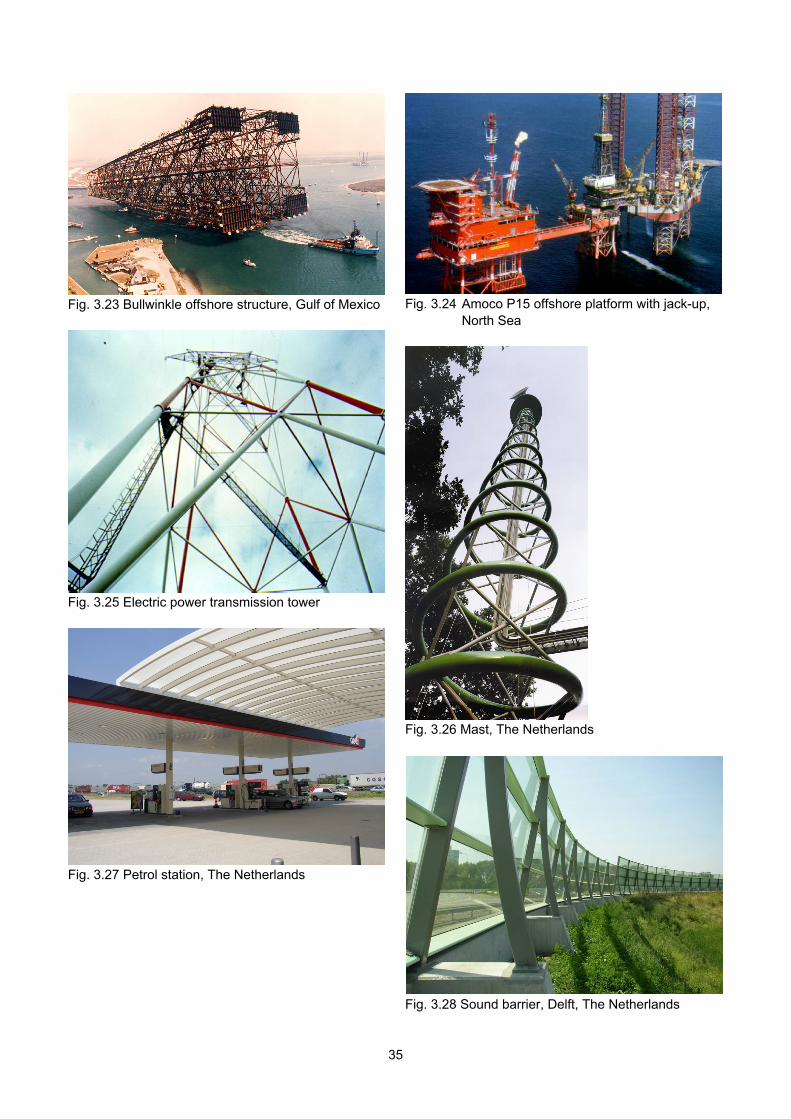
Fig. 3.23 Bullwinkle offshore structure, Gulf of Mexico
Fig. 3.25 Electric power transmission tower
Fig. 3.27 Petrol station, The Netherlands
Fig. 3.24 Amoco P15 offshore platform with jack-up,
North Sea
Fig. 3.26 Mast, The Netherlands
Fig. 3.28 Sound barrier, Delft, The Netherlands
35
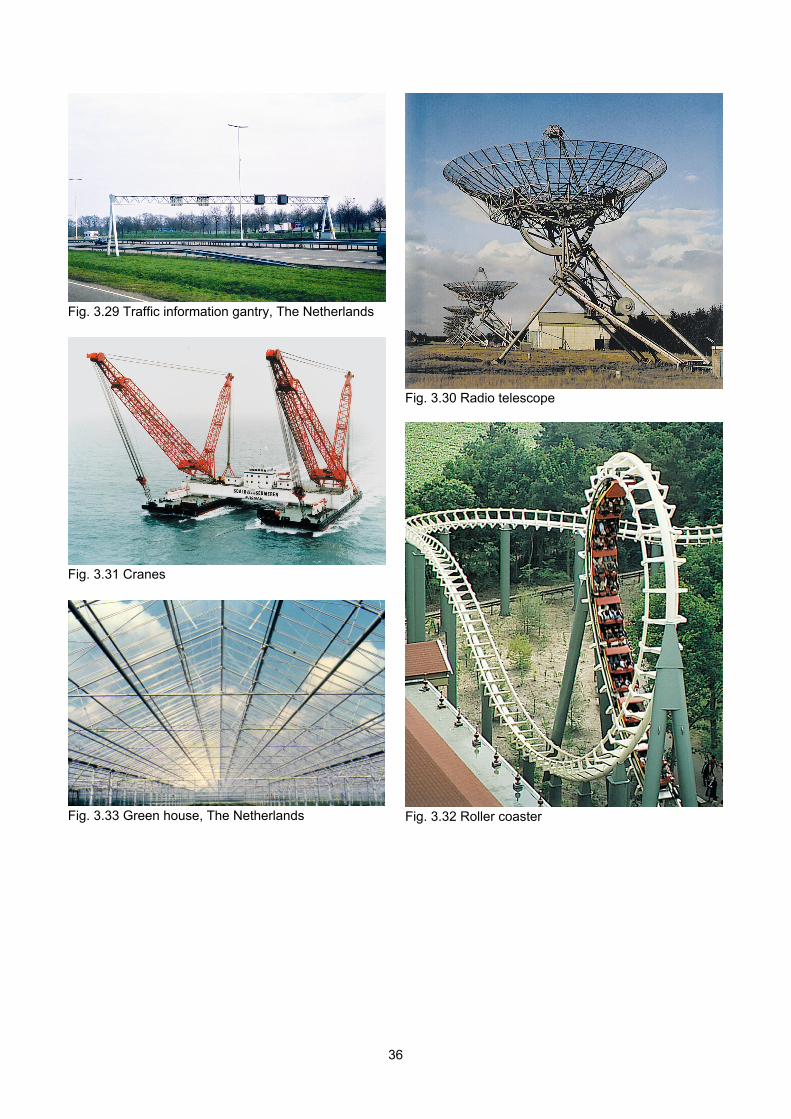
Fig. 3.29 Traffic information gantry, The Netherlands
Fig. 3.30 Radio telescope
Fig. 3.31 Cranes
Fig. 3.33 Green house, The Netherlands Fig. 3.32 Roller coaster
36
4. COMPOSITE STRUCTURES
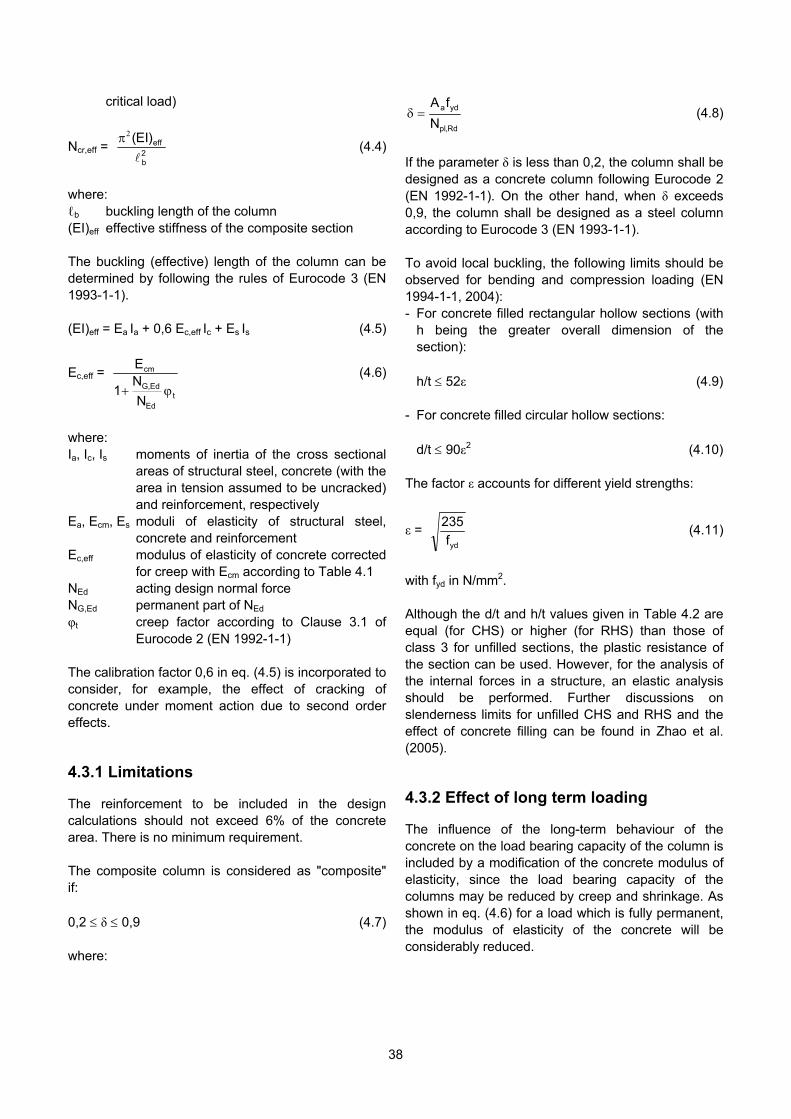
4.1 INTRODUCTION Concrete filled hollow sections (Fig. 4.1) are mainly used for columns. The concrete filling gives a higher load bearing capacity without increasing the outer dimensions. The fire resistance can be considerably increased by concrete filling, in particular if proper reinforcement is used. Due to the fact that the steel structure is visible, it allows a slender, architecturally-appealing design. The hollow section acts not only as the formwork for the concrete, but also ensures that the assembly and erection in the building process are not delayed by the hardening process of the concrete. CIDECT research on composite columns started already in the sixties, resulting in monographs and design rules, adopted by Eurocode 4 (EN 1994-1-1, 2004). CIDECT Design Guide No. 5 (Bergmann et al., 1995) provides detailed information for the static design of concrete filled columns. To a large extent, this chapter follows the information given in Design Guide No. 5, but updated with the latest revisions to Eurocode 4 (EN 1994-1-1).
4.2 DESIGN METHODS In the last decades, several design methods for composite columns were developed, e.g. in Europe by Guiaux & Janss (1970), Roik et al. (1975) and Virdi & Dowling (1976), finally resulting in the design rules given in Eurocode 4 (EN 1994-1-1, 2004). In this chapter, the design method given is based on the approach presented in Eurocode 4 (EN 1994-1-1). The design of composite columns has to be carried out at the ultimate limit state, i.e. the effect of the most unfavourable combination of actions should not exceed the resistance of the composite member. An exact calculation of the load bearing capacity considering the effect of imperfections and deflections (second order analysis), the effect of plastification of the section, cracking of the concrete, etc. can only be carried out by means of a computer program. With such a program, the resistance interaction curves as shown in Fig. 4.2, can be calculated. Based on these calculated capacities, the following simplified design methods have been developed.
4.3 AXIALLY LOADED COLUMNS From the work of Roik et al. (1975), a simplified design method is given in Eurocode 4 (EN 1994-1-1), similar to the design method adopted for steel columns, i.e.:
Rd,plEd N N (4.1)
where: NEd design normal force (including load factors) χ reduction factor for the relevant buckling curve, i.e. curve "a" for ρs 3% and curve "b" for 3% < ρs 6% (see Fig. 2.3) Npl,Rd resistance of the cross section to normal force
according to eq. (4.2) Npl,Rd = Aa fyd + Ac fcd + As fsd (4.2) where: Aa, Ac, As cross sectional areas of structural steel,
concrete and reinforcement fyd, fcd, fsd design strengths of steel, concrete (see
Table 4.1) and reinforcement using the recommended γM factors according to Eurocode 2 (EN 1992-1-1, 2004) and Eurocode 3 (EN 1993-1-1, 2005) being γa = 1,0 for fy, γc = 1,5 for fc, and γs = 1,15 for fs
The load factors for the actions F have to be determined from EN 1990 (2002). Concrete classes higher than C50/60 should not be used without further investigation and classes lower than C20/25 are not allowed for composite construction. In concrete filled hollow sections, the concrete is confined by the hollow section. Therefore, the concrete strength reduction factor of 0,85 does not have to be considered. The χ reduction factor follows from the relative
slenderness
eff,cr
Rk,pl
E N
N
(4.3)
where: Npl,Rk resistance of the cross section to axial load
according to eq. (4.2), however, with fyd, fcd and fsd replaced by fyk, fck and fsk
Ncr,eff elastic buckling capacity of the member (Euler
37
critical load)
Ncr,eff = 2b
eff)EI(
(4.4)
where: ℓb buckling length of the column (EI)eff effective stiffness of the composite section The buckling (effective) length of the column can be determined by following the rules of Eurocode 3 (EN 1993-1-1). (EI)eff = Ea Ia + 0,6 Ec,eff Ic + Es Is (4.5)
Ec,eff =
tEd
Ed,G
cm
N
N1
E
(4.6)
where: Ia, Ic, Is moments of inertia of the cross sectional
areas of structural steel, concrete (with the area in tension assumed to be uncracked) and reinforcement, respectively
Ea, Ecm, Es moduli of elasticity of structural steel, concrete and reinforcement
Ec,eff modulus of elasticity of concrete corrected for creep with Ecm according to Table 4.1
NEd acting design normal force NG,Ed permanent part of NEd φt creep factor according to Clause 3.1 of
Eurocode 2 (EN 1992-1-1) The calibration factor 0,6 in eq. (4.5) is incorporated to consider, for example, the effect of cracking of concrete under moment action due to second order effects. 4.3.1 Limitations The reinforcement to be included in the design calculations should not exceed 6% of the concrete area. There is no minimum requirement. The composite column is considered as "composite" if: 0,2 δ 0,9 (4.7) where:
Rd,pl
yda
N
fA (4.8)
If the parameter δ is less than 0,2, the column shall be designed as a concrete column following Eurocode 2 (EN 1992-1-1). On the other hand, when δ exceeds 0,9, the column shall be designed as a steel column according to Eurocode 3 (EN 1993-1-1). To avoid local buckling, the following limits should be observed for bending and compression loading (EN 1994-1-1, 2004): - For concrete filled rectangular hollow sections (with
h being the greater overall dimension of the section):
h/t 52ε (4.9) - For concrete filled circular hollow sections: d/t 90ε2 (4.10) The factor ε accounts for different yield strengths:
ε = ydf
235 (4.11)
with fyd in N/mm2. Although the d/t and h/t values given in Table 4.2 are equal (for CHS) or higher (for RHS) than those of class 3 for unfilled sections, the plastic resistance of the section can be used. However, for the analysis of the internal forces in a structure, an elastic analysis should be performed. Further discussions on slenderness limits for unfilled CHS and RHS and the effect of concrete filling can be found in Zhao et al. (2005). 4.3.2 Effect of long term loading The influence of the long-term behaviour of the concrete on the load bearing capacity of the column is included by a modification of the concrete modulus of elasticity, since the load bearing capacity of the columns may be reduced by creep and shrinkage. As shown in eq. (4.6) for a load which is fully permanent, the modulus of elasticity of the concrete will be considerably reduced.
38
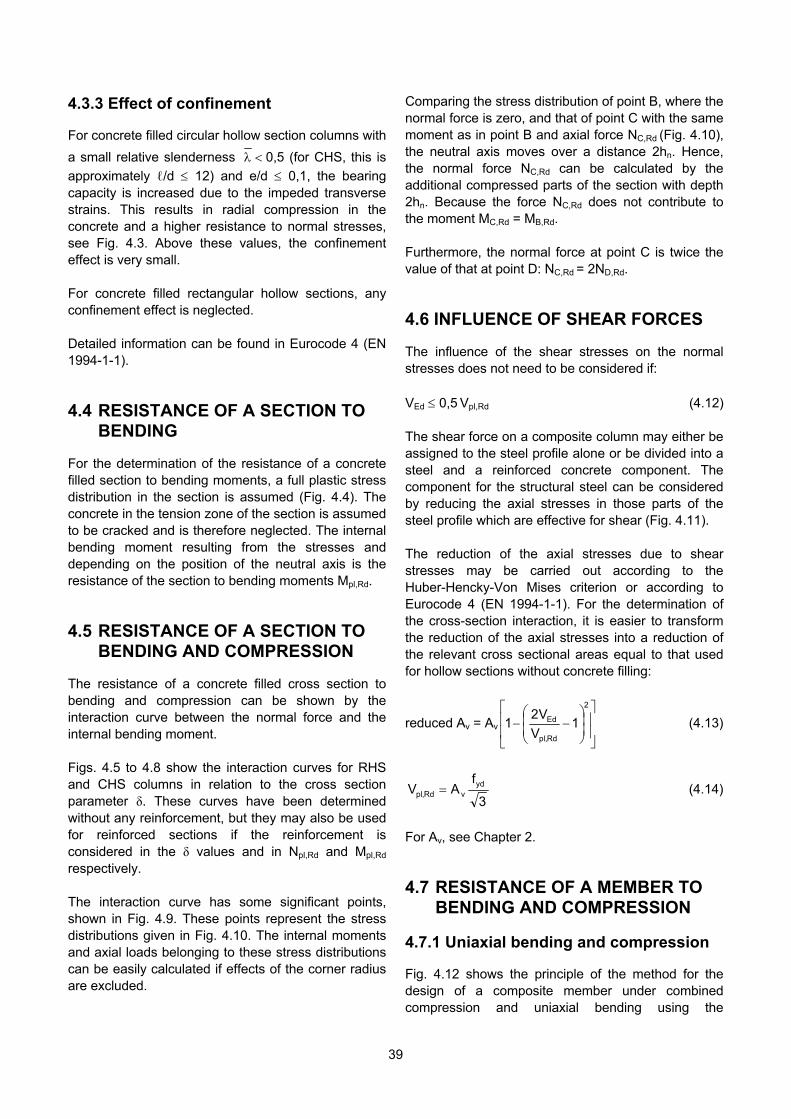
4.3.3 Effect of confinement For concrete filled circular hollow section columns with
a small relative slenderness 0,5 (for CHS, this is
approximately ℓ/d 12) and e/d 0,1, the bearing capacity is increased due to the impeded transverse strains. This results in radial compression in the concrete and a higher resistance to normal stresses, see Fig. 4.3. Above these values, the confinement effect is very small. For concrete filled rectangular hollow sections, any confinement effect is neglected. Detailed information can be found in Eurocode 4 (EN 1994-1-1).
4.4 RESISTANCE OF A SECTION TO BENDING
For the determination of the resistance of a concrete filled section to bending moments, a full plastic stress distribution in the section is assumed (Fig. 4.4). The concrete in the tension zone of the section is assumed to be cracked and is therefore neglected. The internal bending moment resulting from the stresses and depending on the position of the neutral axis is the resistance of the section to bending moments Mpl,Rd.
4.5 RESISTANCE OF A SECTION TO BENDING AND COMPRESSION
The resistance of a concrete filled cross section to bending and compression can be shown by the interaction curve between the normal force and the internal bending moment. Figs. 4.5 to 4.8 show the interaction curves for RHS and CHS columns in relation to the cross section parameter δ. These curves have been determined without any reinforcement, but they may also be used for reinforced sections if the reinforcement is considered in the δ values and in Npl,Rd and Mpl,Rd respectively. The interaction curve has some significant points, shown in Fig. 4.9. These points represent the stress distributions given in Fig. 4.10. The internal moments and axial loads belonging to these stress distributions can be easily calculated if effects of the corner radius are excluded.
Comparing the stress distribution of point B, where the normal force is zero, and that of point C with the same moment as in point B and axial force NC,Rd (Fig. 4.10), the neutral axis moves over a distance 2hn. Hence, the normal force NC,Rd can be calculated by the additional compressed parts of the section with depth 2hn. Because the force NC,Rd does not contribute to the moment MC,Rd = MB,Rd. Furthermore, the normal force at point C is twice the value of that at point D: NC,Rd = 2ND,Rd.
4.6 INFLUENCE OF SHEAR FORCES The influence of the shear stresses on the normal stresses does not need to be considered if: VEd 0,5 Vpl,Rd (4.12) The shear force on a composite column may either be assigned to the steel profile alone or be divided into a steel and a reinforced concrete component. The component for the structural steel can be considered by reducing the axial stresses in those parts of the steel profile which are effective for shear (Fig. 4.11). The reduction of the axial stresses due to shear stresses may be carried out according to the Huber-Hencky-Von Mises criterion or according to Eurocode 4 (EN 1994-1-1). For the determination of the cross-section interaction, it is easier to transform the reduction of the axial stresses into a reduction of the relevant cross sectional areas equal to that used for hollow sections without concrete filling:
reduced Av = Av
2
Rd,pl
Ed 1V
V21 (4.13)
3
fAV yd
vRd,pl (4.14)
For Av, see Chapter 2.
4.7 RESISTANCE OF A MEMBER TO BENDING AND COMPRESSION
4.7.1 Uniaxial bending and compression Fig. 4.12 shows the principle of the method for the design of a composite member under combined compression and uniaxial bending using the
39

cross-section interaction curve. Due to imperfections, the resistance of an axially loaded member is given by eq. (4.1) or χ on the vertical axis in Fig. 4.12. The moment capacity factor at the level of χ is defined as the imperfection moment. Having reached the load bearing capacity for axial compression, the column cannot resist any additional bending moment. The value of χd resulting from the actual design normal force NEd (χd = NEd/Npl,Rd) determines the moment capacity factor μd for the capacity of the member. This factor μd gives the moment capacity including the imperfection moment, thus the imperfection moment should be added to the external moment including second order effects. The capacity for the combined compression and bending of the member can now be checked by: M||,max αM μd Mpl,Rd (4.15) where: M||,max design bending moment of the column,
including the imperfection moment and second order effects
αM 0,9 for S235 to S335 and 0,8 for S420 and S460
μd to be obtained from the interaction diagrams in Figs. 4.5 to 4.8
The additional reduction by the factor αM accounts for the assumptions of this simplified design method, e.g. the interaction curve of the section is determined assuming full plastic behaviour of the materials with no strain limitation. Note: Interaction curves of the composite sections always show an increase in the bending capacity higher than Mpl,Rd. The bending resistance increases with an increasing normal force, because former regions in tension are compressed by the normal force. This positive effect may only be taken into account if it is ensured that the bending moment and the axial force always act together. If this is not ensured, and the bending moment and the axial force result from different loading situations, the related moment capacity μd has to be limited to 1,0. Columns with equal end moments The verification procedure for columns with the same end moments given in Eurocode 4 (EN 1994-1-1) is as follows: The second order moment MEd,|| can be approximated
by: MEd,|| = k MEd (4.16) where:
eff,cr
Ed
N
N1
1k
(4.17)
k is the amplification factor to incorporate the second order effects. Ncr,eff can be determined with eq. (4.4), however, with a modified (EI)eff,|| due to the simplifications mentioned before: (EI)eff,|| = 0,9 (Ea Ia + 0,5 Ec,eff Ic + Es Is) (4.18) The total moment including the imperfection moment is:
M||,max =
eff,cr
Ed
N
N1
1
(MEd + NEd e0) (4.19)
The capacity can now be checked with eq. (4.15). Columns with different end moments If the end moments are not equal (see Fig. 4.13), then the k factor in eq. (4.17) has to be corrected for the external moment by a factor β:
eff,cr
Ed
N
N1
k
(4.20)
where: β = 0,66 + 0,44r but β 0,44 (4.21) with r being the ratio between the smallest and largest end moment (Fig. 4.13). The total moment including the imperfection moment is now:
eff,cr
Ed
0 Ed
eff,cr
Ed
Edmax||,
N
N1
eN
N
N1
MM
(4.22)
This moment has to be used in eq. (4.15). If the first order moment is larger than MEd,||, then this value
40
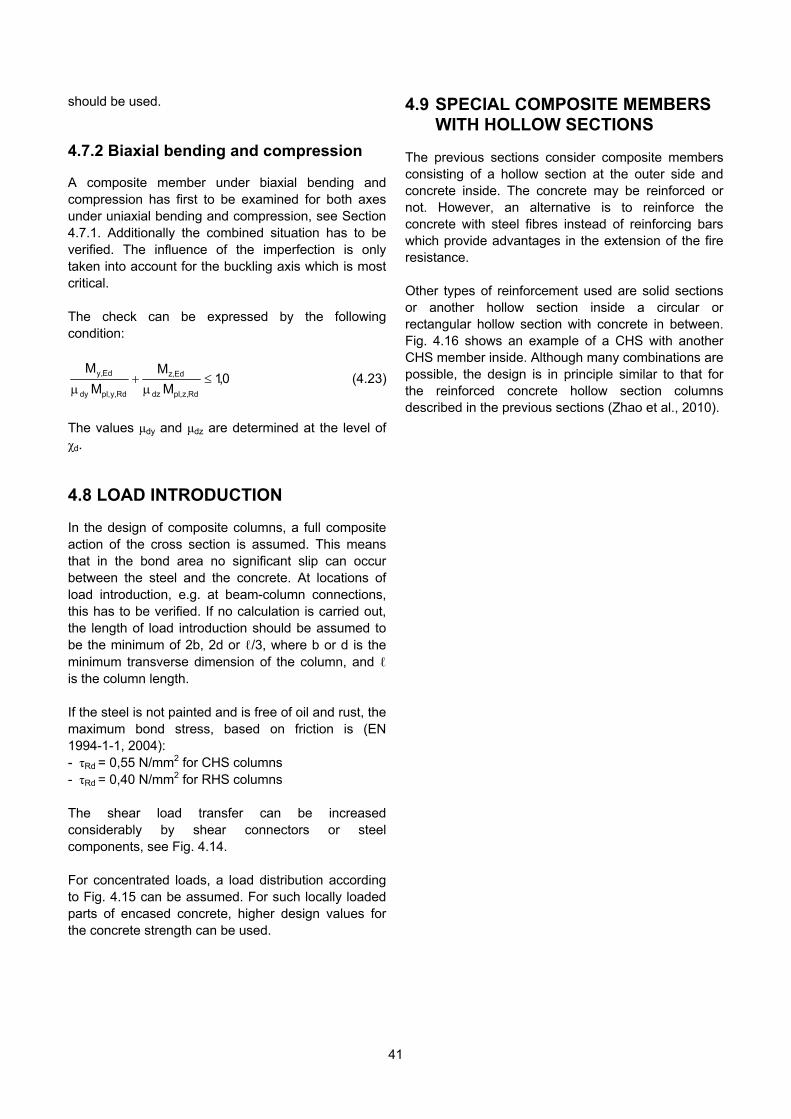
should be used. 4.9 SPECIAL COMPOSITE MEMBERS WITH HOLLOW SECTIONS
4.7.2 Biaxial bending and compression The previous sections consider composite members consisting of a hollow section at the outer side and concrete inside. The concrete may be reinforced or not. However, an alternative is to reinforce the concrete with steel fibres instead of reinforcing bars which provide advantages in the extension of the fire resistance.
A composite member under biaxial bending and compression has first to be examined for both axes under uniaxial bending and compression, see Section 4.7.1. Additionally the combined situation has to be verified. The influence of the imperfection is only taken into account for the buckling axis which is most critical.
41
The check can be expressed by the following condition:
0,1M
M
M
M
Rd,z,pl dz
Ed,z
Rd,y,pl dy
Ed,y
(4.23)
Other types of reinforcement used are solid sections or another hollow section inside a circular or rectangular hollow section with concrete in between. Fig. 4.16 shows an example of a CHS with another CHS member inside. Although many combinations are possible, the design is in principle similar to that for the reinforced concrete hollow section columns described in the previous sections (Zhao et al., 2010). The values μdy and μdz are determined at the level of
χd.
4.8 LOAD INTRODUCTION In the design of composite columns, a full composite action of the cross section is assumed. This means that in the bond area no significant slip can occur between the steel and the concrete. At locations of load introduction, e.g. at beam-column connections, this has to be verified. If no calculation is carried out, the length of load introduction should be assumed to be the minimum of 2b, 2d or ℓ/3, where b or d is the minimum transverse dimension of the column, and ℓ is the column length. If the steel is not painted and is free of oil and rust, the maximum bond stress, based on friction is (EN 1994-1-1, 2004): - τRd = 0,55 N/mm2 for CHS columns - τRd = 0,40 N/mm2 for RHS columns The shear load transfer can be increased considerably by shear connectors or steel components, see Fig. 4.14. For concentrated loads, a load distribution according to Fig. 4.15 can be assumed. For such locally loaded parts of encased concrete, higher design values for the concrete strength can be used.
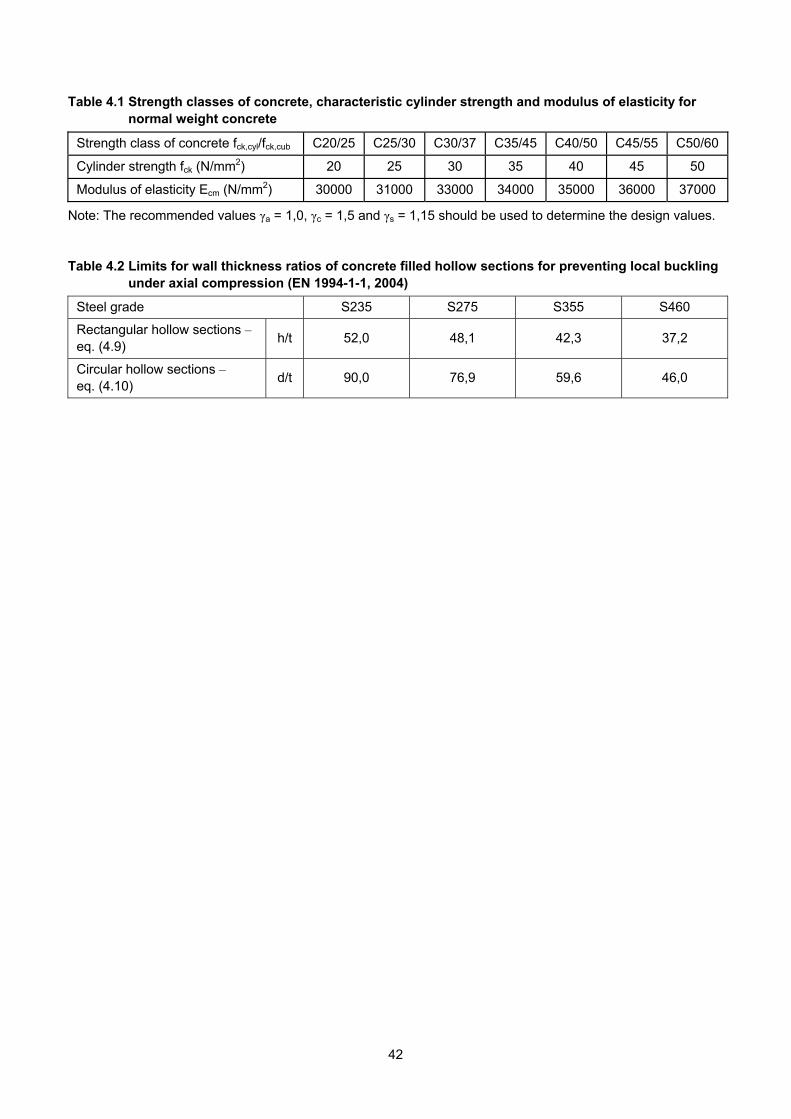
Table 4.1 Strength classes of concrete, characteristic cylinder strength and modulus of elasticity for normal weight concrete
Strength class of concrete fck,cyl/fck,cub C20/25 C25/30 C30/37 C35/45 C40/50 C45/55 C50/60
Cylinder strength fck (N/mm2) 20 25 30 35 40 45 50
Modulus of elasticity Ecm (N/mm2) 30000 31000 33000 34000 35000 36000 37000
Note: The recommended values γa = 1,0, γc = 1,5 and γs = 1,15 should be used to determine the design values. Table 4.2 Limits for wall thickness ratios of concrete filled hollow sections for preventing local buckling
under axial compression (EN 1994-1-1, 2004)
Steel grade S235 S275 S355 S460
Rectangular hollow sections – eq. (4.9)
h/t 52,0 48,1 42,3 37,2
Circular hollow sections – eq. (4.10)
d/t 90,0 76,9 59,6 46,0
42

Fig. 4.1 Concrete filled hollow sections with notations
NEde/Mpl,Rd
1,00
0,75
0,50
0,25
00,750,500,250 1,00
S235 / C45
d = 500 mm
t = 10 mm
NEd/Npl,Rd
NEde/Mpl,Rd
1,00
0,75
0,50
0,25
00,750,500,250 1,00
S235 / C45
d = 500 mm
t = 10 mm
NEd/Npl,Rd
Fig. 4.2 Bearing capacity of a composite hollow section column
43
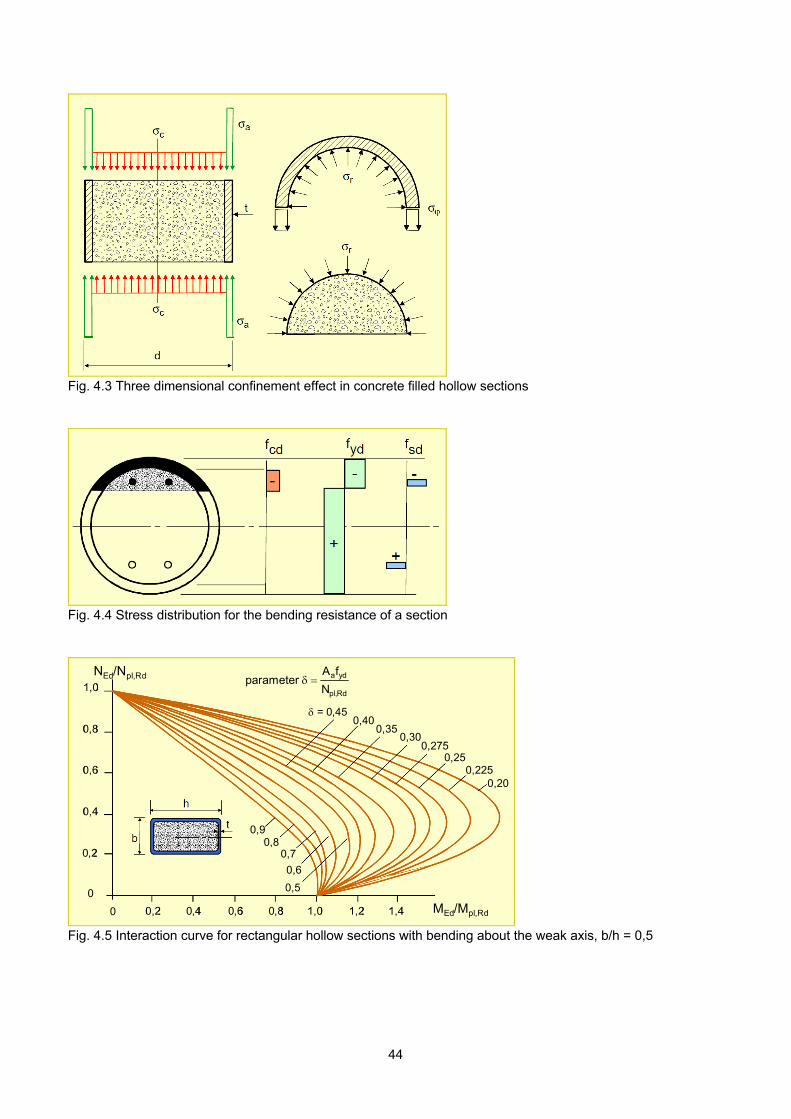
Fig. 4.3 Three dimensional confinement effect in concrete filled hollow sections
Fig. 4.4 Stress distribution for the bending resistance of a section
1,0
0,8
0,2
0,4
0,6
0
1,00,80,2 0,4 0,60 1,2 1,4
= 0,450,40
0,2750,25
0,2250,20
0,30
0,90,8
0,7
0,6
0,5
,
,
NEd/Npl,Rd
MEd/Mpl,Rd
Rd,pl
yda
N
fA parameter
0,35
1,0
0,8
0,2
0,4
0,6
0
1,00,80,2 0,4 0,60 1,2 1,4
1,0
0,8
0,2
0,4
0,6
0
1,00,80,2 0,4 0,60 1,2 1,4
= 0,450,40
0,2750,25
0,2250,20
0,30
0,90,8
0,7
0,6
0,5
,
,
NEd/Npl,Rd
MEd/Mpl,Rd
Rd,pl
yda
N
fA parameter
0,35
Fig. 4.5 Interaction curve for rectangular hollow sections with bending about the weak axis, b/h = 0,5
44
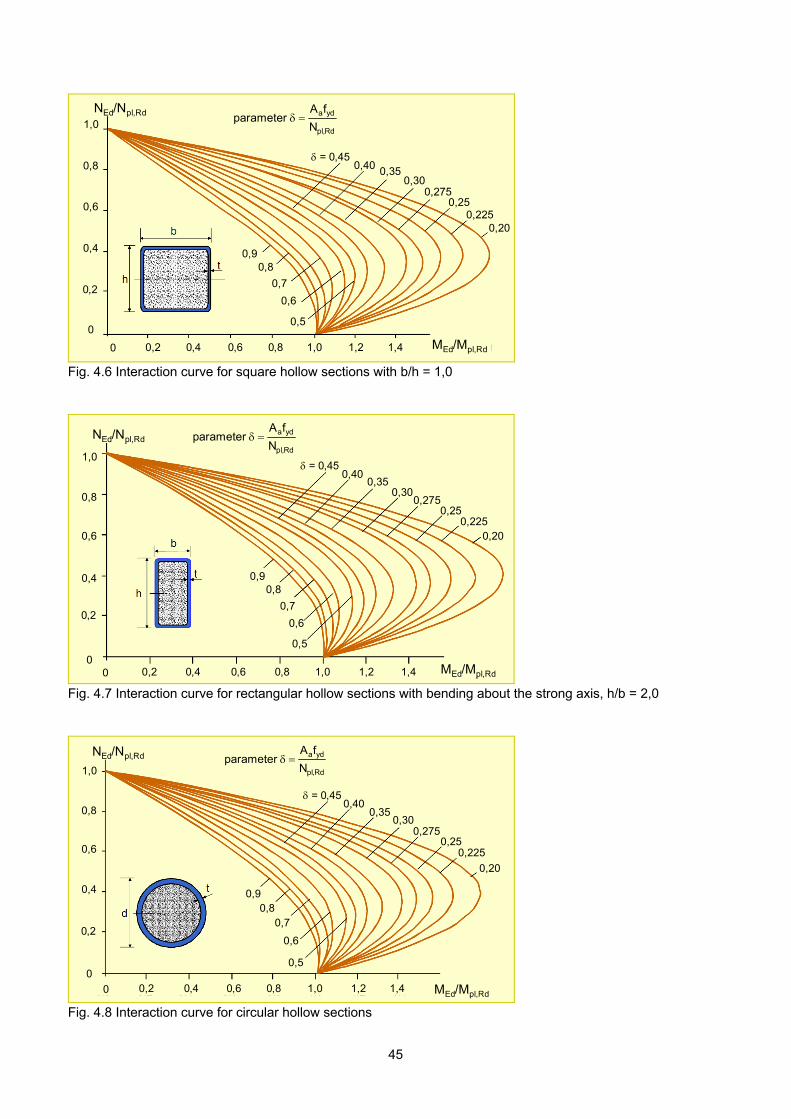
1,0
0,8
0,2
0,4
0,6
0
1,00,80,2 0,4 0,60 1,2 1,4 MEd/Mpl,Rd
= 0,450,40 0,35
0,2750,25
0,2250,20
0,90,8
0,7
0,6
0,5
,
1,0
0,8
0,2
0,4
0,6
0
1,00,80,2 0,4 0,60 1,2 1,4
0,90,8
0,7
0,6
0,5
NEd/Npl,Rd
, Rd,pl
yda
N
fA parameter
0,30
1,0
0,8
0,2
0,4
0,6
0
1,00,80,2 0,4 0,60 1,2 1,4
1,0
0,8
0,2
0,4
0,6
0
1,00,80,2 0,4 0,60 1,2 1,4 MEd/Mpl,Rd
= 0,450,40 0,35
0,2750,25
0,2250,20
0,90,8
0,7
0,6
0,5
0,90,8
0,7
0,6
0,5
,
1,0
0,8
0,2
0,4
0,6
0
1,00,80,2 0,4 0,60 1,2 1,4
0,90,8
0,7
0,6
0,5
NEd/Npl,Rd
, Rd,pl
yda
N
fA parameter
0,30
Fig. 4.6 Interaction curve for square hollow sections with b/h = 1,0
= 0,450,40
0,2750,25
0,2250,20
0,90,8
0,7
0,6
0,5
1,0
0,8
0,2
0,4
0,6
0
NEd/Npl,Rd
MEd/Mpl,Rd1,00,80,2 0,4 0,6 1,2 1,40
,Rd,pl
yda
N
fA parameter
0,300,35
= 0,450,40
0,2750,25
0,2250,20
0,90,8
0,7
0,6
0,5
1,0
0,8
0,2
0,4
0,6
0
NEd/Npl,Rd
1,0
0,8
0,2
0,4
0,6
0
NEd/Npl,Rd
MEd/Mpl,Rd1,00,80,2 0,4 0,6 1,2 1,40 MEd/Mpl,Rd1,00,80,2 0,4 0,6 1,2 1,4 MEd/Mpl,Rd1,00,80,2 0,4 0,6 1,2 1,40
,Rd,pl
yda
N
fA parameter
0,300,35
Fig. 4.7 Interaction curve for rectangular hollow sections with bending about the strong axis, h/b = 2,0
0,400,35
0,2750,25
0,225
0,30
,1,0
0,8
0,2
0,4
0,6
0
0,90,8
0,7
0,6
0,5
NEd/Npl,Rd
MEd/Mpl,Rd1,00,80,2 0,4 0,60 1,2 1,4
1,0
0,8
0,2
0,4
0,6
0
NEd/Npl,Rd
0,20
,Rd,pl
yda
N
fA parameter
= 0,450,40
0,35
0,2750,25
0,225
0,30
,1,0
0,8
0,2
0,4
0,6
0
0,90,8
0,7
0,6
0,5
NEd/Npl,Rd
MEd/Mpl,Rd1,00,80,2 0,4 0,60 1,2 1,4
1,0
0,8
0,2
0,4
0,6
0
NEd/Npl,Rd
1,0
0,8
0,2
0,4
0,6
0
NEd/Npl,Rd
0,20
,Rd,pl
yda
N
fA parameter
= 0,45
Fig. 4.8 Interaction curve for circular hollow sections
45
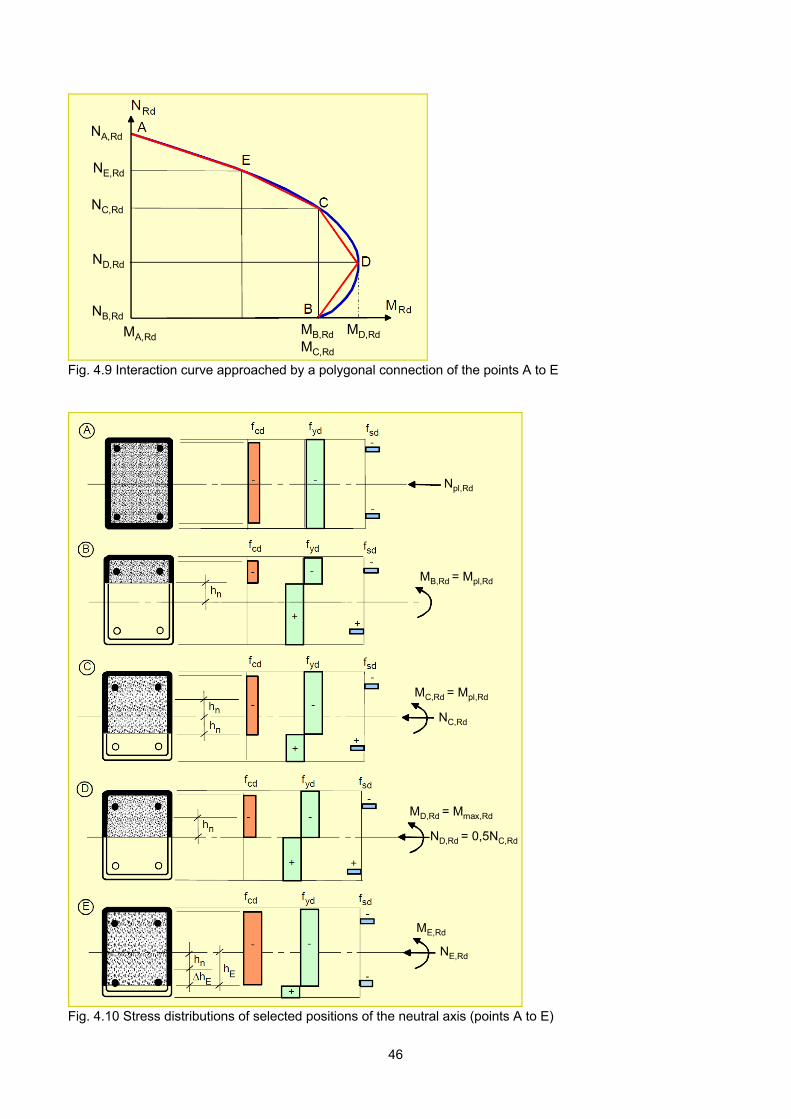
NE,Rd
NA,Rd
NC,Rd
ND,Rd
NB,Rd
MA,RdMC,Rd
MD,RdMB,Rd
NE,Rd
NA,Rd
NC,Rd
ND,Rd
NB,Rd
MA,RdMC,Rd
MD,RdMB,Rd
Fig. 4.9 Interaction curve approached by a polygonal connection of the points A to E
NC,Rd
ND,Rd= 0,5NC,Rd
-
NE,Rd
ME,Rd
ND,Rd = 0,5NC,Rd
MD,Rd = Mmax,Rd
MC,Rd = Mpl,Rd
NC,Rd
MB,Rd = Mpl,Rd
Npl,Rd
NC,Rd
ND,Rd= 0,5NC,Rd
NC,Rd
ND,Rd= 0,5NC,Rd
-
NE,Rd
ME,Rd
ND,Rd = 0,5NC,Rd
MD,Rd = Mmax,Rd
MC,Rd = Mpl,Rd
NC,Rd
MB,Rd = Mpl,Rd
Npl,Rd
Fig. 4.10 Stress distributions of selected positions of the neutral axis (points A to E)
46

Fig. 4.11 Reduction of the normal stresses due to shear
,
d
,
Rd,pl
Ed
N
N
Rd,pl
Ed
M
M
,
d
,
Rd,pl
Ed
N
N
Rd,pl
Ed
M
M
Fig. 4.12 Design for compression and uni-axial bending
MEd
r MEd
MEd
r MEd
Fig. 4.13 Relation between the end moments (-1 r +1)
47

Fig. 4.14 Load introduction into hollow sections by inserted plates
1:2,5 1:2,51:2,5 1:2,5
Fig. 4.15 Load introduction in a composite column
0d
t0
concrete
outer tube
inner tubedi
t i
Fig. 4.16 Tube-in-tube composite column concept
48
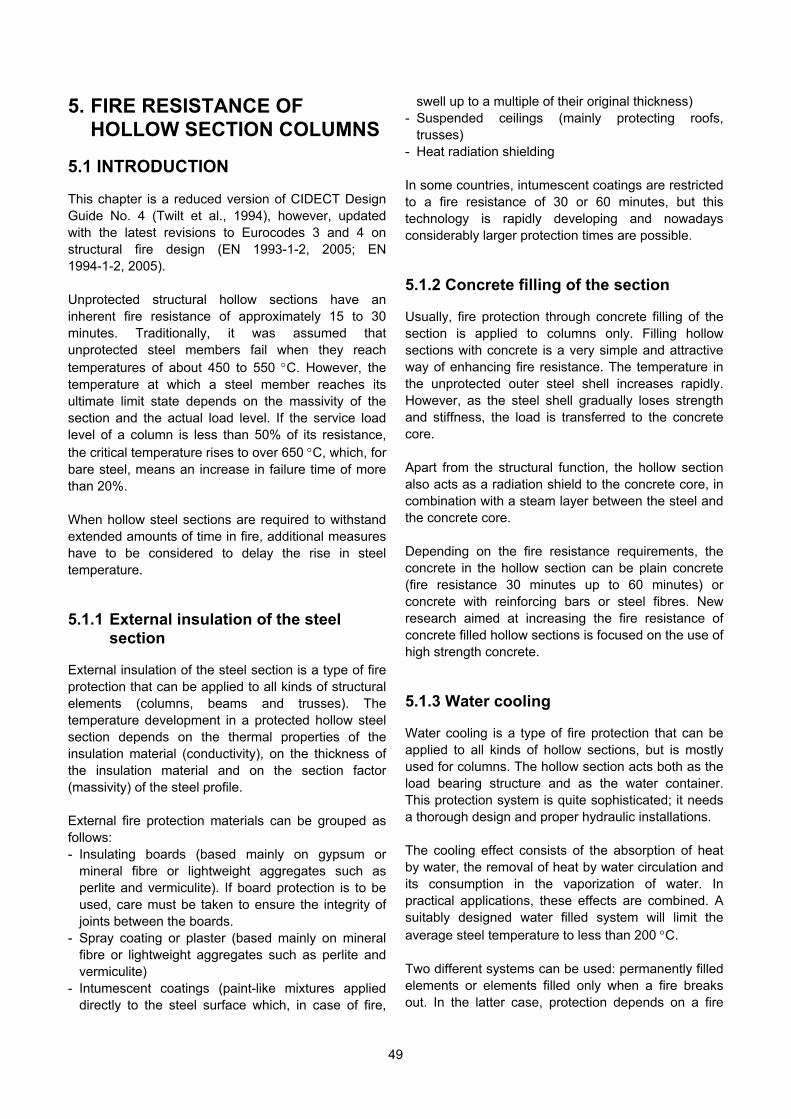
5. FIRE RESISTANCE OF HOLLOW SECTION COLUMNS
5.1 INTRODUCTION This chapter is a reduced version of CIDECT Design Guide No. 4 (Twilt et al., 1994), however, updated with the latest revisions to Eurocodes 3 and 4 on structural fire design (EN 1993-1-2, 2005; EN 1994-1-2, 2005). Unprotected structural hollow sections have an inherent fire resistance of approximately 15 to 30 minutes. Traditionally, it was assumed that unprotected steel members fail when they reach temperatures of about 450 to 550 C. However, the temperature at which a steel member reaches its ultimate limit state depends on the massivity of the section and the actual load level. If the service load level of a column is less than 50% of its resistance, the critical temperature rises to over 650 C, which, for bare steel, means an increase in failure time of more than 20%. When hollow steel sections are required to withstand extended amounts of time in fire, additional measures have to be considered to delay the rise in steel temperature. 5.1.1 External insulation of the steel
section External insulation of the steel section is a type of fire protection that can be applied to all kinds of structural elements (columns, beams and trusses). The temperature development in a protected hollow steel section depends on the thermal properties of the insulation material (conductivity), on the thickness of the insulation material and on the section factor (massivity) of the steel profile. External fire protection materials can be grouped as follows: - Insulating boards (based mainly on gypsum or
mineral fibre or lightweight aggregates such as perlite and vermiculite). If board protection is to be used, care must be taken to ensure the integrity of joints between the boards.
- Spray coating or plaster (based mainly on mineral fibre or lightweight aggregates such as perlite and vermiculite)
- Intumescent coatings (paint-like mixtures applied directly to the steel surface which, in case of fire,
swell up to a multiple of their original thickness) - Suspended ceilings (mainly protecting roofs,
trusses) - Heat radiation shielding In some countries, intumescent coatings are restricted to a fire resistance of 30 or 60 minutes, but this technology is rapidly developing and nowadays considerably larger protection times are possible. 5.1.2 Concrete filling of the section Usually, fire protection through concrete filling of the section is applied to columns only. Filling hollow sections with concrete is a very simple and attractive way of enhancing fire resistance. The temperature in the unprotected outer steel shell increases rapidly. However, as the steel shell gradually loses strength and stiffness, the load is transferred to the concrete core. Apart from the structural function, the hollow section also acts as a radiation shield to the concrete core, in combination with a steam layer between the steel and the concrete core. Depending on the fire resistance requirements, the concrete in the hollow section can be plain concrete (fire resistance 30 minutes up to 60 minutes) or concrete with reinforcing bars or steel fibres. New research aimed at increasing the fire resistance of concrete filled hollow sections is focused on the use of high strength concrete. 5.1.3 Water cooling Water cooling is a type of fire protection that can be applied to all kinds of hollow sections, but is mostly used for columns. The hollow section acts both as the load bearing structure and as the water container. This protection system is quite sophisticated; it needs a thorough design and proper hydraulic installations. The cooling effect consists of the absorption of heat by water, the removal of heat by water circulation and its consumption in the vaporization of water. In practical applications, these effects are combined. A suitably designed water filled system will limit the average steel temperature to less than 200 C. Two different systems can be used: permanently filled elements or elements filled only when a fire breaks out. In the latter case, protection depends on a fire
49

detection system and a short water filling time. In unreplenished systems, the attainable fire resistance time depends on the total water content (including any reservoir tank) and on the shape of the heated structure. In systems where the water is constantly renewed, the fire resistance is unlimited. Water cooling by natural flow is mainly used for vertical or inclined elements in order to ensure the circulation of the water.
5.2 FIRE RESISTANCE 5.2.1 Concept Fire safety precautions are specified with the intent of avoiding any casualties and reducing economic fire damage to an acceptable level. As far as building construction is concerned, it is important that the construction elements can withstand a fire for a specified amount of time. In this respect, one should bear in mind that the strength and deformation properties of the commonly used building materials deteriorate significantly at the temperatures that may be expected under fire conditions. Moreover, the thermal expansion of most building materials is considerable. As a result, the structural elements and assemblies may deform or even collapse when exposed to fire conditions. The amount of time that a construction element can resist a fire largely depends on the anticipated temperature development of the fire itself. This temperature development depends, among other aspects, on the type and amount of combustible materials present, expressed in terms of kg of wood per m2 floor surface and called the fire load density, see Fig. 5.1, and on the fire ventilation conditions. In practical fire safety design, however, it is conventional to use a so-called "standard fire curve", defined in ISO 834-1 (1999), which is more or less representative for post flash-over fires in buildings with relatively small compartments, such as apartment buildings and offices. Alternative standard fire curves, with small differences from the ISO-curve, are in use in the USA. The amount of time a building component is able to withstand heat exposure according to the standard fire curve, is called the "fire resistance". In order to be able to determine the fire resistance of a building component, proper performance criteria have to be determined. These criteria are defined in relation to the anticipated function of the respective building
element during fire. For more details, see Twilt et al. (1994). For building components such as columns, with a load bearing function, the only relevant performance criterion is "stability". As far as the determination of the fire resistance is concerned, there are basically two possibilities: an experimental approach and an analytical approach. The experimental approach, i.e. the determination of the fire resistance of columns based on standard fire tests, is the traditional approach. Although employing different national testing procedures, the concept of fire testing is, by and large, the same in the various countries. The analytical approach is the modern approach and has become possible by the development of computer technology. On an international level, calculation rules for the fire resistance of both steel and composite steel concrete columns, including concrete filled hollow section columns, are available. The analytical approach offers significant advantages, when compared with the experimental one. Important factors influencing the fire resistance of columns are: - Load level - Shape and size of the cross section - Buckling length - Concrete filling and reinforcement Bare steel columns (i.e. hollow section columns without external protection or concrete filling) possess only a limited fire resistance. Depending on the load level and the section factor (massivity), a fire resistance of 15 to 20 minutes is usually attainable. A 30 minutes fire resistance can only be achieved in more exceptional cases. This situation may be dramatically improved by applying thermal insulation to the column. Depending on the type and thickness of the insulation material, fire resistances of many hours can be achieved, although most requirements today are limited to 120 minutes. Hollow section columns filled with concrete have a much higher load bearing capacity and a higher fire resistance than unprotected, empty hollow section columns. Provided the concrete is of good quality (over, say, a crushing strength of 20 N/mm2) and the cross sectional dimensions are not too small (not less than 150 x 150 mm), a fire resistance of at least 30 minutes will be achieved. Sections with larger
50
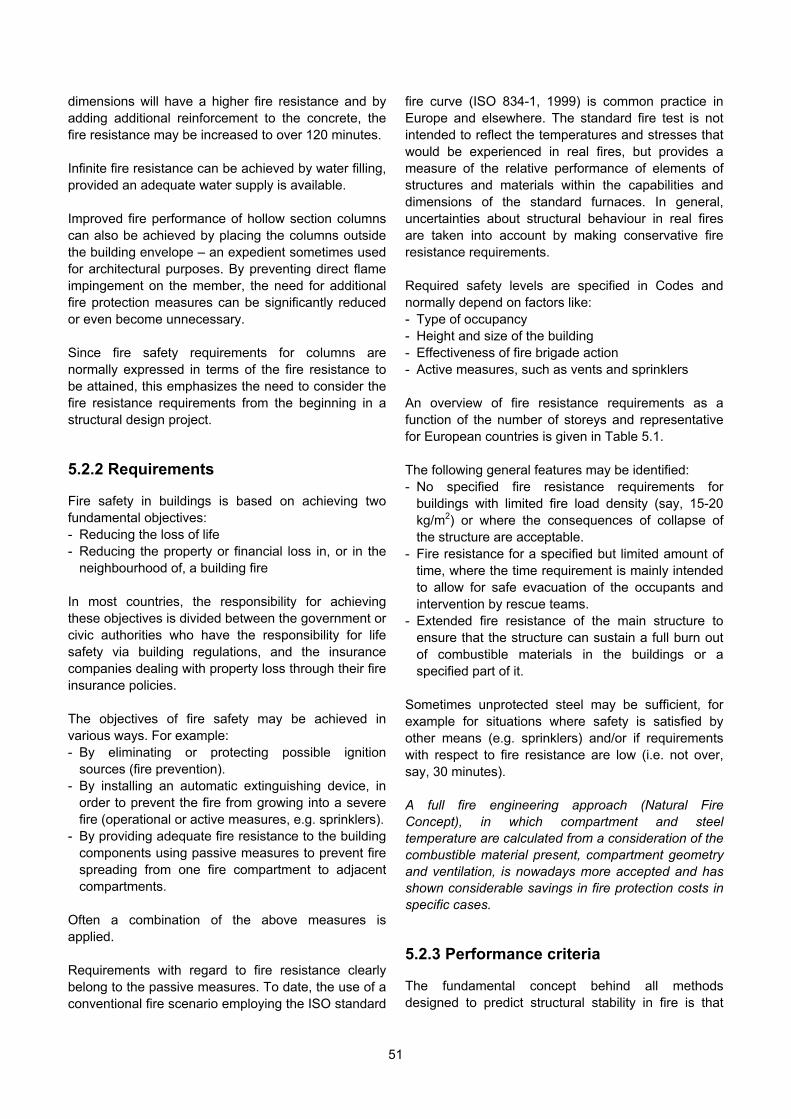
dimensions will have a higher fire resistance and by adding additional reinforcement to the concrete, the fire resistance may be increased to over 120 minutes. Infinite fire resistance can be achieved by water filling, provided an adequate water supply is available. Improved fire performance of hollow section columns can also be achieved by placing the columns outside the building envelope – an expedient sometimes used for architectural purposes. By preventing direct flame impingement on the member, the need for additional fire protection measures can be significantly reduced or even become unnecessary. Since fire safety requirements for columns are normally expressed in terms of the fire resistance to be attained, this emphasizes the need to consider the fire resistance requirements from the beginning in a structural design project. 5.2.2 Requirements Fire safety in buildings is based on achieving two fundamental objectives: - Reducing the loss of life - Reducing the property or financial loss in, or in the
neighbourhood of, a building fire In most countries, the responsibility for achieving these objectives is divided between the government or civic authorities who have the responsibility for life safety via building regulations, and the insurance companies dealing with property loss through their fire insurance policies. The objectives of fire safety may be achieved in various ways. For example: - By eliminating or protecting possible ignition
sources (fire prevention). - By installing an automatic extinguishing device, in
order to prevent the fire from growing into a severe fire (operational or active measures, e.g. sprinklers).
- By providing adequate fire resistance to the building components using passive measures to prevent fire spreading from one fire compartment to adjacent compartments.
Often a combination of the above measures is applied. Requirements with regard to fire resistance clearly belong to the passive measures. To date, the use of a conventional fire scenario employing the ISO standard
fire curve (ISO 834-1, 1999) is common practice in Europe and elsewhere. The standard fire test is not intended to reflect the temperatures and stresses that would be experienced in real fires, but provides a measure of the relative performance of elements of structures and materials within the capabilities and dimensions of the standard furnaces. In general, uncertainties about structural behaviour in real fires are taken into account by making conservative fire resistance requirements. Required safety levels are specified in Codes and normally depend on factors like: - Type of occupancy - Height and size of the building - Effectiveness of fire brigade action - Active measures, such as vents and sprinklers An overview of fire resistance requirements as a function of the number of storeys and representative for European countries is given in Table 5.1. The following general features may be identified: - No specified fire resistance requirements for
buildings with limited fire load density (say, 15-20 kg/m2) or where the consequences of collapse of the structure are acceptable.
- Fire resistance for a specified but limited amount of time, where the time requirement is mainly intended to allow for safe evacuation of the occupants and intervention by rescue teams.
- Extended fire resistance of the main structure to ensure that the structure can sustain a full burn out of combustible materials in the buildings or a specified part of it.
Sometimes unprotected steel may be sufficient, for example for situations where safety is satisfied by other means (e.g. sprinklers) and/or if requirements with respect to fire resistance are low (i.e. not over, say, 30 minutes). A full fire engineering approach (Natural Fire Concept), in which compartment and steel temperature are calculated from a consideration of the combustible material present, compartment geometry and ventilation, is nowadays more accepted and has shown considerable savings in fire protection costs in specific cases. 5.2.3 Performance criteria The fundamental concept behind all methods designed to predict structural stability in fire is that
51
construction materials gradually lose strength and stiffness at elevated temperatures. The reduction in the yield strength of structural steel and the compression strength of concrete with increasing temperature according to Eurocode 3 (EN 1993-1-2) and Eurocode 4 (EN 1994-1-2) is given in Fig. 5.2. It shows that there is not much difference in the relative reduction in strength of concrete and steel under high temperatures. The reason for the difference in the structural behaviour of steel and concrete elements under fire conditions is that heat propagates about 10 to 12 times faster in a steel structure than in a concrete structure of the same massivity, because the thermal conductivity of steel is higher than that of concrete. Normally, the fire resistance design of structures is based on a similar design approach as used for design under ambient temperature. In a multi-storey braced frame, the buckling length of each column at room temperature is usually assumed to be the column length between floors. However, such structures are usually compartmented and any fire is likely to be limited to one storey. Therefore, any column affected by fire will lose its stiffness, while adjacent members will remain relatively cold. Accordingly, if the column is rigidly connected to the adjacent members, built-in end conditions can be assumed in the event of fire. Investigations by Twilt & Both (1991) showed that in the case of fire on one storey the buckling length of columns in braced frames is reduced to between 0,5 and 0,7 times the column length, depending on the boundary conditions, see Fig. 5.3. There is an increasing tendency toward assessing the fire resistance of individual members or sub-assembles by analytical fire engineering. The Eurocodes on structural fire design (EN 1993-1-2, 2005; EN 1994-1-2, 2005) define three levels of assessments: - Level 1: Tabulated data - Level 2: Simple calculation models - Level 3: Advanced calculation models "Advanced calculation models" is the most sophisticated level. Such calculation procedures include a complete thermal and mechanical analysis of the structure and use the values for the material properties given in the Eurocodes. General calculation methods enable real boundary conditions to be considered and take account of the influence of non-uniform temperature distribution over the section and therefore lead to more realistic failure times and, consequently, to the most competitive design.
However, the handling of the necessary computer programs is quite time consuming and requires expert knowledge. For practising engineers and architects not accustomed to handling specialised computer programs, "Simple calculation models" have been developed, which lead to a comprehensive design, but are limited in application range. They use conventional calculation procedures and normally provide adequate accuracy. "Tabulated data", which provide solutions on the safe side and allow fast design for restricted application ranges, forms the lowest level of assessment. In the following chapters, only the principles of the design tables and the simple calculation procedures are shown. In all equations, the recommended γM and γM,fi factors in the Eurocodes for steel and concrete are 1,0.
5.3 UNFILLED HOLLOW SECTION COLUMNS
The simple calculation rules for the critical temperature of steel columns discussed hereafter, hold for classes 1, 2 and 3 cross sections only (as defined in Eurocode 3 (EN 1993-1-1, 2005)) and can be applied both to protected and unprotected columns. For columns with a class 4 cross section, a default value for the critical temperature of 350 C is to be used. The critical temperature of an axially loaded steel column depends on the load Nfi,Ed which is present during a fire and the buckling resistance NRd at room temperature (Nfi,Ed = ηfi,t NRd). Note: Instead of the symbols Efi,d,t and Rfi,d,t used in Eurocode 3 (EN 1993-1-2, 2005), for consistency the symbols Nfi,Ed and Nfi,Rd refer here to the design load and the design resistance in the fire situation. As a simplification for the calculation, the load Nfi,Ed
which is present during a fire may also be related by the ratio ηfi to the design load NEd at room temperature. This ratio depends on the load ratio between variable and permanent loading, but as a simplification, generally a ratio ηfi = 0,65 may be assumed. Only in cases of areas susceptible to accumulation of goods, the recommended value is 0,70.
52

Hence, generally:
EdEd fiEd,fi N 65,0NN (5.1)
where: Nfi,Ed design load in the fire situation NEd design load at room temperature ηfi reduction factor for NEd to obtain Nfi,Ed Now, the following verification has to be carried out:
Rd,pl ,y fiRd,fiEd,fi NkNN (5.2)
where: Nfi,Ed design load in the fire situation Nfi,Rd buckling resistance in the fire situation Npl,Rd compression resistance of gross cross section
at room temperature χfi reduction factor for flexural buckling in the fire
design situation, see Fig. 5.4 ky,θ reduction factor for the yield strength of steel at
a steel temperature θa, see Fig. 5.5 This check is, in principle, similar to that for members in compression at room temperature. Only the buckling coefficient χ at room temperature has to be replaced by χfi at temperature θa in the fire situation and the yield strength fyd at room temperature by ky,θ
fyd in the fire situation. The load factors are usually 1,0. For unprotected steel sections, it can be shown that – for standard fire exposure – the temperature development of a steel section depends only on the relative geometry of the profile. This effect is taken into account by means of the shape factor, Am/V, where: Am exposed surface area of the member per unit
length [m2/m] V volume of the member per unit length [m3/m] This ratio is equal to the exposed steel perimeter/steel cross section. The curves presented in Fig. 5.6 illustrate the effect of the section factor on the temperature development of an unprotected steel section when exposed to standard fire conditions. For commonly used I sections, shape factors are within a range of, say, 50 to 400 m-1. For hollow sections exposed to heat from all sides, the section factor may be approximated by: Am/V = Perimeter/(Perimeter x thickness t) = 1/t [m-1]
with t being the thickness of the steel hollow section. For a practical range of the hollow section thickness of 20 to 2.5 mm, this also leads to section factors varying between 50 and 400 m-1. However, for equivalent cross sections, hollow sections have an Am/V ratio which is about 60% of that of comparable open sections. For any given critical steel temperature, the fire resistance of an unprotected steel element – assuming standard fire conditions – depends only on its section factor as illustrated in Fig. 5.7. In many practical situations, the critical temperature of a steel member will be approximately 550 C. This figure shows that an unprotected steel member with a section factor smaller than approximately 40 m-1 may have a fire resistance of 30 minutes or beyond. If external fire insulation is provided, the steel temperature development depends not only on the section factor, but also on the type and thickness of the insulation material.
5.4 CONCRETE FILLED HOLLOW
SECTION COLUMNS 5.4.1 Unprotected columns – thermal and
mechanical response Because of their different locations in the cross section, the various components of a concrete filled hollow section column will each have different time-dependent strength reduction characteristics. The unprotected, directly exposed steel shell will be rapidly heated and will show a significant strength reduction within a short time. The concrete core with its high massivity and low thermal conductivity will, for some time, maintain a significantly high proportion of its strength, mostly in the core area rather than near the surface. Reinforcement, if used, is normally placed near the surface, but is protected by typically 20-50 mm of concrete cover. For this reason, it will have a retarded strength reduction. Fig. 5.8 demonstrates this characteristic behaviour and describes the fire performance of the various components of concrete filled hollow section columns. The load bearing capacity R of a cross section is the sum of the load bearing capacities of each of its
53

components rj. Under fire conditions, all component capacities are dependent on the fire endurance time t. R(t) = Σrj(t) (5.3) In room temperature design, the steel shell is likely to be the dominant load bearing component because of the high strength of the steel and the location of the profile. However, after a fire time t1, only a small percentage of the original load bearing capacity of the steel shell can still be activated. This means that in the case of fire the main part of the load carried by the steel section will be redistributed to the concrete core, which loses strength and stiffness more slowly than the steel section. Therefore: - The load bearing capacity of the steel shell should
be minimised, which means thin shell thickness and low steel grade.
- The load bearing capacity of the concrete core should be optimised, which means higher concrete strength and reinforcement.
Since the strength reduction of the components is directly affected by the heating characteristic of the cross section, a minimum column cross sectional dimension is often necessary to fulfill a required fire resistance. With increasing temperature, the strength and Young's modulus decrease. Thus, the load bearing capacity of a structural member decreases with time, while its deformation increases. In practical fire design, the influence of the column slenderness has also to be taken into account. 5.4.2 Assessment methods for
unprotected columns Levels of assessment As already explained in Section 5.2.3, Eurocodes 3 and 4 on structural fire design (EN 1993-1-2, 2005; EN 1994-1-2, 2005) define three different levels of assessment. This chapter deals with design information at levels 1 and 2, i.e. "Tabulated data" and "Simple calculation models". For more general calculation models, see Twilt et al. (1994). Level 1: Tabulated data The fire rating of unprotected concrete filled hollow section columns may be classified according to Table 5.2 as a function of: - The load level ηfi,t
- The cross section size (b, h or d) - The amount (%) of reinforcement (As /(Ac + As) 100)
- The minimum cover of the reinforcing bars (us) The slenderness relation is indirectly incorporated in the load level ηfi,t which is given by: ηfi,t = Nfi,Ed /NRd (5.4) where: Nfi,Ed design load in the fire situation NRd buckling resistance at room temperature NRd is calculated according to the room temperature procedures given in Eurocode 4 (EN 1994-1-1, 2004). However, the following limitations apply: - Irrespective of the actual steel grade, the yield
strength of the hollow sections for fire calculations is limited to a maximum of 235 N/mm2.
- The wall thickness of the steel is limited to a maximum of 1/25 of the cross sectional dimension d, b or h.
- Reinforcement ratios higher than 3% are not taken into account.
- The values given in Table 5.2 are valid for steel grade S500 used for the reinforcement As.
Level 2: Simple calculation models At level 2, a computer program has been developed to model the fire performance of concrete filled hollow section columns (Grandjean et al., 1980; Twilt & Van de Haar, 1986). This software tool is based on Annex H (informative) of Eurocode 4 (EN 1994-1-2) for concrete filled hollow section columns at elevated temperatures. However, this program will be modified, because comparisons with other programs revealed discrepancies on the non-conservative side. Design charts have been developed in which, for a standard fire exposure of 30, 60, 90 and 120 minutes, the design axial buckling load Nfi,Rd of concrete filled hollow section columns is given as a function of the buckling length ℓθ and the sectional parameters. Figs. 5.9 and 5.10 illustrate typical charts of Annex H (status 2010) of Eurocode 4 (EN 1994-1-2). These charts should only be used if the following conditions are satisfied: - Buckling length in the fire condition ℓθ 4,5m - Width (b or h) or diameter (d): 140 (b, h or d)
400 mm - Concrete strength minimum C20/25 and maximum
C40/50 - Reinforcement ratio 5% - Fire resistance R 120 minutes For a given buckling length and loading, the fire
54
resistance of concrete filled hollow section columns mainly depends on the cross sectional dimensions, the concrete quality and the reinforcement, if any. By a proper choice of these parameters, practically any fire resistance can be achieved. If no reinforcement is used, a fire resistance of 30 minutes can normally be achieved; 60 minutes, however, is not attainable unless the load level is significantly decreased. As a result, the design charts focus on reinforced hollow section columns with fire resistances of 60 minutes and more. The effect of small eccentricities (M/N 0,5(d or b)) can be taken into account by increasing the axial load Nfi,Ed to an equivalent axial load Nequ:
e s
Ed,fiequ
NN
(5.5)
where: φs correction coefficient related to the reinforcement,
see Fig. 5.11. φe correction coefficient related to the eccentricity e,
see Fig. 5.12. Note: There are some concerns about the Annex H method. Wang & Orton (2008) pointed out that this method is rather antiquated. An alternative method, developed by Wang & Orton (2008), is based on the well established cold design method for composite columns in the main part of Eurocode 4 (EN 1994-1-1, 2004), but modified to take into account strength and stiffness degradations of steel and concrete at high temperatures. A design software package named "Firesoft" is now available to assist designers, which has been verified by Wang & Orton (2008). 5.4.3 Technological aspects Small vent holes (10 to 15 mm diameter) are required in the hollow section walls, usually in pairs. Such holes must be provided for each storey length at each floor level, with a maximum distance of 5,0 m. between pairs. They must be placed between 100 and 120 mm from each column end. Those holes are intended to prevent the bursting of the column under steam pressure from the heating of entrapped water in the enclosed concrete. Besides the standard hollow section cross sections, in the past, a variety of different cross section designs were developed and successfully applied in building projects. They are all based either on combinations of hollow sections (tube inside tube) or on combinations
of hollow sections with other steel sections. The advantages of such special cross section types are an increased load bearing capacity without the need to increase the outer cross sectional dimensions, or reduced dimensions for a given load capacity. To fulfill architectural requirements, special steels, such as weathering steel, can also be used for the hollow sections of the columns. Careful design of the top and bottom of a single column or at the connection of a continuous column is necessary to ensure that the loading is introduced into the composite cross section in a proper way. 5.4.4 Externally protected concrete filled
hollow section columns If an extended fire resistance is desired, in combination with a high load level and/or a minimised column cross section, it may be necessary to apply conventional external protection to a concrete filled hollow section column.
5.5 WATER FILLED HOLLOW SECTION COLUMNS
5.5.1 Basic principles Water filling using natural circulation provides a safe and reliable fire protection method for hollow section columns, provided that two conditions are satisfied (Hönig et al., 1985): - The system is self activating in fire. - The system is self controlling. In a properly designed system, the natural circulation will be activated when the columns are locally heated by a fire. The density of warm water is lower than that of cold water, which produces the pressure differentials that activate the natural circulation. The effect will be intensified when localised boiling commences and steam is formed. As the fire develops, the rate of steam production will also increase, thus forcing the cooling effect obtained by naturally activated circulation. The following methods of permanent water filling are available: 1. Unreplenished columns Simply filling a column with water, with no provision for replacing any water lost through steam production,
55
will lead to an increased, but limited fire resistance compared to that of the empty column. In multi-storey columns the water in the top-storey-columns will be first evaporated, but the fire resistance can be increased by externally protecting the top storey length and using it as a reservoir for the lower storeys. Heavy steam production may lead to an additional critical loss of water. Therefore, unreplenished columns should be used only for lower fire resistance requirements, up to, say, 60 minutes. 2. Columns with external pipe This system has a connecting down pipe between the bottom and top of the columns. The lighter, upward flowing water-steam mixture must be separated at the top, so that the water can return down through the pipe to the bottom. In this manner, an external naturally forced circulation will be activated. In addition, the pipe can be connected with a water storage tank at the top of the building to replace the water lost from steam production and possibly act as a common water/steam separating chamber. A group of individual columns can be connected at their bottom to a shared connecting pipe as well as with a connecting pipe at the top. For such a group of columns, only one down pipe is necessary, connecting top and bottom of the whole group, see Fig. 5.13a. 3. Columns with internal pipe In this system, an internal down tube is used within each column to provide a supply of cool water to the bottom of each column. This promotes the internal, naturally activated circulation of the upward flowing water-steam mixture and the down flowing water after steam separation. Thus, each column acts as an individual member without any connection to the other columns. To minimise the number of water storage tanks, the tops of several columns can be connected by a common pipe leading to one storage tank for the whole group, see Fig. 5.13b. 4. Mixed systems The above mentioned systems can be mixed within a building and they can be connected to act as a mixed integrated system. This can be advantageous for structures containing not only columns, but also water filled diagonals for bracing, etc. In the naturally circulating systems described above, a minimum declination of the diagonals of about 45 is recommended.
It is not advisable to use any electro-mechanical installation, such as pumps, acting against the naturally produced circulation. This may lead to a failure of the cooling system and thus to a collapse of the water filled structure. 5.5.2 Assessment methods A careful design is necessary to ensure the positive behaviour of a water filled hollow section column system. Two main criteria must be fulfilled to ensure the cooling effect: - Natural circulation of the water is maintained. - Water losses due to steam production are replaced. The mass of the water cooled steel structure as well as the water within the system can be taken into account when calculating the time of commencement of boiling. The loss of water mass by evaporation has to be estimated only for the time difference between the start of boiling and the required fire resistance time. For the characteristic thermal behaviour, refer to Fig. 5.14. The maximum temperature reached by the steel can be estimated from the boiling temperature of the water filling. The boiling temperature itself depends on the hydraulic water pressure, i.e. the static head. In addition, there will be a temperature gradient across the wall of the hollow section, which will lead to a slight increase of the temperature of the steel surface directly exposed to the fire. However, the maximum external steel surface temperature will normally not reach a value high enough to significantly affect the mechanical properties of the steel.
5.6 JOINTS 5.6.1 Unfilled hollow section columns Normally, the joints of both protected and unprotected steel structures have a lower local section factor than the adjacent members and will therefore attain lower steel temperatures. However, if the section factors are higher than for the connected members, they may be the critical elements and the behaviour under fire conditions has to be considered, especially if catenary action may occur (Wang & Ding, 2009). When bolted joints are used for insulated steel members, care must be taken to ensure that the bolt heads and nuts are as well protected as the cleat. Normally, this will lead to a local increase of insulation thickness.
56

57
5.6.2 Concrete filled hollow section columns The joints should be designed based on the principle that the loads can be transferred from the beams to the columns in such a way that all structural components – structural steel, reinforcement and concrete – contribute to the load bearing capacity according to their strength. This can be done with a through plate shown in Fig. 4.14 or with fin plates in combination with an additional connection between the hollow section and the concrete e.g. by a through pin.
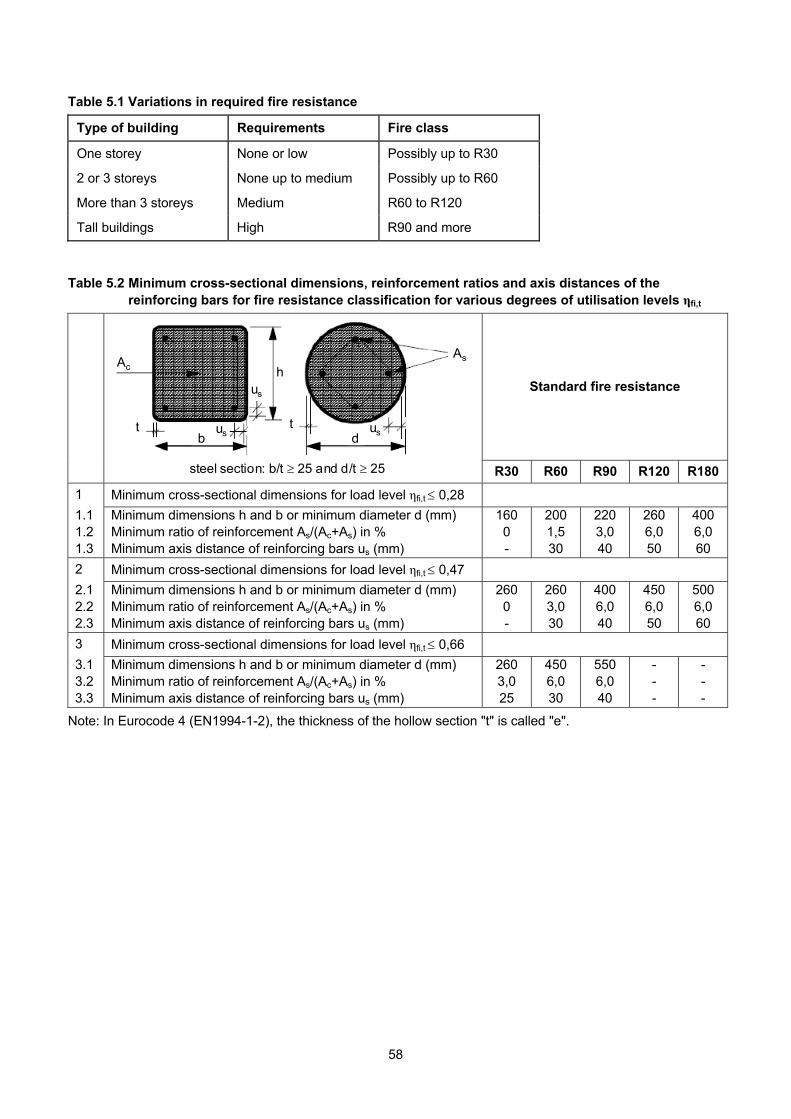
Table 5.1 Variations in required fire resistance
Type of building Requirements Fire class
One storey None or low Possibly up to R30
2 or 3 storeys None up to medium Possibly up to R60
More than 3 storeys Medium R60 to R120
Tall buildings High R90 and more
Table 5.2 Minimum cross-sectional dimensions, reinforcement ratios and axis distances of the
reinforcing bars for fire resistance classification for various degrees of utilisation levels ηfi,t
Standard fire resistance
steel section: b/t 25 and d/t 25
AsAc
t
us
us ust
b d
h
steel section: b/t 25 and d/t 25
AsAc
t
us
us ust
b d
h
R30 R60 R90 R120 R180
1 Minimum cross-sectional dimensions for load level ηfi,t 0,28
1.1 1.2 1.3
Minimum dimensions h and b or minimum diameter d (mm) Minimum ratio of reinforcement As/(Ac+As) in % Minimum axis distance of reinforcing bars us (mm)
160 0 -
200 1,5 30
220 3,0 40
260 6,0 50
400 6,0 60
2 Minimum cross-sectional dimensions for load level ηfi,t 0,47
2.1 2.2 2.3
Minimum dimensions h and b or minimum diameter d (mm) Minimum ratio of reinforcement As/(Ac+As) in % Minimum axis distance of reinforcing bars us (mm)
260 0 -
260 3,0 30
400 6,0 40
450 6,0 50
500 6,0 60
3 Minimum cross-sectional dimensions for load level ηfi,t 0,66
3.1 3.2 3.3
Minimum dimensions h and b or minimum diameter d (mm) Minimum ratio of reinforcement As/(Ac+As) in % Minimum axis distance of reinforcing bars us (mm)
260 3,0 25
450 6,0 30
550 6,0 40
- - -
- - -
Note: In Eurocode 4 (EN1994-1-2), the thickness of the hollow section "t" is called "e".
58

Time (min.)Time (min.)
1,0
0
0,6
0,4
0,2
0,8
1,0
0
0,6
0,4
0,2
0,8
Fig. 5.1 Natural fire curves and the ISO standard fire curve (ISO 834-1, 1999)
Fig. 5.2 Schematic material strength reduction for structural steel and concrete
Rigidcore
Fire exposedcolumn
(a) Section through the building
(b) Room temperature
(c) Elevated temperature
Mode of deformation
top floor :
other floors :k 0.7
k 0.5
For fire conditionsin Europe e.g. :For f ire conditionsin Europe e.g.:
top f loor : ℓθ = 0,7ℓ
other f loors : ℓθ = 0,5ℓ
Fig. 5.3 Schematic structural behaviour of columns in braced frames
59
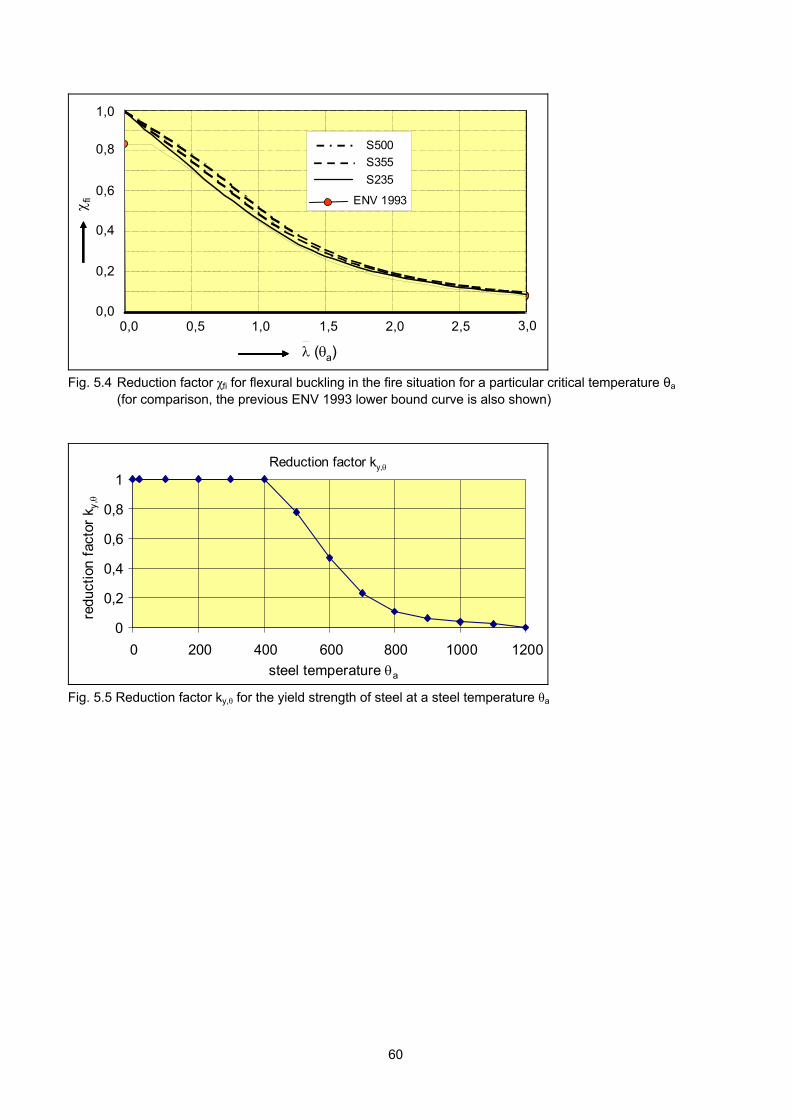
0.0
0.1
0.2
0.3
0.4
0.5
0.6
0.7
0.8
0.9
1.0
0.0 0.5 1.0 1.5 2.0 2.5 3.0
rel (a)
fi
S355
S500
S235ENV 1993
0.0
0.1
0.2
0.3
0.4
0.5
0.6
0.7
0.8
0.9
1.0
0.0 0.5 1.0 1.5 2.0 2.5 3.0
rel (a)
fi
S355
S500
S235ENV 1993
0.0
0.1
0.2
0.3
0.4
0.5
0.6
0.7
0.8
0.9
1.0
0.0 0.5 1.0 1.5 2.0 2.5 3.0
rel (a)
fi
S355
S500
S235ENV 1993
0,0 0,5 2,51,51,0 2,0 3,0
0,8
1,0
0,4
0,6
0,2
0,0
S500
S355
S235
(a)
fi
0.0
0.1
0.2
0.3
0.4
0.5
0.6
0.7
0.8
0.9
1.0
0.0 0.5 1.0 1.5 2.0 2.5 3.0
rel (a)
fi
S355
S500
S235ENV 1993
0.0
0.1
0.2
0.3
0.4
0.5
0.6
0.7
0.8
0.9
1.0
0.0 0.5 1.0 1.5 2.0 2.5 3.0
rel (a)
fi
S355
S500
S235ENV 1993
0.0
0.1
0.2
0.3
0.4
0.5
0.6
0.7
0.8
0.9
1.0
0.0 0.5 1.0 1.5 2.0 2.5 3.0
rel (a)
fi
S355
S500
S235ENV 1993
0,0 0,5 2,51,51,0 2,0 3,0
0,8
1,0
0,4
0,6
0,2
0,0
S500
S355
S235
(a)
fi
Fig. 5.4 Reduction factor χfi for flexural buckling in the fire situation for a particular critical temperature θa (for comparison, the previous ENV 1993 lower bound curve is also shown)
1,0
0,8
0,6
0,4
0,2
0
Reduction factor ky,
0
0,2
0,4
0,6
0,8
1
0 200 400 600 800 1000 1200
steel temperature a
redu
ctio
n f
acto
r k y
,
1,0
0,8
0,6
0,4
0,2
0
Reduction factor ky,
0
0,2
0,4
0,6
0,8
1
0 200 400 600 800 1000 1200
steel temperature a
redu
ctio
n f
acto
r k y
,
Fig. 5.5 Reduction factor ky,θ for the yield strength of steel at a steel temperature θa
60
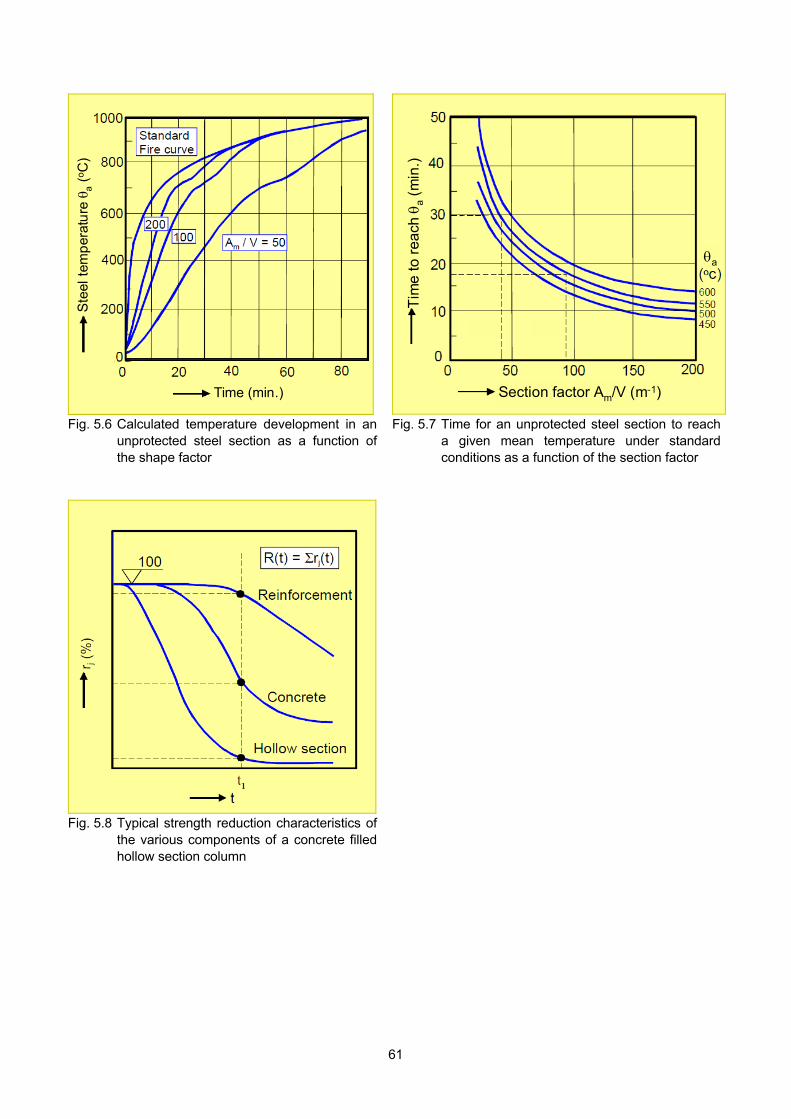
Time (min.)
Ste
el t
emp
erat
ure
a
(oC
)
Time (min.)
Ste
el t
emp
erat
ure
a
(oC
)
Section factor Am/V (m-1)
a
Tim
e t
o r
ea
ch a
(min
.)
Section factor Am/V (m-1)Section factor Am/V (m-1)Section factor Am/V (m-1)
a
Tim
e t
o r
ea
ch a
(min
.)
Section factor Am/V (m-1)
Fig. 5.6 Calculated temperature development in an unprotected steel section as a function of the shape factor
Fig. 5.7 Time for an unprotected steel section to reach a given mean temperature under standard conditions as a function of the section factor
Fig. 5.8 Typical strength reduction characteristics of the various components of a concrete filled hollow section column
61
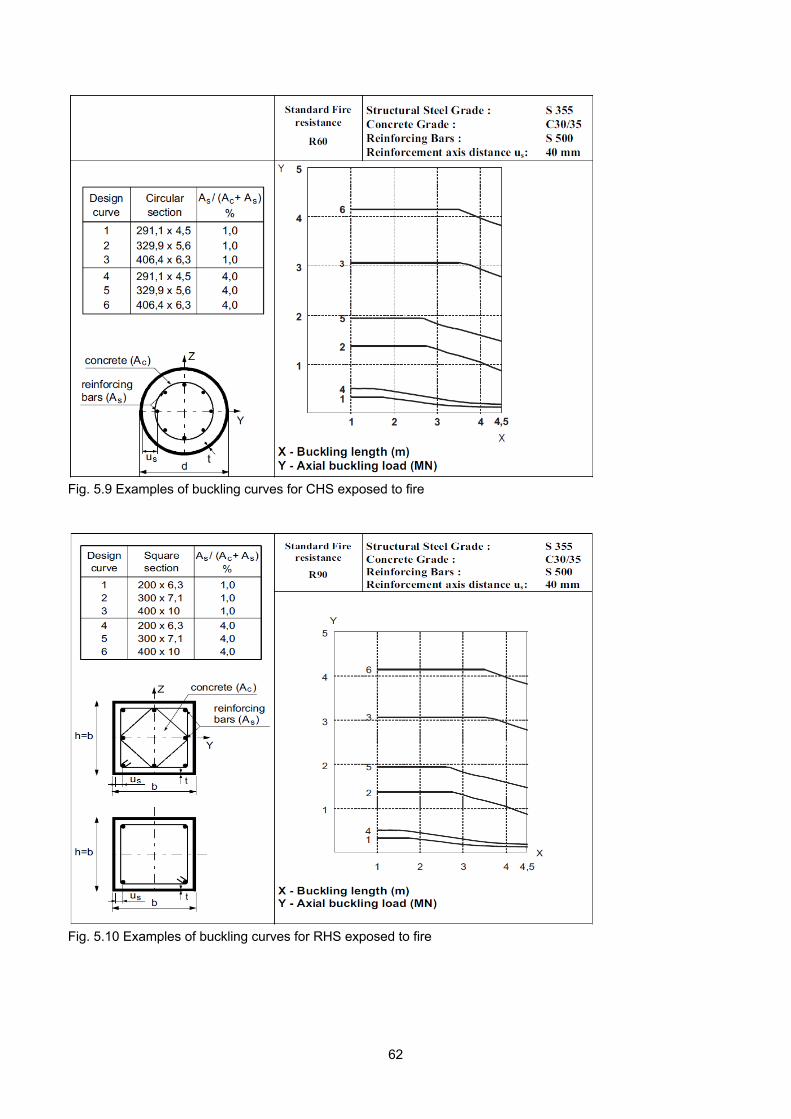
tt
Fig. 5.9 Examples of buckling curves for CHS exposed to fire
ttt
t
Fig. 5.10 Examples of buckling curves for RHS exposed to fire
62

0,0
0,4
1,0
0,9
1,0
0,7
0,8
0,6
0,5
5,00,5 3,01,5 2,52,0 3,5 4,54,0
0,0
0,4
1,0
0,9
1,0
0,7
0,8
0,6
0,5
5,00,5 3,01,5 2,52,0 3,5 4,54,00,0
0,4
1,0
0,9
1,0
0,7
0,8
0,6
0,5
5,00,5 3,01,5 2,52,0 3,5 4,54,00,00,4
1,0
0,9
1,0
0,7
0,8
0,6
0,5
5,00,5 3,01,5 2,52,0 3,5 4,54,0
0,0
0,4
1,0
0,9
1,0
0,7
0,8
0,6
0,5
5,00,5 3,01,5 2,52,0 3,5 4,54,0
0,0
0,4
1,0
0,9
1,0
0,7
0,8
0,6
0,5
5,00,5 3,01,5 2,52,0 3,5 4,54,00,0
0,4
1,0
0,9
1,0
0,7
0,8
0,6
0,5
5,00,5 3,01,5 2,52,0 3,5 4,54,00,00,4
1,0
0,9
1,0
0,7
0,8
0,6
0,5
5,00,5 3,01,5 2,52,0 3,5 4,54,0 Fig. 5.11 Correction coefficient φs as a function of the reinforcement (in %)
ℓθ/b or ℓθ/d ℓθ/b or ℓθ/d
e/b or e/d
ℓθ/b or ℓθ/d ℓθ/b or ℓθ/d
e/b or e/d
0,4
0,9
1,0
0,7
0,8
0,6
0,5
0,30,0 0,10 0,500,300,20 0,40
e
ℓθ/b or ℓθ/d
Note: In Eurocode 4 (EN 1994-1-2), the eccentricity "e" is called "δ".
Fig. 5.12 Correction coefficient φe as a function of the eccentricity e
63
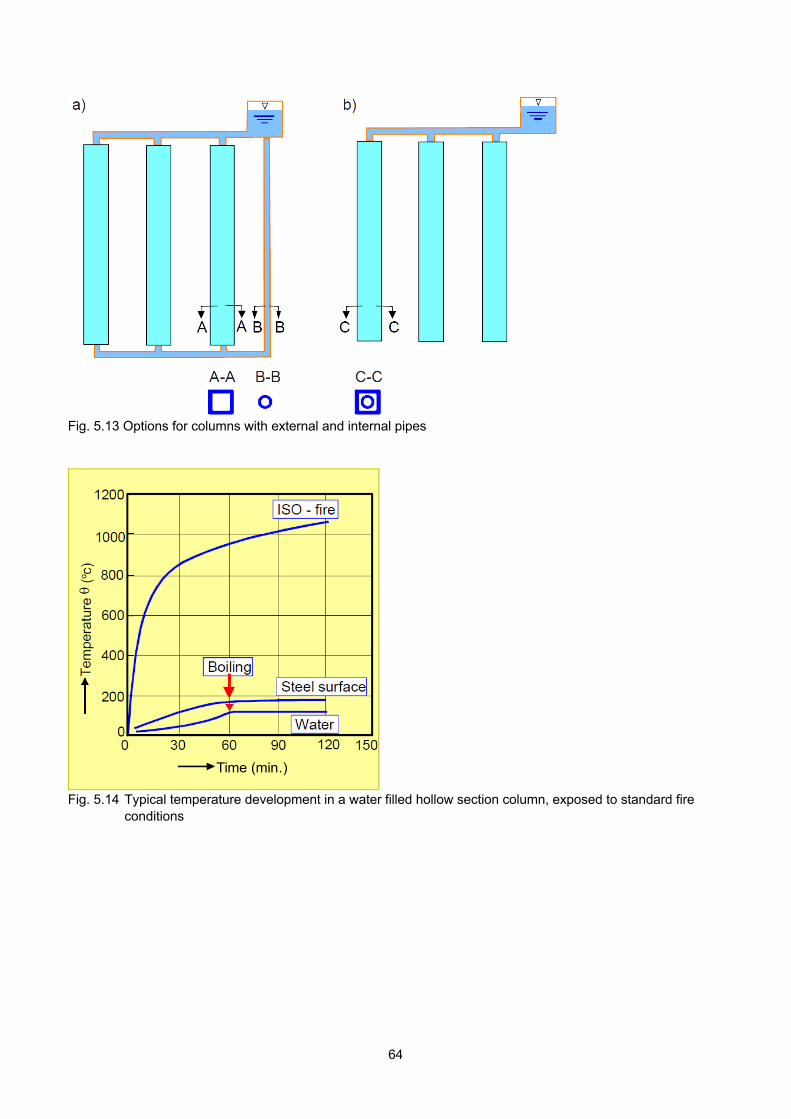
Fig. 5.13 Options for columns with external and internal pipes
Time (min.)Time (min.)
Fig. 5.14 Typical temperature development in a water filled hollow section column, exposed to standard fire conditions
64
6. DESIGN OF HOLLOW SECTION TRUSSES
6.1 TRUSS CONFIGURATIONS Various types of trusses are used in practice, see Fig. 6.1. Trusses made of hollow sections should be designed in such a way that the number of joints and thus fabrication is minimised. This means that due to the lower number of joints, a Warren type truss with K joints (Fig. 6.1a) is preferred to a Pratt type truss with N joints (Fig. 6.1b). Vierendeel girders (Fig. 6.1c) are mainly used in those cases where architectural or functional aspects require that no diagonals are used. Trusses are characterised by their length L, depth h, geometry and the distance between the joints. The depth is normally related to the span, being about 1/10 to 1/16 L. Considering total economy of a hall with all costs, a depth of 1/15 L is a common choice. Whenever feasible, the joints are located at the load application points, e.g. at the purlin locations.
6.2 JOINT CONFIGURATIONS 6.2.1 Joint classification Depending on the type of truss, various types of joints are used (Fig. 6.2), i.e. X, T, Y, N, K or KT. Although here the designation X, T, Y, etc. is related to the configuration, the classification is determined by the loading, see Fig. 6.3. The basic joint types can be defined as follows: (a) When the force component normal to the chord in
a brace member is equilibrated by beam shear (and bending) in the chord member, the joint is classified as a T joint when the brace is perpendicular to the chord, otherwise it is classified as a Y joint.
(b) When the force component normal to the chord in a brace member is essentially equilibrated (within 20%) by loads in other brace member(s) on the same side of the joint, the joint is classified as a K joint. The relevant gap is, in principle, between the primary brace members whose loads equilibrate. An N joint is to be considered as a type of K joint with one brace at 90o.
(c) When the force component normal to the chord is transmitted through the chord member and is
equilibrated by brace member(s) on the opposite side, the joint is classified as an X joint.
When brace members transmit part of their load as K joints and part of their load as T, Y, or X joints, the adequacy of each brace needs to be determined by linear interaction of the proportion of the brace load involved in each type of load transfer. However, the effect of the chord loading should be added to the joint type with the most unfavourable chord load function. One K joint, in Fig. 6.3b, illustrates that the brace force components normal to the chord member may differ by as much as 20% and still be deemed to exhibit K joint behaviour. This is to accommodate slight variations in brace member forces along a typical truss, caused by a series of panel point loads. The N joint in Fig. 6.3c, however, has a ratio of brace force components normal to the chord member of 2:1. In this case, that particular joint needs to be analysed as both a "pure" K joint (with balanced brace forces) and an X joint (because the remainder of the diagonal brace load is being transferred through the joint), as shown in Fig. 6.4. For the diagonal tension brace in that particular joint, one would need to check that:
0,1resistance joint X
N 0,5
resistance jointK
N 0,5
If the gap size in a gapped K (or N) joint becomes large and exceeds the value permitted by the gap limit, then the "K joint" should also be checked as two independent Y joints. In X joints such as Fig. 6.3e where the braces are close or overlapping, the joint should be checked as an X joint, considering both brace load components perpendicular to the chord. In K joints such as Fig. 6.3d, where a brace has very little or no loading, the joint can be treated as a Y joint, as shown. 6.2.2 Terminology and notation In principle, the terminology adopted by CIDECT and IIW to define joint parameters, is used wherever possible. However, to be consistent with the notation in Chapters 2 to 5, for the resistance, the Eurocode 3 notations Ni,Rd and Mi,Rd are used instead of N* or M* in the CIDECT Design Guides.
65
The term "joint" is used to represent the zone where two or more members are interconnected, whereas "connection" is used to represent the location at which two or more elements meet. The "through member" of a joint is termed the "chord" and attached members are termed "braces" (although the latter are also often termed bracings, branch members or web members). Fig. 6.5 shows some of the common joint notation for gapped uniplanar K joints. The numerical subscripts (i = 0, 1, 2) to symbols shown in Fig. 6.5 are used to denote the member of a hollow section joint. The subscript i = 0 designates the chord; i = 1 refers in general to the brace for T, Y and X joints, or it refers to the compression brace member for K and N joints; i = 2 refers to the tension brace member for K and N joints. For K and N overlap joints, the subscript i is used to denote the overlapping brace member and j is used to denote the overlapped brace member (see Fig. 6.6).
6.2.3 Limitations on geometric parameters
Most of the joint resistance formulae are subject to a particular "range of validity". This often represents the range of the parameters or variables for which the formulae have been validated, by either experimental or numerical research. In some cases, it represents the bounds within which a particular failure mode will control, thereby making the design process simpler. Joints with parameters outside these specified ranges of validity are sometimes allowed, but they may result in lower joint efficiencies and generally require considerable engineering judgement and verification. With reference to Figs. 6.6 and 6.7 for RHS sections, the gap g or overlap q, as well as the eccentricity e, may be calculated by eqs. (6.1) and (6.2) (Packer et al., 1992; Packer & Henderson, 1997):
2
2
1
1
2 1
210
θsin 2
h
θsin 2
h
θsinθsin
θθsin
2
heg
(6.1)
2
h
θθsin
θsinθsing
θsin 2
h
θsin 2
he 0
21
2 1
2
2
1
1
(6.2)
For CHS sections replace hi by di. Note that a negative value of the gap g in eq. (6.1) corresponds to an overlap q. A positive value of the
eccentricity e represents an offset from the chord centreline towards the outside of the truss.
6.3 LIMIT STATES AND LIMITATIONS ON MATERIALS
6.3.1 Limit states As stated in Chapter 1, this book is written in a limit states design format already including appropriate material and joint partial safety factors (γM) or joint resistance (or capacity) factors (). This means that the effect of the factored loads (the specified or unfactored loads multiplied by the appropriate load factors) should not exceed the factored resistance of the joint. Some connection elements, which are not specific to hollow sections, such as plate material, bolts and welds, need to be designed in accordance with local or regional structural steel specifications. Thus, additional safety or resistance factors should only be used where indicated. If allowable stress design (ASD) or working stress design is used, the joint factored resistance expressions provided herein should, in addition, be divided by an appropriate load factor. A value of 1,5 is recommended by the American Institute of Steel Construction (AISC, 2005). 6.3.2 Limitations on materials The recommendations given are applicable to both hot-finished and cold-formed steel hollow sections, as well as cold-formed stress-relieved hollow sections. The nominal specified yield strength of hollow sections should not exceed 460 N/mm2 (MPa). This nominal yield strength refers to the finished product and should not be taken larger than 0,8fu. The joint resistances given are for hollow sections with a nominal yield strength up to 355 N/mm2. For nominal yield strengths greater than this value, the joint resistances should be multiplied by 0,9. On one hand, this provision considers the relatively larger deformations that take place in joints with nominal yield strengths around 450 to 460 N/mm2, when plastification of the chord face or chord cross section occurs (for large brace-to-chord diameter or width ratios β, it may be conservative); on the other hand, for other joints the deformation or rotation capacity may be lower with yield strengths exceeding 355
66

N/mm2. Furthermore, for any formula, the "design yield stress" used for computations should not be taken higher than 0,8 of the nominal ultimate tensile strength. This provision allows for ample connection ductility in cases where punching shear failure or failure due to local yielding of a brace or plate govern, since strength formulae for these failure modes are based on the yield stress. For S460 steel hollow sections, the reduction factor of 0,9, combined with the limitation on fy to 0,8fu, results in a total reduction in joint resistance of about 15%, relative to just directly using a yield stress of 460 N/mm2 (Liu & Wardenier, 2004). Some codes, e.g. Eurocode 3 (EN 1993-1-12, 2007) give additional rules for the use of steel S690. These rules prescribe an elastic global analysis for structures with partial-strength joints. Further, a reduction factor of 0,8 to the joint capacity equations has to be used instead of the 0,9 factor which is used for S460.
6.4 GENERAL DESIGN CONSIDERATIONS
In designing hollow section trusses it is important that the designer considers the joint behaviour right from the beginning. Designing members of a truss based on member loads only may result in undesirable stiffening of joints afterwards. This does not mean that the joints have to be designed in detail in the conceptual design phase. It only means that chord and brace members have to be chosen in such a way that the main governing joint parameters provide an adequate joint strength and an economical fabrication. Since the design is always a compromise between various requirements, such as static strength, stability, economy in fabrication and maintenance, which are sometimes in conflict with each other, the designer should be aware of the implications of a particular choice. The following guidance is given to arrive at an optimum design: - Lattice structures can usually be designed assuming
pin jointed members. Secondary bending moments due to the actual joint stiffness can be neglected for static design if the joints have sufficient rotation capacity. This can be achieved by limiting the wall slenderness of certain members, particularly the compression members, which is the basis for some of the geometric limits of validity. This will be the case if the joint parameters are within the range of
validity given in the following chapters. - It is common practice to design the members with
the centre lines noding. However, for ease of fabrication it is sometimes required to have a certain noding eccentricity. The effect should be considered for member and joint design, see Section 6.5.
The gap g (Fig. 6.5) is defined as the distance
measured along the length of the connecting face of the chord, between the toes of the adjacent brace members (ignoring welds). In good designs, the minimum gap between adjacent brace members should be g t1 + t2, to ensure that there is adequate clearance to form satisfactory welds.
- In overlapped K joints, the in-plane overlap should
be large enough to ascertain that the interconnection of the brace members is sufficient for adequate shear transfer from one brace to the other. This can be achieved by ensuring that the overlap, which is defined in Fig. 6.6, is at least 25%. Where overlapping brace members are of different widths, the narrower member should overlap the wider one. Where overlapping brace members with the same diameter have different thicknesses and/or different strength grades, the member with the lowest fyi ti value should overlap the other member.
- Gap joints are preferred to partial overlap joints,
since the fabrication is easier with regard to end cutting, fitting and welding.
- An angle of less than 30 between a brace member
and a chord creates serious welding difficulties at the crown heel location and is not covered in the recommendations. However, angles less than 30 may be possible if the design is based on an angle of 30 and it is shown by the fabricator that a satisfactory weld can be made.
- In common lattice structures (e.g. trusses), about
50% of the material weight is used for the chords in compression, roughly 30% for the chord in tension and about 20% for the web members or braces. This means that with respect to material weight, the chords in compression should likely be optimised to result in thin walled sections. However, for corrosion protection (painting), the outer surface area should be minimised. If both chords have to be designed for compression loads, for example due to uplift wind loading, the above values may change depending on the lateral supports.
- Joint strength increases with decreasing chord
67
diameter- or width-to-thickness ratio. As a result, the final diameter- or width-to-thickness ratio for the chord in compression will be a compromise between joint strength and buckling strength of the member and relatively stocky sections will usually be chosen. For the chord in tension, the diameter- or width-to-thickness ratio should be chosen to be as small as possible.
- Since the joint strength efficiency (i.e. joint strength
divided by the brace yield load Ai fyi) increases with increasing chord-to-brace thickness t0/ti this ratio should be chosen as high as possible, preferably above 2. Furthermore, the weld volume required for a thin walled brace is smaller than that for a thick walled brace with the same cross section, if the welds are to develop the capacity of the connected brace member.
- The joint strength also depends on the yield stress
ratio between chord and brace, thus the use of higher strength steel for chords (if available and practical) may offer economical advantages.
- In principle, multiplanar trusses can be approached
in a similar way as uniplanar trusses, although the depth can usually be smaller, between 1/15 and 1/18 L.
6.5 TRUSS ANALYSIS Elastic analysis of hollow section trusses is frequently performed by assuming that all members are pin connected. Nodal eccentricities between the centre lines of intersecting members at panel points should preferably be kept to e 0.25d0 or 0.25h0. These eccentricities produce primary bending moments which, for a pinned joint analysis, need to be taken into account in chord member design, e.g. by treating it as a beam-column. This is done by distributing the panel point moment (sum of the horizontal components of the brace member forces multiplied by the nodal eccentricity) to the chord on the basis of relative chord stiffness on either side of the joint (i.e. in proportion to the values of moment of inertia divided by chord length to the next panel point, on either side of the joint). If these eccentricity limits are violated, the eccentricity moment may have a detrimental effect on joint strength and the eccentricity moment must be distributed between all members of a joint. If moments are distributed to the brace members, the joint capacity must then be checked for the interaction
between axial load and bending moment, for each brace member. A rigid joint frame analysis is not recommended for most planar, triangulated, single-chord, directly welded trusses, as it generally tends to exaggerate brace member moments, while the axial force distribution will still be similar to that for a pin jointed analysis. Transverse loads applied to either chord away from the panel points produce primary moments which must always be taken into account when designing the chords. Computer plane frame programs are regularly used for truss analysis. In this case, the truss can be modelled by considering a continuous chord with brace members pin connected to it at distances of +e or -e from it (e being the distance from the chord centreline to the intersection of the brace member centrelines). The links to the pins are treated as being extremely stiff as indicated in Fig. 6.8. The advantage of this model is that a sensible distribution of bending moments is automatically generated throughout the truss, for cases in which bending moments need to be taken into account in the design of the chords. Secondary moments, resulting from end fixity of the brace members to a flexible chord wall, can generally be ignored for both members and joints, provided that there is deformation and rotation capacity adequate to redistribute stresses after some local yielding at the connections. This is the case when the prescribed geometric limits of validity for design formulae given in Chapters 8 to 11 are followed. Welds in particular need to have potential for adequate stress redistribution without premature failure, and this will be achieved with the recommendations given in Section 6.5.2. Table 6.1 summarizes when moments need to be considered for designing CHS or RHS trusses. 6.5.1 Truss deflections For the purpose of checking the serviceability condition of overall truss deflection under specified (unfactored) loads, an analysis with all members being pin jointed will provide a conservative (over)estimate of truss deflections when all the joints are overlapped. A better assumption for overlap conditions is to assume continuous chord members and pin jointed brace members.
68
69
However, for gap-connected trusses, a pin jointed analysis still generally underestimates overall truss deflections, because of the flexibility of the joints. At the service load level, gap-connected hollow section truss deflections are underestimated by around 5-10%. Thus, a conservative approach for gap-connected trusses is to estimate the maximum truss deflection by 1,1 times that calculated from a pin jointed analysis. 6.5.2 Weld design To avoid weld failure it is recommended to design the welds to be stronger than the connected brace members, wherever possible. Designing fillet welds in this way, and adopting Eurocode 3 (EN 1993-1-8, 2005), results in the following minimum throat thickness "a" for fillet welds around brace members, assuming matched electrodes: a 0,92t, for S235 (fyi = 235 N/mm2) a 0,96t, for S275 (fyi = 275 N/mm2) a 1,10t, for S355 (fyi = 355 N/mm2) a 1,42t, for S420 (fyi = 420 N/mm2) a 1,48t, for S460 (fyi = 460 N/mm2) For very lightly loaded structures, smaller welds are allowed, provided care has been taken of the effective weld lengths around the perimeter (Frater & Packer, 1990; Packer & Wardenier, 1992).

Table 6.1 Moments to be considered for CHS or RHS truss design
Type of moment Primary Primary Secondary
Moments due to Nodal eccentricity (e 0.25d0 or 0.25h0)
Transverse member loading Secondary effects such as local deformations
Chord design Design of braces Design of joints
Yes No Yes, for Qf only
Yes Yes Yes, influences Qf
No No No, provided parametric limits of validity are met
Note: For structures subjected to fatigue loading, all primary and secondary bending moments should be considered, see Chapter 14.
70
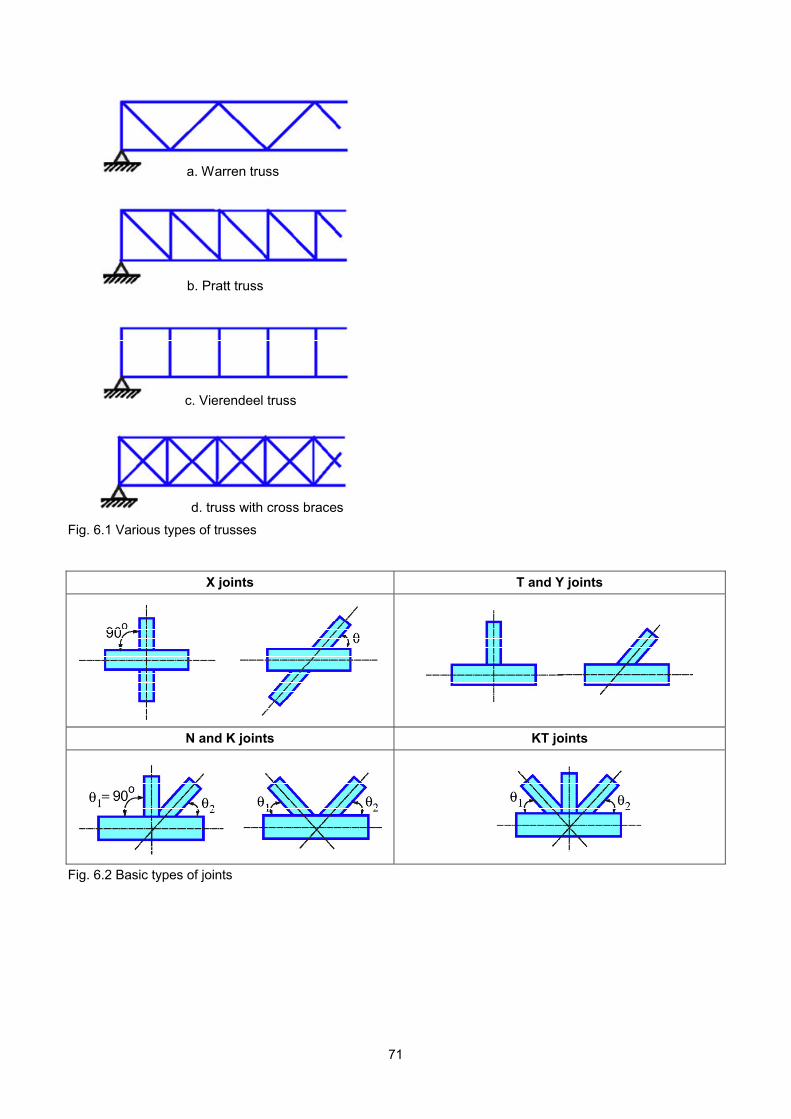
b. Pratt truss
c. Vierendeel truss
d. truss with cross braces
a. Warren truss
b. Pratt truss
c. Vierendeel truss
d. truss with cross braces
a. Warren truss
Fig. 6.1 Various types of trusses
X joints T and Y joints
N and K joints KT joints
Fig. 6.2 Basic types of joints
71
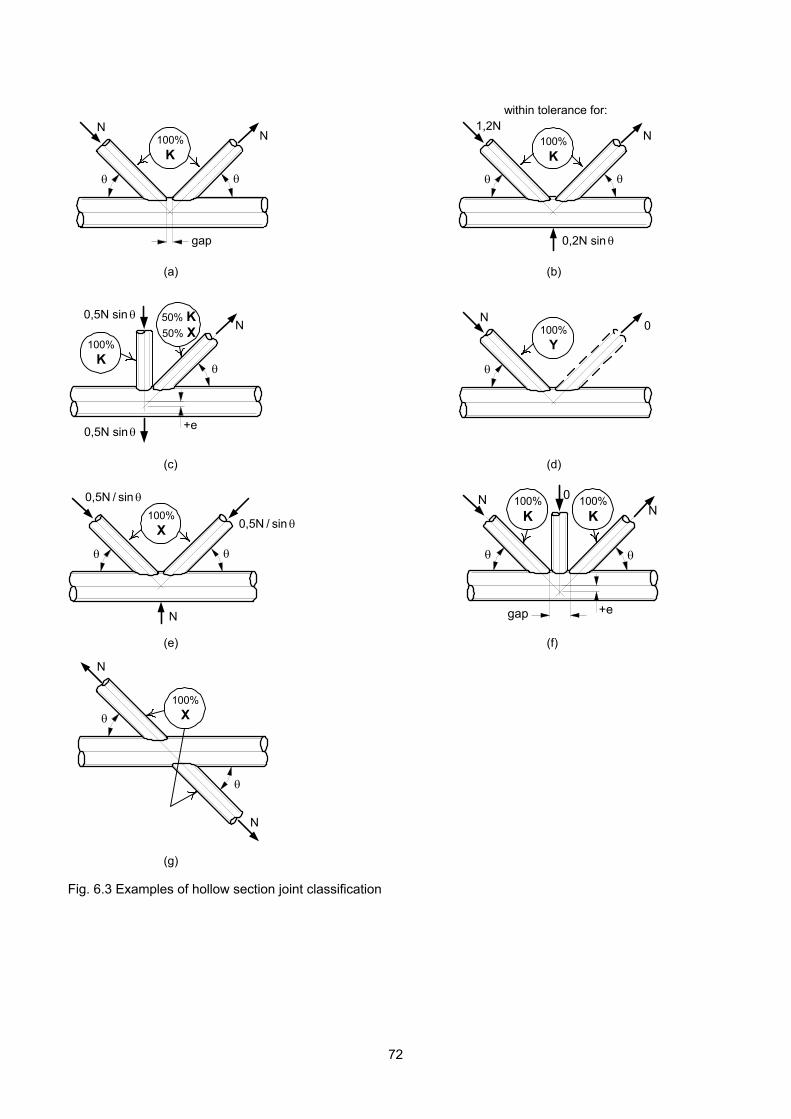
gap
N100%
K
N
(a) (b)
N100%
Y
0
(c) (d)
gap
N 100%
K N100%
K
0
+e
(e) (f)
N
100%
X
N
(g) Fig. 6.3 Examples of hollow section joint classification
within tolerancefor:
1.2N100%
K
N
0.2N sin
within tolerance for: 1,2N
0,2N sin
100%
K
N50% K50% X
+e
0.5N sin0,5N sin
0.5N sin0,5N sin
0.5 N/sin
100%
X
0,5N / sin
0.5 N/sin
N
0,5N / sin
72

0.5N sin
0.5N sin
N
N cos=
0.5N sin
0.5N
0.5N cos
0.5N sin
+
0.5N
0.5N cos
0,5Nsin
0,5N cos N cos
0,5Nsin
0,5Nsin 0,5N 0,5N
0,5N cos
0,5Nsin
0.5N sin
0.5N sin
N
N cos=
0.5N sin
0.5N
0.5N cos
0.5N sin
+
0.5N
0.5N cos
0,5Nsin
0,5N cos N cos
0,5Nsin
0,5Nsin 0,5N 0,5N
0,5N cos
0,5Nsin
Figure 6.4 Checking of a K joint with imbalanced brace loads
b0
h0
t0 2
b2 d2
h2 h1
b1 d1
1
t2 t1
g
+e
N1 N2
N0
1 2
0
Fig. 6.5 Symbols used for K gap joints
Overlap = x 100%p
q
p
q
-e i = 1 or 2 (overlapping member)j = overlapped member
i j
Fig. 6.6 Definition of overlap
73
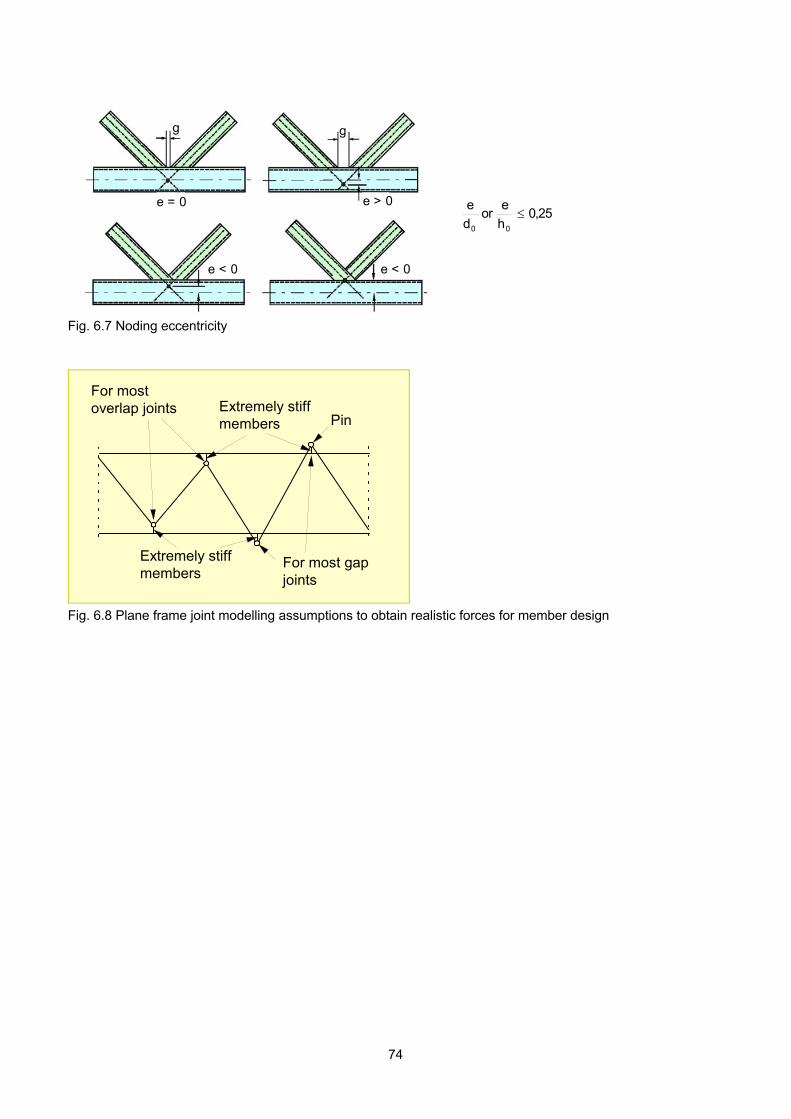
25,0h
e or
d
e
00
e < 0
25,0h
e or
d
e
00
g g
e = 0 e > 0
e < 0 e < 0
25,0h
e or
d
e
00
25,0h
e or
d
e
00
e < 0
25,0h
e or
d
e
00
g g
e = 0 e > 0
e < 0 e < 0
Fig. 6.7 Noding eccentricity
For mostoverlap joints Extremely stiff
members Pin
Extremely stiffmembers
For most gapjoints
For mostoverlap joints Extremely stiff
members Pin
Extremely stiffmembers
For most gapjoints
Fig. 6.8 Plane frame joint modelling assumptions to obtain realistic forces for member design
74
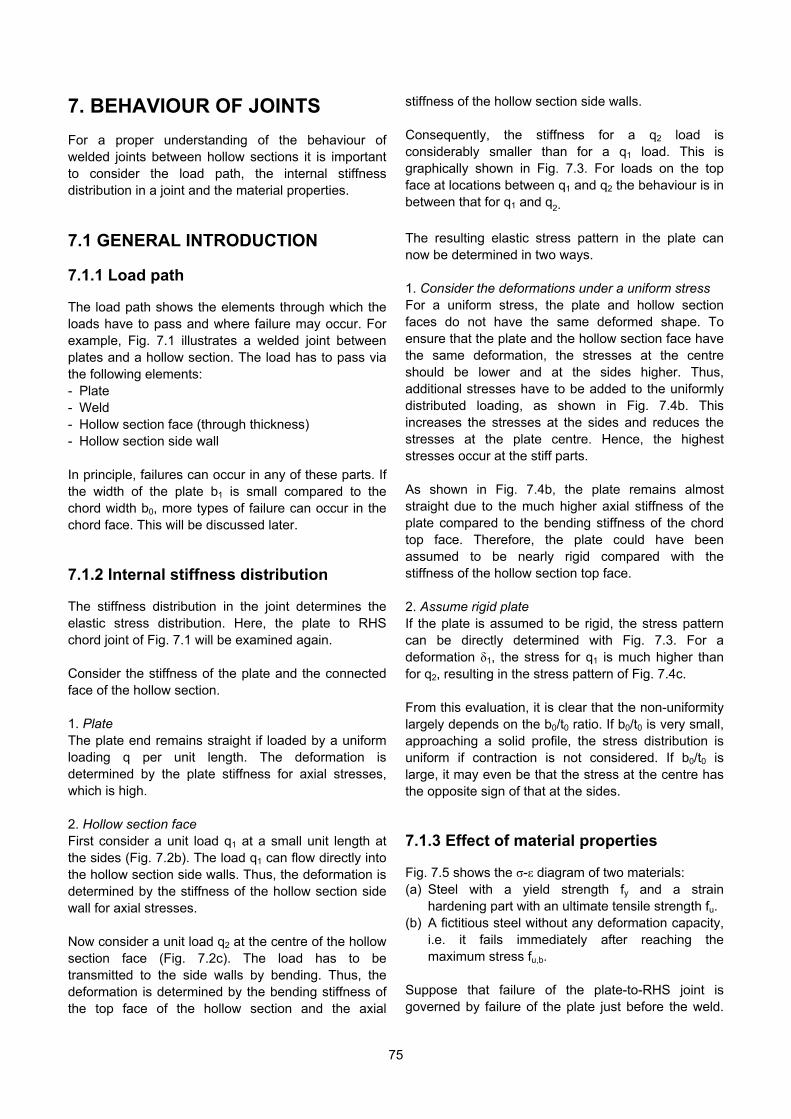
7. BEHAVIOUR OF JOINTS For a proper understanding of the behaviour of welded joints between hollow sections it is important to consider the load path, the internal stiffness distribution in a joint and the material properties.
7.1 GENERAL INTRODUCTION 7.1.1 Load path The load path shows the elements through which the loads have to pass and where failure may occur. For example, Fig. 7.1 illustrates a welded joint between plates and a hollow section. The load has to pass via the following elements: - Plate - Weld - Hollow section face (through thickness) - Hollow section side wall In principle, failures can occur in any of these parts. If the width of the plate b1 is small compared to the chord width b0, more types of failure can occur in the chord face. This will be discussed later. 7.1.2 Internal stiffness distribution The stiffness distribution in the joint determines the elastic stress distribution. Here, the plate to RHS chord joint of Fig. 7.1 will be examined again. Consider the stiffness of the plate and the connected face of the hollow section. 1. Plate The plate end remains straight if loaded by a uniform loading q per unit length. The deformation is determined by the plate stiffness for axial stresses, which is high. 2. Hollow section face First consider a unit load q1 at a small unit length at the sides (Fig. 7.2b). The load q1 can flow directly into the hollow section side walls. Thus, the deformation is determined by the stiffness of the hollow section side wall for axial stresses. Now consider a unit load q2 at the centre of the hollow section face (Fig. 7.2c). The load has to be transmitted to the side walls by bending. Thus, the deformation is determined by the bending stiffness of the top face of the hollow section and the axial
stiffness of the hollow section side walls. Consequently, the stiffness for a q2 load is considerably smaller than for a q1 load. This is graphically shown in Fig. 7.3. For loads on the top face at locations between q1 and q2 the behaviour is in between that for q1 and q2. The resulting elastic stress pattern in the plate can now be determined in two ways. 1. Consider the deformations under a uniform stress For a uniform stress, the plate and hollow section faces do not have the same deformed shape. To ensure that the plate and the hollow section face have the same deformation, the stresses at the centre should be lower and at the sides higher. Thus, additional stresses have to be added to the uniformly distributed loading, as shown in Fig. 7.4b. This increases the stresses at the sides and reduces the stresses at the plate centre. Hence, the highest stresses occur at the stiff parts. As shown in Fig. 7.4b, the plate remains almost straight due to the much higher axial stiffness of the plate compared to the bending stiffness of the chord top face. Therefore, the plate could have been assumed to be nearly rigid compared with the stiffness of the hollow section top face. 2. Assume rigid plate If the plate is assumed to be rigid, the stress pattern can be directly determined with Fig. 7.3. For a deformation δ1, the stress for q1 is much higher than for q2, resulting in the stress pattern of Fig. 7.4c. From this evaluation, it is clear that the non-uniformity largely depends on the b0/t0 ratio. If b0/t0 is very small, approaching a solid profile, the stress distribution is uniform if contraction is not considered. If b0/t0 is large, it may even be that the stress at the centre has the opposite sign of that at the sides. 7.1.3 Effect of material properties Fig. 7.5 shows the σ-ε diagram of two materials: (a) Steel with a yield strength fy and a strain
hardening part with an ultimate tensile strength fu. (b) A fictitious steel without any deformation capacity,
i.e. it fails immediately after reaching the maximum stress fu,b.
Suppose that failure of the plate-to-RHS joint is governed by failure of the plate just before the weld.
75

This means that the stress pattern in the plate (Fig. 7.4c) has to be considered in relation to the material behaviour. The stress pattern in Fig. 7.4c is based on an elastic material behaviour, thus equivalent to material "b". As soon as the maximum stress at the side (location 1) reaches the ultimate stress fu,b, the material will start cracking. If material "a" of Fig. 7.5 had been used, the maximum stress would first reach the yield stress fy. With increasing load, the material at location (1) yields i.e. the stress remains constant fy and the strain ε increases. With further increasing load, the material just beside location (1) in Fig. 7.4c will yield, etc. At a certain strain, the material at location (1) will reach the strain hardening part in the σ-ε diagram of Fig. 7.5. After a further increase of the loading, the stress will increase until the ultimate stress fu, after which the "actual stress" will still increase, although the "engineering stress", based on the original cross section will decrease. At a certain ultimate strain εu cracking will occur at location (1). Sometimes cracking occurs at the very stiff locations and still the loading can be increased due to a more uniform stress distribution in the remaining cross section. The above example shows the importance of yielding for the load capacity of hollow section joints. Another aspect which is also extremely important for static design is the deformation capacity. The deformation capacity determines if secondary moments can be redistributed in structures. For example in a truss, secondary bending moments exist due to the joint stiffness of the welded joints. However, these moments are not necessary for equilibrium of the structure. If the truss is loaded up to failure and the joint strength is governing instead of the member strength, at a certain moment, yielding occurs due to the combination of axial loading and the (secondary) bending moments. If the deformation capacity is sufficient, the axial forces in the members can increase with a decrease of the (secondary) bending moments due to plastic rotation of the joint. In the failure stage, the secondary bending moments may have totally disappeared.
7.1.4 Failure modes Following the load path (see Section 7.1.1) shows the possible failure locations, whereas the stiffness distribution (Section 7.1.2) in combination with the material behaviour (Section 7.1.3) determine the failure mode for the various locations. The lowest failure load for all possible failure modes gives the governing strength. Now the possible failure modes for the plate-to-RHS joint of Fig. 7.1 will be evaluated. 1. Plate Fig. 7.6a shows the possible stress distribution in the plate after yielding and after reaching the ultimate strain at the sides (location 1). If the chord width-to- thickness ratio b0/t0 is low and the material has sufficient ductility, the yield capacity of the plate can be attained. In most cases the capacity is lower. 2. Welds If the strength of the fillet welds (Fig. 7.6b) is lower than that of the plate, the welds may fail. If plastic deformation occurs in the welds only, the total deformation for the joint is small, resulting in a joint with no deformation capacity (which is generally not allowed). Therefore, it is recommended that the welds should preferably be designed to be stronger than the connected brace members. Only for very lightly loaded structures, e.g. where members have been selected based on aesthetical aspects, are smaller welds allowed, provided the secondary effects and the effective perimeter are considered (Frater & Packer, 1990; Packer & Wardenier, 1992). 3. Chord face The loading and hence the stresses have to pass via the top face to the side walls. Especially for thick material, cracking can occur due to manganese-sulphide (MnS) inclusions, called lamellar tearing (Fig. 7.6c). To avoid this material problem, material with good through thickness properties (TTP) should be used, i.e. steels with low sulphur contents. If b1 < b0, other failure modes can be obtained for the chord, i.e. chord face plastification or chord punching shear. For the joint with b1 = b0 the connecting chord face is held in position by the plate and the stiff connection to the side wall. Therefore, chord face yielding with a distinct yield line pattern can only develop after excessive yielding of the plate at the sides and/or excessive yielding of the hollow section side walls
76
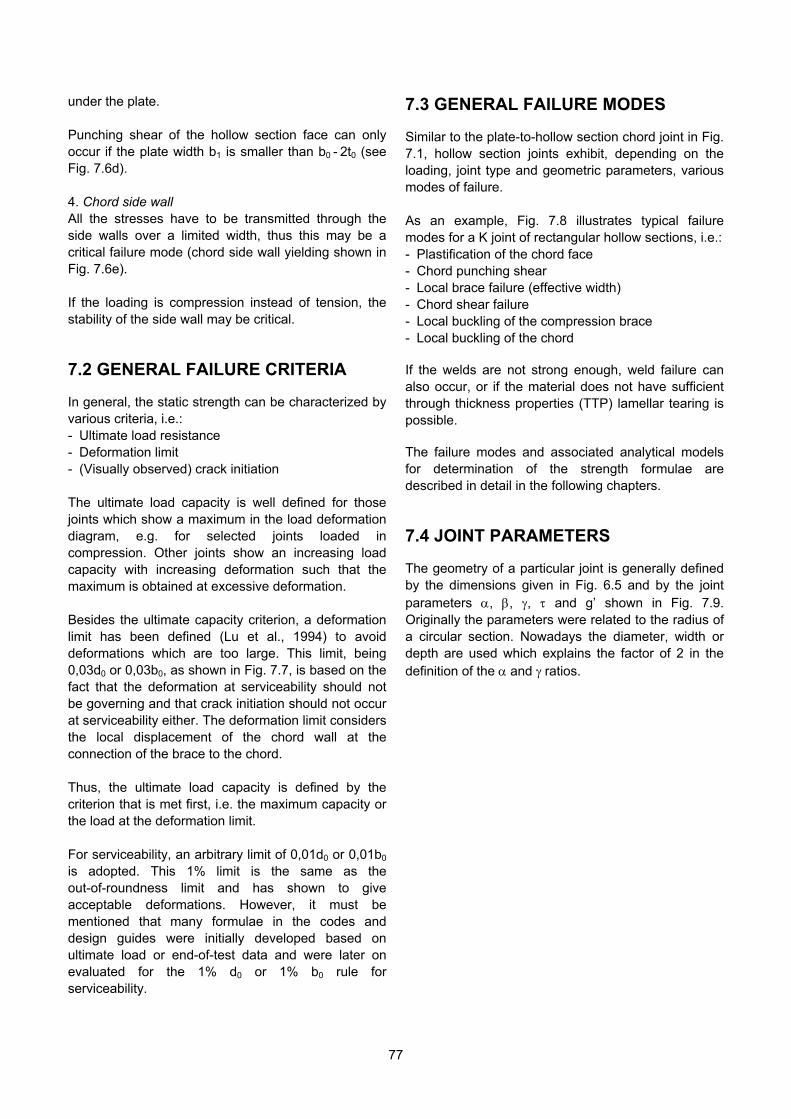
under the plate. Punching shear of the hollow section face can only occur if the plate width b1 is smaller than b0 - 2t0 (see Fig. 7.6d). 4. Chord side wall All the stresses have to be transmitted through the side walls over a limited width, thus this may be a critical failure mode (chord side wall yielding shown in Fig. 7.6e). If the loading is compression instead of tension, the stability of the side wall may be critical.
7.2 GENERAL FAILURE CRITERIA In general, the static strength can be characterized by various criteria, i.e.: - Ultimate load resistance - Deformation limit - (Visually observed) crack initiation The ultimate load capacity is well defined for those joints which show a maximum in the load deformation diagram, e.g. for selected joints loaded in compression. Other joints show an increasing load capacity with increasing deformation such that the maximum is obtained at excessive deformation. Besides the ultimate capacity criterion, a deformation limit has been defined (Lu et al., 1994) to avoid deformations which are too large. This limit, being 0,03d0 or 0,03b0, as shown in Fig. 7.7, is based on the fact that the deformation at serviceability should not be governing and that crack initiation should not occur at serviceability either. The deformation limit considers the local displacement of the chord wall at the connection of the brace to the chord. Thus, the ultimate load capacity is defined by the criterion that is met first, i.e. the maximum capacity or the load at the deformation limit. For serviceability, an arbitrary limit of 0,01d0 or 0,01b0 is adopted. This 1% limit is the same as the out-of-roundness limit and has shown to give acceptable deformations. However, it must be mentioned that many formulae in the codes and design guides were initially developed based on ultimate load or end-of-test data and were later on evaluated for the 1% d0 or 1% b0 rule for serviceability.
7.3 GENERAL FAILURE MODES Similar to the plate-to-hollow section chord joint in Fig. 7.1, hollow section joints exhibit, depending on the loading, joint type and geometric parameters, various modes of failure. As an example, Fig. 7.8 illustrates typical failure modes for a K joint of rectangular hollow sections, i.e.: - Plastification of the chord face - Chord punching shear - Local brace failure (effective width) - Chord shear failure - Local buckling of the compression brace - Local buckling of the chord If the welds are not strong enough, weld failure can also occur, or if the material does not have sufficient through thickness properties (TTP) lamellar tearing is possible. The failure modes and associated analytical models for determination of the strength formulae are described in detail in the following chapters.
7.4 JOINT PARAMETERS The geometry of a particular joint is generally defined by the dimensions given in Fig. 6.5 and by the joint parameters , , , and g’ shown in Fig. 7.9. Originally the parameters were related to the radius of a circular section. Nowadays the diameter, width or depth are used which explains the factor of 2 in the definition of the and ratios.
77
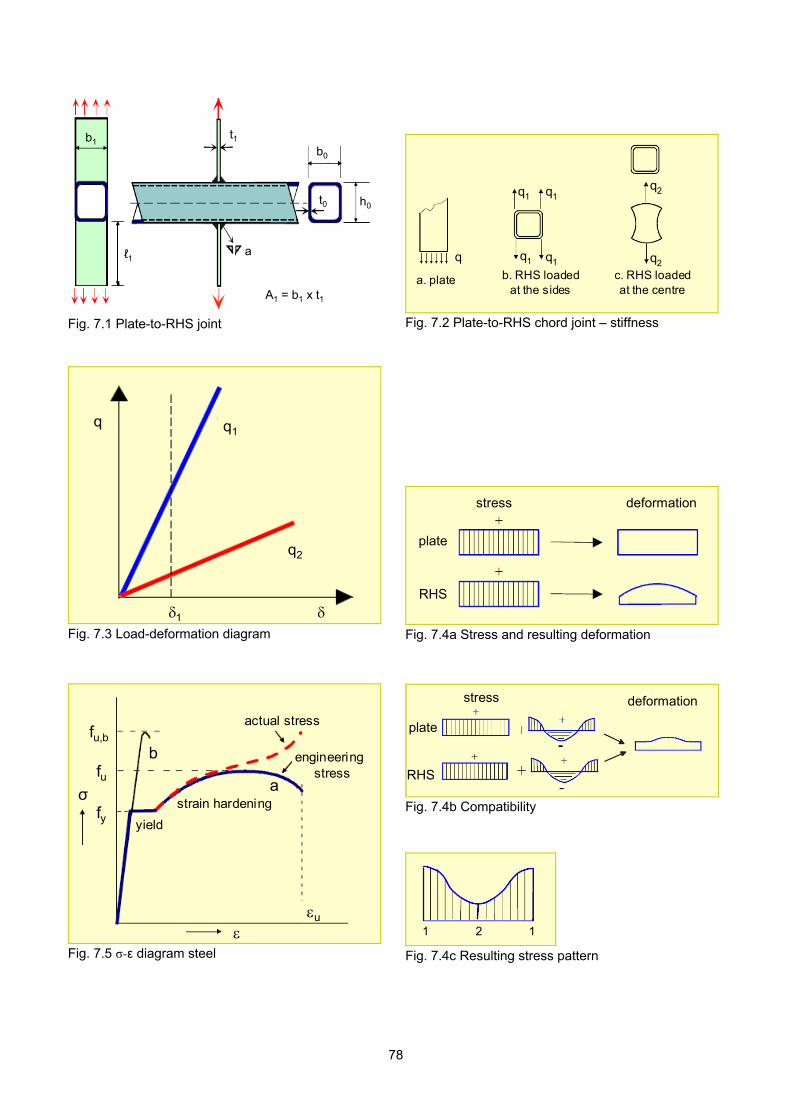
A1 = b1 x t1
ℓ1 a
t0 h0
b0
t1b1
A1 = b1 x t1
ℓ1 a
t0 h0
b0
t1b1
Fig. 7.1 Plate-to-RHS joint
q q1
q2
1
q q1
q2
1 Fig. 7.3 Load-deformation diagram
actual stressfu,b
fu
fyσ
u
b
yield
astrain hardening
engineering stress
actual stressfu,b
fu
fyσ
u
b
yield
astrain hardening
engineering stress
Fig. 7.5 σ-ε diagram steel
a. plate b. RHS loadedat the sides
c. RHS loadedat the centre
q q1 q1
q1q2q1
q2
a. plate b. RHS loadedat the sides
c. RHS loadedat the centre
q q1 q1
q1q2q1
q2
Fig. 7.2 Plate-to-RHS chord joint – stiffness
plate
RHS
stress deformation
plate
RHS
stress deformation
Fig. 7.4a Stress and resulting deformation
stress deformation
plate
RHS
stress deformation
plate
RHS
Fig. 7.4b Compatibility
1 2 11 2 1
Fig. 7.4c Resulting stress pattern
78
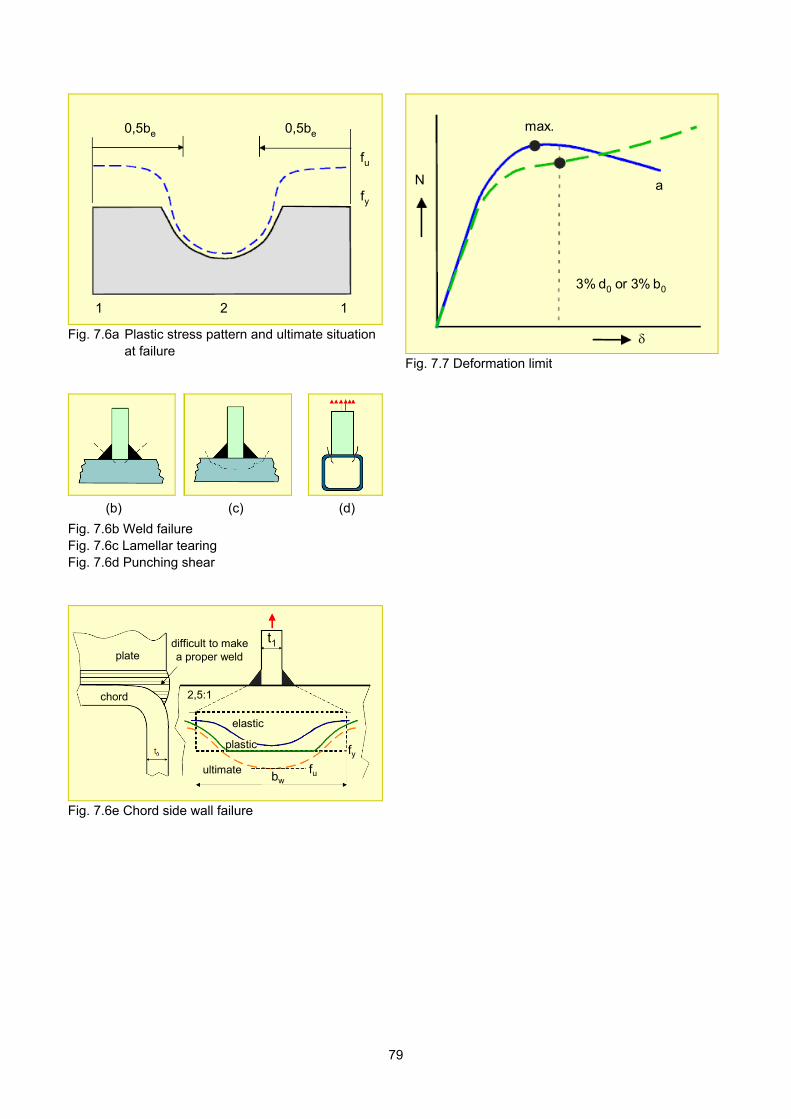
fy
fu
1 12
0,5be0,5be
fy
fu
fy
fu
1 12
0,5be0,5be
max.
3% d0
N a
3% d0 or 3% b0
max.
3% d0
N
max.
3% d0
N a
3% d0 or 3% b0
Fig. 7.6a Plastic stress pattern and ultimate situation
at failure Fig. 7.7 Deformation limit
(b) (c) (d)
Fig. 7.6b Weld failure Fig. 7.6c Lamellar tearing Fig. 7.6d Punching shear
elastic
platedifficult to makea proper weld
2,5:1
fyfu
chord
bw
plastic
t1
ultimate
elastic
platedifficult to makea proper weld
2,5:1
fyfu
chord
bw
plastic
t1
ultimate
Fig. 7.6e Chord side wall failure
79

Fig. 7.8 Failure modes for a K joint of rectangular hollow sections
0
0
0
0
b
2 or
d
2
0
1
0
1
0
1
0
1
b
b or
b
d or
d
bor
d
d for T, Y and X joints
0
21
0
21
0
21
b2
bb or
b2
dd or
d2
dd for K and N joints
0
0
0
0
t
b or
t
d2
0
i
t
t
0t
g'g
0y
0
fn
N1 N2
t0
t1
N0p N0
ℓ0
N1
1 1 2
N1 N2
t0
t1
N0p N0
ℓ0
N1
1 1 2
Fig. 7.9 Parameters used for defining the joint geometry
80
8. WELDED JOINTS BETWEEN CIRCULAR HOLLOW SECTIONS
8.1 INTRODUCTION Circular hollow sections can be connected in various ways, e.g.: - With special prefabricated connectors (Fig. 8.1) - With end pieces which allow a bolted joint (Fig. 8.2) - Welded to a plate (Fig. 8.3) - Welded directly to the through member (chord)
(Fig. 8.4) For transport or erection it may be that bolted joints are preferred or required, whereas for space structures prefabricated connectors are generally used. However, the simplest solution is to profile the ends of the members which have to be connected to the through member (chord) and weld the members directly to each other. Nowadays, end profiling does not give any problem and the end profiling can be combined with the required bevelling for the welds. Although the directly welded joint (Fig. 8.4) is the simplest and cleanest solution, the load transfer is rather complex due to the non-linear stiffness distribution along the perimeter of the connected braces. The design rules have been based on simplified analytical models in combination with experimental evidence, resulting in semi-empirical design formulae.
8.2 MODES OF FAILURE In Chapter 7 it was already indicated that the ultimate load capacity is based on either the maximum in the load deformation diagram (if the chord displacement is smaller than 0,03d0) or the load at a chord deformation of 0,03d0. In accordance with the procedure described in Chapter 7, i.e. following the loads, various possible failure modes (Fig. 8.5) can be expected: - Local brace failure (yielding, local buckling) - Weld failure - Lamellar tearing - Chord plastification (face/wall, or cross section) - Chord punching shear failure - Chord local buckling - Chord shear failure
As indicated in Chapter 6, to avoid weld failure it is recommended to design the welds to be stronger than the connected braces. Prequalified full penetration welds can be considered always to be stronger than the connected braces. Partial penetration plus fillet, or fillet welds alone, can also usually provide a weld connection as strong as the connected braces. The material should not be susceptible to lamellar tearing, i.e. especially for the larger thicknesses, the sulphur content should be low (TTP quality). Furthermore, in the current design recommendations, the d/t ratios have been limited to avoid local buckling. In addition, limiting the d/t ratio has the effect that local brace failure is no longer a governing failure mode for T, Y, X and K gap joints. Furthermore, within the range of validity of the design recommendations, it has been shown that the chord shear criterion can be covered by the formula for chord plastification. As a result, the governing modes of failure to be considered for uniplanar joints have been reduced to: - Chord plastification - Chord punching shear
8.3 ANALYTICAL MODELS For the determination of the influencing joint parameters, three models are used, i.e.: - Ring model (for chord plastification) - Punching shear model (for chord punching shear) - Chord shear model 8.3.1 Ring model The ring model, originally developed by Togo (1967), is based on the assumption that, for example in an X joint, most of the loading is transferred at the saddles of the brace, since the chord is stiffest at these parts of the connection perimeter (see the elastic stress distribution in Fig. 8.6). Consequently, the load N1 in the brace can be divided into two loads of 0,5 N1 sinθ1 at the saddles of the brace perpendicular to the chord and at a distance c1d1 with c1 < 1,0. These loads will be transferred by an effective length Be of the chord. In the model, the load 0,5 N1 sinθ1 is now considered as a line load over the length Be, see Fig. 8.7.
81
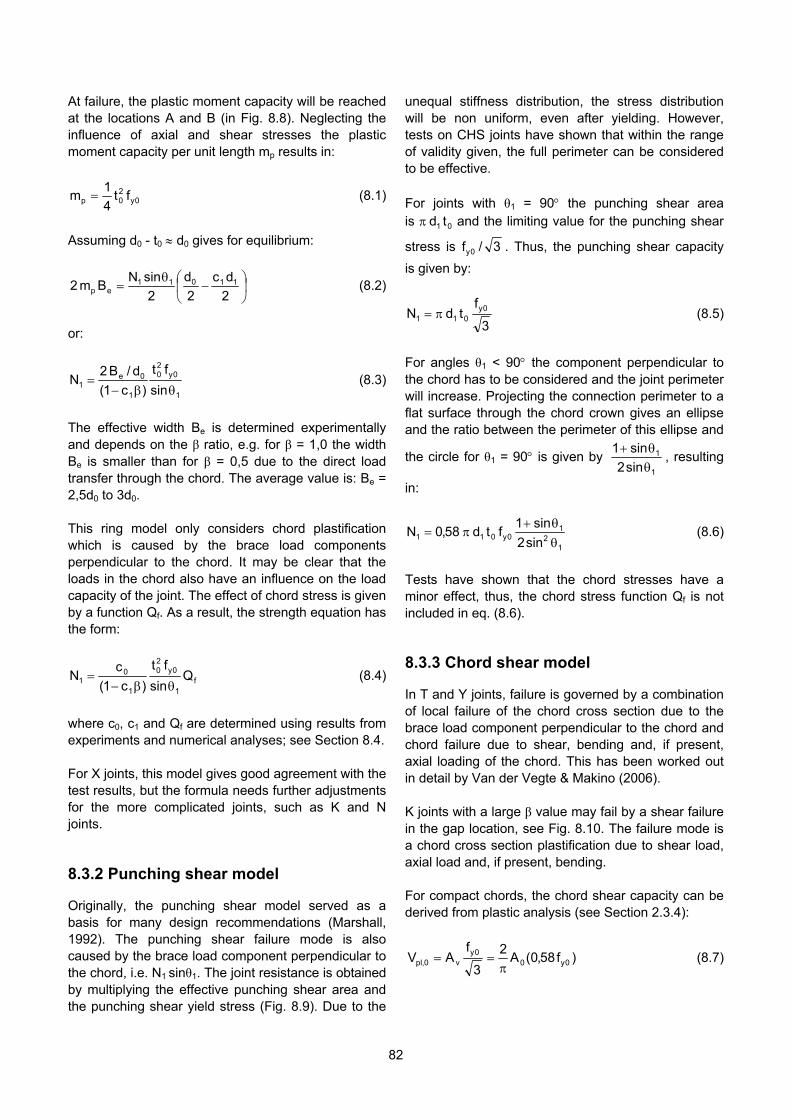
At failure, the plastic moment capacity will be reached at the locations A and B (in Fig. 8.8). Neglecting the influence of axial and shear stresses the plastic moment capacity per unit length mp results in:
0y2 0p ft
4
1m (8.1)
Assuming d0 - t0 d0 gives for equilibrium:
2
dc
2
d
2
sinNBm 2 1 1011
e p (8.2)
or:
1
0y2 0
1
0e1 sin
ft
)c1(
d/B 2N
(8.3)
The effective width Be is determined experimentally and depends on the β ratio, e.g. for β = 1,0 the width Be is smaller than for β = 0,5 due to the direct load transfer through the chord. The average value is: Be = 2,5d0 to 3d0. This ring model only considers chord plastification which is caused by the brace load components perpendicular to the chord. It may be clear that the loads in the chord also have an influence on the load capacity of the joint. The effect of chord stress is given by a function Qf. As a result, the strength equation has the form:
f1
0y2 0
1
01 Q
sin
ft
)c1(
cN
(8.4)
where c0, c1 and Qf are determined using results from experiments and numerical analyses; see Section 8.4. For X joints, this model gives good agreement with the test results, but the formula needs further adjustments for the more complicated joints, such as K and N joints. 8.3.2 Punching shear model Originally, the punching shear model served as a basis for many design recommendations (Marshall, 1992). The punching shear failure mode is also caused by the brace load component perpendicular to the chord, i.e. N1 sinθ1. The joint resistance is obtained by multiplying the effective punching shear area and the punching shear yield stress (Fig. 8.9). Due to the
unequal stiffness distribution, the stress distribution will be non uniform, even after yielding. However, tests on CHS joints have shown that within the range of validity given, the full perimeter can be considered to be effective. For joints with θ1 = 90 the punching shear area is 0 1 td and the limiting value for the punching shear
stress is 3/f 0y . Thus, the punching shear capacity
is given by:
3
ftd N 0y
0 11 (8.5)
For angles θ1 < 90 the component perpendicular to the chord has to be considered and the joint perimeter will increase. Projecting the connection perimeter to a flat surface through the chord crown gives an ellipse and the ratio between the perimeter of this ellipse and
the circle for θ1 = 90 is given by 1
1
sin2
sin1
, resulting
in:
12
10y 0 11
sin2
sin1ftd 58,0N
(8.6)
Tests have shown that the chord stresses have a minor effect, thus, the chord stress function Qf is not included in eq. (8.6). 8.3.3 Chord shear model In T and Y joints, failure is governed by a combination of local failure of the chord cross section due to the brace load component perpendicular to the chord and chord failure due to shear, bending and, if present, axial loading of the chord. This has been worked out in detail by Van der Vegte & Makino (2006). K joints with a large β value may fail by a shear failure in the gap location, see Fig. 8.10. The failure mode is a chord cross section plastification due to shear load, axial load and, if present, bending. For compact chords, the chord shear capacity can be derived from plastic analysis (see Section 2.3.4):
)f58,0(A2
3
fAV 0y 0
0yv0,pl
(8.7)
82
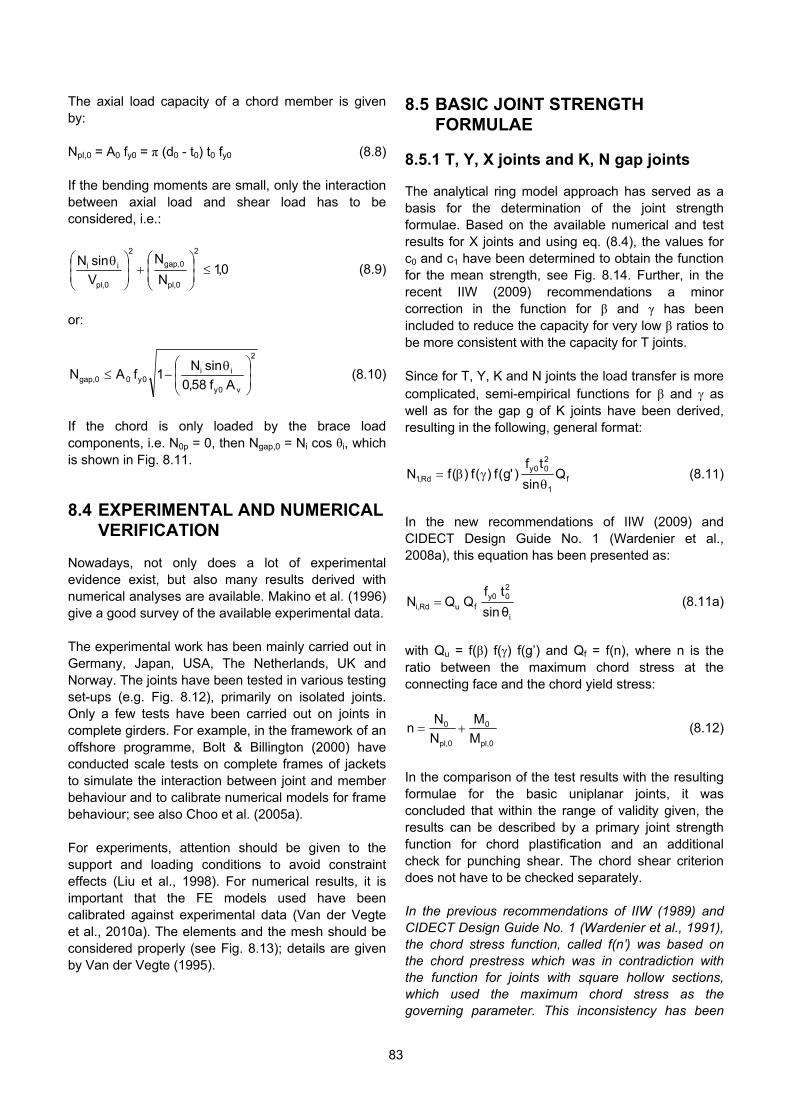
The axial load capacity of a chord member is given by: Npl,0 = A0 fy0 = π (d0 - t0) t0 fy0 (8.8) If the bending moments are small, only the interaction between axial load and shear load has to be considered, i.e.:
0,1N
N
V
sinN2
0,pl
0,gap
2
0,pl
ii
(8.9)
or:
2
v 0y
ii0y 00,gap Af 58,0
sinN1fAN
(8.10)
If the chord is only loaded by the brace load components, i.e. N0p = 0, then Ngap,0 = Ni cos θi, which is shown in Fig. 8.11.
8.4 EXPERIMENTAL AND NUMERICAL VERIFICATION
Nowadays, not only does a lot of experimental evidence exist, but also many results derived with numerical analyses are available. Makino et al. (1996) give a good survey of the available experimental data. The experimental work has been mainly carried out in Germany, Japan, USA, The Netherlands, UK and Norway. The joints have been tested in various testing set-ups (e.g. Fig. 8.12), primarily on isolated joints. Only a few tests have been carried out on joints in complete girders. For example, in the framework of an offshore programme, Bolt & Billington (2000) have conducted scale tests on complete frames of jackets to simulate the interaction between joint and member behaviour and to calibrate numerical models for frame behaviour; see also Choo et al. (2005a). For experiments, attention should be given to the support and loading conditions to avoid constraint effects (Liu et al., 1998). For numerical results, it is important that the FE models used have been calibrated against experimental data (Van der Vegte et al., 2010a). The elements and the mesh should be considered properly (see Fig. 8.13); details are given by Van der Vegte (1995).
8.5 BASIC JOINT STRENGTH FORMULAE
8.5.1 T, Y, X joints and K, N gap joints The analytical ring model approach has served as a basis for the determination of the joint strength formulae. Based on the available numerical and test results for X joints and using eq. (8.4), the values for c0 and c1 have been determined to obtain the function for the mean strength, see Fig. 8.14. Further, in the recent IIW (2009) recommendations a minor correction in the function for β and γ has been included to reduce the capacity for very low β ratios to be more consistent with the capacity for T joints. Since for T, Y, K and N joints the load transfer is more complicated, semi-empirical functions for β and as well as for the gap g of K joints have been derived, resulting in the following, general format:
f1
200y
Rd,1 Qsin
tf )'g(f )(f )(fN
(8.11)
In the new recommendations of IIW (2009) and CIDECT Design Guide No. 1 (Wardenier et al., 2008a), this equation has been presented as:
i
20y0
fuRdi, θ sin
t f Q QN (8.11a)
with Qu = f(β) f() f(g’) and Qf = f(n), where n is the ratio between the maximum chord stress at the connecting face and the chord yield stress:
pl,0
0
pl,0
0
M
M
N
Nn (8.12)
In the comparison of the test results with the resulting formulae for the basic uniplanar joints, it was concluded that within the range of validity given, the results can be described by a primary joint strength function for chord plastification and an additional check for punching shear. The chord shear criterion does not have to be checked separately. In the previous recommendations of IIW (1989) and CIDECT Design Guide No. 1 (Wardenier et al., 1991), the chord stress function, called f(n’) was based on the chord prestress which was in contradiction with the function for joints with square hollow sections, which used the maximum chord stress as the governing parameter. This inconsistency has been
83

corrected in the current design recommendations of IIW (2009) and the 2nd edition of CIDECT Design Guide No. 1 (Wardenier et al., 2008a) adopted in this book. 8.5.2 K, N overlap joints For overlap joints, the same approach is adopted for all types of overlap joints, regardless whether circular or rectangular braces are used in combination with a circular, rectangular or open section chord (Wardenier, 2007; Qian et al., 2007). Only the effective width parameters depend on the type of section. The resistance of overlap joints between circular hollow sections with 25% Ov 100% overlap is based on the following criteria: (1) Local failure of the overlapping brace (2) Local chord member yielding at the joint location
based on interaction between axial load and bending moment
(3) Shear of the connection between the brace(s) and the chord
Figure 8.16 shows the overlap joint configuration with the cross sections to be examined for these criteria. Local failure of the overlapping brace (criterion 1) should always be checked, while shear between the braces and the chord (criterion 3) may only become critical for larger overlaps, i.e. larger than 60% or 80%, depending on whether or not the hidden toe location of the overlapped brace is welded to the chord. The check for local chord member yielding (criterion 2) is, in principle, a member check and may become critical for larger overlaps and/or larger β ratios. For 100% overlap joints, similar criteria have to be checked. Only here, as shown by Qian et al. (2007), shear of the overlapped brace and chord member yielding will generally be the governing criteria. Although an overlap of 100% is given in the recommendations, in general, the overlap will be slightly larger to allow proper welding of the overlapping brace to the overlapped brace.
Joints with overlaps between 0% and 25% should be avoided because in those cases, the stiffness of the connection between the overlapping brace and the overlapped brace is much larger than that of the overlapping brace to chord connection, which may lead to premature cracking and lower capacities (Wardenier, 2007).
More detailed information regarding the design equations for overlap joints is given in Chapter 11.
8.6 EVALUATION TO DESIGN RULES In the analysis for the basic joint strength formulae, at first, functions have been derived which predict the mean strength with the lowest coefficient of variation. Considering the scatter in test results, typical tolerances in dimensions and workmanship and the variation in yield stress, in the second step, characteristic joint strength formulae have been determined with a 5% probability of lower strength (Kurobane, 1981; Wardenier, 1982; Van der Vegte et al., 2008). In the analyses by Van der Vegte et al. (2007, 2008, 2010b) and Zhao et al. (2008) for the new recommendations of IIW (2009) and CIDECT Design Guide No. 1 (Wardenier et al., 2008a), these characteristic formulae have been further divided by a partial factor M of 1,1 for chord plastification and 1,0 for punching shear and 1,0 for chord shear. Finally, the equations have been slightly simplified to derive the design resistance formulae. Table 8.1 summarizes the design resistance formulae for the basic uniplanar joints. As shown, only the chord plastification criterion and the general punching shear criterion should be checked. Fig. 8.15 shows that a compression stress n < 0 in the chord may give a considerable reduction of the joint resistance, whereas for chord tension, the influence depends on the γ ratio. The influence functions given are fully based on experimental and numerical evidence. For chord compression, a function that provided the best fit with the test results is used whereas for chord tension, a lower bound is adopted for the joints with high γ ratios. Recent results (Qian et al., 2008) for low γ ratios show that the chord stress function acts more as a mean function for these data. In the previous recommendations of IIW (1989) and CIDECT (Wardenier et al., 1991), no reduction for chord tensile loading was used since at that time, the available experiments did not show a reduction for chord tension loads up to about 80% of the chord yield capacity (Wardenier, 1982). The joint resistances given in Table 8.1 are for hollow sections with a nominal yield strength not exceeding
84
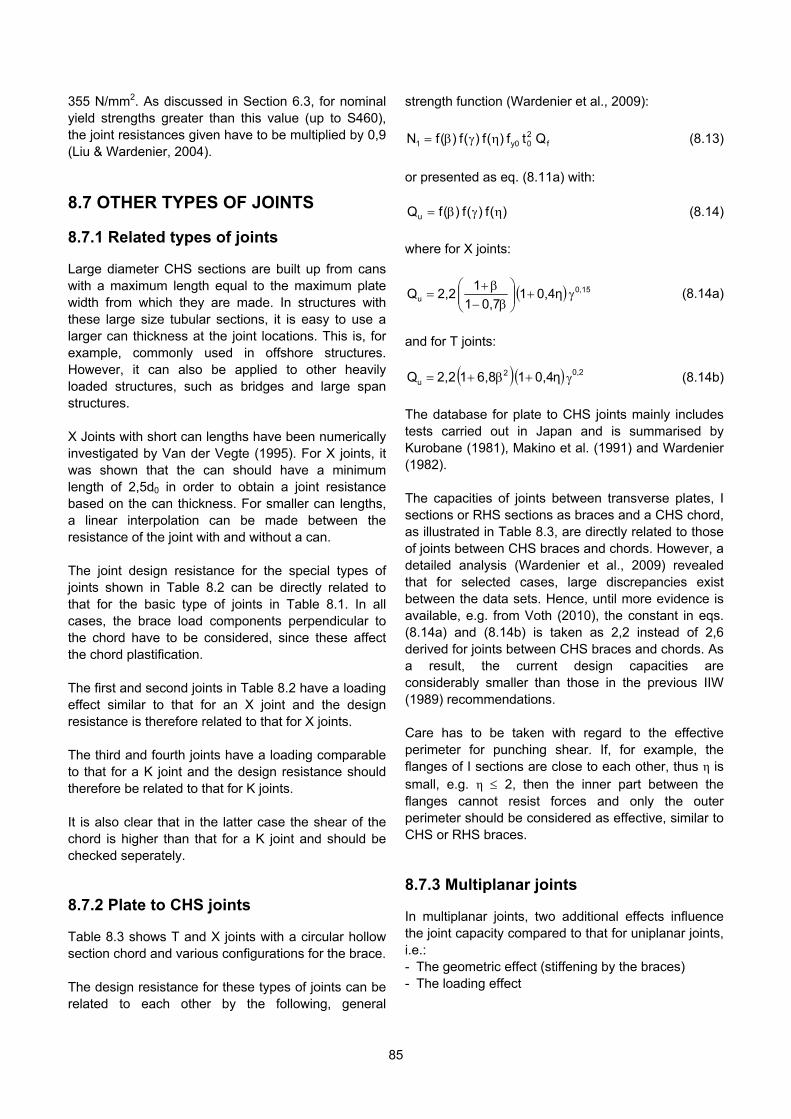
355 N/mm2. As discussed in Section 6.3, for nominal yield strengths greater than this value (up to S460), the joint resistances given have to be multiplied by 0,9 (Liu & Wardenier, 2004).
8.7 OTHER TYPES OF JOINTS 8.7.1 Related types of joints Large diameter CHS sections are built up from cans with a maximum length equal to the maximum plate width from which they are made. In structures with these large size tubular sections, it is easy to use a larger can thickness at the joint locations. This is, for example, commonly used in offshore structures. However, it can also be applied to other heavily loaded structures, such as bridges and large span structures. X Joints with short can lengths have been numerically investigated by Van der Vegte (1995). For X joints, it was shown that the can should have a minimum length of 2,5d0 in order to obtain a joint resistance based on the can thickness. For smaller can lengths, a linear interpolation can be made between the resistance of the joint with and without a can. The joint design resistance for the special types of joints shown in Table 8.2 can be directly related to that for the basic type of joints in Table 8.1. In all cases, the brace load components perpendicular to the chord have to be considered, since these affect the chord plastification. The first and second joints in Table 8.2 have a loading effect similar to that for an X joint and the design resistance is therefore related to that for X joints. The third and fourth joints have a loading comparable to that for a K joint and the design resistance should therefore be related to that for K joints. It is also clear that in the latter case the shear of the chord is higher than that for a K joint and should be checked seperately. 8.7.2 Plate to CHS joints Table 8.3 shows T and X joints with a circular hollow section chord and various configurations for the brace. The design resistance for these types of joints can be related to each other by the following, general
strength function (Wardenier et al., 2009):
f20 y01 Q tf )(f )(f )(fN (8.13)
or presented as eq. (8.11a) with:
)(f )(f )(fQu (8.14)
where for X joints:
0,15u 0,4η1
0,71
1 2,2Q
(8.14a)
and for T joints:
0,22 u 0,4η1 6,81 2,2Q (8.14b)
The database for plate to CHS joints mainly includes tests carried out in Japan and is summarised by Kurobane (1981), Makino et al. (1991) and Wardenier (1982). The capacities of joints between transverse plates, I sections or RHS sections as braces and a CHS chord, as illustrated in Table 8.3, are directly related to those of joints between CHS braces and chords. However, a detailed analysis (Wardenier et al., 2009) revealed that for selected cases, large discrepancies exist between the data sets. Hence, until more evidence is available, e.g. from Voth (2010), the constant in eqs. (8.14a) and (8.14b) is taken as 2,2 instead of 2,6 derived for joints between CHS braces and chords. As a result, the current design capacities are considerably smaller than those in the previous IIW (1989) recommendations. Care has to be taken with regard to the effective perimeter for punching shear. If, for example, the flanges of I sections are close to each other, thus η is small, e.g. η 2, then the inner part between the flanges cannot resist forces and only the outer perimeter should be considered as effective, similar to CHS or RHS braces. 8.7.3 Multiplanar joints In multiplanar joints, two additional effects influence the joint capacity compared to that for uniplanar joints, i.e.: - The geometric effect (stiffening by the braces) - The loading effect
85

For example, consider the XX joint in Table 8.4. If the out-of-plane braces are very small in diameter, and unloaded, they have hardly any effect on the deformation of the chord. However, if the diameter increases (e.g. β = 0,6), the chord cross section is stiffened considerably. As a consequence, for chord plastification, the geometric effect on the joint capacity will be minor for small β values and significant for larger β values. The deformation capacity further decreases for β ratios close to 0,7 since the load transfer is concentrated at the out-of-plane gap locations between the braces. Below β = 0,7, the braces are not overlapping. For the load effects in XX joints, it is clear that, for chord plastification, loads in the brace planes in the opposite sense will decrease the joint capacity, whereas loads in the same sense will increase the joint capacity. However, for chord punching shear, the factor should not exceed 1,0. Although the effects depend on the joint parameters (Paul, 1992; Van der Vegte, 1995) the influence function in Table 8.4 for XX joints can be considered to be a lower bound, especially for loading in both planes in the same sense. 8.7.4 Joints loaded by brace bending
moments In principle, the design resistance formulae for joints loaded by brace in-plane or out-of-plane bending moments have been determined in a similar way to that for axially loaded joints, also resulting in two strength criteria, i.e. chord plastification and chord punching shear. The design resistance formulae are based on the analyses by Wardenier (1982) and Van der Vegte et al. (2010b) and are given in Table 8.5. For out-of-plane bending, the loading is concentrated at the saddles, similar to X joints in the ring model approach. This explains why the same function is used for f(β). In the case of Vierendeel girders, it is recommended to choose joints with width ratios close to β =1,0 to provide sufficient stiffness and strength. For plate, I, H or RHS to CHS chord joints the moment resistance is given in Tables 8.3a and 8.3b.
8.7.5 Interaction between axial loads and bending moments
Joints with brace members subjected to combined loading should satisfy:
0,1M
M
M
M
N
N
Rd,i,op
Ed,i,op
2
Rd,i,ip
Ed,i,ip
Rd,i
Ed,i
(8.15)
This interaction equation is based on the work of Hoadly & Yura (1985), although the exponents have been rounded off. Eq (8.15) shows directly that the influence of axial load and brace out-of-plane bending, both with the loading concentrated at the saddles, is comparable, whereas brace in-plane bending, with the maximum loading more concentrated at the crown, has a smaller effect in the interaction.
8.8 DESIGN CHARTS In the design process, it is important that the designer knows how to design and that he or she can quickly check if a particular design will be appropriate. Hence, design graphs have been established (Wardenier et al., 1991, 2008a) in which the joint resistance is expressed as an efficiency, i.e. the joint resistance is given as a fraction of the yield capacity Ai fyi of the connected brace. This results in the following efficiency formula:
Efficiency =i
f
i yi
00ye
yi i
Rd,i
sin
Q
tf
tfC
fA
N
(8.16)
In the case of 21 dd for K joints, eq. (8.16) has to be
multiplied by i
21
2d
dd , where di is the diameter of the
brace considered. The efficiency parameter Ce (CT for T joints, CX for X joints and CK for K gap joints), see Figs 8.17 to 8.19, gives the efficiency for a joint with: - θi = 90 - fy0 t0 = fyi ti (identical thickness and yield stress for
brace and chord) - Qf = 1,0 As an example, Fig. 8.19b shows that for a K joint with g = 2t0, 2 30 and β 0,5, a value of CK 0,4 applies. Thus, for an angle θi = 45, a 100% efficiency can be obtained if:
86

77,1tf
tf
i yi
00y
Note that this ratio should be slightly larger because the chord stress effect Qf has not been included. This example shows that for a 100% efficiency, fy0 t0 should always be considerably larger than fyi ti. The chord stress function Qf for CHS joints is given as a function of the parameter n, thus related to the maximum stress to yield stress ratio in the chord, see Figs. 8.11 and 8.15. For simply supported lattice girders, the influence of the chord stress function is small (small chord loads) near the supports, whereas it has a pronounced influence at the centre of the girder where the chord loads are high and, in general, the brace loads are small. The chord stress function is especially important in the case of continuous or cantilevered lattice girders.
8.9 RELATION TO THE PREVIOUS RECOMMENDATIONS OF IIW (1989) AND CIDECT (1991)
Recently all data have been reanalysed (Van der Vegte et al., 2007, 2008, 2010b) for the revision of the recommendations of IIW (2009) and CIDECT Design Guide No. 1 (Wardenier et al., 2008a). Zhao et al. (2008) give a detailed overview of the modifications made for the IIW (2009) recommendations. These new recommendations are also to be included in the new ISO standard in this field and will be the basis for the next revision of the Eurocode 3 recommendations. For these reanalyses, extensive numerical data have been obtained. One of the main reasons for the analyses was to define the chord stress function by the maximum chord stress, in accord with that for RHS joints. However, this also influences the basic joint strength functions, while the same analytical models apply. Further, the current database now includes more joints with larger sections where the size of the welds has a smaller influence on the joint capacity. In the new recommendations of IIW (2009) and CIDECT (Wardenier et al., 2008a), for both chord compression and tension loading, the maximum chord load has to be considered for the chord load function and both give a reduction in joint resistance. In the
previous recommendations, a reduction factor was only given for chord compression loading and was based on the chord preload. For brace in-plane bending, only the constant has been changed resulting in about 10% lower strength. This reduction is also a result of newly derived data with larger dimensions and relatively smaller welds. For brace out-of-plane bending, the capacity in the recommendations of IIW (2009) and the 2nd edition of CIDECT Design Guide No. 1 is again related to the axial load capacity of X joints. On average, for medium β and γ ratios the joint capacities are about the same as those in Eurocode 3 (EN 1993-1-8, 2005). For the plate, I or RHS to CHS chord joints, selected data of Akiyama et al. (1974) were originally excluded from the database due to unexplained deviations from other data. In the new analyses these data are included since no satisfactory explanation could be obtained for the discrepancies observed. However, this resulted in a considerable reduction of the joint capacities. Currently, a research programme, including both experiments and numerical analyses, is being carried out at the University of Toronto (Voth, 2010) to investigate this type of configuration more in detail. These results confirm that Akiyama’s data are far too conservative. In most cases, the updated recommendations of IIW (2009) and CIDECT (Wardenier et al., 2008a) give slightly lower capacities than the previous equations, although there are areas where they give the same or higher capacities. A comprehensive comparison between these new recommendations and the previous equations is given by Wardenier et al. (2008a, 2008b). These references further give a comparison with the latest update of the API (2007); see also Pecknold et al. (2007). Detailed information about the background of American codes is given by Marshall & Toprac (1974), Marshall (1984, 1992, 2004, 2006) and Packer et al. (2010). The background for the ISO 19902 (2007) offshore code is given by Dier & Lalani (1998) and Dier (2005).
8.10 CONCLUDING REMARKS For more detailed information about special types of
87

88
joints such as cropped end joints, flattened end joints, stiffened joints, slotted CHS gusset plate joints, etc., reference is made to the appropriate literature; see Choo et al. (2004, 2005b), Dutta (2002), Kurobane (1981), Packer (2006), Packer & Henderson (1997), Rondal (1990), Thiensiripipat (1979), Wardenier (1982) and Wardenier et al. (2008a).

Table 8.1 Design axial resistances of welded joints between circular hollow sections
Type of joint Design limit state
T and Y joints Chord plastification
f0,22
1
20y0
Rd1, Q β7,716,2sin
tf N
Chord punching shear (for d1 d0 - 2t0)
1
N1
t1
d1d0 t0
N0
M0
1 2
1 01y0Rd1,
θsin 2
sin1 t d f 0,58=N
X joints Chord plastification
f15,0
1
20 0y
Rd1, Q 0,7β-1
6,26,2
sin
tfN
Chord punching shear (for d1 d0 - 2t0)
See chord punching shear equation for T and Y joints
Chord shear (for X joints, if cos θ1 > β)
1
N1
t1
d1
N1
d0 t0
N0
1
00y Rd,1 sin
A )/2(f58,0N
2
0 0y
1Ed,10y 0Rd,0,gap A )/2(f58,0
sinN1fAN
K and N gap joints Chord plastification
f8,0 0
0,36,1
1
200y
Rd1, Q )t/g(2,1
11 )2,31(1,65
sin
tfN
Rd1,2
1Rd2, N
sin
sinN
Chord punching shear (for di d0 - 2t0)
2
N2
t2
d2N1
1
t1
d1 g
+e
d0
N0
i 2
i 0iy0Rdi,
θsin 2
sin1 t d f 0,58=N
1C f n1Q with
Rdpl,0,
Ed0,
Rdpl,0,
Ed0,
M
M
N
Nn in connecting face
Function Qf
Chord compression stress (n < 0) Chord tension stress (n 0)
T, Y and X joints C1 = 0,45 - 0,25β
K gap joints C1 = 0,25 C1 = 0,20
Range of validity
1,0d
d0,2
0
i 0i tt 0,25d
e
0
General 30i 21 ttg y0yi ff (1) uy f8,0f 2
y N/mm 460f
Compression class 1 or 2 (2) and )40/td:joints X (for 50/td 0000 Chord
Tension )40/td:joints X (for 50/td 0000
Compression class 1 or 2 (2) and 50/td ii Braces
Tension 50/td ii
(1) For 355 N/mm2 < fy0 460 N/mm2, use a reduction factor of 0,9 for the design resistances. (2) Class 1 and 2 limits for di/ti are given in Table 2.7.
89
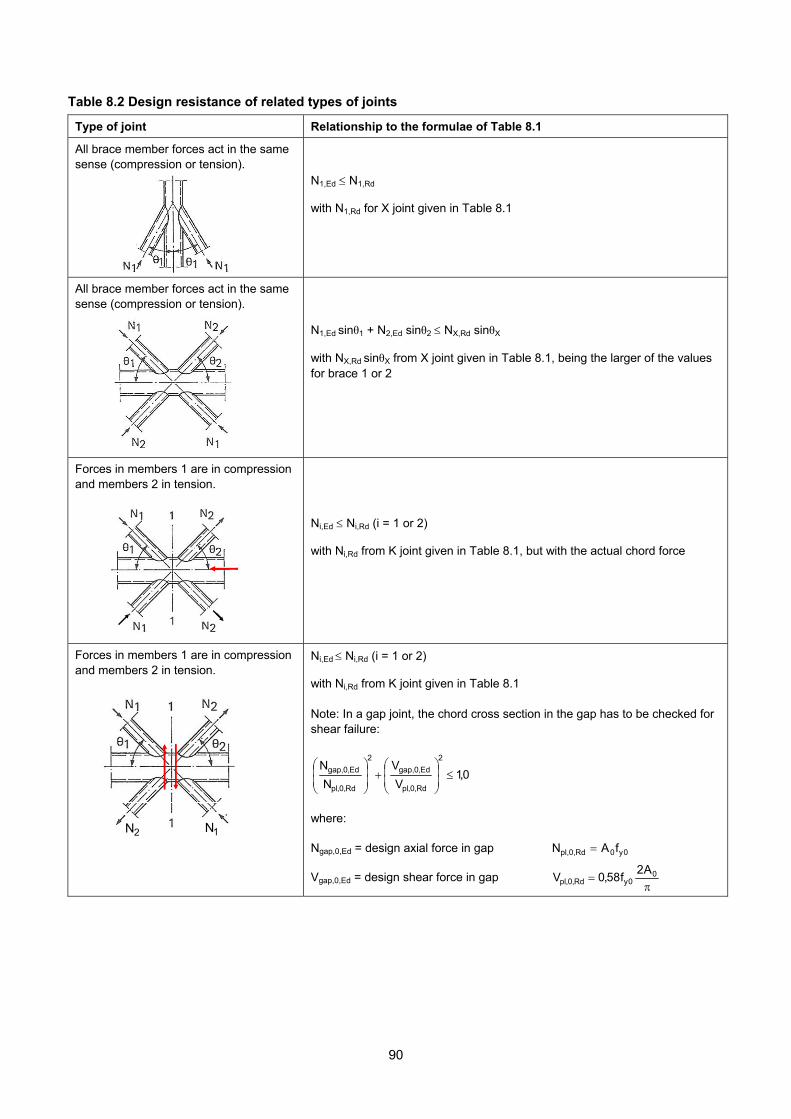
Table 8.2 Design resistance of related types of joints
Type of joint Relationship to the formulae of Table 8.1
All brace member forces act in the same sense (compression or tension).
N1,Ed N1,Rd with N1,Rd for X joint given in Table 8.1
All brace member forces act in the same sense (compression or tension).
N1,Ed sinθ1 + N2,Ed sinθ2 NX,Rd sinθX with NX,Rd sinθX from X joint given in Table 8.1, being the larger of the values for brace 1 or 2
Forces in members 1 are in compression and members 2 in tension.
Ni,Ed Ni,Rd (i = 1 or 2) with Ni,Rd from K joint given in Table 8.1, but with the actual chord force
Forces in members 1 are in compression and members 2 in tension.
Ni,Ed Ni,Rd (i = 1 or 2) with Ni,Rd from K joint given in Table 8.1 Note: In a gap joint, the chord cross section in the gap has to be checked for shear failure:
0,1V
V
N
N2
Rd,0,pl
Ed,0,gap
2
Rd,0,pl
Ed,0,gap
where: Ngap,0,Ed = design axial force in gap 0y0Rd,0,pl fAN
Vgap,0,Ed = design shear force in gap
00yRd,0,pl
A2f58,0V
N2 N1N2 N11N2N
90
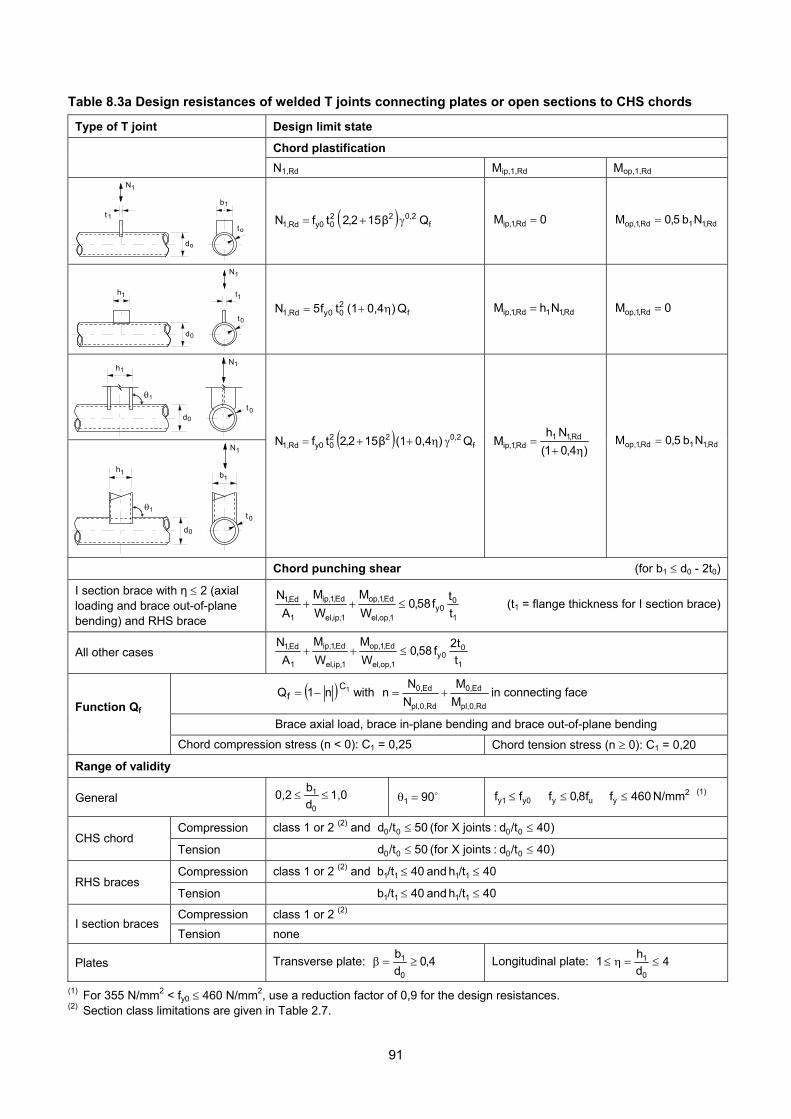
Table 8.3a Design resistances of welded T joints connecting plates or open sections to CHS chords
Type of T joint Design limit state
Chord plastification
N1,Rd Mip,1,Rd Mop,1,Rd
t 1
do
b1
to
N1
f0,22
2 0 y0Rd1, Q β152,2tf N 0M Rd,1,ip Rd,1 1Rd,1,op Nb 5,0M
h1
d0
1
t0
t
N1
f20 0yRd1, Q )0,4(1 tf5N Rd,1 1Rd,1,ip NhM 0M Rd,1,op
f 0,22
2 0 y0Rd1, Q )0,4(1 β152,2tf N
)4,01(
N hM Rd,11
Rd,1,ip
Rd,1 1Rd,1,op Nb 5,0M
Chord punching shear (for b1 d0 - 2t0)
I section brace with η 2 (axial loading and brace out-of-plane bending) and RHS brace 1
00y
1,op,el
Ed,1,op
1,ip,el
Ed,1,ip
1
Ed,1
t
tf58,0
W
M
W
M
A
N (t1 = flange thickness for I section brace)
All other cases 1
00y
1,op,el
Ed,1,op
1,ip,el
Ed,1,ip
1
Ed,1
t
t2f58,0
W
M
W
M
A
N
1C f n1Q with
Rdpl,0,
Ed0,
Rdpl,0,
Ed0,
M
M
N
Nn in connecting face
Brace axial load, brace in-plane bending and brace out-of-plane bending
Function Qf
Chord compression stress (n < 0): C1 = 0,25 Chord tension stress (n 0): C1 = 0,20
Range of validity
General 1,0d
b0,2
0
1 901 y0y1 ff (1) uy f8,0f 2y N/mm 460f
Compression class 1 or 2 (2) and )40/td:joints X (for 50/td 0000 CHS chord
Tension )40/td:joints X (for 50/td 0000
Compression class 1 or 2 (2) and 40/th and 40 /tb 1111 RHS braces
Tension 40/th and 40 /tb 1111
Compression class 1 or 2 (2) I section braces
Tension none
Plates Transverse plate: 4,0d
b
0
1 Longitudinal plate: 4d
h1
0
1
(1) For 355 N/mm2 < fy0 460 N/mm2, use a reduction factor of 0,9 for the design resistances. (2) Section class limitations are given in Table 2.7.
h1
d0
t 0
N1
1
h1
d0
t0
N1
b1
1
91
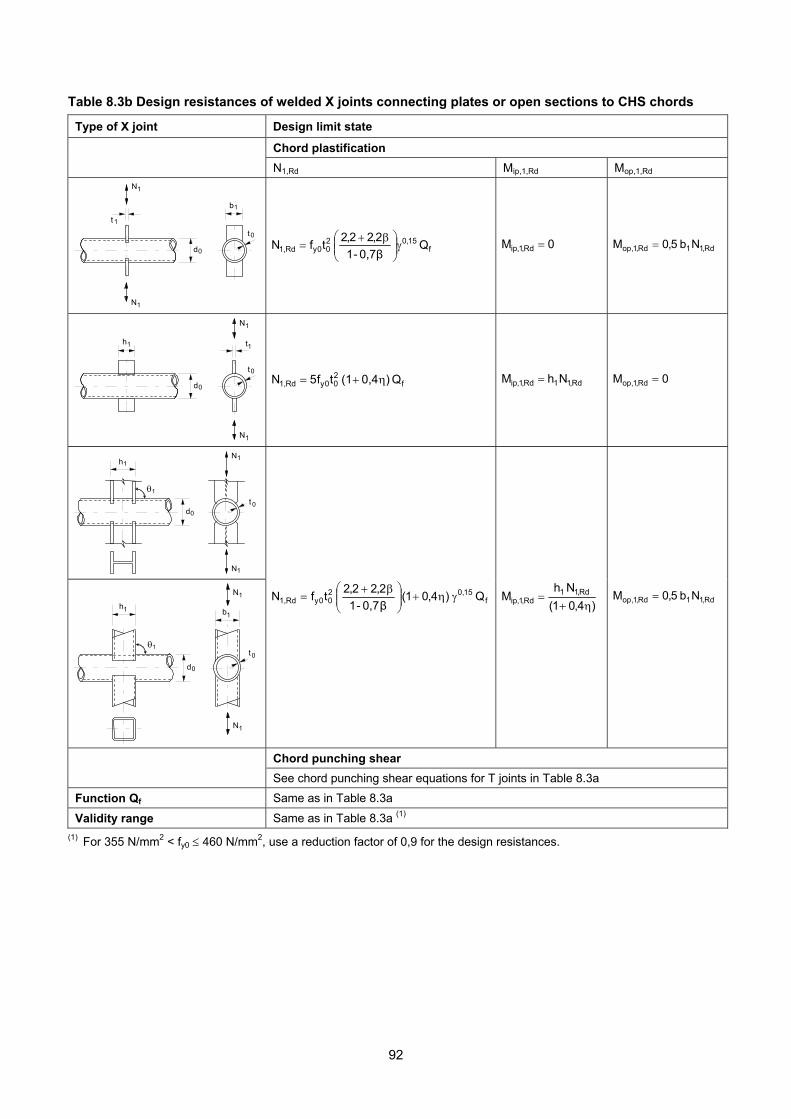
Table 8.3b Design resistances of welded X joints connecting plates or open sections to CHS chords
Type of X joint Design limit state
Chord plastification
N1,Rd Mip,1,Rd Mop,1,Rd
t 1
d0
b1
t0
N1
N1
f 15,0 2
00yRd1, Q0,7β-1
2,22,2 tfN
0M Rd,1,ip Rd,1 1Rd,1,op Nb 5,0M
h1
d0
1
t0
t
N1
N1
f200yRd1, Q )0,4(1 tf5N Rd,1 1Rd,1,ip NhM 0M Rd,1,op
h1
d0
t 0
N1
N1
1
f 15,0
2
00yRd1, Q )4,01(0,7β-1
2,22,2 tfN
)4,01(
N hM Rd,11
Rd,1,ip Rd,1 1Rd,1,op Nb 5,0M
Chord punching shear
See chord punching shear equations for T joints in Table 8.3a
Function Qf Same as in Table 8.3a
Validity range Same as in Table 8.3a (1)
h1
d0
t0
N1
b1
N1
1
(1) For 355 N/mm2 < fy0 460 N/mm2, use a reduction factor of 0,9 for the design resistances.
92
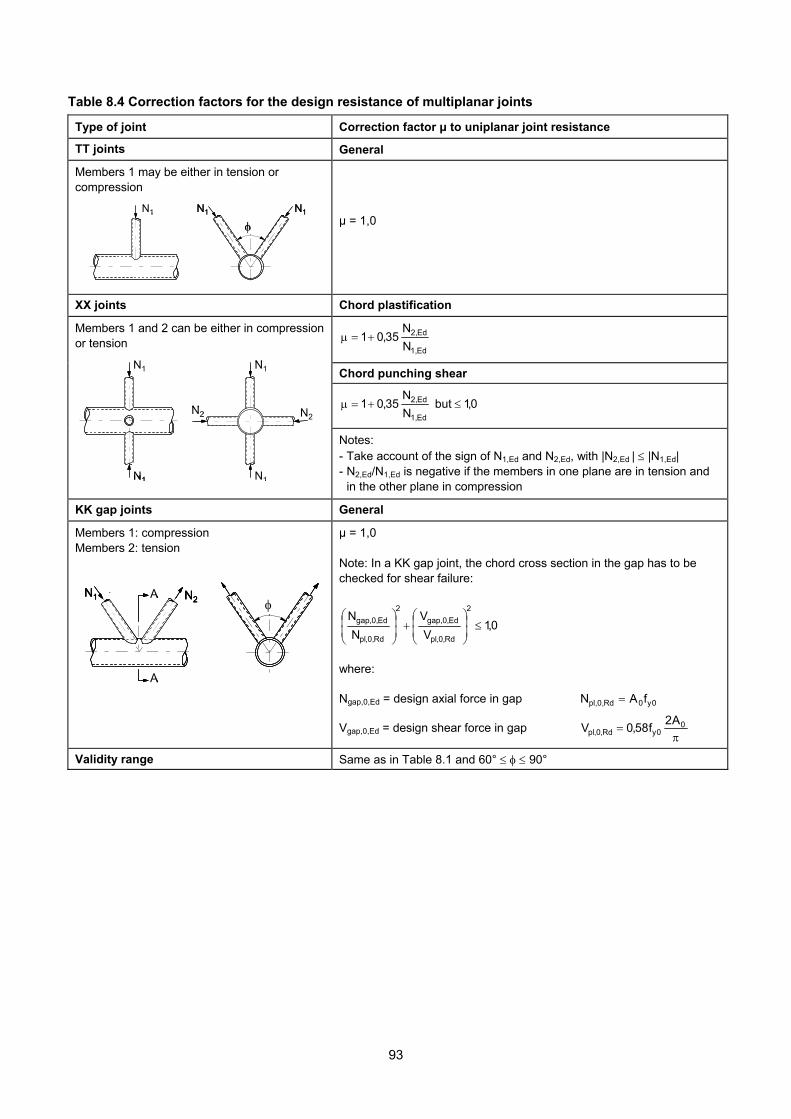
Table 8.4 Correction factors for the design resistance of multiplanar joints
Type of joint Correction factor μ to uniplanar joint resistance
TT joints General
Members 1 may be either in tension or compression
N 1 g tN1
N1 N1
N 1 g tN1
N1 N1
μ = 1,0
XX joints Chord plastification
Ed1,
Ed2,
N
N 35,01
Chord punching shear
0,1 but N
N 35,01
Ed1,
Ed2,
Members 1 and 2 can be either in compression or tension
N 1
N 1
N 1
N 1
N 2 N 2
N1
N2
N1
N2
N1
N1
N 1
N 1
N 1
N 1
N 2 N 2
N1
N2
N1
N2
N1
N1
Notes: - Take account of the sign of N1,Ed and N2,Ed, with |N2,Ed | |N1,Ed| - N2,Ed/N1,Ed is negative if the members in one plane are in tension and
in the other plane in compression
KK gap joints General
Members 1: compression Members 2: tension
N2N1
N 1 N 2
A
A
g t
A
A
N2N1
N 1 N 2
A
A
g t
A
A N2N1
N 1 N 2
A
A
g t
A
A
μ = 1,0 Note: In a KK gap joint, the chord cross section in the gap has to be checked for shear failure:
0,1V
V
N
N2
Rd,0,pl
Ed,0,gap
2
Rd,0,pl
Ed,0,gap
where: Ngap,0,Ed = design axial force in gap 0y0Rd,0,pl fAN
Vgap,0,Ed = design shear force in gap
00yRd,0,pl
A2f58,0V
Validity range Same as in Table 8.1 and 60° 90°
93
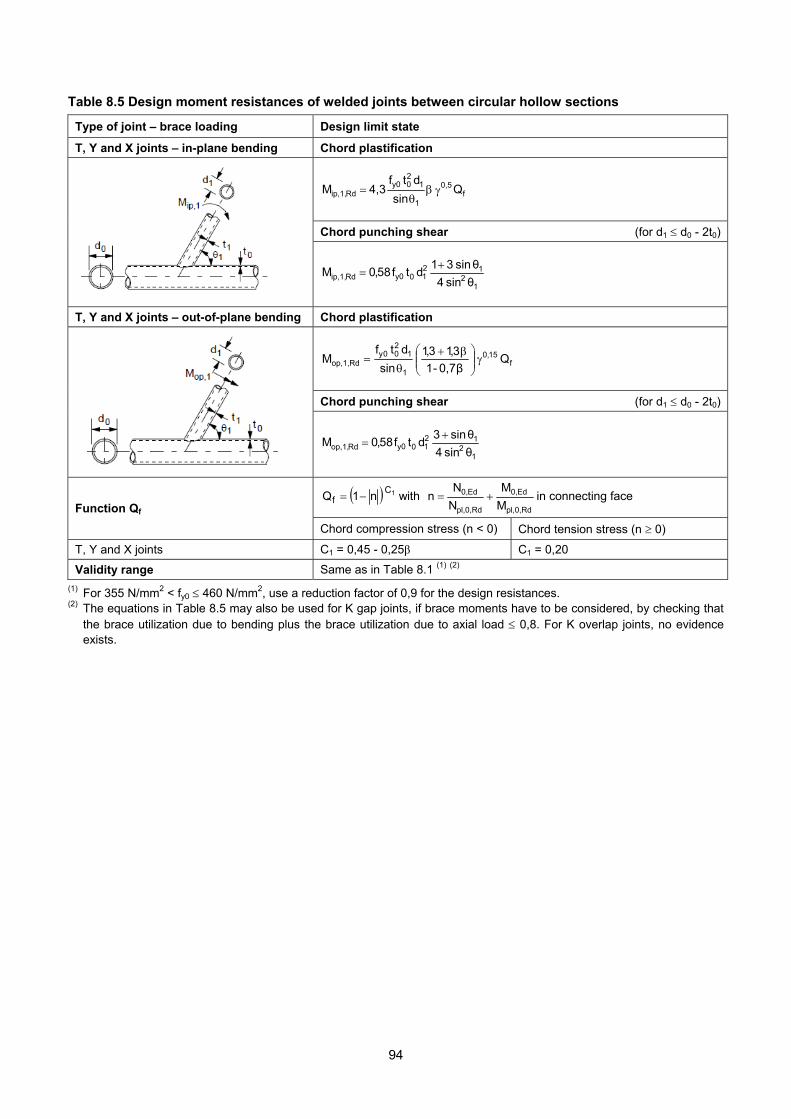
Table 8.5 Design moment resistances of welded joints between circular hollow sections
Type of joint – brace loading Design limit state
T, Y and X joints – in-plane bending Chord plastification
f0,5
1
12 0 y0
Rdip,1, Q sin
dtf4,3 M
Chord punching shear (for d1 d0 - 2t0)
1
212
1 0 y0 Rdip,1,θsin 4
θ sin 31 dtf58,0M
T, Y and X joints – out-of-plane bending Chord plastification
f 15,0
1
12 0 0y
Rdop,1, Q 0,7β-1
3,13,1
sin
dtfM
Chord punching shear (for d1 d0 - 2t0)
1
212
1 0 y0 Rdop,1,θsin 4
θ sin3 dtf58,0M
1C f n1Q with
Rdpl,0,
Ed0,
Rdpl,0,
Ed0,
M
M
N
Nn in connecting face
Function Qf
Chord compression stress (n < 0) Chord tension stress (n 0)
T, Y and X joints C1 = 0,45 - 0,25β C1 = 0,20
Validity range Same as in Table 8.1 (1) (2)
(1) For 355 N/mm2 < fy0 460 N/mm2, use a reduction factor of 0,9 for the design resistances. (2) The equations in Table 8.5 may also be used for K gap joints, if brace moments have to be considered, by checking that
the brace utilization due to bending plus the brace utilization due to axial load 0,8. For K overlap joints, no evidence exists.
94

Fig. 8.1 Example of a prefabricated connector (this
Nodus type is out of production)
Fig. 8.2 Joints with end pieces for bolted joints
Fig. 8.3 Welded CHS slotted gusset plate joints
95
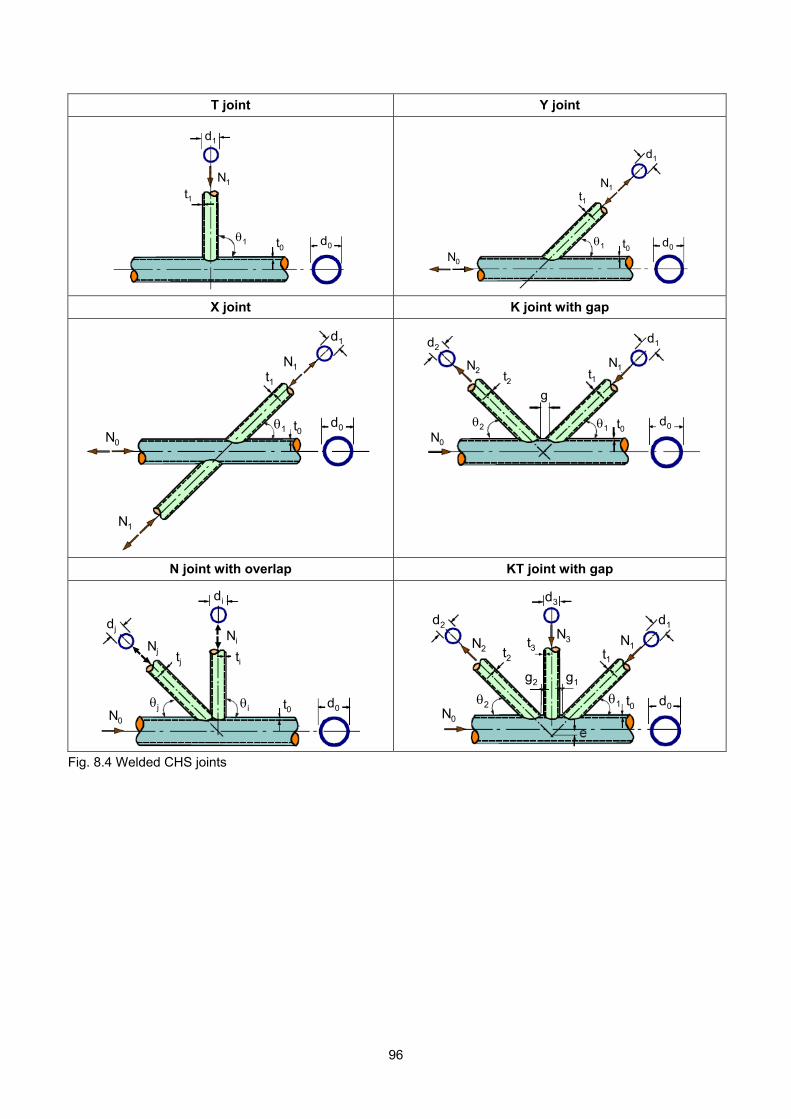
T joint Y joint
d1
t1
t0
N1
d01
d1
t1
t0
N1
d01
N1
t0 d0
N0
d1
t1
1
N1
t0 d0
N0
d1
t1
1
X joint K joint with gap
t0
N1
N0
N1
d0
d1
t1
1 t0
N1
N0
N1
d0
d1
t1
1
d0t0N0
N2
d2
t2
d1
t1N1
1
g
2 d0t0N0
N2
d2
t2
d1
t1N1
1
g
2
N joint with overlap KT joint with gap
ti
d0t0N0
di
Ni
tj
dj
i
Nj
j
ti
d0t0N0
di
Ni
tj
dj
i
Nj
j
d2
t2
d0t0N0
N3t3N2
12
d1
t1N1
d3
g2 g1
d2
t2
d0t0N0
N3t3N2
12
d1
t1N1
d3
g2 g1
Fig. 8.4 Welded CHS joints
96

(a) Brace failure (yielding, local buckling)
(e) Chord punching shear failure
(b) Weld failure
as (a) but failure in the weld
(f) Chord local buckling
(c) Lamellar tearing
see e.g. Fig. 7.6c
(g) Chord shear failure
(d) Chord plastification (face/wall, thus cross section)
oror
Fig. 8.5 Failure modes for joints between circular hollow sections
σ1,Ed
σjoint σjoint
N1
N1
σ1,Ed
σjoint σjoint
N1
N1 Fig. 8.6 Elastic stress distribution in an X joint
97

Be ≈ 2,5 to 3d0
11 sin
2
N
11 sin
2
N
N1
N1
c1d11
1 sin2
Ne
11
B2
sinN
Be ≈ 2,5 to 3d0
11 sin
2
N
11 sin
2
N
N1
N1
c1d11
1 sin2
Ne
11
B2
sinN
Fig. 8.7 Ring model
Fig. 8.8 Plastic hinges in the ring model at failure
N0
N1
Vp
1
N0
N1
Vp
1
Fig. 8.9 Punching shear model
98

N0
N2
12
Ngap,0
V
A
AA
A
N1
N0
N2
12
Ngap,0
V
A
AA
A
N1
Fig. 8.10 Chord shear model
p011gap,0
2
1 i
p0ii0
NcosNN
NcosNN
A
A
1
N1
Fig. 8.11 Chord load N0 and chord preload N0p
Fig. 8.12 Test rig for isolated joint tests
N0
N2
N0p
2
A
A
1
N1N2
2
N0pN0
99

N1/
(fy0
t 02 )
δ (mm)
= 0,60 2 = 40,0N1/
(fy0
t 02 )
N1/
(fy0
t 02 )
δ (mm)
= 0,60 2 = 40,0
Fig. 8.13 The effect of the element type on numerical results
0
2
4
6
8
0,0 0,2 0,4 0,6 0,8 1,0
f(N
1u)
X jo
ints
7,01
1
Fig. 8.14 Comparison of experiments with the mean joint resistance function (X joints)
100
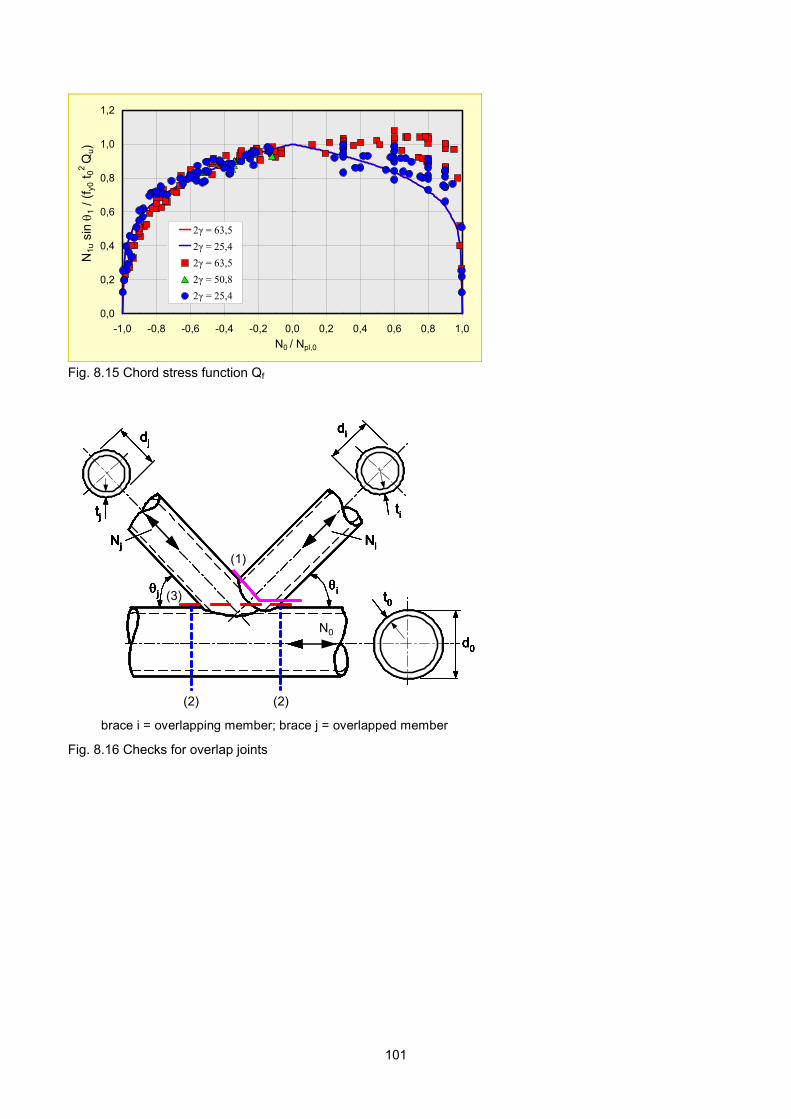
0,0
0,2
0,4
0,6
0,8
1,0
1,2
-1,0 -0,8 -0,6 -0,4 -0,2 0,0 0,2 0,4 0,6 0,8 1,0
2γ = 63,5
2γ = 25,4
2γ = 63,5
2γ = 50,8
2γ = 25,4
N1u
sin
1 /
(f y
0 t 0
2 Q
u)
N0 / Npl,0
Fig. 8.15 Chord stress function Qf
brace i = overlapping member; brace j = overlapped member
di
d0
dj
ti
t0
Ni
Nop
Nj
No
ij
4.8
4.111
4.10
4.1
4.10
tj
brace i =overlapping member; brace j = overlapped member
brace i = overlapping member; brace j = overlapped member
di
d0
dj
ti
t0
Ni
Nop
Nj
No
ij
4.8
4.10
4.1
4.10
tj
4.111
brace i = overlapping member; brace j = overlapped member
(2) (2)
(1)
(3)
N0
brace i = overlapping member; brace j = overlapped member
di
d0
dj
ti
t0
Ni
Nop
Nj
No
ij
4.8
4.10
4.1
4.10
tj
4.111
brace i =overlapping member; brace j = overlapped member
brace i = overlapping member; brace j = overlapped member
di
d0
dj
ti
t0
Ni
Nop
Nj
No
ij
4.8
4.10
4.1
4.10
tj
4.111
brace i = overlapping member; brace j = overlapped member
(2) (2)
(1)
(3)
di
d0
dj
ti
t0
Ni
Nop
Nj
No
ij
4.8
4.10
4.1
4.10
tj
4.111
brace i = overlapping member; brace j = overlapped member
di
d0
dj
ti
t0
Ni
Nop
Nj
No
ij
4.8
4.10
4.1
4.10
tj
4.111
brace i = overlapping member; brace j = overlapped memberbrace i =overlapping member; brace j = overlapped member
di
d0
dj
ti
t0
Ni
Nop
Nj
No
ij
4.8
4.10
4.1
4.10
tj
4.111
brace i = overlapping member; brace j = overlapped member
(1)
(3)
N0
(2) (2)
brace i = overlapping member; brace j = overlapped member
Fig. 8.16 Checks for overlap joints
101

T joint efficiency
0,0
0,1
0,2
0,3
0,4
0,5
0,6
0,7
0,8
0,9
1,0
0 0,1 0,2 0,3 0,4 0,5 0,6 0,7 0,8 0,9 1
effc
ien
cy C
T
1
f
1 1y
0 0yT
1y 1
Rd,1
sin
Q
tf
tf C
fA
N
X joint efficiency
0,0
0,1
0,2
0,3
0,4
0,5
0,6
0,7
0,8
0,9
1,0
0 0,1 0,2 0,3 0,4 0,5 0,6 0,7 0,8 0,9 1
effc
ien
cy C
X
1
f
1 1y
0 0yX
1y 1
Rd,1
sin
Q
tf
tf C
fA
N
Fig. 8.17 Design charts for CHS T and Y joints
Fig. 8.18 Design charts for CHS X joints
1
f
1 1y
0 0yK
1y 1
*1
sin
Q
tf
tf C
fA
N
K gap joint efficiency g'=1
0,0
0,1
0,2
0,3
0,4
0,5
0,6
0,7
0,8
0,9
1,0
0 0,1 0,2 0,3 0,4 0,5 0,6 0,7 0,8 0,9 1
effc
ien
cy C
K
i
21
i
f
i yi
0 0yK
yi i
Rd,i
d2
dd
sin
Q
tf
tf C
fA
N
1
f
1 1y
0 0yK
1y 1
*1
sin
Q
tf
tf C
fA
N
K gap joint efficiency g'=2
0,0
0,1
0,2
0,3
0,4
0,5
0,6
0,7
0,8
0,9
1,0
0 0,1 0,2 0,3 0,4 0,5 0,6 0,7 0,8 0,9 1
effc
ien
cy C
K
i
21
i
f
i yi
0 0yK
yi i
Rd,i
d2
dd
sin
Q
tf
tf C
fA
N
Fig. 8.19a Design charts for CHS K joints with gap (g’ = g/t0 = 1)
Fig. 8.19b Design charts for CHS K joints with gap (g’ = g/t0 = 2)
1
f
1 1y
0 0yK
1y 1
*1
sin
Q
tf
tf C
fA
N
K gap joint efficiency g'=5
0,0
0,1
0,2
0,3
0,4
0,5
0,6
0,7
0,8
0,9
1,0
0 0,1 0,2 0,3 0,4 0,5 0,6 0,7 0,8 0,9 1
effc
ien
cy C
K
i
21
i
f
i yi
0 0yK
yi i
Rd,i
d2
dd
sin
Q
tf
tf C
fA
N
1
f
1 1y
0 0yK
1y 1
*1
sin
Q
tf
tf C
fA
N
K gap joint efficiency g'=10
0,0
0,1
0,2
0,3
0,4
0,5
0,6
0,7
0,8
0,9
1,0
0 0,1 0,2 0,3 0,4 0,5 0,6 0,7 0,8 0,9 1
effc
ien
cy C
K
i
21
i
f
i yi
0 0yK
yi i
Rd,i
d2
dd
sin
Q
tf
tf C
fA
N
Fig. 8.19c Design charts for CHS K joints with gap (g’ = g/t0 = 5)
Fig. 8.19d Design chart for CHS K joints with gap (g’ = g/t0 = 10)
102
9. WELDED JOINTS BETWEEN RECTANGULAR HOLLOW SECTIONS
9.1 INTRODUCTION The most economical and common way to connect rectangular hollow sections is by direct connection without any intersecting plates or gussets, as shown in Fig. 9.1. This also gives the most efficient way for protection and maintenance. Joints between rectangular hollow sections can be easily made, since the connecting members have to be provided with straight end cuts only. Although the fabrication is simple, the load transfer is more complex due to the non-uniform stiffness distribution in the joints. Due to the flat sides, the difference in stiffness at the side and at the centre of a face is even greater than for circular hollow sections. The general philosophy to identify the various failure modes and to observe the load transfer has been described in Chapter 7, but will be discussed here in more detail for the joints between rectangular and square hollow sections. Most failure modes can be related to analytical models to study the impact of the various influencing parameters. Based on the analytical models and the tests carried out, design rules have been established.
9.2 MODES OF FAILURE Similar to circular hollow section joints, the ultimate load capacity is based on the maximum in the load deformation diagram (if the chord deformation is less than 0,03b0) or the load at a deformation of 0,03b0 of the chord. As already indicated in Chapter 7 and shown in Fig. 9.2, the following modes of failure can occur: - (Local) brace failure (cracking or local buckling) - Weld failure - Lamellar tearing - Chord face plastification - Chord punching shear failure - Chord side wall yielding or buckling - Chord local buckling - Chord shear failure Similar to joints between circular hollow sections, to
avoid weld failure, the welds should be stronger than the connected braces and the throat thickness should satisfy the same requirements as given in Section 6.5.2. Prequalified full penetration welds can always be considered to be stronger than the connected brace members. Partial penetration plus fillet, or fillet welds alone, can also usually provide a weld connection as strong as the connected braces. Also here, the steel should not be susceptible to lamellar tearing. Especially for larger thicknesses (t > 25 mm), a TTP quality with a low sulphur content should be used for the chords. In the design recommendations the width-to-wall thickness ratios b/t have been limited to avoid local buckling and/or to limit deformations. As a result, the following failure modes still have to be considered in design: - Local brace failure (yielding, local buckling) - Chord face plastification - Chord punching shear - Chord side wall failure - Chord shear failure Due to the fact that rectangular hollow sections can be connected with various orientations and in various combinations, several failure modes have to be considered, which makes the checking procedure more complicated. In the case of joints between square hollow sections and within a smaller validity range, the failure modes to be checked can be limited to one or two. Local brace failure generally occurs for joints with relatively thin walled braces and is a general failure mode for overlap joints. Chord face plastification is the most common type of failure for T, Y, X and K and N gap joints with width ratios β < 0,85. Chord punching shear may occur in joints with relatively low or high β ratios. However, to allow shear of the chord face, the brace width bi should satisfy: bi < b0 - 2 t0 - 2(1,4a) where a is the weld throat thickness. Chord side wall failure is a common failure mode for T, Y and X joints with a β ratio close or equal to 1,0.
103
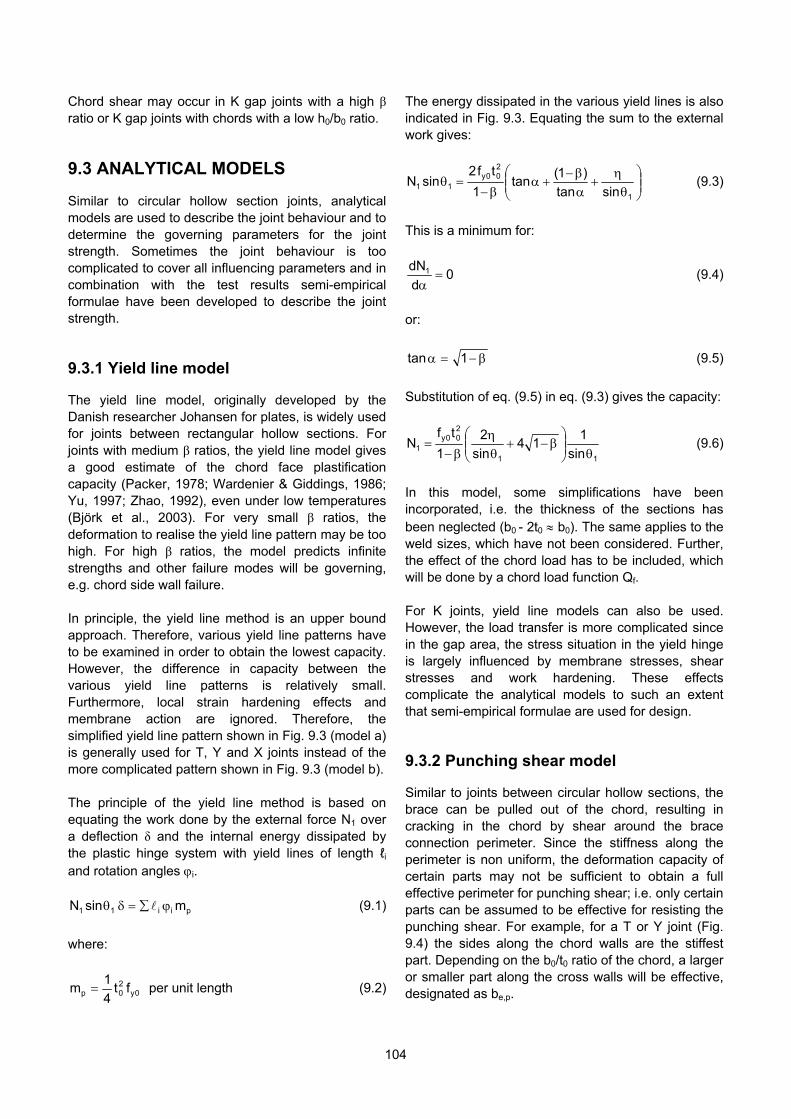
Chord shear may occur in K gap joints with a high β ratio or K gap joints with chords with a low h0/b0 ratio.
9.3 ANALYTICAL MODELS Similar to circular hollow section joints, analytical models are used to describe the joint behaviour and to determine the governing parameters for the joint strength. Sometimes the joint behaviour is too complicated to cover all influencing parameters and in combination with the test results semi-empirical formulae have been developed to describe the joint strength. 9.3.1 Yield line model The yield line model, originally developed by the Danish researcher Johansen for plates, is widely used for joints between rectangular hollow sections. For joints with medium β ratios, the yield line model gives a good estimate of the chord face plastification capacity (Packer, 1978; Wardenier & Giddings, 1986; Yu, 1997; Zhao, 1992), even under low temperatures (Björk et al., 2003). For very small β ratios, the deformation to realise the yield line pattern may be too high. For high β ratios, the model predicts infinite strengths and other failure modes will be governing, e.g. chord side wall failure. In principle, the yield line method is an upper bound approach. Therefore, various yield line patterns have to be examined in order to obtain the lowest capacity. However, the difference in capacity between the various yield line patterns is relatively small. Furthermore, local strain hardening effects and membrane action are ignored. Therefore, the simplified yield line pattern shown in Fig. 9.3 (model a) is generally used for T, Y and X joints instead of the more complicated pattern shown in Fig. 9.3 (model b). The principle of the yield line method is based on equating the work done by the external force N1 over a deflection δ and the internal energy dissipated by the plastic hinge system with yield lines of length ℓi and rotation angles i.
p i i11 m sinN (9.1)
where:
0y2 0p ft
4
1m per unit length (9.2)
The energy dissipated in the various yield lines is also indicated in Fig. 9.3. Equating the sum to the external work gives:
1
200y
11 sintan
)1(tan
1
tf2sinN (9.3)
This is a minimum for:
0d
dN1
(9.4)
or:
1tan (9.5)
Substitution of eq. (9.5) in eq. (9.3) gives the capacity:
11
200y
1 sin
114
sin
2
1
tfN
(9.6)
In this model, some simplifications have been incorporated, i.e. the thickness of the sections has been neglected (b0 - 2t0 b0). The same applies to the weld sizes, which have not been considered. Further, the effect of the chord load has to be included, which will be done by a chord load function Qf. For K joints, yield line models can also be used. However, the load transfer is more complicated since in the gap area, the stress situation in the yield hinge is largely influenced by membrane stresses, shear stresses and work hardening. These effects complicate the analytical models to such an extent that semi-empirical formulae are used for design. 9.3.2 Punching shear model Similar to joints between circular hollow sections, the brace can be pulled out of the chord, resulting in cracking in the chord by shear around the brace connection perimeter. Since the stiffness along the perimeter is non uniform, the deformation capacity of certain parts may not be sufficient to obtain a full effective perimeter for punching shear; i.e. only certain parts can be assumed to be effective for resisting the punching shear. For example, for a T or Y joint (Fig. 9.4) the sides along the chord walls are the stiffest part. Depending on the b0/t0 ratio of the chord, a larger or smaller part along the cross walls will be effective, designated as be,p.
104
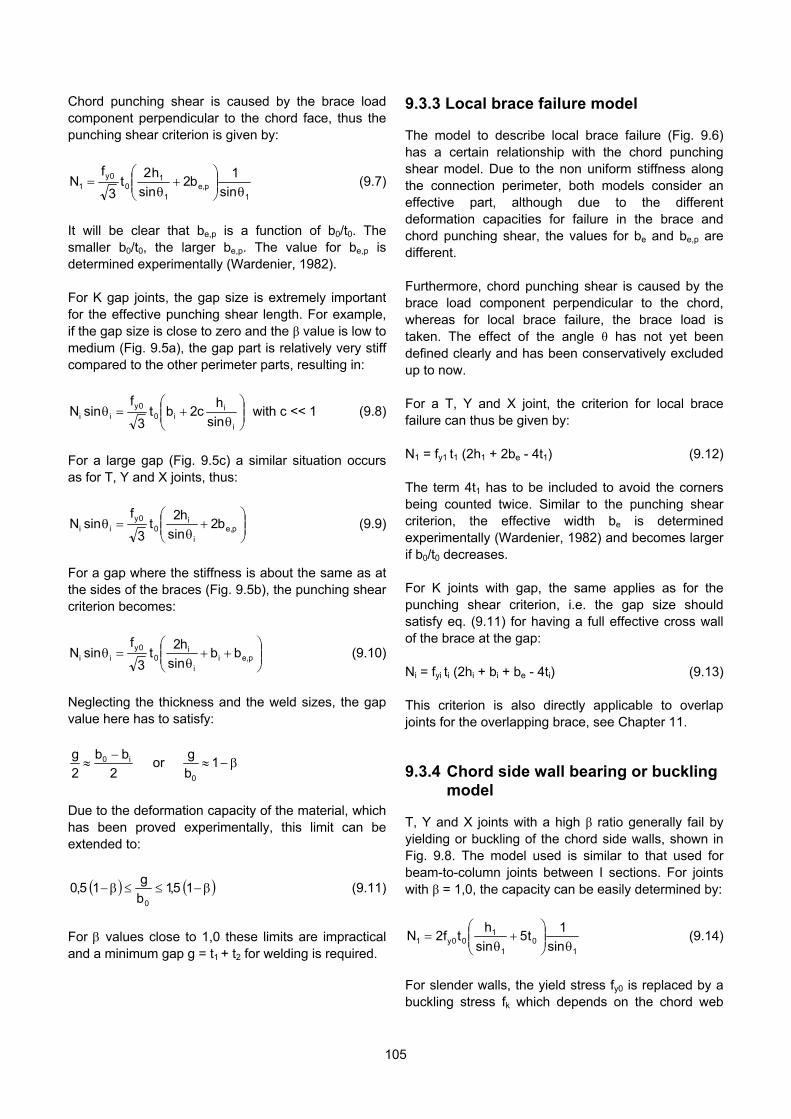
Chord punching shear is caused by the brace load component perpendicular to the chord face, thus the punching shear criterion is given by:
1p,e
1
1
00y
1 sin
1b2
sin
h2t
3
fN
(9.7)
It will be clear that be,p is a function of b0/t0. The smaller b0/t0, the larger be,p. The value for be,p is determined experimentally (Wardenier, 1982). For K gap joints, the gap size is extremely important for the effective punching shear length. For example, if the gap size is close to zero and the β value is low to medium (Fig. 9.5a), the gap part is relatively very stiff compared to the other perimeter parts, resulting in:
i
ii0
0yii sin
hc2bt
3
fsinN with c << 1 (9.8)
For a large gap (Fig. 9.5c) a similar situation occurs as for T, Y and X joints, thus:
p,e
i
i0
0yii b2
sin
h2t
3
fsinN (9.9)
For a gap where the stiffness is about the same as at the sides of the braces (Fig. 9.5b), the punching shear criterion becomes:
p,ei
i
i0
0yii bb
sin
h2t
3
fsinN (9.10)
Neglecting the thickness and the weld sizes, the gap value here has to satisfy:
2
bb
2
g i0 or 1b
g
0
Due to the deformation capacity of the material, which has been proved experimentally, this limit can be extended to:
1 5,1b
g1 5,0
0
(9.11)
For values close to 1,0 these limits are impractical and a minimum gap g = t1 + t2 for welding is required.
9.3.3 Local brace failure model The model to describe local brace failure (Fig. 9.6) has a certain relationship with the chord punching shear model. Due to the non uniform stiffness along the connection perimeter, both models consider an effective part, although due to the different deformation capacities for failure in the brace and chord punching shear, the values for be and be,p are different. Furthermore, chord punching shear is caused by the brace load component perpendicular to the chord, whereas for local brace failure, the brace load is taken. The effect of the angle θ has not yet been defined clearly and has been conservatively excluded up to now. For a T, Y and X joint, the criterion for local brace failure can thus be given by: N1 = fy1 t1 (2h1 + 2be - 4t1) (9.12) The term 4t1 has to be included to avoid the corners being counted twice. Similar to the punching shear criterion, the effective width be is determined experimentally (Wardenier, 1982) and becomes larger if b0/t0 decreases. For K joints with gap, the same applies as for the punching shear criterion, i.e. the gap size should satisfy eq. (9.11) for having a full effective cross wall of the brace at the gap: Ni = fyi ti (2hi + bi + be - 4ti) (9.13) This criterion is also directly applicable to overlap joints for the overlapping brace, see Chapter 11. 9.3.4 Chord side wall bearing or buckling
model T, Y and X joints with a high β ratio generally fail by yielding or buckling of the chord side walls, shown in Fig. 9.8. The model used is similar to that used for beam-to-column joints between I sections. For joints with β = 1,0, the capacity can be easily determined by:
10
1
100y1 sin
1t5
sin
htf2N
(9.14)
For slender walls, the yield stress fy0 is replaced by a buckling stress fk which depends on the chord web
105
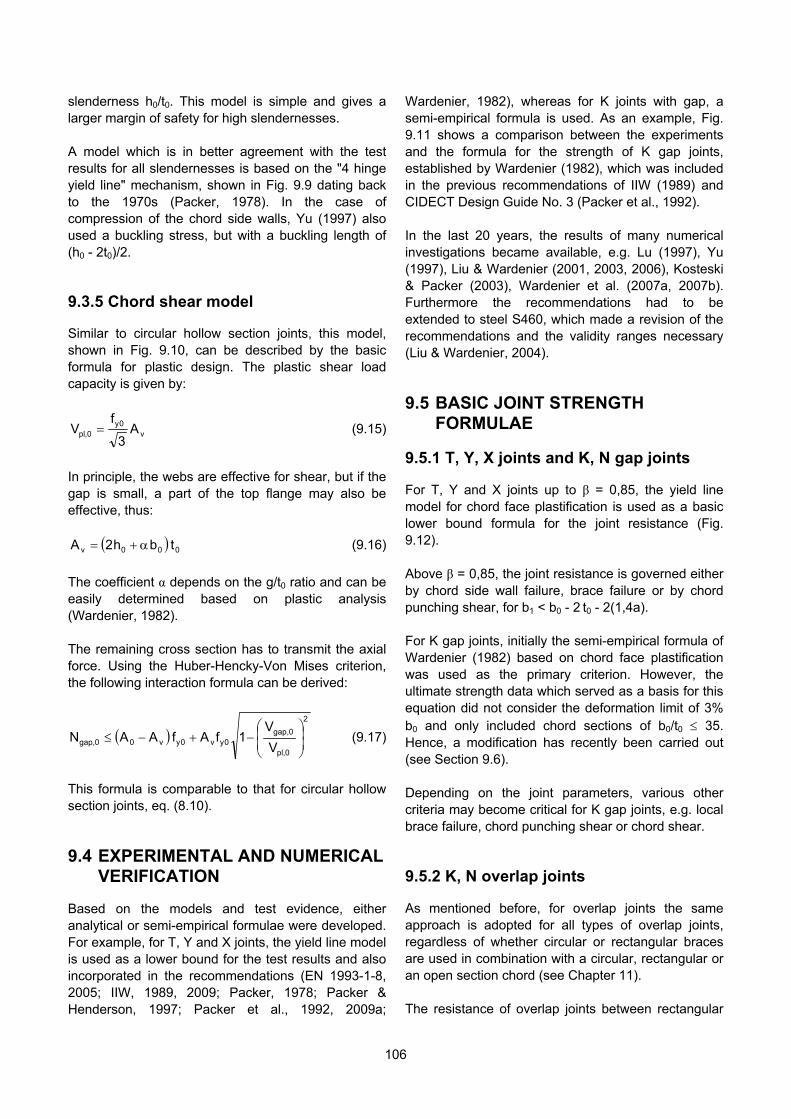
slenderness h0/t0. This model is simple and gives a larger margin of safety for high slendernesses. A model which is in better agreement with the test results for all slendernesses is based on the "4 hinge yield line" mechanism, shown in Fig. 9.9 dating back to the 1970s (Packer, 1978). In the case of compression of the chord side walls, Yu (1997) also used a buckling stress, but with a buckling length of (h0 - 2t0)/2. 9.3.5 Chord shear model Similar to circular hollow section joints, this model, shown in Fig. 9.10, can be described by the basic formula for plastic design. The plastic shear load capacity is given by:
v0y
0,pl A3
fV (9.15)
In principle, the webs are effective for shear, but if the gap is small, a part of the top flange may also be effective, thus:
00 0 v t bh2A (9.16)
The coefficient α depends on the g/t0 ratio and can be easily determined based on plastic analysis (Wardenier, 1982). The remaining cross section has to transmit the axial force. Using the Huber-Hencky-Von Mises criterion, the following interaction formula can be derived:
2
0,pl
0,gap0yv0yv00,gap V
V1fAf AAN
(9.17)
This formula is comparable to that for circular hollow section joints, eq. (8.10).
9.4 EXPERIMENTAL AND NUMERICAL VERIFICATION
Based on the models and test evidence, either analytical or semi-empirical formulae were developed. For example, for T, Y and X joints, the yield line model is used as a lower bound for the test results and also incorporated in the recommendations (EN 1993-1-8, 2005; IIW, 1989, 2009; Packer, 1978; Packer & Henderson, 1997; Packer et al., 1992, 2009a;
Wardenier, 1982), whereas for K joints with gap, a semi-empirical formula is used. As an example, Fig. 9.11 shows a comparison between the experiments and the formula for the strength of K gap joints, established by Wardenier (1982), which was included in the previous recommendations of IIW (1989) and CIDECT Design Guide No. 3 (Packer et al., 1992). In the last 20 years, the results of many numerical investigations became available, e.g. Lu (1997), Yu (1997), Liu & Wardenier (2001, 2003, 2006), Kosteski & Packer (2003), Wardenier et al. (2007a, 2007b). Furthermore the recommendations had to be extended to steel S460, which made a revision of the recommendations and the validity ranges necessary (Liu & Wardenier, 2004).
9.5 BASIC JOINT STRENGTH FORMULAE
9.5.1 T, Y, X joints and K, N gap joints For T, Y and X joints up to β = 0,85, the yield line model for chord face plastification is used as a basic lower bound formula for the joint resistance (Fig. 9.12). Above β = 0,85, the joint resistance is governed either by chord side wall failure, brace failure or by chord punching shear, for b1 < b0 - 2 t0 - 2(1,4a). For K gap joints, initially the semi-empirical formula of Wardenier (1982) based on chord face plastification was used as the primary criterion. However, the ultimate strength data which served as a basis for this equation did not consider the deformation limit of 3% b0 and only included chord sections of b0/t0 35. Hence, a modification has recently been carried out (see Section 9.6). Depending on the joint parameters, various other criteria may become critical for K gap joints, e.g. local brace failure, chord punching shear or chord shear. 9.5.2 K, N overlap joints As mentioned before, for overlap joints the same approach is adopted for all types of overlap joints, regardless of whether circular or rectangular braces are used in combination with a circular, rectangular or an open section chord (see Chapter 11). The resistance of overlap joints between rectangular
106

hollow sections with 25% Ov 100% overlap is based on the following criteria (Chen et al., 2005; Liu et al., 2005; Wardenier & Choo, 2006): (1) Local failure of the overlapping brace (2) Local chord member yielding at the joint location
based on interaction between axial load and bending moment
(3) Shear of the connection between the brace(s) and the chord
Fig. 9.13 shows the overlap joint configuration with the cross sections to be examined for these criteria. For K and N overlap joints, the subscript i is used to denote the overlapping brace member, while the subscript j refers to the overlapped brace member. Local failure of the overlapping brace (criterion 1) should always be checked, while shear between the braces and the chord (criterion 3) may only become critical for larger overlaps, i.e. larger than 60% or 80%, depending on whether or not the hidden toe location of the overlapped brace is welded to the chord. The check for local chord member yielding (criterion 2) is, in principle, a member check and may become critical for larger overlaps and/or larger β ratios.
Joints with overlaps between 0% and 25% should be avoided because in those cases, the stiffness of the connection between the overlapping brace and the overlapped brace is much larger than that of the overlapping brace to chord connection, which may lead to premature cracking and lower capacities (Wardenier, 2007). More detailed information regarding the design equations for overlap joints is given in Chapter 11.
9.6 EVALUATION TO DESIGN RULES In principle, the evaluation to design rules, e.g. for K joints with gap, is similar to that described for joints between circular hollow sections. For T, Y and X joints, a lower bound analytical yield line criterion is used for chord face plastification. Therefore, no statistical evaluation has been carried out. Considering Lu’s deformation limit of 3% b0 (Lu et al., 1994), and extending the validity range to class 1 and 2 sections with b0/t0 40 and h0/t0 40 instead of an upper limit of 35, for K gap joints, the functions for β and γ needed to be modified in such a way that the
capacity for large b0/t0 ratios would be reduced. Changing the original function 8,9βγ0,5, used in the previous editions of IIW (1989) and CIDECT Design Guide No. 3 (Packer et al., 1992), into 14βγ0,3 gives the same capacity for b0/t0 = 20 and a reduction for large b0/t0 ratios. The new expression, included in IIW (2009) and CIDECT Design Guide No. 3 (Packer et al., 2009a) is a reasonable compromise between covering the data determined with the 3% b0 deformation limit, extension of the validity range and backup by previous analyses (Packer & Haleem, 1981; Wardenier, 1982). Since in joints of rectangular hollow sections the sections can have different orientations and depth-to-width ratios, many configurations are possible, resulting in a large number of failure modes and related strength formulae, see Table 9.1. However, with a smaller range of validity, the design formulae for joints between square hollow sections can be reduced to such an extent that only a single check has to be carried out (see Table 9.2). Fleischer & Puthli (2008) initiated research on how to deal with RHS joints with gaps and/or chord width-to-thickness ratios outside the current range of validity.
9.7 OTHER TYPES OF JOINTS OR OTHER LOAD CONDITIONS
9.7.1 Related types of joints As for circular hollow section joints, various joint configurations exist for which the resistance can be directly related to the basic types presented in Tables 9.1 and 9.2. Table 9.3 gives the design resistance for some special types of RHS uniplanar joints with braces directly welded to the chord; notice the similarity with Table 8.2 for circular hollow section joints. 9.7.2 Joints between circular braces and
a rectangular chord As far as chord face plastification is concerned, the strength of a joint with a circular hollow section brace with diameter di is about π/4 times that of a joint with a square hollow section brace with a width bi = di, see Fig. 9.14 (Wardenier, 1982; Packer et al., 2007). As a consequence, the same formulae can be used as for square hollow section joints, but the resistances have
107

to be multiplied by π/4. This also means that the joints have the same efficiency, i.e. the joint strength divided by the squash load of the brace. 9.7.3 Joints between plates or I sections
and RHS chords Joints between plates or I sections and RHS chords are approached in a similar manner as the rectangular hollow section joints and in principle the same modes of failure have to be considered. Within the scope of this book, these joints are not further discussed, but reference is made to Lu (1997), Packer et al. (2009a) and Chapter 12. The design resistances are given in Table 9.4. Tee joints to the ends of RHS members When an axial force is applied to an RHS member, via a welded Tee joint as shown in Fig. 9.15, the capacity is determined by local failure of the RHS walls or the Tee web. For a commonly used distribution slope of 2.5:1 from each face of the Tee web (Kitipornchai & Traves, 1989), the dispersed load width is (5tp + tw). A conservative assumption is to use this effective width at two sides of the RHS member. Thus, the resistance of the RHS can be computed by summing the contributions of the parts of the RHS cross sectional area into which the load is distributed:
1y 1pw 1 y1 Rd,1 fA)5t(ttf2N (9.18)
A similar load dispersion can be assumed for the capacity of the Tee web. If the Tee web has the same width as the width of the cap plate, i.e. (h1 + 2s), the capacity of the Tee web is:
)s5t,2(ttf2N p1w yw Rd,1 (9.19a)
)5t(ttf2 p1w yw (9.19b)
In eqs. (9.18) and (9.19), the size of any weld legs to the Tee web has been conservatively ignored. Gusset plate-to-slotted RHS joints Single gusset plates, slotted into the ends of hollow section members and concentrically aligned with the axis of the member, as shown in Fig. 9.16, are commonly found in diagonal brace members of steel framed buildings. As a consequence of only part of the RHS cross section being connected, an uneven stress distribution
around the RHS perimeter occurs during load transfer at the connection. This phenomenon, known as shear lag, is illustrated in Fig. 9.16. The possible failure modes for the gusset plate-to-slotted RHS joints loaded in tension are circumferential failure of the RHS and tear out or "block shear" failure of the RHS. Shear lag is principally influenced by the weld length, Lw in relation to the dimension w which is the distance between the welds measured from plate face-to-plate face, around the perimeter of the RHS. For long weld lengths, shear lag effects become negligible, while for short weld lengths, tear out governs over circumferential fracture of the RHS. However, if Lw = 1,65b for square braces and 1,3d for circular braces, it can be assumed that the capacity is equal to that of the connected hollow section or plate. Detailed design rules are given by Packer et al. (2009a). 9.7.4 Multiplanar joints Compared to uniplanar joints, multiplanar joints have a geometric effect and a loading effect to be considered. It is plausible that a multiplanar joint has a geometric influence only if the β value is large, because then the chord side wall is stiffened, see e.g. Fig. 9.17 for an XX joint. For multiplanar joints of rectangular hollow sections, the tendency of the loading effect is similar but less pronounced compared to that of joints of circular hollow sections, see Fig. 9.18. Extensive analytical and numerical research by Liu & Wardenier (2001, 2003) showed that the differences in capacity between uniplanar K gap and multiplanar KK gap joints are caused by the larger chord force acting in multiplanar joints. Based on this work, the following design recommendations are given for multiplanar KK joints (see Table 9.5). Multiplanar KK gap joints (Fig. 9.19) - For chord face plastification (small or medium β),
the strength of the joint can be based on the joint resistance formulae for uniplanar joints given in Tables 9.1 and 9.2, and no further multiplanar correction is necessary, provided that the actual, total chord force is used for the chord stress function Qf.
108

- For large ratios or rectangular chord sections, the strength of a KK gap joint is governed by chord shear and chord axial force interaction, presented in Table 9.5. The KK gap joint (with = 90) is
subjected to a shear force of Edgap,0, V20,5 in each
plane, where Vgap,0,Ed is the total "vertical" shear force. The shear force in each plane is resisted by the two walls of the RHS chord.
109
Multiplanar overlap KK joints - For multiplanar overlap KK joints, the strength of the
joint is similar to that for uniplanar overlap joints given in Chapter 11. Thus, compared to the previous IIW (1989) recommendations, a brace shear criterion and a local chord yielding criterion have been added.
9.7.5 Joints loaded by brace bending
moments The design resistances for joints loaded by brace bending moments are derived in a similar way to that for axially loaded joints. To simplify the design, limitations are also given here for the range of validity to reduce the criteria to be checked. For Vierendeel girders it is recommended to choose joints with = 1,0 to provide sufficient stiffness and strength. The design resistance formulae are based on the analyses of Wardenier (1982), Mang et al. (1983), Yu (1997) and Packer et al. (2009a), and are given in Table 9.6. 9.7.6 Interaction between axial loads and
bending moments For joints with brace members subjected to combined loading, the effect of axial load on the joint moment capacity depends on the critical failure mode, and hence a complex set of interactions exists. Consequently, it is conservatively proposed to use a linear interaction relationship:
0,1M
M
N
N
Rd,1,ip
Ed,1,ip
Rd,1
Ed,1 (9.20)
9.8 DESIGN CHARTS In Figs. 9.20 to 9.23, the joint resistances are
expressed in terms of the efficiency of the connected braces in a similar way to that for circular hollow section joints, i.e. the joint resistance is given as a fraction of the yield capacity Ai fyi of the connected brace. This results in the following efficiency formula:
i
f
i yi
00ye
yi i
Rd,i
sin
Q
tf
tfC
fA
NEfficiency
(9.21)
In the case of 21 bb for K joints, eq. (9.21) has to be
multiplied by i
21
2b
bb , where bi is the width of the
brace considered. For a detailed explanation, see Section 8.8. Using the chart of Fig. 9.23 shows that e.g. a K gap joint with 2 20 and b1 = b2 gives an efficiency parameter CK 0,37. Thus, for an angle θi = 45, a 100% efficiency can be obtained if:
9,1tf
tf
i yi
00y (for Qf = 1,0)
If the chord load effect Qf is included, this ratio should be slightly larger. Figs. 9.24 and 9.25 show the chord load effect Qf as a function of the parameter n, defined as the ratio between the maximum stress in the connecting chord face and the chord yield stress.
9.9 CONCLUDING REMARKS For more detailed information about joints loaded by bending moments as well as special types of joints, reference is made to the appropriate literature, see Dutta (2002), Korol et al. (1977), Packer & Henderson (1997), Packer et al. (2009a), Ono et al. (1991), Syam & Chapman (1996), Wardenier (1982) and Wardenier & Giddings (1986).
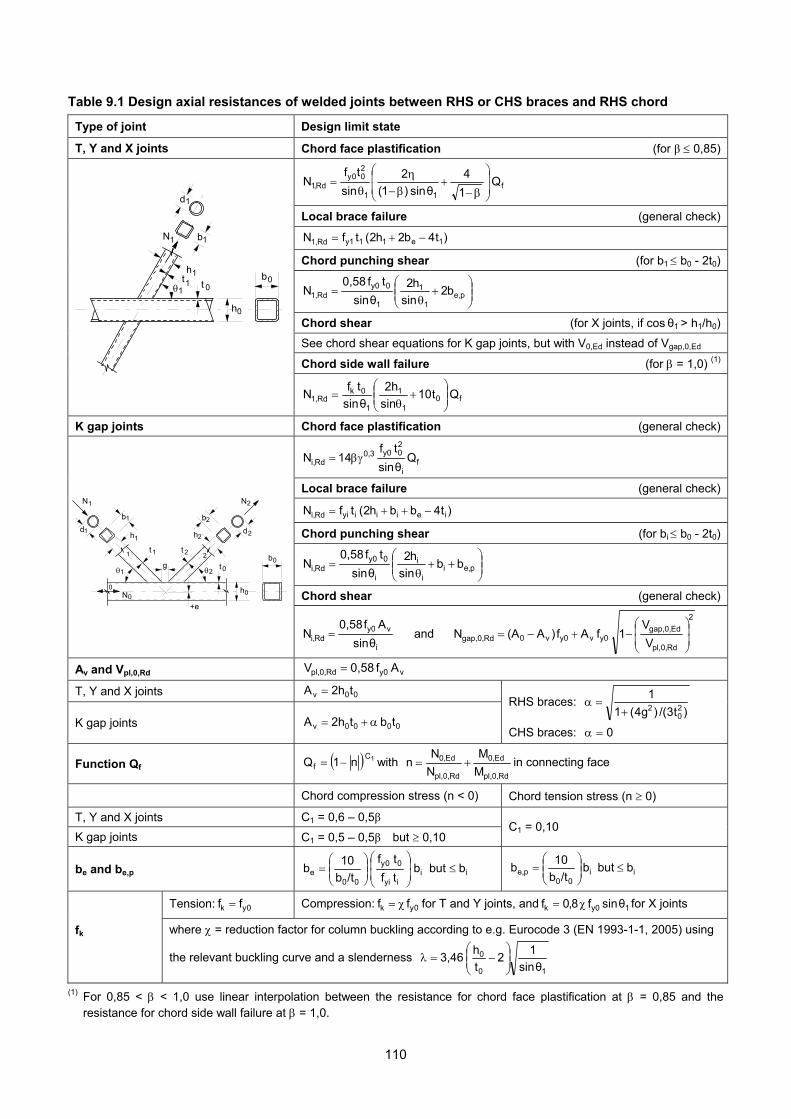
Table 9.1 Design axial resistances of welded joints between RHS or CHS braces and RHS chord
Type of joint Design limit state
T, Y and X joints Chord face plastification (for β 0,85)
f1 1
200y
Rd,1 Q 1
4
θnsi )1(
2
sin
tfN
Local brace failure (general check)
)t4b2h2(tfN 1e1 1 y1Rd1,
Chord punching shear (for b1 b0 - 2t0)
p,e
1
1
1
0 y0
Rd1, b2sin
h2
θsin
tf0,58N
Chord shear (for X joints, if cos θ1 > h1/h0)
See chord shear equations for K gap joints, but with V0,Ed instead of Vgap,0,Ed
Chord side wall failure (for = 1,0) (1)
t 0 t 1
d 1
h 1
b 1
h 0
b 0
N 1
1
f0
1
1
1
0 kRd1, Q t10
sin
2h
θsin
tfN
K gap joints Chord face plastification (general check)
fi
20 y03,0
Rdi, Qθsin
tf41N
Local brace failure (general check)
)t4bbh2(tfN ieii i yiRdi,
Chord punching shear (for bi b0 - 2t0)
p,ei
i
i
i
0 y0
Rdi, bbsin
h2
θsin
tf0,58N
Chord shear (general check)
g
d 1
1 2 t 0
t 2 2 1
+e
0
h 1
b 1
d 2h 2
b 2
h 0
b 0t 1
N 0
N 1 N 2
i
v y0
Rdi, θsin
Af0,58N and
2
Rdpl,0,
Edgap,0, y0 vy0 v0Rdgap,0, V
V1fAf)A(AN
Av and Vpl,0,Rd v y0 Rdpl,0, Af0,58V
T, Y and X joints 00v t2hA
K gap joints 0000v tb t2hA
RHS braces: )t3/()g4(1
120
2
CHS braces: 0
Function Qf 1C f n1Q with
Rdpl,0,
Ed0,
Rdpl,0,
Ed0,
M
M
N
Nn in connecting face
Chord compression stress (n < 0) Chord tension stress (n 0)
T, Y and X joints C1 = 0,6 – 0,5β
K gap joints C1 = 0,5 – 0,5β but 0,10 C1 = 0,10
be and be,p iiiyi
0 0y
00e b but b
tf
tf
/tb
10b
ii
00p,e b but b
/tb
10b
Tension: 0yk ff Compression: for T and Y joints, and for X joints 0y k ff 1 y0 k θsinf8,0f
fk
where = reduction factor for column buckling according to e.g. Eurocode 3 (EN 1993-1-1, 2005) using
the relevant buckling curve and a slenderness 1 0
0
θsin
12
t
h 3,46
(1) For 0,85 < < 1,0 use linear interpolation between the resistance for chord face plastification at = 0,85 and the resistance for chord side wall failure at = 1,0.
110
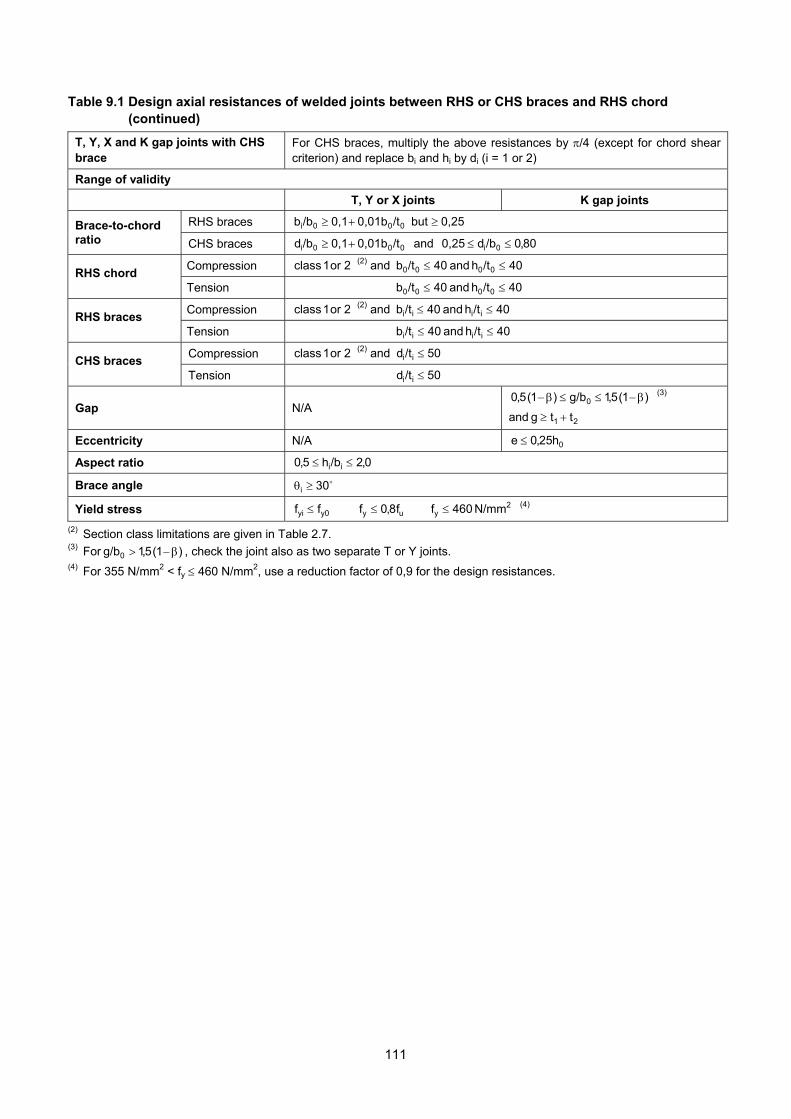
Table 9.1 Design axial resistances of welded joints between RHS or CHS braces and RHS chord (continued)
T, Y, X and K gap joints with CHS brace
For CHS braces, multiply the above resistances by /4 (except for chord shear criterion) and replace bi and hi by di (i = 1 or 2)
Range of validity
T, Y or X joints K gap joints
RHS braces 0,25but /t0,01b0,1/bb 000i Brace-to-chord ratio CHS braces 000i /t0,01b0,1/bd and 80,0/bd 0,25 0i
Compression 2 or 1 class (2) and 40/th and 40/tb 0000 RHS chord
Tension 40/th and 40/tb 0000
Compression 2 or 1 class (2) and 40/th and 40 /tb iiii RHS braces
Tension 40/th and 40/tb iiii
Compression 2 or 1 class (2) and 50/td ii CHS braces
Tension 50/td ii
Gap N/A )1(5,1g/b)1(5,0 0 (3)
and 21 ttg
Eccentricity N/A 0h25,0e
Aspect ratio 0,2/bh5,0 ii
Brace angle 30i
Yield stress y0yi ff (4) uy f8,0f 2
y N/mm 460f
(2) Section class limitations are given in Table 2.7. (3) For , check the joint also as two separate T or Y joints. )1(5,1g/b 0 (4) For 355 N/mm2 < fy 460 N/mm2, use a reduction factor of 0,9 for the design resistances.
111
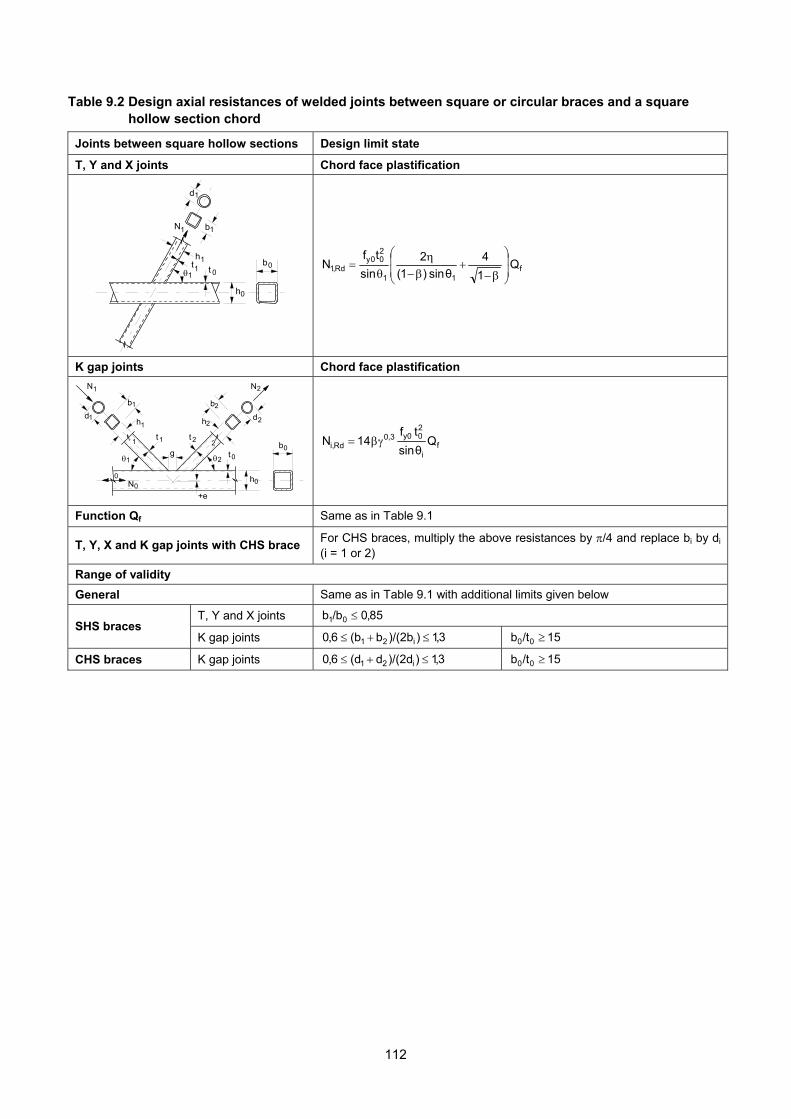
Table 9.2 Design axial resistances of welded joints between square or circular braces and a square hollow section chord
Joints between square hollow sections Design limit state
T, Y and X joints Chord face plastification
t 0 t 1
d 1
h 1
b 1
h 0
b 0
N 1
1
f1 1
200y
Rd,1 Q 1
4
θnsi )1(
2
sin
tfN
K gap joints Chord face plastification
g
d 1
1 2 t 0
t 2 2 1
+e
0
h 1
b 1
d 2h 2
b 2
h 0
b 0t 1
N 0
N 1 N 2
fi
20 y03,0
Rdi, Qθsin
tf41N
Function Qf Same as in Table 9.1
T, Y, X and K gap joints with CHS brace For CHS braces, multiply the above resistances by /4 and replace bi by di (i = 1 or 2)
Range of validity
General Same as in Table 9.1 with additional limits given below
T, Y and X joints 85,0/bb 01 SHS braces
K gap joints 3,1))/(2bb(b6,0 i21 15/tb 00
CHS braces K gap joints 3,1))/(2dd(d6,0 i21 15/tb 00
112

Table 9.3 Design resistance of related types of joints
Type of joint Relationship to the formulae of Tables 9.1 and 9.2
All brace member forces act in the same sense (compression or tension).
N1 N1 1 1
N1,Ed N1,Rd with N1,Rd from X joint given in Table 9.1 or 9.2
All brace member forces act in the same sense (compression or tension).
N2
N1
N1
N2
2 1
N1,Ed sinθ1 + N2,Ed sinθ2 NX,Rd sinθX with NX,Rd sinθX from X joint given in Table 9.1 or 9.2, being the larger of the values for brace 1 or 2
Forces in members 1 are in compression and members 2 in tension.
1
1
N2
N2
N1
N1
2 1
Ni,Ed Ni,Rd (i = 1 or 2) with Ni,Rd from K joint given in Table 9.1 or 9.2, but with the actual chord force
Forces in members 1 are in compression and members 2 in tension.
Ni,Ed Ni,Rd (i = 1 or 2) with Ni,Rd from K gap joint given in Table 9.1 or 9.2 Note: In a gap joint, the chord cross section in the gap has to be checked for shear failure:
v y0 Rd,0,plEdgap,0, Af0,58VV
2
Rd,0,pl
Ed,0,gap y0 vy0 v0Rd,0,gapEd,0,gap V
V1fAf)A(ANN
1
1
N2
N1
N1
N2
2 1
113
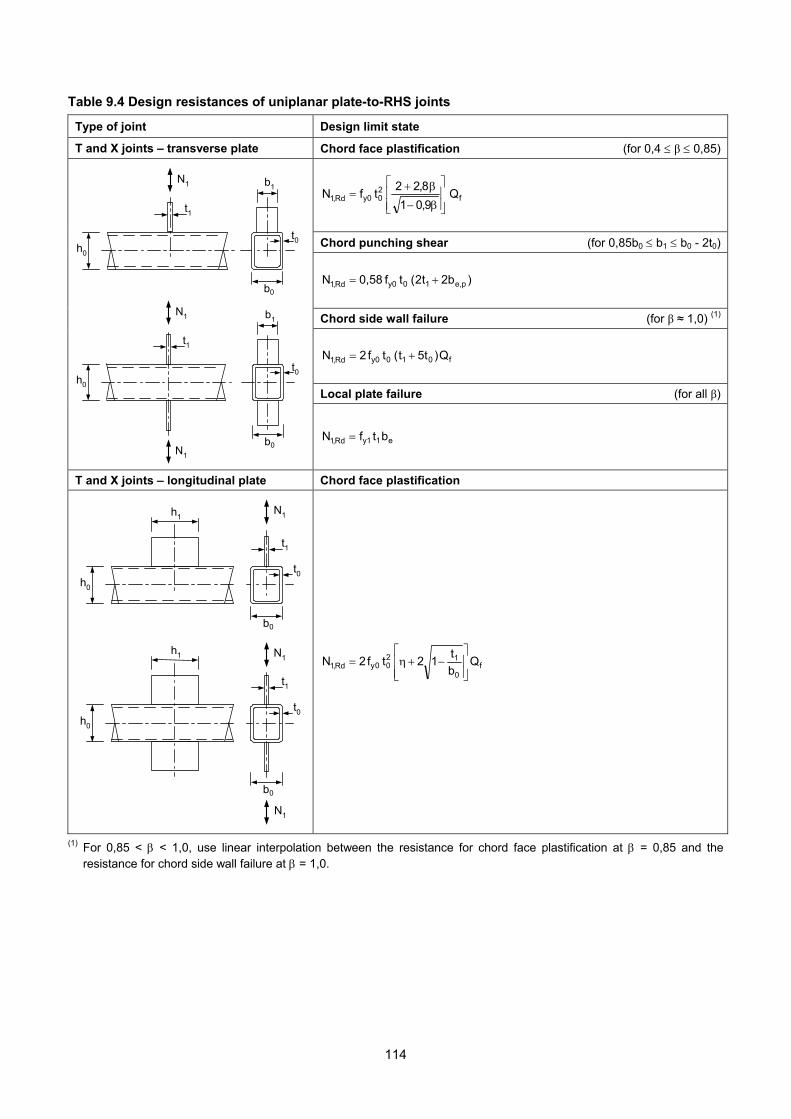
Table 9.4 Design resistances of uniplanar plate-to-RHS joints
Type of joint Design limit state
T and X joints – transverse plate Chord face plastification (for 0,4 β 0,85)
f 2
0 y0Rd,1 Q9,01
8,22tfN
Chord punching shear (for 0,85b0 b1 b0 - 2t0)
)2bt2(tf0,58N pe,1 0 y0 Rd,1
Chord side wall failure (for β ≈ 1,0) (1)
f 01 0 y0 Rd,1 Q)5tt(tf2N
Local plate failure (for all β)
t1
h0
N1
t0
b1
b0
t1
h0
N1
N1
t0
b1
b0
e 1 1yRd,1 btfN
T and X joints – longitudinal plate Chord face plastification
h1
h0
t1
b0
t0
N1
h1
h0
t1
t0
b0
N1
N1
f0
12 0 0y Rd,1 Q
b
t12tf2N
(1) For 0,85 < < 1,0, use linear interpolation between the resistance for chord face plastification at = 0,85 and the resistance for chord side wall failure at = 1,0.
114
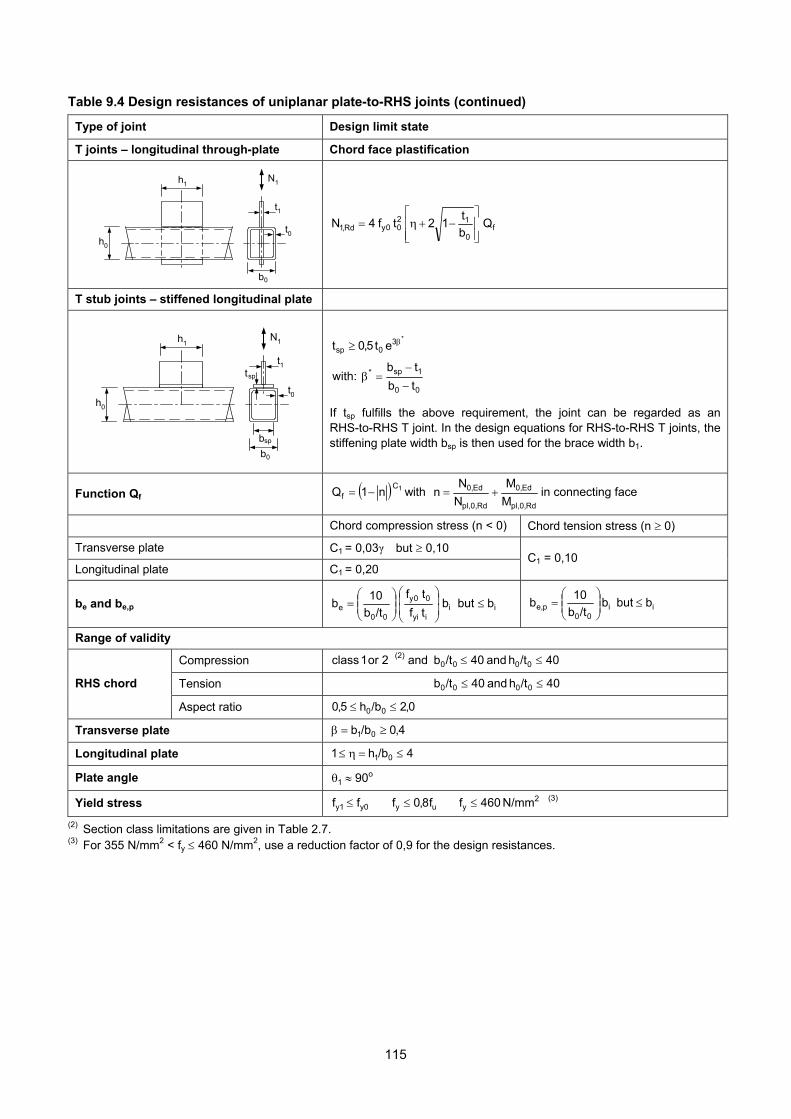
Table 9.4 Design resistances of uniplanar plate-to-RHS joints (continued)
Type of joint Design limit state
T joints – longitudinal through-plate Chord face plastification
h1
h0
t1
b0
t0
N1
f
0
12 0 0yRd,1 Q
b
t12tf 4N
T stub joints – stiffened longitudinal plate
h1
h0
t1
t0
N1
b0
bsp
tsp
*3 0 sp et5,0t
00
1sp*
tb
tb :with
If tsp fulfills the above requirement, the joint can be regarded as an RHS-to-RHS T joint. In the design equations for RHS-to-RHS T joints, the stiffening plate width bsp is then used for the brace width b1.
Function Qf 1C f n1Q with
Rdpl,0,
Ed0,
Rdpl,0,
Ed0,
M
M
N
Nn in connecting face
Chord compression stress (n < 0) Chord tension stress (n 0)
Transverse plate C1 = 0,03γ but 0,10
Longitudinal plate C1 = 0,20 C1 = 0,10
be and be,p iiiyi
0 0y
00e b but b
tf
tf
/tb
10b
ii
00p,e b but b
/tb
10b
Range of validity
Compression 2 or 1 class (2) and 40/th and 40 /tb 0000
Tension 40/th and 40/tb 0000 RHS chord
Aspect ratio 0,2/bh5,0 00
Transverse plate 4,0/bb 01
Longitudinal plate 4/bh1 01
Plate angle o1 90
Yield stress y0y1 ff (3) uy f8,0f 2y N/mm 460f
(2) Section class limitations are given in Table 2.7. (3) For 355 N/mm2 < fy 460 N/mm2, use a reduction factor of 0,9 for the design resistances.
115
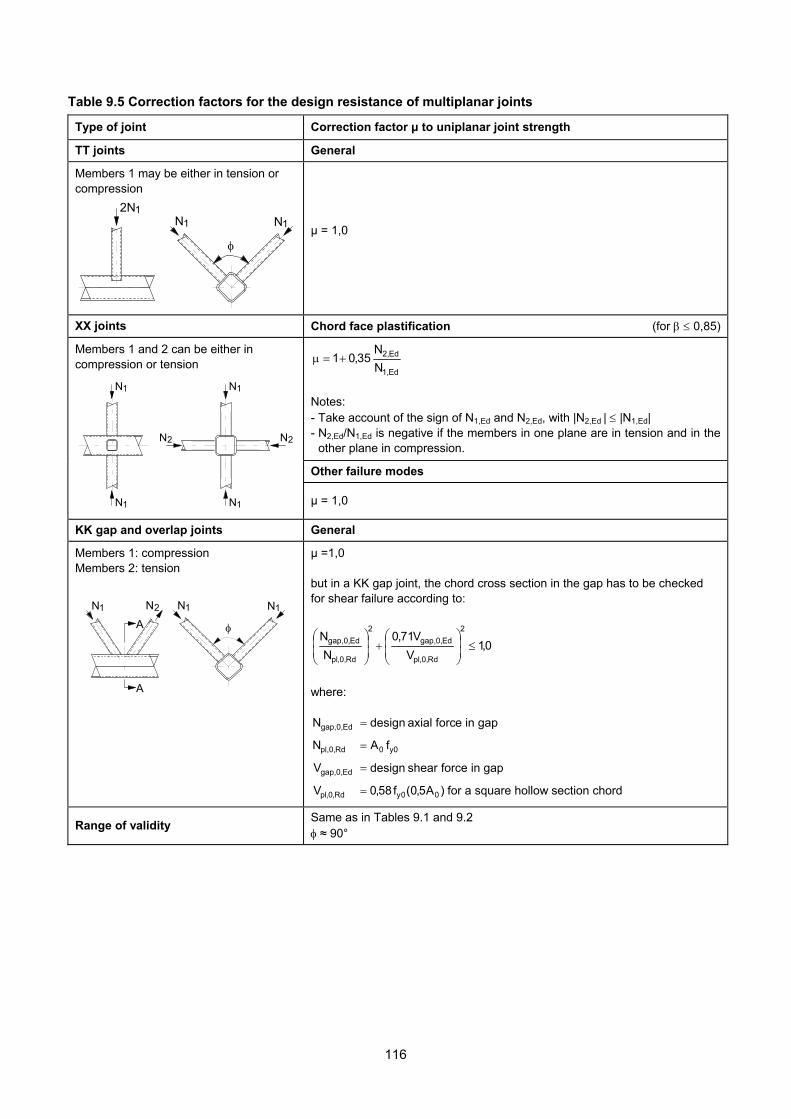
Table 9.5 Correction factors for the design resistance of multiplanar joints
Type of joint Correction factor μ to uniplanar joint strength
TT joints General
Members 1 may be either in tension or compression
2N1
N1 N1
μ = 1,0
XX joints Chord face plastification (for 0,85)
Ed1,
Ed2,
N
N 35,01
Notes: - Take account of the sign of N1,Ed and N2,Ed, with |N2,Ed | |N1,Ed| - N2,Ed/N1,Ed is negative if the members in one plane are in tension and in the
other plane in compression.
Other failure modes
Members 1 and 2 can be either in compression or tension
N1
N2
N1
N1 N1
N2
μ = 1,0
KK gap and overlap joints General
Members 1: compression Members 2: tension
A
A
N1 N1N1 N2
μ =1,0 but in a KK gap joint, the chord cross section in the gap has to be checked for shear failure according to:
0,1V
V71,0
N
N2
Rd,0,pl
Ed,0,gap
2
Rd,0,pl
Ed,0,gap
where:
Edgap,0,N e in gapaxial forc design
Rdpl,0,N y0 0 fA
Edgap,0,V in gapforcehear s design
Rd,0,plV for a square hollow section chord )A5,0(f58,0 00y
Range of validity Same as in Tables 9.1 and 9.2 ≈ 90°
116
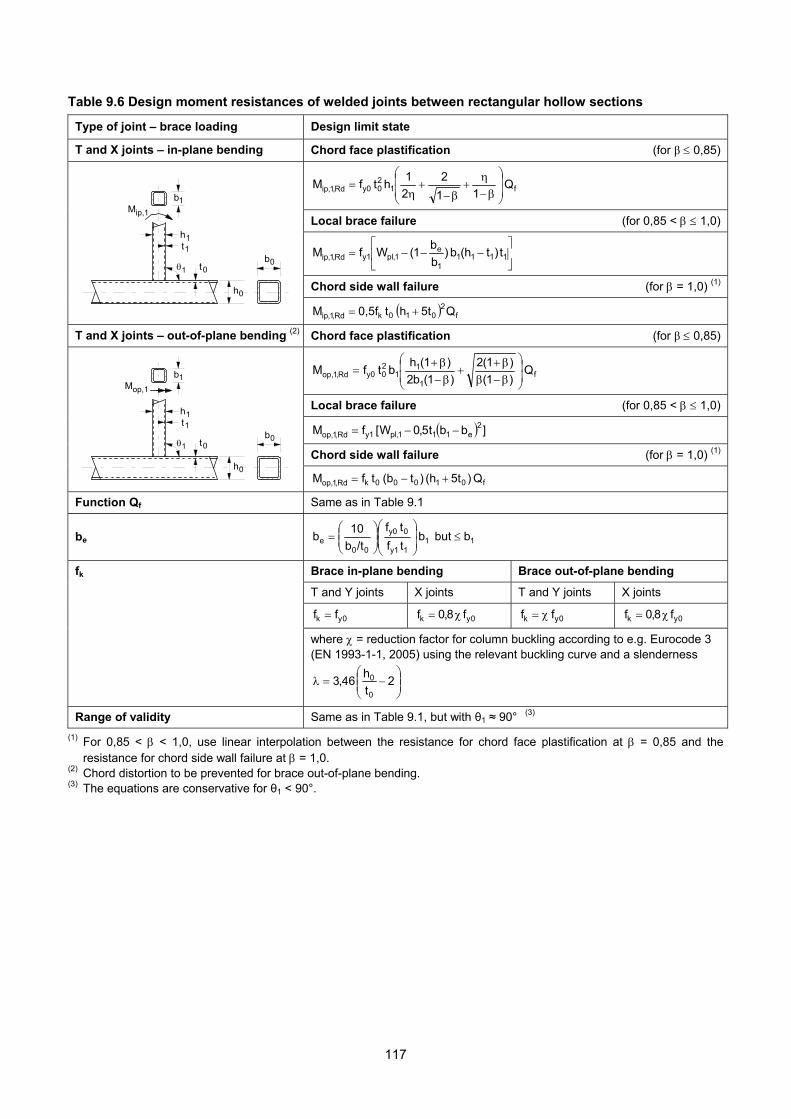
Table 9.6 Design moment resistances of welded joints between rectangular hollow sections
Type of joint – brace loading Design limit state
T and X joints – in-plane bending Chord face plastification (for β 0,85)
f12 0 y0Rd,1,ip Q
11
2
2
1htfM
Local brace failure (for 0,85 < 1,0)
1 111
1
e1,pl1yRd,1,ip t)th(b )
b
b1(WfM
Chord side wall failure (for = 1,0) (1)
t 0
t 1
h 1
b 1
h 0
b 0 1
M ip,1
f2
01 0 kRd,1,ip Q5tht0,5fM
T and X joints – out-of-plane bending (2) Chord face plastification (for β 0,85)
f1
11
2 0 y0Rd,1,op Q
)1(
)1(2
)1(b2
)1(hbtfM
Local brace failure (for 0,85 < 1,0)
]bbt5,0W[fM 2e111,pl 1yRd,1,op
Chord side wall failure (for = 1,0) (1) t 0
t 1
h 1
b 1
h 0
b 0 1
M op,1
f0100 0 kRd,1,op Q )5t(h )t(btfM
Function Qf Same as in Table 9.1
be 111 y1
0 y0
00e b but b
tf
tf
/tb
10b
Brace in-plane bending Brace out-of-plane bending
T and Y joints X joints T and Y joints X joints
0yk ff 0y k f8,0f 0yk f f 0y k f8,0f
fk
where = reduction factor for column buckling according to e.g. Eurocode 3 (EN 1993-1-1, 2005) using the relevant buckling curve and a slenderness
2
t
h46,3
0
0
Range of validity Same as in Table 9.1, but with θ1 ≈ 90° (3)
(1) For 0,85 < < 1,0, use linear interpolation between the resistance for chord face plastification at = 0,85 and the resistance for chord side wall failure at = 1,0.
(2) Chord distortion to be prevented for brace out-of-plane bending. (3) The equations are conservative for θ1 < 90°.
117
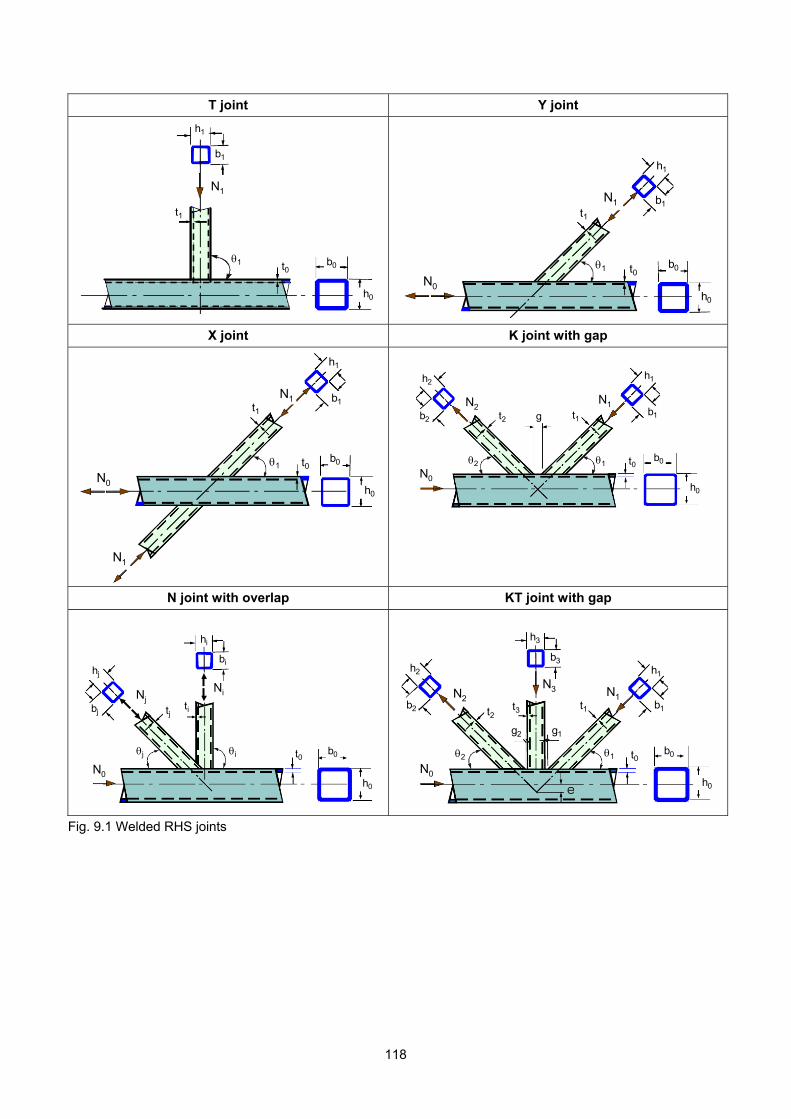
T joint Y joint
N1
b1
h1
t1
1 t0
h0
b0
N1
b1
h1
t1
1 t0
h0
b0
N1
b0
N0
h1
b1t1
1 t0
h0
N1
b0
N0
h1
b1t1
1 t0
h0
X joint K joint with gap
N1
h0
b0
b1
h1
N0
t1
1 t0
N1
N1
h0
b0
b1
h1
N0
t1
1 t0
N1
N1
b0
h0
N0
h2
N2b2 g t1
1 t0
t2
2
b1
h1
N1
b0
h0
N0
h2
N2b2 g t1
1 t0
t2
2
b1
h1
N joint with overlap KT joint with gap
b0
h0
N0
Nj
hi
bj
hj
Ni
bi
tjti
t0ij b0
h0
N0
Nj
hi
bj
hj
Ni
bi
tjti
t0ij
N1
b0
h0
N0
h3
t3t2b2
h2
2 1 t0
h1
b1t1
b3
g1g2
N3N2N1
b0
h0
N0
h3
t3t2b2
h2
2 1 t0
h1
b1t1
b3
g1g2
N3N2
Fig. 9.1 Welded RHS joints
118

(a) Brace failure
(e) Chord punching shear failure
(b) Weld failure
as (a) but failure in the weld
(f) Chord side wall yielding or buckling
(c) Lamellar tearing
see e.g. Fig. 7.6c
(g) Chord local buckling
(d) Chord face plastification
(h) Chord shear failure
Fig. 9.2 Failure modes for welded RHS joints
119
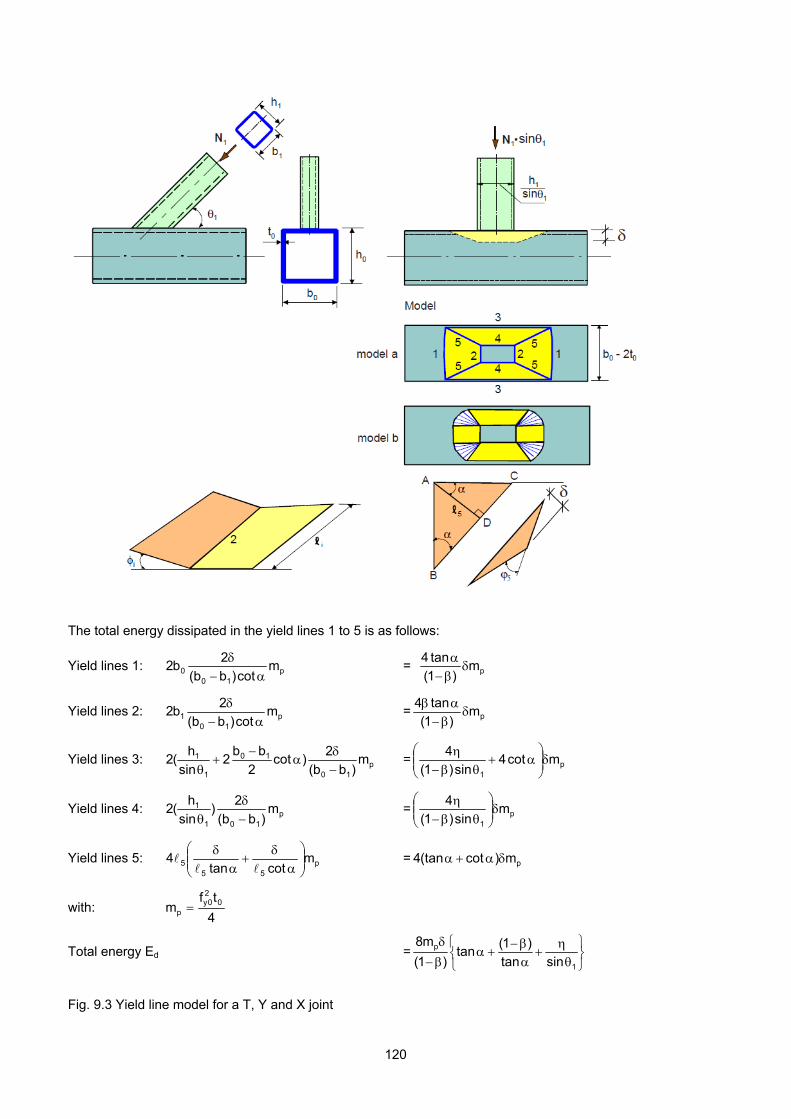
The total energy dissipated in the yield lines 1 to 5 is as follows:
Yield lines 1: p10
0 mcot)bb(
2b2
= pm)1(
tan4
Yield lines 2: p10
1 mcot)bb(
2b2
= pm)1(
tan4
Yield lines 3: p10
10
1
1 m)bb(
2)cot
2
bb2
sin
h(2
= p1
mcot4sin)1(
4
Yield lines 4: p101
1 m)bb(
2)
sin
h(2
= p
1
msin)1(
4
Yield lines 5: p55
5 mcottan
4
= pm)cot(tan4
with: 4
tfm 0
20y
p
Total energy Ed =
1
p
sintan
)1(tan
)1(
m8
Fig. 9.3 Yield line model for a T, Y and X joint
120
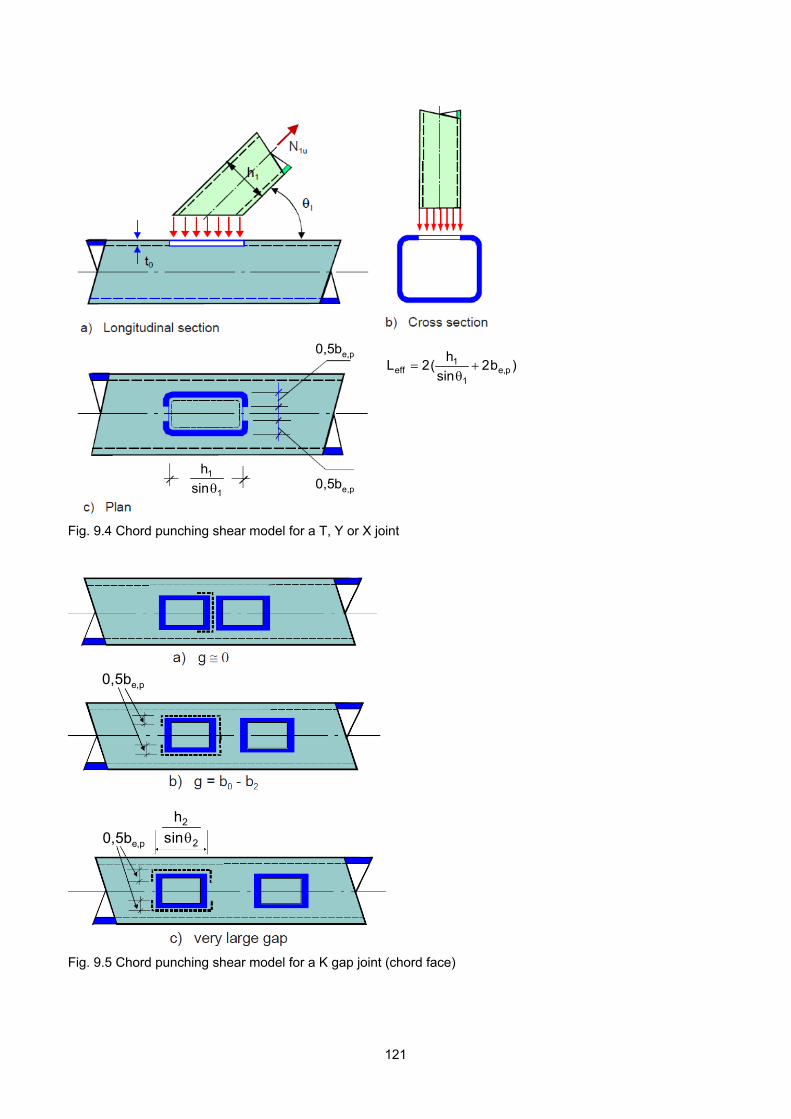
0,5be,p
0,5be,p
1
1
sin
h
)b2sin
h(2L p,e
1
1 eff
0,5be,p
0,5be,p
1
1
sin
h
)b2sin
h(2L p,e
1
1 eff
Fig. 9.4 Chord punching shear model for a T, Y or X joint
,
,0,5be,p 2
2
sin
h
0,5be,p,
,0,5be,p 2
2
sin
h
0,5be,p
Fig. 9.5 Chord punching shear model for a K gap joint (chord face)
121
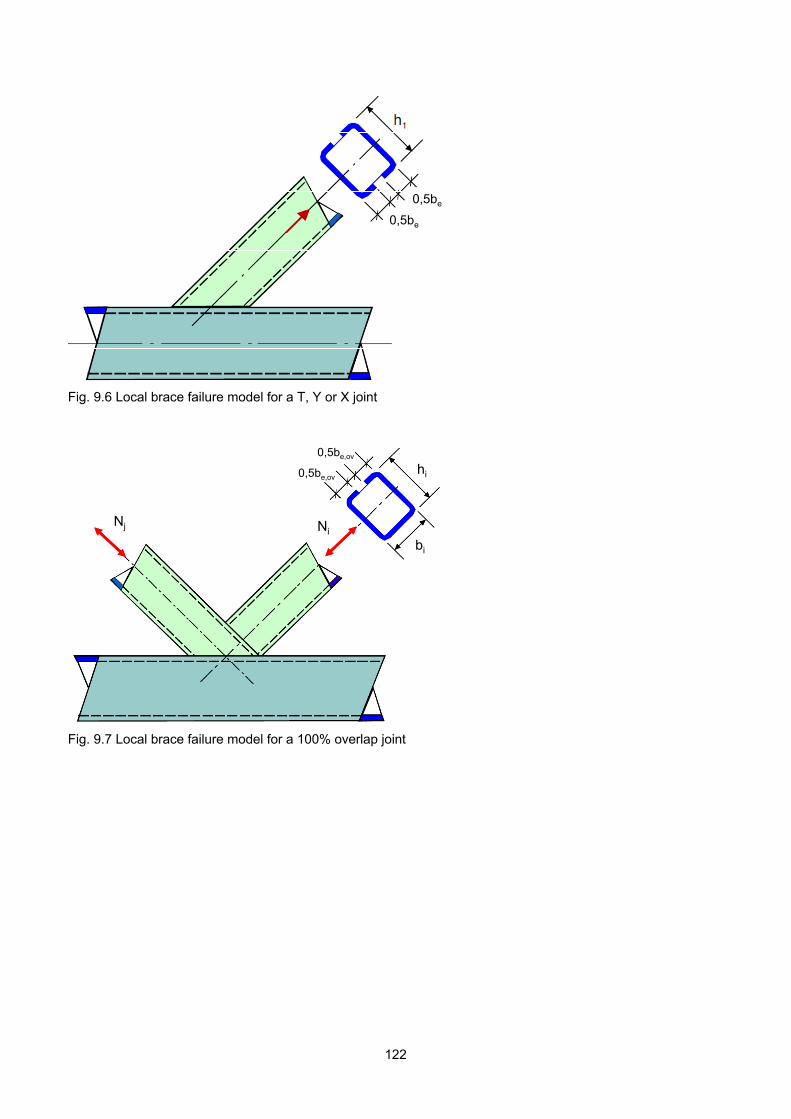
0,5be
0,5be
0,5be
0,5be
Fig. 9.6 Local brace failure model for a T, Y or X joint
Nj Ni
bi
hi
0,5be,ov
0,5be,ov
Nj Ni
bi
hi
0,5be,ov
0,5be,ov
Fig. 9.7 Local brace failure model for a 100% overlap joint
122
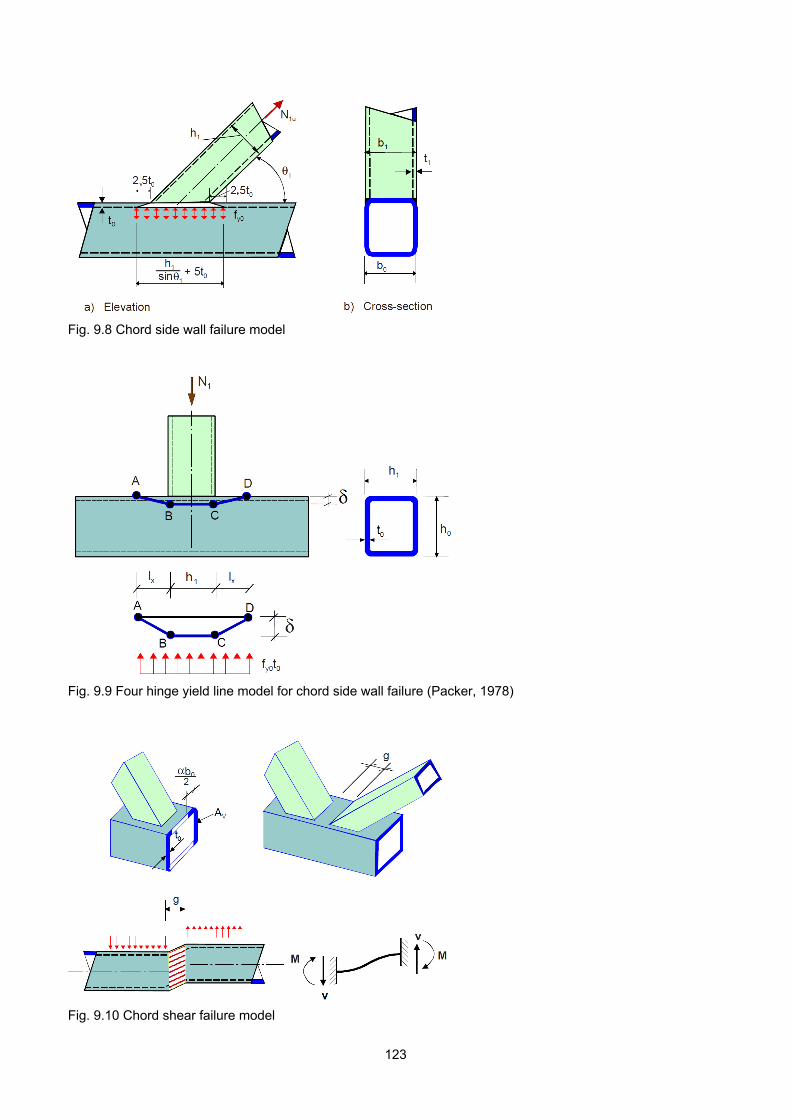
,,
,,
Fig. 9.8 Chord side wall failure model
Fig. 9.9 Four hinge yield line model for chord side wall failure (Packer, 1978)
Fig. 9.10 Chord shear failure model
123
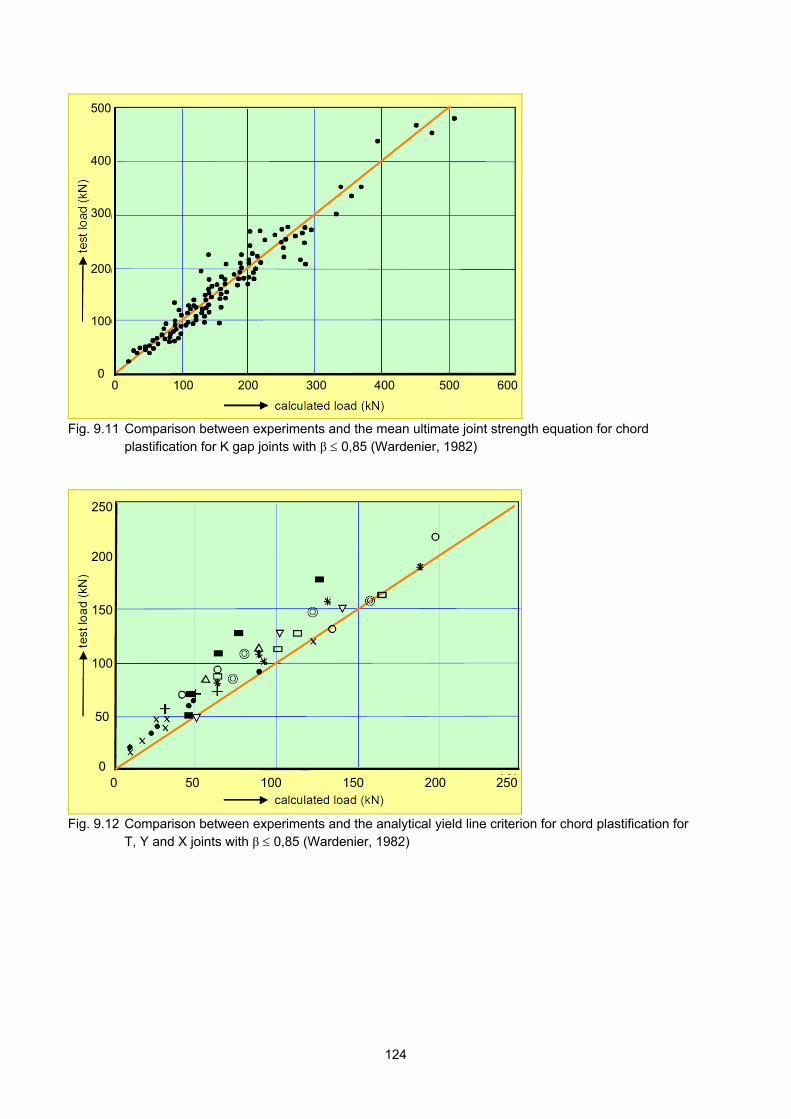
0 100 200 300 400 500 600
500
400
300
200
100
00 100 200 300 400 500 600
500
400
300
200
100
0
Fig. 9.11 Comparison between experiments and the mean ultimate joint strength equation for chord
plastification for K gap joints with β 0,85 (Wardenier, 1982)
0 50 100 150 200 250
250
200
150
100
50
00 50 100 150 200 250
250
200
150
100
50
0
Fig. 9.12 Comparison between experiments and the analytical yield line criterion for chord plastification for
T, Y and X joints with β 0,85 (Wardenier, 1982)
124
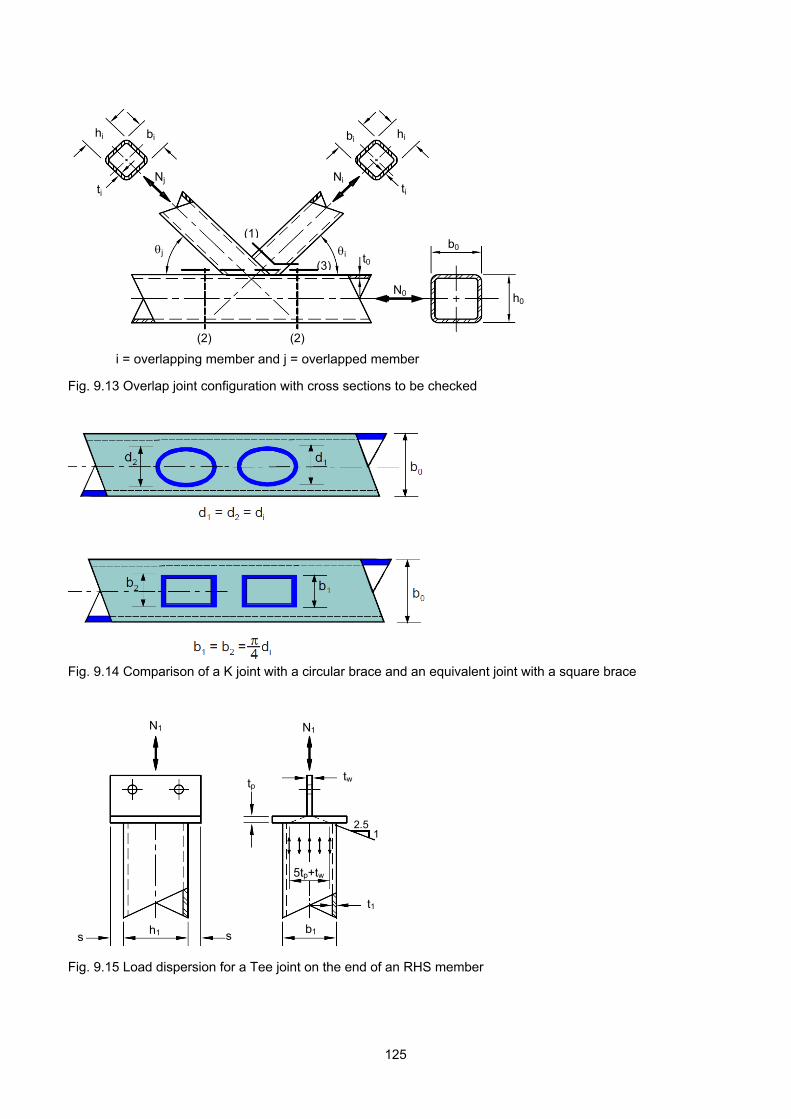
hj hi bj bi
Ni Nj ti tj
i = overlapping member and j = overlapped member
Fig. 9.13 Overlap joint configuration with cross sections to be checked
Fig. 9.14 Comparison of a K joint with a circular brace and an equivalent joint with a square brace
N1 N1
tp tw
t1
b1 s
h1 s
5tp+tw
2.5 1
Fig. 9.15 Load dispersion for a Tee joint on the end of an RHS member
t0
N0p
b0 j i
N0 h0
(2) (2)
(3)
(1)
125
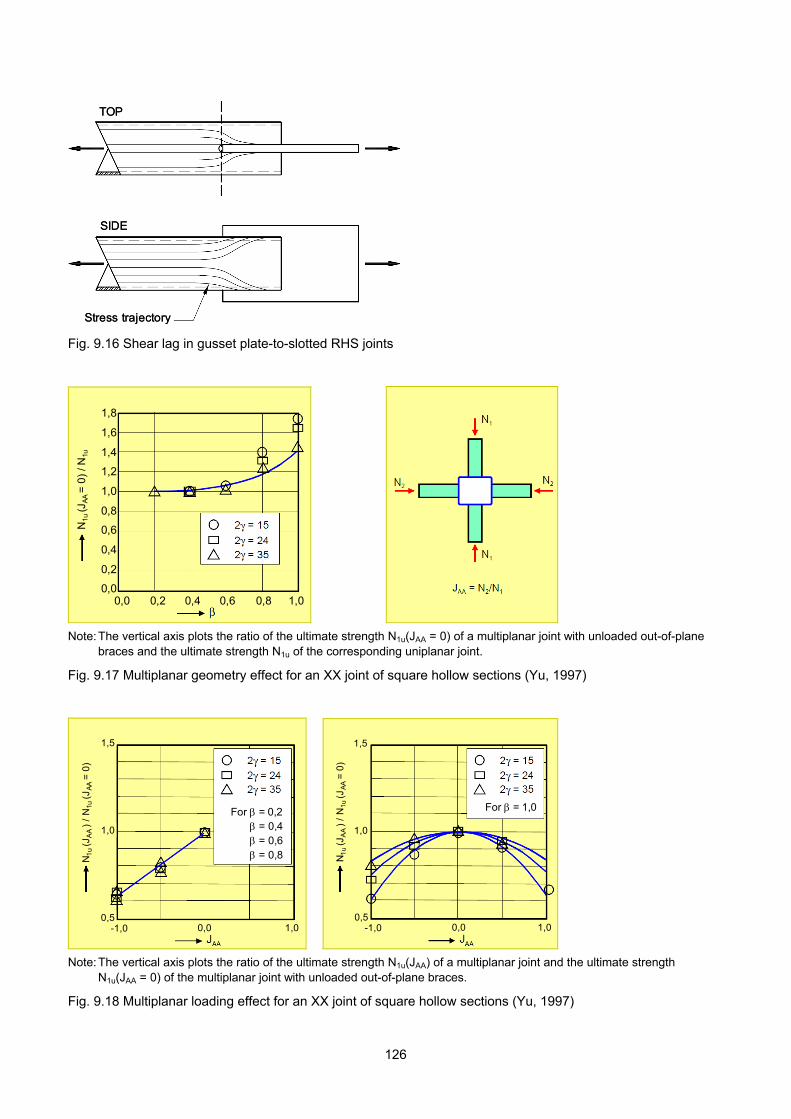
Stress trajectory
TOP
SIDE
Stress trajectory
TOP
SIDE
Stress trajectory
TOP
SIDE
Fig. 9.16 Shear lag in gusset plate-to-slotted RHS joints
1,8
1,6
1,4
1,2
1,0
0,8
0,6
0,4
0,2
0,00,0 0,2 0,4 0,6 0,8 1,0
N1u
(JA
A =
0)
/ N1u
1,8
1,6
1,4
1,2
1,0
0,8
0,6
0,4
0,2
0,00,0 0,2 0,4 0,6 0,8 1,0
N1u
(JA
A =
0)
/ N1u
Note: The vertical axis plots the ratio of the ultimate strength N1u(JAA = 0) of a multiplanar joint with unloaded out-of-plane
braces and the ultimate strength N1u of the corresponding uniplanar joint.
Fig. 9.17 Multiplanar geometry effect for an XX joint of square hollow sections (Yu, 1997)
1,5
0,51,0
1,0
-1,0 0,0
For = 0,2 = 0,4 = 0,6 = 0,8N
1u
(JA
A )
/ N
1u (J
AA
= 0
)
1,5
0,51,0
1,0
-1,0 0,0
For = 0,2 = 0,4 = 0,6 = 0,8N
1u
(JA
A )
/ N
1u (J
AA
= 0
)
1,0
0,5
1,5
1,0-1,0 0,0
For = 1,0
N1
u (J
AA
) /
N1u
(JA
A =
0)
1,0
0,5
1,5
1,0-1,0 0,0
For = 1,0
N1
u (J
AA
) /
N1u
(JA
A =
0)
Note: The vertical axis plots the ratio of the ultimate strength N1u(JAA) of a multiplanar joint and the ultimate strength
N1u(JAA = 0) of the multiplanar joint with unloaded out-of-plane braces.
Fig. 9.18 Multiplanar loading effect for an XX joint of square hollow sections (Yu, 1997)
126

Fig. 9.19 Multiplanar KK joint of square hollow sections
127
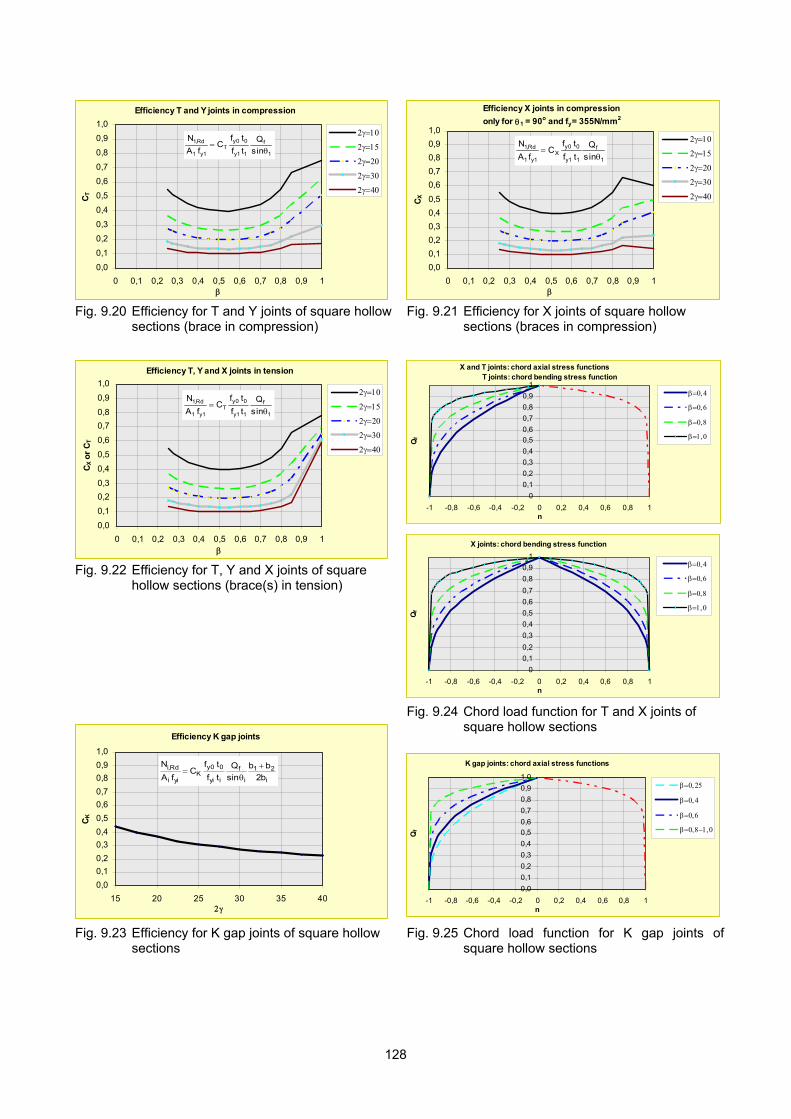
Efficiency T and Y joints in compression
0,0
0,1
0,2
0,3
0,4
0,5
0,6
0,7
0,8
0,9
1,0
0 0,1 0,2 0,3 0,4 0,5 0,6 0,7 0,8 0,9 1
CT
1
f
1 1y
0 0yT
1y1
Rd,1
sin
Q
tf
tfC
f A
N
Efficiency X joints in compression
only for 1 = 90o and fy = 355N/mm2
0,0
0,1
0,2
0,3
0,4
0,5
0,6
0,7
0,8
0,9
1,0
0 0,1 0,2 0,3 0,4 0,5 0,6 0,7 0,8 0,9 1
CX
1
f
11y
0 0yX
1y 1
Rd,1
sin
Q
t f
tfC
fA
N
Fig. 9.20 Efficiency for T and Y joints of square hollow
sections (brace in compression)
Fig. 9.21 Efficiency for X joints of square hollow sections (braces in compression)
Efficiency T, Y and X joints in tension
0,0
0,1
0,2
0,3
0,4
0,5
0,6
0,7
0,8
0,9
1,0
0 0,1 0,2 0,3 0,4 0,5 0,6 0,7 0,8 0,9 1
CX o
r C
T
1
f
1 1y
0 0yT
1y1
Rd,1
sin
Q
tf
tfC
f A
N
Fig. 9.22 Efficiency for T, Y and X joints of square
hollow sections (brace(s) in tension)
Efficiency K gap joints
0,0
0,1
0,2
0,3
0,4
0,5
0,6
0,7
0,8
0,9
1,0
15 20 25 30 35 40
CK
i
21
i
f
i yi
0 0yK
yi i
Rd,i
b2
bb
sin
Q
tf
tfC
fA
N
X and T joints: chord axial stress functions T joints: chord bending stress function
0
0,1
0,2
0,3
0,4
0,5
0,6
0,7
0,8
0,9
1
-1 -0,8 -0,6 -0,4 -0,2 0 0,2 0,4 0,6 0,8 1n
Qf
X joints: chord bending stress function
0
0,1
0,2
0,3
0,4
0,5
0,6
0,7
0,8
0,9
1
-1 -0,8 -0,6 -0,4 -0,2 0 0,2 0,4 0,6 0,8 1n
Qf
Fig. 9.24 Chord load function for T and X joints of square hollow sections
K gap joints: chord axial stress functions
0,0
0,1
0,2
0,3
0,4
0,5
0,6
0,7
0,8
0,9
1,0
-1 -0,8 -0,6 -0,4 -0,2 0 0,2 0,4 0,6 0,8 1n
Qf
Fig. 9.23 Efficiency for K gap joints of square hollow sections
Fig. 9.25 Chord load function for K gap joints of square hollow sections
128
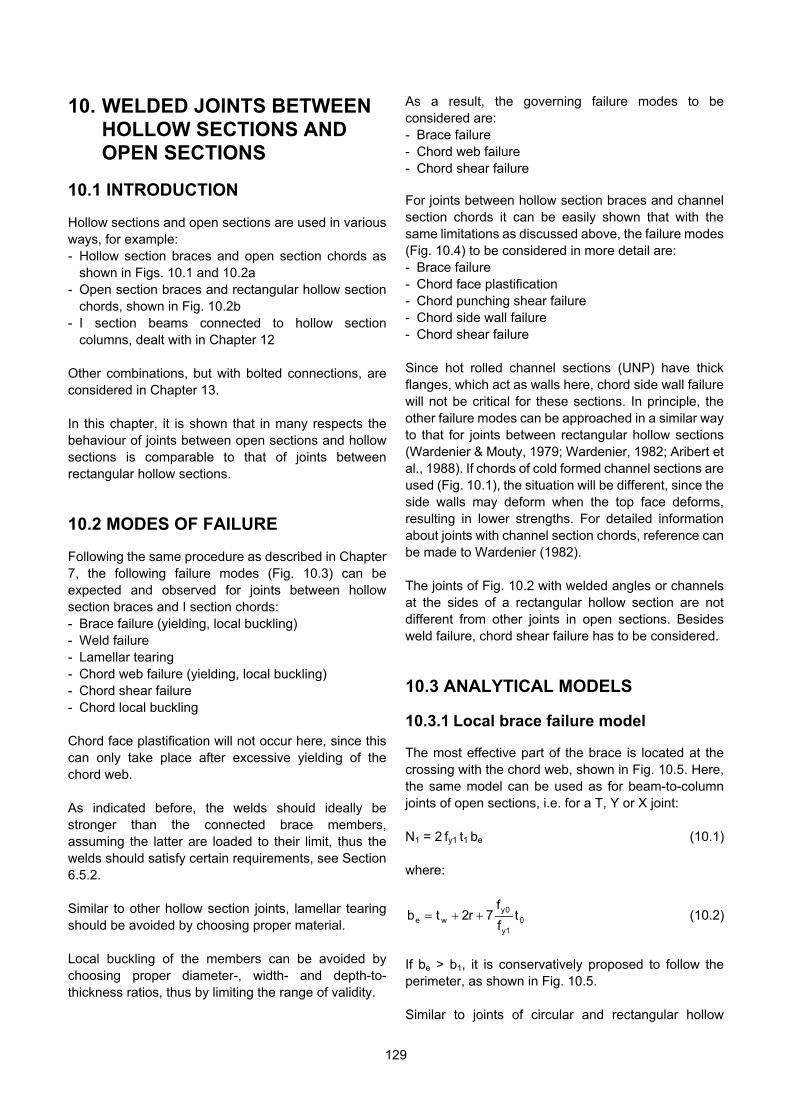
10. WELDED JOINTS BETWEEN HOLLOW SECTIONS AND OPEN SECTIONS
10.1 INTRODUCTION Hollow sections and open sections are used in various ways, for example: - Hollow section braces and open section chords as
shown in Figs. 10.1 and 10.2a - Open section braces and rectangular hollow section
chords, shown in Fig. 10.2b - I section beams connected to hollow section
columns, dealt with in Chapter 12 Other combinations, but with bolted connections, are considered in Chapter 13. In this chapter, it is shown that in many respects the behaviour of joints between open sections and hollow sections is comparable to that of joints between rectangular hollow sections.
10.2 MODES OF FAILURE Following the same procedure as described in Chapter 7, the following failure modes (Fig. 10.3) can be expected and observed for joints between hollow section braces and I section chords: - Brace failure (yielding, local buckling) - Weld failure - Lamellar tearing - Chord web failure (yielding, local buckling) - Chord shear failure - Chord local buckling Chord face plastification will not occur here, since this can only take place after excessive yielding of the chord web. As indicated before, the welds should ideally be stronger than the connected brace members, assuming the latter are loaded to their limit, thus the welds should satisfy certain requirements, see Section 6.5.2. Similar to other hollow section joints, lamellar tearing should be avoided by choosing proper material. Local buckling of the members can be avoided by choosing proper diameter-, width- and depth-to- thickness ratios, thus by limiting the range of validity.
As a result, the governing failure modes to be considered are: - Brace failure - Chord web failure - Chord shear failure For joints between hollow section braces and channel section chords it can be easily shown that with the same limitations as discussed above, the failure modes (Fig. 10.4) to be considered in more detail are: - Brace failure - Chord face plastification - Chord punching shear failure - Chord side wall failure - Chord shear failure Since hot rolled channel sections (UNP) have thick flanges, which act as walls here, chord side wall failure will not be critical for these sections. In principle, the other failure modes can be approached in a similar way to that for joints between rectangular hollow sections (Wardenier & Mouty, 1979; Wardenier, 1982; Aribert et al., 1988). If chords of cold formed channel sections are used (Fig. 10.1), the situation will be different, since the side walls may deform when the top face deforms, resulting in lower strengths. For detailed information about joints with channel section chords, reference can be made to Wardenier (1982). The joints of Fig. 10.2 with welded angles or channels at the sides of a rectangular hollow section are not different from other joints in open sections. Besides weld failure, chord shear failure has to be considered.
10.3 ANALYTICAL MODELS 10.3.1 Local brace failure model The most effective part of the brace is located at the crossing with the chord web, shown in Fig. 10.5. Here, the same model can be used as for beam-to-column joints of open sections, i.e. for a T, Y or X joint: N1 = 2 fy1 t1 be (10.1) where:
01y
0ywe t
f
f7r2tb (10.2)
If be > b1, it is conservatively proposed to follow the perimeter, as shown in Fig. 10.5. Similar to joints of circular and rectangular hollow
129
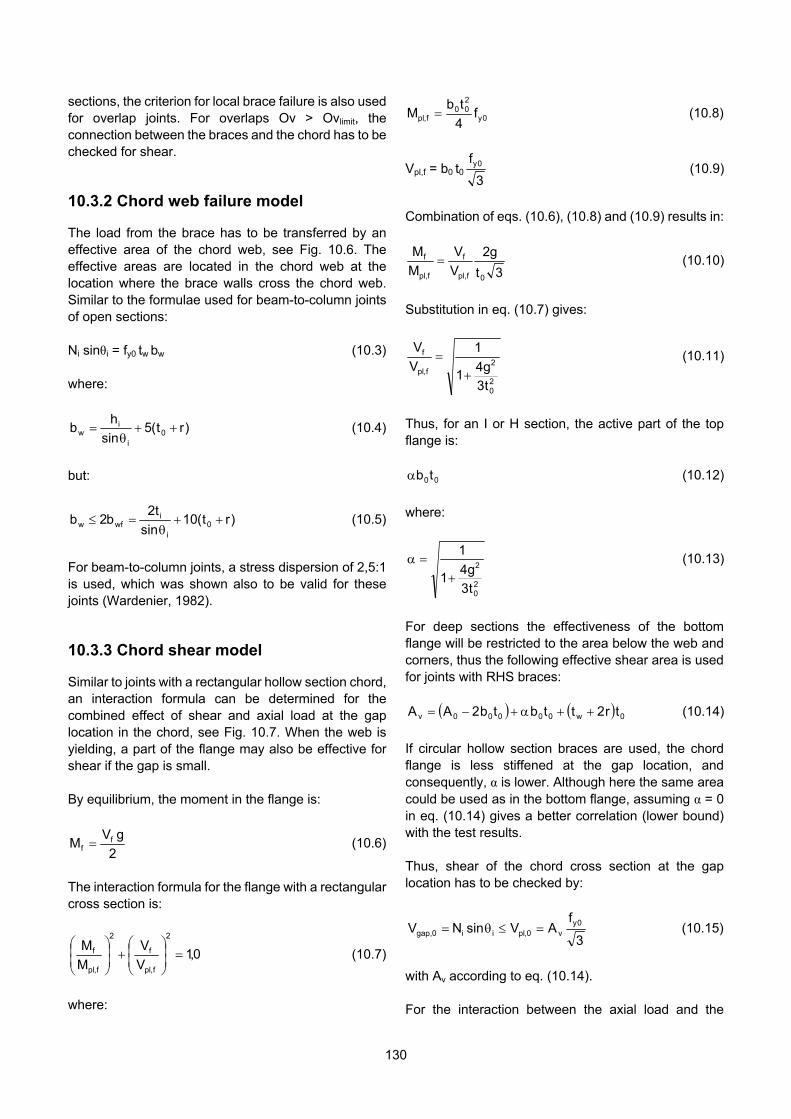
sections, the criterion for local brace failure is also used for overlap joints. For overlaps Ov > Ovlimit, the connection between the braces and the chord has to be checked for shear. 10.3.2 Chord web failure model The load from the brace has to be transferred by an effective area of the chord web, see Fig. 10.6. The effective areas are located in the chord web at the location where the brace walls cross the chord web. Similar to the formulae used for beam-to-column joints of open sections: Ni sinθi = fy0 tw bw (10.3) where:
)rt(5sin
hb 0
i
iw
(10.4)
but:
)rt(10sin
t2b2 b 0
i
iwfw
(10.5)
For beam-to-column joints, a stress dispersion of 2,5:1 is used, which was shown also to be valid for these joints (Wardenier, 1982). 10.3.3 Chord shear model Similar to joints with a rectangular hollow section chord, an interaction formula can be determined for the combined effect of shear and axial load at the gap location in the chord, see Fig. 10.7. When the web is yielding, a part of the flange may also be effective for shear if the gap is small. By equilibrium, the moment in the flange is:
2
gVM f
f (10.6)
The interaction formula for the flange with a rectangular cross section is:
0,1V
V
M
M2
f,pl
f
2
f,pl
f
(10.7)
where:
0y
200
f,pl f4
tbM (10.8)
Vpl,f = b0 t03
f 0y (10.9)
Combination of eqs. (10.6), (10.8) and (10.9) results in:
3t
g2
V
V
M
M
0f,pl
f
f,pl
f (10.10)
Substitution in eq. (10.7) gives:
20
2f,pl
f
t3
g41
1
V
V
(10.11)
Thus, for an I or H section, the active part of the top flange is:
00tb (10.12)
where:
20
2
t3
g41
1
(10.13)
For deep sections the effectiveness of the bottom flange will be restricted to the area below the web and corners, thus the following effective shear area is used for joints with RHS braces:
0 w00 00 0v tr2ttbtb2AA (10.14)
If circular hollow section braces are used, the chord flange is less stiffened at the gap location, and consequently, α is lower. Although here the same area could be used as in the bottom flange, assuming α = 0 in eq. (10.14) gives a better correlation (lower bound) with the test results. Thus, shear of the chord cross section at the gap location has to be checked by:
3
fAVsinNV 0y
v0,plii0,gap (10.15)
with Av according to eq. (10.14). For the interaction between the axial load and the
130
shear load at the gap location, based on the Huber-Hencky-Von Mises criterion, the following formula applies (see Section 9.3.5):
2
0,pl
0,gap0yv0y v00,gap V
V1fAfAAN
(10.16)
131
10.4 EXPERIMENTAL VERIFICATION The formulae developed in Section 10.3 for joints with an I section chord have been verified by experiments (Wardenier & Mouty, 1979; Wardenier, 1982), e.g. the comparison of eq. (10.15) with test results is given in Fig. 10.8. The design criteria for joints with a hot finished channel chord section have also been checked by tests. It was shown that for medium to high width ratios β, chord shear failure was the most common failure mode for K gap joints, whereas chord punching shear or chord face plastification was governing for low β values.
10.5 EVALUATION TO DESIGN RULES In principle, the same approach has been used as for the joints discussed in Chapters 8 and 9. However, due to the limited number of tests, no thorough statistical analysis has been carried out. The resulting design resistances are given in Table 10.1. For overlap joints, the same approach is adopted for all types of overlap joints, regardless whether circular or rectangular braces are used in combination with a circular, rectangular or open section chord. Only the effective width parameters depend on the type of section. The resistance of overlap joints between circular hollow sections with 25% Ov 100% overlap is based on the following criteria: (1) Local failure of the overlapping brace (2) Local chord member yielding at the joint location
based on interaction between axial load and bending moment
(3) Shear of the connection between the brace(s) and the chord
The cross sections to be examined for these criteria are the same are those shown in Figures 8.16 and 9.13. Local failure of the overlapping brace (criterion 1) should always be checked, while shear between the braces and the chord (criterion 3) may only become critical for larger overlaps, i.e. larger than 60% or 80%,
depending on whether or not the hidden toe location of the overlapped brace is welded to the chord. The check for local chord member yielding (criterion 2) is, in principle, a member check and may become critical for larger overlaps and/or larger β ratios. For 100% overlap joints, similar criteria have to be checked. Only here, as shown by Chen et al. (2005) and Qian et al. (2007), shear of the overlapped brace and chord member yielding will generally be the governing criteria. Although an overlap of 100% is given in the recommendations, in general, the overlap will be slightly larger to allow proper welding of the overlapping brace to the overlapped brace.
More detailed information regarding the design equations for overlap joints is given in Chapter 11.
10.6 JOINTS PREDOMINANTLY LOADED BY BENDING MOMENTS
Here, only beam-to-column joints with an RHS brace (or beam) and an I section column are of practical interest. The design resistance in Table 10.2 is governed by local failure of the RHS brace with formulae based on eqs. (10.1) and (10.2) (see Fig. 10.9) and column web failure based on eqs. (10.3) to (10.5) (see Fig. 10.10).
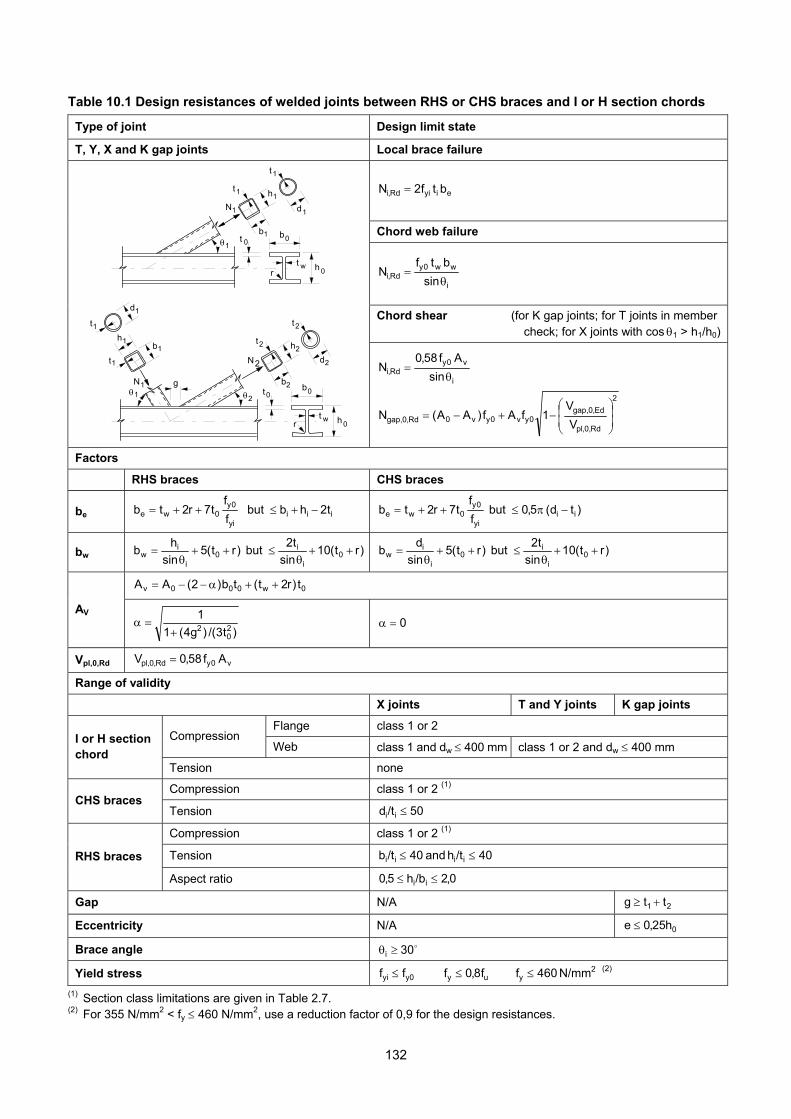
Table 10.1 Design resistances of welded joints between RHS or CHS braces and I or H section chords
Type of joint Design limit state
T, Y, X and K gap joints Local brace failure
e i yiRd,i btf2N
Chord web failure
i
w w 0yRd,i sin
btfN
Chord shear (for K gap joints; for T joints in member check; for X joints with cos 1 > h1/h0)
b0
h 0
t 0
t w
b1
h1t1
N1
1
d1
t1
r
b0
h 0
t0
t w
b2
h2t2
N2
2
d2
t2
r
1
b1
h1
t1
N1
d1
t1
g
i
v 0y
Rd,i sin
Af58,0N
2
Rd,0,pl
Ed,0,gap0yv0y v0Rd,0,gap V
V1fAf)AA(N
Factors
RHS braces CHS braces
be iiiyi
0y0we t2hb but
f
ft7r2tb )td( 5,0 but
f
ft7r2tb ii
yi
0y0we
bw )rt(10sin
t2 but )rt(5
sin
hb 0
i
i0
i
iw
)rt(10
sin
t2 but )rt(5
sin
db 0
i
i0
i
iw
0 w00 0v t)r2t(tb)2(AA
AV
)t3/()g4(1
120
2 0
Vpl,0,Rd v 0y Rd,0,pl Af58,0V
Range of validity
X joints T and Y joints K gap joints
Flange class 1 or 2 Compression
Web class 1 and dw 400 mm class 1 or 2 and dw 400 mm I or H section chord
Tension none
Compression class 1 or 2 (1) CHS braces
Tension 50/td ii
Compression class 1 or 2 (1)
Tension 40/th and 40 /tb iiii RHS braces
Aspect ratio 0,2/bh5,0 ii
Gap N/A 21 ttg
Eccentricity N/A 0h25,0e
Brace angle 30i
Yield stress y0yi ff (2) uy f8,0f 2
y N/mm 460f
(1) Section class limitations are given in Table 2.7. (2) For 355 N/mm2 < fy 460 N/mm2, use a reduction factor of 0,9 for the design resistances.
132

Table 10.2 Design moment resistance of uniplanar RHS braces (beams) to I or H section chord joints
Type of joint Design limit state
T joints Local brace failure
z e 1 1yRd,1,ip hbtfM
where hz is the distance between the centres of gravity of the effective parts of the RHS brace (beam)
Chord web failure hz h1
be
be
'I' or 'H' Column
RHS Beam
M
I or H chord
RHS brace (beam)
Mip,1
1
hz h1
be
be
'I' or 'H' Column
RHS Beam
M
I or H chord
RHS brace (beam)
Mip,1
1
)th(btf5,0M 11w w0y Rd,1,ip
Factors
be 1111y
0y0we t2hbbut
f
ft7r2tb
bw )rt(10t2but )rt(5hb 0101w
Range of validity Same as in Table 10.1, but θ1 ≈ 90°
133

T joint X joint
h0
b0
b1
h1
d1t1
t0
twr
t1
h0
b0
b1
h1
d1t1
t0
twr
t1
h0
b0
b1
h1
t0
r tw
d1t1
t1
h0
b0
b1
h1
t0
r tw
d1t1
t1
K gap joints
N1
b0
h0
N2
h1h2
b1d1
d2
t1t2
t0
twr
12
d1b2
N1
b0
h0
N2
h1h2
b1d1
d2
t1t2
t0
twr
12
d1b2
N1
tw
b0
N2
b1b2
t1t2
t0
h0r
21
h1h2
g = 0,1b0
N1
tw
b0
N2
b1b2
t1t2
t0
h0r
21
h1h2
g = 0,1b0
Fig. 10.1 Welded truss joints between hollow section braces and open section chords
134
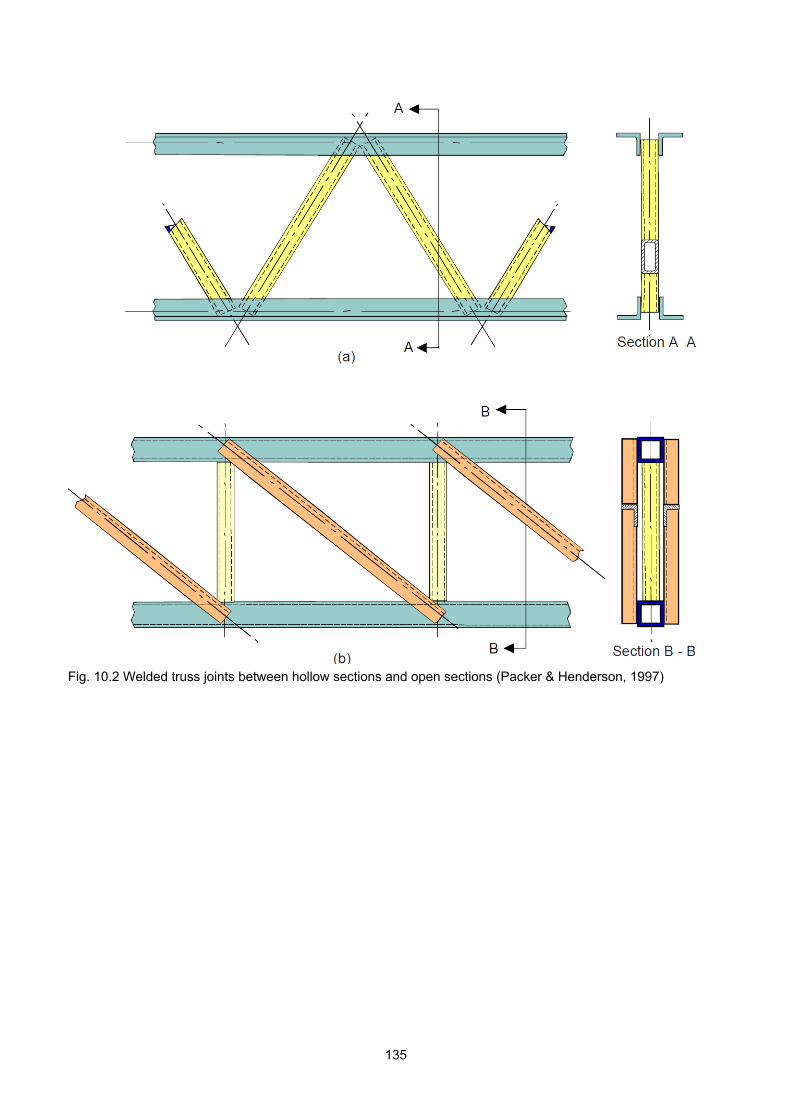
Fig. 10.2 Welded truss joints between hollow sections and open sections (Packer & Henderson, 1997)
135
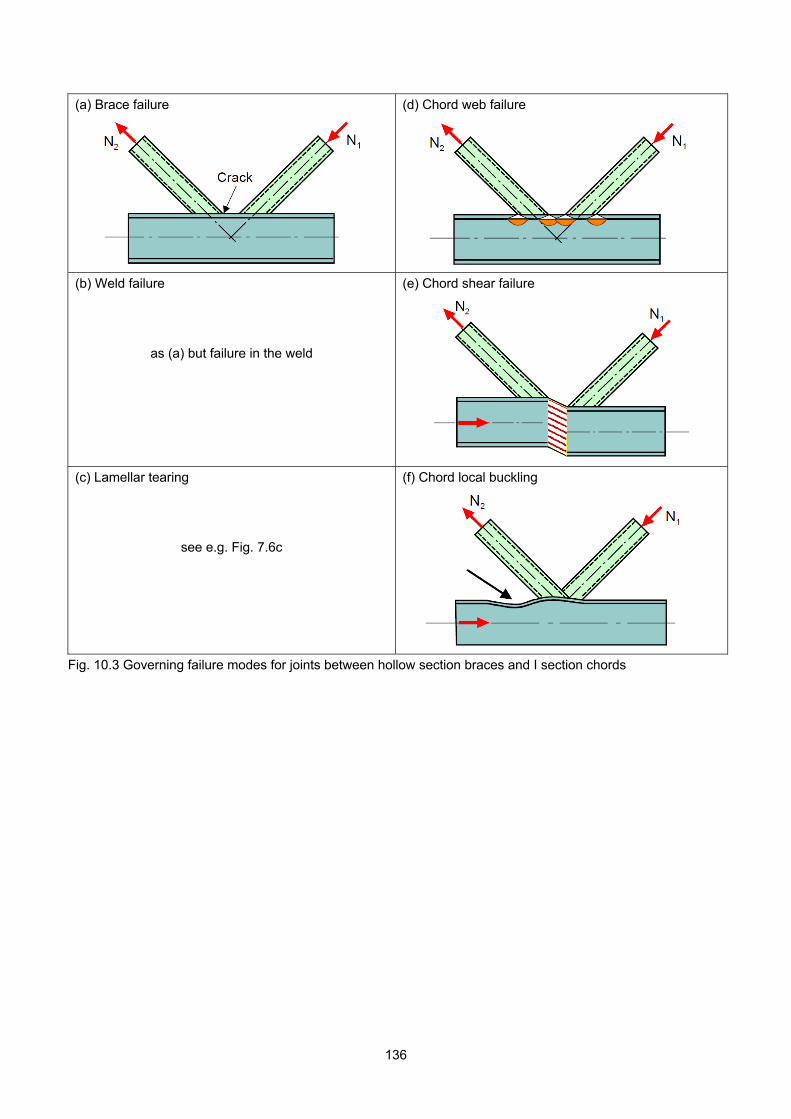
(a) Brace failure
(d) Chord web failure
(b) Weld failure
as (a) but failure in the weld
(e) Chord shear failure
(c) Lamellar tearing
see e.g. Fig. 7.6c
(f) Chord local buckling
Fig. 10.3 Governing failure modes for joints between hollow section braces and I section chords
136
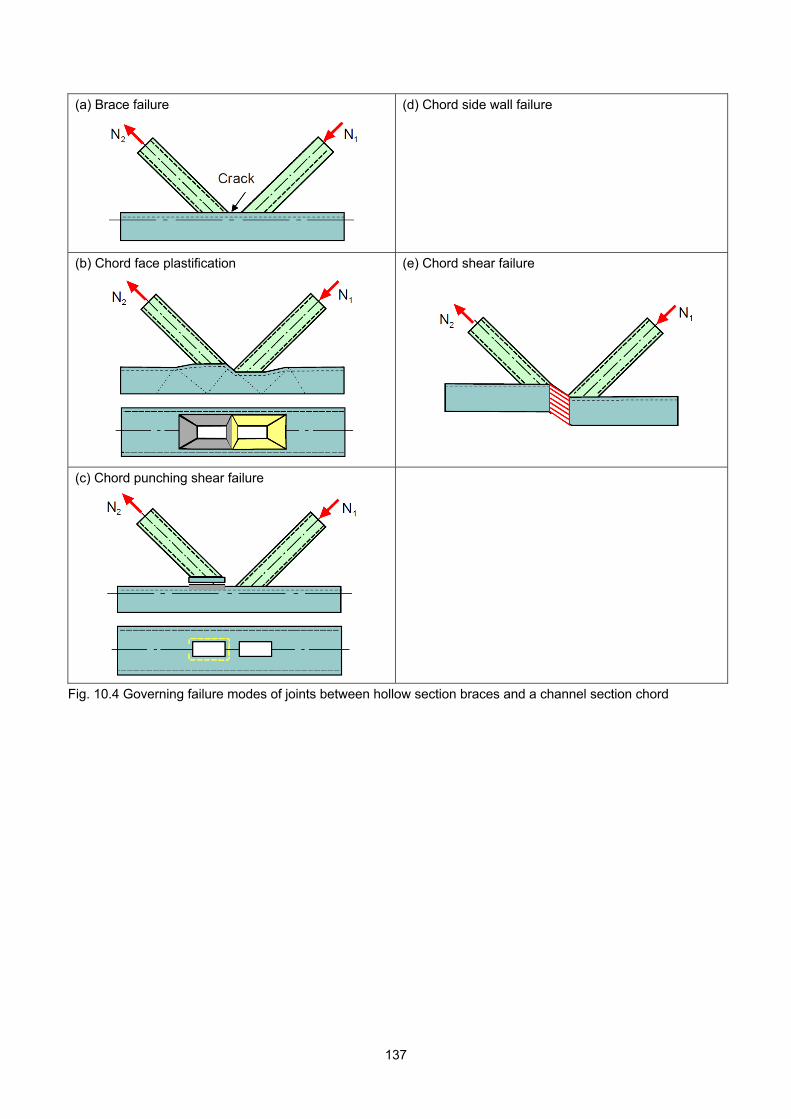
(a) Brace failure
(d) Chord side wall failure
(b) Chord face plastification
(e) Chord shear failure
(c) Chord punching shear failure
Fig. 10.4 Governing failure modes of joints between hollow section braces and a channel section chord
137
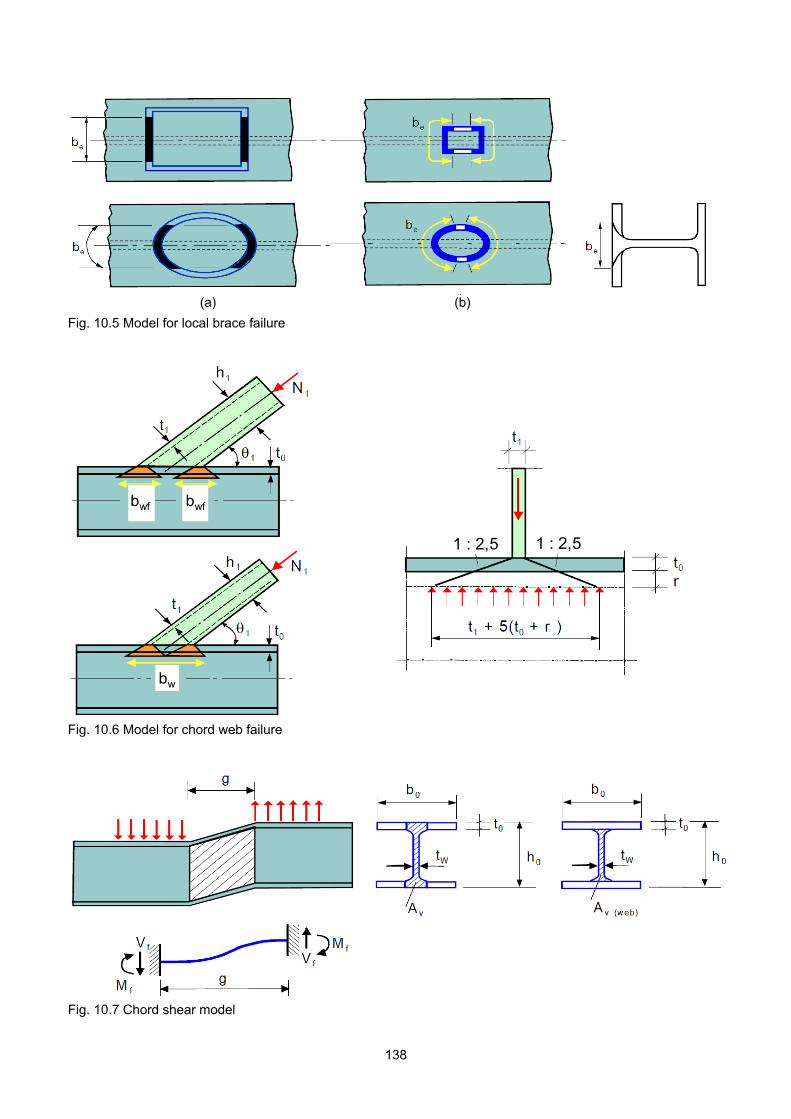
(a) (b)
Fig. 10.5 Model for local brace failure
bwf bwf
bw
1 : 2,5 1 : 2,5
bwf bwf
bw
1 : 2,5 1 : 2,5
Fig. 10.6 Model for chord web failure
Fig. 10.7 Chord shear model
138
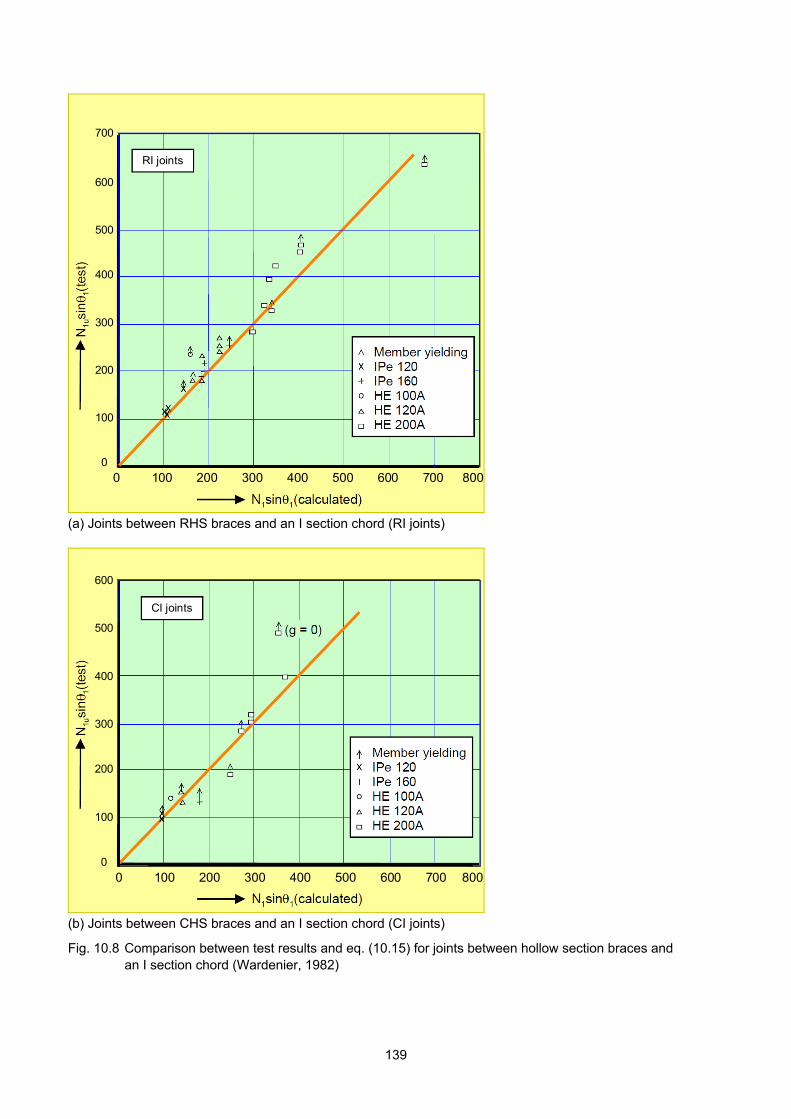
RI joints
700
600
500
400
300
200
100
0
0 100 200 300 400 500 600 700 800
RI joints
700
600
500
400
300
200
100
0
0 100 200 300 400 500 600 700 800
(a) Joints between RHS braces and an I section chord (RI joints)
600
500
400
300
200
100
0
0 100 200 300 400 500 600 700 800
CI joints
600
500
400
300
200
100
0
0 100 200 300 400 500 600 700 800
CI joints
(b) Joints between CHS braces and an I section chord (CI joints)
Fig. 10.8 Comparison between test results and eq. (10.15) for joints between hollow section braces and an I section chord (Wardenier, 1982)
139

11
Fig. 10.9 Local brace failure criterion for moment loading of RHS beam-to-column joints
1
bwf
1
bwf
Fig. 10.10 Column web failure criterion for moment loading
140
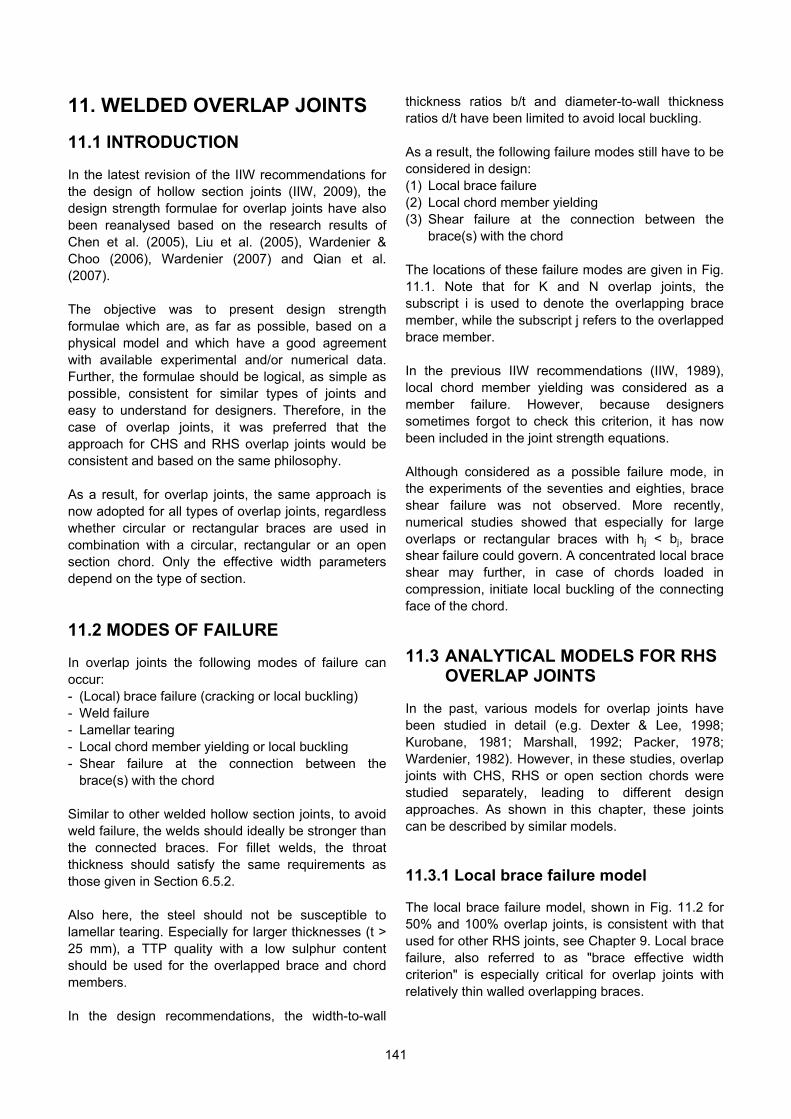
11. WELDED OVERLAP JOINTS
11.1 INTRODUCTION In the latest revision of the IIW recommendations for the design of hollow section joints (IIW, 2009), the design strength formulae for overlap joints have also been reanalysed based on the research results of Chen et al. (2005), Liu et al. (2005), Wardenier & Choo (2006), Wardenier (2007) and Qian et al. (2007). The objective was to present design strength formulae which are, as far as possible, based on a physical model and which have a good agreement with available experimental and/or numerical data. Further, the formulae should be logical, as simple as possible, consistent for similar types of joints and easy to understand for designers. Therefore, in the case of overlap joints, it was preferred that the approach for CHS and RHS overlap joints would be consistent and based on the same philosophy. As a result, for overlap joints, the same approach is now adopted for all types of overlap joints, regardless whether circular or rectangular braces are used in combination with a circular, rectangular or an open section chord. Only the effective width parameters depend on the type of section.
11.2 MODES OF FAILURE In overlap joints the following modes of failure can occur: - (Local) brace failure (cracking or local buckling) - Weld failure - Lamellar tearing - Local chord member yielding or local buckling - Shear failure at the connection between the
brace(s) with the chord Similar to other welded hollow section joints, to avoid weld failure, the welds should ideally be stronger than the connected braces. For fillet welds, the throat thickness should satisfy the same requirements as those given in Section 6.5.2. Also here, the steel should not be susceptible to lamellar tearing. Especially for larger thicknesses (t > 25 mm), a TTP quality with a low sulphur content should be used for the overlapped brace and chord members. In the design recommendations, the width-to-wall
thickness ratios b/t and diameter-to-wall thickness ratios d/t have been limited to avoid local buckling. As a result, the following failure modes still have to be considered in design: (1) Local brace failure (2) Local chord member yielding (3) Shear failure at the connection between the
brace(s) with the chord The locations of these failure modes are given in Fig. 11.1. Note that for K and N overlap joints, the subscript i is used to denote the overlapping brace member, while the subscript j refers to the overlapped brace member. In the previous IIW recommendations (IIW, 1989), local chord member yielding was considered as a member failure. However, because designers sometimes forgot to check this criterion, it has now been included in the joint strength equations. Although considered as a possible failure mode, in the experiments of the seventies and eighties, brace shear failure was not observed. More recently, numerical studies showed that especially for large overlaps or rectangular braces with hj < bj, brace shear failure could govern. A concentrated local brace shear may further, in case of chords loaded in compression, initiate local buckling of the connecting face of the chord.
11.3 ANALYTICAL MODELS FOR RHS OVERLAP JOINTS
In the past, various models for overlap joints have been studied in detail (e.g. Dexter & Lee, 1998; Kurobane, 1981; Marshall, 1992; Packer, 1978; Wardenier, 1982). However, in these studies, overlap joints with CHS, RHS or open section chords were studied separately, leading to different design approaches. As shown in this chapter, these joints can be described by similar models. 11.3.1 Local brace failure model The local brace failure model, shown in Fig. 11.2 for 50% and 100% overlap joints, is consistent with that used for other RHS joints, see Chapter 9. Local brace failure, also referred to as "brace effective width criterion" is especially critical for overlap joints with relatively thin walled overlapping braces.
141
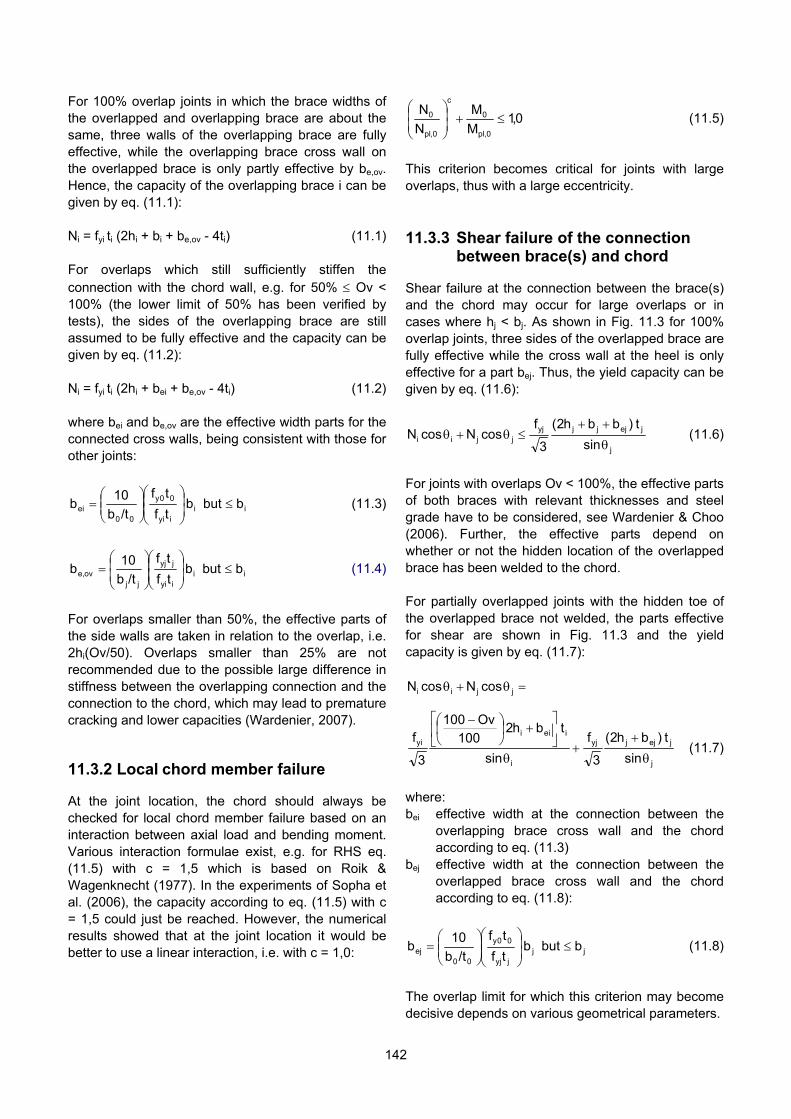
For 100% overlap joints in which the brace widths of the overlapped and overlapping brace are about the same, three walls of the overlapping brace are fully effective, while the overlapping brace cross wall on the overlapped brace is only partly effective by be,ov. Hence, the capacity of the overlapping brace i can be given by eq. (11.1): Ni = fyi ti (2hi + bi + be,ov - 4ti) (11.1) For overlaps which still sufficiently stiffen the connection with the chord wall, e.g. for 50% Ov < 100% (the lower limit of 50% has been verified by tests), the sides of the overlapping brace are still assumed to be fully effective and the capacity can be given by eq. (11.2): Ni = fyi ti (2hi + bei + be,ov - 4ti) (11.2) where bei and be,ov are the effective width parts for the connected cross walls, being consistent with those for other joints:
iiiyi
00y
00ei bbut b
tf
tf
/tb
10b
(11.3)
iiiyi
jyj
jjov,e bbut b
tf
tf
/tb
10b
(11.4)
For overlaps smaller than 50%, the effective parts of the side walls are taken in relation to the overlap, i.e. 2hi(Ov/50). Overlaps smaller than 25% are not recommended due to the possible large difference in stiffness between the overlapping connection and the connection to the chord, which may lead to premature cracking and lower capacities (Wardenier, 2007). 11.3.2 Local chord member failure At the joint location, the chord should always be checked for local chord member failure based on an interaction between axial load and bending moment. Various interaction formulae exist, e.g. for RHS eq. (11.5) with c = 1,5 which is based on Roik & Wagenknecht (1977). In the experiments of Sopha et al. (2006), the capacity according to eq. (11.5) with c = 1,5 could just be reached. However, the numerical results showed that at the joint location it would be better to use a linear interaction, i.e. with c = 1,0:
0,1M
M
N
N
0,pl
0
c
0,pl
0
(11.5)
This criterion becomes critical for joints with large overlaps, thus with a large eccentricity. 11.3.3 Shear failure of the connection
between brace(s) and chord Shear failure at the connection between the brace(s) and the chord may occur for large overlaps or in cases where hj < bj. As shown in Fig. 11.3 for 100% overlap joints, three sides of the overlapped brace are fully effective while the cross wall at the heel is only effective for a part bej. Thus, the yield capacity can be given by eq. (11.6):
j
jejjjyjjjii sin
t )bbh2(
3
fcosNcosN
(11.6)
For joints with overlaps Ov < 100%, the effective parts of both braces with relevant thicknesses and steel grade have to be considered, see Wardenier & Choo (2006). Further, the effective parts depend on whether or not the hidden location of the overlapped brace has been welded to the chord. For partially overlapped joints with the hidden toe of the overlapped brace not welded, the parts effective for shear are shown in Fig. 11.3 and the yield capacity is given by eq. (11.7):
jjii cosNcosN
j
jejjyj
i
ieiiyi
sin
t )bh2(
3
f
sin
t bh2 100
Ov100
3
f
(11.7)
where: bei effective width at the connection between the
overlapping brace cross wall and the chord according to eq. (11.3)
bej effective width at the connection between the overlapped brace cross wall and the chord according to eq. (11.8):
jjjyj
00y
00ej bbut b
tf
tf
/tb
10b
(11.8)
The overlap limit for which this criterion may become decisive depends on various geometrical parameters.
142

11.4 ANALYTICAL MODELS FOR CHS OVERLAP JOINTS
For CHS joints, the same principles are followed as for RHS joints and the criteria are directly related to those of RHS joints (Wardenier, 2007; Qian et al., 2007). For local failure of the overlapping brace, the criteria for overlap joints with RHS braces are multiplied by π/4 to obtain the capacity of CHS brace joints, since π/4 is the ratio of cross sectional areas of thin walled CHS and RHS braces with d = b = h. Further all "b" and "h" dimensions in the formulae are replaced by "d". Since the local stiffness of the joints between CHS-to-CHS members is more uniform than that for RHS-to-RHS members, the constant in the effective width terms of eqs. (11.3), (11.4) and (11.8) is increased by 20%, i.e. changed from 10 to 12. This increase is also found when comparing the efficiency of CHS X joints to that of RHS X joints. Adopting these modifications in eqs. (11.1) and (11.2) results in the functions given in Tables 11.1 and 11.4. Numerical data showed that due to the more uniform stiffness distribution in CHS overlap joints, a single expression, related to the expression for RHS joints with 50% Ov < 100%, can be used to describe the local brace failure of CHS joints with overlaps 25% Ov < 100%. For the local chord yield criterion, eq. (11.5) with c = 1,7 for CHS sections is given, based on Roik & Wagenknecht (1977).
11.5 ANALYTICAL MODELS FOR OVERLAP JOINTS WITH AN OPEN SECTION CHORD
Overlap joints with open section chords behave in principle similar to those with an RHS chord section. Only the effective width terms bei and bej at the connection of the braces with the chord differ. However, these terms are in agreement with the expression used for T, X and K gap joints, see eq. (10.2). For local chord member failure, eq. (11.5) is used with c = 1,0, similar to the equation for overlap joints with an RHS chord. The brace shear criterion is also consistent with overlap joints with an RHS chord, although the
effective width terms bei and bej at the connection of the braces with the chord should again be based on eq. (10.2).
11.6 EXPERIMENTAL AND NUMERICAL VERIFICATION
The equations in Sections 11.3 to 11.5 for local brace failure have been verified with experiments and/or numerical data; for RHS overlap joints in Wardenier (1982), Chen et al. (2005), Liu et al. (2005) and Wardenier & Choo (2006) and for CHS joints in Wardenier (2007) and Qian et al. (2007). For joints with open section chords, the local brace failure criterion was previously evaluated in Wardenier (1982). As an example, Fig. 11.4 shows, for all experimental and numerical data for CHS overlap joints with 25% Ov < 100% in the screened database of Makino et al. (1996), the ratio of the actual capacity and the predicted value using the local brace failure criterion, see Table 11.1. This evaluation gives a mean value of 1,11 with a coefficient of variation (COV) of 6,0%. Due to the non-uniform stiffness distribution in joints with small overlaps, and depending on the geometric parameters, the joint capacity may drop for small overlaps, leading to a large scatter. Therefore, it is proposed to limit the validity of equations for local brace failure to 25% Ov < 100%. As already mentioned in Section 11.3.2, for local chord failure, the experiments by Sopha et al. (2006) just reached the capacity according to eq. (11.5) with c = 1,5. However, the numerical results showed that at the joint location it would be better to use a linear interaction, i.e. with c = 1,0, which is also adopted for open section chords. The available experimental results and numerical data (Chen et al., 2005; Qian et al., 2007) showed that the brace shear criteria, i.e. eqs. (11.6) and (11.7) are too conservative if based on the yield strength fy. Since fracture does not occur but the shear deformation has to be limited to avoid local chord deformation leading to premature chord local buckling, it was proposed to base this strength criterion on the ultimate strength fu of the parts effective for shear. In 1994, Davies & Crocket (1994) already investigated the effect of the welded or non-welded hidden toe of the overlapped brace for RHS joints. They found, for their numerically investigated joints,
143
144
no effect. However, Dexter & Lee (1998) observed for CHS joints with the hidden location welded, a capacity which was about 10% higher than that for joints with no weld. The recent reanalysis for the IIW (2009) recommendations showed that the effect depends on the overlap and the governing criterion. If local brace failure or the local chord yielding is decisive, then welding of the hidden toe of the overlapped brace has no effect on the joint strength. However, if the brace shear criterion is governing, the capacity of the joints with the hidden location welded is about 10% higher than that of the joints with no weld, which agrees with the above results found in the literature. Fig. 11.5 shows, for CHS joints, that the local brace failure criterion and the brace shear criterion with the hidden location welded or unwelded give about the same capacity for an overlap of 60% if the hidden toe location is unwelded and for an overlap of 80% if the hidden toe location is welded. From this comparison, the limits decisive for checking the brace shear criterion are determined. This also explains why, in general, no brace shear failures were observed in the experiments: in most cases the hidden location was welded and the overlap was smaller. For joints with braces with hj < bj, the brace shear criterion can become critical for smaller overlaps.
11.7 JOINT STRENGTH FORMULAE Using the equations developed in Sections 11.3 to 11.5 with modifications based on the experimental and/or numerical data discussed in Section 11.6, the final joint strength equations shown in Table 11.1 have been developed. The range of validity is given in Table 11.2, while details of the parameters used in Table 11.1 are provided in Tables 11.3 and 11.4. Designers who feel the equations for overlap joints with RHS braces are too complicated could, as a (conservative) simplification, neglect the effective width terms (bei + be,ov - 4ti) for the local brace failure criterion and bei and bej for the brace shear criterion, thus reducing many parameters in Table 11.4 to zero or to a certain conservative value. Similar comments apply for dei, de,ov and dej for overlap joints with CHS braces.

Table 11.1 Design axial resistance of uniplanar overlap joints with a CHS, RHS, I or H section chord
Type of joint Design limit state
Axially loaded overlap joints Local failure of overlapping brace
.eff,b i yiRd,i tfN
Local chord member yielding
c = 1,7 for CHS chord
0,1M
M
N
N
Rd,0,pl
Ed,0
c
Rd,0,pl
Ed,0
c = 1,0 for RHS or I section chord
Brace shear (for Ovlimit < Ov 100%) (1)
t 0
N j
j
d j
t j
i
d i
Ni
t i
t 0
N j
ji
Ni b j
h jt jbi
i
t i
h
Rd,sjEd,jiEd,i NcosNcosN (see Table 11.3)
ℓb,eff. (2)
CHS braces RHS braces
25% Ov < 50% iov,eeii.eff,b t4bbh2)50
Ov(
50% Ov < 100%
)t4ddd2(4 iov,eeii.eff,b
iov,eeii.eff,b t4bbh2
Ov = 100% )t4d2d2(4 iov,ei.eff,b
iov,eii.eff,b t4bbh2
General note
The efficiency (i.e. design resistance divided by the yield load) of the overlapped
brace j shall not exceed that of the overlapping brace i, i.e.
yi i
yj jRd,iRd,j fA
fANN
(1) Ovlimit = 60% if hidden toe of the overlapped brace is not welded. Ovlimit = 80% if hidden toe of the overlapped brace is welded. (2) The expressions for dei, de,ov, bei and be,ov are given in Table 11.4.
145
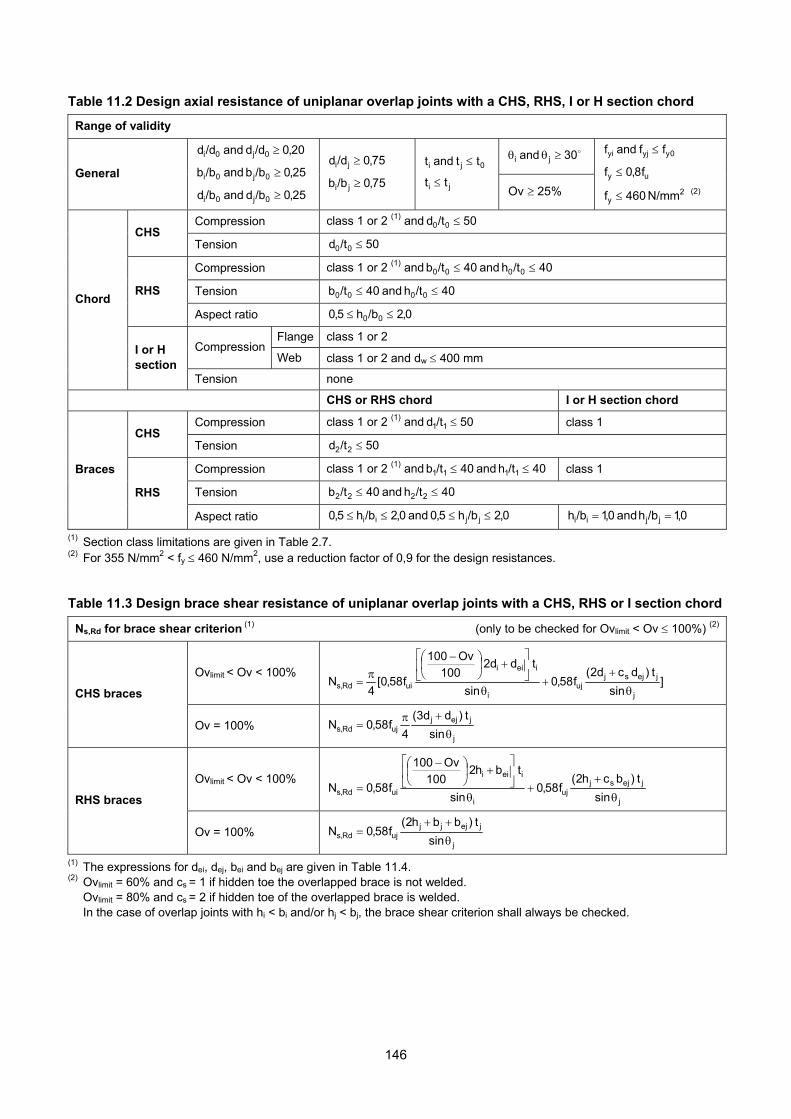
Table 11.2 Design axial resistance of uniplanar overlap joints with a CHS, RHS, I or H section chord
Range of validity
30 and ji
General
20,0 /dd and /dd 0j0i
25,0/bb and /bb 0j0i
25,0/bd and /bd 0j0i
75,0/dd ji
75,0/bb ji
0ji tt and t
ji tt %25Ov
0yyjyi ff and f
uy f8,0f
2y N/mm 460f (2)
Compression class 1 or 2 (1) and 50/td 00 CHS
Tension 50/td 00
Compression class 1 or 2 (1) and 40/th and 40/tb 0000
Tension 40/th and 40/tb 0000 RHS
Aspect ratio 0,2/bh5,0 00
Flange class 1 or 2 Compression
Web class 1 or 2 and dw 400 mm
Chord
I or H section
Tension none
CHS or RHS chord I or H section chord
Compression class 1 or 2 (1) and 50/td 11 class 1 CHS
Tension 50/td 22
Compression class 1 or 2 (1) and 40/th and 40/tb 1111 class 1
Tension 40/th and 40/tb 2222
Braces
RHS
Aspect ratio 0,2/bh5,0 and 0,2/bh5,0 jjii 0,1/bh and 0,1/bh jjii
(1) Section class limitations are given in Table 2.7. (2) For 355 N/mm2 < fy 460 N/mm2, use a reduction factor of 0,9 for the design resistances. Table 11.3 Design brace shear resistance of uniplanar overlap joints with a CHS, RHS or I section chord
Ns,Rd for brace shear criterion (1) (only to be checked for Ovlimit < Ov 100%) (2)
Ovlimit < Ov < 100% ]
sin
t )dcd2(f58,0
sin
t dd2 100
Ov100
f58,0[4
Nj
jej sjuj
i
ieii
uiRd,s
CHS braces
Ov = 100% j
jejjujRd,s sin
t )dd3(
4f58,0N
Ovlimit < Ov < 100%
j
jej sjuj
i
ieii
uiRd,s sin
t )bch2(f58,0
sin
t bh2 100
Ov100
f58,0N
RHS braces
Ov = 100% j
jejjjujRd,s sin
t )bbh2(f58,0N
(1) The expressions for dei, dej, bei and bej are given in Table 11.4. (2) Ovlimit = 60% and cs = 1 if hidden toe the overlapped brace is not welded. Ovlimit = 80% and cs = 2 if hidden toe of the overlapped brace is welded. In the case of overlap joints with hi < bi and/or hj < bj, the brace shear criterion shall always be checked.
146
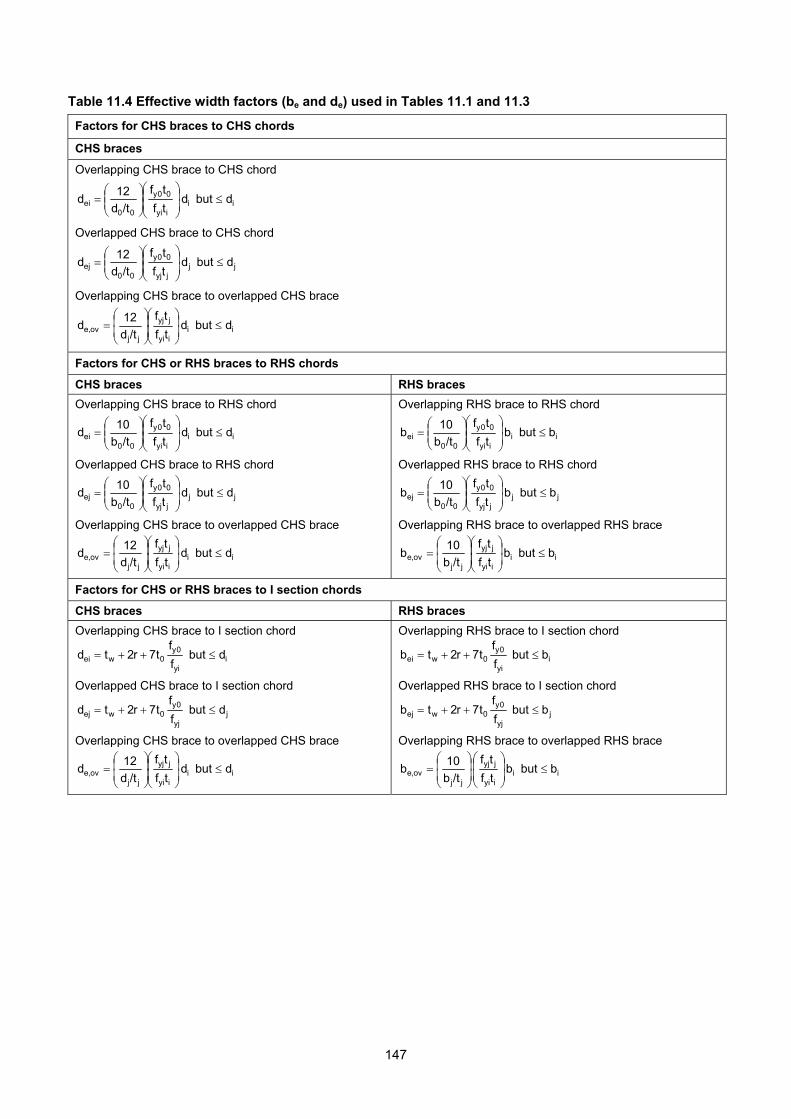
Table 11.4 Effective width factors (be and de) used in Tables 11.1 and 11.3
Factors for CHS braces to CHS chords
CHS braces
Overlapping CHS brace to CHS chord
iiiyi
00y
00ei dbut d
tf
tf
/td
12d
Overlapped CHS brace to CHS chord
jjjyj
00y
00ej dbut d
tf
tf
/td
12d
Overlapping CHS brace to overlapped CHS brace
iiiyi
jyj
jjov,e dbut d
tf
tf
/td
12d
Factors for CHS or RHS braces to RHS chords
CHS braces RHS braces
Overlapping CHS brace to RHS chord
iiiyi
00y
00ei dbut d
tf
tf
/tb
10d
Overlapped CHS brace to RHS chord
jjjyj
00y
00ej dbut d
tf
tf
/tb
10d
Overlapping CHS brace to overlapped CHS brace
iiiyi
jyj
jjov,e dbut d
tf
tf
/td
12d
Overlapping RHS brace to RHS chord
iiiyi
00y
00ei bbut b
tf
tf
/tb
10b
Overlapped RHS brace to RHS chord
jjjyj
00y
00ej bbut b
tf
tf
/tb
10b
Overlapping RHS brace to overlapped RHS brace
iiiyi
jyj
jjov,e bbut b
tf
tf
/tb
10b
Factors for CHS or RHS braces to I section chords
CHS braces RHS braces
Overlapping CHS brace to I section chord
iyi
0y0wei dbut
f
ft7r2td
Overlapped CHS brace to I section chord
jyj
0y0wej dbut
f
ft7r2td
Overlapping CHS brace to overlapped CHS brace
iiiyi
jyj
jjov,e dbut d
tf
tf
/td
12d
Overlapping RHS brace to I section chord
iyi
0y0wei bbut
f
ft7r2tb
Overlapped RHS brace to I section chord
jyj
0y0wej bbut
f
ft7r2tb
Overlapping RHS brace to overlapped RHS brace
iiiyi
jyj
jjov,e bbut b
tf
tf
/tb
10b
147

t0
N0p
hj bj
tj
b0
h0
bi hi
ti
N0
j i
Ni Nj
(2) (2)
(3)
(1)
i = overlapping member and j = overlapped member
Fig. 11.1 Overlap joint with cross sections to be checked (for other sections, the same locations apply) 0,5be,ov 0,5be,ov
b0 0,5bei t0 i i j j h0
Fig. 11.2 Local failure of the overlapping brace for RHS joints with 50% and 100% overlap
hjbj
tjti
hi bi
ji
0,5bej0,5bei
hj / sinj
0,5hi / sini
ti tj
hjbj
tjti
hi bi
ji
0,5bej0,5bei
hj / sinj
0,5hi / sini
ti tj
hjbj
tjti
hi bi
ji
0,5bejbj
hj / sinj
tj
hjbj
tjti
hi bi
ji
0,5bejbj
hj / sinj
tj Fig. 11.3 Effective shear area for RHS joints with 50% (no hidden weld) and 100% overlap
148

CHS 25-100% Overlap joints (excl. brace yielding)
0,0
0,2
0,4
0,6
0,8
1,0
1,2
1,4
0,0 0,2 0,4 0,6 0,8 1,0
N e
xp. / N
lo
cal
bra
ce f
ail
ure
Washio '63
Kurobane '64
Togo '67
Wardenier-de Koning '77
Kurobane '80
Ochi '81
De Koning-Wardenier '81
Kurobane '82
Dexter '94
Fig. 11.4 Ratio of the experimental joint capacity (database Makino et al., 1996) and the capacity based on
the local brace failure criterion (25% Ov < 100%)
Local brace failure vs. brace shear criteria
0,0
0,2
0,4
0,6
0,8
1,0
1,2
0 20 40 60d0/t0
Eff
icie
ncy
Local brace failure
Brace shear; hidden toewelded; Ov = 80%
Brace shear; hidden toenot welded; Ov = 60%
Fig. 11.5 Comparison between the criteria for local brace failure and brace shear with the hidden location
welded or unwelded (for di/ti = 25, di = dj, ti = tj, fyi = fyj, fui = fuj = 1,25fyi, θi = θj = 45°)
149
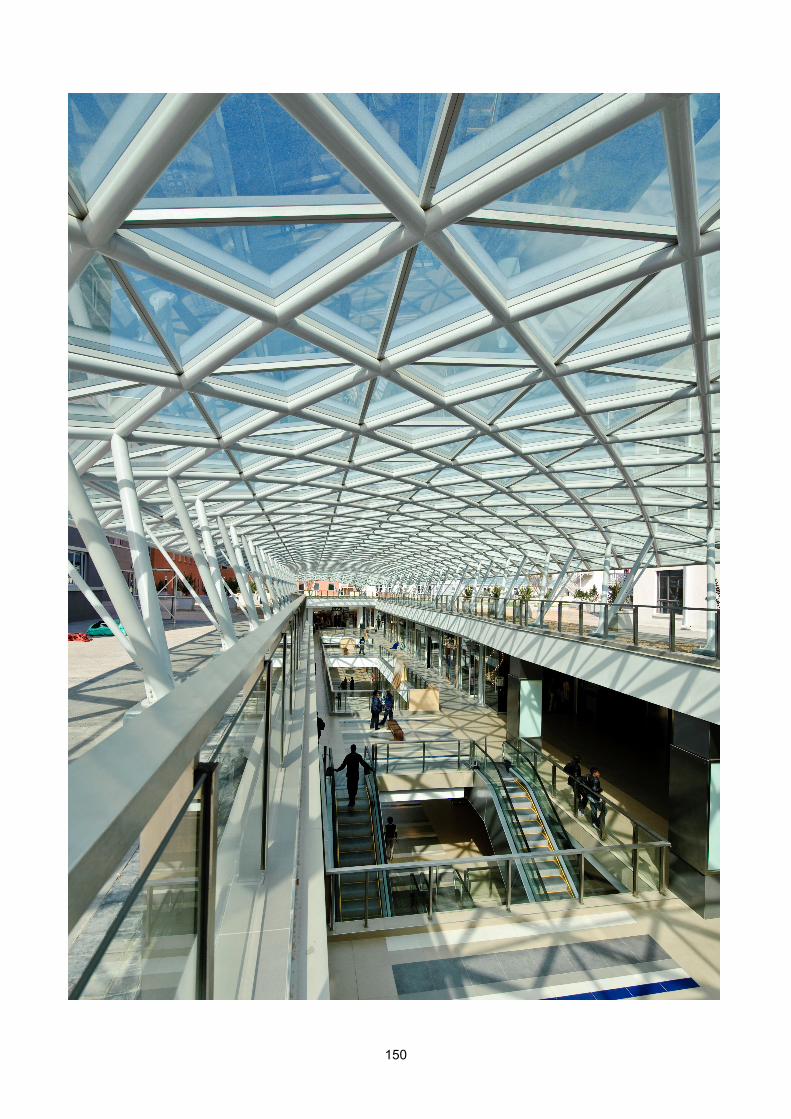
150
12. WELDED I BEAM-TO-CHS OR RHS COLUMN MOMENT JOINTS
12.1 INTRODUCTION Connections in beam-to-column joints can be welded or bolted. This chapter will focus mainly on unstiffened, welded joints between CHS or RHS columns and I section beams, as shown in Fig. 12.1. Examples of some stiffened joints, especially used in earthquake prone regions, e.g. Japan, are shown in Fig. 12.2. In Chapters 8 and 9 it is already stated that the design formulae for hollow section joints loaded by bending moments can be derived in a similar way to that for axially loaded joints. This also applies to beam-to- column joints. For more detailed information, reference can be made to Dutta (2002), Kamba & Tabuchi (1994), Kurobane et al. (2004), Lu (1997), Packer & Henderson (1997) and De Winkel (1998).
12.2 MODES OF FAILURE In a similar way to that described in Chapter 7, various modes of failure (Fig. 12.3) can be identified by following the load transfer through the joint: - Local beam flange failure (yielding, local buckling) - Weld failure - Lamellar tearing - Column plastification (face, wall or cross section) - Column punching shear - Column local buckling - Column shear failure As indicated in Chapter 7, several modes of failure can be avoided, e.g.: - Weld failure, by making the welds stronger than the
connected beam, i.e. for double fillet welds the throat thickness "a" should meet at least 0,5 times the value given in Section 6.5.2.
- Lamellar tearing, by choosing a material quality which is not susceptible to lamellar tearing (TTP quality).
- Local buckling, by limiting the width-to-thickness and/or the diameter-to-thickness ratio.
As a result, the following modes of failure have to be considered for design: - Local failure of the beam flange - Column plastification (face, wall or cross section) - Column punching shear - Column shear failure
12.3 ANALYTICAL MODELS 12.3.1 Local failure of the beam flange The effective width for the beam flange be shown in Fig. 12.4 can be determined from plate-to-CHS or plate-to-RHS joints (see Sections 8.7.2 and 9.7.3 with more detailed information in Section 9.3) because the flange connections are governing. The moment capacity can be expressed by: M1,Rd = N1,Rd (h1 - t1) (12.1) where N1,Rd is the flange capacity for axial loading based on local failure of the beam flange determined in a similar way to that for the joints between hollow sections. Tests on plate-to-CHS column joints showed that, within the range of validity of the formulae, local failure of the plate was not critical compared to the other criteria. For plate-to-RHS column joints, the capacity for local failure of the plate is given by: M1,Rd = fy1 t1 be (h1 - t1) (12.2) where be is similar to that for joints between rectangular hollow sections, see Table 9.1. 12.3.2 Column plastification The plastification of I beam-to-CHS or RHS column joints is not only determined by the connection at the flanges but also by the column depth. The web of the I beam forces the chord face of an RHS column into a different yield line pattern than that which would be observed by two flanges at a certain distance apart, see Fig. 12.5. If the web of the beam was not present, the capacity of the flange could be given according to eq. (12.1) where N1,Rd is the flange capacity based on the column plastification criterion. For example, for an RHS column (with θ1 = 90 and η = t1/b0 which is very small), eq. (9.6) would result in:
)th(1
4tfM 11
200yRd,1
(12.3)
151

If the influence of the web is incorporated, the equation becomes considerably more complicated and reference can be made to Lu (1997). For the chord side wall plastification criterion, similar rules can be used to those for beam-to-column joints between I sections and those used for RHS joints with β =1,0, i.e.
)th(btf 2M 11wf 0 0yRd,1 (12.4)
where:
2
t5h but t5tb 01
01wf
(12.5)
For I beam-to-CHS column joints, the strength of the flange plate connection can be based on the ring model (see Chapter 8) with the resistances given in Table 8.3. However, for moment loading with the beam web included, the formulae become rather complicated and have to be calibrated with test results, resulting in semi-empirical formulae (De Winkel, 1998). 12.3.3 Column punching shear The column punching shear strength of I beam-to- CHS or RHS joints can be directly determined from plate-to-CHS or plate-to-RHS joints (Wardenier et al., 2008a; Packer et al., 2009a). For more detailed information, see Wardenier (1982) and Voth (2010). Here, similar to the criterion for local failure of the beam flange, the flanges are governing because the webs are located at the softest part of the column face and are generally not effective. As shown in Fig. 12.6, the capacity is given by:
)th)(t2b2(t3
fM 111p,e0
0yRd,1 (12.6)
For plate-to-CHS column joints, it was shown that, within the range of application given in Table 8.3, be,p can be taken as b1. For plate-to-RHS column joints, the same be,p can be taken as that given in Table 9.4.
12.3.4 Column shear failure If the beam-to-column joints only have a moment loaded beam on one side, or alternatively the beam moments on either side of the joint do not balance each other, shear forces will act in the column, which may cause shear failure of the column. The cross section of the column has to be checked here for the combined actions of axial load, shear load and bending moment. For class 1 and class 2 sections, the interaction can be based on the Huber-Hencky-Von Mises criterion (Wardenier, 1982) or a suitable, possible stress distribution can be assumed, as e.g. shown in Fig. 12.7b. According to the Huber-Hencky-Von Mises criterion, the following condition applies for a side wall of an RHS column:
222y 3f (12.7)
or:
2
y
2
y 3/ff1
(12.7a)
or:
1V
V
M
M2
Rd,0,pl
Ed,0
2
Rd,0,pl
Ed,0
(12.7b)
1V
V
N
N2
Rd,0,pl
Ed,0
2
Rd,0,pl
Ed,0
(12.7c)
or:
2
Rd,0,pl
Ed,0Rd,0,plRd,0,V,pl V
V1MM
(12.8)
2
Rd,0,pl
Ed,0Rd,0,plRd,0,V,pl V
V1NN
(12.9)
Adding the flange parts (which are not reduced by shear) and conservatively assuming that the effective shear area is 2 hm t0 results in:
2
Rd,0,pl
Ed,00y 0
2 m0y 0 m mRdV,0,pl, V
V1fth 5,0fthbM
(12.10)
152
2
Rd,0,pl
Ed,00y 0 m0y 0 mRd,0,V,pl V
V1fth 2ftb 2N
(12.11) The formulae (12.10) and (12.11) show the plastic capacities for axial loading and moment, reduced by the effect of shear. In a similar way, the interaction between axial load and bending moment can be derived (Wardenier, 1982). By introducing Npl,V,0,Rd and Mpl,V,0,Rd instead of Npl,0,Rd and Mpl,0,Rd, the full interaction can be obtained. In the standards (EN 1993-1-1, 2005) these formulae are approximated by simpler formulae. Also, the effect of small shear loads has been neglected, e.g. for V0,Ed 0,5 Vpl,0,Rd.
12.4 EXPERIMENTAL AND NUMERICAL VERIFICATION
Most of the initial tests on plate-to-CHS and I beam-to-CHS joints were carried out in Japan (Makino et al., 1991; Kamba & Tabuchi, 1994). A good survey of all existing evidence on beam-to-CHS column joints, including many tests on stiffened joints, is given by Kamba & Tabuchi (1994). Later work by De Winkel (1998) concentrated on a numerical parameter study with experiments carried out for validation of the numerical models. This study not only dealt with simple, unstiffened joints, but also with I beam-to-CHS column joints in which the column was filled with concrete and/or combined with a composite steel-concrete floor. A similar investigation to that carried out by De Winkel (1998) was done by Lu (1997) for plate and I beam-to-RHS column joints. Stiffened joints with strips welded at the sides of the flanges were investigated by Shanmugam et al. (1993) i.e. the cross section of the flange at the connection with the RHS column also had an I shape.
12.5 BASIC JOINT STRENGTH FORMULAE
In the studies mentioned in Section 12.4 on unstiffened RHS joints, strength formulae have been determined using analytical models as a basis. These formulae have been modified to fit the numerical data. Since the strength data have been based on a
deformation criterion of 3% of the chord width, the resulting formulae for plate-to-RHS column joints give, for low β ratios, lower strengths than those based on the yield line method. At present, only strength functions are established for uniplanar and multiplanar joints, but no formulae have been developed for the stiffness, although the stiffness is extremely important for the determination of the moment distribution in unbraced frames. However, a large number of moment-rotation diagrams is available for a wide range of parameters. From these moment-rotation diagrams (Lu, 1997; De Winkel, 1998) indications can be obtained for the stiffness. The effect of the joint stiffness on the elastic moment distribution is represented in Figs. 12.8 and 12.9. It is shown that with semi-rigid joints the elastic moment distribution can be influenced considerably. If a rigid-plastic analysis is used, not only is the joint moment resistance of primary importance, but also the rotation capacity. For example, if the stiffness of the beam-to-column joints in Fig. 12.8 is very low, the plastic moment capacity of the beam at mid-span Mpl,Rd may be reached first. The moment capacity of the end joints Mj,Rd can only be attained if the beam has sufficient rotation capacity at the location of the plastic moment. In the case of joints with a very low stiffness, this might not be the case, e.g. see curve "e" in Fig. 12.10. If the stiffness of the joint is high, the (partial) strength capacity of the beam-to-column joints (e.g. curve "b" in Fig. 12.10) may be reached first. Now, these joints should have sufficient deformation capacity to allow the plastic moment capacity of the beam at mid-span to be attained. The joints with behaviour "a" or "c" are stronger than the connected beam, thus the beam should have sufficient deformation capacity if the plastic moment is reached first at the ends. Hence, for an accurate analysis of frames with semi-rigid joints, an appropriate description of the moment-rotation behaviour is required as well as evidence regarding: - Stiffness (at serviceability and at the ultimate limit
state) - Strength (ultimate limit state) - Rotation capacity However, all this information is not yet generally available for beam-to-tubular column joints, although research has been initiated by Weynand et al. (2006).
153

154
Alternative options are to use joints with such a stiffness that the joints can be classified as (nearly) rigid or (nearly) pinned. For both cases, limits can be defined. However, the deflections can only be determined properly if the joint stiffnesses are known (Fig. 12.11). Part 8 of Eurocode 3 (EN 1993-1-8, 2005) provides stiffness classifications, see Fig. 12.12. A possible joint modelling approach is given in Fig. 12.13. For I beam-to-tubular column joints, the factors c1 and c2 still have to be defined. Another complication is that the axial loads and moments in the column do not only affect the strength but also the stiffness, as shown by the curve in Fig. 12.13 for N0 ≠ 0.
12.6 CONCLUDING REMARKS The design recommendations in CIDECT Design Guide No. 9 (Kurobane et al., 2004) give strength functions for beam-to-CHS and beam-to-RHS column joints. This chapter intends to give basic background information without going too much into detail in the resulting design formulae. The design of frames with semi-rigid joints is not typical for tubular structures and is therefore not described here in detail.
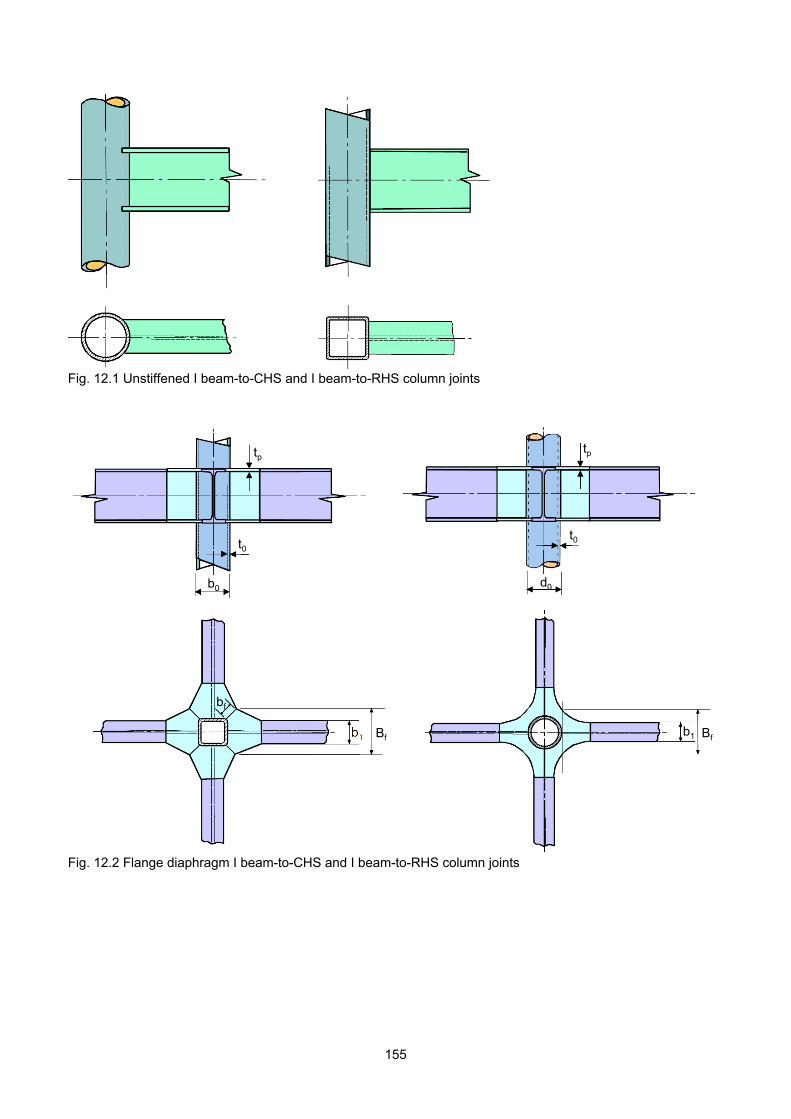
Fig. 12.1 Unstiffened I beam-to-CHS and I beam-to-RHS column joints
Bf
d0
t0
Bfb1
tp
b0
t0
tp
bf
Bf
d0
t0
Bfb1
tp
b0
t0
tp
bf
Fig. 12.2 Flange diaphragm I beam-to-CHS and I beam-to-RHS column joints
155
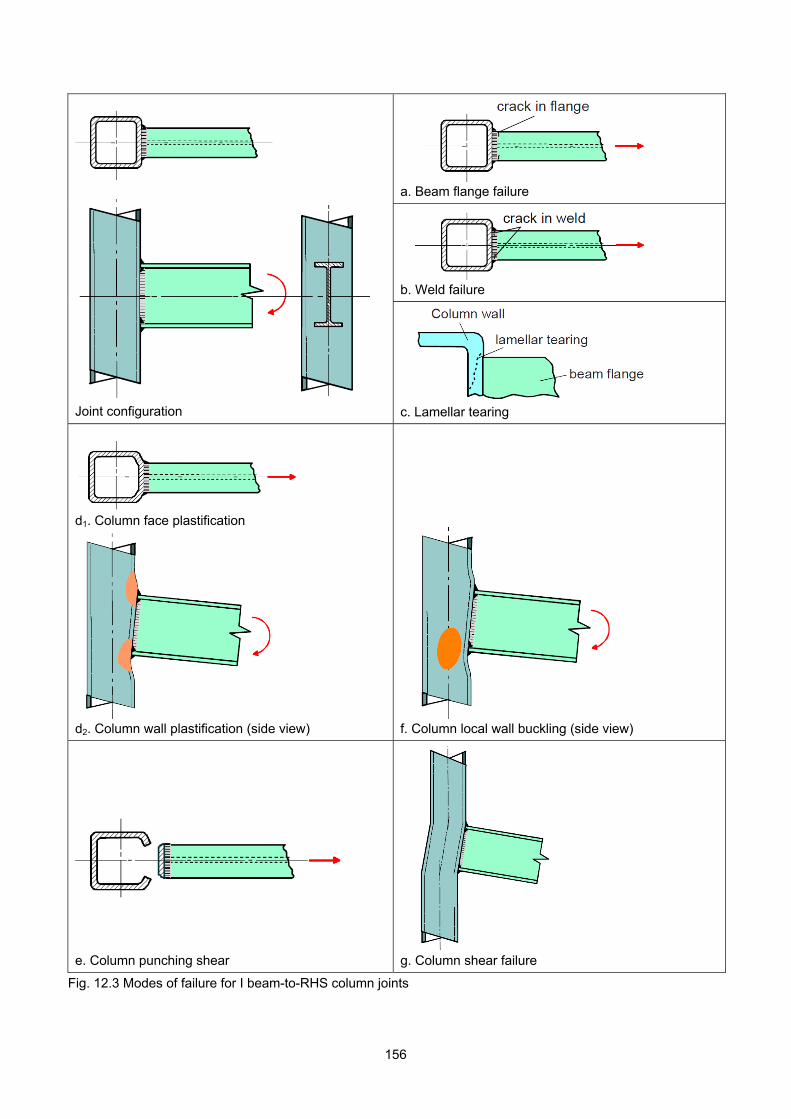
a. Beam flange failure
b. Weld failure
Joint configuration
c. Lamellar tearing
d1. Column face plastification
d2. Column wall plastification (side view)
f. Column local wall buckling (side view)
e. Column punching shear
g. Column shear failure
Fig. 12.3 Modes of failure for I beam-to-RHS column joints
156
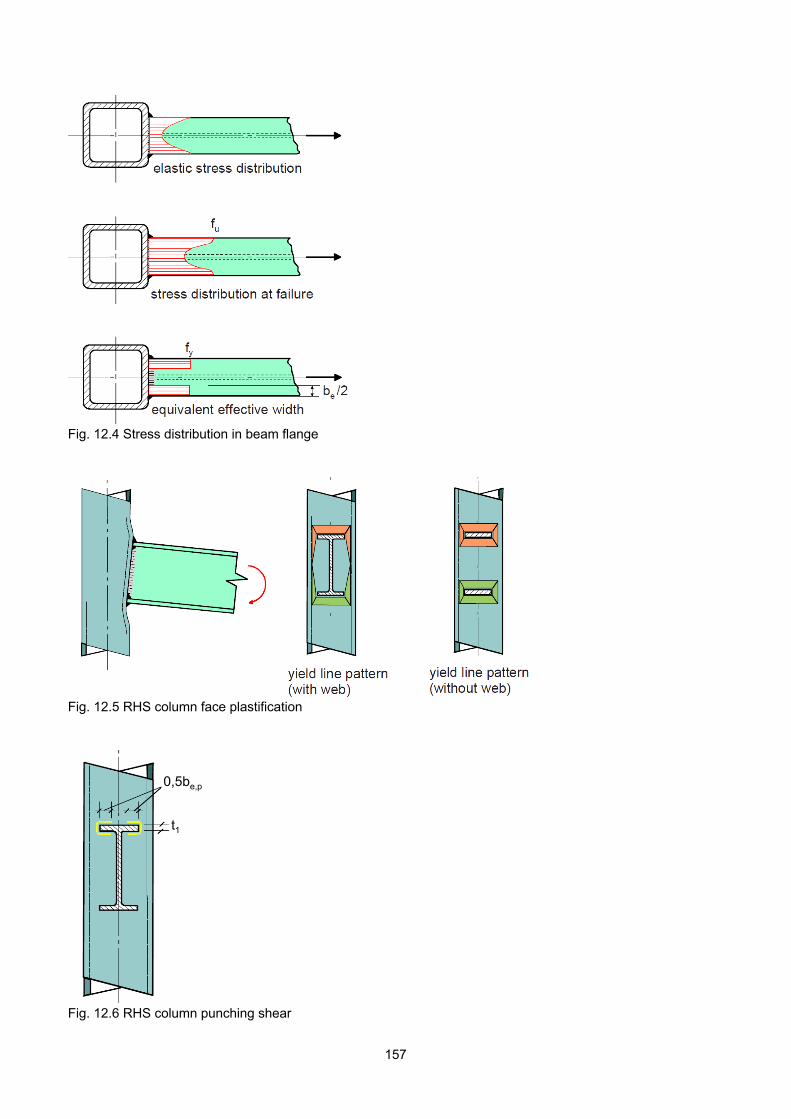
Fig. 12.4 Stress distribution in beam flange
Fig. 12.5 RHS column face plastification
t1
0,5be,p
t1
0,5be,p
Fig. 12.6 RHS column punching shear
157
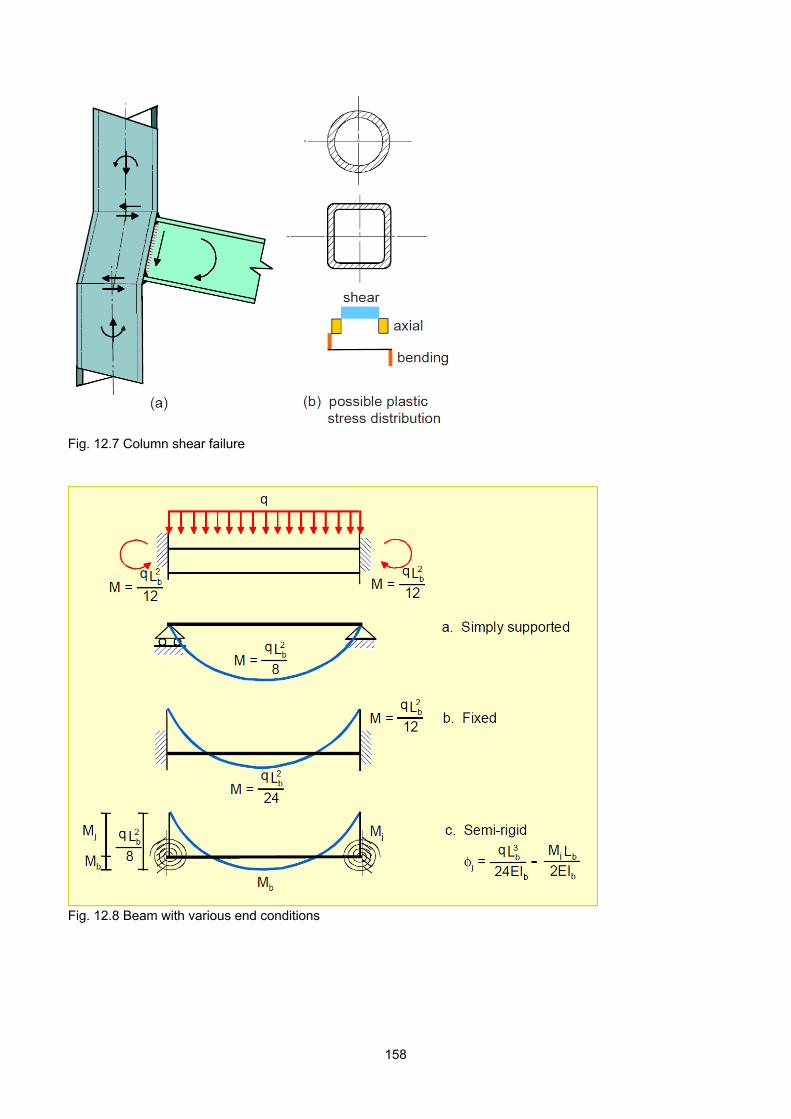
Fig. 12.7 Column shear failure
Fig. 12.8 Beam with various end conditions
158
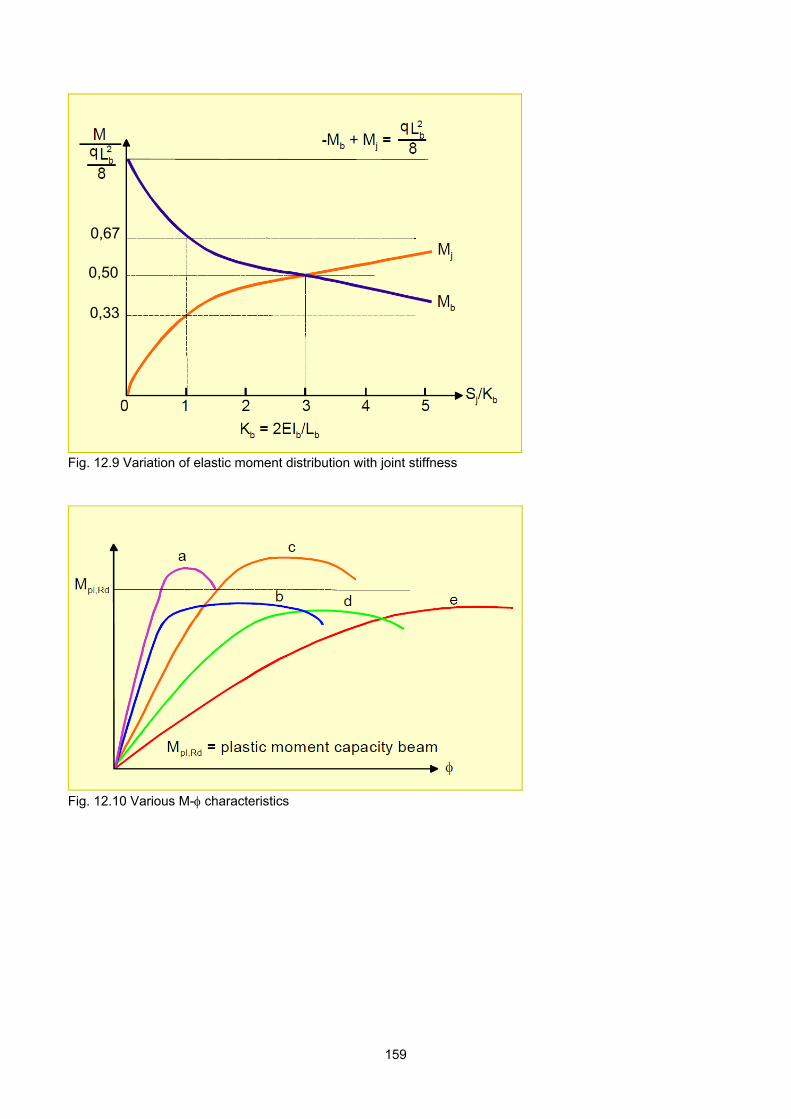
0,67
0,50
0,33
0,67
0,50
0,33
Fig. 12.9 Variation of elastic moment distribution with joint stiffness
Fig. 12.10 Various M- characteristics
159
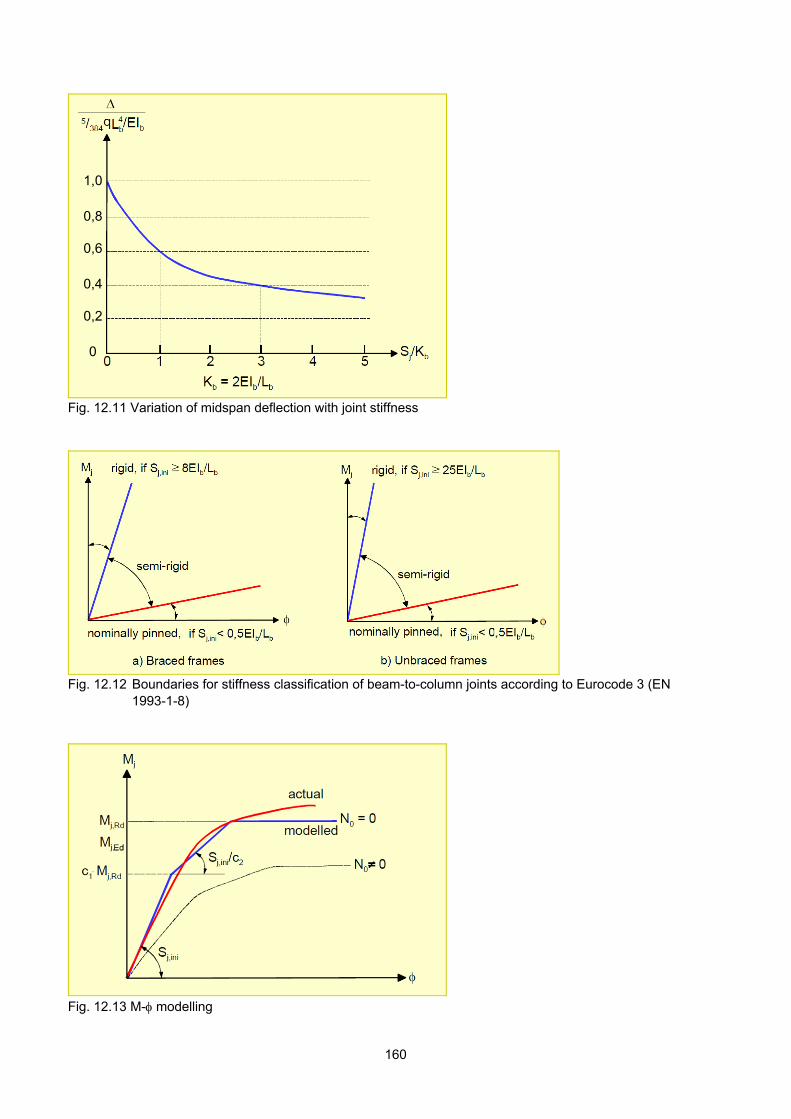
1,0
0,8
0,6
0,4
0,2
0
1,0
0,8
0,6
0,4
0,2
0
Fig. 12.11 Variation of midspan deflection with joint stiffness
, ,, ,
Fig. 12.12 Boundaries for stiffness classification of beam-to-column joints according to Eurocode 3 (EN
1993-1-8)
EdEd
Fig. 12.13 M- modelling
160
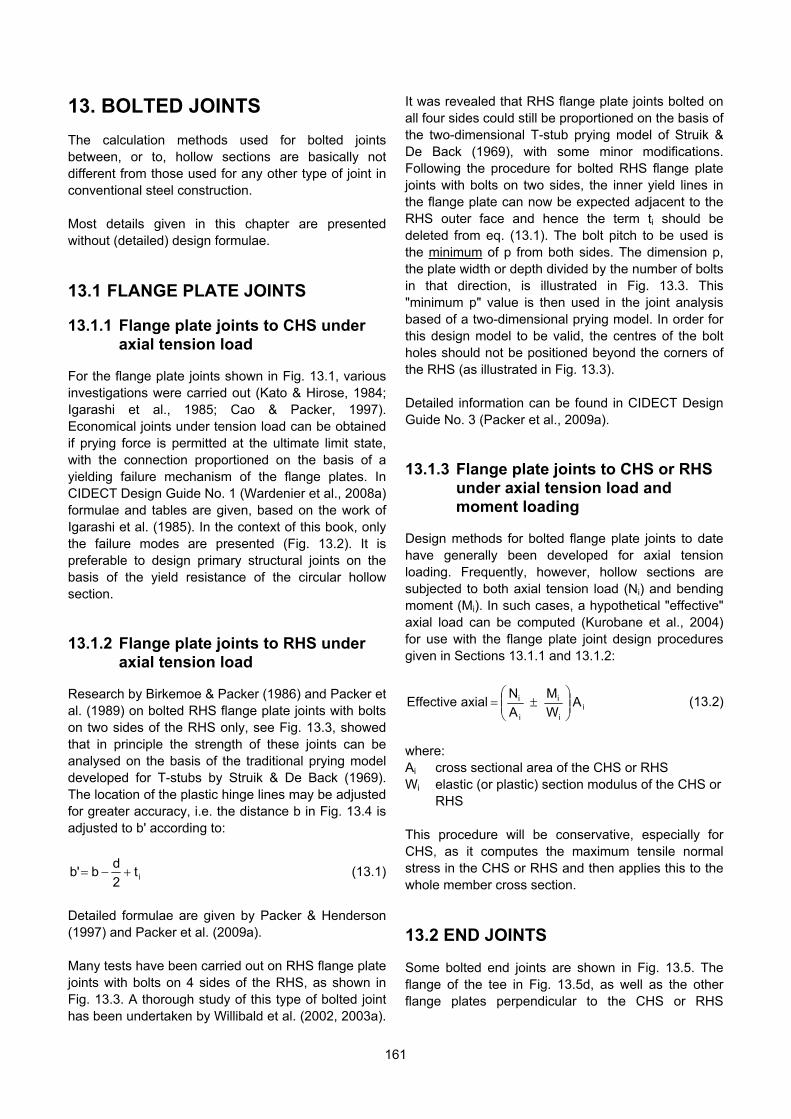
13. BOLTED JOINTS The calculation methods used for bolted joints between, or to, hollow sections are basically not different from those used for any other type of joint in conventional steel construction. Most details given in this chapter are presented without (detailed) design formulae.
13.1 FLANGE PLATE JOINTS 13.1.1 Flange plate joints to CHS under
axial tension load For the flange plate joints shown in Fig. 13.1, various investigations were carried out (Kato & Hirose, 1984; Igarashi et al., 1985; Cao & Packer, 1997). Economical joints under tension load can be obtained if prying force is permitted at the ultimate limit state, with the connection proportioned on the basis of a yielding failure mechanism of the flange plates. In CIDECT Design Guide No. 1 (Wardenier et al., 2008a) formulae and tables are given, based on the work of Igarashi et al. (1985). In the context of this book, only the failure modes are presented (Fig. 13.2). It is preferable to design primary structural joints on the basis of the yield resistance of the circular hollow section. 13.1.2 Flange plate joints to RHS under
axial tension load Research by Birkemoe & Packer (1986) and Packer et al. (1989) on bolted RHS flange plate joints with bolts on two sides of the RHS only, see Fig. 13.3, showed that in principle the strength of these joints can be analysed on the basis of the traditional prying model developed for T-stubs by Struik & De Back (1969). The location of the plastic hinge lines may be adjusted for greater accuracy, i.e. the distance b in Fig. 13.4 is adjusted to b' according to:
it2
db'b (13.1)
Detailed formulae are given by Packer & Henderson (1997) and Packer et al. (2009a). Many tests have been carried out on RHS flange plate joints with bolts on 4 sides of the RHS, as shown in Fig. 13.3. A thorough study of this type of bolted joint has been undertaken by Willibald et al. (2002, 2003a).
It was revealed that RHS flange plate joints bolted on all four sides could still be proportioned on the basis of the two-dimensional T-stub prying model of Struik & De Back (1969), with some minor modifications. Following the procedure for bolted RHS flange plate joints with bolts on two sides, the inner yield lines in the flange plate can now be expected adjacent to the RHS outer face and hence the term ti should be deleted from eq. (13.1). The bolt pitch to be used is the minimum of p from both sides. The dimension p, the plate width or depth divided by the number of bolts in that direction, is illustrated in Fig. 13.3. This "minimum p" value is then used in the joint analysis based of a two-dimensional prying model. In order for this design model to be valid, the centres of the bolt holes should not be positioned beyond the corners of the RHS (as illustrated in Fig. 13.3). Detailed information can be found in CIDECT Design Guide No. 3 (Packer et al., 2009a). 13.1.3 Flange plate joints to CHS or RHS
under axial tension load and moment loading
Design methods for bolted flange plate joints to date have generally been developed for axial tension loading. Frequently, however, hollow sections are subjected to both axial tension load (Ni) and bending moment (Mi). In such cases, a hypothetical "effective" axial load can be computed (Kurobane et al., 2004) for use with the flange plate joint design procedures given in Sections 13.1.1 and 13.1.2:
ii
i
i
i A W
M
A
N axial Effective
(13.2)
where: Ai cross sectional area of the CHS or RHS Wi elastic (or plastic) section modulus of the CHS or
RHS This procedure will be conservative, especially for CHS, as it computes the maximum tensile normal stress in the CHS or RHS and then applies this to the whole member cross section.
13.2 END JOINTS Some bolted end joints are shown in Fig. 13.5. The flange of the tee in Fig. 13.5d, as well as the other flange plates perpendicular to the CHS or RHS
161
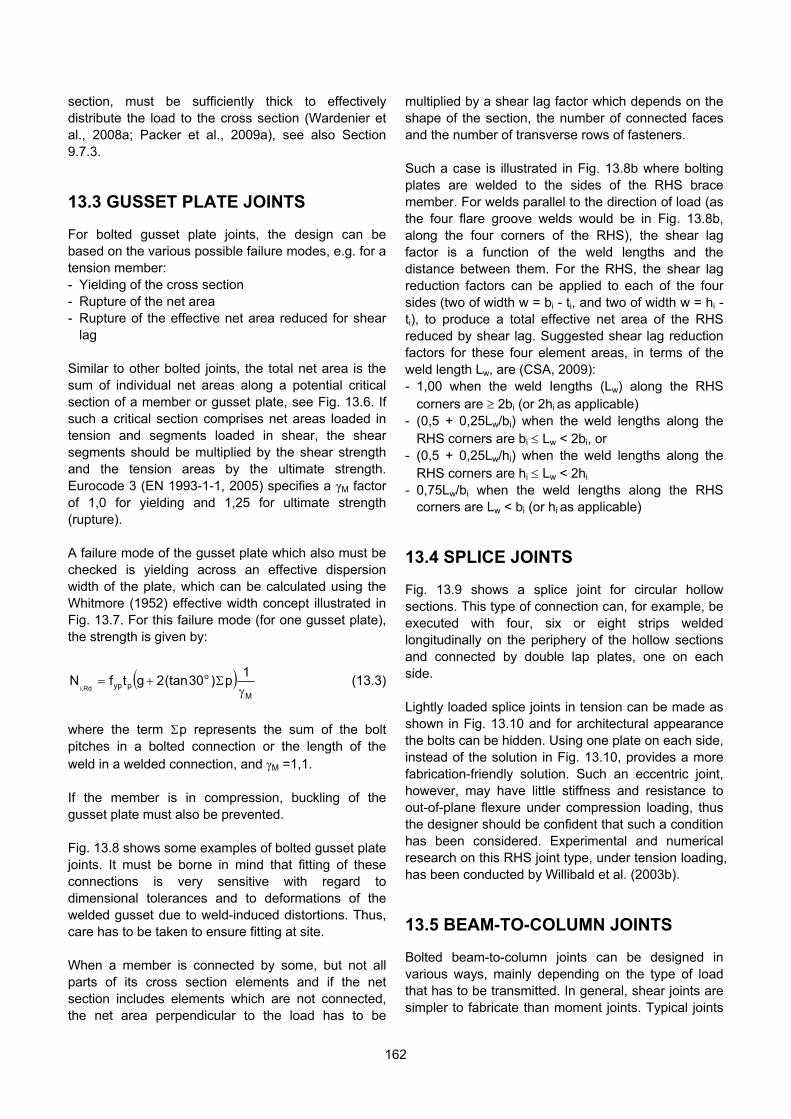
section, must be sufficiently thick to effectively distribute the load to the cross section (Wardenier et al., 2008a; Packer et al., 2009a), see also Section 9.7.3.
13.3 GUSSET PLATE JOINTS For bolted gusset plate joints, the design can be based on the various possible failure modes, e.g. for a tension member: - Yielding of the cross section - Rupture of the net area - Rupture of the effective net area reduced for shear
lag Similar to other bolted joints, the total net area is the sum of individual net areas along a potential critical section of a member or gusset plate, see Fig. 13.6. If such a critical section comprises net areas loaded in tension and segments loaded in shear, the shear segments should be multiplied by the shear strength and the tension areas by the ultimate strength. Eurocode 3 (EN 1993-1-1, 2005) specifies a γM factor of 1,0 for yielding and 1,25 for ultimate strength (rupture). A failure mode of the gusset plate which also must be checked is yielding across an effective dispersion width of the plate, which can be calculated using the Whitmore (1952) effective width concept illustrated in Fig. 13.7. For this failure mode (for one gusset plate), the strength is given by:
M
o
pyp
1p)30(tan2gtfN
Rd,i (13.3)
where the term p represents the sum of the bolt pitches in a bolted connection or the length of the weld in a welded connection, and M =1,1. If the member is in compression, buckling of the gusset plate must also be prevented. Fig. 13.8 shows some examples of bolted gusset plate joints. It must be borne in mind that fitting of these connections is very sensitive with regard to dimensional tolerances and to deformations of the welded gusset due to weld-induced distortions. Thus, care has to be taken to ensure fitting at site. When a member is connected by some, but not all parts of its cross section elements and if the net section includes elements which are not connected, the net area perpendicular to the load has to be
multiplied by a shear lag factor which depends on the shape of the section, the number of connected faces and the number of transverse rows of fasteners. Such a case is illustrated in Fig. 13.8b where bolting plates are welded to the sides of the RHS brace member. For welds parallel to the direction of load (as the four flare groove welds would be in Fig. 13.8b, along the four corners of the RHS), the shear lag factor is a function of the weld lengths and the distance between them. For the RHS, the shear lag reduction factors can be applied to each of the four sides (two of width w = bi - ti, and two of width w = hi - ti), to produce a total effective net area of the RHS reduced by shear lag. Suggested shear lag reduction factors for these four element areas, in terms of the weld length Lw, are (CSA, 2009): - 1,00 when the weld Iengths (Lw) along the RHS
corners are 2bi (or 2hi as applicable) - (0,5 + 0,25Lw/bi) when the weld lengths along the
RHS corners are bi Lw < 2bi, or - (0,5 + 0,25Lw/hi) when the weld lengths along the
RHS corners are hi Lw < 2hi - 0,75Lw/bi when the weld lengths along the RHS
corners are Lw < bi (or hi as applicable)
13.4 SPLICE JOINTS Fig. 13.9 shows a splice joint for circular hollow sections. This type of connection can, for example, be executed with four, six or eight strips welded longitudinally on the periphery of the hollow sections and connected by double lap plates, one on each side. Lightly loaded splice joints in tension can be made as shown in Fig. 13.10 and for architectural appearance the bolts can be hidden. Using one plate on each side, instead of the solution in Fig. 13.10, provides a more fabrication-friendly solution. Such an eccentric joint, however, may have little stiffness and resistance to out-of-plane flexure under compression loading, thus the designer should be confident that such a condition has been considered. Experimental and numerical research on this RHS joint type, under tension loading, has been conducted by Willibald et al. (2003b).
13.5 BEAM-TO-COLUMN JOINTS Bolted beam-to-column joints can be designed in various ways, mainly depending on the type of load that has to be transmitted. In general, shear joints are simpler to fabricate than moment joints. Typical joints
162
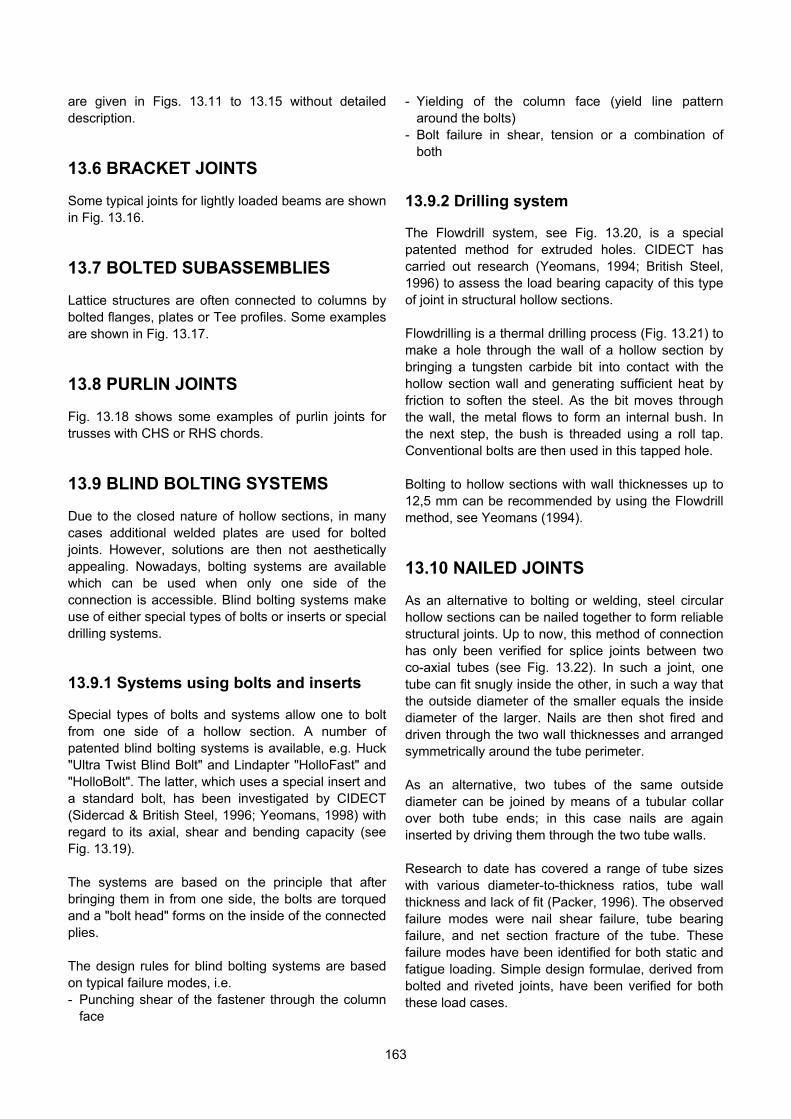
163
are given in Figs. 13.11 to 13.15 without detailed description.
13.6 BRACKET JOINTS Some typical joints for lightly loaded beams are shown in Fig. 13.16.
13.7 BOLTED SUBASSEMBLIES Lattice structures are often connected to columns by bolted flanges, plates or Tee profiles. Some examples are shown in Fig. 13.17.
13.8 PURLIN JOINTS Fig. 13.18 shows some examples of purlin joints for trusses with CHS or RHS chords.
13.9 BLIND BOLTING SYSTEMS Due to the closed nature of hollow sections, in many cases additional welded plates are used for bolted joints. However, solutions are then not aesthetically appealing. Nowadays, bolting systems are available which can be used when only one side of the connection is accessible. Blind bolting systems make use of either special types of bolts or inserts or special drilling systems. 13.9.1 Systems using bolts and inserts Special types of bolts and systems allow one to bolt from one side of a hollow section. A number of patented blind bolting systems is available, e.g. Huck "Ultra Twist Blind Bolt" and Lindapter "HolloFast" and "HolloBolt". The latter, which uses a special insert and a standard bolt, has been investigated by CIDECT (Sidercad & British Steel, 1996; Yeomans, 1998) with regard to its axial, shear and bending capacity (see Fig. 13.19). The systems are based on the principle that after bringing them in from one side, the bolts are torqued and a "bolt head" forms on the inside of the connected plies. The design rules for blind bolting systems are based on typical failure modes, i.e. - Punching shear of the fastener through the column
face
- Yielding of the column face (yield line pattern around the bolts)
- Bolt failure in shear, tension or a combination of both
13.9.2 Drilling system The Flowdrill system, see Fig. 13.20, is a special patented method for extruded holes. CIDECT has carried out research (Yeomans, 1994; British Steel, 1996) to assess the load bearing capacity of this type of joint in structural hollow sections. Flowdrilling is a thermal drilling process (Fig. 13.21) to make a hole through the wall of a hollow section by bringing a tungsten carbide bit into contact with the hollow section wall and generating sufficient heat by friction to soften the steel. As the bit moves through the wall, the metal flows to form an internal bush. In the next step, the bush is threaded using a roll tap. Conventional bolts are then used in this tapped hole. Bolting to hollow sections with wall thicknesses up to 12,5 mm can be recommended by using the Flowdrill method, see Yeomans (1994).
13.10 NAILED JOINTS As an alternative to bolting or welding, steel circular hollow sections can be nailed together to form reliable structural joints. Up to now, this method of connection has only been verified for splice joints between two co-axial tubes (see Fig. 13.22). In such a joint, one tube can fit snugly inside the other, in such a way that the outside diameter of the smaller equals the inside diameter of the larger. Nails are then shot fired and driven through the two wall thicknesses and arranged symmetrically around the tube perimeter. As an alternative, two tubes of the same outside diameter can be joined by means of a tubular collar over both tube ends; in this case nails are again inserted by driving them through the two tube walls. Research to date has covered a range of tube sizes with various diameter-to-thickness ratios, tube wall thickness and lack of fit (Packer, 1996). The observed failure modes were nail shear failure, tube bearing failure, and net section fracture of the tube. These failure modes have been identified for both static and fatigue loading. Simple design formulae, derived from bolted and riveted joints, have been verified for both these load cases.
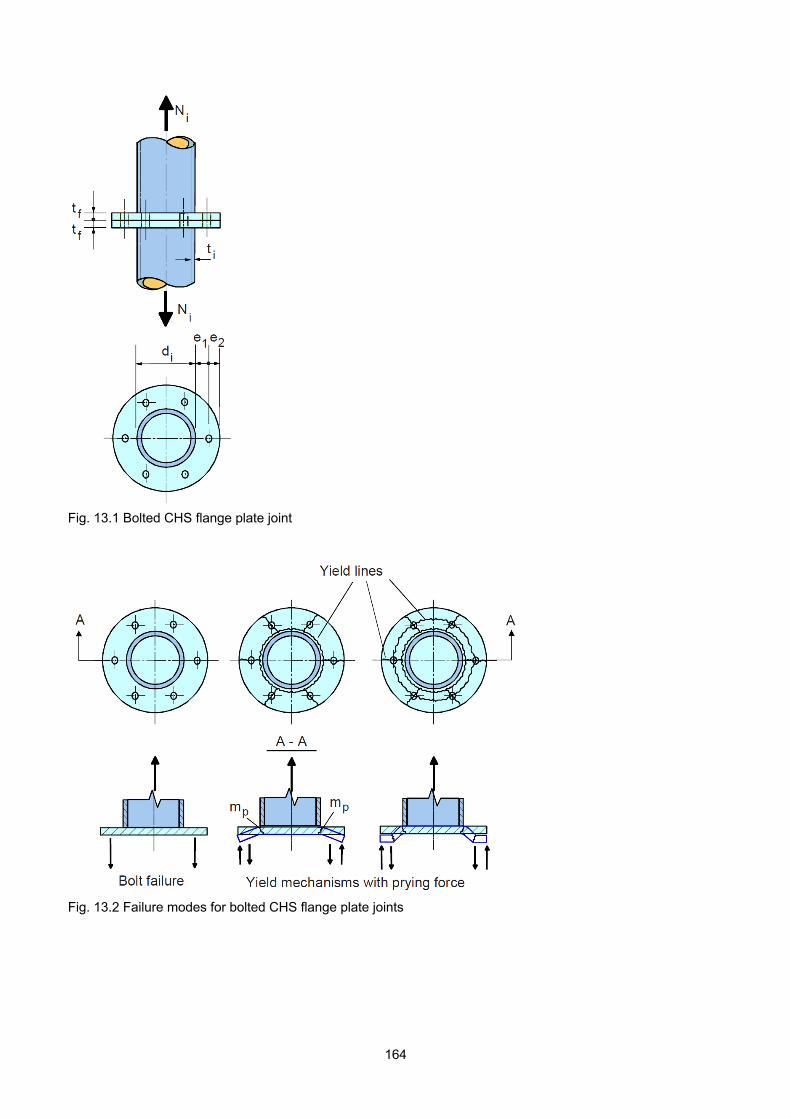
Fig. 13.1 Bolted CHS flange plate joint
Fig. 13.2 Failure modes for bolted CHS flange plate joints
164
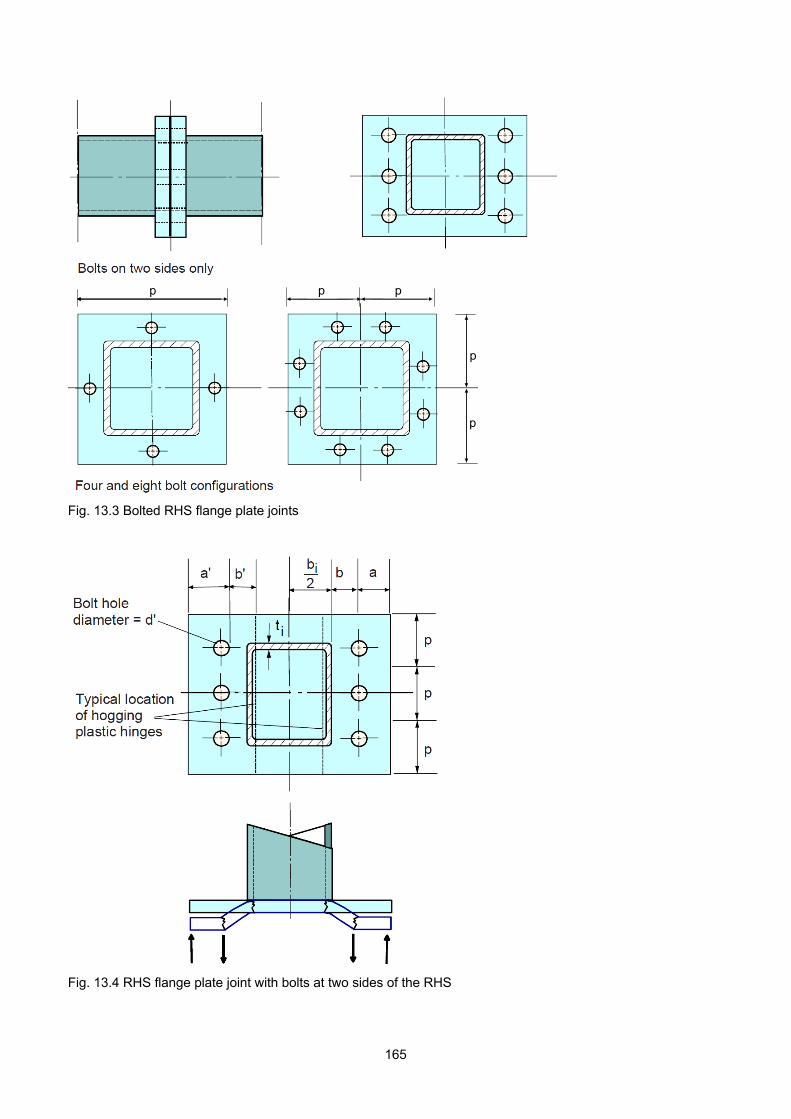
p p p
p
p
p p p
p
p
Fig. 13.3 Bolted RHS flange plate joints
Fig. 13.4 RHS flange plate joint with bolts at two sides of the RHS
165

Fig. 13.5 Bolted end joints
Bolt hole diameter d’
Shear segmentsInclined segments
Tension segment Bolt hole diameter d’
Shear segmentsInclined segments
Tension segment
Total net area for critical section A-A is the sum of the individual segments: For tension segment : An = (g1 - d’/2) t For shear segment : Agv = L t For each inclined segment : An = (g2 - d’) t + (s2/4g2) t
Fig. 13.6 Calculation of total net area for a gusset plate
166
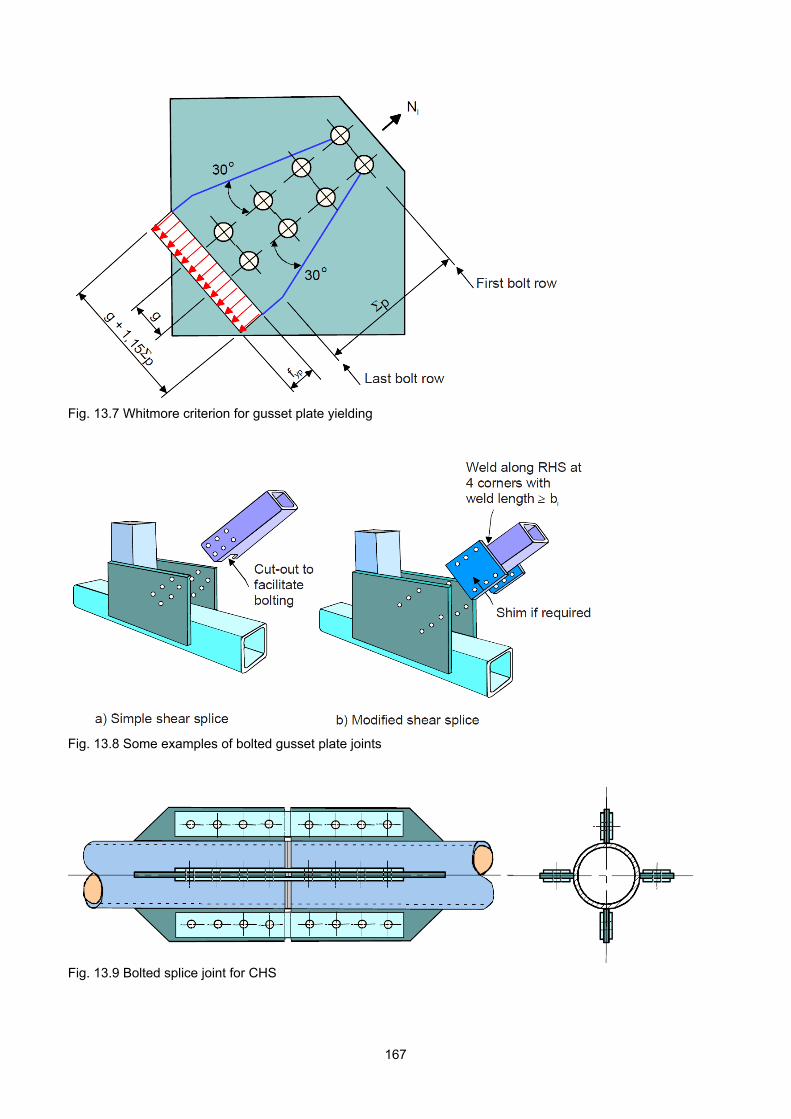
,,
Fig. 13.7 Whitmore criterion for gusset plate yielding
Fig. 13.8 Some examples of bolted gusset plate joints
Fig. 13.9 Bolted splice joint for CHS
167
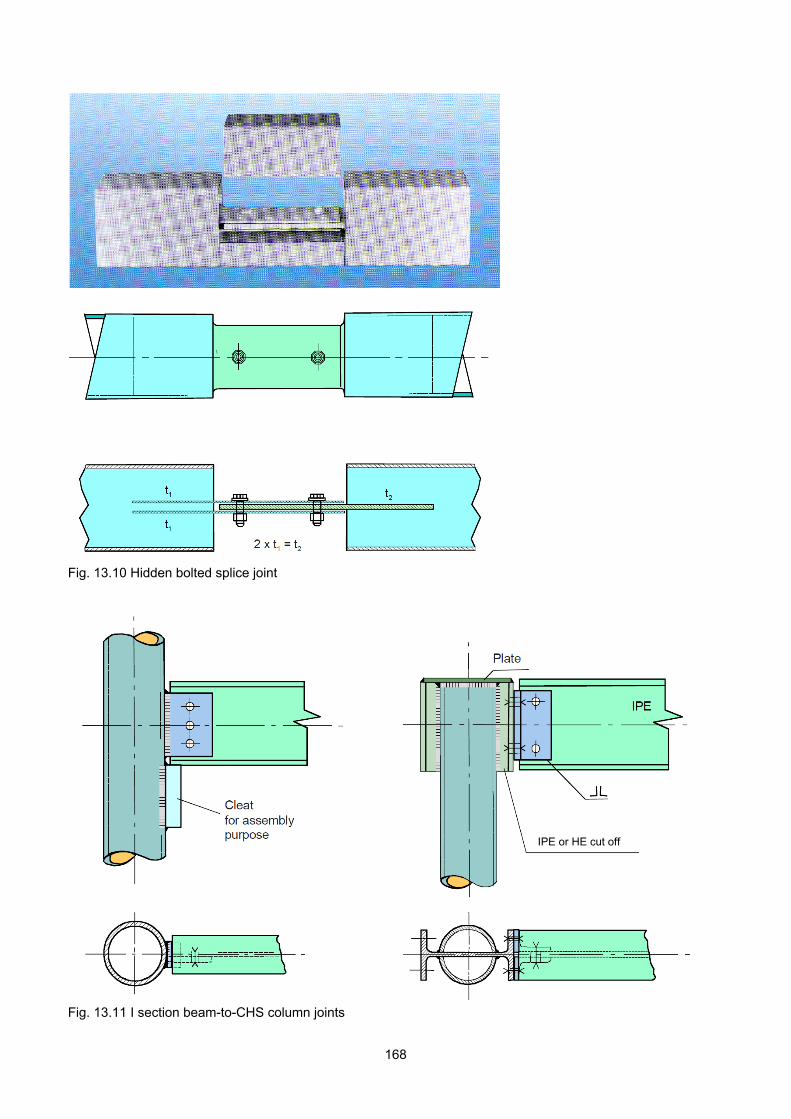
Fig. 13.10 Hidden bolted splice joint
IPE or HE cut offIPE or HE cut off
Fig. 13.11 I section beam-to-CHS column joints
168
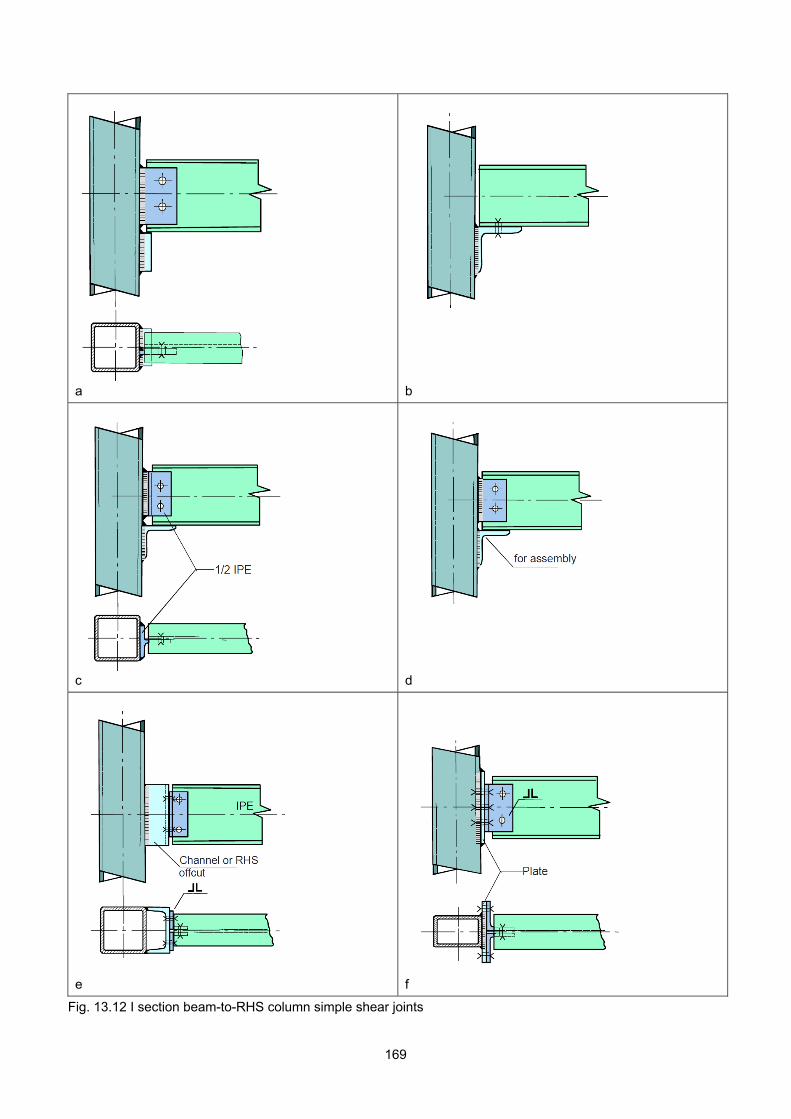
a
b
c
d
e
f
Fig. 13.12 I section beam-to-RHS column simple shear joints
169
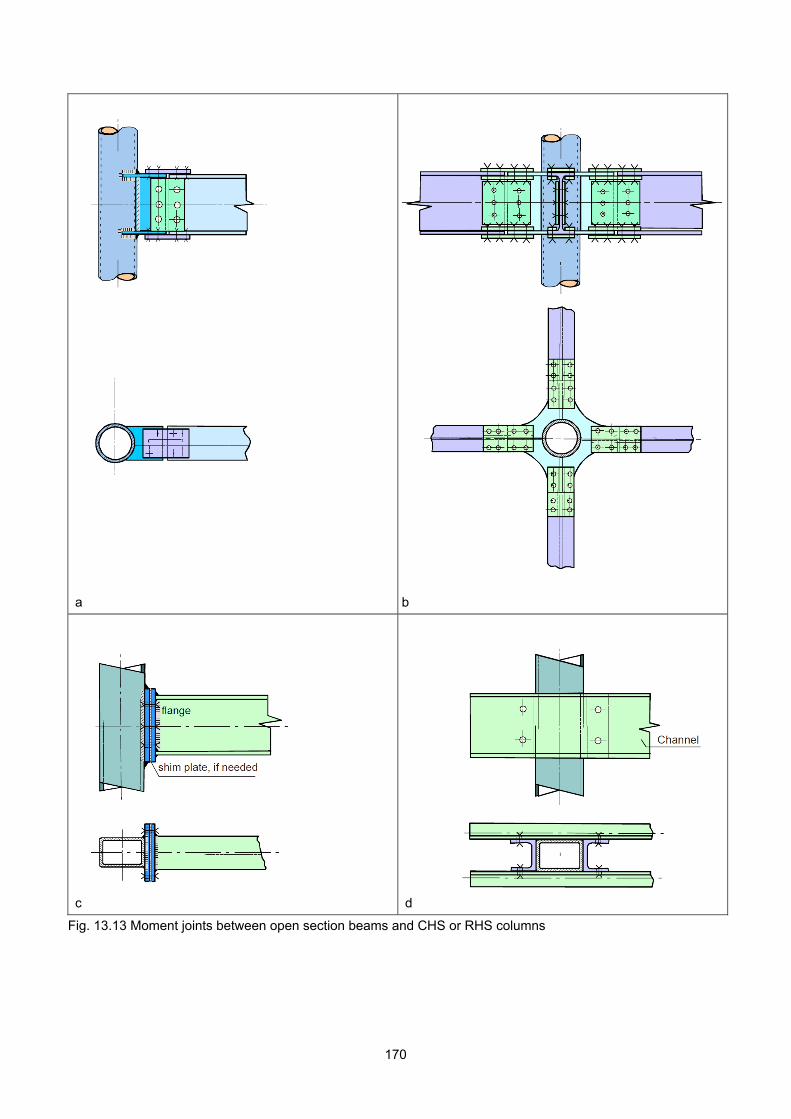
a
b
c
d
Fig. 13.13 Moment joints between open section beams and CHS or RHS columns
170
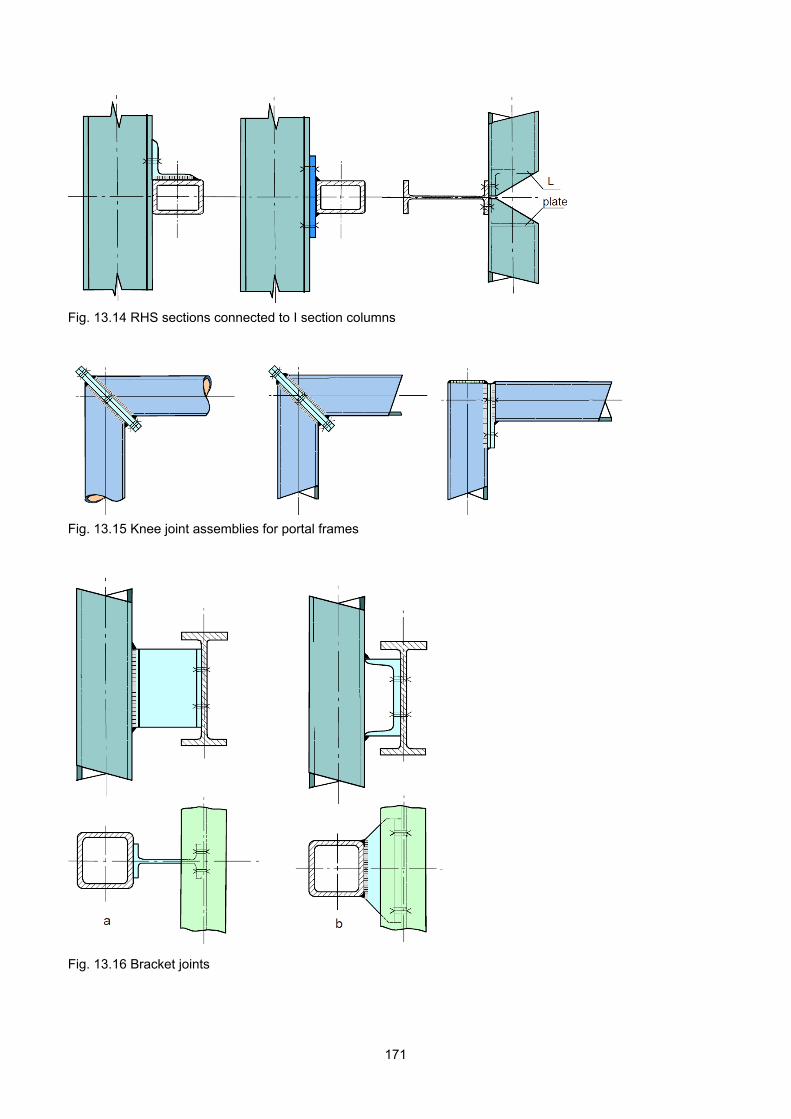
Fig. 13.14 RHS sections connected to I section columns
Fig. 13.15 Knee joint assemblies for portal frames
Fig. 13.16 Bracket joints
171
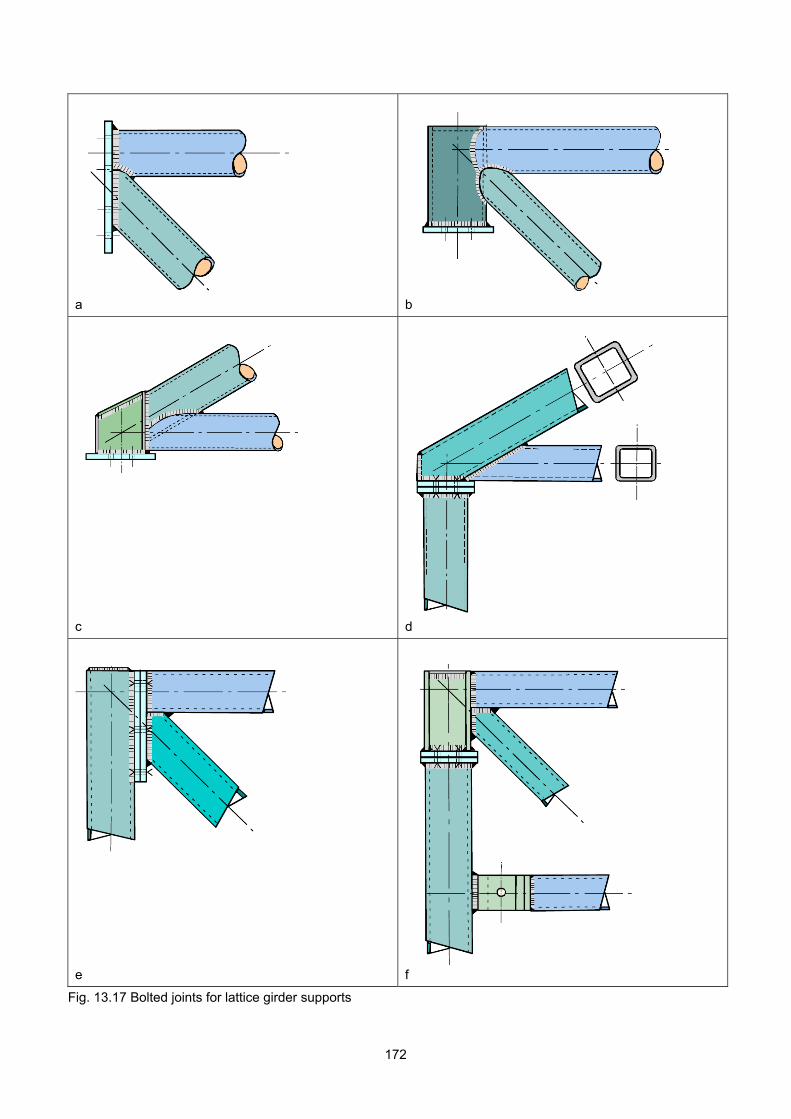
a
b
c
d
e
f
Fig. 13.17 Bolted joints for lattice girder supports
172
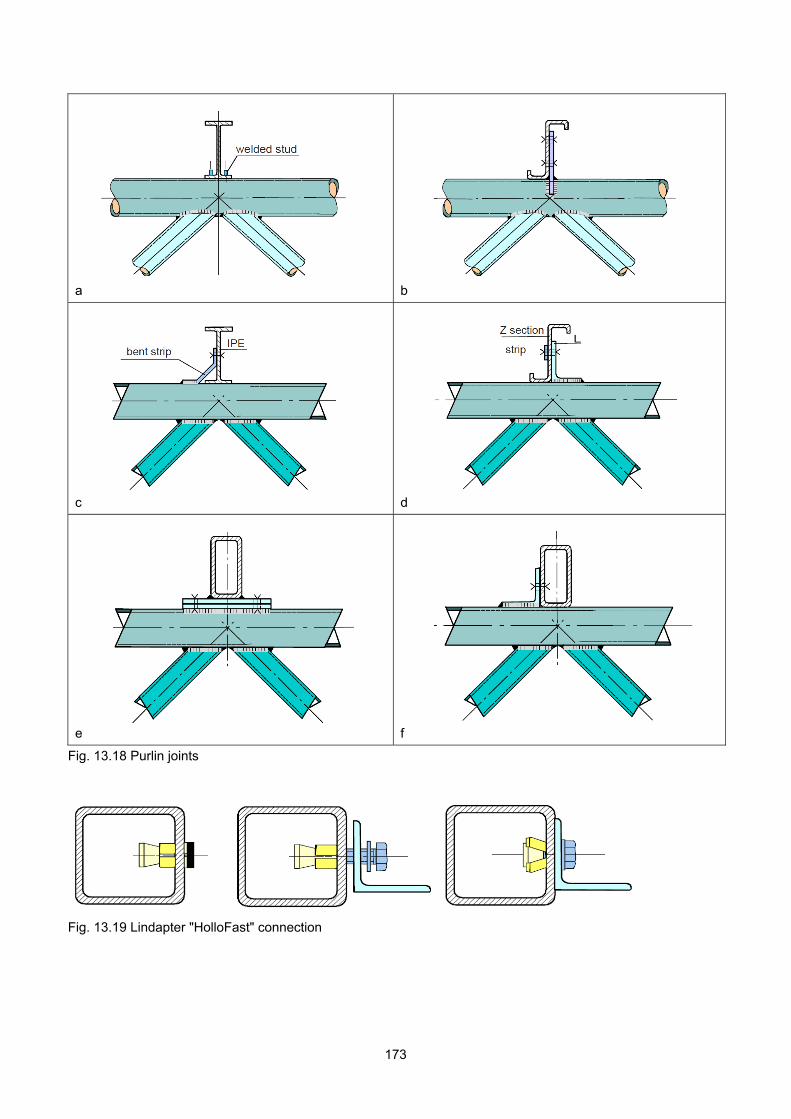
a
b
c
d
e
f
Fig. 13.18 Purlin joints
Fig. 13.19 Lindapter "HolloFast" connection
173
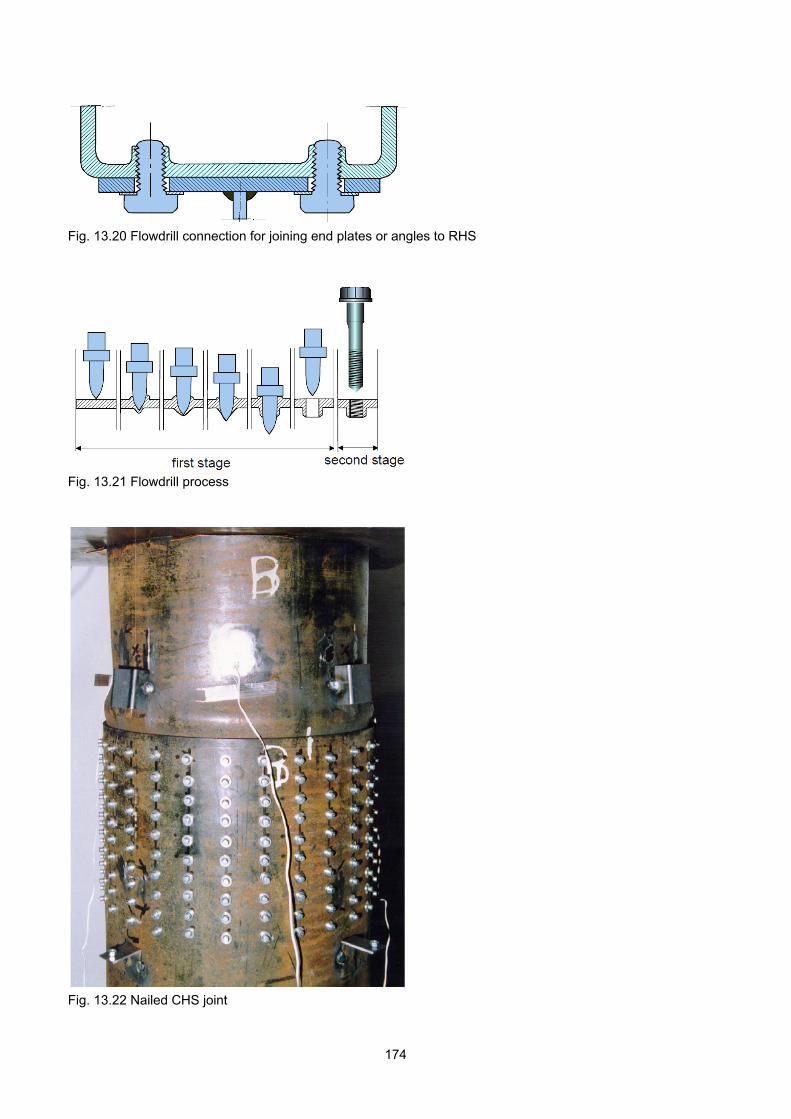
Fig. 13.20 Flowdrill connection for joining end plates or angles to RHS
Fig. 13.21 Flowdrill process
Fig. 13.22 Nailed CHS joint
174

14. FATIGUE BEHAVIOUR OF HOLLOW SECTION JOINTS
Fatigue is a mechanism whereby cracks grow in a structure under fluctuating stress. Final failure generally occurs when the reduced cross section becomes insufficient to carry the load without rupture. Generally the fatigue cracks start at locations with high stress peaks. High stress peaks may occur at local notches, e.g. at welds (Fig. 14.1). However, geometric peak stresses may also occur due to the geometry, e.g. at holes or in hollow section joints due to the non-uniform stiffness distribution at the perimeter of the connection (Fig. 14.2). Thus the fatigue behaviour is largely influenced by the loading and the way the members are connected. In a fatigue analysis the loading and the loading effects should be carefully evaluated and compared with the fatigue resistance. Sometimes it is difficult to determine the loading effects accurately, e.g. the secondary bending moments in lattice girders. In such cases, simplified approaches can be used.
14.1 DEFINITIONS Stress range Δσ The stress range Δσ (shown in Fig. 14.3) is the difference between the maximum and the minimum stress in a constant amplitude loading regime. Stress ratio R The stress ratio R is defined as the ratio between the minimum stress and the maximum stress in a stress cycle of constant amplitude loading (Fig. 14.3). σ-N or Wöhler line The relation (on a log-log scale) between the stress range Δσ and the number of cycles N to failure is presented in a so-called σ-N or Wöhler line (Fig. 14.4). Fatigue strength The fatigue strength of a welded component is defined as the stress range Δσ, which causes failure of the component after a specified number of cycles N. Fatigue life The number of cycles N to a defined failure is known
as the endurance or fatigue life. Fatigue limit The fatigue limit is defined as the stress range below which it is assumed that no fatigue failure occurs for a constant amplitude loading, see Fig. 14.4. For Eurocode 3 (EN 1993-1-9, 2005) and the IIW recommendations for hollow section joints (IIW, 1999), for example, this occurs at N = 5 x 10⁶ cycles. Note: IIW (2008) for fatigue design of welded joints and components has recently changed this limit to 107 cycles. Cut off limit The cut off limit is defined as the stress range below which it is assumed that the stress ranges of a variable amplitude loading do not contribute to the fatigue damage. For Eurocode 3 (EN 1993-1-9), for example, this occurs at N = 108 cycles (see Fig. 14.5). Note: The recently revised recommendations of IIW (2008) no longer give a cut off limit for variable amplitude loading. Geometric stress The geometric stress, also called hot spot stress, is defined as the extrapolated principal stress at a specified location at the weld toe. The extrapolation must be carried out from the region outside the influence of the effects of the weld geometry and discontinuities at the weld toe, but close enough to fall inside the zone of the stress gradient caused by the global geometrical effects of the joint. The extrapolation is to be carried out on the brace side and the chord side of each weld (see Fig. 14.6). Generally the geometric stress (or the hot spot stress) can be determined by considering the stress normal to the weld toe since the orientation of the maximum principal stress is normal or almost normal to the weld toe. Stress concentration factor The stress concentration factor (SCF) is the ratio between the geometric peak stress, or hot spot stress, excluding local effects, at a particular location in a joint and the nominal stress in the member due to a basic member load which causes this geometric stress.
14.2 INFLUENCING FACTORS The fatigue behaviour can be determined either by Δσ-N methods or with a fracture mechanics approach. The various Δσ-N methods are based on experiments resulting in Δσ-N graphs (Fig. 14.4) with a defined
175
stress range Δσ on the vertical axis and the number of cycles N to a specified failure criterion on the horizontal axis. The relation between the number of cycles to failure N and the stress range Δσ can be given by:
)( CN m (14.1)
or:
logmClogNlog (14.2)
On a log-log scale, this gives a straight line with a slope of -m, see Fig. 14.4. The fracture mechanics approach is based on a fatigue crack growth model and is not further discussed in the context of this book. Due to the appearance of residual stresses, the stress ratio R = σmin /σmax (see Fig. 14.3) is not taken into account in modern fatigue design. Only if the structure is fully stress relieved, it might be advantageous to take the stress ratio into account. Fig. 14.7 shows an example illustrating the influence of residual stresses on a plate with fy = 240 N/mm2. A nominal stress range Δσnom = 120 N/mm2 is applied on the plate, resulting in a nominal average stress range in the net cross section at the hole of:
2nom N/mm 160120
60
80
With a geometric stress concentration factor SCF = 3 for this detail, this nominal stress range results in a theoretical geometric stress range: Δσgeom = SCF Δσnom = 3 x 160 = 480 N/mm2 However, at 240 N/mm2 the material is yielding, resulting in stress pattern "b". Unloading to zero (loading in the opposite sense) means that the elastic stress pattern "a" has to be subtracted from "b" resulting in residual stress pattern "c". The next cycle will thus fluctuate between patterns "c" and "b", i.e. starting from a residual stress equal to the yield stress. In welded structures, residual stresses and discontinuities exist at welds too. Therefore, it is assumed that locally the stress will fluctuate between the yield stress and a lower limit (fy - Δσgeom).
The example in Fig. 14.7 with a tensile loading results in a compressive residual stress at the hole, which is favourable. However, it also shows that a compressive loading would have resulted in a tensile residual stress at the hole, which is unfavourable. In this latter case, it would result in fatigue failure under an external nominal compression stress range Δσ. In practical situations, various stress ranges occur and the residual stress ranges are not known. That is why, in general, no difference is made between tensile and compressive loading. For simple details, e.g. butt welded, end-to-end connections, cover plates, attachments, etc., Δσ-N lines can be determined. These Δσ-N lines (Figs. 14.4 and 14.5) already take into account the effect of the welds and the geometry of the connection. For more complicated geometries, such as the directly welded joints between hollow sections, the peak stresses and thus the peak stress ranges depend on the geometrical parameters. This means that for every joint, a separate Δσ-N line exists. Hence, in modern design, the fatigue behaviour of hollow section joints is related to basic Δσ-N curves, in which Δσ represents a geometrical or hot spot stress range taking into account the effect of the geometry of the joint. This geometrical stress range can also be calculated by multiplying the nominal stress range with a relevant stress concentration factor SCF. As a consequence of this method, stress concentration factors should be available for joints with various geometries. The effect of the weld is included in the basic Δσ-N lines. As shown later, the thickness of the sections is also an influencing parameter.
14.3 LOADING EFFECTS As stated before, the stress range Δσ is a governing parameter for fatigue. For constant amplitude loading, the Δσ-N line is generally cut off between N = 2 x 10⁶ to 107 cycles depending on the code. CIDECT (Zhao et al., 2001) and IIW (1999) follow Eurocode 3 (EN 1993-1-9, 2005) and use 5 x 10⁶ cycles (see Fig. 14.4). For random loading, also called spectrum loading, the smaller cycles may also have an effect and the cut off is taken at 108 to 2 x 10⁸ cycles, depending on the code. Eurocode 3 (EN 1993-1-9) uses a cut off at N = 108 cycles. Between 5 x 10⁶ to 108 cycles, a Δσ-N line is used with a shallower slope of m = 5.
176
Although the sequence of the stress ranges affects the damage, the simplest and best rule available up to now to determine the cumulative damage, is the Palmgren-Miner linear damage rule, i.e.
0,1N
n
i
i (14.3)
in which ni is the number of cycles of a particular stress range Δσi and Ni is the number of cycles to failure for that particular stress range. If vibration of the members occurs, the nominal stress ranges may be considerably increased. This will be the case if the natural frequency of a structural element is close to the frequency of the loading. It is therefore essential to avoid this. For very high stress ranges and consequently a low number of cycles, low cycle fatigue may occur. In this case, no Δσ-N curves are given in the codes since the fatigue is mainly governed by the strains. Research by Van der Vegte et al. (1989) showed that the various Δσ-N curves can be used if translated into strain, i.e. Δε-N curves. In this case, the loading should be evaluated based on the resulting strain range Δε.
14.4 FATIGUE STRENGTH In IIW (1999), CIDECT (Zhao et al., 2001) and Eurocode 3 (EN 1993-1-9, 2005) the fatigue strength for members with butt welded or fillet welded end-to-end connections, with plates or members with attachments, etc. is given as the stress range at 2 x 10⁶ cycles. This classification is in line with the classifications given for other members such as I sections, etc. Table 14.1 shows some of these classifications, adopted by Eurocode 3 (EN 1993-1-9, 2005), which are based on the analyses of Noordhoek et al. (1980) and Wardenier (1982). Table 14.1 shows that the classification of 160 or 140 N/mm2 for plain sections without attachments or connections is much higher than the classification for details. Table 14.1 further makes clear that a butt welded end-to-end connection has a better fatigue behaviour than a fillet welded end-to-end connection with an intersecting plate. For welded details, the classification is independent of the steel grade. Higher strength steels are more sensitive to notches, which reduces the favourable
effect of the higher strength. However, if improved welding methods are used or post weld improvements (grinding, TIG dressing, plasma dressing, ultrasonic impact treatment (UIT), etc.) are carried out, higher fatigue strengths can be obtained, especially for higher strength steels (e.g. for S460 and S690).
14.5 PARTIAL FACTORS If fatigue actions are included in a design, it should be noted that the stress ranges produced by the (unfactored) loading have to be multiplied by a partial (safety) factor which depends on the type of structure (fail-safe or non fail-safe) and the possibility for inspection and maintenance. The recommended partial (safety) factors according to CIDECT (Zhao et al., 2001) are given in Table 14.2. For example, a partial factor of M = 1,25 and m = 3 reduces the design fatigue life by about a factor of (1,25)-3 0,5.
14.6 FATIGUE CAPACITY OF WELDED JOINTS
In Section 14.4 the basic parameters influencing the strength of members with attachments or with end-to-end connections are discussed. It has already been stated that in welded joints between hollow sections the stiffness around the intersection is non-uniform, resulting in a geometrical non-uniform stress distribution as shown in Fig. 14.2 for an X joint of circular hollow sections. This non-uniform stress distribution depends on the type of brace loading (axial, in-plane bending, out-of-plane bending), the joint type and the geometry. Therefore, fatigue design of hollow section joints is, in general, different from, for example, that of simple welded connections between plates. 14.6.1 Geometrical stress approach Since peak stresses determine the fatigue behaviour, in modern design methods, the fatigue design is related to the geometrical stress range of a connection. This geometrical stress range includes the geometrical influences but excludes the effects related to fabrication such as the configuration of the weld (flat, convex, concave) and the local condition at the weld toe (radius of weld toe, undercut, etc.). Since the geometrical peak stress (also called the hot spot stress) can only be determined with finite element methods or by measurements on actual specimens, stress concentration factors have been developed for
177
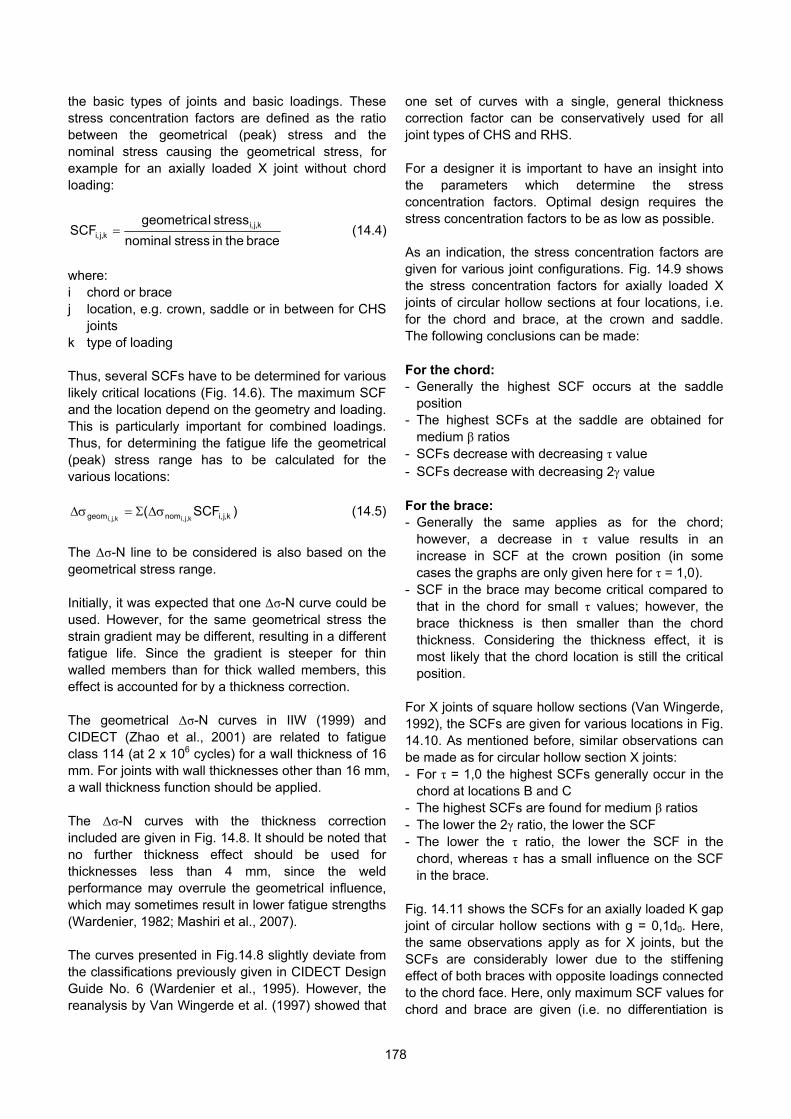
the basic types of joints and basic loadings. These stress concentration factors are defined as the ratio between the geometrical (peak) stress and the nominal stress causing the geometrical stress, for example for an axially loaded X joint without chord loading:
brace the in stress nominal
stress lgeometricaSCF k,j,i
k,j,i (14.4)
where: i chord or brace j location, e.g. crown, saddle or in between for CHS
joints k type of loading Thus, several SCFs have to be determined for various likely critical locations (Fig. 14.6). The maximum SCF and the location depend on the geometry and loading. This is particularly important for combined loadings. Thus, for determining the fatigue life the geometrical (peak) stress range has to be calculated for the various locations:
)SCF( k,j,inomgeom k,j,ik,j,i (14.5)
The Δσ-N line to be considered is also based on the geometrical stress range. Initially, it was expected that one Δσ-N curve could be used. However, for the same geometrical stress the strain gradient may be different, resulting in a different fatigue life. Since the gradient is steeper for thin walled members than for thick walled members, this effect is accounted for by a thickness correction. The geometrical Δσ-N curves in IIW (1999) and CIDECT (Zhao et al., 2001) are related to fatigue class 114 (at 2 x 10⁶ cycles) for a wall thickness of 16 mm. For joints with wall thicknesses other than 16 mm, a wall thickness function should be applied. The Δσ-N curves with the thickness correction included are given in Fig. 14.8. It should be noted that no further thickness effect should be used for thicknesses less than 4 mm, since the weld performance may overrule the geometrical influence, which may sometimes result in lower fatigue strengths (Wardenier, 1982; Mashiri et al., 2007). The curves presented in Fig.14.8 slightly deviate from the classifications previously given in CIDECT Design Guide No. 6 (Wardenier et al., 1995). However, the reanalysis by Van Wingerde et al. (1997) showed that
one set of curves with a single, general thickness correction factor can be conservatively used for all joint types of CHS and RHS. For a designer it is important to have an insight into the parameters which determine the stress concentration factors. Optimal design requires the stress concentration factors to be as low as possible. As an indication, the stress concentration factors are given for various joint configurations. Fig. 14.9 shows the stress concentration factors for axially loaded X joints of circular hollow sections at four locations, i.e. for the chord and brace, at the crown and saddle. The following conclusions can be made: For the chord: - Generally the highest SCF occurs at the saddle
position - The highest SCFs at the saddle are obtained for
medium β ratios - SCFs decrease with decreasing τ value - SCFs decrease with decreasing 2 value For the brace: - Generally the same applies as for the chord;
however, a decrease in τ value results in an increase in SCF at the crown position (in some cases the graphs are only given here for τ = 1,0).
- SCF in the brace may become critical compared to that in the chord for small τ values; however, the brace thickness is then smaller than the chord thickness. Considering the thickness effect, it is most likely that the chord location is still the critical position.
For X joints of square hollow sections (Van Wingerde, 1992), the SCFs are given for various locations in Fig. 14.10. As mentioned before, similar observations can be made as for circular hollow section X joints: - For τ = 1,0 the highest SCFs generally occur in the
chord at locations B and C - The highest SCFs are found for medium β ratios - The lower the 2γ ratio, the lower the SCF - The lower the τ ratio, the lower the SCF in the
chord, whereas τ has a small influence on the SCF in the brace.
Fig. 14.11 shows the SCFs for an axially loaded K gap joint of circular hollow sections with g = 0,1d0. Here, the same observations apply as for X joints, but the SCFs are considerably lower due to the stiffening effect of both braces with opposite loadings connected to the chord face. Here, only maximum SCF values for chord and brace are given (i.e. no differentiation is
178

made between the saddle and crown positions). Although the effect of the brace angle is not included in the figures, a decrease in the angle between brace and chord results in a considerable decrease in SCF. If the chord is loaded, the geometrical or hot spot stress range at the chord locations at the crown (CHS) or at the locations C and D (RHS) (see Fig. 14.6) has to be increased by the chord nominal stress range multiplied by the stress concentration factor produced by the chord stresses. As shown in Fig. 14.12 for RHS T and X joints, the SCF for chord loading varies between 1 and 3, depending on the loading, joint type and geometrical parameters (Van Wingerde, 1992). Another aspect to be considered is multiplanar loading. For the same type of joint and the same geometry, different SCFs can be obtained for different loading conditions (see Fig. 14.13). All the SCFs are based on measurements taken at the toe of the weld, since this location is generally critical. However, for very low SCFs, crack initiation can start at the weld root. Therefore a minimum SCF = 2,0 is recommended. Further, the SCF values have been determined for butt or groove welded joints. Fillet welds cause slightly lower SCFs in the chord, but due to local wall bending effects, result in considerably higher SCFs in the braces. It is therefore recommended to increase the SCFs in RHS braces of T and X joints by a factor of 1,4 when fillet welds are used (Van Wingerde, 1992). Considering all these aspects, it can be concluded that optimal design can be achieved if the SCFs are as low as possible. Thus the following guidelines can be given: - Avoid medium β ratios. Ratios close to β = 1,0 give
the lowest SCFs. - Make the wall thickness of the brace as low as
possible (low τ ratio). - Take relatively thick walled chords (low 2γ ratio). In this way, SCFs of about 2 to 4 are possible, resulting in an economic design. If the bending moments in girders have not been determined by finite element analyses or other methods, e.g. a rigid frame analysis, the effect of the bending moments can be incorporated in a simplified manner as discussed in Section 14.6.2. More detailed information about stress concentration
factors can be obtained for CHS joints from Efthymiou (1988) and Romeijn (1994) and for RHS joints from Herion (1994) and Van Wingerde (1992). 14.6.2 Classification method based on
nominal stress ranges To simplify design methods, it would be easier if the SCFs could already be incorporated in the design class, taking account of the main influencing parameters. However, this is impossible for T, Y and X joints, since the variation in SCF is considerable. For K joints, classification is possible to a certain extent. Table 14.3 shows the detail categories for lattice girder joints given in Eurocode 3 (EN 1993-1-9, 2005), based on the analyses of Noordhoek et al. (1980) and Wardenier (1982). The thickness effect is indirectly included. The method can only be used for thin walled sections (see recommended range of validity). As shown in Table 14.3, the classification only depends on the gap, overlap and τ ratio. It must be stated that the design classes are based on test results and on an independent analysis, and do not comply with the geometric stress method. Further, the design classes given clearly show the advantage of using a low τ ratio or high t0/ti. Since it might be difficult for designers to determine the secondary bending moments, the CIDECT and IIW recommendations allow a calculation based on the assumption that the members are pin connected. However, the stress ranges in chord and braces caused by the axial loading in the braces have to be multiplied by the factors given in Tables 14.4 and 14.5 to account for the secondary bending moments due to joint stiffness. These multiplication factors are based on measurements in actual girders (De Koning & Wardenier, 1979). In the case of eccentricities or loads in between the joints, a calculation based on the model in Fig. 6.8 is recommended. Although the effects of the eccentricities and loads in between the joints are then covered, the effects of joint stiffness still have to be added in a similar way as described here before.
14.7 FATIGUE CAPACITY OF BOLTED JOINTS
Joints with pretensioned high strength friction grip (HSFG) bolts have a favourable fatigue behaviour compared to joints with non-pretensioned bolts. Joints loaded in tension can, for example, be designed in
179

such a way that the fatigue load does not critically affect the joints. Joints with pretensioned high strength bolts subjected to shear or friction loads can bear higher fatigue loads than welded joints, which means that, in general, these bolted joints in shear do not represent the most critical elements. Bolted joints under fatigue loading should be designed in such a way that there is no play and no slip between the faying surfaces. 14.7.1 Bolted joints under tensile load Theoretical investigations and experimental results (Bouwman, 1982) show that the fatigue behaviour of joints with pretensioned bolts is significantly influenced by the way in which the load is transmitted. A few examples of bolted joints in tension are shown in Fig. 14.14. For configurations a1 and a2 (Fig. 14.14) the contact face pressure is, by design, co-axial with the external load. In this case, as the load increases, at first there is a significant decrease in the contact pressure. Only when the applied load exceeds the contact pressure, the load in the high strength bolts begins to increase appreciably. For configurations c1 and c2, the load in the high strength bolts increases from the very beginning with growing applied load due to prying. Thus, connection types a1 and a2 exhibit a much better fatigue performance than the other types. For the a1 and a2 configurations, the stiffness of the flanges is distinctly higher than that for the axial load transmission through the bolts accompanied by flange bending. As a result, for configurations a1 and a2 under fatigue load, only a small stress increase in the bolts is observed. This change in stresses due to fatigue loading can generally be neglected, when the applied load per bolt is smaller than the bolt preload. Should the load transmitting parts not be located on the same plane, the connections must then be designed in such a manner that the load transmission is mainly effected through a reduction of contact loads. The arrangements shown in Fig. 14.15 are recommended for bolted ring flange joints between hollow sections. These proposed flange connections require expensive machining and finishing. However, the same level of load transmission can be achieved simply with the help of packing plates (shims). It is further recommended that the high strength bolts be located as closely as possible to the load carrying structural parts.
Snug-tight bolted connections without pretensioning should be avoided, since the fatigue behaviour is bad. 14.7.2 Bolted joints under shear load The fatigue behaviour of high strength pretensioned bolted joints under shear load is generally better than that of welds connecting hollow sections to end plates. As shown in Fig. 14.16, the stress distribution in joints with pretensioned bolts is significantly better than that in bolted joints without preload. The reason is that part of the external load is transmitted by friction around the bolt hole. After a high strength pretensioned bolted joint has slipped, a more unfavourable stress distribution develops than before, since part of the force is now transmitted by pressure on the face of the hole (see Fig. 14.16c). Non-pretensioned, non-fitted bolts should be avoided for structural parts subjected to fatigue loading. Recommendations for the design class of high strength bolted joints are, for example, given in Eurocode 3 (EN 1993-1-9, 2005), see Table 14.6. It is noted that, depending on the conditions, partial (safety) factors have to be used; see e.g. Table 14.2.
14.8 FATIGUE DESIGN In the previous sections the fatigue resistance of hollow section joints has been discussed in relation to the geometry. However, when a designer starts with the design process, the geometry is not known and he or she has first to determine the geometry, e.g. for a truss. Here, several steps have to be followed: Step A: For the determination of the geometry, use has to be made of the knowledge obtained in the previous sections. For a good performance of joints, the following points have to be considered to obtain the best fatigue behaviour: - Select joints with high or low β values, and avoid
intermediate values. Considering fabrication, β = 0,8 is preferred to β = 1,0.
- Choose the chord diameter- or chord width-to- thickness ratio 2γ to be as low as possible; e.g. for tension chords about 20 or lower and for compression chords about 25 or lower.
- Design the braces to be as thin as possible to achieve preferable brace-to-chord thickness ratios τ 0,5 and to minimise welding.
180
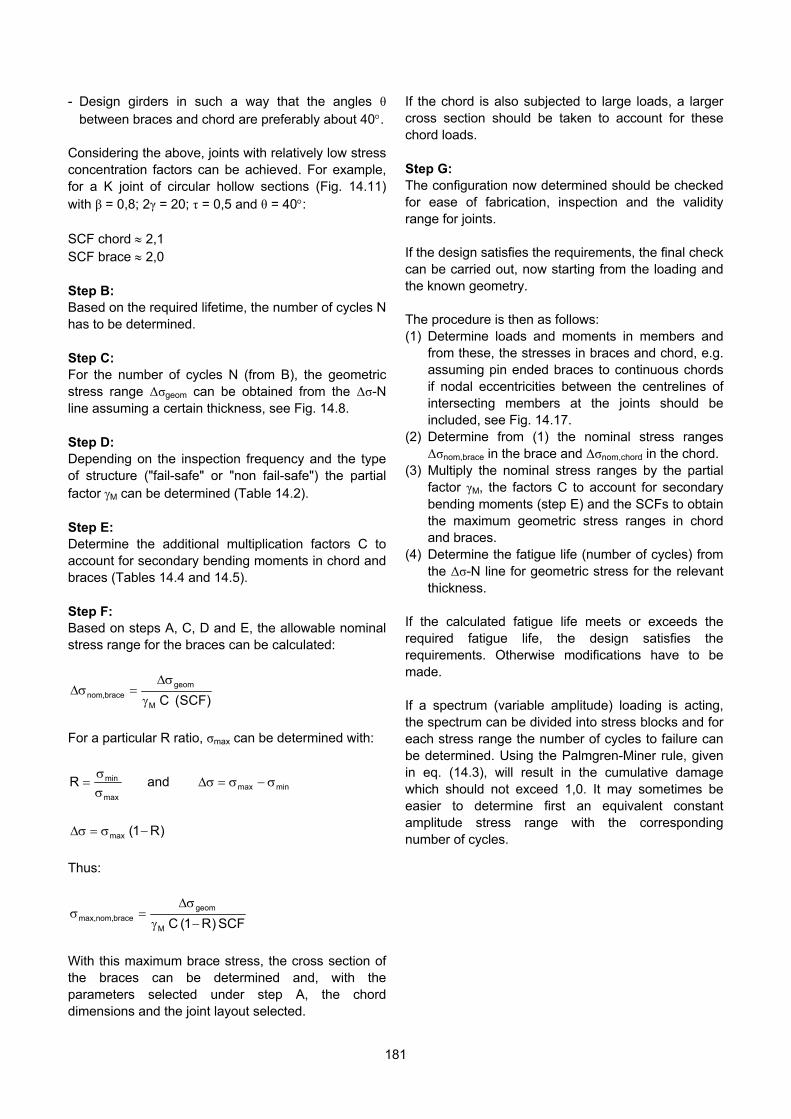
If the chord is also subjected to large loads, a larger cross section should be taken to account for these chord loads.
- Design girders in such a way that the angles θ between braces and chord are preferably about 40.
Considering the above, joints with relatively low stress
concentration factors can be achieved. For example, for a K joint of circular hollow sections (Fig. 14.11) with β = 0,8; 2γ = 20; τ = 0,5 and θ = 40:
Step G: The configuration now determined should be checked for ease of fabrication, inspection and the validity range for joints. SCF chord 2,1 If the design satisfies the requirements, the final check can be carried out, now starting from the loading and the known geometry.
SCF brace 2,0 Step B:
Based on the required lifetime, the number of cycles N has to be determined. The procedure is then as follows:
(1) Determine loads and moments in members and from these, the stresses in braces and chord, e.g. assuming pin ended braces to continuous chords if nodal eccentricities between the centrelines of intersecting members at the joints should be included, see Fig. 14.17.
Step C: For the number of cycles N (from B), the geometric stress range Δσgeom can be obtained from the Δσ-N line assuming a certain thickness, see Fig. 14.8.
(2) Determine from (1) the nominal stress ranges Δσnom,brace in the brace and Δσnom,chord in the chord.
Step D: Depending on the inspection frequency and the type of structure ("fail-safe" or "non fail-safe") the partial factor M can be determined (Table 14.2).
(3) Multiply the nominal stress ranges by the partial factor γM, the factors C to account for secondary bending moments (step E) and the SCFs to obtain the maximum geometric stress ranges in chord and braces.
Step E: Determine the additional multiplication factors C to account for secondary bending moments in chord and braces (Tables 14.4 and 14.5).
(4) Determine the fatigue life (number of cycles) from the Δσ-N line for geometric stress for the relevant thickness.
Step F: If the calculated fatigue life meets or exceeds the required fatigue life, the design satisfies the requirements. Otherwise modifications have to be made.
Based on steps A, C, D and E, the allowable nominal stress range for the braces can be calculated:
)SCF( C M
geombrace,nom
If a spectrum (variable amplitude) loading is acting, the spectrum can be divided into stress blocks and for each stress range the number of cycles to failure can be determined. Using the Palmgren-Miner rule, given in eq. (14.3), will result in the cumulative damage which should not exceed 1,0. It may sometimes be easier to determine first an equivalent constant amplitude stress range with the corresponding number of cycles.
For a particular R ratio, σmax can be determined with:
minmaxmax
min and R
)R1( max
Thus:
SCF )R1( C M
geombrace,nommax,
With this maximum brace stress, the cross section of the braces can be determined and, with the parameters selected under step A, the chord dimensions and the joint layout selected.
181

Table 14.1 Detail categories for hollow sections and simple joints according to Eurocode 3 (EN 1993-1-9, 2005), IIW (1999) and CIDECT (Zhao et al., 2001)
Details loaded by nominal normal stresses
Detail category m = 3
Constructional detail Description
160
Rolled and extruded products Non-welded elements Sharp edges and surface flaws to be improved by grinding
140
Continuous longitudinal welds Automatic longitudinal welds with no stop-start positions, proven free of detectable discontinuities
71
Transverse butt welds Butt welded end-to-end connection of circular hollow sections Requirements: - Height of the weld reinforcement less than 10% of weld with smooth
transitions to the plate surface - Welds made in flat position and proven free of detectable discontinuities - Details with wall thickness greater than 8 mm may be classified two
detail categories higher ( 90)
56
Transverse butt welds Butt welded end-to-end connection of rectangular hollow sections Requirements: - Height of the weld reinforcement less than 10% of weld with smooth
transitions to the plate surface - Welds made in flat position and proven free of detectable discontinuities - Details with wall thicknesses greater than 8 mm may be classified two
detail categories higher ( 71)
71
Welded attachments (non load-carrying welds) Circular or rectangular hollow section, fillet welded to another section Section width parallel to stress direction 100 mm
50
Welded connections (load-carrying welds) Circular hollow sections, end-to-end butt welded with intermediate plate Requirements: - Welds proven free of detectable discontinuities - Details with wall thicknesses greater than 8 mm may be classified one
detail category higher ( 56)
45
Welded connections (load-carrying welds) Rectangular hollow sections, end-to-end butt welded with intermediate plate Requirements: - Welds proven free of detectable discontinuities - Details with wall thicknesses greater than 8 mm may be classified one
detail category higher ( 50)
40
Welded connections (load-carrying welds) Circular hollow sections, end-to-end fillet welded with intermediate plate Requirements: - Wall thickness less than 8 mm
36
Welded connections (load-carrying welds) Rectangular hollow sections, end-to-end fillet welded with intermediate plate Requirements: - Wall thickness less than 8 mm
182
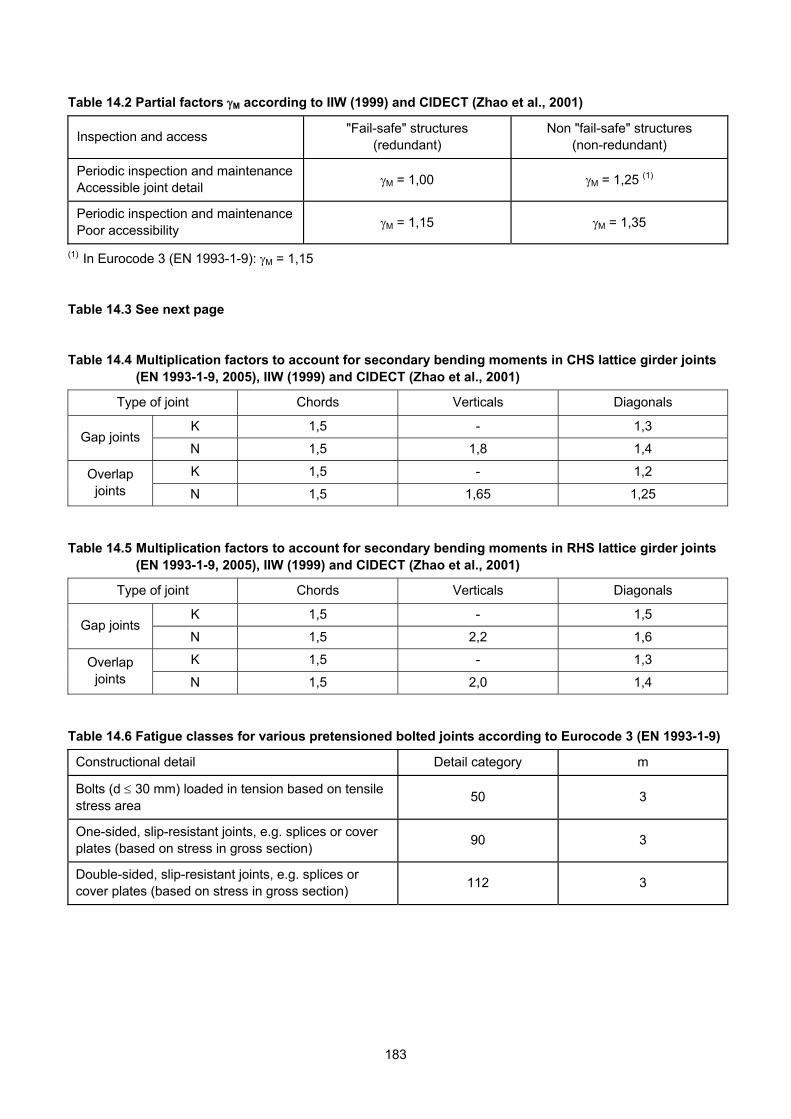
Table 14.2 Partial factors M according to IIW (1999) and CIDECT (Zhao et al., 2001)
Inspection and access "Fail-safe" structures
(redundant) Non "fail-safe" structures
(non-redundant)
Periodic inspection and maintenance Accessible joint detail
M = 1,00 M = 1,25 (1)
Periodic inspection and maintenance Poor accessibility
M = 1,15 M = 1,35
(1) In Eurocode 3 (EN 1993-1-9): M = 1,15 Table 14.3 See next page Table 14.4 Multiplication factors to account for secondary bending moments in CHS lattice girder joints
(EN 1993-1-9, 2005), IIW (1999) and CIDECT (Zhao et al., 2001)
Type of joint Chords Verticals Diagonals
K 1,5 - 1,3 Gap joints
N 1,5 1,8 1,4
K 1,5 - 1,2 Overlap joints N 1,5 1,65 1,25
Table 14.5 Multiplication factors to account for secondary bending moments in RHS lattice girder joints
(EN 1993-1-9, 2005), IIW (1999) and CIDECT (Zhao et al., 2001)
Type of joint Chords Verticals Diagonals
K 1,5 - 1,5 Gap joints
N 1,5 2,2 1,6
K 1,5 - 1,3 Overlap joints N 1,5 2,0 1,4
Table 14.6 Fatigue classes for various pretensioned bolted joints according to Eurocode 3 (EN 1993-1-9)
Constructional detail Detail category m
Bolts (d 30 mm) loaded in tension based on tensile stress area
50 3
One-sided, slip-resistant joints, e.g. splices or cover plates (based on stress in gross section)
90 3
Double-sided, slip-resistant joints, e.g. splices or cover plates (based on stress in gross section)
112 3
183
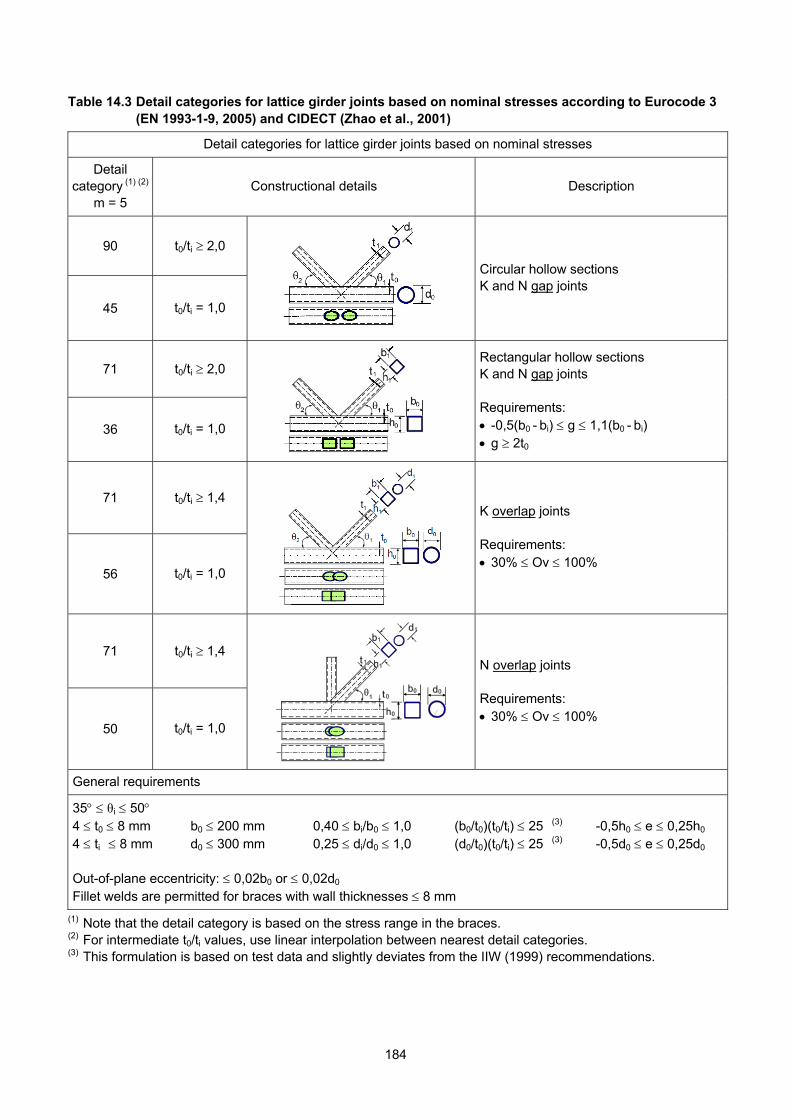
Table 14.3 Detail categories for lattice girder joints based on nominal stresses according to Eurocode 3 (EN 1993-1-9, 2005) and CIDECT (Zhao et al., 2001)
Detail categories for lattice girder joints based on nominal stresses
Detail category (1) (2)
m = 5 Constructional details Description
90 t0/ti 2,0
45 t0/ti = 1,0
Circular hollow sections K and N gap joints
71 t0/ti 2,0
36 t0/ti = 1,0
Rectangular hollow sections K and N gap joints Requirements: -0,5(b0 - bi) g 1,1(b0 - bi) g 2t0
71 t0/ti 1,4
56 t0/ti = 1,0
K overlap joints Requirements: 30% Ov 100%
71 t0/ti 1,4
50 t0/ti = 1,0
N overlap joints Requirements: 30% Ov 100%
General requirements
35 θi 50 4 t0 8 mm b0 200 mm 0,40 bi/b0 1,0 (b0/t0)(t0/ti) 25 (3) -0,5h0 e 0,25h0 4 ti 8 mm d0 300 mm 0,25 di/d0 1,0 (d0/t0)(t0/ti) 25 (3) -0,5d0 e 0,25d0 Out-of-plane eccentricity: 0,02b0 or 0,02d0 Fillet welds are permitted for braces with wall thicknesses 8 mm
(1) Note that the detail category is based on the stress range in the braces. (2) For intermediate t0/ti values, use linear interpolation between nearest detail categories. (3) This formulation is based on test data and slightly deviates from the IIW (1999) recommendations.
184

Maximum geometricalpeak stress
Stress increase due to weld toe effects
Stress increase due to weld geometry
Geometrical stress
weld
notch
Chord wall
Bra
cew
all
a b
Maximum geometricalpeak stress
Stress increase due to weld toe effects
Stress increase due to weld geometry
Geometrical stress
weld
notch
Chord wall
Bra
cew
all
a b
Fig. 14.1 Peak stress due to weld discontinuity
peak in chord
nominal
peak in bracepeak in chord
nominal
peak in brace
Fig. 14.2 Geometrical stress distribution in an axially loaded X joint of circular hollow sections
StressR > 0
R = -1
R = 0
StressR > 0
R = -1
R = 0
Fig. 14.3 Stress range σ and stress ratio R
185

Number of stress cycles N
Str
ess
ran
ge
(N/m
m2)
m = 3
Detail category
Constant amplitudefatigue limit
1000
500
100
50
10104 5 1075 105 5 1085 106
Number of stress cycles N
Str
ess
ran
ge
(N/m
m2)
m = 3
Detail category
Constant amplitudefatigue limit
1000
500
100
50
10104 5 1075 105 5 1085 106
Fig. 14.4 σ – N curves for classified details and constant amplitude loading (IIW, 1999; CIDECT, 2001;
EN 1993-1-9, 2005)
Number of stress cycles N
Str
ess
range
(N/m
m2 )
m = 3
Detail category
Constant amplitudefatigue limit
1000
500
100
50
10104 5 1075 105 5 1085 106
m = 5
2
Cut-off limit
Number of stress cycles N
Str
ess
range
(N/m
m2 )
m = 3
Detail category
Constant amplitudefatigue limit
1000
500
100
50
10104 5 1075 105 5 1085 106
m = 5
2
Cut-off limit
Fig. 14.5 σ – N curves for classified details and variable amplitude loading (IIW, 1999; CIDECT, 2001;
EN 1993-1-9, 2005)
186
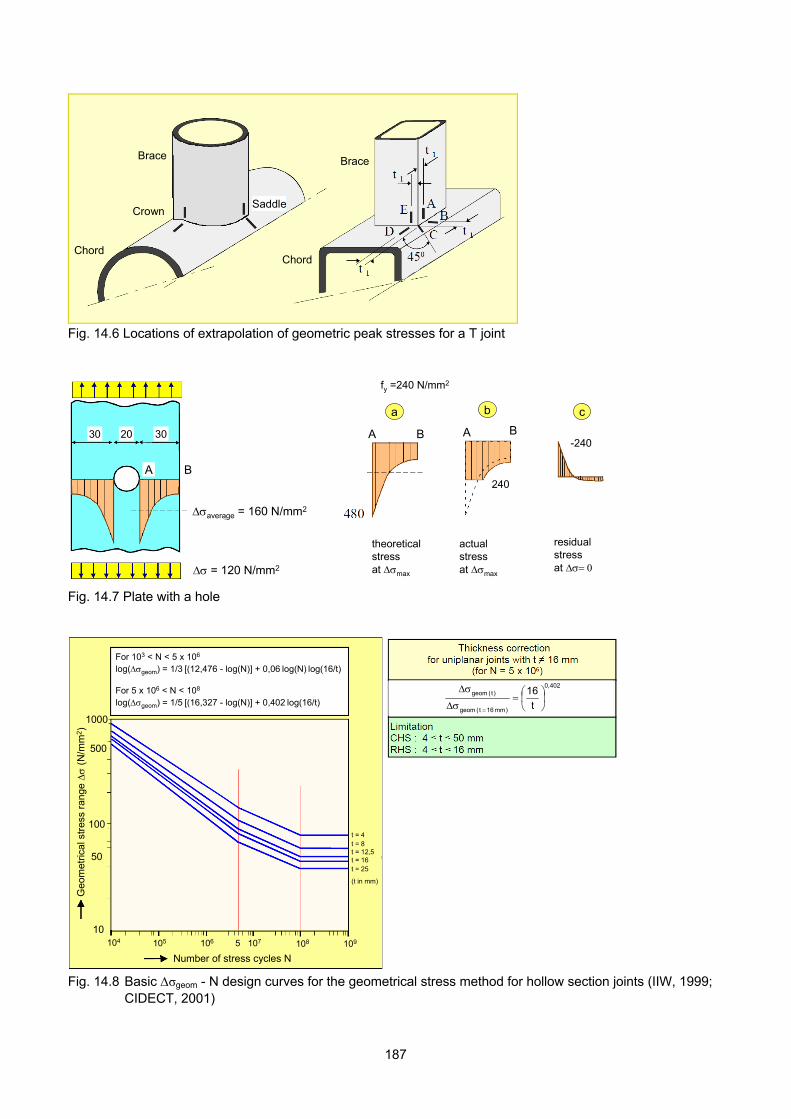
Brace
Crown
Brace
ChordChord
Saddle
Brace
Crown
Brace
ChordChord
Saddle
Fig. 14.6 Locations of extrapolation of geometric peak stresses for a T joint
30 20 30
= 120 N/mm2
average = 160 N/mm2
fy =240 N/mm2
theoreticalstress at max
actualstress at max
residualstress at
-240
240
a cb
A B
BB AA30 20 30
= 120 N/mm2
average = 160 N/mm2
fy =240 N/mm2
theoreticalstress at max
actualstress at max
residualstress at
-240
240
a cb
A B
BB AA
Fig. 14.7 Plate with a hole
Number of stress cycles N
1000
500
100
50
10104 5 107105 108106
Geo
met
rical
stre
ss r
ange
(N/m
m2)
109
t = 4t = 8t = 12,5t = 16t = 25
(t in mm)
,
,,
,,,
For 103 < N < 5 x 10⁶
log(geom) = 1/3 [(12,476 - log(N)] + 0,06 log(N) log(16/t)
For 5 x 10⁶ < N < 108
log(geom) = 1/5 [(16,327 - log(N)] + 0,402 log(16/t)
402,0
)mm 16 t( geom
)t( geom
t
16
Fig. 14.8 Basic σgeom - N design curves for the geometrical stress method for hollow section joints (IIW, 1999;
CIDECT, 2001)
187
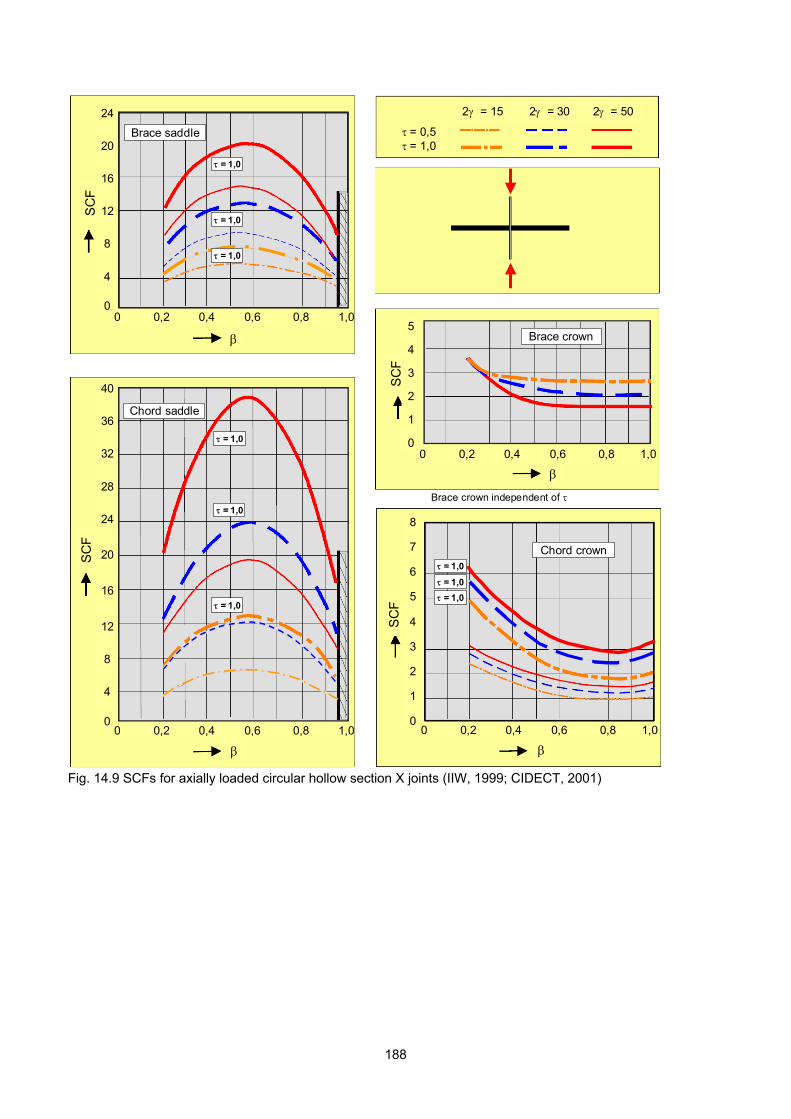
0 0,2 0,4 0,6 0,8 1,0
0 0,2 0,4 0,6 0,8 1,0
24
20
16
12
8
4
0
40
36
32
28
24
20
16
12
8
4
0
5
4
3
2
1
0
8
7
6
5
4
3
2
1
00 0,2 0,4 0,6 0,8 1,0
0 0,2 0,4 0,6 0,8 1,0
SC
F
SC
F
SC
F
SC
F
Brace saddle
Brace crown
Chord saddle
Chord crown
2 = 15 2 = 30 2 = 50
= 0,5= 1,0
= 1,0
= 1,0
= 1,0
= 1,0
= 1,0
= 1,0
= 1,0
= 1,0
Brace crown independent of
= 1,0
0 0,2 0,4 0,6 0,8 1,0
0 0,2 0,4 0,6 0,8 1,0
24
20
16
12
8
4
0
40
36
32
28
24
20
16
12
8
4
0
5
4
3
2
1
0
8
7
6
5
4
3
2
1
00 0,2 0,4 0,6 0,8 1,0
0 0,2 0,4 0,6 0,8 1,0
SC
F
SC
F
SC
F
SC
F
Brace saddle
Brace crown
Chord saddle
Chord crown
2 = 15 2 = 30 2 = 50
= 0,5= 1,0
= 1,0
= 1,0
= 1,0
= 1,0
= 1,0
= 1,0
= 1,0
= 1,0
Brace crown independent of
= 1,0
Fig. 14.9 SCFs for axially loaded circular hollow section X joints (IIW, 1999; CIDECT, 2001)
188

32
28
24
20
16
12
8
4
0
SC
F/
0,7
5
0 0,2 0,4 0,6 0,8 1,0
32
28
24
20
16
12
8
4
0
SC
F/
0,7
5
Line B0 0,2 0,4 0,6 0,8 1,0
SC
F/
0,7
5
Line D
20
16
12
8
4
00 0,2 0,4 0,6 0,8 1,0
Line A, E
20
16
12
8
4
0
SC
F
2 = 15 2 = 30 2 = 50
= 0,25 – 1,0Symbol size ~
Brace
Chord
Line C
0 0,2 0,4 0,6 0,8 1,0
32
28
24
20
16
12
8
4
0
SC
F/
0,7
5
0 0,2 0,4 0,6 0,8 1,0
32
28
24
20
16
12
8
4
0
SC
F/
0,7
5
Line B0 0,2 0,4 0,6 0,8 1,0
SC
F/
0,7
5
Line D
20
16
12
8
4
00 0,2 0,4 0,6 0,8 1,0
Line A, E
20
16
12
8
4
0
SC
F
2 = 15 2 = 30 2 = 50
= 0,25 – 1,0Symbol size ~
Brace
Chord
Line C
0 0,2 0,4 0,6 0,8 1,0
Notes: - For a T joint, the effect of chord bending due to the axial brace load should be separately included in the analysis. - For fillet welded joints: multiply SCFs for the brace by 1,4. - A minimum SCF = 2,0 is recommended to avoid crack initiation from the root. Fig. 14.10 SCFs for butt welded T and X joints of square hollow sections, loaded by an axial force on the brace
(parametric formulae compared with FE calculations (Van Wingerde, 1992))
189
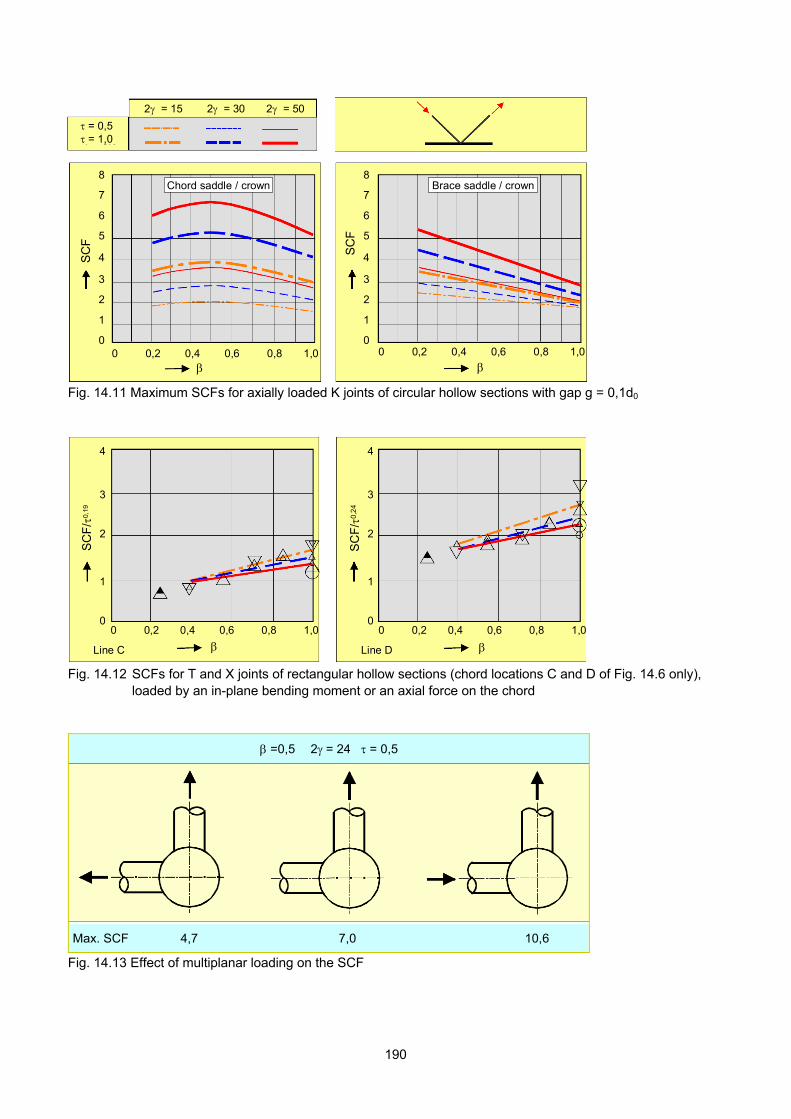
8
7
6
5
4
3
2
1
00 0,2 0,4 0,6 0,8 1,0
SC
F
Brace saddle / crown
8
7
6
5
4
3
2
1
00 0,2 0,4 0,6 0,8 1,0
SC
F
Chord saddle / crown
= 0,5= 1,0
2 = 15 2 = 30 2 = 50
8
7
6
5
4
3
2
1
00 0,2 0,4 0,6 0,8 1,0
SC
F
Brace saddle / crown
8
7
6
5
4
3
2
1
00 0,2 0,4 0,6 0,8 1,0
SC
F
Chord saddle / crown
= 0,5= 1,0
2 = 15 2 = 30 2 = 50
Fig. 14.11 Maximum SCFs for axially loaded K joints of circular hollow sections with gap g = 0,1d0
Line D
4
3
2
1
00 0,2 0,4 0,6 0,8 1,0
SC
F/
0,2
4
Line C
4
3
2
1
00 0,2 0,4 0,6 0,8 1,0
SC
F/
0,19
Line D
4
3
2
1
00 0,2 0,4 0,6 0,8 1,0
SC
F/
0,2
4
Line C
4
3
2
1
00 0,2 0,4 0,6 0,8 1,0
SC
F/
0,19
Fig. 14.12 SCFs for T and X joints of rectangular hollow sections (chord locations C and D of Fig. 14.6 only),
loaded by an in-plane bending moment or an axial force on the chord
Max. SCF 4,7 7,0 10,6
=0,5 2= 24 = 0,5
Max. SCF 4,7 7,0 10,6
=0,5 2= 24 = 0,5
Fig. 14.13 Effect of multiplanar loading on the SCF
190
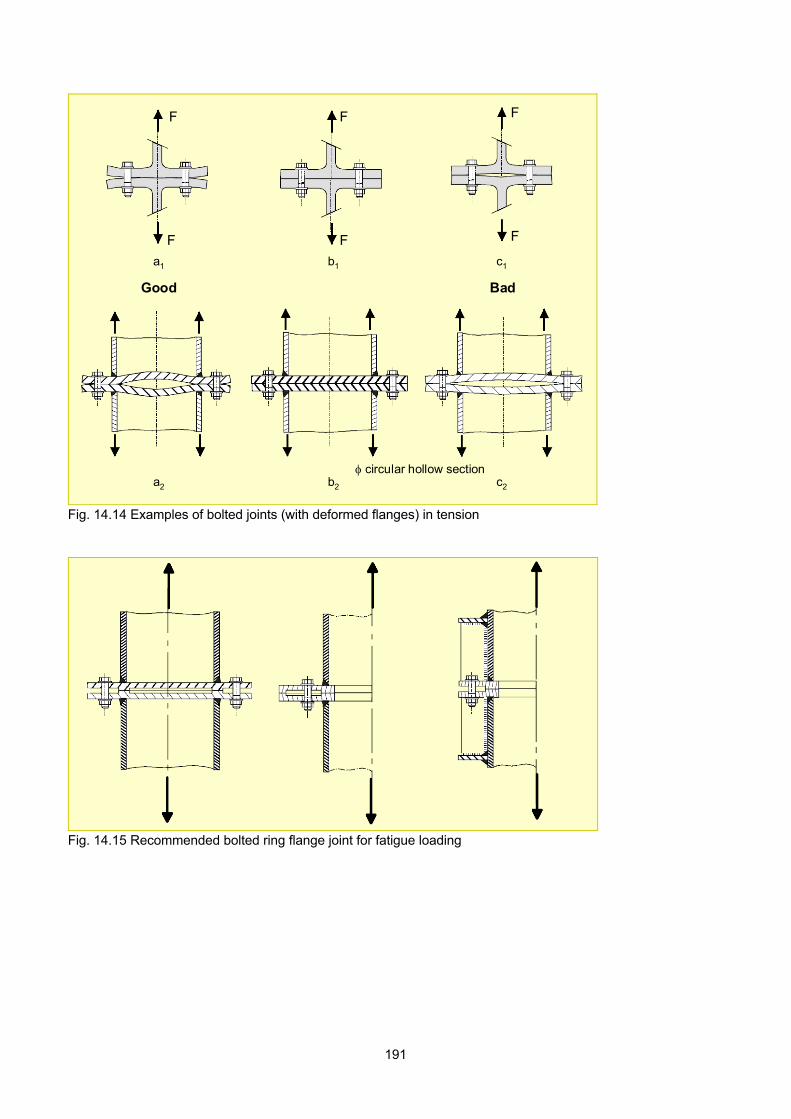
F
FF
FF
F
a1 b1 c1
a2 b2 c2
circular hollow section
Good Bad
F
FF
FF
F
a1 b1 c1
a2 b2 c2
circular hollow section
Good Bad
Fig. 14.14 Examples of bolted joints (with deformed flanges) in tension
Fig. 14.15 Recommended bolted ring flange joint for fatigue loading
191

a. No preload b. Preloaded c. Preloaded with slipa. No preload b. Preloaded c. Preloaded with slip Fig. 14.16 Possible stress distributions in bolted shear joints
Noding conditionfor most
overlap joints
Extremelystiff members
Pin
Extremelystiff members Noding condition
for most gap joints
Noding conditionfor most
overlap joints
Extremelystiff members
Pin
Extremelystiff members Noding condition
for most gap joints
Fig. 14.17 Plane frame joint modelling assumptions
192

15. DESIGN EXAMPLES
15.1 UNIPLANAR TRUSS OF CIRCULAR HOLLOW SECTIONS
In this example (Wardenier et al., 2008a), the design principles of Chapter 6 are illustrated as well as the joint design methods. • Truss layout and member loads A Warren type truss with low brace member angles is chosen to limit the number of joints, see Fig. 15.1. The trusses are spaced at 12 m intervals and the top chord is considered to be laterally supported at each purlin position at 6 m centre-to-centre. The span- to-depth ratio is 15, which is approximately the optimal limit considering service load deflections and overall costs. For this example, hot finished members are selected and the member resistances are calculated according to Eurocode 3 (EN 1993-1-1, 2005), assuming a partial factor M = 1,0 (this factor may be different for various countries). The factored design load P from the purlins including the weight of the truss has been calculated as P = 108 kN. A pin jointed analysis of the truss gives the member forces shown in Fig. 15.2. • Design of members In this example, the chords are made from steel S355 with a yield stress of 355 N/mm2 and the braces from steel S275 with a yield stress of 275 N/mm2. For member selection, use can be made of either member resistance tables with the applicable effective length or the applicable strut buckling curve. The availability of the member sizes selected has to be checked. Since the joints at the truss ends are generally decisive, the chords should not be too thin walled. As a consequence, a continuous chord with the same wall thickness over the whole truss length is often the best choice. Top chord Use a continuous chord with an effective in-plane and out-of-plane buckling length ℓb (see Chapter 2) of: ℓb = 0,9 x 6000 = 5400 mm
Maximum chord force N0 = -1148 kN (compression). Possible section sizes are shown in Table 15.1, along with their compressive resistances. From a material point, the sections Ø244,5 x 5,6 and Ø219,1 x 7,1 are most efficient. However, for the supplier considered in this example, these two dimensions are not available from stock (only deliverable from the mill). These dimensions can only be used if a large quantity is required, which is assumed in this example. Bottom chord For the capacities of the joints, it is best to keep the tension chord as compact and stocky as possible. However, to allow gap joints and to keep the eccentricity within the limits, a larger diameter may be needed. Possible section sizes are given in Table 15.2. Diagonals Try to select members (see Chapters 6 and 8) which satisfy:
iyi
00y
tf
tf 2,0
i.e. 0,2t275
1,7355
i
or ti 4,5 mm
For the braces loaded in compression, use an effective buckling length ℓb (see Chapter 2) of:
m 88,20,34,275,075,0 22 b
The possible sizes for the compression diagonals are given in Table 15.3 and for the tension diagonals in Table 15.4. Member selection The number of sectional dimensions depends on the total tonnage to be ordered. In this example, for the braces only two different dimensions will be selected. Comparison of the members suitable for the tension members and those suitable for the compression members shows that the following sections (see Fig. 15.3) are most convenient: - Braces: Ø139,7 x 4,5 Ø 88,9 x 3,6 - Top chord: Ø219,1 x 7,1 - Bottom chord: Ø193,7 x 6,3
193

(These chord sizes allow gap joints; no eccentricity is required.) It is recognized that the d0/t0 ratios of the chords selected are high. This may give joint strength problems in joints 2 and 5. The check for joint resistance is given in Table 15.5. • Joint strength checks, commentary and revision General In Table 15.5, all joints are treated as K joints, initially neglecting the additional X joint action in the joints 2, 3 and 4. In this case, there should be a larger margin between the design and the acting efficiency as will be shown in the more detailed, accurate evaluation given below. Joint 1 If, in joint 1, a gap g = 2t0 is chosen between the cap plate and the brace, nearly no eccentricity exists for the bolted joint of the cap plate. This joint is checked as a K(N) joint (see Table 15.5) because the load transfer is similar as in an N joint (the reaction in the cap plate is upwards and the diagonal loading is downwards). In the example, β is conservatively based on the diameter of the brace. Joint 2 Table 15.5 shows that the strength of joint 2 with g = 12,8t0 (and eccentricity e = 0 mm) is not sufficient. The easiest way to obtain adequate joint strength will be to decrease the gap from 12,8t0 to 3t0, resulting in a larger CK = 0,39 and a slightly lower Qf. However, this means that a (negative) eccentricity of e = 28 mm is introduced resulting in an eccentricity moment of: M0 = (878 - 338) x 28 x 10-3 = 15,12 kNm. Since the length and the stiffness El of the top chord members between joints 1-2 and 2-3 are the same (see Fig. 15.3), this moment can be equally distributed over both members, i.e. both members have to be designed additionally for M0,Ed = 7,56 kNm. Including the chord bending moment effect gives the following values for the chord stress parameter n in the connecting face at the left and right side of the joint. Left side:
113,3
7,56
0,3554728
338
M
M
fA
Nn
Rdpl,0,
Ed0,
y0 0
Ed0,
-0,130,067-0,20
Right side:
113,3
7,56-
0,3554728
878
M
M
fA
Nn
Rdpl,0,
Ed0,
y0 0
Ed0,
-0,590,067-0,52
The right side with n = -0,59 is decisive, resulting in Qf = 0,80. In combination with CK, this gives a joint strength efficiency (see Table 15.5):
0,82fA
N 0,84
fA
N
1y 1
Ed1,
1y 1
Rd1, (o.k.)
The chord members between joints 1-2 and 2-3, which are in compression, should also be checked as a beam-column for buckling. From these, chord member 2-3 is most critical. This check depends on the national code to be used. In general, the criterion to be verified has the following format:
1,0 M
M k
f A
N
Rdpl,0,
Ed0,
y0 0
Ed0,
where: χ reduction factor for column buckling (see
Table 15.1 for the values of χ for the possible chord sections)
k amplification factor for second order effects depending on slenderness, section classification and moment diagram (in this case use a triangular shape)
Mpl,0,Rd plastic moment resistance (Wpl,0 fy0) of the chord (class 1 or 2 sections)
113,3
7,56k
1189
878
M
M k
fA
N
Rdpl,0,
Ed0,
y00
Ed0,
0,1k067,074,0
Independent of the code used, this will not be critical. More accurate calculation based on combined K and X joint actions As already mentioned, this joint actually has a combination of K joint and X joint actions and should be substituted by a K joint and an X joint, see Chapter 6.2.1.
194
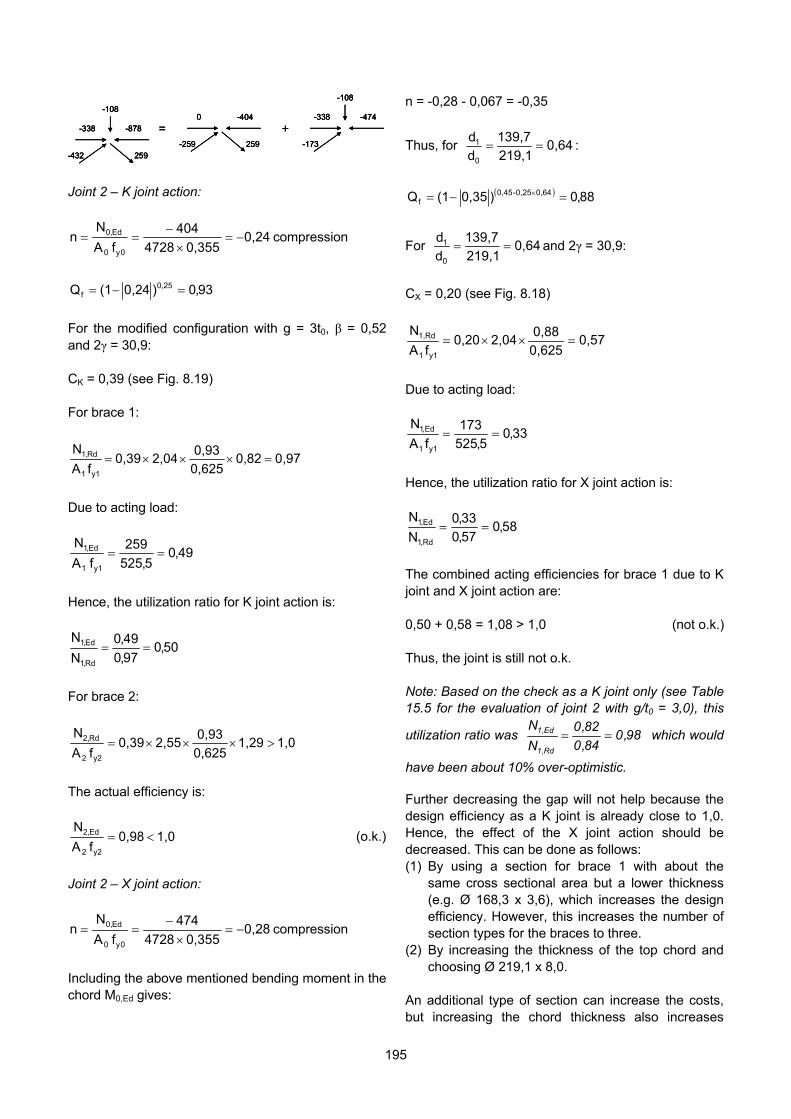
0 -404
-259 259
=-338 -474
-173
-108
+-338 -878
-432 259
-1080 -404
-259 259
0 -404
-259 259
=-338 -474
-173
-108
-338 -474
-173
-108
+-338 -878
-432 259
-108
-338 -878
-432 259
-108
Joint 2 – K joint action:
0,240,3554728
404
fA
Nn
0y 0
Ed,0
compression
93,0)0,24(1Q 0,25f
For the modified configuration with g = 3t0, β = 0,52 and 2γ = 30,9: CK = 0,39 (see Fig. 8.19) For brace 1:
0,970,820,625
0,932,040,39
fA
N
y1 1
Rd1,
Due to acting load:
49,05,525
259
f A
N
1y1
Ed,1
Hence, the utilization ratio for K joint action is:
50,097,0
49,0
N
N
Rd,1
Ed,1
For brace 2:
1,01,290,625
0,932,550,39
fA
N
y2 2
Rd2,
The actual efficiency is:
1,0 0,98fA
N
y2 2
Ed2, (o.k.)
Joint 2 – X joint action:
0,280,3554728
474
fA
Nn
0y 0
Ed,0
compression
Including the above mentioned bending moment in the chord M0,Ed gives:
n = -0,28 - 0,067 = -0,35
Thus, for 0,64219,1
139,7
d
d
0
1 :
88,0)0,35(1Q 0,640,25-0,45
f
For 0,64219,1
139,7
d
d
0
1 and 2γ = 30,9:
CX = 0,20 (see Fig. 8.18)
0,570,625
0,882,040,20
fA
N
y1 1
Rd1,
Due to acting load:
33,05,525
173
fA
N
1y 1
Ed,1
Hence, the utilization ratio for X joint action is:
58,057,0
33,0
N
N
Rd,1
Ed,1
The combined acting efficiencies for brace 1 due to K joint and X joint action are: 0,50 + 0,58 = 1,08 > 1,0 (not o.k.) Thus, the joint is still not o.k. Note: Based on the check as a K joint only (see Table 15.5 for the evaluation of joint 2 with g/t0 = 3,0), this
utilization ratio was 98,084,0
82,0
N
N
Rd,1
Ed,1 which would
have been about 10% over-optimistic. Further decreasing the gap will not help because the design efficiency as a K joint is already close to 1,0. Hence, the effect of the X joint action should be decreased. This can be done as follows: (1) By using a section for brace 1 with about the
same cross sectional area but a lower thickness (e.g. Ø 168,3 x 3,6), which increases the design efficiency. However, this increases the number of section types for the braces to three.
(2) By increasing the thickness of the top chord and choosing Ø 219,1 x 8,0.
An additional type of section can increase the costs, but increasing the chord thickness also increases
195
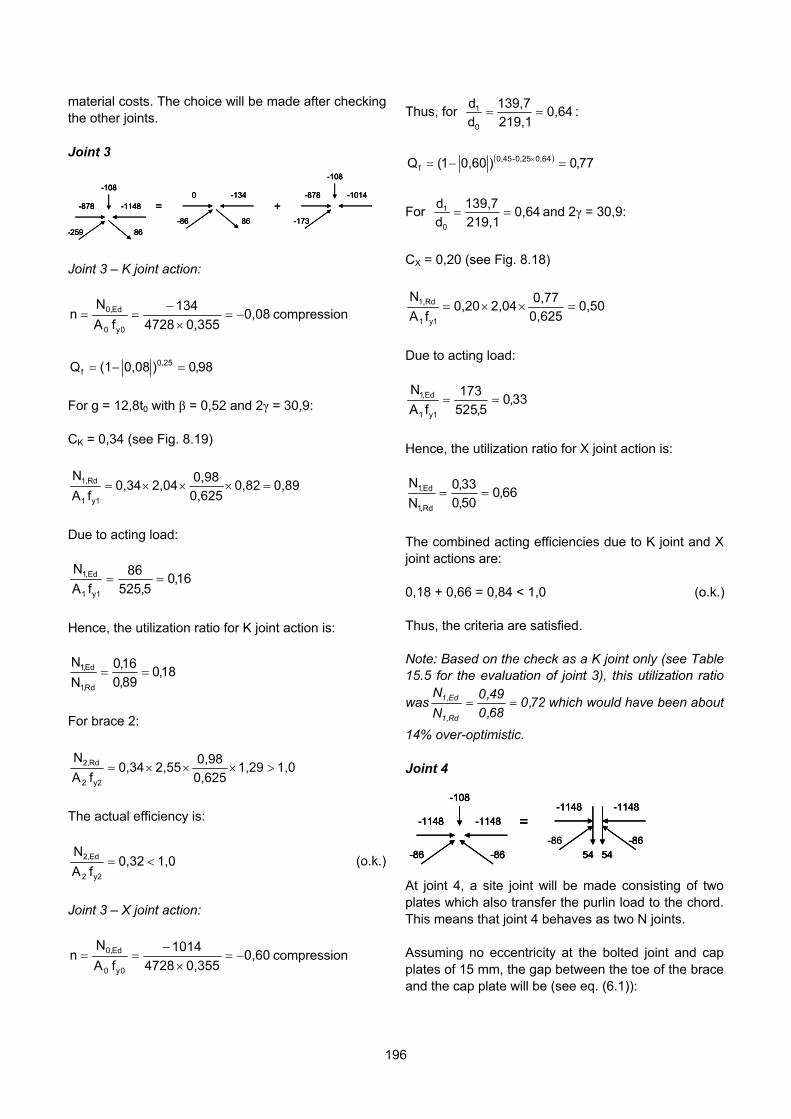
material costs. The choice will be made after checking the other joints. Joint 3
oint 3 – K joint action:
J
0,080,3554728
134
fA
Nn
0y 0
Ed,0
compression
98,0)0,08(1Q 0,25f
or g = 12,8t0 with β = 0,52 and 2γ = 30,9:
K = 0,34 (see Fig. 8.19)
F C
0,890,820,625
0,982,040,34
fA
N
y1 1
Rd1,
ue to acting load: D
16,05,525
86
fA
N
1y 1
Ed,1
ence, the utilization ratio for K joint action is: H
18,089,0
16,0
N
N
Rd,1
Ed,1
or brace 2: F
1,01,290,625
0,982,550,34
fA
N
y2 2
Rd2,
he actual efficiency is: T
1,00,32fA
N
y2 2
Ed2, (o.k.)
oint 3 – X joint action: J
0,600,3554728
1014
fA
Nn
Thus, for 0,64219,1
139,7
d
d
0
1 :
77,0)0,601(Q 0,640,25-0,45
f
0 -134
-86 86
=-878 -1014
-173
-108
+-878 -1148
-
-108
0y 0
Ed,0
compression
For 0,64219,1
139,7
d
d
0
1 and 2γ = 30,9:
CX = 0,20 (see Fig. 8.18)
0,500,625
0,772,040,20
fA
N
y1 1
Rd1,
Due to acting load:
33,05,525
173
fA
N
1y 1
Ed,1
Hence, the utilization ratio for X joint action is:
66,050,0
33,0
N
N
Rd,1
Ed,1
The combined acting efficiencies due to K joint and X joint actions are: 0,18 + 0,66 = 0,84 < 1,0 (o.k.) Thus, the criteria are satisfied. Note: Based on the check as a K joint only (see Table 15.5 for the evaluation of joint 3), this utilization ratio
was 72,068,0
49,0
N
N
Rd,1
Ed,1 which would have been about
14% over-optimistic. Joint 4 At joint 4, a site joint will be made consisting of two plates which also transfer the purlin load to the chord. This means that joint 4 behaves as two N joints. Assuming no eccentricity at the bolted joint and cap plates of 15 mm, the gap between the toe of the brace and the cap plate will be (see eq. (6.1)):
259 86
-1080 -134
-86 86
0 -134
-86 86
=-878 -1014
-173
-878 -1014
-173
-108
+
-108-108
-878 -1148-878 -1148
-259 86-259 86
-86
-1148 -1148
-86
=-1148 -1148
-86 -86
-108
54 54
-86
-1148 -1148
-86
=-1148 -1148
-86 -86
-108
54 54
-1148 -1148
-86
=-1148 -1148
-86 -86
-108
54 54
196
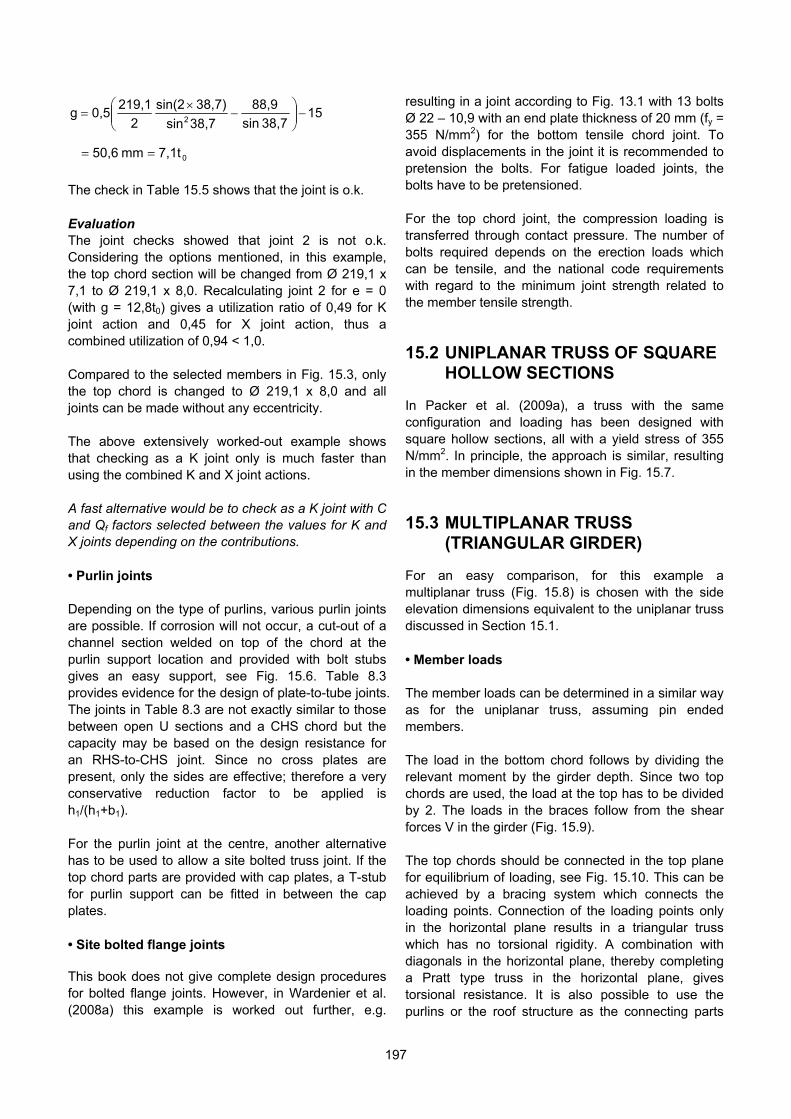
1538,7 sin
88,9
38,7sin
38,7)sin(2
2
219,10,5g
2
07,1tmm 50,6
The check in Table 15.5 shows that the joint is o.k. Evaluation The joint checks showed that joint 2 is not o.k. Considering the options mentioned, in this example, the top chord section will be changed from Ø 219,1 x 7,1 to Ø 219,1 x 8,0. Recalculating joint 2 for e = 0 (with g = 12,8t0) gives a utilization ratio of 0,49 for K joint action and 0,45 for X joint action, thus a combined utilization of 0,94 < 1,0. Compared to the selected members in Fig. 15.3, only the top chord is changed to Ø 219,1 x 8,0 and all joints can be made without any eccentricity. The above extensively worked-out example shows that checking as a K joint only is much faster than using the combined K and X joint actions. A fast alternative would be to check as a K joint with C and Qf factors selected between the values for K and X joints depending on the contributions. • Purlin joints Depending on the type of purlins, various purlin joints are possible. If corrosion will not occur, a cut-out of a channel section welded on top of the chord at the purlin support location and provided with bolt stubs gives an easy support, see Fig. 15.6. Table 8.3 provides evidence for the design of plate-to-tube joints. The joints in Table 8.3 are not exactly similar to those between open U sections and a CHS chord but the capacity may be based on the design resistance for an RHS-to-CHS joint. Since no cross plates are present, only the sides are effective; therefore a very conservative reduction factor to be applied is h1/(h1+b1). For the purlin joint at the centre, another alternative has to be used to allow a site bolted truss joint. If the top chord parts are provided with cap plates, a T-stub for purlin support can be fitted in between the cap plates. • Site bolted flange joints This book does not give complete design procedures for bolted flange joints. However, in Wardenier et al. (2008a) this example is worked out further, e.g.
resulting in a joint according to Fig. 13.1 with 13 bolts Ø 22 – 10,9 with an end plate thickness of 20 mm (fy = 355 N/mm2) for the bottom tensile chord joint. To avoid displacements in the joint it is recommended to pretension the bolts. For fatigue loaded joints, the bolts have to be pretensioned. For the top chord joint, the compression loading is transferred through contact pressure. The number of bolts required depends on the erection loads which can be tensile, and the national code requirements with regard to the minimum joint strength related to the member tensile strength.
15.2 UNIPLANAR TRUSS OF SQUARE HOLLOW SECTIONS
In Packer et al. (2009a), a truss with the same configuration and loading has been designed with square hollow sections, all with a yield stress of 355 N/mm2. In principle, the approach is similar, resulting in the member dimensions shown in Fig. 15.7.
15.3 MULTIPLANAR TRUSS (TRIANGULAR GIRDER)
For an easy comparison, for this example a multiplanar truss (Fig. 15.8) is chosen with the side elevation dimensions equivalent to the uniplanar truss discussed in Section 15.1. • Member loads The member loads can be determined in a similar way as for the uniplanar truss, assuming pin ended members. The load in the bottom chord follows by dividing the relevant moment by the girder depth. Since two top chords are used, the load at the top has to be divided by 2. The loads in the braces follow from the shear forces V in the girder (Fig. 15.9). The top chords should be connected in the top plane for equilibrium of loading, see Fig. 15.10. This can be achieved by a bracing system which connects the loading points. Connection of the loading points only in the horizontal plane results in a triangular truss which has no torsional rigidity. A combination with diagonals in the horizontal plane, thereby completing a Pratt type truss in the horizontal plane, gives torsional resistance. It is also possible to use the purlins or the roof structure as the connecting parts
197
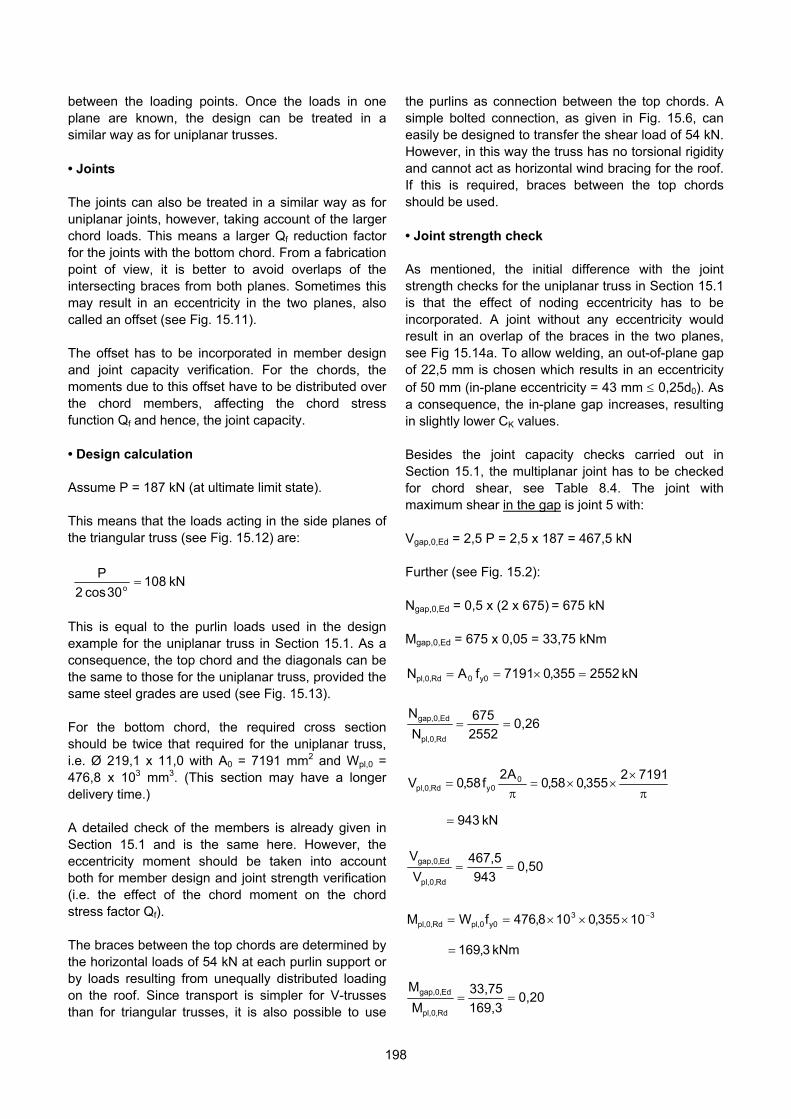
between the loading points. Once the loads in one plane are known, the design can be treated in a similar way as for uniplanar trusses. • Joints The joints can also be treated in a similar way as for uniplanar joints, however, taking account of the larger chord loads. This means a larger Qf reduction factor for the joints with the bottom chord. From a fabrication point of view, it is better to avoid overlaps of the intersecting braces from both planes. Sometimes this may result in an eccentricity in the two planes, also called an offset (see Fig. 15.11). The offset has to be incorporated in member design and joint capacity verification. For the chords, the moments due to this offset have to be distributed over the chord members, affecting the chord stress function Qf and hence, the joint capacity. • Design calculation Assume P = 187 kN (at ultimate limit state). This means that the loads acting in the side planes of the triangular truss (see Fig. 15.12) are:
kN 10830cos 2
P
o
This is equal to the purlin loads used in the design example for the uniplanar truss in Section 15.1. As a consequence, the top chord and the diagonals can be the same to those for the uniplanar truss, provided the same steel grades are used (see Fig. 15.13). For the bottom chord, the required cross section should be twice that required for the uniplanar truss, i.e. Ø 219,1 x 11,0 with A0 = 7191 mm2 and Wpl,0 = 476,8 x 103 mm3. (This section may have a longer delivery time.) A detailed check of the members is already given in Section 15.1 and is the same here. However, the eccentricity moment should be taken into account both for member design and joint strength verification (i.e. the effect of the chord moment on the chord stress factor Qf). The braces between the top chords are determined by the horizontal loads of 54 kN at each purlin support or by loads resulting from unequally distributed loading on the roof. Since transport is simpler for V-trusses than for triangular trusses, it is also possible to use
the purlins as connection between the top chords. A simple bolted connection, as given in Fig. 15.6, can easily be designed to transfer the shear load of 54 kN. However, in this way the truss has no torsional rigidity and cannot act as horizontal wind bracing for the roof. If this is required, braces between the top chords should be used. • Joint strength check As mentioned, the initial difference with the joint strength checks for the uniplanar truss in Section 15.1 is that the effect of noding eccentricity has to be incorporated. A joint without any eccentricity would result in an overlap of the braces in the two planes, see Fig 15.14a. To allow welding, an out-of-plane gap of 22,5 mm is chosen which results in an eccentricity of 50 mm (in-plane eccentricity = 43 mm 0,25d0). As a consequence, the in-plane gap increases, resulting in slightly lower CK values. Besides the joint capacity checks carried out in Section 15.1, the multiplanar joint has to be checked for chord shear, see Table 8.4. The joint with maximum shear in the gap is joint 5 with: Vgap,0,Ed = 2,5 P = 2,5 x 187 = 467,5 kN Further (see Fig. 15.2): Ngap,0,Ed = 0,5 x (2 x 675) = 675 kN Mgap,0,Ed = 675 x 0,05 = 33,75 kNm
kN 2552355,07191fAN y0 0Rdpl,0,
0,262552
675
N
N
Rdpl,0,
Edgap,0,
71912
355,058,0A2
f58,0V 00y Rdpl,0,
kN 943
0,50943
467,5
V
V
Rdpl,0,
Edgap,0,
33
y0pl,0Rdpl,0, 10355,0108,476fWM
kNm 3,169
0,20169,3
33,75
M
M
Rdpl,0,
Edgap,0,
198

A conservative, linear interaction gives:
Rdpl,0,
Edgap,0,
Rdpl,0,
Edgap,0,
Rdpl,0,
Edgap,0,
M
M
V
V
N
N
1,00,960,200,500,26
The exact interaction is more complicated (Wardenier, 1982). In general, this chord shear check becomes critical for larger β ratios.
15.4 MULTIPLANAR TRUSS OF SQUARE HOLLOW SECTIONS
The approach for a multiplanar truss of square hollow sections is similar to that in Section 15.3. Generally, the braces in the two side planes are connected at different faces of the bottom chord, giving no problems with out-of-plane overlaps as would be possible for circular hollow sections. Working out the example used in Section 15.3 for square hollow sections (all members with fy = 355 N/mm2), results in the same dimensions for the top chords and braces as those given in Fig. 15.7. For the bottom chord, a section with twice the cross sectional area has to be selected.
15.5 JOINT CHECK USING THE JOINT RESISTANCE FORMULAE
The joints in the previous examples have been checked using the efficiency parameters Ce from the design graphs. However, the joints can also be checked, using the formulae given in Chapters 8 and 9. Here, as an example, only joint 5 of the uniplanar (RHS) truss shown in Fig. 15.7 will be checked using the resistance formulae. The dimensions of the sections and the yield stresses are presented in Fig. 15.7. All other information remains similar to that given in Figs. 15.1 and 15.2. Since all members are square hollow sections, Table 9.2 applies. • Check of validity range According to Table 9.1, the gap g has to satisfy:
)1,5(1g/b)0,5(1 0
Thus, for b0 = 150 mm and 8,01502
1202
b2
bb
0
21
:
0,8)1,5(1g/1500,8)0,5(1
or: 15 g 45 The eccentricity (e) corresponding to the minimum gap of 15 mm, giving the minimum value for e, can be calculated with:
2
h
θθ sin
θ sin θ sing
θ sin 2
h
sinθ 2
he 0
21
21
2
2
1
1
mm 82
150
38,738,7 sin
38,7 sin 38,7 sin15
38,7 sin
120
8,0150
120
b
b
0
i 0,34 6,3
1500,010,1 (o.k.)
245
120
t
b
1
1 class 2 limit (= 33,9) and 40 (o.k.)
8,233,6
150
t
b
0
0 15 23,8 40 (o.k.)
0,11202
1202
b2
bb
i
21
0,6 1,0 1,3 (o.k.)
θi = 38,7 30 (o.k.) • Check for chord plastification
fi
20 y03,0
Rdi, Qθsin
tf 41N
For tension:
0,10 f )n(1Q
8,01502
1202
b2
bb
0
21
9,113,62
150
199
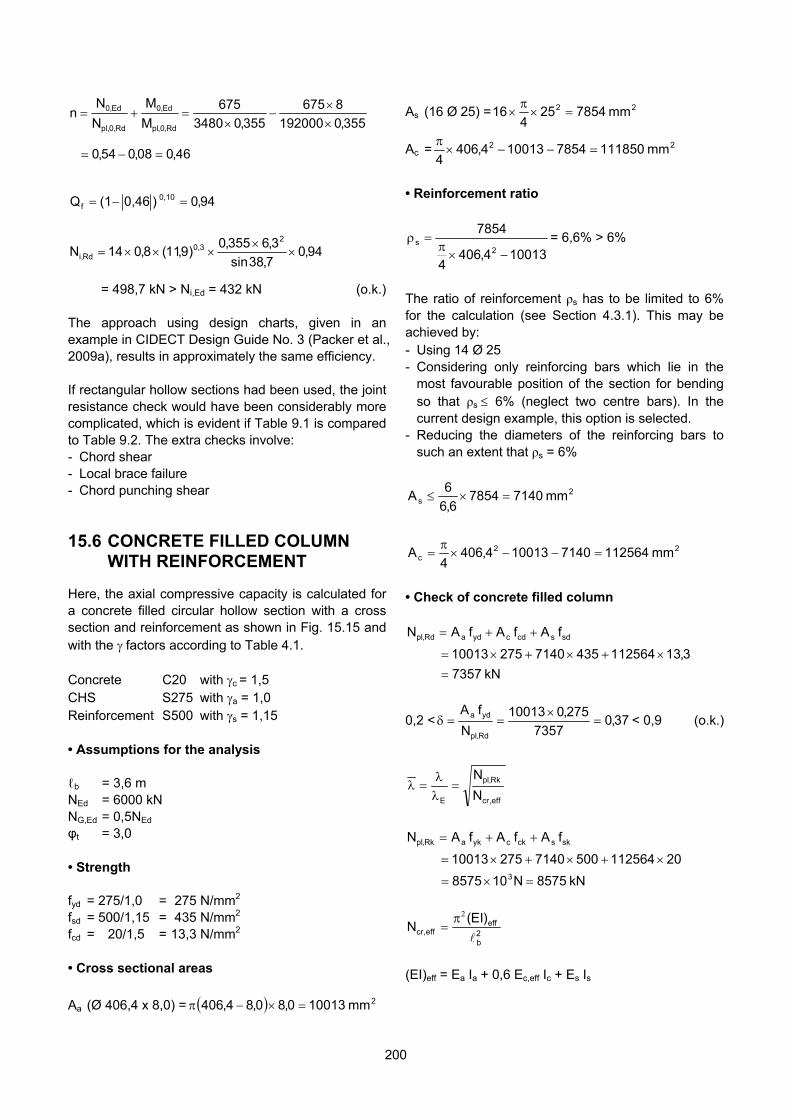
355,0192000
8675
355,03480
675
M
M
N
Nn
Rd,0,pl
Ed,0
Rd,0,pl
Ed,0
46,008,054,0
94,0)0,46(1Q 0,10 f
94,07,38sin
3,6355,0)9,11(8,014N
23,0
Rdi,
= 498,7 kN > Ni,Ed = 432 kN (o.k.) The approach using design charts, given in an example in CIDECT Design Guide No. 3 (Packer et al., 2009a), results in approximately the same efficiency. If rectangular hollow sections had been used, the joint resistance check would have been considerably more complicated, which is evident if Table 9.1 is compared to Table 9.2. The extra checks involve: - Chord shear - Local brace failure - Chord punching shear
15.6 CONCRETE FILLED COLUMN WITH REINFORCEMENT
Here, the axial compressive capacity is calculated for a concrete filled circular hollow section with a cross section and reinforcement as shown in Fig. 15.15 and with the factors according to Table 4.1. Concrete C20 with c = 1,5 CHS S275 with a = 1,0 Reinforcement S500 with s = 1,15 • Assumptions for the analysis ℓb = 3,6 m NEd = 6000 kN NG,Ed = 0,5NEd φt = 3,0 • Strength fyd = 275/1,0 = 275 N/mm2 fsd = 500/1,15 = 435 N/mm2 fcd = 20/1,5 = 13,3 N/mm2 • Cross sectional areas
Aa (Ø 406,4 x 8,0) = 2 mm 100130,80,84,406
As (16 Ø25) = 22 mm 7854254
16
Ac = 22 mm 1118507854100134,4064
• Reinforcement ratio
100134,4064
7854
2s
= 6,6% > 6%
The ratio of reinforcement ρs has to be limited to 6% for the calculation (see Section 4.3.1). This may be achieved by: - Using 14 Ø25 - Considering only reinforcing bars which lie in the
most favourable position of the section for bending so that ρs 6% (neglect two centre bars). In the current design example, this option is selected.
- Reducing the diameters of the reinforcing bars to such an extent that ρs = 6%
2s mm 71407854
6,6
6A
22c mm 1125647140100134,406
4A
• Check of concrete filled column
kN 7357
3,13112564435714027510013
fAfAfAN sd scd cyd aRd,pl
0,2 < 37,07357
275,010013
N
fA
Rd,pl
yd a
< 0,9 (o.k.)
eff,cr
Rk,pl
E N
N
kN 8575N108575
20112564500714027510013
fAfAfAN
3
sk sck cyk aRk,pl
2b
effeff,cr
)EI(N
(EI)eff = Ea Ia + 0,6 Ec,eff Ic + Es Is
200
2
tEd
Ed,G
cmeff,c N/mm 12000
35,01
30000
N
N1
EE
2945
a a Nmm 10417271019870101,2IE
29
4c eff,c
Nmm 108210
824,40664
120006,0IE 6,0
Neglecting the two centre bars gives:
2922
225s s
Nmm 1019812 )0,15522,1434
6,10943,594(16
7854101,2IE
(EI)eff = 41727 + 8210 + 19812 = 69749 kNm2
kN 531176,3
69749N eff,cr
40,053117
8575
N
N
eff,cr
Rk,pl
The reinforcement ratio ρs> 3%, thus use curve "b" (see Fig. 2.3): χ = 0,93
kN 6842735793,0kN 6000N Rd,plEd (o.k.)
• Check for local buckling
9,76275
23590908,50
0,8
4,406
t
d 2 (o.k.)
Note: The increase in compression capacity caused by confinement effects is here neglected, but would
give an increase in capacity due to the low ratio.
201
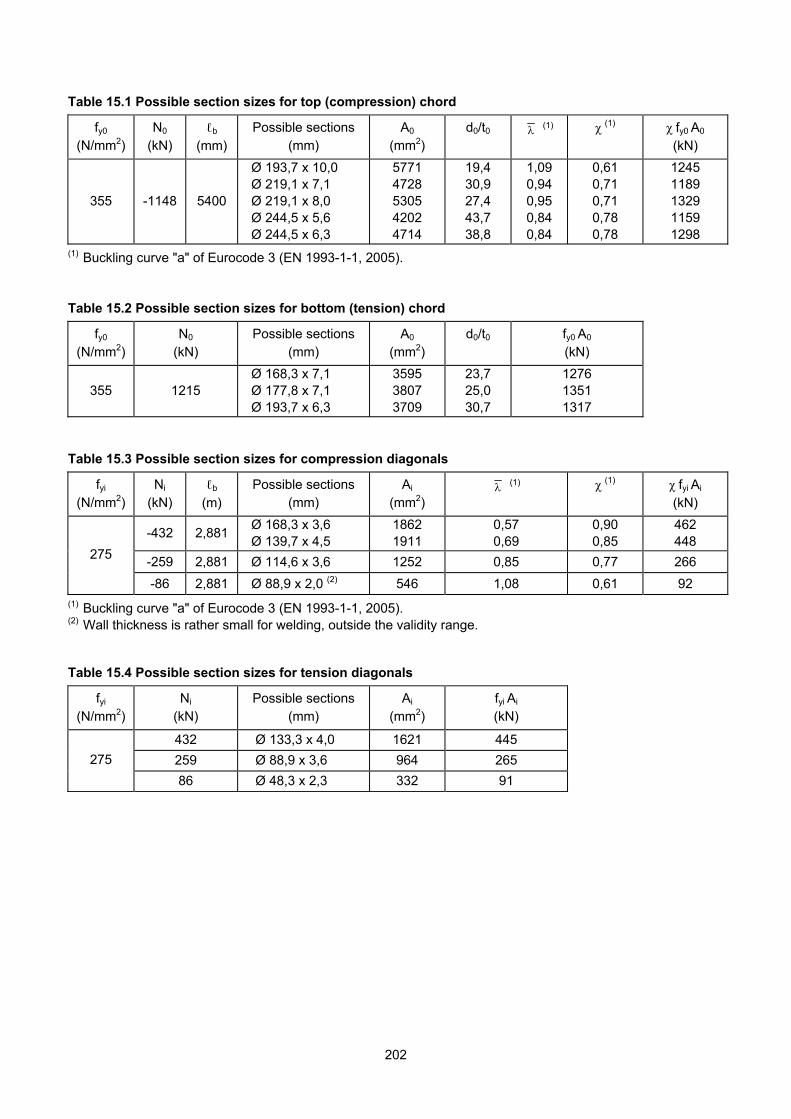
Table 15.1 Possible section sizes for top (compression) chord fy0
(N/mm2)
N0
(kN) ℓb
(mm) Possible sections
(mm) A0
(mm2) d0/t0 (1) χ (1) χ fy0 A0
(kN)
355 -1148 5400
Ø 193,7 x 10,0 Ø 219,1 x 7,1 Ø 219,1 x 8,0 Ø 244,5 x 5,6 Ø 244,5 x 6,3
5771 4728 5305 4202 4714
19,4 30,9 27,4 43,7 38,8
1,09 0,94 0,95 0,84 0,84
0,61 0,71 0,71 0,78 0,78
1245 1189 1329 1159 1298
(1) Buckling curve "a" of Eurocode 3 (EN 1993-1-1, 2005). Table 15.2 Possible section sizes for bottom (tension) chord
fy0
(N/mm2) N0
(kN) Possible sections
(mm) A0
(mm2) d0/t0 fy0 A0
(kN)
355 1215 Ø 168,3 x 7,1 Ø 177,8 x 7,1 Ø 193,7 x 6,3
3595 3807 3709
23,7 25,0 30,7
1276 1351 1317
Table 15.3 Possible section sizes for compression diagonals
fyi
(N/mm2) Ni
(kN) ℓb
(m) Possible sections
(mm) Ai
(mm2) (1) χ (1) χ fyi Ai
(kN)
-432 2,881 Ø 168,3 x 3,6 Ø 139,7 x 4,5
1862 1911
0,57 0,69
0,90 0,85
462 448
-259 2,881 Ø 114,6 x 3,6 1252 0,85 0,77 266 275
-86 2,881 Ø 88,9 x 2,0 (2) 546 1,08 0,61 92 (1) Buckling curve "a" of Eurocode 3 (EN 1993-1-1, 2005). (2) Wall thickness is rather small for welding, outside the validity range. Table 15.4 Possible section sizes for tension diagonals
fyi
(N/mm2) Ni
(kN) Possible sections
(mm) Ai
(mm2) fyi Ai
(kN)
432 Ø 133,3 x 4,0 1621 445
259 Ø 88,9 x 3,6 964 265 275
86 Ø 48,3 x 2,3 332 91
202

Table 15.5 Joint strength check, assuming K joint action only
Member sizes Joint parameters Chord load
Joint Chord (mm) Braces (mm) β d0/t0 g/t0 n
1 Ø 219,1 x 7,1 Plate Ø 139,7 x 4,5
0,64 30,9 2,0 -0,20
2 Ø 219,1 x 7,1 Ø 139,7 x 4,5 Ø 88,9 x 3,6
0,52 30,9 12,8 -0,52
2a Additional analysis of joint 2 with g/t0 = 3,0 and e = -28 mm
0,52 30,9 3,0 -0,59
3 Ø 219,1 x 7,1 Ø 139,7 x 4,5 Ø 88,9 x 3,6
0,52 30,9 12,8 -0,68
4 Ø 219,1 x 7,1 Ø 88,9 x 3,6 Ø 88,9 x 3,6
0,41 30,9 7,1 -0,68
5 Ø 193,7 x 6,3 Ø 139,7 x 4,5 Ø 139,7 x 4,5
0,72 30,7 2,9 0,51
6 Ø 193,7 x 6,3 Ø 88,9 x 3,6 Ø 139,7 x 4,5
0,59 30,7 9,4 0,82
7 Ø 193,7 x 6,3 Ø 88,9 x 3,6 Ø 88,9 x 3,6
0,46 30,7 15,8 0,92
Actual efficiency Joint strength efficiency Check
Joint yi i
Ed,i
fA
N CK
i yi
0 0y
tf
tf Qf
isin
1
i
21
d2
dd
yi i
Rd,i
fA
N Ed,iRd,i NN
1 --
0,82
0,41 -
2,04
0,95
1,60
> 1,0
> 1,0
o.k.
2 0,82 0,98
0,34 2,04 2,55
0,83 1,60 0,82 1,29
0,76 > 1,0
not o.k. o.k.
2a 0,82 0,98
0,39 2,04 2,55
0,80 1,60 0,82 1,29
0,84 > 1,0
o.k. o.k.
3 0,49 0,32
0,34 2,04 2,55
0,75 1,60 0,82 1,29
0,68 > 1,0
o.k. o.k.
4 0,32 0,32
0,35 2,55 2,55
0,75 1,60 1,0 1,0
> 1,0 > 1,0
o.k. o.k.
5 0,82 0,82
0,41 1,81 1,81
0,87 1,60 1,0 1,0
> 1,0 > 1,0
o.k. o.k.
6 0,98 0,49
0,37 2,26 1,81
0,71 1,60 1,29 0,82
> 1,0 0,62
o.k. o.k.
7 0,32 0,32
0,32 2,26 2,26
0,60 1,60 1,0 1,0
0,69 0,69
o.k. o.k.
Note: Joints 1-4 discussed in detail in text.
203
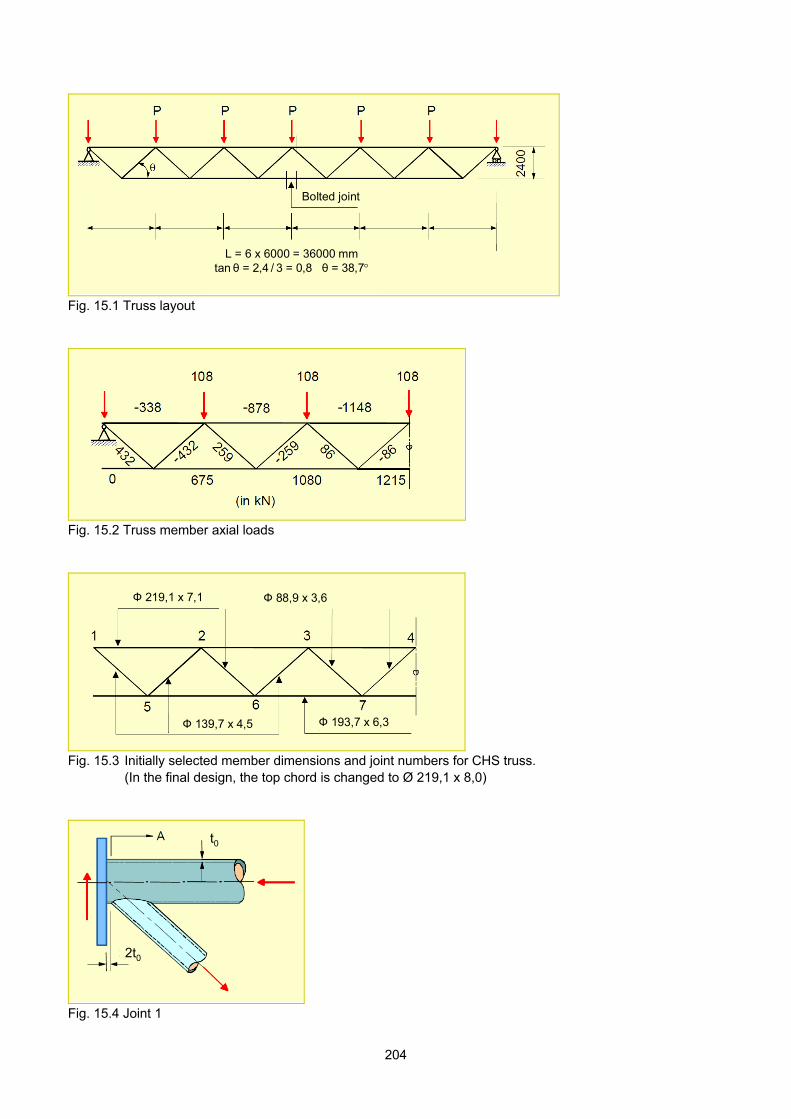
L = 6 x 6000 = 36000 mmtan θ = 2,4 / 3 = 0,8 θ = 38,7
Bolted joint
L = 6 x 6000 = 36000 mmtan θ = 2,4 / 3 = 0,8 θ = 38,7
Bolted joint
Fig. 15.1 Truss layout
-- -
---
-- -
---
Fig. 15.2 Truss member axial loads
Ф 219,1 x 7,1 Ф 88,9 x 3,6
Ф 139,7 x 4,5 Ф 193,7 x 6,3
Ф 219,1 x 7,1 Ф 88,9 x 3,6
Ф 139,7 x 4,5 Ф 193,7 x 6,3
Fig. 15.3 Initially selected member dimensions and joint numbers for CHS truss. (In the final design, the top chord is changed to Ø 219,1 x 8,0)
2t0
t0
2t0
t0
Fig. 15.4 Joint 1
204
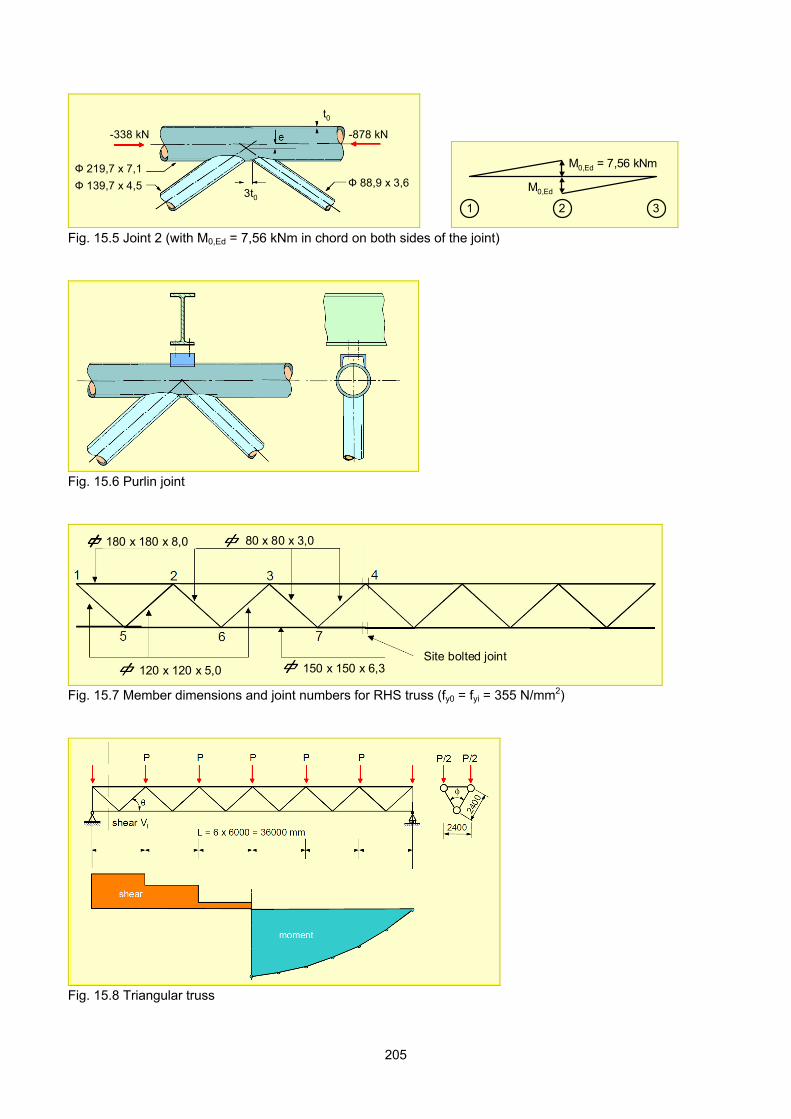
3t0
t0
-338 kN
Ф 139,7 x 4,5
Ф 219,7 x 7,1
-878 kN
Ф 88,9 x 3,63t0
t0
-338 kN
Ф 139,7 x 4,5
Ф 219,7 x 7,1
-878 kN
Ф 88,9 x 3,6
M0,Ed = 7,56 kNm
M0,Ed
1 2 3
M0,Ed = 7,56 kNm
M0,Ed
1 2 3
Fig. 15.5 Joint 2 (with M0,Ed = 7,56 kNm in chord on both sides of the joint)
Fig. 15.6 Purlin joint
180 x 180 x 8,0 80 x 80 x 3,0
120 x 120 x 5,0 150 x 150 x 6,3Site bolted joint
180 x 180 x 8,0 80 x 80 x 3,0
120 x 120 x 5,0 150 x 150 x 6,3Site bolted joint
Fig. 15.7 Member dimensions and joint numbers for RHS truss (fy0 = fyi = 355 N/mm2)
Fig. 15.8 Triangular truss
205
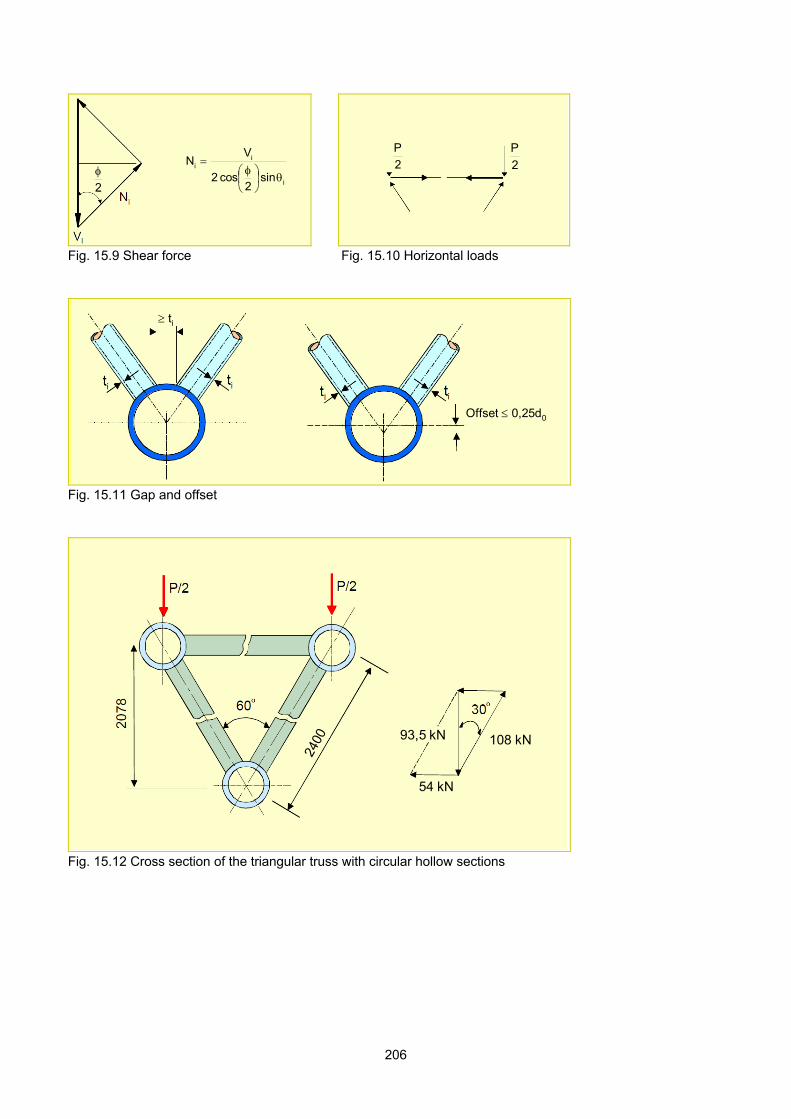
2
i
ii
sin 2
cos 2
VN
2
i
ii
sin 2
cos 2
VN
2
P
2
P2
P
2
P
Fig. 15.9 Shear force Fig. 15.10 Horizontal loads
Offset 0,25d0
ti
Offset 0,25d0
ti
Fig. 15.11 Gap and offset
2400 93,5 kN
54 kN
108 kN
2400 93,5 kN
54 kN
108 kN
Fig. 15.12 Cross section of the triangular truss with circular hollow sections
206

Ф 219,1 x 8,0
Ф 219,1 x 11,0Ф 139,7 x 4,5
Ф 88,9 x 3,6
Chord: fy0 = 355 N/mm2
Diagonals: fyi = 355 N/mm2
Ф 219,1 x 8,0
Ф 219,1 x 11,0Ф 139,7 x 4,5
Ф 88,9 x 3,6
Chord: fy0 = 355 N/mm2
Diagonals: fyi = 355 N/mm2
Fig. 15.13 Member dimensions and steel grades
Diagonals: Ф 139,7 x 4,5
Chord: Ф 219,1 x 11
22,5
Diagonals: Ф 139,7 x 4,5
Chord: Ф 219,1 x 11
22,5
Diagonals: Ф 139,7 x 4,5
Chord: Ф 219,1 x 11
22,5
Fig. 15.14 Connection of the diagonals to the bottom chord
207

59,315
5,0
109,
68,8
406,4
16 Ф 25, S500
S275
C20
143,
2
59,315
5,0
109,
68,8
406,4
16 Ф 25, S500
S275
C20
143,
2
Fig. 15.15 Concrete filled column
208
16. REFERENCES AISC, 2005: Specification for structural steel buildings. ANSI/AISC 360-05, American Institute of Steel Construction, Chicago, USA. AISC, 2010: Specification for structural steel buildings. ANSI/AISC 360-10, American Institute of Steel Construction, Chicago, USA. Akiyama, N., Yayima, M., Akiyama, H., & Otake, F., 1974: Experimental study on strength of joints in steel tubular structures. Journal of Society of Steel Construction, JSSC, Vol. 10, No. 102, pp. 37-68, (in Japanese). API, 2007: Recommended practice for planning, designing and constructing fixed offshore platforms – Working stress design. API RP 2A, 21st Edition, Suppl 3, American Petroleum Institute, Dallas, USA. Aribert, J.M., Ammari, F., & Lachal, A., 1988: Influence du mode d'application d'une charge de compression locale sur la résistance plastique de l'âme d'un profilé cas des assemblages tubulaires. Construction Métallique No. 2, pp. 3-30. Baar, S., 1968: Etude théorique et expérimentale du déversement des poutres à membrures tubulaires. Collection des publications de la Faculté des Sciences Appliquées de Université de Liège, No. 10, Liège, Belgium. Bergmann, R., Matsui, C., Meinsma, C., & Dutta, D., 1995: Design guide for concrete filled hollow section columns under static and seismic loading. CIDECT Series "Construction with hollow steel sections" No. 5, Verlag TÜV Rheinland, Köln, Germany, ISBN 3-8249-0298-2. Birkemoe, P.C., & Packer, J.A., 1986: Ultimate strength design of bolted tubular tension connections. Proceedings Conference on Steel Structures – Recent Research Advances and their Applications to Design, Budva, Yugoslavia, pp. 153-168. Björk, T., Marquis, G., Kemppainen, R., & Ilvonen, R., 2003: The capacity of cold-formed rectangular hollow section K gap joints. Proceedings 10th International Symposium on Tubular Structures, Madrid, Spain, Tubular Structures X, Swets & Zeitlinger, Lisse, The Netherlands, pp. 227-234. Björk, T., 2005: Ductility and ultimate strength of cold-formed rectangular hollow section joints at subzero temperatures. Ph.D. Thesis, Lappeenranta University of Technology, Lappeenranta, Finland. Bolt, H.M., & Billington, C.J., 2000: Results from ultimate load tests on 3D jacket-type structures. Proceedings Offshore Technology Conference, OTC 11941, Houston, USA. Bortolotti, E., Jaspart, J.-P., Pietrapertosa, C., Nicaud, G., Petitjean, P.D., Grimmault, J.P., & Michard, L., 2003: Testing and modelling of welded joints between elliptical hollow sections. Proceedings 10th International Symposium on Tubular Structures, Madrid, Spain, Tubular Structures X, Swets & Zeitlinger, Lisse, The Netherlands, pp. 259-264. Bouwkamp, J.G., 1964: Concept of tubular-joint design. Journal of the Structural Division, American Society of Civil Engineers, Vol. 90, No. ST2, pp. 77-101. Bouwman, L.P., 1982: Bolted connections dynamically loaded in tension. Journal of the Structural Division, American Society of Civil Engineers, Vol. 108, No. 9, pp. 2117-2129. British Steel, 1996: Flowdrill jointing system. CIDECT Project 6F Final Reports 6F-13A/96 and 6F-13B/96, British Steel Tubes & Pipes, Corby, UK.
209
Brodka, J., 1968: Stahlrohrkonstruktionen. Verlagsgesellschaft Rüdolf Müller, Köln-Braunsfeld, Germany, ISBN 978-3481109912. Cao, J., & Packer, J.A., 1997: Design of tension circular flange joints in tubular structures. Engineering Journal, American Institute of Steel Construction, Vol. 34, First Quarter, pp. 17-25. CEN/TC 250/SC 3-N 1729, 2010: Choice of steel material to avoid brittle fracture for hollow section structures. Report prepared for amending EN 1993-1-10. Rev. 4, CEN/TC 250 – CIDECT - Liaison, Aachen, Germany. Chan, T.M., & Gardner, L., 2008: Bending strength of hot-rolled elliptical hollow sections. Journal of Constructional Steel Research, Vol. 64, Issue 9, pp. 971-986. Chen, Y., Liu, D.K., & Wardenier, J., 2005: Design recommendations for RHS-K joints with 100% overlap. Proceedings 15th International Offshore and Polar Engineering Conference, Seoul, Korea, Vol. IV, pp. 300-307. Choo, Y.S., Liang, J.X., & Lim, L.V., 2003: Static strength of elliptical hollow section X-joint under brace compression. Proceedings 10th International Symposium on Tubular Structures, Madrid, Spain, Tubular Structures X, Swets & Zeitlinger, Lisse, The Netherlands, pp. 253-258. Choo, Y.S., Liang, J.X., & Vegte, G.J. van der, 2004: An effective external reinforcement scheme for circular hollow section joints. Proceedings ECCS-AISC Workshop "Connections in Steel Structures V", Bouwen met Staal, Zoetermeer, The Netherlands, pp. 423-432. Choo, Y.S., Qian, X.D., & Foo, K.S., 2005a: Nonlinear analysis of tubular space frame incorporating joint stiffness and strength. Proceedings 10th International Conference on Jack-up Platform Design, Construction and Operation, City University, London, UK. Choo, Y.S., Vegte, G.J. van der, Zettlemoyer, N., Li, B.H., & Liew, J.Y.R., 2005b: Static strength of T joints reinforced with doubler or collar plates - I: Experimental investigations. Journal of Structural Engineering, American Society of Civil Engineers, USA, Vol. 131, No. 1, pp. 119-128. CIDECT, 1984: Construction with hollow steel sections. British Steel Plc., Corby, Northants, UK, ISBN 0-9510062-0-7. CSA, 2009: Design of steel structures. CSA-S16-09, Canadian Standards Association, Toronto, Canada. Davies, G., & Crockett, P., 1994: Effect of the hidden weld on RHS partial overlap K joint capacity. Proceedings 6th International Symposium on Tubular Structures, Melbourne, Australia, Tubular Structures VI, Balkema, Rotterdam, The Netherlands, pp. 573-579. Deutscher Dampfkesselausschuß, 1975: Glatte Vierkantrohre und Teilkammern unter innerem Überdruck. Technische Regeln für Dampfkessel (TRD 320), Vereinigung der Technischen Überwachungsvereine e.V., Essen, Germany. Dexter, E.M., & Lee, M.M.K., 1998: Effect of overlap on the behaviour of axially loaded CHS K-joints. Proceedings 8th International Symposium on Tubular Structures, Singapore, Tubular Structures VIII, Balkema, Rotterdam, The Netherlands, pp. 249-258. Dier, A.F., & Lalani, M., 1998: New code formulations for tubular joint static strength. Proceedings 8th International Symposium on Tubular Structures, Singapore, Tubular Structures VIII, Balkema, Rotterdam, The Netherlands, pp. 107-116. Dier, A.F., 2005: Tubular joint technology for offshore structures. International Journal of Steel Structures, Vol. 5, No. 5, pp. 495-502.
210
Dutta, D., Wardenier, J., Yeomans, N., Sakae, K., Bucak, Ö., & Packer, J.A., 1998: Design guide for fabrication, assembly and erection of hollow section structures. CIDECT Series "Construction with hollow steel sections" No. 7, TÜV-Verlag, Köln, Germany, ISBN 3-8249-0443-8. Dutta, D., 2002: Structures with hollow sections. Wiley-VCH Verlag GmbH, Berlin, Germany, ISBN 978-3-433-01458-5, (also available in German). Eekhout, M., 1996: Tubular structures in architecture. 1st Edition, Delft University of Technology, Delft, The Netherlands, CIDECT. Eekhout, M., 2010: Tubular structures in architecture. 2nd Edition, Delft University of Technology, Delft, The Netherlands, CIDECT. Efthymiou, M., 1988: Development of SCF formulae and generalised influence functions for use in fatigue analysis. Proceedings Offshore Tubular Joints Conference, Surrey, UK. EN 1990, 2002: Eurocode − Basis of structural design. European Committee for Standardization, Brussels, Belgium. EN 1992-1-1, 2004: Eurocode 2: Design of concrete structures − Part 1-1: General rules and rules for buildings. European Committee for Standardization, Brussels, Belgium. EN 1993-1-1, 2005: Eurocode 3: Design of steel structures − Part 1-1: General rules and rules for buildings. European Committee for Standardization, Brussels, Belgium. EN 1993-1-2, 2005: Eurocode 3: Design of steel structures − Part 1-2: General rules - Structural fire design. European Committee for Standardization, Brussels, Belgium. EN 1993-1-8, 2005: Eurocode 3: Design of steel structures − Part 1-8: Design of joints. European Committee for Standardization, Brussels, Belgium. EN 1993-1-9, 2005: Eurocode 3: Design of steel structures − Part 1-9: Fatigue. European Committee for Standardization, Brussels, Belgium. EN 1993-1-10, 2005: Eurocode 3: Design of steel structures − Part 1-10: Material toughness and through-thickness properties. European Committee for Standardization, Brussels, Belgium. EN 1993-1-12, 2007: Eurocode 3: Design of steel structures − Part 1-12: Additional rules for the extension of EN 1993 up to steel grades S700. European Committee for Standardization, Brussels, Belgium. EN 1994-1-1, 2004: Eurocode 4: Design of composite steel and concrete structures – Part 1-1: General rules and rules for buildings. European Committee for Standardization, Brussels, Belgium. EN 1994-1-2, 2005: Eurocode 4: Design of composite steel and concrete structures – Part 1-2: General rules - Structural fire design. European Committee for Standardization, Brussels, Belgium. EN 10210-1, 2006: Hot finished structural hollow sections of non-alloy and fine grain steels – Part 1: Technical delivery conditions. European Committee for Standardization, Brussels, Belgium. EN 10210-2, 2006: Hot finished structural hollow sections of non-alloy and fine grain steels – Part 2: Tolerances, dimensions and sectional properties. European Committee for Standardization, Brussels, Belgium. EN 10219-1, 2006: Cold formed welded structural hollow sections of non-alloy and fine grain steels – Part 1: Technical delivery conditions. European Committee for Standardization, Brussels, Belgium.
211
EN 10219-2, 2006: Cold formed welded structural hollow sections of non-alloy and fine grain steels – Part 2: Tolerances, dimensions and sectional properties. European Committee for Standardization, Brussels, Belgium. Fleischer, O., & Puthli, R., 2008: Extending existing design rules in EN 1993-1-8 (2005) for gapped RHS K-joints for maximum chord slenderness (b0/t0) of 35 to 50 and gap size g to as low as 4t0. Proceedings 12th International Symposium on Tubular Structures, Shanghai, China, Tubular Structures XII, Taylor & Francis Group, London, UK, pp. 293-301. Frater, G.S., & Packer, J.A., 1990: Design of fillet weldments for hollow structural section trusses. CIDECT Report 5AN/2-90/7, University of Toronto, Toronto, Canada. Grandjean, G., Grimault, J.-P., & Petit, L., 1980: Détermination de la durée au feu des profiles creux remplis de béton. Cometube, Paris, France, (also published as ECSC Report No. 7210-SA/302). Guiaux, P., & Janss, J., 1970: Comportement au flambement de colonnes constituées de tubes en acier remplis de béton. Centre de Recherches Scientifiques et Techniques de l'Industrie des Fabrications Métalliques, MT 65, Brussels, Belgium. Herion, S., 1994: Räumliche K-Knoten aus Rechteck-Hohlprofilen. Ph.D. Thesis, University of Karlsruhe, Karlsruhe, Germany. Hoadley, P.W., & Yura, J.A., 1985: Ultimate strength of tubular joints subjected to combined loads. Proceedings Offshore Technology Conference, OTC 4854, Houston, USA. Hönig, O., Klingsch, W., & Witte, H., 1985: Baulicher Brandschutz durch wassergefüllte Stützen in Rahmentragwerken (Fire resistance of water filled columns). Research Report, Studiengesellschaft für Stahlanwendung e.V., Forschungsbericht p. 86/4.5, Düsseldorf, Germany. Igarashi, S., Wakiyama, K., lnoue, K., Matsumoto, T., & Murase, Y., 1985: Limit design of high strength bolted tube flange joint – Parts 1 and 2. Journal of Structural and Construction Engineering, Transactions of AIJ, Department of Architecture Reports, Osaka University, Osaka, Japan. IISI, 1997: Innovation in steel – Bridges around the world. International Iron and Steel Institute. IIW, 1989: Design recommendations for hollow section joints – Predominantly statically loaded. 2nd Edition, International Institute of Welding, Sub-commission XV-E, Annual Assembly, Helsinki, Finland, IIW Doc. XV-701-89. IIW, 1999: Recommended fatigue design procedure for welded hollow section joints, Part 1: Recommendations and Part 2: Commentary. International Institute of Welding, Sub-commission XV-E, IIW Docs. XV-1035-99/XIII-1804-99. IIW, 2008: Recommendations for fatigue design of welded joints and components. International Institute of Welding, IIW Docs. IIW-1823-07/XIII-2151r4-07/XV-1254r4-07. IIW, 2009: Static design procedure for welded hollow section joints – Recommendations. 3rd Edition, International Institute of Welding, Sub-commission XV-E, Annual Assembly, Singapore, IIW Doc. XV-1329-09. ISO 657-14, 2000: Hot-rolled steel sections – Part 14: Hot-finished structural hollow sections – Dimensions and sectional properties. International Organization for Standardization, Geneva, Switzerland. ISO 834-1, 1999: Fire resistance tests – Elements of building construction – Part 1: General requirements. International Organization for Standardization, Geneva, Switzerland.
212
ISO 4019, 2001: Structural steels – Cold-formed, welded, structural hollow sections – Dimensions and sectional properties. International Organization for Standardization, Geneva, Switzerland. ISO 19902, 2007: Petroleum and natural gas industries – Fixed steel offshore structures. International Organization for Standardization, Geneva, Switzerland. Jamm, W., 1951: Form strength of welded tubular connections and tubular structures under static loading. (Translation from German). Schweissen und Schneiden, Vol. 3, Germany. Kaim, P., 2006: Buckling of members with rectangular hollow sections. Proceedings 11th International Symposium on Tubular Structures, Quebec City, Canada, Tubular Structures XI, Taylor & Francis Group, London, UK, pp. 443-449. Kamba, T., & Tabuchi, M., 1994: Database for tubular column to beam connections in moment resisting frames. IIW Doc. XV-E-94-208, Dept. of Architecture, Kobe University, Kobe, Japan. Kato, B., & Hirose, A., 1984: Bolted tension flanges joining circular hollow section members. CIDECT Report 8C-84/24-E. Kitipornchai, S., & Traves, W.H., 1989: Welded tee end connections for circular hollow tubes. Journal of Structural Engineering, American Society of Civil Engineers, Vol. 115, No. 12, pp. 3155-3170. Koning, C.H.M. de, & Wardenier, J., 1979: Tests on welded joints in complete girders made of square hollow sections. Stevin Report 6-79-4, Delft University of Technology, Delft, The Netherlands. Korol, R.M., El-Zanaty, M., & Brady, F.J., 1977: Unequal width connections of square hollow sections in Vierendeel trusses. Canadian Journal of Civil Engineering, Vol. 4, No. 2, pp. 190-201. Kosteski, N., & Packer, J.A., 2003: Longitudinal plate and through plate-to-HSS welded connections. Journal of Structural Engineering, American Society of Civil Engineers, Vol. 129, No. 4, pp. 478-486. Kosteski, N., Packer, J.A., & Puthli, R.S., 2003: Notch toughness of cold formed hollow sections. CIDECT Report 1B-2/03. University of Toronto, Toronto, Canada. Kühn, B., 2005: Beitrag zur Vereinheitlichung der Europäischen Regelungen zur Vermeidung von Sprödbruch. Ph.D. Thesis, RWTH Aachen, Aachen, Germany. Kurobane, Y., 1981: New developments and practices in tubular joint design (+ Addendum). International Institute of Welding, Annual Assembly, Oporto, Portugal, IIW Doc. XV-488-81. Kurobane, Y., Packer, J.A., Wardenier, J., & Yeomans, N., 2004: Design guide for structural hollow section column connections. CIDECT Series "Construction with hollow steel sections" No. 9, TÜV-Verlag, Köln, Germany, ISBN 3-8249-0802-6. Lind, N.C., & Shroff, D.K., 1971: Utilization of cold work in light gage steel. Proceedings 1st Specialty Conference on Cold-Formed Steel Structures, University of Missouri, Rolla, USA, pp. 10-13. Liu, D.K., Yu, Y., & Wardenier, J., 1998: Effect of boundary conditions and chord preload on the strength of RHS uniplanar gap K-joints. Proceedings 8th International Symposium on Tubular Structures, Singapore, Tubular Structures VIII, Balkema, Rotterdam, The Netherlands, pp. 223-230. Liu, D.K., & Wardenier, J., 2001: Multiplanar influence on the strength of RHS multiplanar gap KK joints. Proceedings 9th lnternational Symposium on Tubular Structures, Düsseldorf, Germany, Tubular Structures IX, Swets & Zeitlinger, Lisse, The Netherlands, pp. 203-212.
213
Liu, D.K., & Wardenier, J., 2003: The strength of multiplanar KK-joints of square hollow sections. Proceedings 10th International Symposium on Tubular Structures, Madrid, Spain, Tubular Structures X, Swets & Zeitlinger, Lisse, The Netherlands, pp. 197-205. Liu, D.K., & Wardenier, J., 2004: Effect of the yield strength on the static strength of uniplanar K-joints in RHS (steel grades S460, S355 and S235). IIW Doc. XV-E-04-293, Delft University of Technology, Delft, The Netherlands. Liu, D.K., Chen, Y., & Wardenier, J., 2005: Design recommendations for RHS-K joints with 50% overlap. Proceedings 15th International Offshore and Polar Engineering Conference, Seoul, Korea, Vol. IV, pp. 308-315. Liu, D.K., & Wardenier, J., 2006: Effect of chord loads on the strength of RHS uniplanar gap K-joints. Proceedings.11th International Symposium on Tubular Structures, Quebec City, Canada, Tubular Structures XI, Taylor & Francis Group, London, UK, pp. 539-544. Lu, L.H., Winkel, G.D. de, Yu, Y., & Wardenier, J., 1994: Deformation limit for the ultimate strength of hollow section joints. Proceedings 6th International Symposium on Tubular Structures, Melbourne, Australia, Tubular Structures VI, Balkema, Rotterdam, The Netherlands, pp. 341-347. Lu, L.H., 1997: The static strength of I-beam to rectangular hollow section column connections. Ph.D. Thesis, Delft University of Technology, Delft, The Netherlands. Makino, Y., Kurobane, Y., Paul, J.C., Orita, Y., & Hiraishi, K., 1991: Ultimate capacity of gusset plate-to-tube joints under axial and in plane bending loads. Proceedings 4th International Symposium on Tubular Structures, Delft, The Netherlands, Delft University Press, Delft, The Netherlands, pp. 424-434. Makino, Y., Kurobane, Y., Ochi, K., Vegte, G.J. van der, & Wilmshurst, S.R., 1996: Database of test and numerical analysis results for unstiffened tubular joints. IIW Doc. XV-E-96-220, Kumamoto University, Kumamoto, Japan. Mang, F., & Bucak, Ö., 1983: Hohlprofilkonstruktionen. Stahlbau-Handbuch, Bd. I, Stahlbau-Verlag, Köln, Germany. Mang, F., Bucak, Ö., & Wolfmuller, F., 1983: The development of recommendations for the design of welded joints between steel structural hollow sections (T- and X-type joints). Final Report on ECSC Agreement 7210 SA/l 09 and CIDECT Programme 5AD, University of Karlsruhe, Karlsruhe, Germany. Marshall, J., 1971: Torsional behaviour of structural rectangular hollow sections. The Structural Engineer, The Institution of Structural Engineers, London, UK, Vol. 49, Issue 8, pp. 375-379. Marshall, P.W., & Toprac, A.A., 1974: Basis for tubular joint design. Welding Journal, Vol. 53, No. 5, pp. 192-201, (also ASCE preprint no. 2008, April 1973). Marshall, P.W., 1984: Connections for welded tubular structures. IIW Houdremont Lecture, Proceedings 2nd International Conference on Welding of Tubular Structures, Boston, USA. Pergamon Press, Oxford, UK, pp. 1-54. Marshall, P.W., 1992: Design of welded tubular connections. Elsevier, Amsterdam, The Netherlands. Marshall, P.W., 2004: Review of tubular joint criteria. Proceedings ECCS-AISC Workshop "Connections in Steel Structures V", Bouwen met Staal, Zoetermeer, The Netherlands, pp. 457-467. Marshall, P.W., 2006: Punching shear and hot spot stress - Back to the future? Kurobane Lecture, Proceedings 11th International Symposium on Tubular Structures, Quebec City, Canada, Tubular Structures XI, Taylor & Francis Group, London, UK, pp. 287-299.
214

Martinez-Saucedo, G., Packer, J.A., & Zhao, X.-L., 2008: Static design of elliptical hollow section end-connections. Proceedings Institution of Civil Engineers, Structures & Buildings 161, Issue SB2, pp. 103-113. Mashiri, F.R., Zhao, X.-L., Hirt, M., & Nussbaumer, A., 2007: Size effect of welded thin-walled tubular joints. International Journal of Structural Stability and Dynamics, Vol. 7, No. 1, pp. 101-127. Mouty, J., 1981: Effective lengths of lattice girder members. CIDECT Monograph No. 4, CIDECT. Natarajan, M., & Toprac, A.A., 1968: Studies on tubular joints in Japan: Review of research reports. Structures Fatigue Research Laboratory, The University of Texas, Austin, USA. Natarajan, M., & Toprac, A.A., 1969: Studies on tubular joints in USA: Review of research reports. Structures Fatigue Research Laboratory, The University of Texas, Austin, USA. Noordhoek, C., Wardenier, J., & Dutta, D., 1980: The fatigue behaviour of welded joints in square hollow sections – Part 2: Analysis. Stevin Report 6-80-4, TNO-IBBC Report BI-80-10/0063.4.3821, Delft University of Technology, Delft, The Netherlands. Ono, T., Iwata, M., & Ishida, K., 1991: An experimental study on joints of new truss system using rectangular hollow sections. Proceedings 4th International Symposium on Tubular Structures, Delft, The Netherlands, Delft University Press, Delft, The Netherlands, pp. 344-353. Packer, J.A., 1978: Theoretical behaviour and analysis of welded steel joints with RHS chord sections. Ph.D. Thesis, University of Nottingham, Nottingham, UK. Packer, J.A., & Haleem, A.S., 1981: Ultimate strength formulae for statically loaded welded HSS joints in lattice girders with RHS chords. Proceedings Canadian Society for Civil Engineering, Annual Conference, Fredericton, Canada, Vol. 1, pp. 331-343. Packer, J.A., Bruno, L., & Birkemoe, P.C., 1989: Limit analysis of bolted RHS flange plate joints. Journal of Structural Engineering, American Society of Civil Engineers, Vol. 115, No. 9, pp. 2226-2242. Packer, J.A., & Wardenier, J., 1992: Design rules for welds in RHS K, T, Y and X connections. Proceedings IIW International Conference on Engineering Design in Welded Constructions, Madrid, Spain, pp. 113-120. Packer, J.A., Wardenier, J., Kurobane, Y., Dutta, D., & Yeomans, N., 1992: Design guide for rectangular hollow section (RHS) joints under predominantly static loading. 1st Edition, CIDECT Series "Construction with hollow steel sections" No. 3, Verlag TÜV Rheinland, Köln, Germany, ISBN 3-8249-0089-0. Packer, J.A., 1993: Overview of current international design guidance on hollow structural section connections. Proceedings 3rd International Offshore and Polar Engineering Conference, Singapore, Vol. 4, pp. 1-7. Packer, J.A., 1996: Nailed tubular connections under axial loading. Journal of Structural Engineering, American Society of Civil Engineers, Vol. 122. No. 8, pp. 458-467. Packer, J.A., & Henderson, J.E., 1997: Hollow structural section connections and trusses – A design guide. 2nd Edition, Canadian Institute of Steel Construction, Toronto, Canada. Packer, J.A., 2006: Tubular brace member connections in braced steel frames. Houdremont Lecture, Proceedings 11th International Symposium on Tubular Structures, Quebec City, Canada, Tubular Structures XI, Taylor & Francis Group, London, UK, pp. 3-14. Packer, J.A., Mashiri, F.R., Zhao, X.-L., & Willibald, S., 2007: Static and fatigue design of CHS-to-RHS welded connections using a branch conversion method. Journal of Constructional Steel Research, Vol. 63, Issue 1, pp. 82-95.
215
Packer, J.A., Wardenier, J., Zhao, X.-L., Vegte, G.J. van der, & Kurobane, Y., 2009a: Design guide for rectangular hollow section (RHS) joints under predominantly static loading. 2nd Edition, CIDECT Series "Construction with hollow steel sections" No. 3, CIDECT, ISBN 978-3-938817-04-9. Packer, J.A., Wardenier, J., Choo, Y.S., & Chiew, S.P., 2009b: Elliptical steel tubes. Steel News and Notes, Singapore Structural Steel Society, SN&N 25th Anniversary Issue, pp. 86-90. Packer, J., Sherman, D., & Lecce, M., 2010: Hollow structural section connections. Steel Design Guide No. 24, American Institute of Steel Construction, Chicago, USA. Paul, J.C., 1992: The ultimate behaviour of multiplanar TT and KK joints made of circular hollow sections. Ph.D. Thesis, Kumamoto University, Kumamoto, Japan. Pecknold, D.A., Marshall, P.W., & Bucknell, J., 2007: New API RP2A tubular joint strength design provisions. Journal of Energy Resources Technology, American Society of Mechanical Engineers, USA, Vol. 129, No. 3, pp. 177-189. Pietrapertosa, C., & Jaspart, J.-P., 2003: Study of the behaviour of welded joints composed of elliptical hollow sections. Proceedings 10th International Symposium on Tubular Structures, Madrid, Spain, Tubular Structures X, Swets & Zeitlinger, Lisse, The Netherlands, pp. 601-608. Puthli, R.S., 1998: Hohlprofilkonstruktionen aus Stahl nach DIN V ENV 1993 (EC 3) und DIN 18 800 (11.90). Werner Verlag GmbH & Co. KG., Düsseldorf, Germany, ISBN 3-8041-2975-7. Puthli, R.S., & Herion, S., 2005: Welding in cold-formed areas of rectangular hollow sections. CIDECT Report 1A-1/05. University of Karlsruhe, Karlsruhe, Germany. Qian, X.D., Wardenier, J., & Choo, Y.S., 2007: A uniform approach for the design of 100% CHS overlap joints. Proceedings 5th International Conference on Advances in Steel Structures, Singapore, Vol. II, pp. 172-182. Qian, X.D., Choo, Y.S., Vegte, G.J. van der, & Wardenier, J., 2008: Evaluation of the new IIW CHS strength formulae for thick-walled joints. Proceedings 12th International Symposium on Tubular Structures, Shanghai, China, Tubular Structures XII, Taylor & Francis Group, London, UK, pp. 271-279. Roik, K., Bergmann, R., Bode, H., & Wagenknecht, G., 1975: Tragfähigkeit von ausbetonierten Hohlprofilstützen aus Baustahl. Technisch Wissenschaftliche Mitteilungen, Institut für Konstruktiven Ingenieurbau, TWM-Heft Nr. 75-4, Ruhr-Universität Bochum, Bochum, Germany. Roik, K., & Wagenknecht, G., 1977: Traglastdiagramme zur Bemessung von Druckstäben mit doppelsymmetrischem Querschnitt aus Baustahl. Technisch Wissenschaftliche Mitteilungen, Institut für Konstruktiven Ingenieurbau, Heft 27, Ruhr-Universität Bochum, Bochum, Germany. Romeijn, A., 1994: Stress and strain concentration factors of welded multiplanar tubular joints. Heron, Vol. 39, No. 3, Delft University of Technology, Delft, The Netherlands. Rondal, J., 1990: Study of maximum permissible weld gaps in connections with plane end cuttings (5AH2); Simplification of circular hollow section welded joints (5AP). CIDECT Report 5AH2/5AP-90/20. Rondal, J., Würker, K.-G., Dutta, D., Wardenier, J., & Yeomans, N., 1992: Structural stability of hollow sections. CIDECT Series "Construction with hollow steel sections" No. 2, Verlag TÜV Rheinland, Köln, Germany, ISBN 3-8249-0075-0. Schulz, G., 1970: Der Windwiderstand von Fachwerken aus zylindrischen Stäben und seine Berechnung. Internationaler Normenvergleich für die Windlasten auf Fachwerken. CIDECT Monograph No. 3, CIDECT.
216
Sedlacek, G., Feldmann, M., Kühn, B., Tschickardt, D., Höhler, S., Müller, C., Hensen, W., Stranghöner, N., Dahl, W., Langenberg, P., Münstermann, S., Brozetti, J., Raoul, J., Pope, R., & Bijlaard, F., 2008: Commentary and worked examples to EN 1993-1-10 “Material toughness and through thickness properties” and other toughness oriented rules in EN 1993. JRC 47278, EUR 23510 EN, Luxembourg. Shanmugam, N.E., Ting, L.C., & Lee, S.L., 1993: Static behaviour of I-beam to box-column connections with external stiffeners. The Structural Engineer, The Institution of Structural Engineers, London, UK, Vol. 71, Issue 15, pp. 269-275. Sidercad, & British Steel, 1996: Hollow section connections using Hollo-Fast expansion bolts. CIDECT Project 6G Final Report 6G-14E/96, British Steel Tubes & Pipes, Corby, UK. Soininen, R., 1996: Fracture behaviour and assessment of design requirements against fracture in welded steel structures made of cold-formed rectangular hollow sections. Ph.D. Thesis, Lappeenranta University of Technology, Lappeenranta, Finland. Sopha, T., Chiew, S.P., & Wardenier, J., 2006: Test results for RHS K-joints with 50% and 100% overlap. Proceedings 11th International Symposium on Tubular Structures, Quebec City, Canada, Tubular Structures XI, Taylor & Francis Group, London, UK, pp. 133-138. Struik, J.H.A., & Back, J. de, 1969: Tests on bolted T-stubs with respect to a bolted beam-to-column connection. Stevin Report 6-69-13, Delft University of Technology, Delft, The Netherlands. Syam, A.A., & Chapman, B.G., 1996: Design of structural steel hollow section connections. 1st Edition, Australian Institute of Steel Construction, Sydney, Australia. Theofanous, M., Chan, T.M., & Gardner, L., 2009: Flexural behaviour of stainless steel oval hollow sections. Thin-Walled Structures, Vol. 47, Nos. 6-7, pp. 776-787. Thiensiripipat, N., 1979: Statical behaviour of cropped web joints in tubular trusses. Ph.D. Thesis, University of Manitoba, Winnipeg, Canada. Tissier, P., 1978: Resistance to corrosion of the interior of hollow steel sections. Acier, Stahl, Steel 2/1978. Togo, T., 1967: Experimental study on mechanical behaviour of tubular joints. Ph.D. Thesis, Osaka University, Osaka, Japan, (in Japanese). Twilt, L., & Haar, P.W. van de, 1986: Harmonization of the calculation rules for the fire resistance of concrete filled SHS-columns. CIDECT Project 15F-86/7-0; IBBC-TNO Report B-86-461, Delft, The Netherlands. Twilt, L., & Both, C., 1991: Technical notes on the realistic behaviour and design of fire exposed steel and composite structures. Final Report ECSC 7210-SA/112, Activity D: "Basis for Technical Notes", TNO Building and Construction Research, BI-91-069, The Netherlands. Twilt, L., Hass, R., Klingsch, W., Edwards, M., & Dutta, D., 1994: Design guide for structural hollow section columns exposed to fire. CIDECT Series "Construction with hollow steel sections" No. 4, Verlag TÜV Rheinland, Köln, Germany, ISBN 3-8249-0171-4. Vegte, G.J. van der, Back, J. de, Wardenier, J., 1989: Low cycle fatigue of tubular T- and X-joints. Proceedings 3rd International Symposium on Tubular Structures, Lappeenranta, Finland, pp. 266-277. Vegte, G.J. van der, 1995: The static strength of uniplanar and multiplanar tubular T and X joints. Ph.D. Thesis, Delft University of Technology, Delft, The Netherlands.
217
Vegte, G.J. van der, & Makino, Y., 2006: Ultimate strength formulation for axially loaded CHS uniplanar T-joints. International Journal of Offshore and Polar Engineering, ISOPE, Vol. 16, No. 4, pp. 305-312. Vegte, G.J. van der, Makino, Y., & Wardenier, J., 2007: New ultimate strength formulation for axially loaded CHS K-joints. Proceedings 5th International Conference on Advances in Steel Structures, Singapore, Vol. II, pp. 218-227. Vegte, G.J. van der, Wardenier, J., Zhao, X.-L., & Packer, J.A., 2008: Evaluation of new CHS strength formulae to design strengths. Proceedings 12th International Symposium on Tubular Structures, Shanghai, China, Tubular Structures XII, Taylor & Francis Group, London, UK, pp. 313-322. Vegte, G.J. van der, Wardenier, J., & Puthli, R.S., 2010a: FE analysis for welded hollow section joints and bolted joints. Proceedings Institution of Civil Engineers, Structures & Buildings (to be published). Vegte, G.J. van der, Wardenier, J., Qian, X.D., & Choo, Y.S., 2010b: Re-evaluation of the moment capacity of CHS joints. Proceedings Institution of Civil Engineers, Structures & Buildings (to be published). Virdi, K.S., & Dowling, P.J., 1976: A unified design method for composite columns. International Association for Bridge and Structrural Engineering (IABSE), Zürich, Switzerland, Mémoires Vol. 36-II, pp. 165-184. Voth, A.P., 2010: Branch plate-to-circular hollow structural section connections. Ph.D. Thesis, University of Toronto, Toronto, Canada. Wang, Y.C., & Orton, A.H., 2008: Fire resistant design of concrete filled tubular steel columns. The Structural Engineer, The Institution of Structural Engineers, London, UK, Vol. 86, Issue 19, pp. 40-45. Wang, Y.C., & Ding, J, 2009: The robustness of joints between steel beams and concrete filled tubular (CFT) columns under fire conditions. CIDECT Final Report 15S-14/09, The University of Manchester, Manchester, UK. Wanke, J., 1966: Stahlrohrkonstruktionen. Springer Verlag, Vienna, Austria, ISBN 978-3211807910. Wardenier, J., & Mouty, J., 1979: Design rules for predominantly statically loaded welded joints with hollow sections as bracings and an I- or H-section as chord. Welding in the World, Vol. 17, No. 9/10. Wardenier, J., 1982: Hollow section joints. Delft University Press, Delft, The Netherlands. Wardenier, J., & Giddings, T.W., 1986: The strength and behaviour of statically loaded welded connections in structural hollow sections. CIDECT Monograph No. 6, CIDECT. Wardenier, J., Kurobane, Y., Packer, J.A., Dutta, D., & Yeomans, N., 1991: Design guide for circular hollow section (CHS) joints under predominantly static loading. 1st Edition, CIDECT Series "Construction with hollow steel sections" No. 1, Verlag TÜV Rheinland, Köln, Germany, ISBN 3-88585-975-0. Wardenier, J., Dutta, D., Yeomans, N., Packer, J.A., & Bucak, Ö., 1995: Design guide for structural hollow sections in mechanical applications. CIDECT Series "Construction with hollow steel sections" No. 6, Verlag TÜV Rheinland, Köln, Germany, ISBN 3-8249-0302-4. Wardenier, J., 2002: Hollow sections in structural applications. 1st Edition, Bouwen met Staal, Zoetermeer, The Netherlands. Wardenier, J., & Choo, Y.S., 2006: Recent developments in welded hollow section joint recommendations. Advanced Steel Construction, The Hong Kong Institute of Steel Construction, Vol. 2, No. 2, pp. 109-127. Wardenier, J., 2007: A uniform effective width approach for the design of CHS overlap joints. Proceedings 5th International Conference on Advances in Steel Structures, Singapore, Vol. II, pp. 155-165.
218
Wardenier, J., Vegte, G.J. van der, & Liu, D.K., 2007a: Chord stress function for rectangular hollow section X and T joints. Proceedings 17th International Offshore and Polar Engineering Conference, Lisbon, Portugal, Vol. IV, pp. 3363-3370. Wardenier, J., Vegte, G.J. van der, & Liu, D.K., 2007b: Chord stress functions for K gap joints of rectangular hollow sections. International Journal of Offshore and Polar Engineering, ISOPE, Vol. 17, No. 3, pp. 225-232. Wardenier, J., Kurobane, Y., Packer, J.A., Vegte, G.J. van der, & Zhao, X.-L., 2008a: Design guide for circular hollow section (CHS) joints under predominantly static loading. 2nd Edition, CIDECT Series "Construction with hollow steel sections" No. 1, CIDECT, ISBN 978-3-938817-03-2. Wardenier, J., Vegte, G.J. van der, Makino, Y., & Marshall, P.W., 2008b: Comparison of the new IIW (2008) CHS joint strength formulae with those of the previous IIW (1989) and the new API (2007). Proceedings 12th International Symposium on Tubular Structures, Shanghai, China, Tubular Structures XII, Taylor & Francis Group, London, UK, pp. 281-291. Wardenier, J., Vegte, G.J. van der, & Makino, Y., 2009: Joints between plates or I sections and a circular hollow section chord. International Journal of Offshore and Polar Engineering, ISOPE, Vol. 19, No. 3, pp. 232-239. Weynand, K., Busse, E., & Jaspart, J.-P., 2006: First practical implementation of the component method for joints in tubular construction. Proceedings 11th International Symposium on Tubular Structures, Quebec City, Canada, Tubular Structures XI, Taylor & Francis Group, London, UK, pp. 139-145. Whitmore, R.E., 1952: Experimental investigation of stresses in gusset plates. Bulletin 16, Engineering Experiment Station, The University of Tennessee, Knoxville, USA. Wilkinson, T., & Hancock, G., 1998: Compact or class 1 limits for rectangular hollow sections in bending. Proceedings 8th International Symposium on Tubular Structures, Singapore, Tubular Structures VIII, Balkema, Rotterdam, The Netherlands, pp. 409-416. Willibald, S., Packer, J.A., & Puthli, R.S., 2002: Experimental study of bolted HSS flange-plate connections in axial tension. Journal of Structural Engineering, American Society of Civil Engineers, Vol. 128, No. 3, pp. 328-336. Willibald, S., Packer, J.A., & Puthli, R.S., 2003a: Design recommendations for bolted rectangular HSS flange-plate connections in axial tension. Engineering Journal, American Institute of Steel Construction, Vol. 40, First Quarter, pp. 15-24. Willibald, S., Packer, J.A., & Puthli, R.S., 2003b: Investigation on hidden joint connections under tensile loading. Proceedings 10th International Symposium on Tubular Structures, Madrid, Spain, Tubular Structures X, Swets & Zeitlinger, Lisse, The Netherlands, pp. 217-225. Willibald, S., Packer, J.A., & Martinez-Saucedo, G., 2006: Behaviour of gusset plate connections to ends of round and elliptical hollow structural section members. Canadian Journal of Civil Engineering, Vol. 33, pp. 373-383. Wingerde, A.M. van, 1992: The fatigue behaviour of T- and X-joints made of square hollow sections. Heron, Vol. 37, No. 2, Delft University of Technology, Delft, The Netherlands. Wingerde, A.M. van, Delft, D.R.V. van, Wardenier, J., & Packer, J.A., 1997: Scale effects on the fatigue behaviour of tubular structures. Proceedings IIW International Conference on Performance of Dynamically Loaded Welded Structures, San Francisco, USA, pp. 123-135.
219
220
Winkel, G.D de, 1998: The static strength of I-beam to circular hollow section column connections. Ph.D. Thesis, Delft University of Technology, Delft, The Netherlands. Yeomans, N.F., 1994: I-Beam/rectangular hollow section column connections using the Flowdrill system. Proceedings 6th International Symposium on Tubular Structures, Melbourne, Australia, Tubular Structures VI, Balkema, Rotterdam, The Netherlands, pp. 381-388. Yeomans, N.F., 1998: Rectangular hollow section column connections using the Lindapter HolloBolt. Proceedings 8th International Symposium on Tubular Structures, Singapore, Tubular Structures VIII, Balkema, Rotterdam, The Netherlands, pp. 559-566. Yu, Y., 1997: The static strength of uniplanar and multiplanar connections in rectangular hollow sections. Ph.D. Thesis, Delft University of Technology, Delft, The Netherlands. Zhao, X.-L., 1992: The behaviour of cold formed RHS beams under combined actions. Ph.D. Thesis, The University of Sydney, Sydney, Australia. Zhao, X.-L., Herion, S., Packer, J A., Puthli, R.S., Sedlacek, G., Wardenier, J., Weynand, K., Wingerde, A.M. van, & Yeomans, N.F., 2001: Design guide for circular and rectangular hollow section welded joints under fatigue loading. CIDECT Series "Construction with hollow steel sections" No. 8, TÜV-Verlag, Köln, Germany, ISBN 3-8249-0565-5. Zhao, X.-L., Wilkinson, T., & Hancock, G.J., 2005: Cold-formed tubular members and connections. Elsevier Science, London, UK, ISBN 978-0080441016. Zhao, X.-L., Wardenier, J., Packer, J.A., & Vegte, G.J. van der, 2008: New IIW (2008) static design recommendations for hollow section joints. Proceedings 12th International Symposium on Tubular Structures, Shanghai, China, Tubular Structures XII, Taylor & Francis Group, London, UK, pp. 261-269. Zhao, X.-L., & Packer, J.A., 2009: Tests and design of concrete-filled elliptical hollow section stub columns. Thin-Walled Structures, Vol. 47, Nos. 6-7, pp. 617-628. Zhao, X.-L., Han, L.H., & Lu, H., 2010: Concrete-filled tubular members and connections. Taylor & Francis Group, London, UK, ISBN 978-0-415-43500-0.

SYMBOLS
Abbreviations of organisations AISC American Institute of Steel Construction AWS American Welding Society CEN European Committee for Standardization CIDECT Comité International pour le Développement et l'Etude de la Construction Tubulaire CSA Canadian Standards Association IIW International Institute of Welding ISO International Organization for Standardization
Other abbreviations CHS circular hollow section CTOD crack tip opening displacement FE finite element RHS rectangular or square hollow section SCF stress concentration factor SHS square hollow section TTP through thickness properties
General symbols A cross sectional area Aa cross sectional area of structural steel in a composite column Ac cross sectional area of concrete in a composite column Agv gross area in shear for block failure Ai cross sectional area of member i (i = 0, 1, 2, 3) Am exposed surface area of a steel member/unit length under fire conditions; cross section
parameter for torsion An net section in a bolted joint Anet net cross sectional area As cross sectional area of reinforcement in a composite column Av shear area Be effective chord length in ring model Bf width parameter of diaphragm plate in beam-to-column joints C constant; constant in Δσ-N relationship; multiplication factor to account for secondary bending
moments Ce efficiency parameter for joints (general) CK efficiency parameter for K joints CT efficiency parameter for T joints CX efficiency parameter for X joints C1 constant used in chord stress function E modulus of elasticity Ea modulus of elasticity of steel section in a composite column Ecm modulus of elasticity of concrete in a composite column Ec,eff modulus of elasticity of concrete in a composite column, corrected for creep Ed total energy dissipated in yield line model Efi,d,t design load under fire conditions, at fire exposure time t Es modulus of elasticity of reinforcement in a composite column (EI)eff effective stiffness of a composite column
221
(EI)eff,|| stiffness of a composite column used for a second order analysis F force I moment of inertia Ia moment of inertia of steel section in a composite column Ib moment of inertia of a beam Ic moment of inertia of concrete in a composite column Is moment of inertia of reinforcement in a composite column It torsional moment of inertia JAA ratio of out-of-plane axial load and in-plane axial load in a multiplanar joint Kb stiffness of a beam L length; span; length in a bolted (gusset plate) joint Lb length of a beam Leff effective length Lo measured length of a tensile test specimen Lw weld length in a gusset plate joint M moment Mb bending moment in a beam at mid-span Mc,Rd design resistance of a cross section to bending moment Me elastic moment capacity Mel elastic yield moment capacity MEd design bending moment MEd,|| second order bending moment Mf bending moment in a flange Mgap,0,Ed design bending moment in the cross section of a chord at the gap Mi applied bending moment in member i (i = 0, 1, 2, 3) Mi,Rd design resistance of a joint, expressed in terms of bending moment in member i (i = 0, 1, 2, 3) Mip,i applied in-plane bending moment in member i (i = 0, 1, 2, 3) Mip,i,Ed design applied in-plane bending moment in member i (i = 0, 1, 2, 3) Mip,i,Rd design resistance of a joint, expressed in terms of in-plane bending moment in member i (i = 0,
1, 2, 3) Mj applied bending moment in a beam-to-column joint Mj,Ed applied design bending moment in a beam-to-column joint Mj,Rd design moment resistance of a beam-to-column joint Mmax,Rd maximum design resistance of a composite cross section to bending moment Mop,i applied out-of-plane bending moment in member i (i = 0, 1, 2, 3) Mop,i,Ed design applied out-of-plane bending moment in member i (i = 0, 1, 2, 3) Mop,i,Rd design resistance of a joint, expressed in terms of out-of-plane bending moment in member i
(i = 0, 1, 2, 3) Mpl plastic moment capacity Mpl,f plastic moment capacity of a flange Mpl,V,0,Rd design value of the plastic moment capacity of a chord cross section, reduced by shear Mpl,Rd design value of the plastic moment capacity of a (composite) cross section Mpl,y,Rd design resistance of a (composite) cross section to bending moment about the y-y axis Mpl,z,Rd design resistance of a (composite) cross section to bending moment about the z-z axis Mpl,0 plastic moment capacity of a chord cross section Mpl,0,Rd design value of the plastic moment capacity of a chord cross section MRd design resistance of a (composite) cross section to bending moment Mt,Rd design resistance of a cross section to torsional moment My,Ed design bending moment about the y-y axis Mz,Ed design bending moment about the z-z axis M0 bending moment in a chord M0,Ed design bending moment in a chord M1 brace or beam bending moment M||,max design bending moment of a member including imperfection and second order effects N axial load; number of cycles (to failure)
222

Nb,Rd design buckling resistance of a member Ncr,eff buckling capacity used to determine the second order effects NEd (acting) design axial load (at room temperature) Nequ equivalent design axial load under fire conditions including effect of eccentricities Nfi,Ed design axial load under fire conditions Nfi,Rd buckling resistance of a member under fire conditions NG,Ed permanent part of the acting design force in a composite column Ngap,0 axial load in the cross section of a chord at the gap Ngap,0,Ed design axial load in the cross section of a chord at the gap Ngap,0,Rd reduced resistance to axial load, due to shear, in the cross section of a chord at the gap Ni applied axial force in brace i (i = 1, 2, 3); applied axial force in overlapping brace Ni number of cycles to failure (in Palmgren-Miner rule) Ni,Ed design applied axial load in member i (i = 0, 1, 2, 3) Ni,Rd design resistance of a joint, expressed in terms of axial load in member i (i = 0, 1, 2, 3) Nj applied axial load in overlapped brace Nj,Ed design applied axial load in overlapped brace Npl axial load capacity of a cross section Npl,V,0,Rd design value of the axial load capacity of a chord cross section, reduced by shear Npl,Rd design resistance of a (composite) cross section to axial load (at room temperature) Npl,Rk characteristic resistance of a (composite) cross section to axial load Npl,0 axial yield capacity of a chord cross section Npl,0,Rd design axial yield capacity of a chord cross section NRd design resistance of a (composite) cross section to axial load; buckling resistance of a member
at room temperature Ns,Rd design value of the shear resistance of the brace(s) at the connection with the chord Nt,Rd design tensile capacity of a cross section N0 chord load N0,Ed design value of the chord load N0p chord preload N1u ultimate axial load capacity of a joint based on the load in member 1 N1u(JAA) ultimate strength of a multiplanar joint with load ratio JAA N1u(JAA = 0) ultimate strength of a multiplanar joint with unloaded out-of-plane braces P factored design load Ov overlap, Ov = q/p x 100% Ovlimit limit for overlap, decisive for brace shear check Qf chord stress function Qu function in the design strength equations accounting for the effect of geometric parameters R stress or load ratio RAZ reduction of area in a tensile test (in %) Rfi,d,t design resistance under fire conditions, at fire exposure time t R(t) resistance under fire conditions S static moment to neutral axis Sj rotational stiffness of a joint Sj,ini initial rotational stiffness of a joint So cross sectional area of a standard tensile test specimen (in mm2) V volume of a steel member/unit length; shear load VEd (acting) design shear load Vf shear load in a flange Vgap,0,Ed design shear load in the cross section of a chord at the gap Vi shear load in brace i (i = 1, 2, 3) Vp punching shear stress Vpl,f plastic shear capacity of a flange Vpl,Rd design plastic shear yield capacity Vpl,0 plastic shear yield capacity of a chord cross section Vpl,0,Rd design plastic shear yield capacity of a chord cross section
223
V0 shear load in a chord V0,Ed design shear load in a chord Weff effective section modulus Wel elastic section modulus Wel,ip,i elastic section modulus for in-plane bending moment in member i Wel,op,i elastic section modulus for out-of-plane bending moment in member i Wi elastic section modulus of member i (i = 0, 1, 2, 3) Wpl plastic section modulus Wpl,i plastic section modulus of member i (i = 0, 1, 2, 3) Wt section modulus for torsion a throat thickness of a weld; edge distance of bolt a’ edge distance of plastic hinge line in bolted end plate connection b external width of a rectangular hollow section; width of a plate; distance from bolt to RHS face be effective width of a plate, a beam flange or a brace member bei effective width of an overlapping RHS brace member at the chord connection bej effective width of an overlapped RHS brace member at the chord connection be,ov effective width of an overlapping RHS brace member at the connection to the overlapped
brace be,p effective punching shear width bf minimum width of a diaphragm plate in beam-to-column joints bi external width of brace i (i = 1, 2, 3) bj width of overlapped brace bm average width of an RHS (b-t) bsp width of a stiffening plate bw effective width of a web bwf effective width of a web under a brace wall, a plate or a beam flange b’ distance between plastic hinge lines in bolted end plate connection b0 external width of a chord b1 width of a plate or width of an I section or RHS brace c constant in chord M-N interaction equation c, c0, c1, c2 coefficients cs factor considering the condition (welded or unwelded) at the hidden toe of the overlapped
brace d external diameter of a hollow section; bolt diameter dei effective width of an overlapping CHS brace member at the chord connection dej effective width of an overlapped CHS brace member at the chord connection de,ov effective width of an overlapping CHS brace member at the connection to the overlapped
brace di external diameter of brace i (i = 1, 2, 3); diameter of overlapping brace; external diameter of
inner tube in composite column dj diameter of overlapped brace dw depth of the web of an I section chord (dw = h0 - 2t0 - 2r) d’ bolt hole diameter d0 external diameter of a chord e, e0 eccentricity e1 distance from bolt to CHS face e2 edge distance of bolt fb,Rd design buckling stress fc strength of concrete in a composite column fcd design strength of concrete in a composite column fck characteristic concrete cylinder strength (in N/mm2) fck,cub characteristic concrete cube strength (in N/mm2) fck,cyl characteristic concrete cylinder strength (in N/mm2) fk buckling stress for chord side wall failure (general)
224
fs yield strength of reinforcement in a composite column fsd design strength of reinforcement in a composite column fsk characteristic strength of reinforcement in a composite column fu specified ultimate tensile strength fu,b ultimate tensile strength of material "b" fui ultimate tensile strength of overlapping brace fuj ultimate tensile strength of overlapped brace fu0 ultimate tensile strength of a chord fy yield strength; design yield strength in joint strength equations fya design yield strength based on the average yield strength of an RHS section fyb yield strength of parent material fyd specified design yield strength fyi design yield strength of brace i (i = 1, 2, 3); design yield strength of overlapping brace fyj design yield strength of overlapped brace fyk characteristic yield strength of hollow steel section in a composite column fyp design yield strength of a plate fyw design yield strength of a web fy0 design yield strength of a chord g, g1, g2 gap between the braces (ignoring welds) of a K, N or KT joint at the face of the chord g bolt gauge g1 bolt edge distance g2 bolt distance g’ gap divided by chord thickness: g’ = g/t0 h depth of a rectangular hollow section hi external depth of brace i (i = 1, 2, 3) hj depth of overlapped brace hm average depth of an RHS (h-t) hn parameter in a composite column hz moment arm h0 external depth of a chord h1 depth of a plate or depth of an I section or RHS brace i radius of gyration k amplification factor to incorporate second order effects ky,θ reduction factor for the yield strength of steel at steel temperature θa
l, ℓ length ℓA circumferential parameter for torsion ℓb buckling length ℓb,eff. effective perimeter for local brace failure ℓi length of yield line i; length of member i (i = 0, 1, 2, 3) ℓθ buckling length under fire conditions lx length used in the "4 hinge yield line" model m slope of Δσ-N curve mp plastic moment per unit length n chord stress divided by chord yield stress n’ ratio of chord stress due to chord preload and chord yield stress ni applied number of cycles (in Palmgren-Miner rule) p length of the projected contact area of the overlapping brace onto the face of the chord,
without the presence of the overlapped brace; internal pressure; bolt pitch q projected length of overlap between braces of a K or N joint at the chord face; uniformly
distributed loading q, q1, q2 loadings r inside corner radius of a rectangular or square hollow section; radius of an I or U section; ratio
of the smaller to the larger end moment (-1 r +1) rj load bearing capacity in fire of a single component of a composite cross section rm mean corner radius of a rectangular or square hollow section
225
s extension of a Tee from a brace member; bolt distance t (fire exposure) time, thickness; wall thickness tf flange plate thickness ti wall thickness of brace i (i = 1, 2, 3); thickness of overlapping brace; wall thickness of inner
tube in composite column; plate thickness (i = 1, 2) in a bolted splice joint tj wall thickness of overlapped brace tp thickness of a plate tsp thickness of a stiffening plate tw thickness of a web t0 flange thickness of an I section chord or wall thickness of a CHS or RHS chord or “through
member” (e.g. column) t1 thickness of a plate or flange thickness of an I section brace or wall thickness of a CHS or
RHS brace us concrete cover of reinforcement w distance between the welds measured from plate face-to-plate face around the perimeter of a
CHS or RHS member α non-dimensional factor for the effectiveness of the chord flange in shear; angle used in yield
line model α chord length parameter: α = 2ℓ0/d0 or 2ℓ0/b0 αM reduction factor for the plastic moment capacity of a composite column β parameter for the effect of the end moments on member buckling β diameter or width ratio between braces and chord:
0
1
0
1
0
1
0
1
b
b or
d
b or
b
d or
d
d (T, Y or X joints);
0
21
0
21
0
21
2b
bb or
2b
dd or
d2
dd (K or N joints);
0
321
0
321
3b
bbb or
d3
ddd (KT joints)
β* width parameter used for T stub joints χ reduction factor for buckling according to EN 1993-1-1 (2005) or any equivalent national
buckling curve χd ratio between actual design force and the axial capacity of a composite section χfi reduction factor for buckling in the fire design situation δ, δ1 deformation δ section parameter (contribution ratio of steel section in a composite column) ε section class parameter accounting for different steel grades; engineering strain; logarithmic
strain εu ultimate strain joint resistance (or capacity) factor; angle between the planes in a multiplanar joint , j rotation of a beam-to-column joint γ half diameter or half width-to-thickness ratio of the chord: γ = d0/2t0 or b0/2t0 γa partial (safety) factor for steel section in a composite column γc partial (safety) factor for concrete in a composite column γF load factor for the action γM, γM0, γM1, γM2 material or joint partial (safety) factor γs partial (safety) factor for reinforcement in a composite column η brace member depth-to-chord diameter or width ratio: η = hi/d0 or hi/b0 ηfi ratio between the design load present under fire conditions and the design load at room
temperature ηfi,t ratio between the design load present under fire conditions and the buckling resistance at
room temperature φ angle used in ring model
226
φe correction coefficient related to the eccentricity φi rotation in a yield line i φs correction coefficient related to the reinforcement φt creep factor slenderness of a member under compression E Euler slenderness
relative slenderness ratio μ correction factor to uniplanar joint resistance to account for multiplanar effect μd related bending capacity in a composite column μdy related bending capacity about the y axis μdz related bending capacity about the z axis θ temperature; angle between brace and chord θa steel temperature θi acute angle between brace member i (i = 1, 2, 3) and the chord; acute angle between
overlapping brace and the chord θj acute angle between overlapped brace and the chord ρs reinforcement ratio of a composite column (in %) σ axial or bending stress; engineering stress; logarithmic stress σa stress in steel section σc stress in concrete σjoint stress at the intersection of brace and chord σmax maximum stress σmin minimum stress σnom nominal stress in a member σpeak peak stress at the weld toe of a joint σr stress in radial direction σ stress in tangential direction σ0 chord stress σ1,Ed nominal stress in brace τ shear stress τ brace-to-chord wall thickness ratio: τ = ti/t0 τRd design bond stress Δ midspan deflection of a beam under a uniformly distributed load ΔTcf temperature shift in the notch impact energy - temperature diagram due to cold forming (cf) Δε strain range Δσ stress range Δσgeom geometrical stress range Δσnom nominal stress range
Subscripts a referring to structural steel in a composite column c referring to concrete in a composite column e, eff effective el elastic fi referring to fire conditions i subscript used to denote the member of a hollow section joint. Subscript i = 0 designates the
chord (or “through member”); i = 1 refers in general to the brace for T, Y and X joints, or it refers to the compression brace for K, N and KT joints; i = 2 refers to the tension brace for K, N and KT joints; i = 3 refers to the vertical brace for KT joints. For K and N overlap joints, the subscript i is used to denote the overlapping brace member; subscript used to indicate the member for which the SCF is given
ip in-plane
227

228
j subscript used to denote the overlapped brace member for K and N overlap joints; subscript used to indicate the location where the SCF is given
k subscript used to indicate the type of loading for which the SCF is given max maximum min minimum n net nom nominal op out-of-plane p plate; preload pl plastic s referring to reinforcement in a composite column t tension; torsion; time u ultimate v shear w web; weld y yield Ed design value of action Rd design value of resistance Rk characteristic value of resistance Symbols not shown here are specifically defined at the location where they are used. In all calculations, the nominal (guaranteed minimum) mechanical properties should be used.

Comité International pour le Développement et I’Etude de la Construction Tubulaire
International Committee for the Development and Study of Tubular Structures CIDECT, founded in 1962 as an international association, joins together the research resources of the principal hollow steel section manufacturers to create a major force in the research and application of hollow steel sections world-wide. The CIDECT website is http://www.cidect.com The objectives of CIDECT are: • To increase the knowledge of hollow steel sections and their potential application by initiating and
participating in appropriate research and studies. • To establish and maintain contacts and exchanges between producers of hollow steel sections and the ever
increasing number of architects and engineers using hollow steel sections throughout the world. • To promote hollow steel section usage wherever this makes good engineering practice and suitable
architecture, in general by disseminating information, organising congresses, etc. • To co-operate with organisations concerned with specifications, practical design recommendations,
regulations or standards at national and international levels. Technical activities The technical activities of CIDECT have centred on the following research aspects of hollow steel section design: • Buckling behaviour of empty and concrete filled columns • Effective buckling lengths of members in trusses • Fire resistance of concrete filled columns • Static strength of welded and bolted joints • Fatigue resistance of welded joints • Aerodynamic properties • Bending strength of hollow steel section beams • Corrosion resistance • Workshop fabrication, including section bending • Material properties The results of CIDECT research form the basis of many national and international design requirements for hollow steel sections.
229

CIDECT Publications The current situation relating to CIDECT publications reflects the ever increasing emphasis on the dissemination of research results. The list of CIDECT Design Guides, in the series "Construction with Hollow Steel Sections", already published, is given below. These Design Guides are available in English, French, German and Spanish. 1. Design guide for circular hollow section (CHS) joints under predominantly static loading (1st edition 1991 and
2nd edition 2008) 2. Structural stability of hollow sections (1992, reprinted 1996) 3. Design guide for rectangular hollow section (RHS) joints under predominantly static loading (1st edition 1992
and 2nd edition 2009) 4. Design guide for structural hollow section columns exposed to fire (1994, reprinted 1996) 5. Design guide for concrete filled hollow section columns under static and seismic loading (1995) 6. Design guide for structural hollow sections in mechanical applications (1995) 7. Design guide for fabrication, assembly and erection of hollow section structures (1998) 8. Design guide for circular and rectangular hollow section welded joints under fatigue loading (2001) 9. Design guide for structural hollow section column connections (2004) In addition, as a result of the ever-increasing interest in steel hollow sections in internationally acclaimed structures, two books have been published, i.e. "Tubular Structures in Architecture" by Prof. Mick Eekhout (1st edition 1996 and 2nd edition 2010) and "Hollow Sections in Structural Applications" by Prof. Jaap Wardenier (1st edition 2002) and this 2nd edition by Prof. Jaap Wardenier et al. (2010). Copies of the Design Guides, the architectural book and research papers may be obtained through the CIDECT website: http://www.cidect.com "Hollow Sections in Structural Applications" by Prof. Jaap Wardenier et al. (2010) is available in hard copy colour print from the publisher:
Bouwen met Staal Boerhaavelaan 40 2713 HX Zoetermeer, The Netherlands P.O. Box 190 2700 AD Zoetermeer, The Netherlands Tel. +31(0)79 353 1277 Fax +31(0)79 353 1278 E-mail [email protected]
CIDECT Organisation (2010) • President: P. Ritakallio, Finland • Treasurer/Secretary: R. Murmann, United Kingdom • A General Assembly of all members meeting once a year and appointing an Executive Committee
responsible for administration and execution of established policy. • A Technical Commission and a Promotion Committee meeting at least once a year and directly responsible
for the research work and technical promotion work. Chairman Technical Commission: G. Iglesias, Spain Chairman Promotion Committee: J. Krampen, Germany
230

Present members of CIDECT are: • Atlas Tube, Canada/USA • OneSteel Australian Tube Mills, Australia • Borusan Mannesmann Boru, Turkey • Corus Tubes, United Kingdom • Grupo Condesa, Spain • Industrias Unicon, Venezuela • Rautaruukki Oyj, Finland • Robor Steel Services, South Africa • Sidenor SA, Greece • Vallourec & Mannesmann Tubes, Germany • Voest-Alpine Krems, Austria Acknowledgements for photographs The authors express their appreciation to the following firms and persons for making available some of the photographs used in this book:
Bouwdienst, Rijkswaterstaat, The Netherlands CORUS Tubes, UK Delft University of Technology, The Netherlands HGG Profiling Equipment BV, Wieringerwerf, The Netherlands Instituto para la Construcción Tubular (ICT), Spain University of Toronto, Canada Vallourec & Mannesmann Tubes, Germany Prof. Y.S. Choo, National University of Singapore, Singapore Mr. D. Dutta, Germany Mr. Félix Escrig, Spain Mr. José Sánchez, Spain
Disclaimer Care has been taken to ensure that all data and information herein is factual and that numerical values are accurate. To the best of our knowledge, all information in this book is accurate at the time of publication. CIDECT, its members and the authors assume no responsibility for errors or misinterpretations of information contained in this book or in its use.
231

232