second quarter 2021 earnings presentation
TRANSCRIPT

SECOND QUARTER 2021EARNINGS PRESENTATION
August 16, 2021

The statements contained in this presentation that are not purely historical are forward-looking statements and involve a number of risks and uncertainties. Our forward-looking statements include, but are not limited to, statements regarding our or our management team’s expectations, hopes, beliefs, intentions or strategies regarding the future. The information included in this presentation in relation to Atlas has been provided by Atlas and its management team, and forward-looking statements include statements relating to Atlas’ management team’s expectations, hopes, beliefs, intentions or strategies regarding the future. In addition, any statements that refer to projections, forecasts or other characterizations of future events or circumstances, including any underlying assumptions, are forward-looking statements. The words “anticipate,” “believe,” “continue,” “could,” “estimate,” “expect,” “intend,” “may,” “might,” “plan,” “possible,” “potential,” “predict,” “project,” “should,” “would” and variations of such words and similar expressions may identify forward-looking statements, but the absence of these words does not mean that a statement is not forward-looking. The forward-looking statements contained in this presentation are based on our current expectations and beliefs concerning future developments and their potential effects on us. There can be no assurance that future developments affecting us will be those that we haveanticipated. These forward-looking statements involve a number of risks, uncertainties (some of which are beyond our control) or other assumptions that may cause actual results or performance to be materially different from those expressed or implied by these forward-looking statements. These risks and uncertainties include, but are not limited to: (1) the ability to maintain the listing of the Company’s shares of Class A common stock on Nasdaq; (2) the ability to recognize the anticipated benefits of the business combination or acquisitions, which may be affected by, among other things, competition, the ability of the Company to grow and manage growthprofitably, maintain relationships with customers and suppliers and retain management and key employees; (3) costs related toacquisitions; (4) changes in applicable laws or regulations; (5) the possibility that the Company may be adversely affected by other economic, business, and/or competitive factors, including as a result of COVID-19; and (6) other risks and uncertainties indicated from time to time in the Company’s filings with the U.S. Securities and Exchange Commission, including those under “Risk Factors” therein. Given these risks and uncertainties, you are cautioned not to place undue reliance on any forward-looking statements, which speak only as of the date of this presentation. Except as otherwise required by applicable law, we disclaim any duty to update any forward-looking statements, all of which are expressly qualified by the statements in this section, to reflect events or circumstances after the date of this presentation.
FORWARD LOOKING STATEMENTS
2

3
AGENDA
Business OverviewL. Joe Boyer
Chief Executive Officer
Financial Overview & OutlookDavid Quinn
Chief Financial Officer

ESSENTIAL PROVIDER OF MISSION CRITICAL SERVICES
Q2 2021 HEADLINES
Revenue and Margin Growth
Positioned to Benefit from
Strong Market Tailwinds
Outlook Supported by
Record Backlog and New Awards
4
Atlas has provided certified welding inspection, concrete and soil testing, storm water sampling, and health and safety services over the past two years.
Atlas will also perform quality inspection services for the compound.
SOUTH DAKOTA SANFORD UNDERGROUND RESEARCH COMPOUND’S LONG-BASELINE NEUTRINO FACILITY (LBNF)
Testing, Inspection & Certification
Environmental Solutions
Engineering & Design
Program, Construction, & Quality Management
A LEADING NATIONAL TECHNICAL SERVICES PLATFORMSpecialized provider of testing, inspection, environmental and engineering services to support and maintain critical infrastructure

Q2 2021 HIGHLIGHTSStrong performance, sales momentum and new acquisitions expand the platform
Gross Revenue
$131.6M
Backlog
$751M
Adj. EBITDA2
$18.2M
Adj. EPS2,3
$0.11
5
• Gross revenues up 16.7% YoY, driven by strong organic growth1 of ~6% and contributions from M&A
• Net revenue2 increased 16.0% YoY, reflecting the continued increase of self-performance and cross-selling while reducing reliance on third party providers. Experiencing some wage rate inflation, mitigating via 90% cost reimbursable contract structure
• Adj. EBITDA2 at 17.1% of net revenues, in line with expectations, up 17.9% over Q2 2020
• Adjusted net income2 of $0.11 per share3
• AEL acquisition broadens reach of infrastructure services while strengthening cross-selling capabilities in the New York Tri-State Area. OSG acquisition broadens reach into Pacific Northwest with specialty light rail and environmental expertise
• Backlog up sequentially to a record $751 million, excluding ~$150 million of new awards pending contract execution
1. Organic growth is defined as total revenue growth less revenue acquired for the comparable pre-acquisition period. 2. Adjusted EBITDA, Net Revenue, Adjusted Net Income and Adjusted EPS are not financial measures determined in accordance with GAAP. For a definition of Adjusted
EBITDA, Net Revenue, Adjusted Net Income and Adjusted EPS and a reconciliation to our most directly comparable financial measure calculated and presented in accordance with GAAP, please see the Appendix included herewith.
3. Period over period EPS comparison reflects differences in weighted average Class A share counts. At Q2 2020, Class A Share Count was 5,767,342; Current Class A Share Count 30,633,366.

6
MARKET TAILWINDS DRIVING GROWTH Atlas is well-positioned to capitalize on market tailwinds and the proposed Federal Infrastructure Bill
BUSINESS GROWTH DRIVERS
Aging InfrastructureIncreased investment dedicated to deteriorating US infrastructure
Safety & Reliability Recent building & bridge collapse tragedies drive growing demand for higher safety, and regulatory code compliance environment
High Growth StatesPopulation growth demands; states being creative in alternative funding sources for infrastructure projects rather than waiting on federal funding
OutsourcingContinued outsourcing by State DOTs and cities/municipalities for project & quality assurance services that were traditionally self-performed
Environmental, Social & Governance (ESG)Increased public awareness; investment in sustainability and societal impacts of infrastructure assets; desire for healthy buildings driven by pandemic & ESG focus
Technology & Innovation Clients’ desire to partner with firms that can deliver high-tech solutions for quality, cost, time, and resource efficiency
PROPOSED INFRASTRUCTURE BILL ACCESSIBLE IN ATLAS MARKETS
Atlas has the potential to participate in most of the ~$1.0T of proposed investments in the
Federal Infrastructure Bill
Largest components are transportation, infrastructure and other government based work, consistent with our core
services
Other top priorities include environmental, resiliency, electric vehicle infrastructure – all
areas where Atlas provides value
7
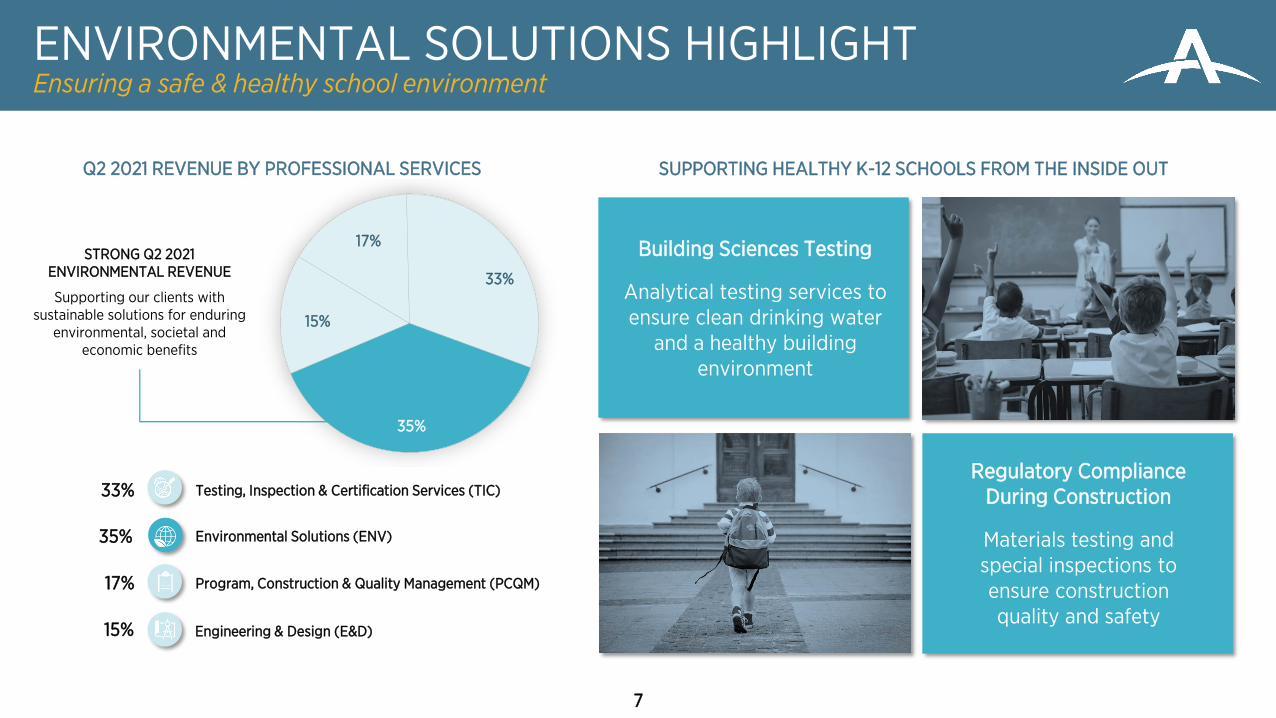
Q2 2021 REVENUE BY PROFESSIONAL SERVICES
Testing, Inspection & Certification Services (TIC)
ENVIRONMENTAL SOLUTIONS HIGHLIGHTEnsuring a safe & healthy school environment
SUPPORTING HEALTHY K-12 SCHOOLS FROM THE INSIDE OUT
Building Sciences Testing
Analytical testing services to ensure clean drinking water
and a healthy building environment
Regulatory Compliance During Construction
Materials testing and special inspections to ensure construction quality and safety
33%
35%
15%
17%
35%
33%
17%
15%
STRONG Q2 2021ENVIRONMENTAL REVENUE
Supporting our clients with sustainable solutions for enduring
environmental, societal and economic benefits
Environmental Solutions (ENV)
Engineering & Design (E&D)
Program, Construction & Quality Management (PCQM)

We believe environmental, social and governance (ESG) issues have a profound impact on our world, and there is a growing need to manage the risks and opportunities associated with it.
8
ENVIRONMENTAL, SOCIAL & GOVERNANCEOur Core Business is Inherently Connected by ESG
SAFE & HEALTHY INFRASTRUCTUREWe enhance the quality and value of vital infrastructure in our communities
SUSTAINABLE & RESILIENT SYSTEMSOur environmental and quality management work protects natural resources people depend on every day
DIVERSE, EQUITABLE, & INCLUSIVE COMMUNITIESWe lead with our hearts and apply our diverse talents for equitable and inclusive communities
KEY PILLARS
Our ESG strategy focuses on three key pillars that address the delicate balance between people and planet; the vital solutions inherent to our work; and the opportunity to make a positive systemic change:
• Appointed Chief Diversity Officer• Formed DE&I Council • Developed DE&I intranet site• Launched Unconscious Bias Training• Seven Employee Resource Groups
• Code of Conduct & Ethics• Supplier Code of Conduct• Human Rights Policy Statement• SASB Disclosures• Ethics & Compliance Committee
Quality assurance through design, certified materials testing, and program management of infrastructure projects that ensure the health and safety of our communities
Actively helping our clients achieve their ESG goals through analytical testing to resolve environmental concerns associated with air, land and water quality
1
2
3
OUR PROGRESS HIGHLIGHTS
The CEO Action for Diversity & Inclusion™ aims to rally the business community to advance diversity and inclusion within the workplace
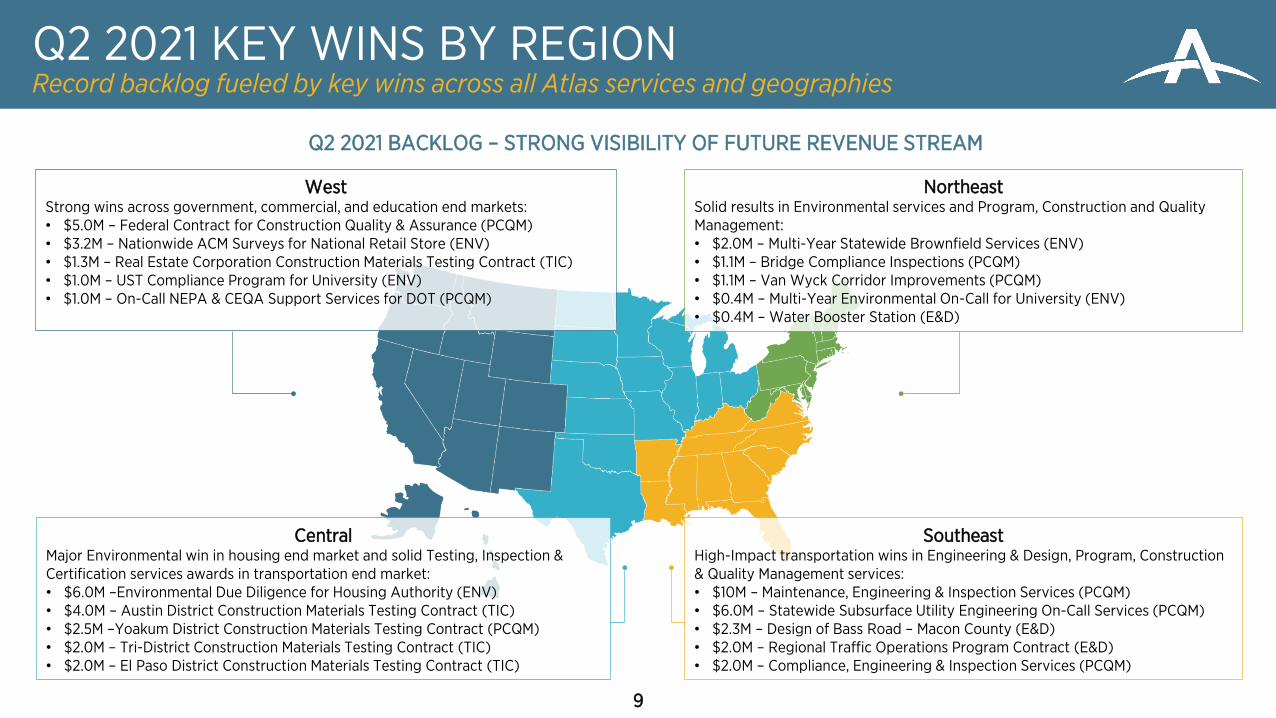
Q2 2021 KEY WINS BY REGIONRecord backlog fueled by key wins across all Atlas services and geographies
9
SoutheastHigh-Impact transportation wins in Engineering & Design, Program, Construction & Quality Management services:• $10M – Maintenance, Engineering & Inspection Services (PCQM)• $6.0M – Statewide Subsurface Utility Engineering On-Call Services (PCQM)• $2.3M – Design of Bass Road – Macon County (E&D)• $2.0M – Regional Traffic Operations Program Contract (E&D)• $2.0M – Compliance, Engineering & Inspection Services (PCQM)
NortheastSolid results in Environmental services and Program, Construction and Quality Management: • $2.0M – Multi-Year Statewide Brownfield Services (ENV)• $1.1M – Bridge Compliance Inspections (PCQM)• $1.1M – Van Wyck Corridor Improvements (PCQM)• $0.4M – Multi-Year Environmental On-Call for University (ENV)• $0.4M – Water Booster Station (E&D)
CentralMajor Environmental win in housing end market and solid Testing, Inspection & Certification services awards in transportation end market:• $6.0M –Environmental Due Diligence for Housing Authority (ENV)• $4.0M – Austin District Construction Materials Testing Contract (TIC)• $2.5M –Yoakum District Construction Materials Testing Contract (PCQM)• $2.0M – Tri-District Construction Materials Testing Contract (TIC)• $2.0M – El Paso District Construction Materials Testing Contract (TIC)
WestStrong wins across government, commercial, and education end markets:• $5.0M – Federal Contract for Construction Quality & Assurance (PCQM)• $3.2M – Nationwide ACM Surveys for National Retail Store (ENV)• $1.3M – Real Estate Corporation Construction Materials Testing Contract (TIC)• $1.0M – UST Compliance Program for University (ENV)• $1.0M – On-Call NEPA & CEQA Support Services for DOT (PCQM)
Q2 2021 BACKLOG – STRONG VISIBILITY OF FUTURE REVENUE STREAM

10
2021 ACQUISITIONSQ2 acquisitions accelerate growth while further deleveraging the business
Accretive acquisition pipeline remains strong and will continue to fund with a mix of cash and stock to reduce net leverage
Adds full-service materials testing, inspection,
geotechnical, on-site quality control and quality assurance
Expands ATCX’s footprint in NY, NJ, and CT with significant infrastructure spend expected
Adds premier construction quality assurance in
transportation, rail and environmental water services
Deepens ATCX’s opportunities for growth in transportation,
transit and environmental water projects

(Dollars in Millions)
1. Adjusted EBITDA, Net Revenue, Adjusted Net Income, and Adjusted EPS are not financial measures determined in accordance with GAAP. For a definition of these metrics and a reconciliation to our most directly comparable financial measure calculated and presented in accordance with GAAP, please see the Appendix included herewith.
2. Adjusted EBITDA margin calculated as Adjusted EBITDA / Net Revenues.3. Period over period EPS comparison reflects differences in weighted average Class A share counts. At Q2 2020, Class A Share Count was 5,767,342; Current Class A Share Count 30,633,366.
Q2 2021
Q22020
YoY Change
Gross Revenue $131.6 $112.7 16.7%
Net Revenue1 $106.3 $91.6 16.0%
Adj. EBITDA1 $18.2 $15.4 17.9%
Adj. EBITDA Margin2 17.1% 16.8% 0.3%
Adj. EPS3 $0.11 $0.07 N/A
11
Q2 2021Adj. EBITDA
SECOND QUARTER FINANCIAL HIGHLIGHTSResilient business model continues delivering strong results
12
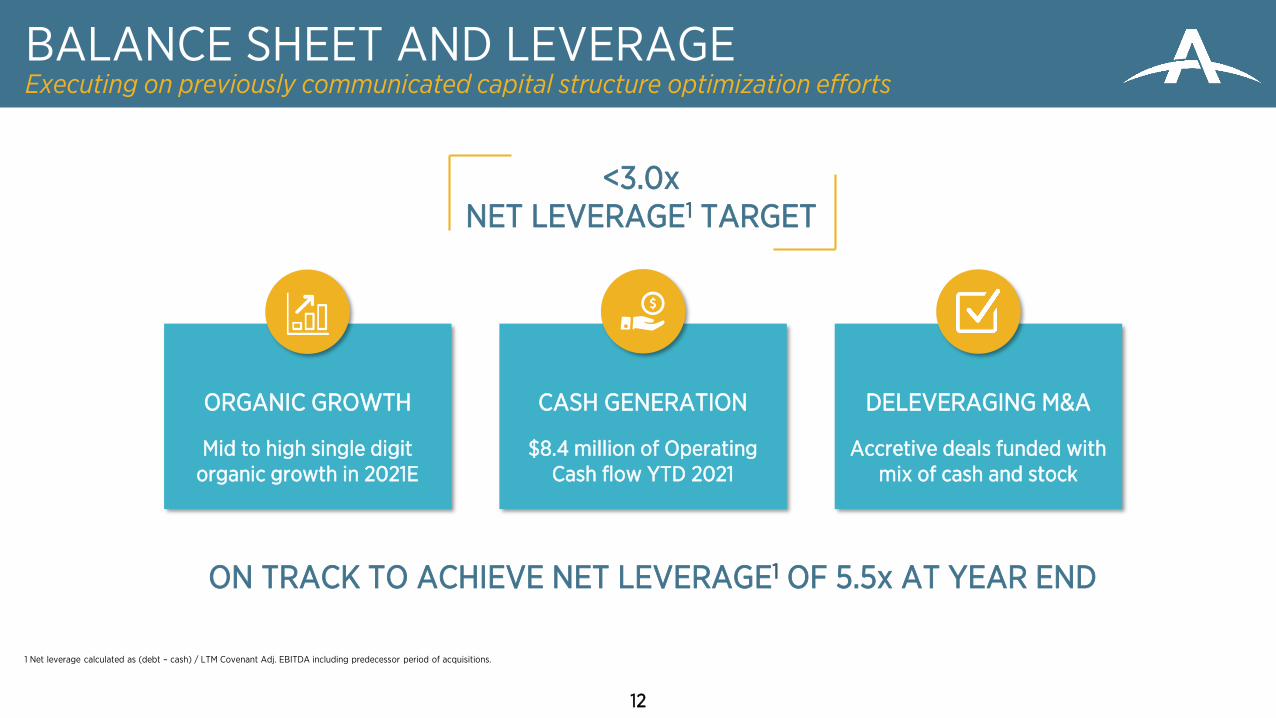
BALANCE SHEET AND LEVERAGEExecuting on previously communicated capital structure optimization efforts
1 Net leverage calculated as (debt – cash) / LTM Covenant Adj. EBITDA including predecessor period of acquisitions.
ORGANIC GROWTH
Mid to high single digit organic growth in 2021E
CASH GENERATION
$8.4 million of Operating Cash flow YTD 2021
ON TRACK TO ACHIEVE NET LEVERAGE1 OF 5.5x AT YEAR END
DELEVERAGING M&A
Accretive deals funded with mix of cash and stock
<3.0x NET LEVERAGE1 TARGET

REITERATING FULL YEAR 2021 OUTLOOKOutlook affirmed with tailwinds and momentum going into 2022
1. Adjusted EBITDA, Net Revenue, Adjusted Net Income and Adjusted EPS are not financial measures determined in accordance with GAAP. For a definition of Adjusted EBITDA, Net Revenue, Adjusted Net Income and Adjusted EPS and a reconciliation to our most directly comparable financial measure calculated and presented in accordance with GAAP, please see the Appendix included herewith.
2. Net leverage calculated as (debt – cash) / LTM Covenant Adj. EBITDA including predecessor period of acquisitions.
13
• Outlook reflects solid H1 2021 results, the addition of AEL in April, the addition of OSG in June, and current visibility on timing of work (assumes no new pandemic or resource related constraints)
• Anticipate growth of for revenue and for Adjusted EBITDA for full year 2021. Adjusted 2021 EBITDA expected to be in a range of $73 million to $80 million. Run rate Adjusted EBITDA (pro forma assuming AEL and OSG had been closed on January 1, 2021) estimated at $76 million to $83 million
• Government-based work remains positive YoY and seeing continued recovery in private sector work
• Positioned to benefit from expanding federal, state and local investments in infrastructure and environment
• Anticipate reduction in 2 at 2021 year-end
• Growing backlog to fuel underlying earnings power in 2021 and beyond
REITERATE FULL YEAR 2021 GUIDANCE
$520M - $540MGROSS REVENUE
$73M - $80MADJ. EBITDA1

Executing on accretive M&A, integration efforts, cross-selling initiatives
Strong quarter for Atlas, with solid operating results with both organic growth and contributions from recent strategic acquisitions
Strong market tailwinds driving growth in our core markets and services.
Positioned to reduce net leverage by a full turn in 2021 to 5.5x and to progress towards our goal of <3.0x net leverage
SUMMARY
14
2021 outlook reiterated for revenue and adjusted EBITDA; Backlog and new awards supports future growth; Continuing to monitor pandemic related developments closely

APPENDIX
15
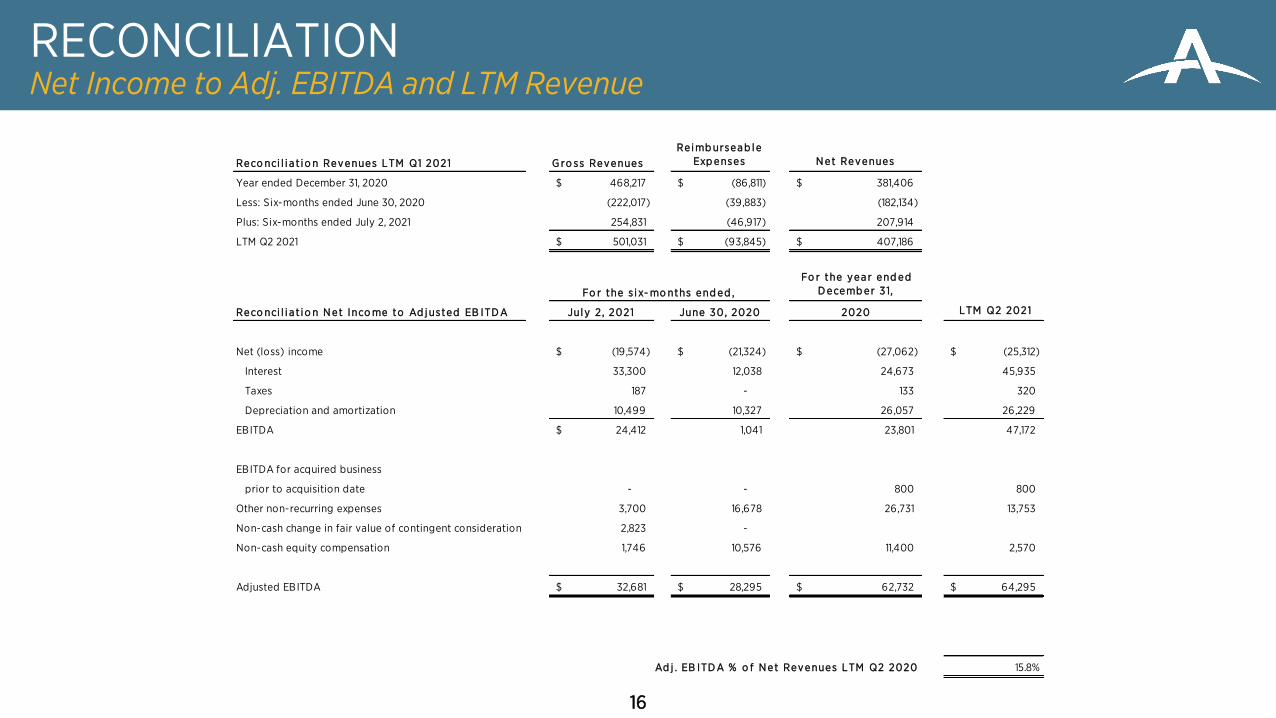
RECONCILIATIONNet Income to Adj. EBITDA and LTM Revenue
16
Reco nci l i a t i o n Revenues LTM Q1 2021 G ro ss Revenues
Re i mb ursea b l e
Exp enses N et Revenues
Year ended December 31, 2020 468,217$ (86,811)$ 381,406$
Less: Six-months ended June 30, 2020 (222,017) (39,883) (182,134)
Plus: Six-months ended July 2, 2021 254,831 (46,917) 207,914
LTM Q2 2021 501,031$ (93,845)$ 407,186$
Fo r the yea r end ed
D ecemb er 31,
Reco nci l i a t i o n N et Inco me to Ad justed EB ITD A Jul y 2 , 2021 June 30, 2020 2020 LTM Q2 2021
Net (loss) income (19,574)$ (21,324)$ (27,062)$ (25,312)$
Interest 33,300 12,038 24,673 45,935
Taxes 187 - 133 320
Depreciation and amortization 10,499 10,327 26,057 26,229
EBITDA 24,412$ 1,041 23,801 47,172
EBITDA for acquired business
prior to acquisition date - - 800 800
Other non-recurring expenses 3,700 16,678 26,731 13,753
Non-cash change in fair value of contingent consideration 2,823 -
Non-cash equity compensation 1,746 10,576 11,400 2,570
Adjusted EBITDA 32,681$ 28,295$ 62,732$ 64,295$
Ad j . EB ITD A % o f N et Revenues LTM Q2 2020 15.8%
Fo r the s i x- mo nths end ed ,

RECONCILIATIONNet Income & EPS to Adj. Net Income and Adj. EPS
17
Jul y 2 , 2021 June 30, 2020
Net loss attributable to Class A common stockholders per share (0.14)$ (0.07)$
Amortization of intangible assets 0.10 0.11
Write-off of deferred financing costs - -
Acquisition costs and other non-recurring charges 0.07 0.03
Fair value adjustment for contingent consideration 0.08
Income tax expense - -
Adjusted EPS 0.11 0.07
Weighted average of shares outstanding Class A common shares (basic and diluted): 30,634 5,767
Jul y 2 , 2021 June 30, 2020
Net loss attributable to Class A common stockholders (4,166)$ (407)$
Amortization of intangible assets 3,132 608
Write-off of deferred financing costs - -
Acquisition costs and other non-recurring charges 2,066 192
Fair value adjustment for contingent consideration 2,436
Income tax expense - -
Adjusted net income attributable to Class A common stockholders 3,468 393
Fo r the q ua rte r end ed
(Unaudited)
Fo r the q ua rte r end ed
(Unaudited)