second quarter 2010 earnings release - snl
TRANSCRIPT

Second Quarter 2010 Earnings Release
August 6, 2010

2
Forward-Looking Statements
Under the Private Securities Litigation Act of 1995This document may contain or incorporate by reference forward-looking statements as defined under the federal securities laws regarding DCP Midstream Partners, LP (the “Partnership”), including projections, estimates, forecasts, plans and objectives. Although management believes that expectations reflected in such forward-looking statements are reasonable, no assurance can be given that such expectations will prove to be correct. In addition, these statements are subject to certain risks, uncertainties and other assumptions that are difficult to predict and may be beyond our control. If one or more of these risks or uncertainties materialize, or if underlying assumptions prove incorrect, the Partnership’s actual results may vary materially from what management anticipated, estimated, projected or expected.
The key risk factors that may have a direct bearing on the Partnership’s results of operations and financial condition are highlighted in the earnings release to which this presentation relates and are described in detail in the Partnership’s periodic reports most recently filed with the Securities and Exchange Commission, including its most recent Form 10-K. Investors are encouraged to consider closely the disclosures and risk factors contained in the Partnership’s annual and quarterly reports filed from time to time with the Securities and Exchange Commission. The Partnership undertakes no obligation to publicly update or revise any forward-looking statements, whether as a result of new information, future events or otherwise. Information contained in this document is unaudited, and is subject to change.
Regulation GThis document may include certain non-GAAP financial measures as defined under SEC Regulation G, such as distributable cash flow, adjusted EBITDA and adjusted segment EBITDA. In such an event, a reconciliation of those measures to the most directly comparable GAAP measures is included in supplementary material to this presentation on our website at www.dcppartners.com.

3
Today’s Agenda
� Q2 and YTD highlights
� Operational update
� Financial overview and forecast
� Outlook and summary

4
Q2 and YTD Highlights
� Financial results in line with 2010 DCF forecast� Distributable cash flow of $24.9 million in Q2 and $56.6 million YTD
� Distribution coverage ratio of 1.14x YTD
� Delivered on 2010 objective of resuming distribution growth� Declared 1.7% increase in quarterly distribution ($0.61 per unit)
� Executing on growth opportunities which are substantially fee-based� Wholesale propane terminal acquisition expands business into Mid-Atlantic
� Acquisition of additional 55% interest in Black Lake NGL pipeline
� In conjunction with GP, signed letter of intent to create natural gas processing and related NGL infrastructure JV to serve EQT and third party producers in Marcellus and Huron shale areas
� Michigan and Wattenberg acquisition integration efforts on plan
� Continued execution on financial positioning objectives
Delivering on 2010 business plan commitments
5
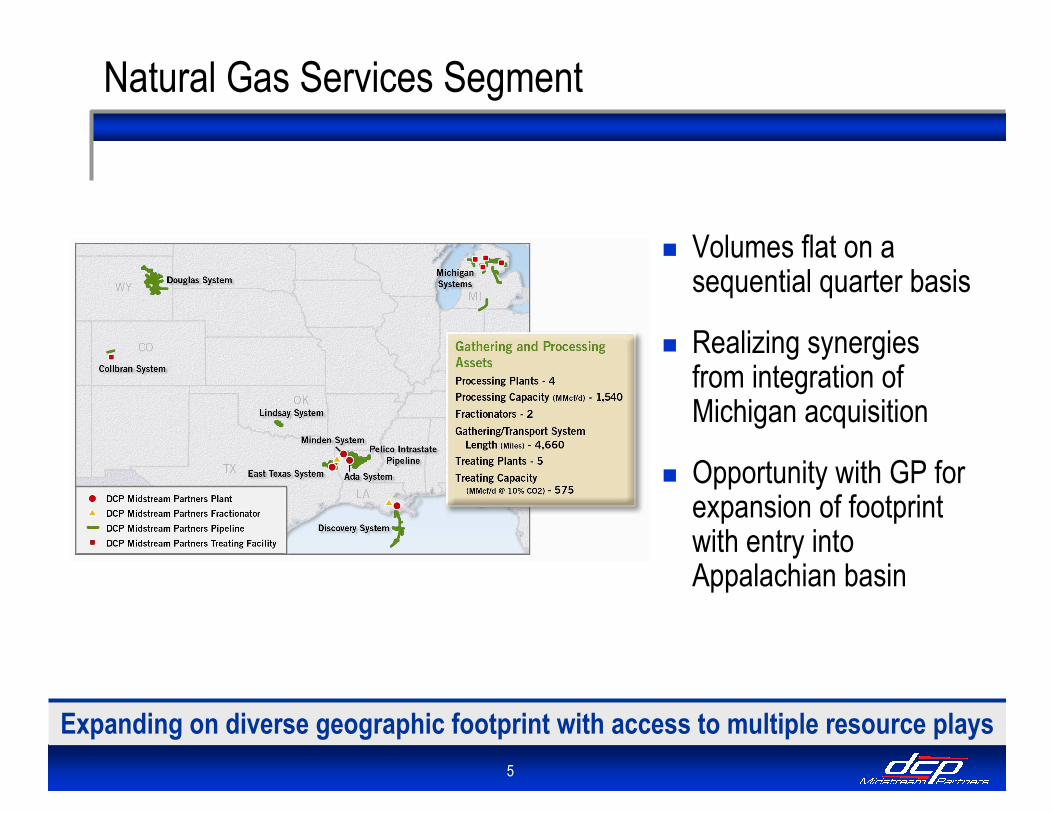
� Volumes flat on a sequential quarter basis
� Realizing synergies from integration of Michigan acquisition
� Opportunity with GP for expansion of footprint with entry into Appalachian basin
Natural Gas Services Segment
Expanding on diverse geographic footprint with access to multiple resource plays

6
NGL Joint Venture in Appalachian Basin
170 MMcf/d Langley Plant
NGL Pipeline
� Expands gas processing and NGL marketing presence into prolific Marcellus shale play
� EQT has industry leading E&P position in the Appalachian basin
� Facilitates additional investment opportunities to meet rapidly growing needs of EQT and other producers
Strategic entry point for emerging shale play
� Signed letter of intent to create natural gas processing and related NGL infrastructure JV to serve EQT and third party producers in the Marcellus and Huron shale areas of Appalachian basin

7
� Sales volumes reflect planned outage related to Providence terminal inspection and warmer weather
� Providence supply contract amendment
� Successful contracting season for winter 2010/2011
� Acquisition expands business into Mid-Atlantic region
Wholesale Propane Logistics Segment
Strengthening supply and logistics capabilities enhance competitive positioning
8
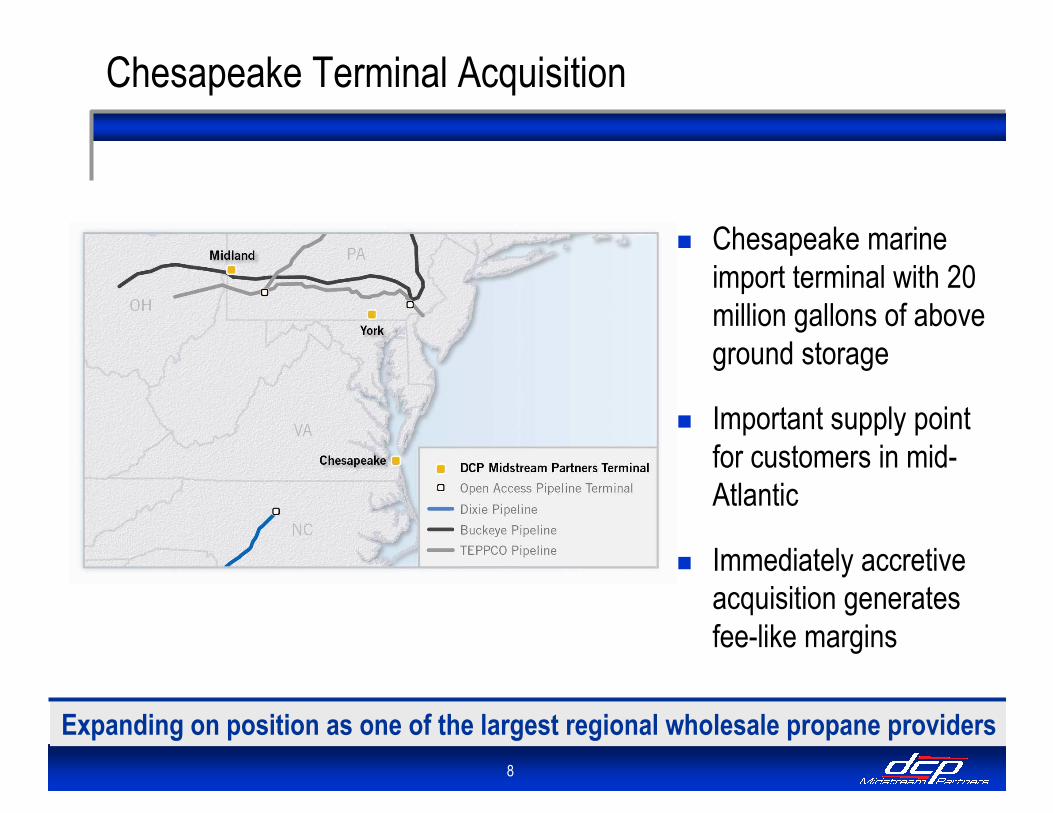
� Chesapeake marine import terminal with 20 million gallons of above ground storage
� Important supply point for customers in mid-Atlantic
� Immediately accretive acquisition generates fee-like margins
Chesapeake Terminal Acquisition
Expanding on position as one of the largest regional wholesale propane providers

9
� Wattenberg acquisition integration and expansion project on plan to be completed early 2011
� Immediately accretive acquisition of additional 55% ownership interest in Black Lake pipeline
NGL Logistics Segment
Integrated fee-based business providing expansion opportunities

10
Consolidated Financial Results
Six Months
Ended June 30,Three Months Ended June 30,
1.14x
$56.6
$66.3
2010($ in millions)
Coverage Ratio
Distributable Cash Flow
Adjusted EBITDA
1.19x1.03x0.99x
$50.6$23.2$24.9
$72.6$32.4$26.2
200920092010
On track to achieve 2010 DCF forecast

11
Natural Gas Services Segment
Results relatively flat on a sequential quarter basis
28,584
1,108
$14.5
$34.5
2009
Six Months
Ended June 30,
Three Months
Ended June 30,
$27.7$33.2$17.0Operating and maintenance expense
25,20833,36033,846NGL gross production (Bbls/d)
1,0511,1631,161Natural gas throughput (MMcf/d)
Operating Statistics:
$59.0$66.4$33.1Adjusted Segment EBITDA
200920102010($ in millions)

12
Wholesale Propane Logistics Segment
Results tempered by planned outage and warmer weather
13,912
$2.4
$3.5
2009
13,055
$2.6
$(0.5)
2010
Three Months
Ended June 30,
Six Months
Ended June 30,
20092010($ in millions)
25,50223,205Propane sales volume (Bbls/d)
$5.1$5.2Operating and maintenance expense
Operating Statistics:
$26.4$11.2Adjusted Segment EBITDA
13
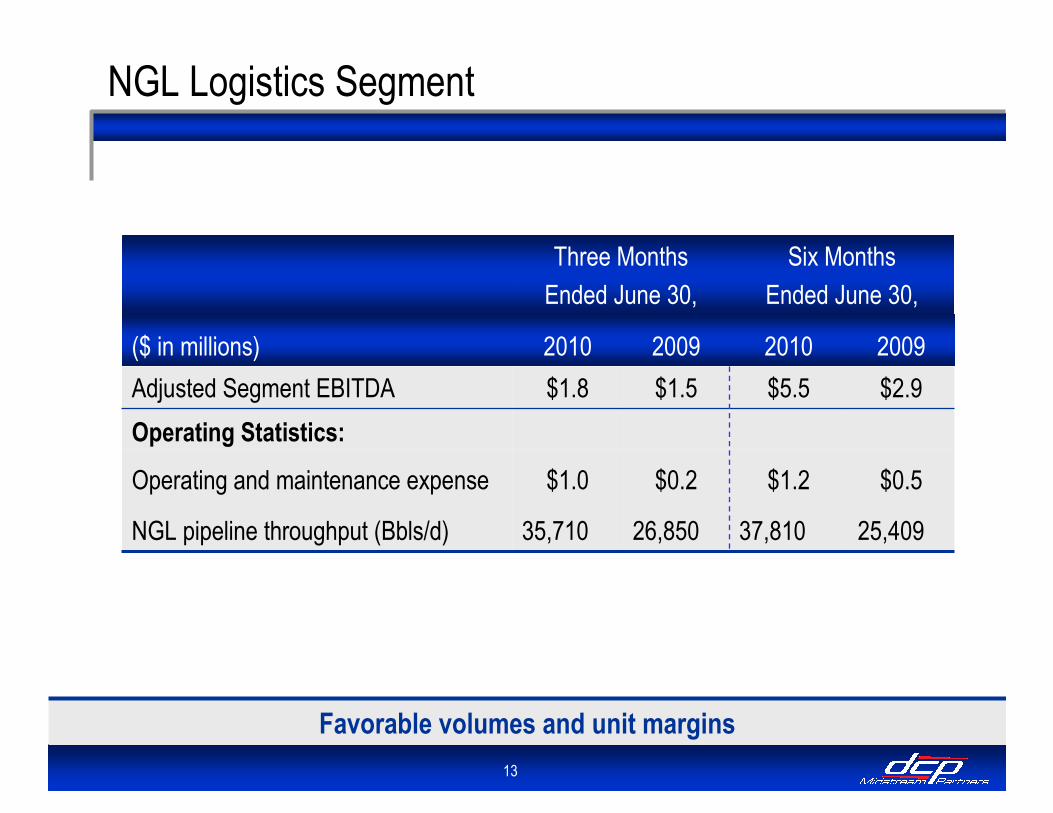
NGL Logistics Segment
Favorable volumes and unit margins
Six Months
Ended June 30,
Three Months
Ended June 30,
26,850
$0.2
$1.5
2009
37,810
$1.2
$5.5
2010 20092010($ in millions)
25,40935,710NGL pipeline throughput (Bbls/d)
$0.5$1.0Operating and maintenance expense
Operating Statistics:
$2.9$1.8Adjusted Segment EBITDA

14
2010 DCF Forecast
� Chesapeake and Black Lake acquisitions provide an additional $3 million to 2010 DCF forecast
� Additional 2011 base business contributions� Wattenberg NGL pipeline
integration and expansion completed
� Integration and synergy benefits from recent Michigan acquisition
Base business provides adequate distribution coverage in current environment
Original DCF forecast provided March 2010
$90
1.15x-1.50x1.05x-1.30x1.00x-1.15xDistribution
Coverage Ratio
NGL to Crude Relationship
$125-$150
$115-$130
70%60%50%
$80
$70
$60
Crude ($/Bbl)
($ in millions)
Reflects range of YTD and general market views of commodity prices
$100 - $110
$105 - $115
$105 - $120
$115 - $130

15
3.9x
4.3%
$235
(615)
$850
Credit Facility Leverage Ratio (max 5.0x/5.5x)
Effective Interest Rate
Credit Metrics and Covenants
Net Capacity Available
Less: Revolver Drawn
Credit Facility Commitment
Credit Facility and Liquidity (As of 6/30/10)
Disciplined financial management consistent with investment grade objective
Financial Position
� Continue to execute on investment grade plan� Received Fitch investment grade credit rating in May
� Maintain liquidity to support 2010 plan and future growth� Reinstated $25 million credit facility commitment
� Disciplined approach to long-term financing($ in millions)

16
Growth Opportunities
Strategic and disciplined growth across all segments
� Growth continues to enhance diversity of asset portfolio� Executing on opportunities across all business segments
� Extending geographic footprint
� Recent growth resulting in increased percentage of fee-based margins
Dropdowns
Offshore development
Potential divestitures by majors and E&P
Emerging shale play infrastructure development
Natural Gas Services
Dropdowns
Offshore development
Potential divestitures by majors and E&P
Emerging shale play infrastructure development
Natural Gas Services
- Third party acquisitions
- Organic projects
Footprint expansion
Wholesale Propane Logistics
- Third party acquisitions
- Organic projects
Footprint expansion
Wholesale Propane Logistics
�
�
�
Organic expansion around footprint- DJ Basin
Dropdowns
Potential divestitures by majors
NGL infrastructure development in shale plays
NGL Logistics
Organic expansion around footprint- DJ Basin
Dropdowns
Potential divestitures by majors
NGL infrastructure development in shale plays
NGL Logistics
�
�
�

17
Outlook and Summary
� On track to achieve 2010 business plan commitments and forecast
� Delivered on 2010 objective of resuming distribution growth
� Executing on growth opportunities
� Targeting long-term top quartile total shareholder return
� Sponsorship of DCP Midstream, ConocoPhillips and Spectra

18
Q&A

19
Appendix

20
Consolidated Financial Results
1.19x1.14x1.03x0.99xCoverage ratio
(30.9)(36.5)(16.3)(18.7)Depreciation and amortization expense
1.01x
$24.9
$26.2
$ 26.0
(1.0)
(0.1)
(7.3)
6.6
27.8
(249.7)
3.5
(8.2)
(20.6)
(205.7)
277.5
22.5
$ 255.0
2010
Three MonthsEnded June 30,
Six MonthsEnded June 30,
200920102009($ in millions)
1.26x
$ 50.6
$ 72.6
$ (21.0)
(0.8)
(0.1)
(14.0)
2.6
(8.7)
(445.1)
-
(15.7)
(33.3)
(365.2)
436.4
(38.9)
$ 475.3
1.15x
$56.6
$66.3
$ 51.8
(1.1)
(0.4)
(14.5)
14.5
53.3
(627.9)
3.5
(16.8)
(39.6)
(538.5)
681.2
28.5
$ 652.7
1.15x
$ 23.2
$ 32.4
$ (42.1)
(2.1)
-
(6.9)
3.7
(36.8)
(188.8)
-
(7.1)
(17.1)
(148.3)
152.0
(45.9)
$ 197.9
General and administrative expense
Total operating revenues
Gains (losses) from commodity derivative activity, net*
Operating and maintenance expense
Operating income (loss)
Adjusted EBITDA
Interest expense, net
Earnings from unconsolidated affiliates
Cash distribution coverage
Distributable cash flow
Net income (loss) attributable to partners
Net income attributable to noncontrolling interests
Total operating costs and expenses
Income tax expense
Other income
Purchases of natural gas, propane and NGLs
Sales, transportation, processing and other revenues
* Details on following page

21
Commodity Derivative Activity
Six Months
Ended June 30,
Three Months
Ended June 30,
$(45.9)
-
8.2
$(54.1)
$(54.1)
-
$(54.1)
2009
$28.5
(2.0)
-
$30.5
$30.1
(0.4)
$30.5
2010
$(53.8)$22.3Non-cash gains (losses)
(0.5)-Non-cash losses – other*
$(53.3)$22.3Non-cash gains (losses) – commodity derivative
--Cash commodity hedge settlements paid
(38.9)$22.5Gains (losses) from commodity derivative activity, net
20092010($ in millions)
14.40.2Cash commodity hedge settlements received
$(53.3)$22.3Non-cash gains (losses) – commodity derivative
* Other non-cash losses represent the amortization of the deferred net losses related to our change in accounting method from cash flow hedge accounting to mark-to-market accounting. These losses were classified to sales of natural gas, propane, NGLs and condensate during the current period.

22
Balance Sheet
¹ Long-term debt includes $0 and $10 million outstanding on the term loan portion of our credit facility as of June 30, 2010 and December 31, 2009, respectively. These amounts are fully secured by restricted investments.
$ 1,481.5
227.7
377.7
72.0
613.0
$ 191.1
$ 1,481.5
273.7
1,000.1
10.0
195.6
$ 2.1
December 31, 2009
$ 1,413.2
224.2
379.6
53.6
615.0
$ 140.8
$ 1,413.2
270.0
1,008.5
-
129.9
$ 4.8
June 30, 2010
Total liabilities and equity
Noncontrolling interest
Partners’ equity
Other long term liabilities
Long-term debt¹
Current liabilities
Total assets
Other long term assets
Property, plant and equipment, net
Restricted investments¹
Other current assets
Cash and cash equivalents
($ in millions)

23
2010 Margin
Contracts and Commodity Sensitivities
* Excluding keep whole sensitivities
** Impact to Adjusted EBITDA increases/decreases by ~$1.6MM for each $20/Bbl increase/decrease in crude oil price from $70/Bbl
Over 90% of 2010 margins are fee-based or supported by commodity hedges
+/- $5.6
+/- $1.3
+/- $0.2
Impact to Adjusted EBITDA ($MM)
+/- 5 percentage point change (assuming 60% NGL to crude relationship and $70/Bbl crude)
+/- $5.00/Bbl change in crude at 60% NGL to crude relationship
+/- $1.00/MMBtu change
Amount of Change
NGL to Crude Relationship**
Crude Oil
Natural Gas
Commodity
Estimated 2010 Annual Commodity Sensitivities*
2010 MarginPercentage of
Proceeds/Liquids 32%
Fee-Based 56%
Condensate 7%Keep Whole
5%
Fee-Based
56%
Commodity
Hedged
37%
Commodity
Unhedged
7%

24
Long-Term Cash Flow Stability
(1) As of 7/30/10
Multi-year hedge positions provide cash flow stability
2,665
2,600
2,125
2,050
1,500
500
$67.04 $68.28 $68.47$72.57
$82.61
$92.00$80.14
$83.48 $85.15 $86.05 $86.97 $88.18
0
500
1000
1500
2000
2500
3000
2010 2011 2012 2013 2014 2015
Hed
ge Volum
e (Bbls/d)
$0
$25
$50
$75
$100
$125
Crude
Oil
Hedged Crude Volume (Bbls/d)
Weighted Average Swap Price
Forward Price (1)4,539
2,900
2,900
1,800
1,000
$6.32 $6.16
$5.06
$5.83$6.32
$5.19
$4.64
$5.18 $5.16$4.95
0
1000
2000
3000
4000
5000
2010 2011 2012 2013 2014Hedge Volum
e (MMBtu/d)
$0
$2
$4
$6
$8
$10
Natural Gas
Hedged Natural Gas Volume (MMBtu/d)
Weighted Average Swap Price
Composite Forward Price (1)
� Over 55% of 2010 forecasted margin is fee-based
� For commodity-based margins, 80+% hedged on crude oil equivalent basis in 2010
Crude Oil Hedge Position Natural Gas Hedge Position