session01 doviak - introduction to the shipping industry
TRANSCRIPT

1
IFLOS SUMMER ACADEMY - HAMBURG
Session 1 – Week 3Introduction to the Shipping Industry
5 August 2019
Presented byDr John M DoviakManaging Director
Cambridge Academy of Transport
CambridgeAcademy ofTransport
2
Content
• Perspective on World Trade
• Perspective on Shipping
• Tonnage Definitions
• Limiting Factors to Trading
• Who Owns the Major Fleets of the World
• The Big Picture: Historical Growth of Merchant Fleet
• Conclusion
1

CambridgeAcademy ofTransport
3
Perspective on World Trade
Demand for Ships
CambridgeAcademy ofTransport
4
PERSPECTIVE ON WORLD TRADE(2015)
• World GDP is approximately $74,689bn – down 5.4% from 2014 ($78,832bn) †
• The first fall in GDP since 2009
• Most of this drop can be put down to the method of measurement: GDP Constant Prices , US$
• In 2015, on this basis, 128 countries showed a negative growth and only 60 were positive
• Included in the negative group are almost all oil or commodity exporting countries including:
– All Middle East exporters
– Nigeria
– Norway
– Australia
– South Africa
• In the positive group were many countries that rely on aid including most of Africa, Latin America and Caribbean
• NOTE:
– USA growth was 3.6% to $18,000bn
– China growth was 9.9% to $11,400bn
† All GDP figures from Interna onal Monetary Fund (IMF)
2

CambridgeAcademy ofTransport
5
PERSPECTIVE ON WORLD TRADE(2016)
• World GDP is approximately $75,735bn (1.4% over 2015)
• Of this, World (International) Trade is about $15,500bn (Down ~8% as value of goods fell).
• Of this, the major part is carried by ships (approx $10,000bn by value and 90-95% by volume)
– GACAG (Global Air Cargo Advisory Group) estimates air cargo value at 30% of World Trade value
• Total freight bill between $300-$400bn (~3%) but operators gained benefit of lower fuel costs
World GDP
World Trade
Seaborne Trade
$75,653bn
$16,058bn
$10,000bn (Estimate)
Shipping services this part
CambridgeAcademy ofTransport
6
PERSPECTIVE ON WORLD TRADE(2017)
• World GDP is approximately $80,144bn (5.8% over 2016)
• Of this, World (International) Trade grew by 10.9% as the value of goods recovered.
• Of this, the major part is carried by ships (approx $11,000bn by value and 90-95% by volume)
– GACAG (Global Air Cargo Advisory Group) estimates air cargo value at 30% of World Trade value
• Total freight bill between $300-$400bn (~3%) but gained benefit of lower fuel costs
World GDP
World Trade
Seaborne Trade
$80,144bn
$17,810bn
$11,000bn (Estimate)
Shipping services this part
3

CambridgeAcademy ofTransport
7
PERSPECTIVE ON WORLD TRADE(2018)
• World GDP is approximately $84,740bn (5.7% over 2017)
• Of this, World (International) Trade grew by 10.6% as the value of goods continued to recover.
• Of this, the major part is carried by ships (approx $11,000bn by value and 90-95% by volume)
– GACAG (Global Air Cargo Advisory Group) estimates air cargo value at 30% of World Trade value
• Total freight bill between $300-$400bn (~3%) but gained benefit of lower fuel costs
World GDP
World Trade
Seaborne Trade
$84,740bn
$19,690bn (Exceeded previous peak in 2014of $18,891bn for imports
$11,500bn (Estimate)
Shipping services this partFreight > $350bn
CambridgeAcademy ofTransport
Global Picture GDP 2017
8
2018 GDPUSA $20,494China $13,407Japan 4,972Germany 4,000UK 2,829
Source: World Economic Forum
4
CambridgeAcademy ofTransport
9
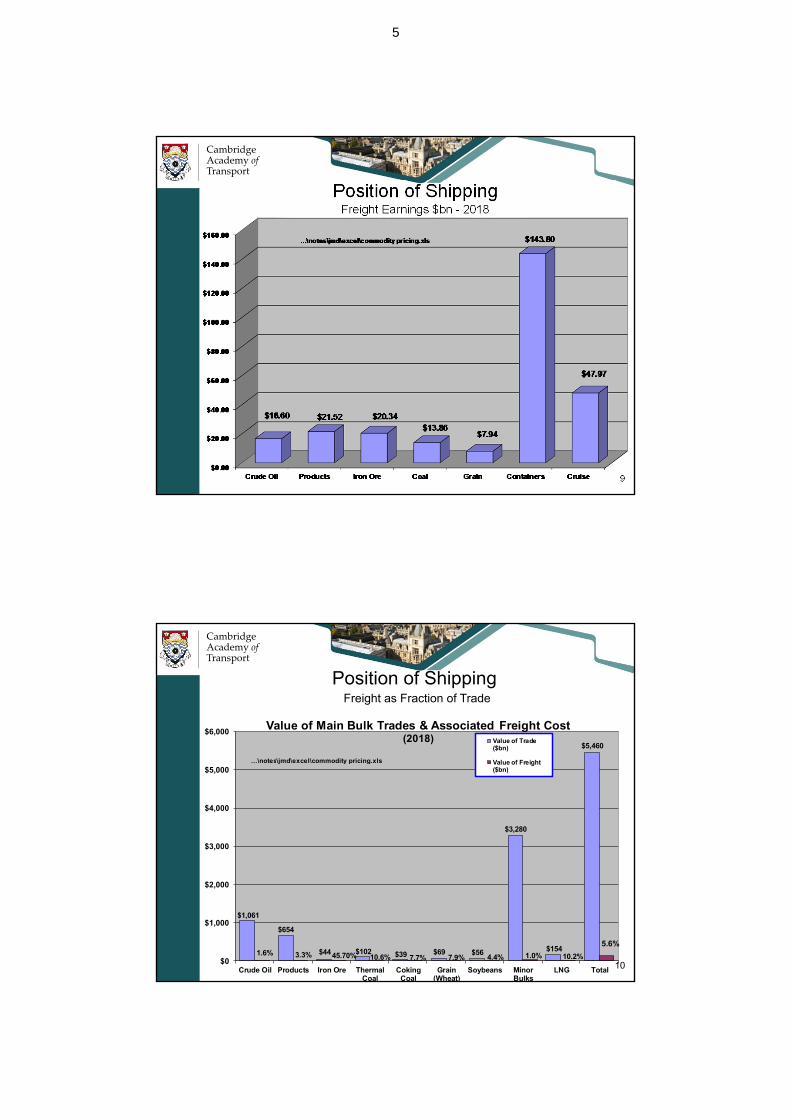
Position of ShippingFreight Earnings $bn - 2018
CambridgeAcademy ofTransport
$1,061
$654
$44 $102 $39 $69 $56
$3,280
$154
$5,460
$0
$1,000
$2,000
$3,000
$4,000
$5,000
$6,000
Crude Oil Products Iron Ore ThermalCoal
CokingCoal
Grain(Wheat)
Soybeans MinorBulks
LNG Total
Value of Main Bulk Trades & Associated Freight Cost(2018) Value of Trade
($bn)
Value of Freight($bn)
1.6% 3.3% 45.70% 10.6% 7.7% 4.4%
…\notes\jmd\excel\commodity pricing.xls
1.0% 10.2%
5.6%
7.9%10
Position of ShippingFreight as Fraction of Trade
5

CambridgeAcademy ofTransport
11Source:Clarksons
Stable Markets
Low Commodity Prices
CommodityPricesRecovering
CambridgeAcademy ofTransport
12
Dry Cargoes, 8,068
Liquid Cargoes, 3,878
(Total 11,946 million tonnes)
Dry Cargo accounts for approximately 68% of World Trade
NB: Dry cargo includes all cargoes including containerised
World Seaborne Trade 2018 (Est)
Source:Clarksons
6

CambridgeAcademy ofTransport
13
Crude Oil2,036
Products1,104
LNG325
Chemical319
LPG94
(Total 3,878 million Tonnes)
Crude Oil accounts for approximately 53% of Liquid Cargo Tradewhich has fallen as a percentage over several years
(Chemicals include organic, inorganic, molasses, veg oil, lubes & ethanol)
Liquids Seaborne Trade 2018 (Est)
Source:Clarksons
CambridgeAcademy ofTransport
14
Container1,926
Other Dry918
Dry Bulk5,224
(Total 8,068 million Tonnes)
Dry Bulk Cargo accounts for approximately 65% of the Dry Trade
Dry Cargo Seaborne Trade 2018 (Est)
Source:Clarksons
7

CambridgeAcademy ofTransport
15
Major Bulks accounts for approximately 62% of the Dry Bulk Trade
Minor Bulks1,995
Major Bulks3,229
(Total 5,224 million Tonnes)
Agribulks & SoftsMetals & MineralsManufactures
Iron OreCoalGrainSoybean
Dry Bulk Trade 2018 (Est)
Source:Clarksons
CambridgeAcademy ofTransport
16
The Steel Industry accounts for approximately 55% of the Major Bulk Trade
NB: Iron Ore and Coking Coal are basic ingredients for steel
Coking Coal267
Grain335
Soybeans148
Iron Ore1498
Steam Coal981
Major (Dry) Bulk Trade 2018 (Est)(Total 3,229 million Tonnes)
Source:Clarksons
8

CambridgeAcademy ofTransport
17
The Steel Industry accounts for approximately 32% of the Minor Bulk Trade
NB: Production of steel products makes use of scrap, coke and some petcoke
Other277 Bauxite & Alumina
145Phosphate Rock
28
Steel Products391
Scrap119
Coke21
Petcoke74
Sugar55
Agribulks175
Fertilizer145
Nichel Ore48
Anthracite33
Cement110
Forest Products374
(Total 1,995 million Tonnes)
AgribulksSoymealOilseed/mealRiceGrapeseed extractGroundnut kernelsCorn Gluten CakesGuarmealCotton seed extractLinseed extractOther extracts
Minor Bulk Trade 2018 (est)
Source:Clarksons
CambridgeAcademy ofTransport
18
% Dry Bulk Trade
Steel Industry
- Iron Ore & Coking (metallurgical) Coal
- Steel Products
- Scrap
- Pig Iron Est (13m mt) & Coke (& 25% petcoke)
34.1%
7.8%
2.1%
0.6%
Total 44.6%
Energy
Steaming coal 18.4%
Agriculture
Grain, Soybeans, Ferts, Sugar & Agribulks 17.7%
What Trades Drive Dry-Cargo Freight Rates?2018
9

CambridgeAcademy ofTransport
19
Perspective on Shipping
Definition of ShippingCharacteristics of Shipping
Ship typesStructure of the fleet
CambridgeAcademy ofTransport
20
Shipping Is…
…a Derived Demand industry
• If there were no seaborne trade, we wouldn’t need ships.
• The growth of seaborne trade increases the demand for shipping services
• Matching trade growth with ship fleet growth is a tricky business
• Trade growth cannot be accurately predicted
• BUT ships must be ordered 3-4 years ahead
• If trade grows faster than the fleet: SHIPPING BOOM
• If the fleet grows faster than trade: SHIPPING RECESSION
These mismatches in growth rates lead to fluctuations in the “freight market” – where the charges for using ships are negotiated between shipowner and cargo owner.
10

CambridgeAcademy ofTransport
21
Shipping
“Shipping is a complex industry and the conditions which govern its operations in one sector do not necessarily apply in another; it might even, for some purposes, be better regarded as a group of related industries. Its main assets, the ships themselves, vary widely in size and type; they provide the whole range of services which are needed to transport passengers and a great variety of goods, whether over shorter or longer distances. Although one can, for analytical purposes, usefully isolate sectors of the industry providing particular types of service, there is usually some interchange at the margin which cannot be ignored.”
(UK Parliament Rochdale Report 1967)
What does all this mean?
CambridgeAcademy ofTransport
22
• “... a group of related (but distinct) industries.”
Liner - Tanker
Gas - ReeferFerries - Dry-Bulk
• “...ships vary widely in size and type.”Small to very BIG: 10 tonnes to 440,000 tones
How big was the biggest?mid 50s - 50,000 dwtmid 60s - 100,000 dwtmid 70s - 555,000 dwtmid 80s - “mid 90s - “2000 - 440,000 dwt
• “...interchange at the margin.”finance classificationshipbuilding ports & terminalsskilled crew fuels & lubricantsinsurance ship management
Characteristics of Shipping
11

CambridgeAcademy ofTransport
23
Ship Types
Fishing Offshore Cable ResearchVessels
Anchor handlingDredgers Survey Tugs Icebreakers
Supply Boats Ships
Floating storage
Production
Pipe Laying
Passenger General Cargo Combination Bulk
CruiseUnit Load Ro/Ro Break Bulk Tanker Dry Bulk Timber Specialist
FerryContainer Car/PCC Tweendecker Crude Grain Wood chip Chemical
Ro/RoLash Reefer Products Coal Pulp Gases
HovercraftSeabee LPG Open Self Wine and
Hydrofoil Hatch Unloading SpiritsPallet Ethylene Log Carrier
Jetfoil O/O Iron BeerHeavy Lift LNG
Cat OBO Sugar Orange JuiceBacat CNG
Hotel/Prison Probo Cement Sulphuric AcidATB Asphalt
Auto/Reefer Lakers NuclearITB Molten
Conbulker Sulphur BIBO Sugar
FPSO Livestock(TO/TO)
FSO
Ships which carry things
Ships which keepthe sea lanes open
Rescue/Standby
CambridgeAcademy ofTransport
24
Passenger General Cargo Combination Bulk
CruiseUnit Load Ro/Ro Break Bulk Tanker Dry Bulk Timber Specialist
FerryContainer Car/PCC Tweendecker Crude Grain Wood chip Chemical
Ro/RoLash Reefer Products Coal Pulp Gases
HovercraftSeabee LPG Open Self Wine and
Hydrofoil Hatch Unloading SpiritsPallet Ethylene Log Carrier
Jetfoil O/O Iron BeerHeavy Lift LNG
Cat OBO Sugar Orange JuiceBacat CNG
Hotel/Prison Probo Cement Sulphuric AcidATB Asphalt
Auto/Reefer Lakers NuclearITB Molten
Conbulker Sulphur BIBO Sugar
FPSO Livestock(TO/TO)
FSO
Ships which carry things
CambridgeAcademy ofTransport
12
CambridgeAcademy ofTransport
25
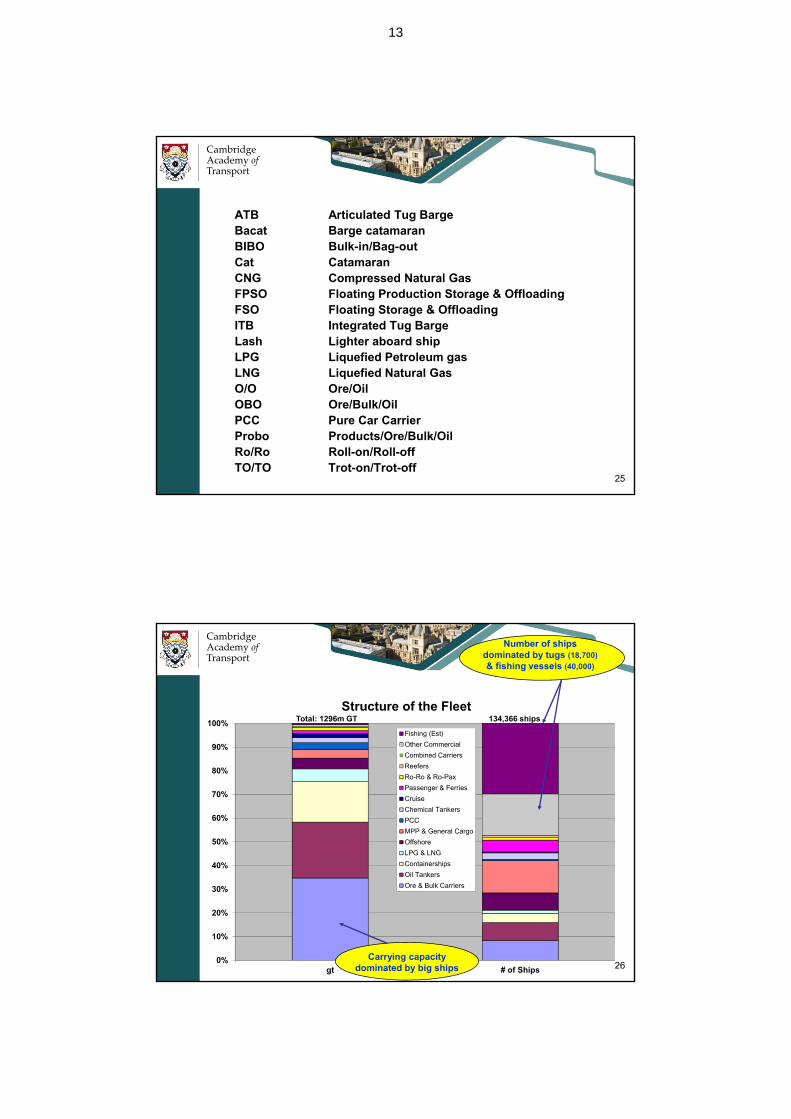
ATB Articulated Tug BargeBacat Barge catamaranBIBO Bulk-in/Bag-outCat CatamaranCNG Compressed Natural GasFPSO Floating Production Storage & OffloadingFSO Floating Storage & OffloadingITB Integrated Tug BargeLash Lighter aboard shipLPG Liquefied Petroleum gasLNG Liquefied Natural GasO/O Ore/OilOBO Ore/Bulk/OilPCC Pure Car CarrierProbo Products/Ore/Bulk/OilRo/Ro Roll-on/Roll-offTO/TO Trot-on/Trot-off
CambridgeAcademy ofTransport
0%
10%
20%
30%
40%
50%
60%
70%
80%
90%
100%
gt # of Ships
Structure of the Fleet
Fishing (Est)
Other Commercial
Combined Carriers
Reefers
Ro-Ro & Ro-Pax
Passenger & Ferries
Cruise
Chemical Tankers
PCC
MPP & General Cargo
Offshore
LPG & LNG
Containerships
Oil Tankers
Ore & Bulk Carriers
Carrying capacitydominated by big ships
Number of shipsdominated by tugs (18,700)
& fishing vessels (40,000)
26
Total: 1296m GT 134,366 ships
13

CambridgeAcademy ofTransport
27
Physical Characteristics of Ships
Tonnage Explained
CambridgeAcademy ofTransport
28
• Displacement - The actual weight of the ship at any given time (corresponds to the weight of the water which the vessel displaces).
NB: Varies depending on how much weight the vessel is carrying
• Light Weight - the weight of the empty ship (no cargo, crew, stores, fuel, water and ballast).
NB: Displacement = Light Weight when the ship is completely empty
• Deadweight - Total weight of cargo, crew, stores, fuel, water and ballast.Displacement – Deadweight = Light weight
The above weights are today conventionally measured in metric tonnes (=1000kg)
Tonnage Definitions
14

CambridgeAcademy ofTransport
29
• Gross Ton – A volume measure of the internal capacity of a vessel. Until early 1990s, 1 grt (gross registered ton) was defined as 100 cubic feet. The International Tonnage Convention 1969 which came into force in the 1990s redefined the Gross Ton as 1 gt ≈ 3 cubic metres.
NB: Although called a “ton” it is actually a volume
• Net Ton – defined in the same way as the Gross Ton but some of the internal carrying capacity of the vessel is excluded. The object is to arrive at a volume of space which can be used to carry passengers or goods: the revenue earning space. Therefore such spaces as crew quarters, engine room, ballast tanks and the like are excluded.
NB: Taxes and port dues are usually levied on the Net Tonnage
Tonnage definitions - continued
CambridgeAcademy ofTransport
30
Ship size measurement
Tankers Bulk Carriers LinersLiners
(containers) Gas Cruise
Unit dwt(deadweight)
dwt gt(gross ton)
TEU(twenty foot
equivalent unit
cubic metres Lower Berths
Measure metric tonnecapacity
metric tonnecapacity
volume measure
1 gt~100 cu ft
volume measure
1 TEU=8'x8'x20'
volumemeasure
passengers
All vessels have a maximum weight that they can carry as determined by the weight which causes the vessel to sink to its "load line".
Different groups of vessels use different units for their size measurement
15

CambridgeAcademy ofTransport
31
Limiting Factors
How much can vessels carryWhere can vessels trade
CambridgeAcademy ofTransport
32
How much may a Vessel Carry
Loadline Marks (Plimsoll Line)Deck Edge
L R
TF
FT
S
W
WNA
(Tropical Fresh)
(Fresh)(Tropical)
(Summer)
(Winter)
(Winter North Atlantic)
FWA (Fresh WaterAllowance)
Freeboard
Rules:
1. FWA = D/(40T) where D is Displacement weight at Summer Draft and T is TPC
2. Gap between (T - S), (S - W) and (TF - F) = Draft/48
3. WNA applies only to vessels of 100m length or less.
16
CambridgeAcademy ofTransport
3333
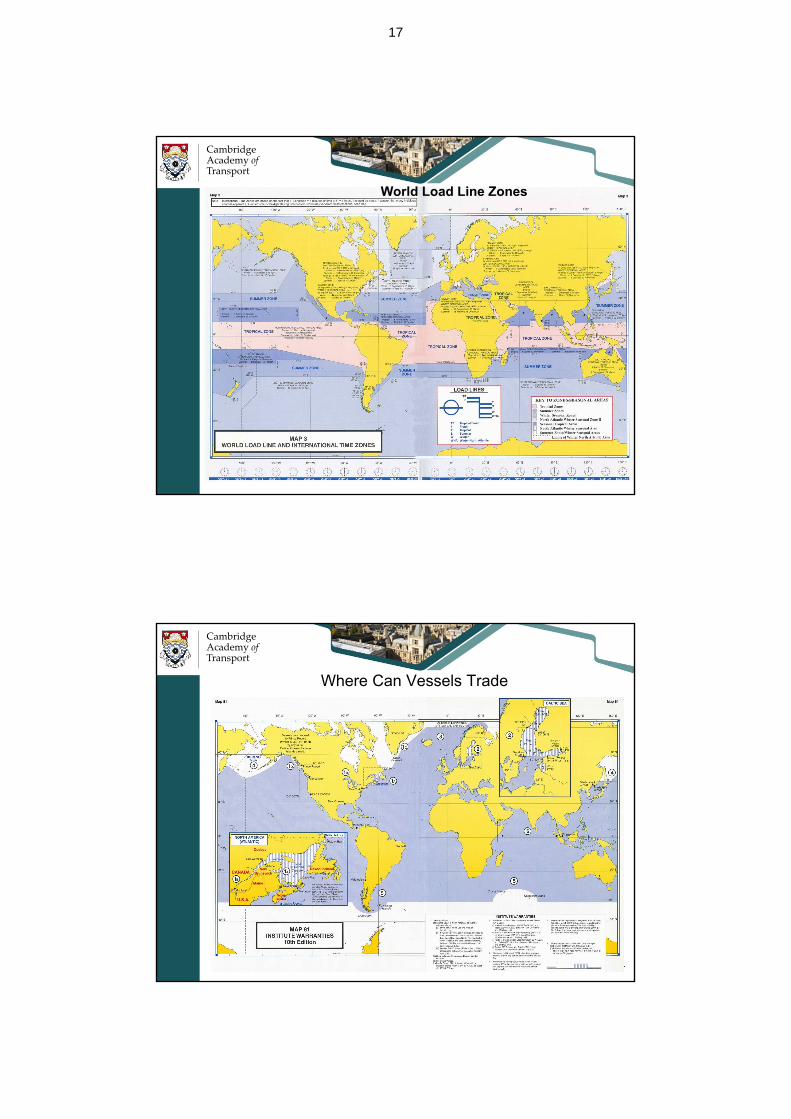
World Load Line Zones
CambridgeAcademy ofTransport
3434
Where Can Vessels Trade
17

CambridgeAcademy ofTransport
35
• IWL – Institute Warranties LimitsA separate clause dating from 1/7/76 which was added to hull insurance contracts. It restricted where the vessel could trade. No Arctic, Antarctic, Baltic in winter etc.(Institute = Institute of London Underwriters)
• INL – International Navigation LimitsThe modern form of wording used to restrict the operation of ships geographically. It is expressly included in the new International Hull Clauses dating from 2003. Largely the same as IWL with an clarification of the restricted areas
IWL versus INL
CambridgeAcademy ofTransport
3636
Stowage factor Principles
WaterLine
If holds are completely filled with cargo of stowage factor 40, vessel will sink down to “her marks” - in other words the Plimsoll Mark line will align with the surface of the water when in salt water. Example Calcium Nitrate: 32-40 cu ft/tonne
With a cargo of higher stowage factor (ie a cargo that is less dense), the vessel will not sink as deeply as her Plimsoll Mark even with the hold completely full. Example Soyabean meal in bulk: 58-60 cu ft/tonne
With a more dense cargo (lower stowage factor), the vessel will have sunk to her Plimsoll Mark before the hold is completely full. Example iron ore concentrate: 11-20 cu ft/tonne
Relationship between Stowage Factor (Cubic Feet per Ton) and Hold occupancy.
PlimsollMark
Vessel design for cargo of stowage factor 40.
With a cargo of stowage factor 60.
With a cargo of stowage factor 20.
18

CambridgeAcademy ofTransport
0%
10%
20%
30%
40%
50%
60%
70%
80%
90%
100%
gt # of Ships
Structure of the Fleet
Fishing (Est)
Other Commercial
Combined Carriers
Reefers
Ro-Ro & Ro-Pax
Passenger & Ferries
Cruise
Chemical Tankers
PCC
MPP & General Cargo
Offshore
LPG & LNG
Containerships
Oil Tankers
Ore & Bulk Carriers
Let’s take a closer look atthe three biggest sectors:Bulker, Tanker & Container
Recall…
37
CambridgeAcademy ofTransport
38Source: Clarksons March 2017
0
200
400
600
800
1,000
1,200
1,400
1,600
1,800
Fleet Development (million dwt)at 1st January
Other
Containerships
General Cargo
Combination
Bulkers
Tankers
= Tramp, Liner, Multi-purpose & Ro/Roships
= LPG, LNG, PCC, Reefer, Offshore (AHTS & PSV), & Other Cargo
19
CambridgeAcademy ofTransport
39
Vessel Terminology
Dry-BulkTanker
Container
CambridgeAcademy ofTransport
40
Dry-bulk Shipping
20

CambridgeAcademy ofTransport
4141
Bulk-Cargo Vessel Terminology
Source: Clarksons December 2018
Note: Kamsarmax vessels are those of length 229m, but of “old” Panamax beamExcludes Lakes Only vessels (78 no.) & Combination Carriers (47 no.)Specials include Aggregate, Deck Cargo Only, Heavy Lift, Landing Craft, Livestock and Pallet
Generic Name Typical SizeNo.
OwnersNo.
Ships Dwt
General Cargo General Cargo / Tweendecker <43,000 dwt 6,066 11,984 29.1m
Specials <47,000 dwt 970 1,763 2.3m
Multi-Purpose (MPP) 1,000-55,000 dwt 968 3,174 29.2m
Small Bulkers Small Bulkers <10,000 dwt 729 1,190 3.0m
Dry Bulk Handysize 10 – 39,999 dwt 1,120 3,378 96.6m
Handymax 40 – 49,999 dwt 310 703 32.4mSupramax 50 – 59,999 dwt 604 2,076 115.3mUltramax (Note overlap with Panam 60 – 69,999 dwt 236 801 50.1mPanamax 65 – 79,999 dwt 422 1,173 91.8mKamsarmax 80 – 82,999 dwt 277 848 69.3mPost-Panamax 83 – 99,999 dwt 159 499 45.3mCapesize 100 – 404,000 dwt 256 1,703 326.6m…of which VLBC (or VLOC) >200,000 dwt 84 488 119.8m
TOTAL (>10,000 dwt) 1,938 11,182 823.8m
Bulk Cargo Vessel Terminology
CambridgeAcademy ofTransport
4242Source: Clarksons October 2018
0.00
100.00
200.00
300.00
400.00
500.00
600.00
700.00
800.00
900.00
mil
lio
n d
wt
Bulk Carrier Fleet Development(@ year end except 2018 which is at 1/10/2018)
Capesize
Panamax
Handymax
Handysize
21

CambridgeAcademy ofTransport
Source: Clarkson, October 201843
Pacific Basin Shpg2,646,224
Fednav1,623,649
Wisdom Marine Group1,508,910
Polish Steamship Co1,393,658
John Swire & Sons1,179,463
China COSCO Shipping1,145,283
Shih Wei Navigation1,013,186
Canadian Forest Nav.984,420
Interlink Ltd961,223
Hartmann AG838,650
Top 10 Owners ‐ Handysize(13.8% of Handysize Fleet)
Total Handy Fleet:1120 Owners3378 Vessels / 30.2% Fleet96.6 dwt / 11.7% FleetAverage Age: 12.1Average Size: 28,592 dwt
CambridgeAcademy ofTransport
Handysize Bulk Carrier
44m.v. Mount Owen 28,333 dwt - owned by Pacific Basin
22

CambridgeAcademy ofTransport
Source: Clarkson, October 201845
China COSCO Shipping16,270,716
Berge Bulk9,930,665
Angelicoussis Group9,168,375
Fredriksen Group8,692,082
Nippon Yusen Kaisha8,567,905
K-Line8,237,992
Polaris Shipping Co7,855,751
Mitsui O.S.K. Lines7,575,356
Pan Ocean6,387,748
NS United KK6,294,688
Top 10 Owners ‐ Capesize(26.9% of Capesize Fleet)
Total Capesize Fleet:256 Owners1703 Vessels / 15.2% Fleet326.6 dwt / 39.6% FleetAverage Age: 9.2Average Size: 191,771 dwt
CambridgeAcademy ofTransport
Largest Dry-Bulk Carrier
46mv Sea Beijing 403,818 dwt 7 Holds - owned by Pan Ocean Shipping
Note: One hold equivalent to Panamax size ship!
23
CambridgeAcademy ofTransport
47
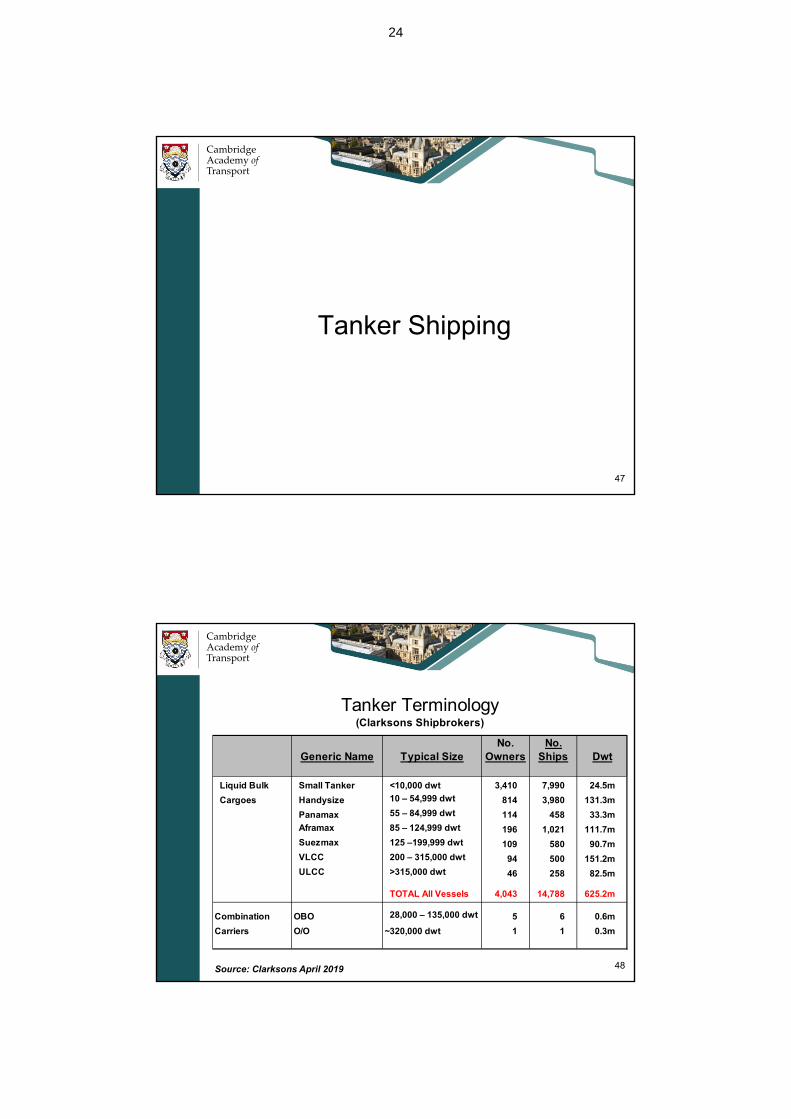
Tanker Shipping
CambridgeAcademy ofTransport
48
Tanker Terminology(Clarkson Shipbrokers)
Source: Clarksons April 2019
Generic Name Typical SizeNo.
OwnersNo.
Ships Dwt
Liquid Bulk Small Tanker <10,000 dwt 3,410 7,990 24.5m
Cargoes Handysize 10 – 54,999 dwt 814 3,980 131.3m
Panamax 55 – 84,999 dwt 114 458 33.3m
Aframax 85 – 124,999 dwt 196 1,021 111.7m
Suezmax 125 –199,999 dwt 109 580 90.7m
VLCC 200 – 315,000 dwt 94 500 151.2m
ULCC >315,000 dwt 46 258 82.5m
TOTAL All Vessels 4,043 14,788 625.2m
Combination OBO 28,000 – 135,000 dwt 5 6 0.6m
Carriers O/O ~320,000 dwt 1 1 0.3m
Tanker Terminology(Clarksons Shipbrokers)
24
CambridgeAcademy ofTransport
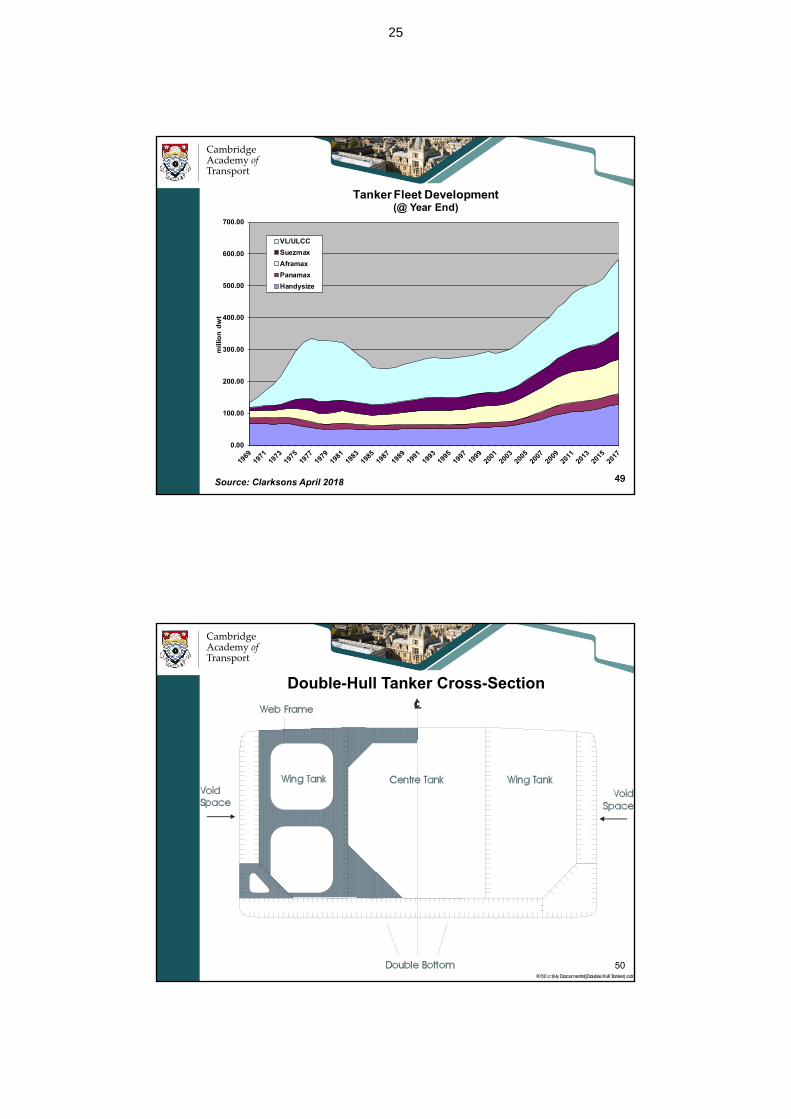
4949Source: Clarksons April 2018
0.00
100.00
200.00
300.00
400.00
500.00
600.00
700.00m
illio
n d
wt
Tanker Fleet Development(@ Year End)
VL/ULCC
Suezmax
Aframax
Panamax
Handysize
CambridgeAcademy ofTransport
50
Double-Hull Tanker Cross-Section
25

CambridgeAcademy ofTransport
51Source: October 2018
51
China Merchants14,488,548
Euronav NV14,029,096
Bahri13,995,145
China COSCO Shipping
12,799,690
Nat Iranian Tanker11,763,127
Angelicoussis Group11,048,841
Mitsui O.S.K. Lines8,600,303
DHT Holdings8,054,148
SK Holdings5,644,945
Nippon Yusen Kaisha5,165,428
Top 10 Owners (dwt) ‐ UL/VLCC(47.0% of UL/VLCC Fleet)
Total UL/VLCC Fleet:107 Owners729 Vessels / 5.0% Fleet224.65m dwt / 36.8% FleetAverage Age: 9.4Average Size: 308,160dwt
CambridgeAcademy ofTransport
Largest Tanker Afloat
52Euronav TI Europe 441,561 dwt, 380.0m length
26

CambridgeAcademy ofTransport
53Source: October 2018
53
Scorpio Group3,214,408
TORM A/S2,781,856
Mitsui O.S.K. Lines2,576,549
Stolt-Nielsen2,252,145
A.P. Moller Holding2,140,149
Sinokor Merchant2,032,030
China Merchants2,008,290
Diamond S Shipping1,657,324
China COSCO Shipping1,596,302
SCF Group1,573,711
Top 10 Owners (dwt) ‐ Handysize(16.6% of Handysize Fleet)
Total Handy Fleet:814 Owners3,980 Vessels / 26.9% Fleet131.33m dwt / 21.0% FleetAverage Age: 11.1Average Size: 32,997dwt
CambridgeAcademy ofTransport
Chemical Carrier
54Fairfield “Fairchem Friesian” 21,209 dwt, LOA 146m
27

CambridgeAcademy ofTransport
55
Container Shipping
CambridgeAcademy ofTransport
56
Key Features of Container Shipping – 1
A Liner Business
• It is “Liner” shipping, not “Tramp” shipping
– Liner Shipping are ships plying a fixed route or routes, sailing according to pre-determined schedules which offer cargo and/or passengers space at fixed rates to those who wish to have goods transported or make journeys
– Tramps are vessels that trade anywhere in the world without a fixed itinerary and which offer their services to the highest bidder
– Not all vessels and trades fall into these two neat categories: for example, industrial shipping such as the regular supply of iron ore to a steel mill, which service may be agreed many years ahead.
28

CambridgeAcademy ofTransport
57
• For many years, the container business was under the dominant influence of the “Conference System”
– A “Conference” is a group of two or more vessel operating carriers which provides international liner services for the carriage of cargo on a particular route or routes within specified geographical limits and which has an agreement or arrangements, whatever it’s nature, within the framework of which they operate under uniform or common freight rates and any other agreed conditions with respect to the provision of liner services.
Key Features of Container Shipping – 2
The Conference System
CambridgeAcademy ofTransport
58
Key Features of Container Shipping – 3
Consortia
• Today, Container Shipping companies group together in what are known as “Consortia”
– ‘Consortium’ means an agreement between two or more vessel-operating carriers which provide international liner shipping services exclusively for the carriage of cargo, chiefly by container, relating to a particular trade
– the object of a consortium is to bring about co-operation in the joint operation of maritime transport services, which improves the service which would otherwise be offered individually by each of its members in the absence of the consortium
– Members of the consortium rationalize their services by means of technical, operational and/or commercial arrangements, with the exception of price fixing.
29

CambridgeAcademy ofTransport
Container Terminology(Clarkson Shipbrokers)
59Source: Clarksons August 2018
No. No.
Owners Ships
Feeder <3000 TEU 567 2,907 3,930,160 53.42 Large Feeder 3,000 –5,999 TEU 133 1,089 4,972,506 62.75 Intermediate 6,000 – 7,999 TEU 44 270 1,865,063 23.09 Neo Panamax 8,000 – 11,999 TEU 54 607 5,339,472 64.16 Large Neo Panamax 12,000 – 14,999 TEU 22 223 2,931,890 32.00 Post Panamax >15,000 TEU 13 104 1,629,407 16.90
TOTAL 631 5,200 21,193,470 256.83
TEU dwtGeneric Name Typical Size
CambridgeAcademy ofTransport
60Source: Clarksons as at April 2018
0
5,000
10,000
15,000
20,000
25,000
'000
TE
U
Containership Fleet Development('000 TEU as at 1 January)
Post-Panamax (>15,000TEU)
Large Neo-Panamax (12-15,000TEU)
Small Neo-Panamax (8-12,000TEU)
Large Intermediate (6-8,000TEU)
Small Intermediate (3-6,000TEU)
Large Feeder (2-3,000TEU)
Intermediate Feeder (1-2,000TEU)
Feeder (<1000TEU)
…\my documents\notes\clarkson data\container fleet.xls
30

CambridgeAcademy ofTransport
61Source: Clarksons April 2018
A.P. Moller2,327,892
MSC1,258,197
China COSCO Shipping1,151,234CMA CGM
1,082,654
Hapag-Lloyd1,031,575
Seaspan Corporation869,500
Evergreen Marine558,991
Orient Overseas Intl543,547
Reederei C-P Offen499,860
Costamare Shipping459,547
Top 10 Owners ‐ Containerships(46.2% of Total Fleet)
CambridgeAcademy ofTransport
Largest Container Ship…for now!
62“MSC Gülsün” Launched July 2019 224,983 dwt LOA400m
31
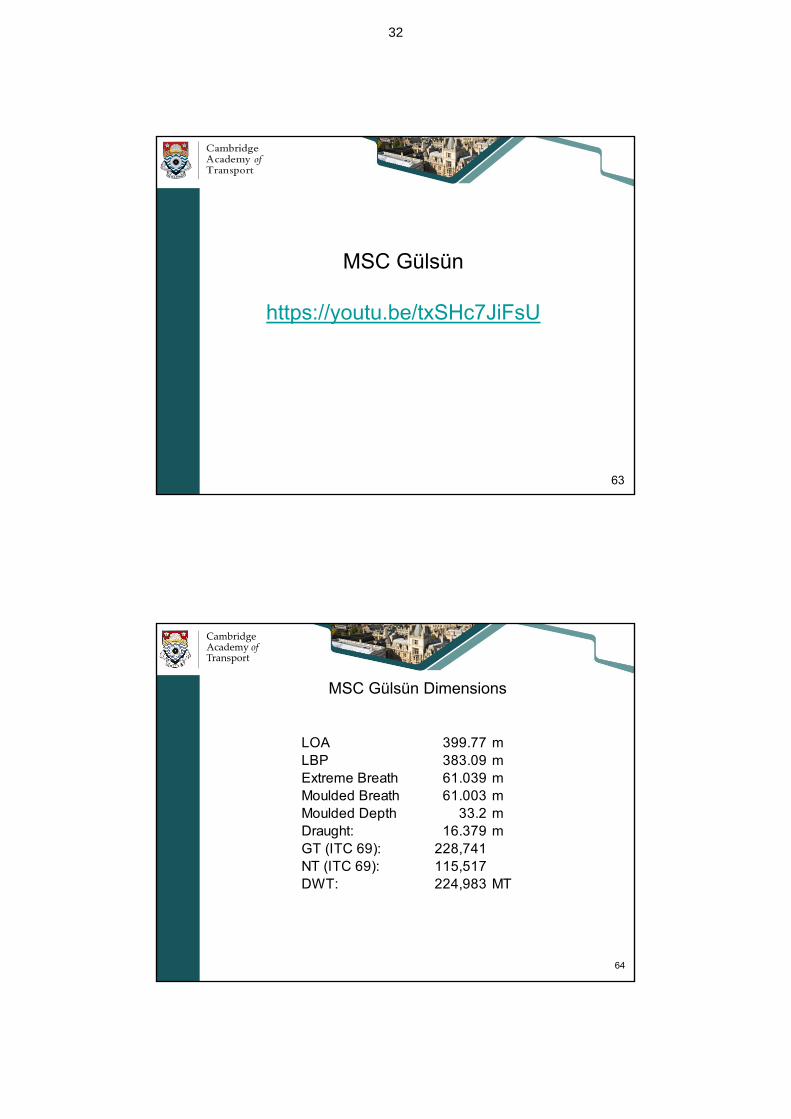
MSC Gülsün
https://youtu.be/txSHc7JiFsU
63
CambridgeAcademy ofTransport
MSC Gülsün Dimensions
64
LOA 399.77 mLBP 383.09 mExtreme Breath 61.039 mMoulded Breath 61.003 mMoulded Depth 33.2 mDraught: 16.379 mGT (ITC 69): 228,741NT (ITC 69): 115,517DWT: 224,983 MT
32

CambridgeAcademy ofTransport
65
Top 20 Operator-Owner Container Fleets – 2017No. Ships TEUs
Maersk 259 1,730,630MSC 201 1,248,061Hapag-Lloyd 122 1,058,186China COSCO Shipping 152 1,053,506CMA-CGM 133 1,027,721Evergreen 105 543,705OOCL 56 436,482NYK 52 338,694Hamburg-Sud 46 308,334PIL 117 299,024Mitsui OSK 32 252,419Yang Ming 47 224,319K-Line 30 222,540HMM 25 186,193Wan Hai 73 172,871Zim 18 110,839China Merchants Grp 29 105,264SM Line 18 102,452Sinokor 36 101,986Arkas 50 93,263
Source: Clarksons SIN September 2017
• 52.5% of Top 20 Operator-Owner TEUs in the control of European Companies
• 41.5% of TEUs in the control of Asia/Far East Companies
• Top 20 control 46.1% of the World Fleet
• Until 2012, European Operators owned more capacity than Asian Operators
• By 2013, Asian Operator-Owners controlled more than 50%.
• As of mid-2015, European Owner-Operators have reversed the trend
CambridgeAcademy ofTransport
66
Top 20 Operator-Owner Container Fleets - 2018
Source: Clarksons SIN September 2018
• 55.5% of Top 20 Operator-Owner TEUs in the control of European Companies
• 44.5% of TEUs in the control of Asia/Far East Companies
• Top 20 control 51.9% of the World Fleet
• Until 2012, European Operators owned more capacity than Asian Operators
• By 2013, Asian Operator-Owners controlled more than 50%.
• European Owner-Operators have reversed the trend since mid-2015 but gap closed in 2018.
No. teuMaersk 328 2,394,312China COSCO Shipping 231 1,871,922MSC 209 1,278,354CMA CGM 145 1,119,254Hapag-Lloyd 112 1,031,575ONE* 121 938,357Evergreen 115 575,078PIL 124 392,571Yang Ming 47 224,319HMM 25 196,791Wan Hai 77 180,879China Merchants 31 129,544Zim 18 110,839Sinokor 50 107,931Arkas 50 93,263IRISL 24 85,872Quanzhou Ansheng 28 78,068KMTC 36 68,315SITC 49 67,369Zhonggu Shipping 20 62,639
33

CambridgeAcademy ofTransport
Top 20 Charterer-Owner Container Fleets
67Source: Clarksons SIN September 2018
• 41.3% of Top 20 Charterer-Owners TEUs are in control of 8 KG Funds based in Germany (down from 62.1% & 11 in 2016 and 53.8% and 9 in 2017)
• These 8 companies fleets are about 13.4% of the World total, down ~1% from previous year
• The Top 20 Charterer-Owners control about 27.3% of the World Fleet, upa bit
• KG Companies and Charterer-Owners share of the World total have been declining in recent years.
No. teu KGSeaspan 112 909,900 3
C-P Offen 63 487,532 3
Costamare 73 477,544Peter Dohle 98 408,145 3
Danaos Shipping 58 347,180Zodiac Maritime 42 338,751Shoei Kisen Kaisha 45 327,345BoCom Leasing 28 317,882Rickmers 36 230,849 3
E.R. Schiffahrt 37 221,835 3
Norddeutsche 44 221,061 3
Fredriksen Group 25 202,046Schulte Group 45 190,802 3
Eastern Pacific Shipping 26 185,851Navios Maritime 42 183,823MPC Group 80 176,096 3
Technomar 35 164,261Minsheng Bank 10 142,920SinOceanic Shipping 13 133,665Lomar Kaiun 18 123,361
CambridgeAcademy ofTransport
Container Operators Deployed Fleets (1/9/2018)
68
No. teu No. teu No. teuMaersk 328 2,394,312 389 1,585,753 717 3,980,065 7 77,034MSC 209 1,278,354 278 1,907,118 487 3,185,472 11 242,000China COSCO Shippin 231 1,871,922 206 895,883 437 2,767,805 17 261,020CMA CGM 145 1,119,254 343 1,514,238 488 2,633,492 17 238,400Hapag-Lloyd 112 1,031,575 111 535,558 223 1,567,133ONE* 121 938,357 110 614,575 231 1,552,932 13 181,870Evergreen 115 575,078 86 580,800 201 1,155,878 16 111,280Yang Ming 47 224,319 60 423,034 107 647,353 10 28,000PIL 124 392,571 8 42,776 132 435,347 5 47,800HMM 25 196,791 47 223,731 72 420,522Zim 18 110,839 64 284,272 82 395,111Wan Hai 77 180,879 33 94,366 110 275,245 8 22,400KMTC 36 68,315 38 90,343 74 158,658X-Press Feeders 31 51,708 49 82,444 80 134,152SITC 49 67,369 27 36,595 76 103,964 12 20,466SM Line 21 116,711 21 116,711IRISL 24 85,872 - 24 85,872 4 57,904Quanzhou Ansheng 28 78,068 -1 -698 27 77,370 25 38,880Arkas 50 93,263 -4 -16,078 46 77,185Zhonggu Shipping 20 62,639 2 8,074 22 70,713 10 18,728
TOTAL 3,657 19,840,980
Owned Chartered Total Deployed On Order
Source: Clarkson SIN 94% of World fleet
34

CambridgeAcademy ofTransport
69
Key Features of Container Shipping – 5
NVOCC
• Non-Vessel Operating Common Carriers are companies which do not own nor operate vessels but none-the-less offer container space to shippers.
– NVOCCs lease space from existing “carriers” on a wholesale basis
– To the customer, they behave like a carrier as they will issue bills of lading in their own name.
CambridgeAcademy ofTransport
70
The Big Picture
Historical Supply/Demand
35
CambridgeAcademy ofTransport
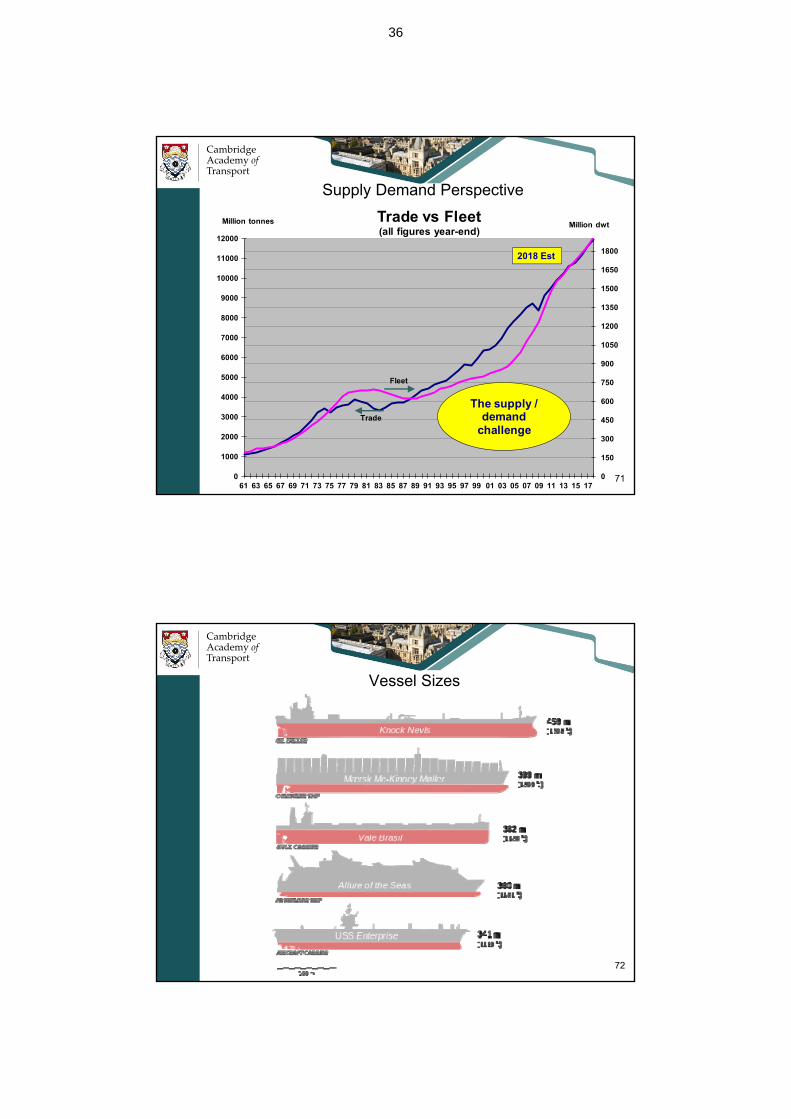
Supply Demand Perspective
0
150
300
450
600
750
900
1050
1200
1350
1500
1650
1800
0
1000
2000
3000
4000
5000
6000
7000
8000
9000
10000
11000
12000
61 63 65 67 69 71 73 75 77 79 81 83 85 87 89 91 93 95 97 99 01 03 05 07 09 11 13 15 17
Trade vs Fleet(all figures year-end)
Trade
Fleet
The supply / demand
challenge
Million tonnes Million dwt
71
2018 Est
CambridgeAcademy ofTransport
Vessel Sizes
72
36

CambridgeAcademy ofTransport
73
Conclusion
What you should know about ShippingWhat is Shipping
What is Shipowning
CambridgeAcademy ofTransport
74
What You Should Know About Shipping
• Shipping is one of the most international of industries– shrouded in mystique– dominated by private companies– many small players– many rules govern safety and pollution, but few rules govern its
commercial practice• The World is a shrinking market place
– can’t work without reliance upon shipping– container shipping has done more to achieve “globalisation” than
even the microchip
• The industry is going through a period of change
– a decade of relentless growth has tracked World trade
– the Credit Crisis of 2008/9 has stalled demand
– a potential gap between supply and demand will influence revenues
37

CambridgeAcademy ofTransport
75
Seaborne Trade
Shipping
Finance
Insurance
Shipbuilding
Crew
Ports
• Debt• Equity• Lease• ….
• H & M• P & I• War• …. • Steel
• Engines• Cargo Gear• ….
• Training• Employment• Certification• ….
• Tugs• Pilots• Dreding• Customs• Terminals• Containers• ….
Shipping is all of this and more…
OperationsChartering
HULL & MACHINERYPROTECTION & INDEMNITY
What is Shipping?
CambridgeAcademy ofTransport
76
The ShipActual Owner
Seller
Sell the ship
S&PMarket
Buyer
Sales Contract
Lease/Bareboat
CapitalMarkets
Bareboat Charter
Lessee
Lessor
Time charter
PeriodMarket
Time Charter
Owner
Charterer
Carry Cargo
FreightMarket
Voyage Charter
Owner
Charterer
NewbuildingMarket
ShipYard
Buy NewShip Newbuilding
Contract
Scrap theShip
ScrapMarket
DemolitionContract
ScrapYard
OPERATIONS
FINANCIAL
What Is Shipowning?
38