shrp ii interstate 64 corridor plan
TRANSCRIPT
1
SHRP II Interstate 64 Corridor Plan
Prepared by Charlottesville/albemarle mpo & staunton augusta Waynesboro mpodeCember 2017

Acknowledgments
i
The Interstate 64 corridor study was made possible by a grant from the U.S. Department of Transportation Federal Highway Administration SHRP2 Implementation Assistance Program-User Incentive to Deploy PlanWorks: Better planning. Better projects. (C01). The Charlottesville Albemarle Metropolitan Planning Organization would like to thank all project partners and participants in the Working Group.
Agency Partners:
FHWA• Mack Frost
National Park Service• Sally Hurlbert
Virginia Department of Transportation• Chuck Proctor Culpeper District• John Chiles Culpeper District• Joel Denunzio Culpeper District• Adam Campbell Staunton District• Don Komara Staunton District• Josh Dunlap Staunton District• Roy Reid Staunton & Culpeper Districts• Erik Johnson Freight Planning Office
Virginia Transportation Research Council• Bridget Donaldson
Virginia Department of Rail and Public Transportation • Katie Schwing
Virginia State Police• Scott VanLear
Local Government partners:
Albemarle County• Kevin McDermott
Augusta County• Leslie Tate
City of Charlottesville• Jeanette Janiczek
City of Staunton • Billy Vaughn
City of Waynesboro• Gary Critzer• Greg Hitchin • Luke Juday
Central Shenandoah Planning District Commission (CSPDC)• Bonnie Riedesel• Scott Philips • Rebecca Joyce
Thomas Jefferson Planning District Commission (TJPDC) (CA-MPO)• Chip Boyles
Buckingham Branch Railroad• Brian Freeman
BRITE• Nancy Gourley
The MPO Policy Boards: CA-MPO• Kristin Szakos, Charlottesville City Council, Chair• Ann Mallek, Albemarle County Board of Supervisors, Vice Chair• Kathy Galvin, Charlottesville City Council• Liz Palmer, Albemarle County Board of Supervisors• John D. Lynch, Virginia Department of Transportation Culpeper District
Staunton Augusta Waynesboro Metropolitan Planning Organization (SAWMPO)• Wendell Coleman, Augusta County• Tim Fitzgerald, Augusta County• James Harrington, City of Staunton• Steven Rosenberg, City of Staunton• Bruce Allen, City of Waynesboro• Jim Shaw, City of Waynesboro• Randy Kiser, Virginia Department of Transportation
ii
Table of Contents
Executive Summary..................................................................................1
Introduction ............................................................................................2
Background .............................................................................................6
PlanWorks ..............................................................................................10
Public Involvement ...............................................................................11
Existing Conditions and Hotspots .......................................................12
Recommendations.................................................................................32
Implementation........................................................................................41
Appendix A: Lessons Learned.............................................................A-1
Appendix B: Use of PlanWorks..........................................................B-1
Appendix C: Environmental review maps.........................................C-1
Appendix D: Working Group Meeting Materials..............................D-1
Appendix E: Posters.............................................................................E-1
Appendix F: Memorandum of Understanding (MOU)......................F-1
Maps and Figures:
Maps
Map 1: I-64 Corridor Study Area LocationMap 2: Average Annual Daily Traffic As of 2015 Map 3: Average Annual Daily Traffic forecast of 2035Map 4: Percentage of Truck Traffic in I-64 CorridorMap 5: VC Ratio, 2014-2015Map 6: VC Ratio Forecast, 2035Map 7: Condition of Roadway Pavement in I-64 CorridorMap 8: Bridge Sufficiency Ratings in I-64 CorridorMap 9: Vehicle Crash Hotspots Map 10: Historic and Cultural ResourcesMap 11: Aquatic ResourcesMap 12: LandscapesMap 13: Predicted Habitat Model Areas for Species of ConcernMap 14: Crash Rates on I-64 Corridor: Number of Crashes per 100 Million Vehicle-Miles-TraveledMap 15: Vehicle - Wildlife Crash Density in I-64 CorridorMap 16: Afton MountainMap 17: Ivy AreaMap 18: Interchange 118Map 19: Interchange 94Map 20: US 250 CrozetMap 21: Congestion Hot-spots in I-64 CorridorMap 22: Truck-Climbing Lanes on I-64 CorridorMap 23: Intersection and Interchange Improvements in I-64 CorridorMap 24: Inter-Regional Transit Service Routes and Potential Bus StopsMap 25: Animal-Vehicle Crash Density and Existing and Potential Mitigation MeasuresMap 26: Existing Electronic Signage in I-64 CorridorMap 27: Animal-Vehicle Crash Density and Existing and Potential Preventative MeasuresMap 28: Recommended Projects in I-64 Corridor
iii
Tables
Table 1: Main Roadways in the CorridorTable 2: Major Economies along the CorridorTable 3: Main Industries in the CorridorTable 4: KABCO Injury ScaleTable 5: Number of Crashes in the I-64 Corridor (2011-2016)Table 6: Estimated Annual Operation CostTable 7: Project Recommendations
Charts
Chart 1: Total PopulationChart 2: Youth PopulationChart 3: Elderly PopulationChart 4: Median Household IncomeChart 5: Educational Attainment
1
Executive SummaryChapter 1. IntroductionChapter 1 outlines the corridor, process, goals and objectives. This includes the problem statement and other details related to the scope of the plan
Chapter 2. BackgroundChapter 2 describes the background of the corridor. This includes a history of the corridor, analyses of demographic trends, commuting patterns, housing and incomes.
Chapter 3. PlanWorksChapter 3 provides an overview of the PlanWorks corridor planning toolkit and how it was integrated into the planning process. A detailed discussion of how PlanWorks was implemented can be found in Appendix B of the plan.
Chapter 4. Public InvolvementChapter 4 includes a discussion of public involvement and the role that a working group played in the planning process for the corridor.
Chapter 5. Existing Conditions and HotspotsChapter 5 introduces the existing conditions in the corridor and provides an analyses of roadway congestion, bridge and pavement conditions, safety, and environmental resources. This chapter also identifies areas with serious safety and congestion deficiencies in the corridor.
Chapter 6. RecommendationsChapter 6 presents existing and future project recommendations found in various plans that are considered important in addressing various deficiencies identified in Chapter 5.
Chapter 7. Implementation Chapter 7 discusses the relationship between the plan and other planning documents, including rural and urban long-range plans, the Six-year improvement program and the Smart Scale process.
The SHRP II Interstate 64 (I-64) Corridor Plan is a partnership between the Charlottesville Albemarle Metropolitan Planning Organization (CA-MPO) and the Staunton Augusta Waynesboro Metropolitan Planning Organization (SAWMPO). The project was made possible by funding from the Federal Highway Administration (FHWA) Strategic Highway Research Program II (SHRP2). The purpose of the project was to facilitate inter-regional communication and cooperation between stakeholders that have infrequently coordinated in the past.
The corridor plan evaluates existing conditions along the I-64 and US 250 corridor between Charlottesville and Staunton, Virginia and recommended projects that help address existing deficiencies in the corridor. These recommendations include addressing safety, congestion, driver communication and truck traffic.The plan includes a discussion about how PlanWorks was used and provides lessons learned.
The plan is organized into 7 chapters that correspond to key steps in the planning process and are aligned with the PlanWorks corridor planning decision guide.
What is PlanWorksPlan Works is a decision support tool, built from the experiences of transportation partners and stakeholders, which provides how-to information when it is most needed.
Decision Guide:The Corridor Planning decision guide consists of 9 modules. While the project referred to all 9COR-1, COR-2, COR-3, COR-4, COR-5, COR-6 were used to inform the process
Corridor Overview:• Approximately 40 miles long running east from Staunton to Charlottesville• Includes I-64, US 250, feeder roads and multi-modal transportation components• Passing through the counties of Albemarle, Augusta, Nelson and the City of Waynesboro.• Crosses the Blue Ridge Mountains at Rockfish Gap
2
Introduction
The Interstate 64 (I-64) corridor stretches half way across the United States from Hampton Roads, VA to St. Louis, MO. Within the Commonwealth the corridor extends 298 miles from the West Virginia State line to Chesapeake VA. The corridor is one of only two major east-west interstate corridors in the Commonwealth, and is the corridor that provides the most
OVERVIEW OF THE CORRIDOR
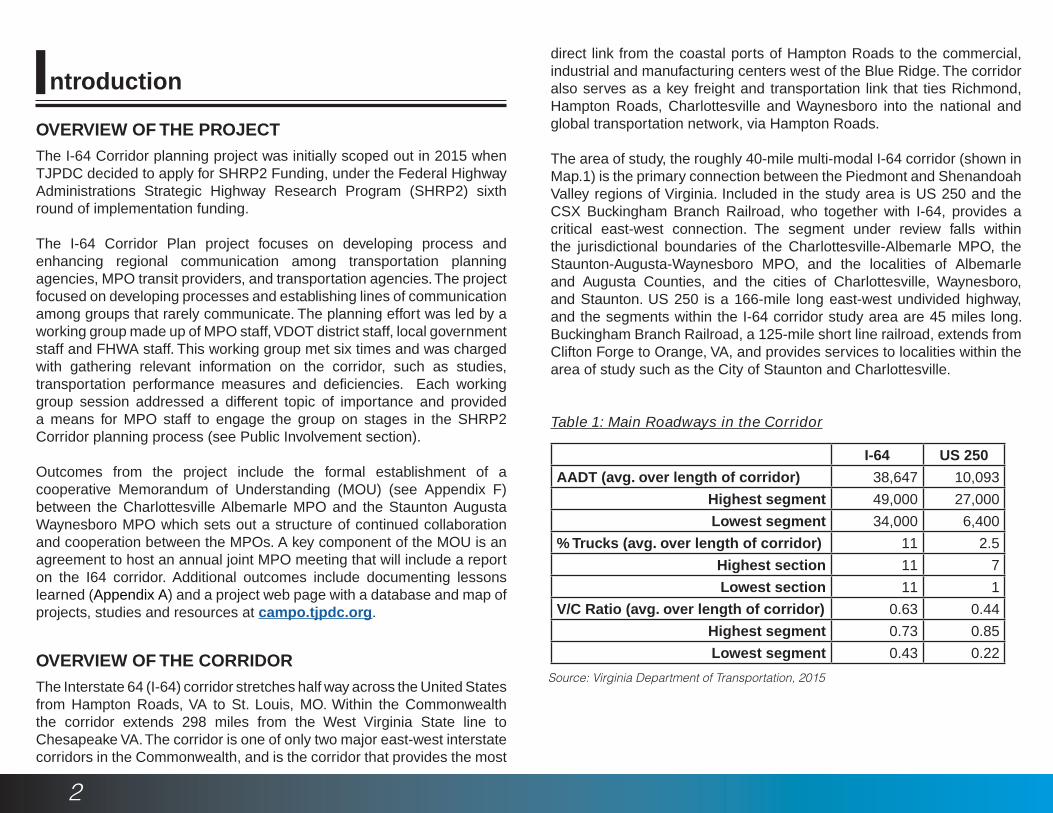
I-64 US 250
AADT (avg. over length of corridor) 38,647 10,093
Highest segment 49,000 27,000
Lowest segment 34,000 6,400
% Trucks (avg. over length of corridor) 11 2.5
Highest section 11 7
Lowest section 11 1
V/C Ratio (avg. over length of corridor) 0.63 0.44
Highest segment 0.73 0.85
Lowest segment 0.43 0.22
OVERVIEW OF THE PROJECTThe I-64 Corridor planning project was initially scoped out in 2015 when TJPDC decided to apply for SHRP2 Funding, under the Federal Highway Administrations Strategic Highway Research Program (SHRP2) sixth round of implementation funding.
The I-64 Corridor Plan project focuses on developing process and enhancing regional communication among transportation planning agencies, MPO transit providers, and transportation agencies. The project focused on developing processes and establishing lines of communication among groups that rarely communicate. The planning effort was led by a working group made up of MPO staff, VDOT district staff, local government staff and FHWA staff. This working group met six times and was charged with gathering relevant information on the corridor, such as studies, transportation performance measures and deficiencies. Each working group session addressed a different topic of importance and provided a means for MPO staff to engage the group on stages in the SHRP2 Corridor planning process (see Public Involvement section).
Outcomes from the project include the formal establishment of a cooperative Memorandum of Understanding (MOU) (see Appendix F) between the Charlottesville Albemarle MPO and the Staunton Augusta Waynesboro MPO which sets out a structure of continued collaboration and cooperation between the MPOs. A key component of the MOU is an agreement to host an annual joint MPO meeting that will include a report on the I64 corridor. Additional outcomes include documenting lessons learned (Appendix A) and a project web page with a database and map of projects, studies and resources at campo.tjpdc.org.
Table 1: Main Roadways in the Corridor
Source: Virginia Department of Transportation, 2015
direct link from the coastal ports of Hampton Roads to the commercial, industrial and manufacturing centers west of the Blue Ridge. The corridor also serves as a key freight and transportation link that ties Richmond, Hampton Roads, Charlottesville and Waynesboro into the national and global transportation network, via Hampton Roads.
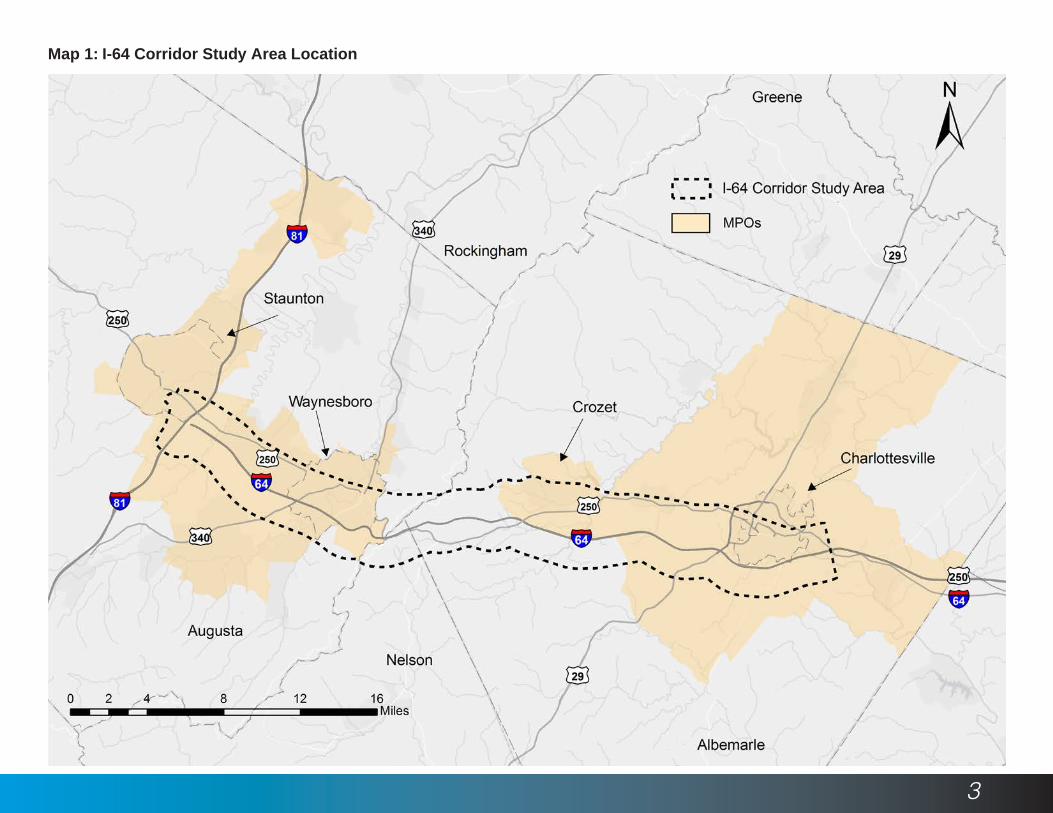
The area of study, the roughly 40-mile multi-modal I-64 corridor (shown in Map.1) is the primary connection between the Piedmont and Shenandoah Valley regions of Virginia. Included in the study area is US 250 and the CSX Buckingham Branch Railroad, who together with I-64, provides a critical east-west connection. The segment under review falls within the jurisdictional boundaries of the Charlottesville-Albemarle MPO, the Staunton-Augusta-Waynesboro MPO, and the localities of Albemarle and Augusta Counties, and the cities of Charlottesville, Waynesboro, and Staunton. US 250 is a 166-mile long east-west undivided highway, and the segments within the I-64 corridor study area are 45 miles long. Buckingham Branch Railroad, a 125-mile short line railroad, extends from Clifton Forge to Orange, VA, and provides services to localities within the area of study such as the City of Staunton and Charlottesville.
3
Map 1: I-64 Corridor Study Area Location
4
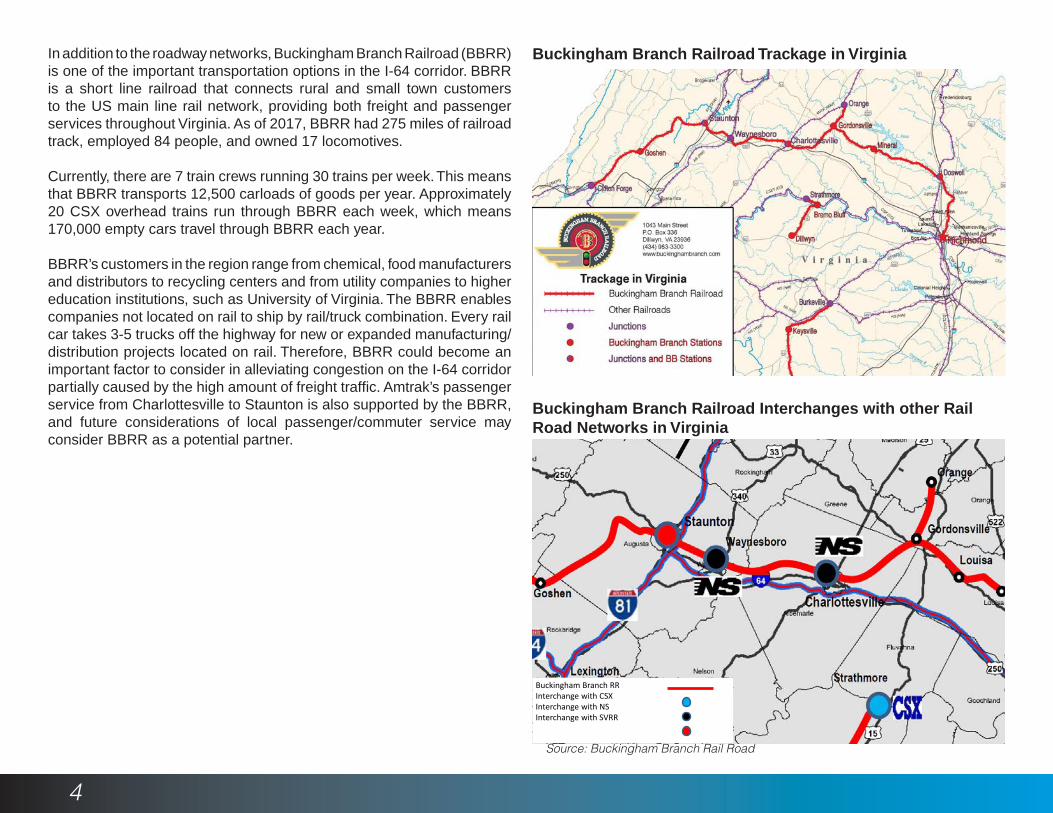
In addition to the roadway networks, Buckingham Branch Railroad (BBRR) is one of the important transportation options in the I-64 corridor. BBRR is a short line railroad that connects rural and small town customers to the US main line rail network, providing both freight and passenger services throughout Virginia. As of 2017, BBRR had 275 miles of railroad track, employed 84 people, and owned 17 locomotives.
Currently, there are 7 train crews running 30 trains per week. This means that BBRR transports 12,500 carloads of goods per year. Approximately 20 CSX overhead trains run through BBRR each week, which means 170,000 empty cars travel through BBRR each year.
BBRR’s customers in the region range from chemical, food manufacturers and distributors to recycling centers and from utility companies to higher education institutions, such as University of Virginia. The BBRR enables companies not located on rail to ship by rail/truck combination. Every rail car takes 3-5 trucks off the highway for new or expanded manufacturing/ distribution projects located on rail. Therefore, BBRR could become an important factor to consider in alleviating congestion on the I-64 corridor partially caused by the high amount of freight traffic. Amtrak’s passenger service from Charlottesville to Staunton is also supported by the BBRR, and future considerations of local passenger/commuter service may consider BBRR as a potential partner.
Charlottesville
Staunton
Richmond
Roanoke
Port ofHampton Roads
Wash, DC, Baltimore & PhiladelphiaPA, NY, NE
Loulsville & St. Louis
Atlanta
Jacksonville
Waynesboro
Clifton Forge
Doswell
Burkeville
Greensboro
Strathmore
Dillwyn
Clarksville
Gordonsville
Orange
Lexington
Lynchburg
Danville
Ashland
Buckingham Branch RRInterchange with CSXInterchange with NSInterchange with SVRR
Chase City
Keysville
Mineral
Louisa
GoshenMillboro
Virginia
Buckingham Branch Railroad Trackage in Virginia
Buckingham Branch Railroad Interchanges with other Rail Road Networks in Virginia
Source: Buckingham Branch Rail Road
5
Goals and objectives for the I-64 corridor plan were developed from goals and objectives found in existing transportation planning documents which include the SAWMPO 2040 Long Range Transportation Plan, the CA-MPO 2040 Long Range Transportation Plan and the 2035 Rural Long Range Transportation Plan for the Thomas Jefferson Planning District Commission. The goals focus on improving the function, safety, communication and impacts of activities within the corridor. Given the inter-jurisdictional nature of the corridor a significant portion of the goals are dedicated to enhancing and maintaining communications between jurisdictions, transportation agencies and MPOs. The overall goal is to increase efficiency of the corridor and ensuring that the corridor receives adequate project funding to address issues well in advance of them becoming a problem. The supplemental goals outlined below were presented to the project working group and vetted by staff at the MPOs and VDOT districts.
GOALS AND OBJECTIVES
Goals
Goal 1. Improve the overall function of the corridor by increasing the efficiency and safety for people and goods moving through the corridor.
• Enhance user experience through improved communications about weather conditions, detours, accidents and congestion. (Active Safety Management System)
• Develop an MOU defines out a framework for continued cooperation between the SAW-MPO and the CA-MPO on corridor related planning activities (MOU)
• Host an annual Joint MPO meeting that includes a report on the state of the corridor and key projects
• Work collaboratively to identify corridor-specific project improvements for inclusion in long range plans and future studies
Goal 2. Enhance communication among MPOs, Local Governments, VDOT and DRPT on planning issues in the corridor.
Goal 3. Minimize the impact that new projects have on natural resources and the environment.
• Reduce impacts to sensitive habitats and natural resources
• Limit road profile in areas of concern such as Afton mountain
• Improve habitat connectivity by utilizing existing stream corridors to reduce the conflict between vehicles and wildlife
Problem Statement
The Interstate 64 corridor is a multi-modal corridor that is the primary connection between the Piedmont and the Shenandoah Valley regions of Virginia. The corridor has unique challenges and opportunities. Challenged include; terrain, weather, and capacity at key points, and a growing demand on the corridor during daily peak travel times. Opportunities include; a good state of repair, available capacity during off-peak hours, interest in transit and a willingness of stakeholders to collaborate.
• Identify key hotspots and suggest actions to mitigate congestion, safety and access issues at these key locations (East and West approach to Afton, Ivy, Charlottesville exists and Waynesboro area exits)
• Further integrate transit into corridor through supporting research and development of inter-regional transit options. (JAUNT Crozet transit, Inter-Regional Transit)
• Improve corridor access by focusing on projects that reduce congestion at intersections and access points. (US 250 in Waynesboro, Crozet, Ivy)
• Improve freight performance by providing additional roadway capacity at key locations (Truck climbing lanes, improved interchange geometry)
6
The I-64 corridor is a vital transportation corridor that links the economies of the Central Shenandoah region to the greater Charlottesville region. The two regions are home to a combined population of 344,466 and an annual average employment of 215,111. Further, the corridor is a center of Virginia’s knowledge economy with the University of Virginia, UVA health, Augusta Health, Eastern Mennonite University, and Virginia School for the Deaf and Blind. As a combined region, the economy contributes 3.6% of Virginia’s gross domestic product.
HISTORY OF THE CORRIDOR
Background
Area GDP($ millions)
% State GDP
Average Annu-al Employment
Population Estimate
(2015)
Charlottesville MSA
12,851 2.6 150,717 225,070
Staunton-Waynesboro MSA
4,980 1.0 64,394 119,396
Beginning with Native American tribes who first traversed the Blue Ridge Mountains following hunting trails in search of big game, to the eventual creation of the modern Interstate system, there is a rich and varied history of how people and goods moved between the Shenandoah Valley and Piedmont regions of Virginia. Colonial expansion beginning in the late 1600’s and early 1700’s drove the indigenous Monacan and Mannahoac tribes from their land westward due to war and colonization. Between this period and the Revolutionary War, there was a lack of easily traversable roads. With the end of the Revolutionary War and peacetime returning to the Commonwealth, an increasingly mobile population began to settle in the Central Shenandoah and greater Charlottesville area regions. Three Notch’d Road was one of the earliest colonial routes to cross Virginia, passing through the Charlottesville area and over the Blue Ridge Mountains. But as these regions continued to grow, it became apparent
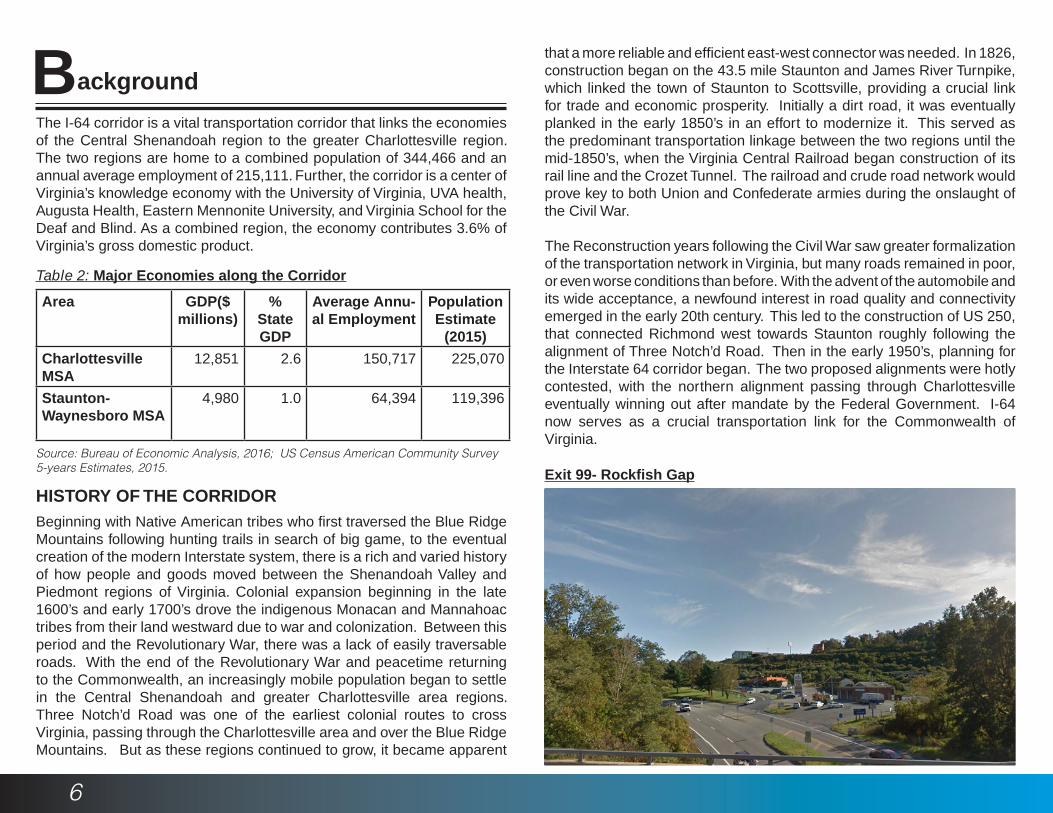
that a more reliable and efficient east-west connector was needed. In 1826, construction began on the 43.5 mile Staunton and James River Turnpike, which linked the town of Staunton to Scottsville, providing a crucial link for trade and economic prosperity. Initially a dirt road, it was eventually planked in the early 1850’s in an effort to modernize it. This served as the predominant transportation linkage between the two regions until the mid-1850’s, when the Virginia Central Railroad began construction of its rail line and the Crozet Tunnel. The railroad and crude road network would prove key to both Union and Confederate armies during the onslaught of the Civil War.
The Reconstruction years following the Civil War saw greater formalization of the transportation network in Virginia, but many roads remained in poor, or even worse conditions than before. With the advent of the automobile and its wide acceptance, a newfound interest in road quality and connectivity emerged in the early 20th century. This led to the construction of US 250, that connected Richmond west towards Staunton roughly following the alignment of Three Notch’d Road. Then in the early 1950’s, planning for the Interstate 64 corridor began. The two proposed alignments were hotly contested, with the northern alignment passing through Charlottesville eventually winning out after mandate by the Federal Government. I-64 now serves as a crucial transportation link for the Commonwealth of Virginia.
Source: Bureau of Economic Analysis, 2016; US Census American Community Survey 5-years Estimates, 2015.
Table 2: Major Economies along the Corridor
Exit 99- Rockfish Gap
7
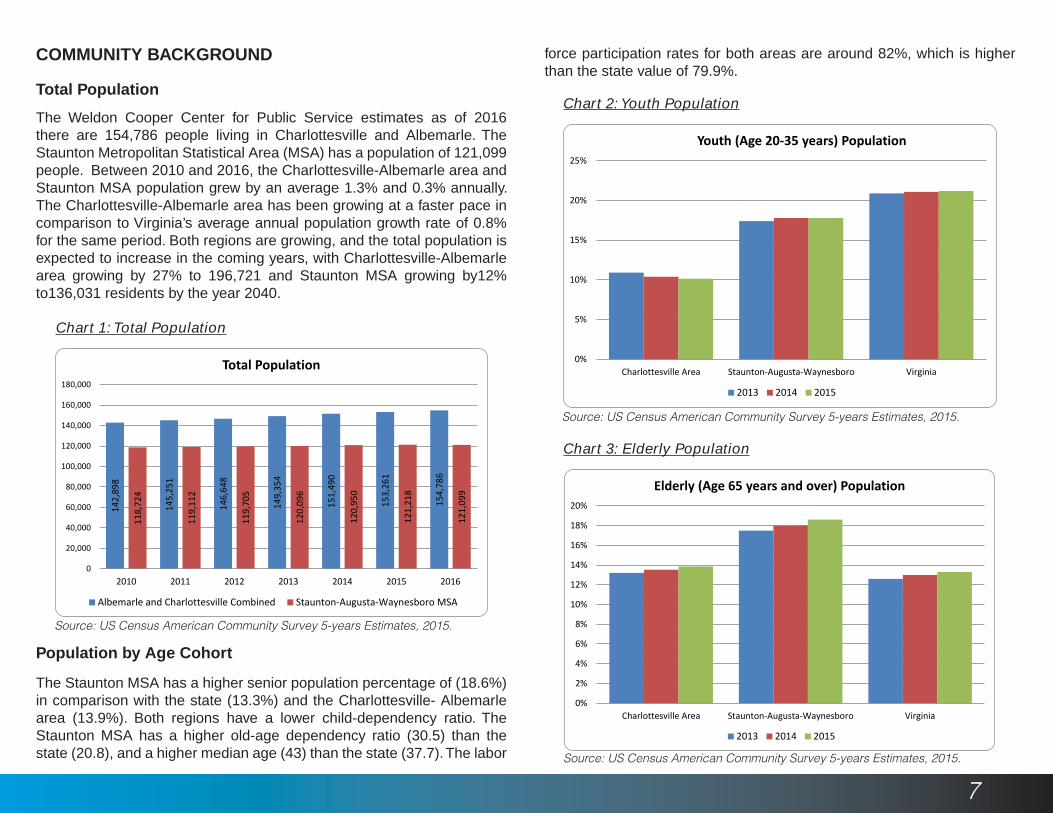
The Weldon Cooper Center for Public Service estimates as of 2016 there are 154,786 people living in Charlottesville and Albemarle. The Staunton Metropolitan Statistical Area (MSA) has a population of 121,099 people. Between 2010 and 2016, the Charlottesville-Albemarle area and Staunton MSA population grew by an average 1.3% and 0.3% annually. The Charlottesville-Albemarle area has been growing at a faster pace in comparison to Virginia’s average annual population growth rate of 0.8% for the same period. Both regions are growing, and the total population is expected to increase in the coming years, with Charlottesville-Albemarle area growing by 27% to 196,721 and Staunton MSA growing by12% to136,031 residents by the year 2040.
Total Population
The Staunton MSA has a higher senior population percentage of (18.6%) in comparison with the state (13.3%) and the Charlottesville- Albemarle area (13.9%). Both regions have a lower child-dependency ratio. The Staunton MSA has a higher old-age dependency ratio (30.5) than the state (20.8), and a higher median age (43) than the state (37.7). The labor
Population by Age Cohort
142,
898
145,
251
146,
648
149,
354
151,
490
153,
261
154,
786
118,
724
119,
112
119,
705
120,
096
120,
950
121,
218
121,
099
0
20,000
40,000
60,000
80,000
100,000
120,000
140,000
160,000
180,000
2010 2011 2012 2013 2014 2015 2016
Total Population
Albemarle and Charlottesville Combined Staunton-Augusta-Waynesboro MSA
Source: US Census American Community Survey 5-years Estimates, 2015.
force participation rates for both areas are around 82%, which is higher than the state value of 79.9%.
0%
5%
10%
15%
20%
25%
Charlottesville Area Staunton-Augusta-Waynesboro Virginia
Youth (Age 20-35 years) Population
2013 2014 2015
Source: US Census American Community Survey 5-years Estimates, 2015.
0%
2%
4%
6%
8%
10%
12%
14%
16%
18%
20%
Charlottesville Area Staunton-Augusta-Waynesboro Virginia
Elderly (Age 65 years and over) Population
2013 2014 2015
Source: US Census American Community Survey 5-years Estimates, 2015.
COMMUNITY BACKGROUND
Chart 1: Total Population
Chart 3: Elderly Population
Chart 2: Youth Population
8
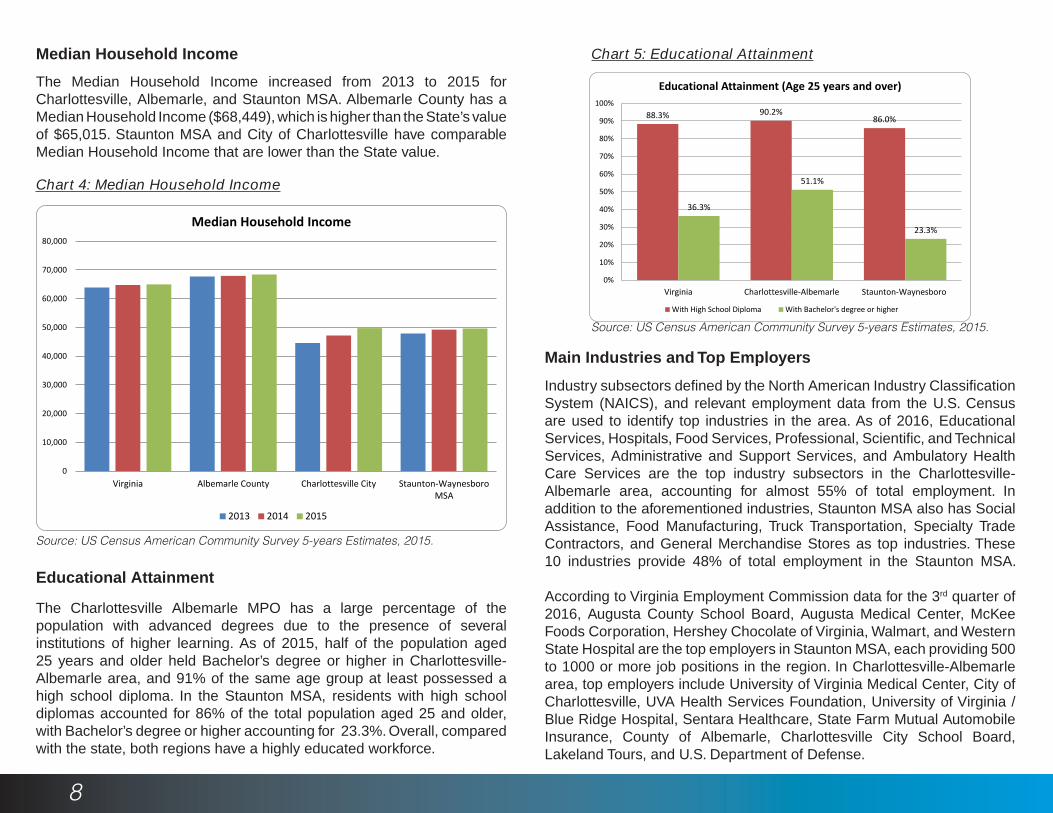
The Median Household Income increased from 2013 to 2015 for Charlottesville, Albemarle, and Staunton MSA. Albemarle County has a Median Household Income ($68,449), which is higher than the State’s value of $65,015. Staunton MSA and City of Charlottesville have comparable Median Household Income that are lower than the State value.
Median Household Income
The Charlottesville Albemarle MPO has a large percentage of the population with advanced degrees due to the presence of several institutions of higher learning. As of 2015, half of the population aged 25 years and older held Bachelor’s degree or higher in Charlottesville-Albemarle area, and 91% of the same age group at least possessed a high school diploma. In the Staunton MSA, residents with high school diplomas accounted for 86% of the total population aged 25 and older, with Bachelor’s degree or higher accounting for 23.3%. Overall, compared with the state, both regions have a highly educated workforce.
Educational Attainment
Industry subsectors defined by the North American Industry Classification System (NAICS), and relevant employment data from the U.S. Census are used to identify top industries in the area. As of 2016, Educational Services, Hospitals, Food Services, Professional, Scientific, and Technical Services, Administrative and Support Services, and Ambulatory Health Care Services are the top industry subsectors in the Charlottesville-Albemarle area, accounting for almost 55% of total employment. In addition to the aforementioned industries, Staunton MSA also has Social Assistance, Food Manufacturing, Truck Transportation, Specialty Trade Contractors, and General Merchandise Stores as top industries. These 10 industries provide 48% of total employment in the Staunton MSA.
According to Virginia Employment Commission data for the 3rd quarter of 2016, Augusta County School Board, Augusta Medical Center, McKee Foods Corporation, Hershey Chocolate of Virginia, Walmart, and Western State Hospital are the top employers in Staunton MSA, each providing 500 to 1000 or more job positions in the region. In Charlottesville-Albemarle area, top employers include University of Virginia Medical Center, City of Charlottesville, UVA Health Services Foundation, University of Virginia / Blue Ridge Hospital, Sentara Healthcare, State Farm Mutual Automobile Insurance, County of Albemarle, Charlottesville City School Board, Lakeland Tours, and U.S. Department of Defense.
Main Industries and Top Employers
0
10,000
20,000
30,000
40,000
50,000
60,000
70,000
80,000
Virginia Albemarle County Charlottesville City Staunton-WaynesboroMSA
Median Household Income
2013 2014 2015
Source: US Census American Community Survey 5-years Estimates, 2015.
88.3% 90.2%86.0%
36.3%
51.1%
23.3%
0%
10%
20%
30%
40%
50%
60%
70%
80%
90%
100%
Virginia Charlottesville-Albemarle Staunton-Waynesboro
Educational Attainment (Age 25 years and over)
With High School Diploma With Bachelor's degree or higher
Chart 4: Median Household Income
Source: US Census American Community Survey 5-years Estimates, 2015.
Chart 5: Educational Attainment
9
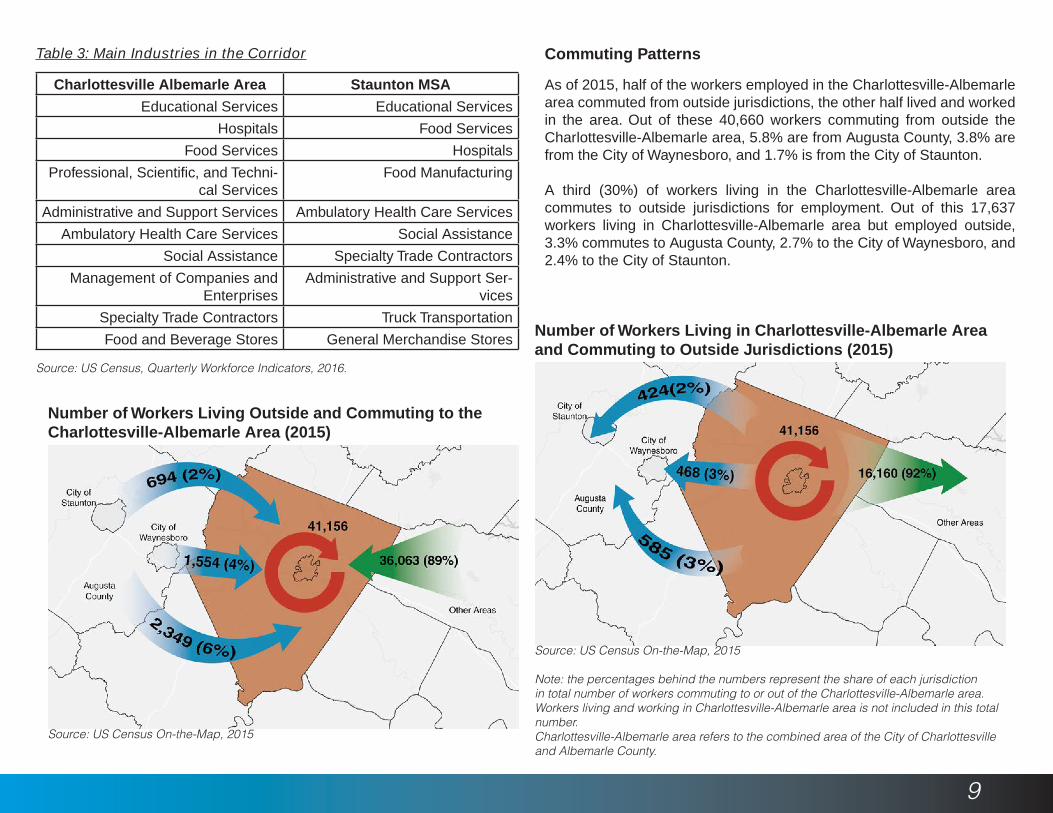
As of 2015, half of the workers employed in the Charlottesville-Albemarle area commuted from outside jurisdictions, the other half lived and worked in the area. Out of these 40,660 workers commuting from outside the Charlottesville-Albemarle area, 5.8% are from Augusta County, 3.8% are from the City of Waynesboro, and 1.7% is from the City of Staunton.
A third (30%) of workers living in the Charlottesville-Albemarle area commutes to outside jurisdictions for employment. Out of this 17,637 workers living in Charlottesville-Albemarle area but employed outside, 3.3% commutes to Augusta County, 2.7% to the City of Waynesboro, and 2.4% to the City of Staunton.
Commuting Patterns
Number of Workers Living Outside and Commuting to the Charlottesville-Albemarle Area (2015)
Source: US Census, Quarterly Workforce Indicators, 2016.
Table 3: Main Industries in the Corridor
Charlottesville Albemarle Area Staunton MSA
Educational Services Educational Services
Hospitals Food Services
Food Services Hospitals
Professional, Scientific, and Techni-cal Services
Food Manufacturing
Administrative and Support Services Ambulatory Health Care Services
Ambulatory Health Care Services Social Assistance
Social Assistance Specialty Trade Contractors
Management of Companies and Enterprises
Administrative and Support Ser-vices
Specialty Trade Contractors Truck Transportation
Food and Beverage Stores General Merchandise StoresNumber of Workers Living in Charlottesville-Albemarle Area and Commuting to Outside Jurisdictions (2015)
Source: US Census On-the-Map, 2015
Note: the percentages behind the numbers represent the share of each jurisdiction in total number of workers commuting to or out of the Charlottesville-Albemarle area. Workers living and working in Charlottesville-Albemarle area is not included in this total number. Charlottesville-Albemarle area refers to the combined area of the City of Charlottesville and Albemarle County.
Source: US Census On-the-Map, 2015
Source: US Census American Community Survey 5-years Estimates, 2015.
Chart 5: Educational Attainment
10
1. Decision Guide - A troubleshooting guide describing the common decision points and opportunities for cooperation in the transportation planning and environmental review process. For each of the key decision points, PlanWorks provides policy and stakeholder questions, data needs, case studies and examples, and links to tools that can help support the decision.
2. Assessments – Interactive assessment tools that enable project stakeholders to identify opportunities to work together, improve inter-agency cooperation, and expedite project delivery. Assessments can be taken online, or downloaded and used offline collaboratively.
3. Applications – A series of special topics that provide specific information and approaches for how these topics can be considered in the collaborative decision-making framework. Applications include performance measures, visioning, freight, and many other emerging and complex topics.
4. Library - A resource library containing relevant case studies and reports of successful inter-agency cooperation in the transportation planning and environmental review process.
PlanWorks has four major components:
PLANWORKS
PlanWorks is a web resource developed by the Federal Highway Administration that supports collaborative decision-making in transportation planning and project development. PlanWorks is built around key decision points in long-range planning, programming, corridor planning, and environmental review. PlanWorks suggests when and how to engage cross-disciplinary partners and stakeholder groups. PlanWorks resource has four major components:
HOW DOES THIS PROJECT USE PLANWORKS?
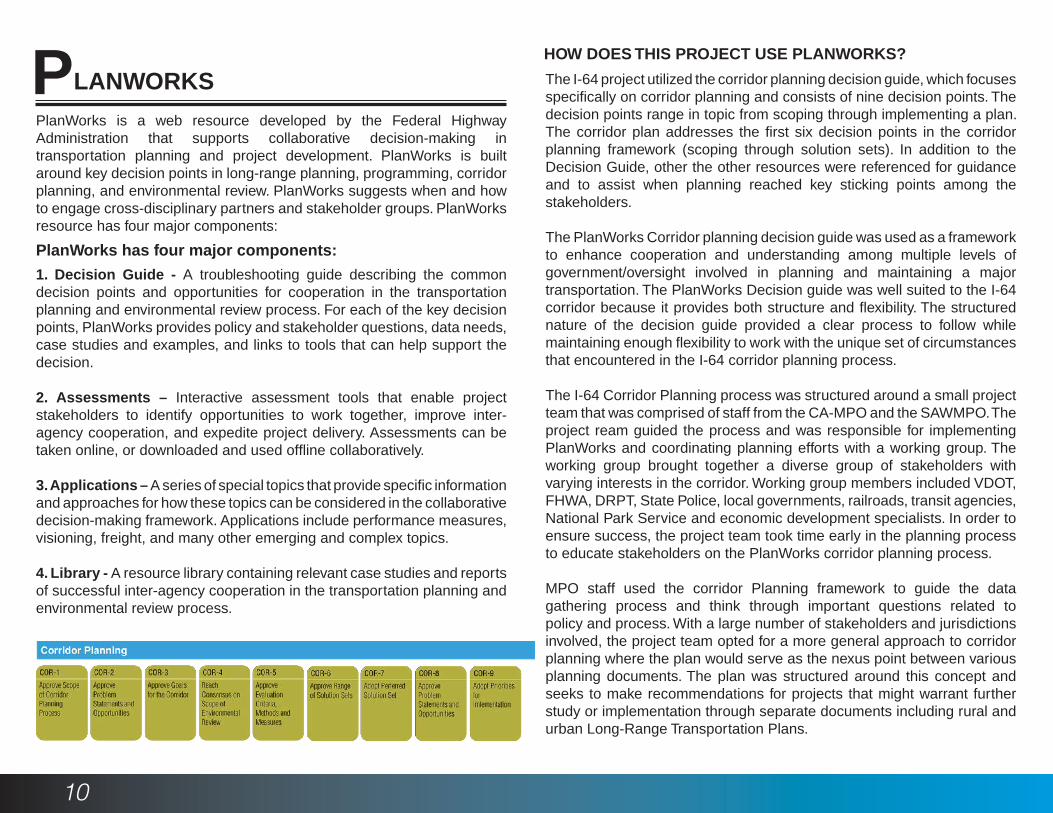
The I-64 project utilized the corridor planning decision guide, which focuses specifically on corridor planning and consists of nine decision points. The decision points range in topic from scoping through implementing a plan. The corridor plan addresses the first six decision points in the corridor planning framework (scoping through solution sets). In addition to the Decision Guide, other the other resources were referenced for guidance and to assist when planning reached key sticking points among the stakeholders.
The PlanWorks Corridor planning decision guide was used as a framework to enhance cooperation and understanding among multiple levels of government/oversight involved in planning and maintaining a major transportation. The PlanWorks Decision guide was well suited to the I-64 corridor because it provides both structure and flexibility. The structured nature of the decision guide provided a clear process to follow while maintaining enough flexibility to work with the unique set of circumstances that encountered in the I-64 corridor planning process.
The I-64 Corridor Planning process was structured around a small project team that was comprised of staff from the CA-MPO and the SAWMPO. The project ream guided the process and was responsible for implementing PlanWorks and coordinating planning efforts with a working group. The working group brought together a diverse group of stakeholders with varying interests in the corridor. Working group members included VDOT, FHWA, DRPT, State Police, local governments, railroads, transit agencies, National Park Service and economic development specialists. In order to ensure success, the project team took time early in the planning process to educate stakeholders on the PlanWorks corridor planning process.
MPO staff used the corridor Planning framework to guide the data gathering process and think through important questions related to policy and process. With a large number of stakeholders and jurisdictions involved, the project team opted for a more general approach to corridor planning where the plan would serve as the nexus point between various planning documents. The plan was structured around this concept and seeks to make recommendations for projects that might warrant further study or implementation through separate documents including rural and urban Long-Range Transportation Plans.
11
With any transportation project, public involvement is an important part of the planning process. The project team made the decision early on to engage the public directly through a public open house and community survey. The public was also indirectly engaged through the MPO committee meeting. This included providing the MPO committees with regular project updates and presentations at important decision points in the planning process.
PUBLIC INVOLVEMENT
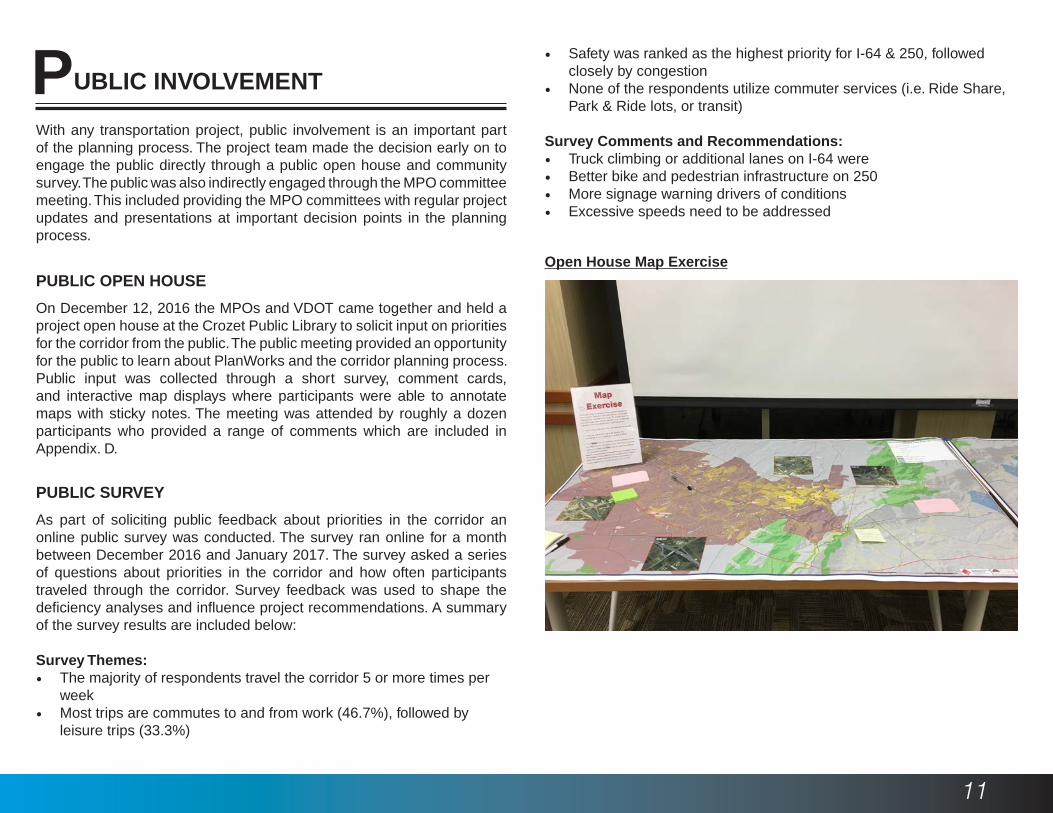
PUBLIC OPEN HOUSE
On December 12, 2016 the MPOs and VDOT came together and held a project open house at the Crozet Public Library to solicit input on priorities for the corridor from the public. The public meeting provided an opportunity for the public to learn about PlanWorks and the corridor planning process. Public input was collected through a short survey, comment cards, and interactive map displays where participants were able to annotate maps with sticky notes. The meeting was attended by roughly a dozen participants who provided a range of comments which are included in Appendix. D.
Open House Map Exercise
PUBLIC SURVEY
As part of soliciting public feedback about priorities in the corridor an online public survey was conducted. The survey ran online for a month between December 2016 and January 2017. The survey asked a series of questions about priorities in the corridor and how often participants traveled through the corridor. Survey feedback was used to shape the deficiency analyses and influence project recommendations. A summary of the survey results are included below:
Survey Themes:• The majority of respondents travel the corridor 5 or more times per
week • Most trips are commutes to and from work (46.7%), followed by
leisure trips (33.3%)
• Safety was ranked as the highest priority for I-64 & 250, followed closely by congestion
• None of the respondents utilize commuter services (i.e. Ride Share, Park & Ride lots, or transit)
Survey Comments and Recommendations:• Truck climbing or additional lanes on I-64 were • Better bike and pedestrian infrastructure on 250 • More signage warning drivers of conditions • Excessive speeds need to be addressed
12
WORKING GROUP MEETINGS
The working group served as a key component of the overall project. The working group provided a structured framework for improving communication and coordination among all the parties responsible for transportation planning. Originally, the group was envisioned as a small group of representatives from the MPOs, VDOT FHWA and the local governments. However, it quickly became evident that the group needed to expand to include additional representatives from public safety, rail operators, economic development professionals and the Virginia Transportation Research Council. The working group met a total of six times with each meeting focused on a specific topic and component of the corridor planning decision guide.
EXISTING CONDITIONS
ROADWAY CONDITIONS
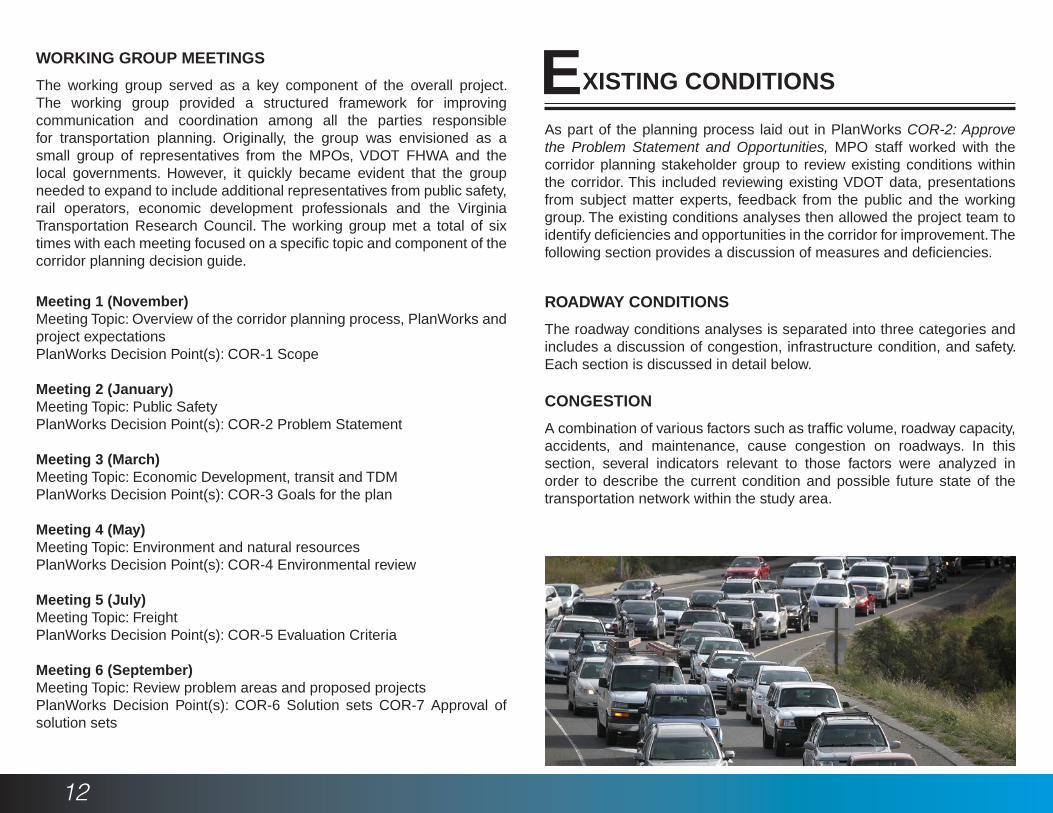
A combination of various factors such as traffic volume, roadway capacity, accidents, and maintenance, cause congestion on roadways. In this section, several indicators relevant to those factors were analyzed in order to describe the current condition and possible future state of the transportation network within the study area.
CONGESTION
As part of the planning process laid out in PlanWorks COR-2: Approve the Problem Statement and Opportunities, MPO staff worked with the corridor planning stakeholder group to review existing conditions within the corridor. This included reviewing existing VDOT data, presentations from subject matter experts, feedback from the public and the working group. The existing conditions analyses then allowed the project team to identify deficiencies and opportunities in the corridor for improvement. The following section provides a discussion of measures and deficiencies.
The roadway conditions analyses is separated into three categories and includes a discussion of congestion, infrastructure condition, and safety. Each section is discussed in detail below.
Meeting 1 (November)Meeting Topic: Overview of the corridor planning process, PlanWorks and project expectationsPlanWorks Decision Point(s): COR-1 Scope
Meeting 2 (January)Meeting Topic: Public SafetyPlanWorks Decision Point(s): COR-2 Problem Statement
Meeting 3 (March)Meeting Topic: Economic Development, transit and TDMPlanWorks Decision Point(s): COR-3 Goals for the plan
Meeting 4 (May)Meeting Topic: Environment and natural resourcesPlanWorks Decision Point(s): COR-4 Environmental review
Meeting 5 (July)Meeting Topic: FreightPlanWorks Decision Point(s): COR-5 Evaluation Criteria
Meeting 6 (September)Meeting Topic: Review problem areas and proposed projectsPlanWorks Decision Point(s): COR-6 Solution sets COR-7 Approval of solution sets
13
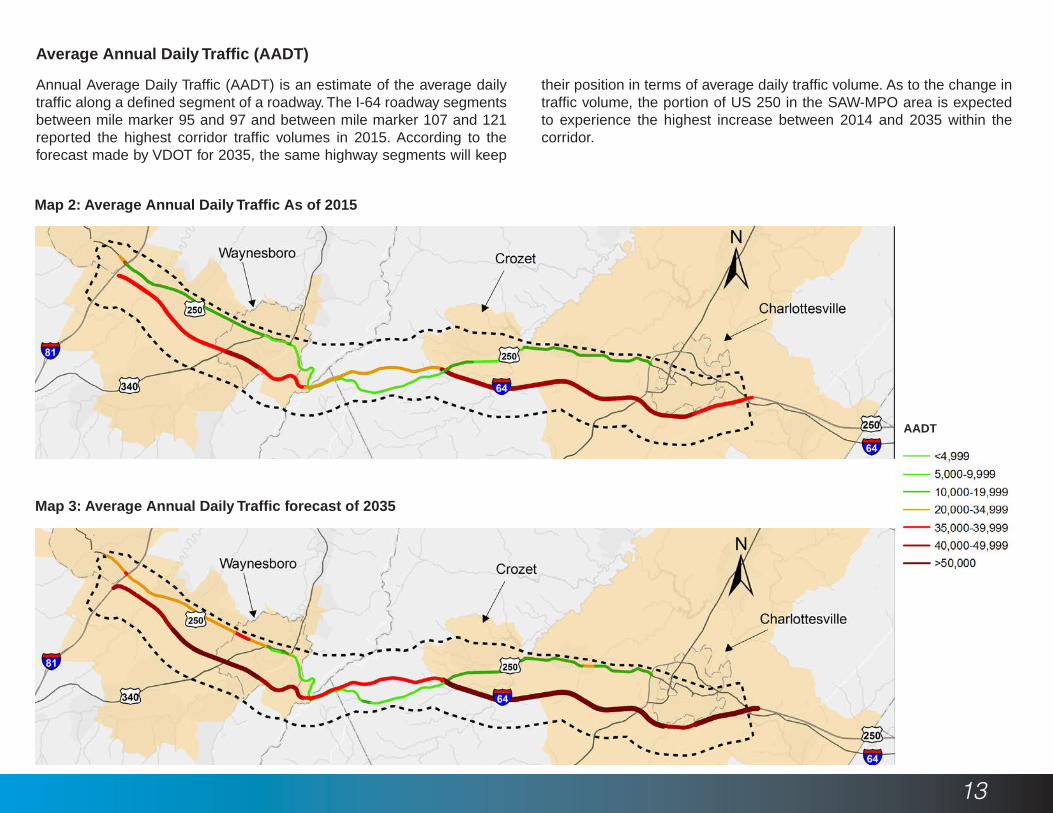
Annual Average Daily Traffic (AADT) is an estimate of the average daily traffic along a defined segment of a roadway. The I-64 roadway segments between mile marker 95 and 97 and between mile marker 107 and 121 reported the highest corridor traffic volumes in 2015. According to the forecast made by VDOT for 2035, the same highway segments will keep
Map 2: Average Annual Daily Traffic As of 2015
Average Annual Daily Traffic (AADT)
their position in terms of average daily traffic volume. As to the change in traffic volume, the portion of US 250 in the SAW-MPO area is expected to experience the highest increase between 2014 and 2035 within the corridor.
Map 3: Average Annual Daily Traffic forecast of 2035
AADT
14
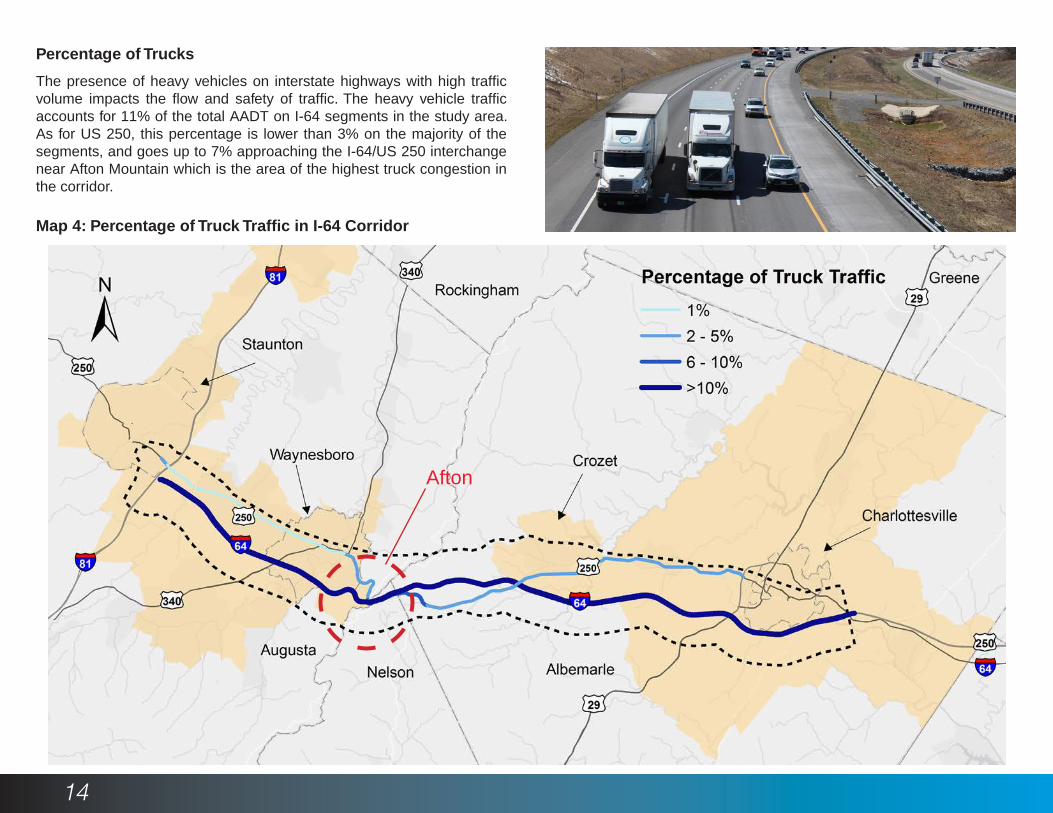
The presence of heavy vehicles on interstate highways with high traffic volume impacts the flow and safety of traffic. The heavy vehicle traffic accounts for 11% of the total AADT on I-64 segments in the study area. As for US 250, this percentage is lower than 3% on the majority of the segments, and goes up to 7% approaching the I-64/US 250 interchange near Afton Mountain which is the area of the highest truck congestion in the corridor.
Percentage of Trucks
Map 4: Percentage of Truck Traffic in I-64 Corridor
Afton
15
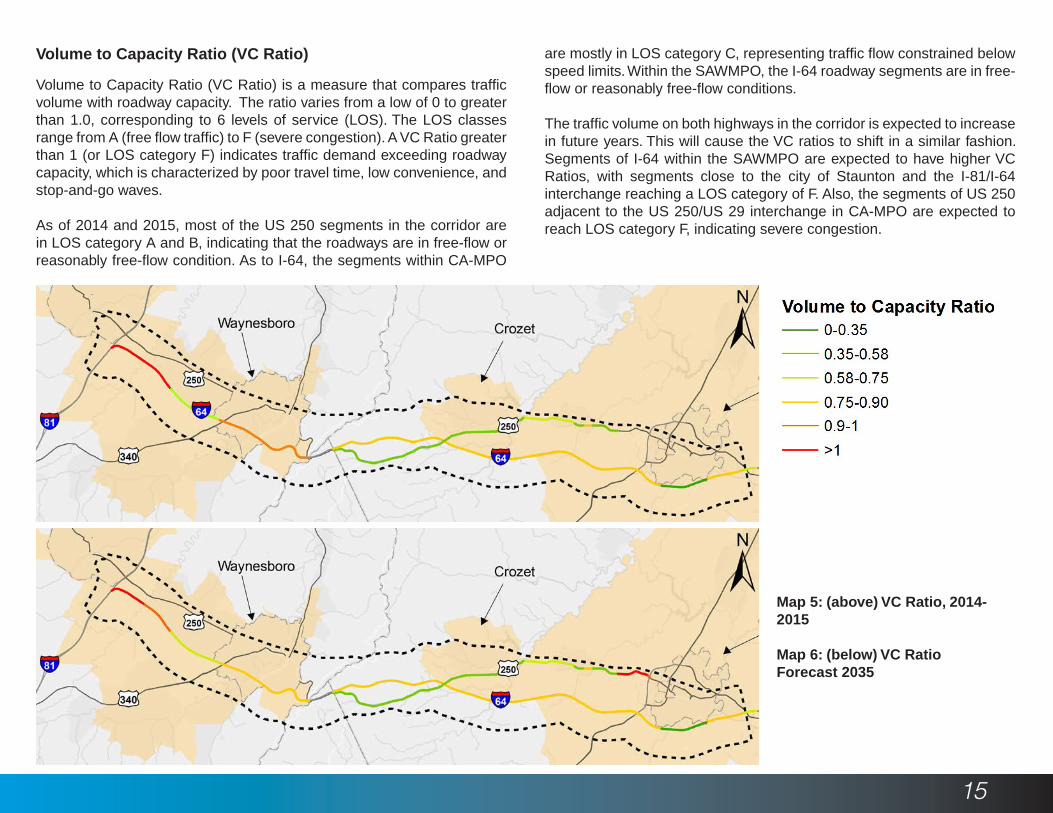
Volume to Capacity Ratio (VC Ratio) is a measure that compares traffic volume with roadway capacity. The ratio varies from a low of 0 to greater than 1.0, corresponding to 6 levels of service (LOS). The LOS classes range from A (free flow traffic) to F (severe congestion). A VC Ratio greater than 1 (or LOS category F) indicates traffic demand exceeding roadway capacity, which is characterized by poor travel time, low convenience, and stop-and-go waves.
As of 2014 and 2015, most of the US 250 segments in the corridor are in LOS category A and B, indicating that the roadways are in free-flow or reasonably free-flow condition. As to I-64, the segments within CA-MPO
Volume to Capacity Ratio (VC Ratio) are mostly in LOS category C, representing traffic flow constrained below speed limits. Within the SAWMPO, the I-64 roadway segments are in free-flow or reasonably free-flow conditions.
The traffic volume on both highways in the corridor is expected to increase in future years. This will cause the VC ratios to shift in a similar fashion. Segments of I-64 within the SAWMPO are expected to have higher VC Ratios, with segments close to the city of Staunton and the I-81/I-64 interchange reaching a LOS category of F. Also, the segments of US 250 adjacent to the US 250/US 29 interchange in CA-MPO are expected to reach LOS category F, indicating severe congestion.
Map 5: (above) VC Ratio, 2014-2015
Map 6: (below) VC Ratio Forecast 2035
16
Maintenance Conditions
Maintenance conditions of transportation infrastructure are important performance measures indicating the overall quality of the infrastructure. In the corridor two indicators were analyzed; pavement conditions and bridge sufficiency. These measures are good indicators of areas of maintenance needs and roadway quality.
Pavement Conditions
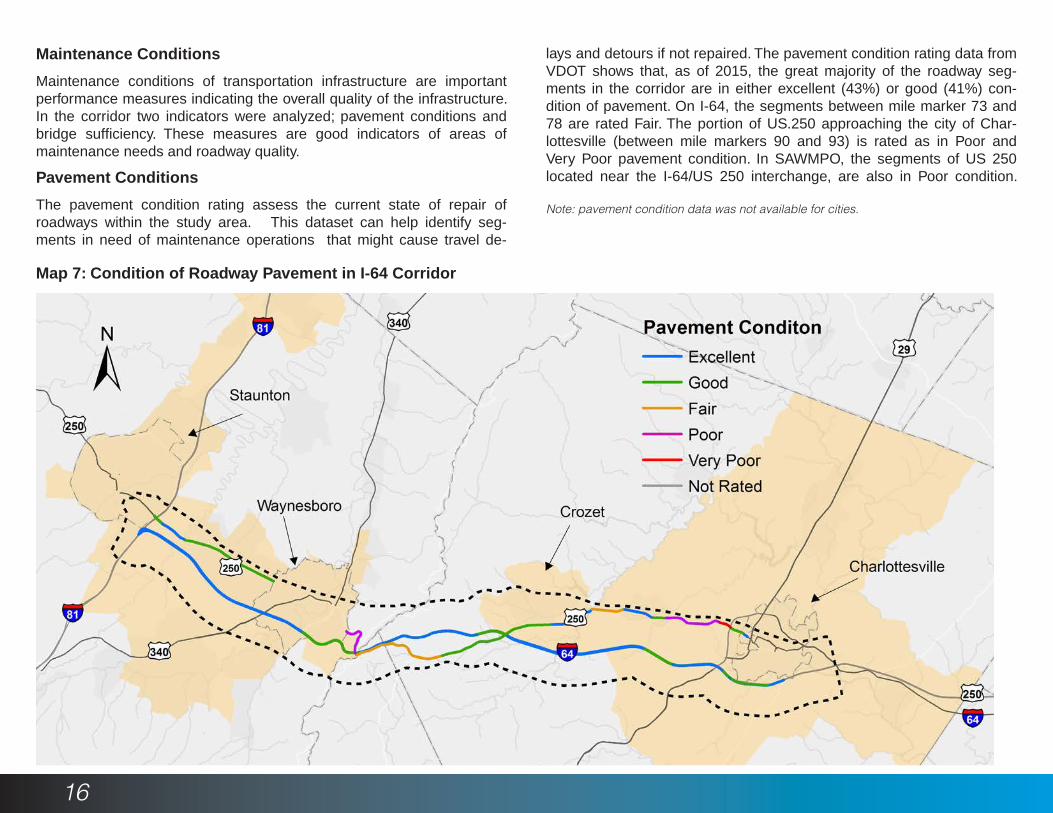
The pavement condition rating assess the current state of repair of roadways within the study area. This dataset can help identify seg-ments in need of maintenance operations that might cause travel de-
Map 7: Condition of Roadway Pavement in I-64 Corridor
lays and detours if not repaired. The pavement condition rating data from VDOT shows that, as of 2015, the great majority of the roadway seg-ments in the corridor are in either excellent (43%) or good (41%) con-dition of pavement. On I-64, the segments between mile marker 73 and 78 are rated Fair. The portion of US.250 approaching the city of Char-lottesville (between mile markers 90 and 93) is rated as in Poor and Very Poor pavement condition. In SAWMPO, the segments of US 250 located near the I-64/US 250 interchange, are also in Poor condition.
Note: pavement condition data was not available for cities.
17
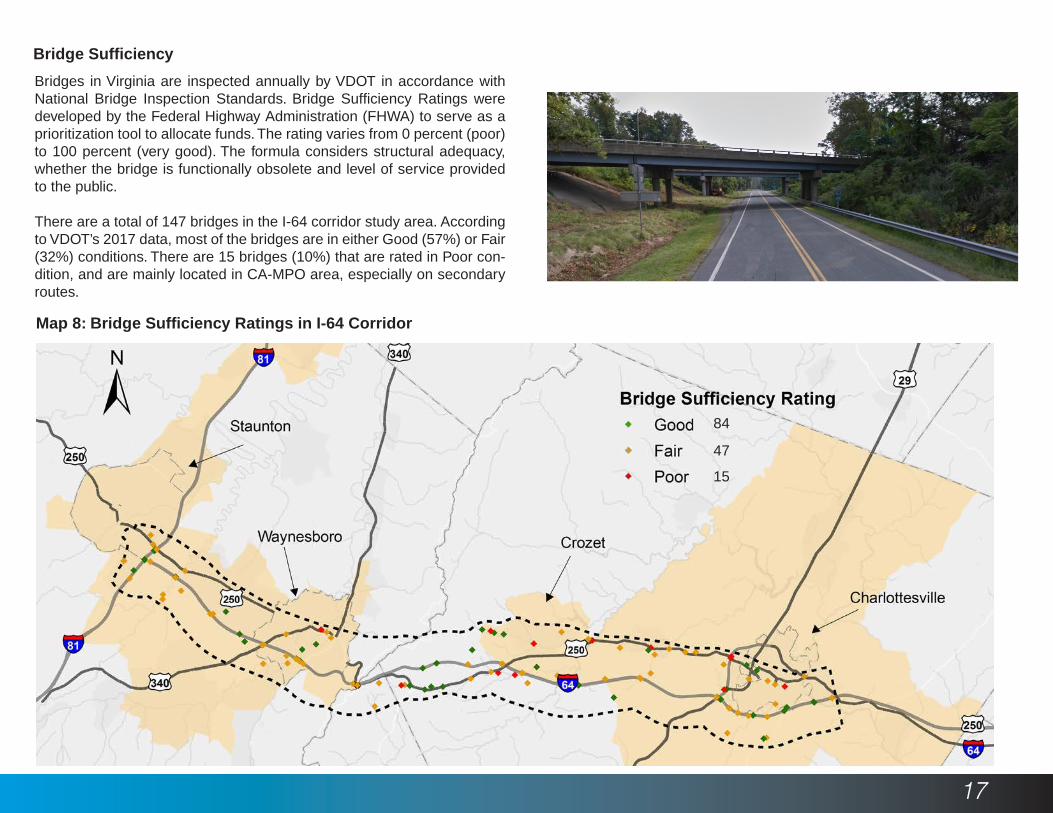
Bridge Sufficiency
Bridges in Virginia are inspected annually by VDOT in accordance with National Bridge Inspection Standards. Bridge Sufficiency Ratings were developed by the Federal Highway Administration (FHWA) to serve as a prioritization tool to allocate funds. The rating varies from 0 percent (poor) to 100 percent (very good). The formula considers structural adequacy, whether the bridge is functionally obsolete and level of service provided to the public.
There are a total of 147 bridges in the I-64 corridor study area. According to VDOT’s 2017 data, most of the bridges are in either Good (57%) or Fair (32%) conditions. There are 15 bridges (10%) that are rated in Poor con-dition, and are mainly located in CA-MPO area, especially on secondary routes.
Map 8: Bridge Sufficiency Ratings in I-64 Corridor
47
84
15
18
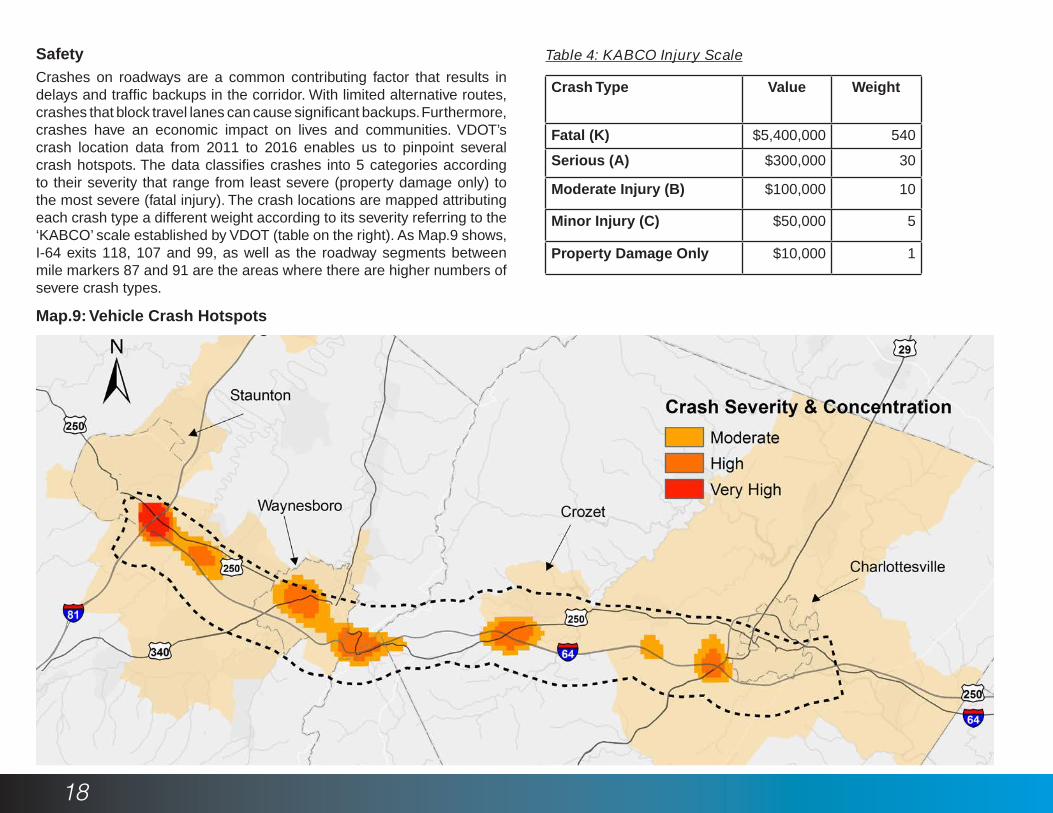
SafetyCrashes on roadways are a common contributing factor that results in delays and traffic backups in the corridor. With limited alternative routes, crashes that block travel lanes can cause significant backups. Furthermore, crashes have an economic impact on lives and communities. VDOT’s crash location data from 2011 to 2016 enables us to pinpoint several crash hotspots. The data classifies crashes into 5 categories according to their severity that range from least severe (property damage only) to the most severe (fatal injury). The crash locations are mapped attributing each crash type a different weight according to its severity referring to the ‘KABCO’ scale established by VDOT (table on the right). As Map.9 shows, I-64 exits 118, 107 and 99, as well as the roadway segments between mile markers 87 and 91 are the areas where there are higher numbers of severe crash types.
Map.9: Vehicle Crash Hotspots
Table 4: KABCO Injury Scale
Crash Type Value Weight
Fatal (K) $5,400,000 540
Serious (A) $300,000 30
Moderate Injury (B) $100,000 10
Minor Injury (C) $50,000 5
Property Damage Only $10,000 1
19
Environmental Resource
The geographic location of the corridor puts it in a location of high environmental value. The corridor passes through three distinct physiography provinces which include the Piedmont Plateau, Blue Ridge and Ridge and Valley. Each province supports communities of unique, endemic, and endangered species of which impacts to should be avoided. The corridor also passes within close proximity to Shenandoah National Park, the George Washington National Forest, and the Appalachian trail, which are all considered important environmental and cultural resources. Further, the corridor also passes through important cultural landscapes which include numerous historic properties, historic districts, battlefields and viewsheds.
Utilizing GIS and other spatial analyst tools, the plan took a holistic approach to assess the overall environmental and cultural resources within the corridor planning area. This allowed the corridor project recommendations to be reviewed for potential impacts in aggregate. Further, most of the project recommendations fall within existing rights of way so any new impacts would be minimal.
The section below provides a brief description of the environmental and cultural datasets that were analyzed as part of the planning process.
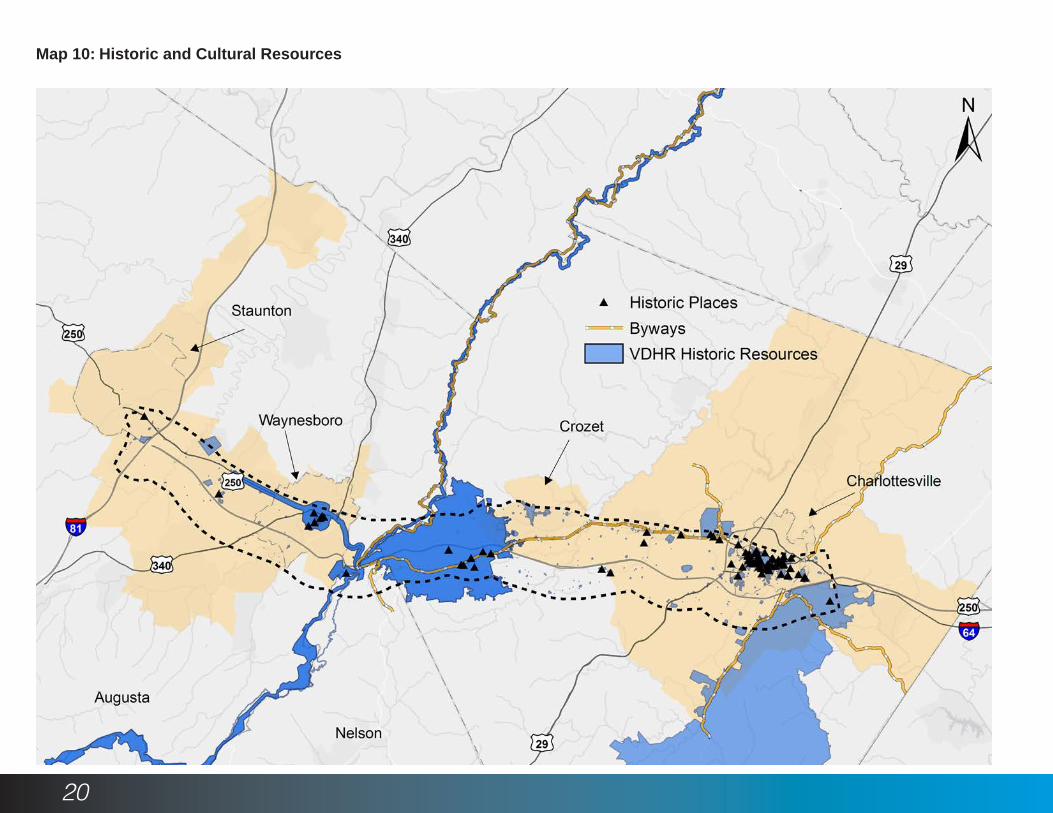
Historic and Cultural Resources
For the purposes of the I-64 corridor study, geographic data on historic and cultural resources was gathered from the Virginia Department of Historic Resource and the Virginia Department of Transportation. Datasets used in evaluating potential corridor impacts included; historic places, historic resources, archaeological resources and National Scenic Byways. Planning analyses involved mapping the cultural and historic assets and determining if any project recommendations had the potential to impact any listed resources.
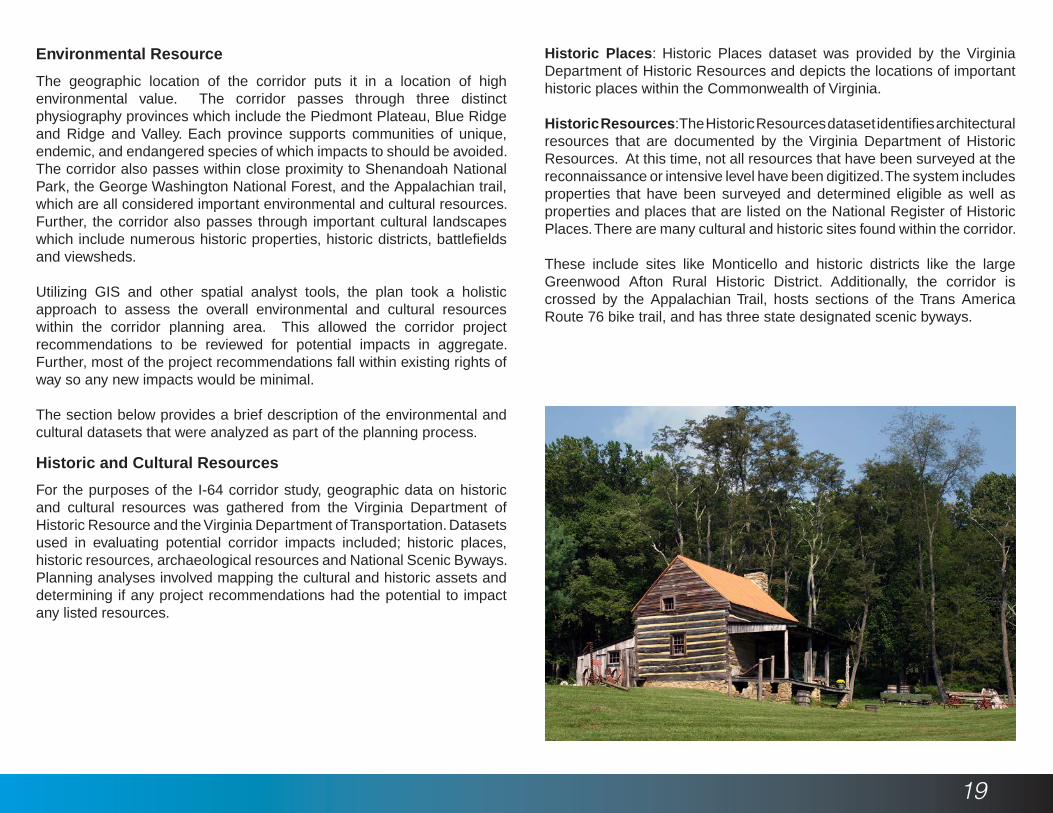
Historic Places: Historic Places dataset was provided by the Virginia Department of Historic Resources and depicts the locations of important historic places within the Commonwealth of Virginia.
Historic Resources: The Historic Resources dataset identifies architectural resources that are documented by the Virginia Department of Historic Resources. At this time, not all resources that have been surveyed at the reconnaissance or intensive level have been digitized. The system includes properties that have been surveyed and determined eligible as well as properties and places that are listed on the National Register of Historic Places. There are many cultural and historic sites found within the corridor. These include sites like Monticello and historic districts like the large Greenwood Afton Rural Historic District. Additionally, the corridor is crossed by the Appalachian Trail, hosts sections of the Trans America Route 76 bike trail, and has three state designated scenic byways.
20
Map 10: Historic and Cultural Resources
21
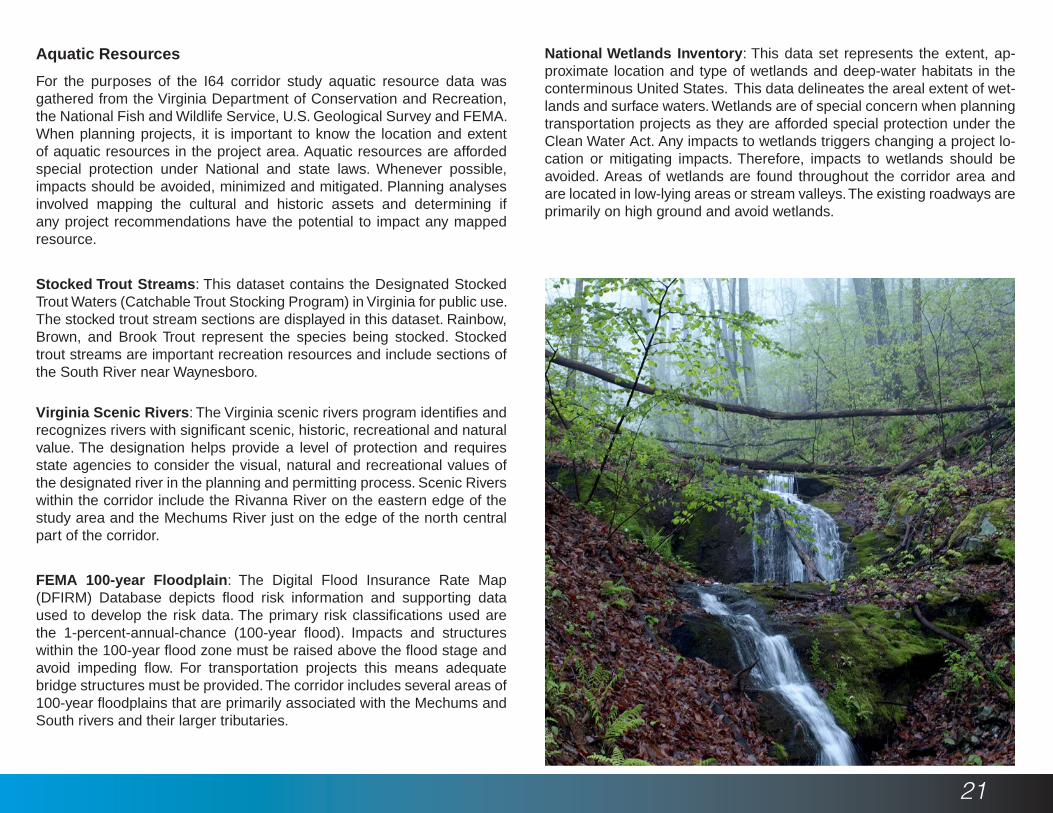
Aquatic Resources
For the purposes of the I64 corridor study aquatic resource data was gathered from the Virginia Department of Conservation and Recreation, the National Fish and Wildlife Service, U.S. Geological Survey and FEMA. When planning projects, it is important to know the location and extent of aquatic resources in the project area. Aquatic resources are afforded special protection under National and state laws. Whenever possible, impacts should be avoided, minimized and mitigated. Planning analyses involved mapping the cultural and historic assets and determining if any project recommendations have the potential to impact any mapped resource.
Stocked Trout Streams: This dataset contains the Designated Stocked Trout Waters (Catchable Trout Stocking Program) in Virginia for public use. The stocked trout stream sections are displayed in this dataset. Rainbow, Brown, and Brook Trout represent the species being stocked. Stocked trout streams are important recreation resources and include sections of the South River near Waynesboro.
Virginia Scenic Rivers: The Virginia scenic rivers program identifies and recognizes rivers with significant scenic, historic, recreational and natural value. The designation helps provide a level of protection and requires state agencies to consider the visual, natural and recreational values of the designated river in the planning and permitting process. Scenic Rivers within the corridor include the Rivanna River on the eastern edge of the study area and the Mechums River just on the edge of the north central part of the corridor.
FEMA 100-year Floodplain: The Digital Flood Insurance Rate Map (DFIRM) Database depicts flood risk information and supporting data used to develop the risk data. The primary risk classifications used are the 1-percent-annual-chance (100-year flood). Impacts and structures within the 100-year flood zone must be raised above the flood stage and avoid impeding flow. For transportation projects this means adequate bridge structures must be provided. The corridor includes several areas of 100-year floodplains that are primarily associated with the Mechums and South rivers and their larger tributaries.
National Wetlands Inventory: This data set represents the extent, ap-proximate location and type of wetlands and deep-water habitats in the conterminous United States. This data delineates the areal extent of wet-lands and surface waters. Wetlands are of special concern when planning transportation projects as they are afforded special protection under the Clean Water Act. Any impacts to wetlands triggers changing a project lo-cation or mitigating impacts. Therefore, impacts to wetlands should be avoided. Areas of wetlands are found throughout the corridor area and are located in low-lying areas or stream valleys. The existing roadways are primarily on high ground and avoid wetlands.

22
Map 11: Aquatic Resources
23
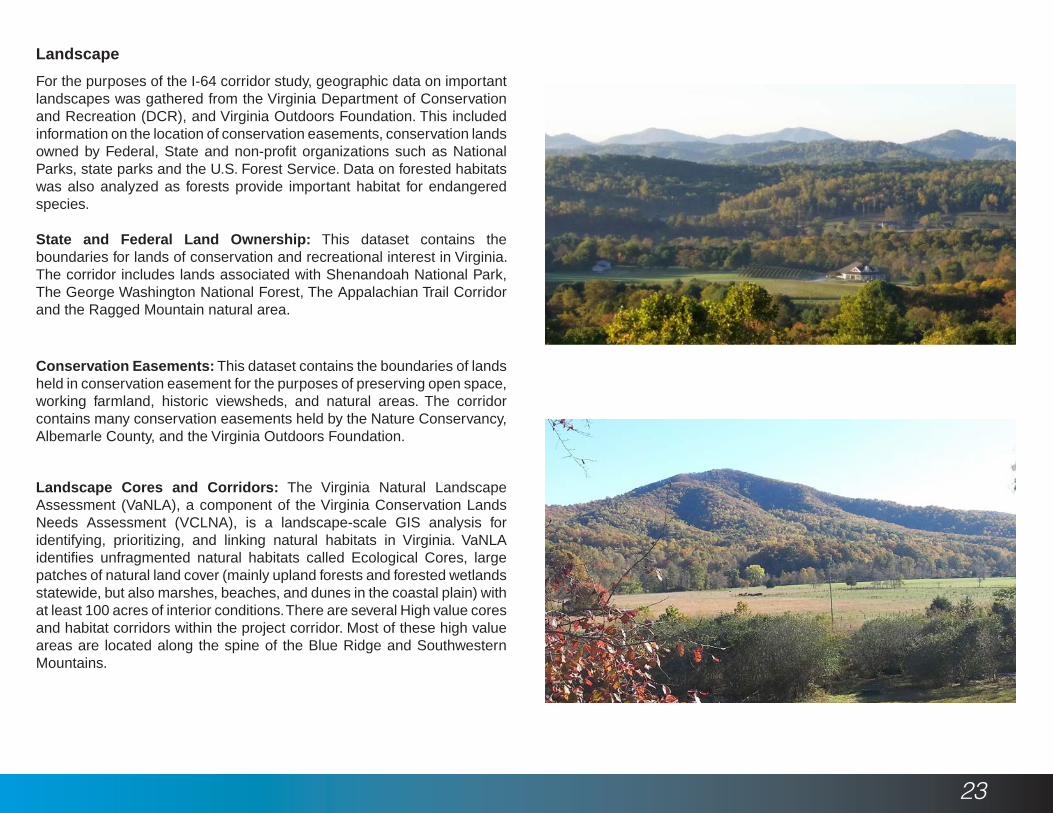
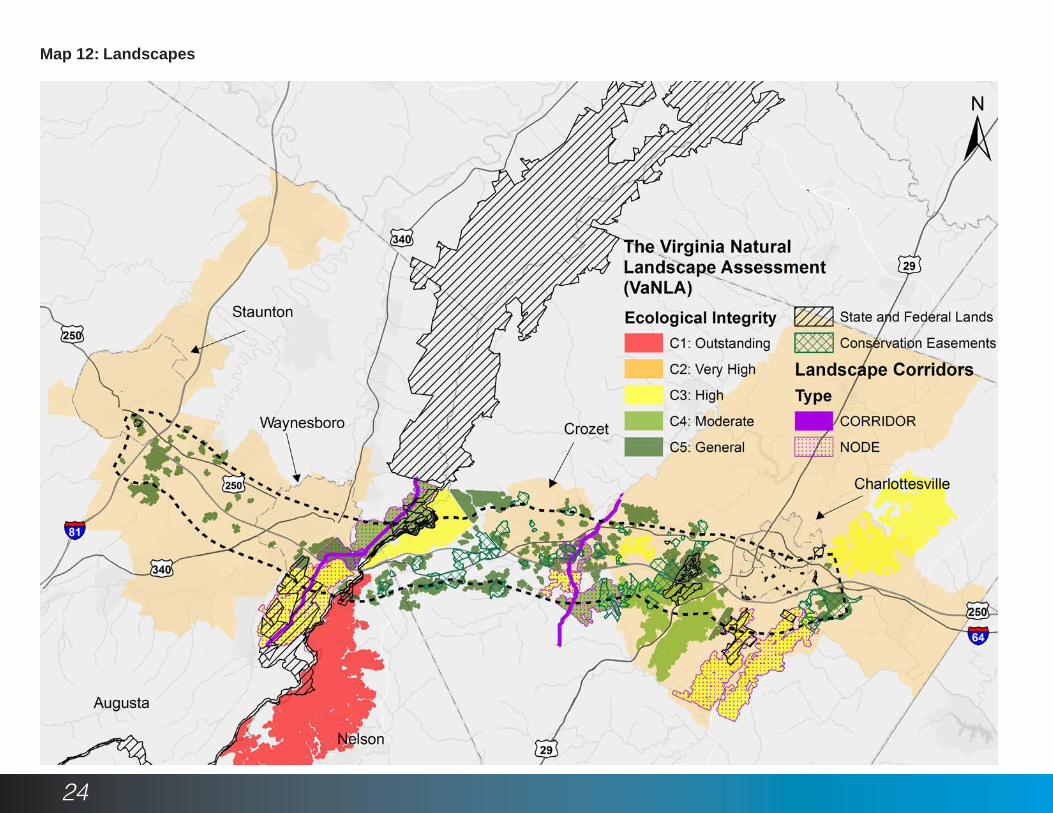
Landscape
For the purposes of the I-64 corridor study, geographic data on important landscapes was gathered from the Virginia Department of Conservation and Recreation (DCR), and Virginia Outdoors Foundation. This included information on the location of conservation easements, conservation lands owned by Federal, State and non-profit organizations such as National Parks, state parks and the U.S. Forest Service. Data on forested habitats was also analyzed as forests provide important habitat for endangered species.
State and Federal Land Ownership: This dataset contains the boundaries for lands of conservation and recreational interest in Virginia. The corridor includes lands associated with Shenandoah National Park, The George Washington National Forest, The Appalachian Trail Corridor and the Ragged Mountain natural area.
Conservation Easements: This dataset contains the boundaries of lands held in conservation easement for the purposes of preserving open space, working farmland, historic viewsheds, and natural areas. The corridor contains many conservation easements held by the Nature Conservancy, Albemarle County, and the Virginia Outdoors Foundation.
Landscape Cores and Corridors: The Virginia Natural Landscape Assessment (VaNLA), a component of the Virginia Conservation Lands Needs Assessment (VCLNA), is a landscape-scale GIS analysis for identifying, prioritizing, and linking natural habitats in Virginia. VaNLA identifies unfragmented natural habitats called Ecological Cores, large patches of natural land cover (mainly upland forests and forested wetlands statewide, but also marshes, beaches, and dunes in the coastal plain) with at least 100 acres of interior conditions. There are several High value cores and habitat corridors within the project corridor. Most of these high value areas are located along the spine of the Blue Ridge and Southwestern Mountains.
24
Map 12: Landscapes
25
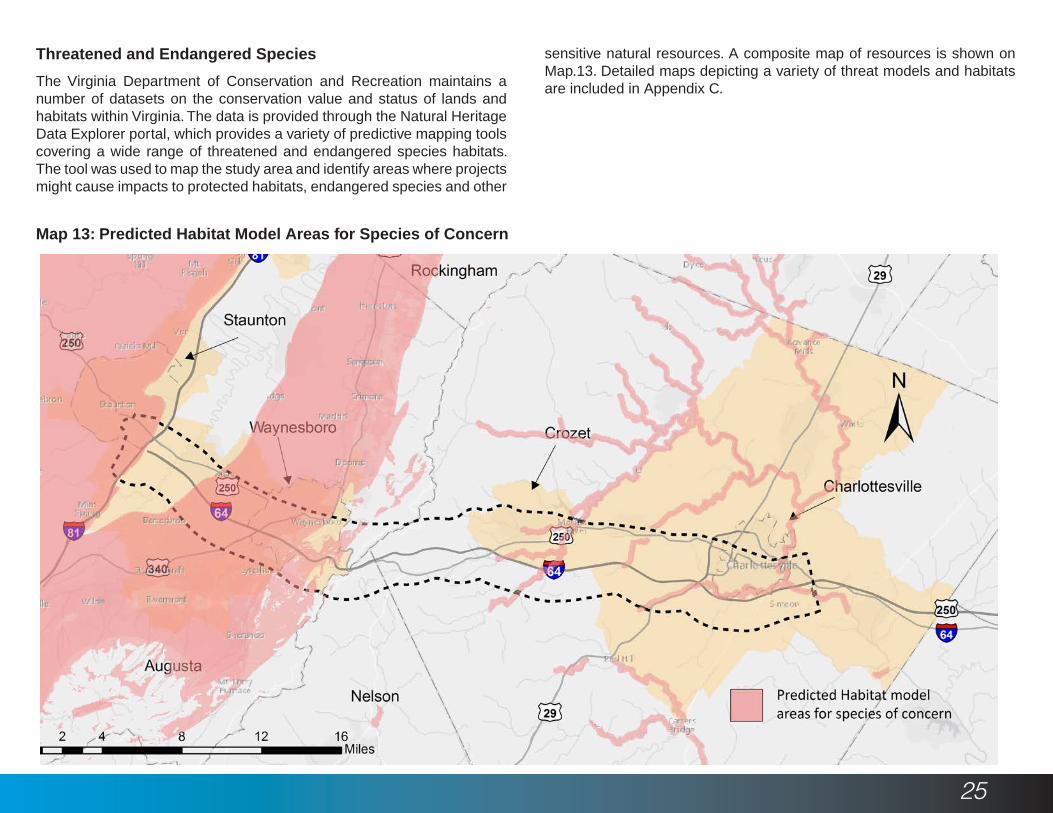
Threatened and Endangered Species
The Virginia Department of Conservation and Recreation maintains a number of datasets on the conservation value and status of lands and habitats within Virginia. The data is provided through the Natural Heritage Data Explorer portal, which provides a variety of predictive mapping tools covering a wide range of threatened and endangered species habitats. The tool was used to map the study area and identify areas where projects might cause impacts to protected habitats, endangered species and other
sensitive natural resources. A composite map of resources is shown on Map.13. Detailed maps depicting a variety of threat models and habitats are included in Appendix C.
Map 13: Predicted Habitat Model Areas for Species of Concern
26
SAFETY HOTSPOTS
This section focuses on identifying problematic areas, or hotspots, by analyzing the entire corridor from safety, congestion, maintenance, access, and growth perspectives. For each subsection, relevant indicators that can act as essential proxy for the current condition of the roadways are selected and analyzed.
The safety of the corridor is approached from crash frequency and animal-vehicle crashes perspective. Crash rates per vehicle miles traveled and concentration of animal-vehicle collisions are used as indicators respectively.
Crash rates
The Crash Rate is the number of crashes per vehicle exposure, and is expressed as a number of crashes per One Hundred Million Vehicle Miles Traveled. It is an important indicator to measure the relative safety at a particular location, and the susceptibility of a roadway segment for future crashes. The Crash Rate calculation takes into account total number of crashes in a 5-year period, length of the roadway segments, and the traffic volume based on the Average Annual Daily Traffic (AADT) data. The Federal Highway Administration Defines the formula as following:
R = Roadway Departure crash rate for the road segment expressed as crashes per 100 million vehicle-miles of travel,C = Total number of roadway departure crashes in the study periodV = Traffic volumes using Average Annual Daily Traffic (AADT) volumesN = Number of years of dataL = Length of the roadway segment in miles
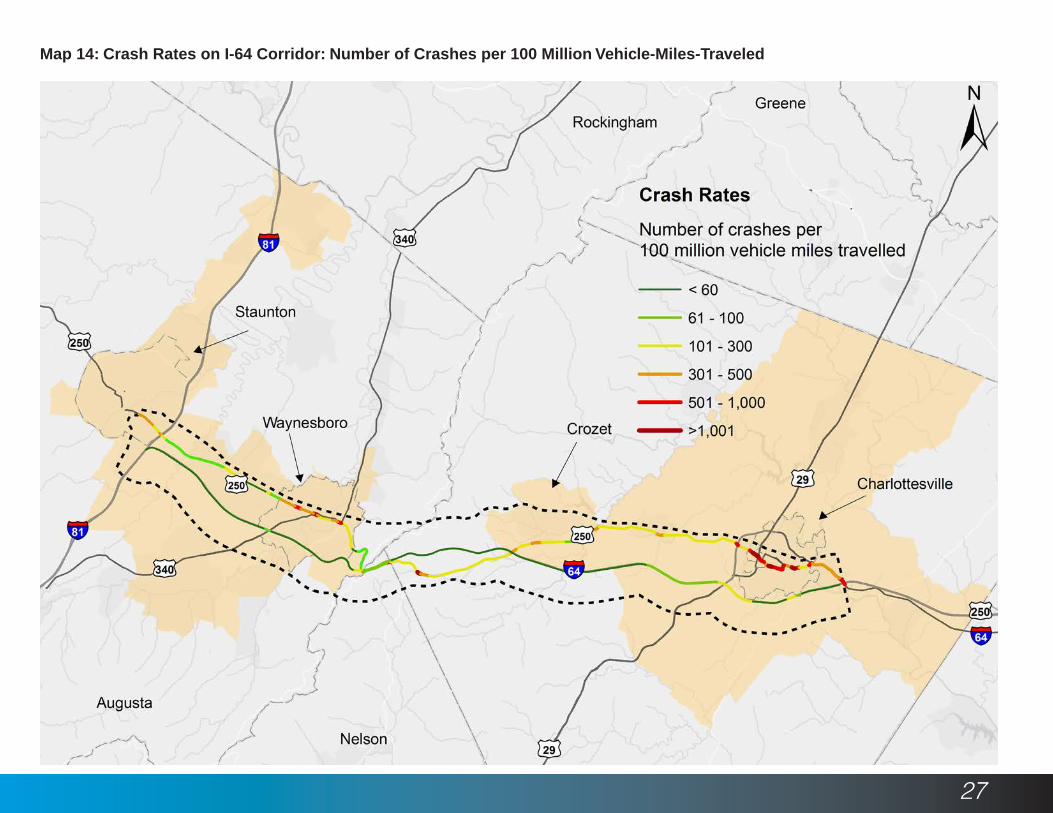
The Statewide Planning System (SPS) data for 2014 was used to calculate and map crash rates for I-64 and US 250 segments in the study area (see Map.14). The data analysis shows that I-64 Exit 124 at Pantops, US 250 Business, US 250 and US29 interchange, and US 250 and State Route151 intersection in the CA-MPO are the areas most susceptible
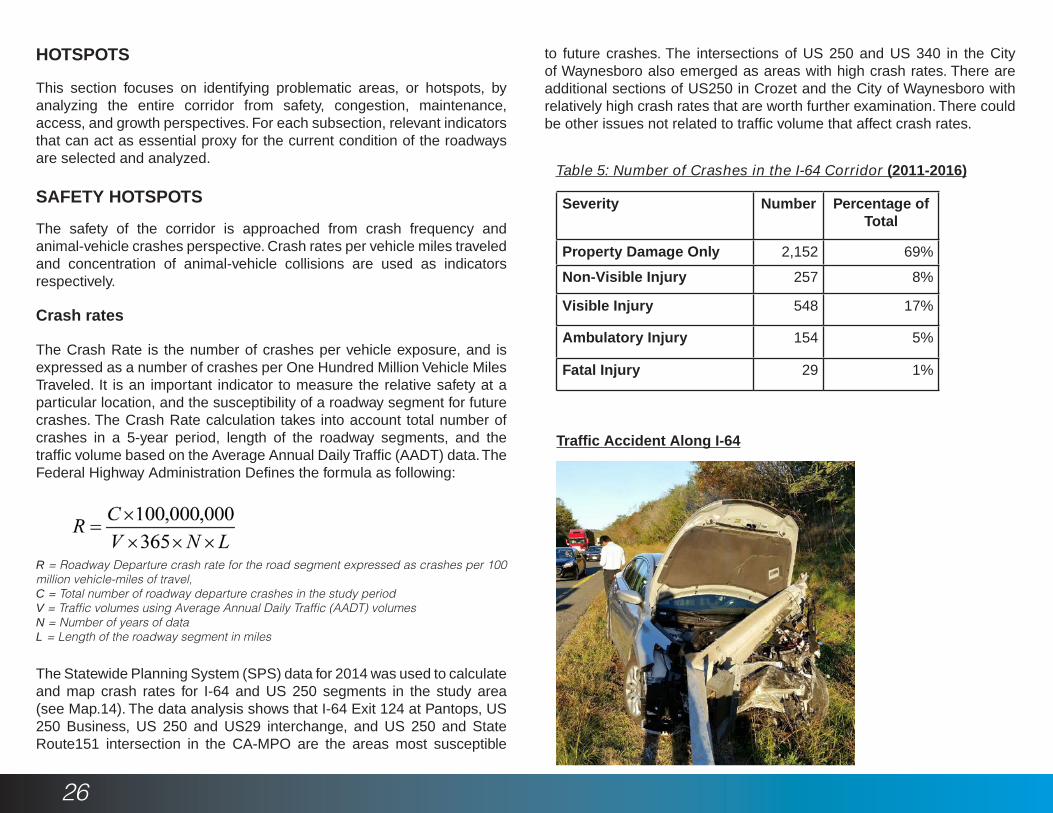
Traffic Accident Along I-64
HOTSPOTS to future crashes. The intersections of US 250 and US 340 in the City of Waynesboro also emerged as areas with high crash rates. There are additional sections of US250 in Crozet and the City of Waynesboro with relatively high crash rates that are worth further examination. There could be other issues not related to traffic volume that affect crash rates.
Table 5: Number of Crashes in the I-64 Corridor (2011-2016)
Severity Number Percentage of Total
Property Damage Only 2,152 69%
Non-Visible Injury 257 8%
Visible Injury 548 17%
Ambulatory Injury 154 5%
Fatal Injury 29 1%
27
Map 14: Crash Rates on I-64 Corridor: Number of Crashes per 100 Million Vehicle-Miles-Traveled

28
Vehicle - Wildlife Crashes
Vehicle-wildlife collisions account for a high percentage of total crashes in the I-64 corridor area. Virginia Transportation Research Council (VTRC) conducted a study that identified vehicle-wildlife crashes as one of the main causes of crashes in the corridor. Using carcass count data, the study author was able to identify significant under-counting of wildlife crashes in the official crash statistics.
According to official crash records, vehicle-wildlife crashes account for approximately one in six collisions along the I-64 corridor. However, the deer crashes account for 53% of all crashes if VDOT animal carcass removal data is used for calculation.
The TJPDC conducted an analysis on I-64 segments within the corridor
Map 15: Vehicle - Wildlife Crash Density in I-64 Corridor
to identify areas with a high number of vehicle-wildlife crashes using the VDOT Animal Carcass Removal data. As shown on the following map, Afton Mountain (from mile marker 95 to103) is a high crash area for vehicle-wildlife crashes.
The VTRC study also presented the existing and potential measures of mitigation, such as wildlife underpasses and overpasses with fencing. Map.15 presents the locations of two pilot projects designed to study the effectiveness of wildlife fencing. Current data indicated that the fencing projects have reduced vehicle wildlife crashes to near zero. The report also suggests potential locations for deploying similar types of additional facilities within the corridor. These additional fencing and crossings are discussed in the recommendations section.
29
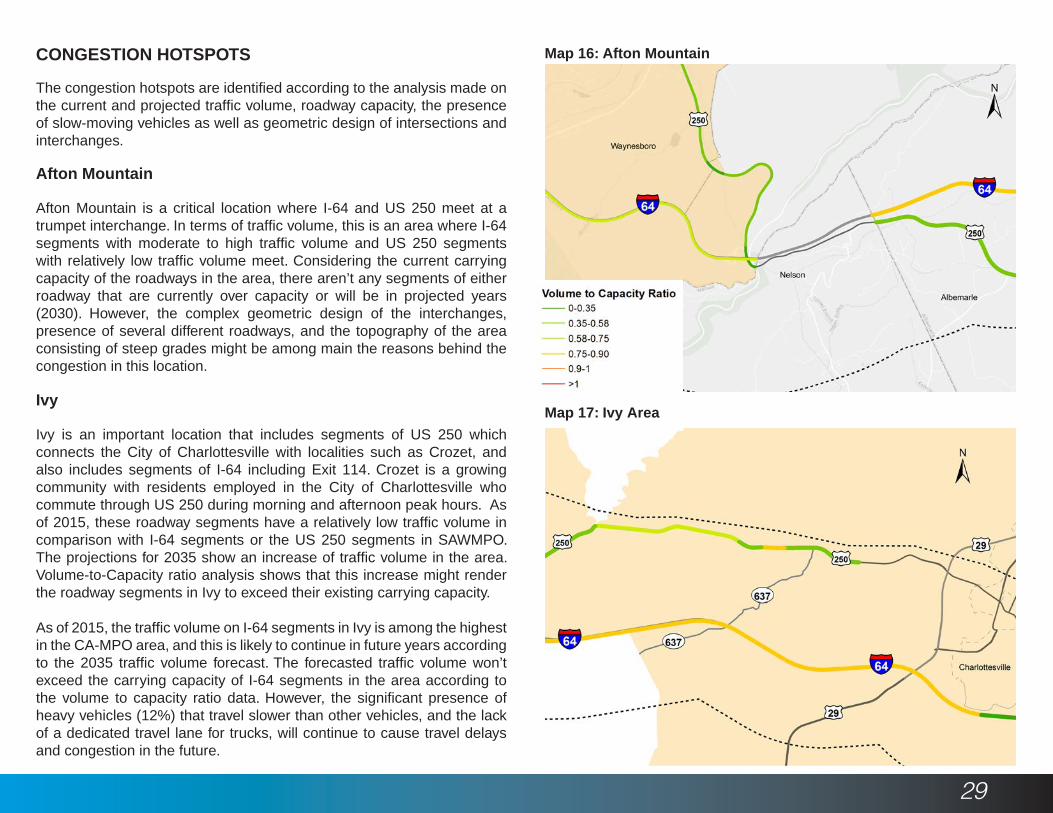
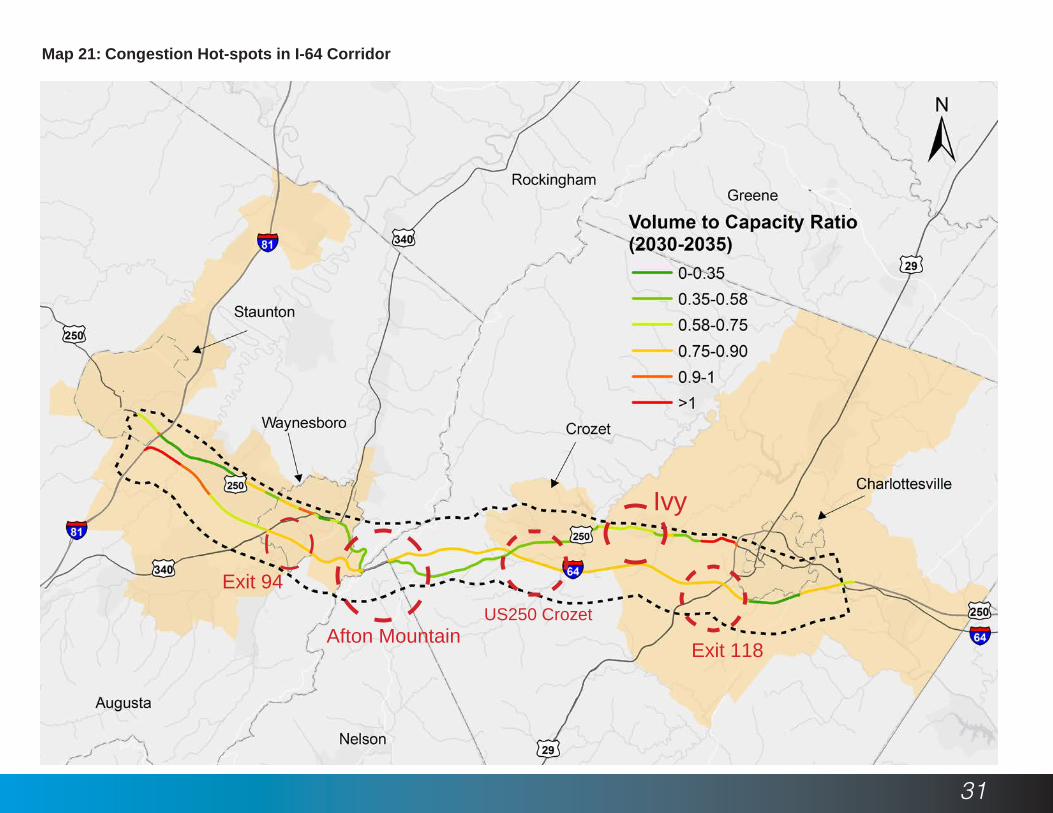
Afton Mountain is a critical location where I-64 and US 250 meet at a trumpet interchange. In terms of traffic volume, this is an area where I-64 segments with moderate to high traffic volume and US 250 segments with relatively low traffic volume meet. Considering the current carrying capacity of the roadways in the area, there aren’t any segments of either roadway that are currently over capacity or will be in projected years (2030). However, the complex geometric design of the interchanges, presence of several different roadways, and the topography of the area consisting of steep grades might be among main the reasons behind the congestion in this location.
CONGESTION HOTSPOTS
Afton Mountain
The congestion hotspots are identified according to the analysis made on the current and projected traffic volume, roadway capacity, the presence of slow-moving vehicles as well as geometric design of intersections and interchanges.
Ivy is an important location that includes segments of US 250 which connects the City of Charlottesville with localities such as Crozet, and also includes segments of I-64 including Exit 114. Crozet is a growing community with residents employed in the City of Charlottesville who commute through US 250 during morning and afternoon peak hours. As of 2015, these roadway segments have a relatively low traffic volume in comparison with I-64 segments or the US 250 segments in SAWMPO. The projections for 2035 show an increase of traffic volume in the area. Volume-to-Capacity ratio analysis shows that this increase might render the roadway segments in Ivy to exceed their existing carrying capacity.
As of 2015, the traffic volume on I-64 segments in Ivy is among the highest in the CA-MPO area, and this is likely to continue in future years according to the 2035 traffic volume forecast. The forecasted traffic volume won’t exceed the carrying capacity of I-64 segments in the area according to the volume to capacity ratio data. However, the significant presence of heavy vehicles (12%) that travel slower than other vehicles, and the lack of a dedicated travel lane for trucks, will continue to cause travel delays and congestion in the future.
Ivy
Map 16: Afton Mountain
Map 17: Ivy Area
30
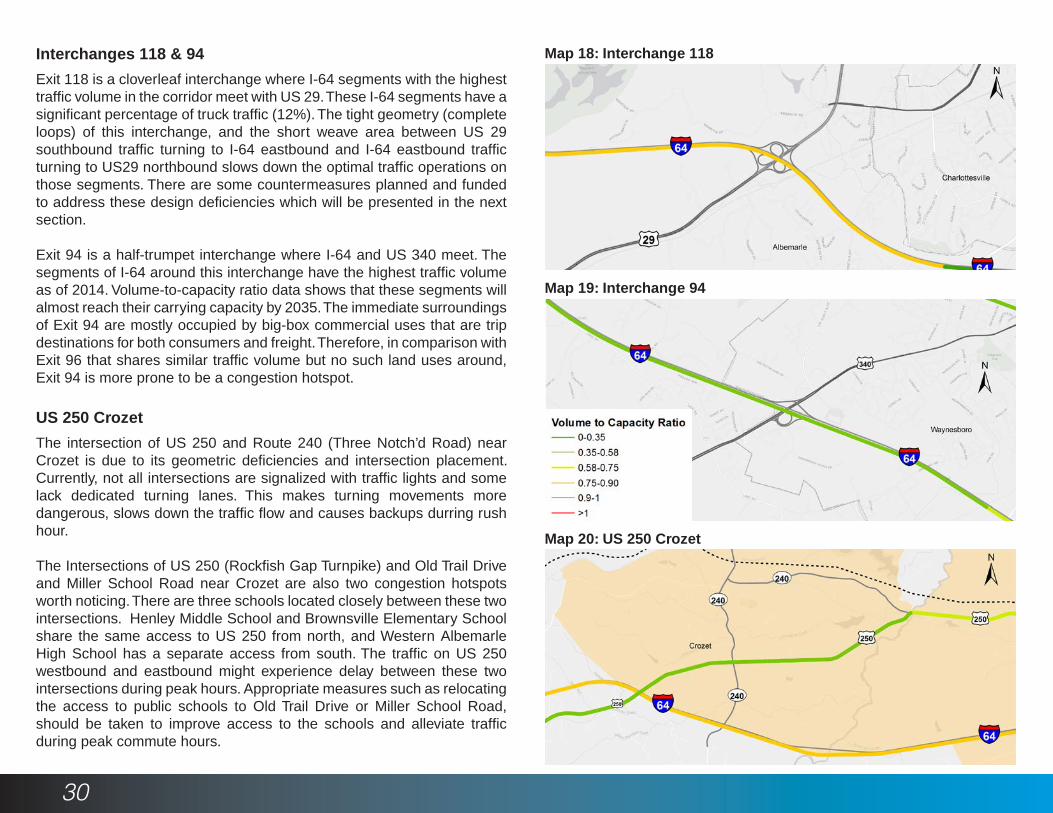
Exit 118 is a cloverleaf interchange where I-64 segments with the highest traffic volume in the corridor meet with US 29. These I-64 segments have a significant percentage of truck traffic (12%). The tight geometry (complete loops) of this interchange, and the short weave area between US 29 southbound traffic turning to I-64 eastbound and I-64 eastbound traffic turning to US29 northbound slows down the optimal traffic operations on those segments. There are some countermeasures planned and funded to address these design deficiencies which will be presented in the next section.
Exit 94 is a half-trumpet interchange where I-64 and US 340 meet. The segments of I-64 around this interchange have the highest traffic volume as of 2014. Volume-to-capacity ratio data shows that these segments will almost reach their carrying capacity by 2035. The immediate surroundings of Exit 94 are mostly occupied by big-box commercial uses that are trip destinations for both consumers and freight. Therefore, in comparison with Exit 96 that shares similar traffic volume but no such land uses around, Exit 94 is more prone to be a congestion hotspot.
Interchanges 118 & 94
US 250 Crozet
The intersection of US 250 and Route 240 (Three Notch’d Road) near Crozet is due to its geometric deficiencies and intersection placement. Currently, not all intersections are signalized with traffic lights and some lack dedicated turning lanes. This makes turning movements more dangerous, slows down the traffic flow and causes backups durring rush hour.
The Intersections of US 250 (Rockfish Gap Turnpike) and Old Trail Drive and Miller School Road near Crozet are also two congestion hotspots worth noticing. There are three schools located closely between these two intersections. Henley Middle School and Brownsville Elementary School share the same access to US 250 from north, and Western Albemarle High School has a separate access from south. The traffic on US 250 westbound and eastbound might experience delay between these two intersections during peak hours. Appropriate measures such as relocating the access to public schools to Old Trail Drive or Miller School Road, should be taken to improve access to the schools and alleviate traffic during peak commute hours.
Map 18: Interchange 118
Map 19: Interchange 94
Map 20: US 250 Crozet
31
Map 21: Congestion Hot-spots in I-64 Corridor
Ivy
Exit 118Afton Mountain
Exit 94
US250 Crozet
32
Recommendations
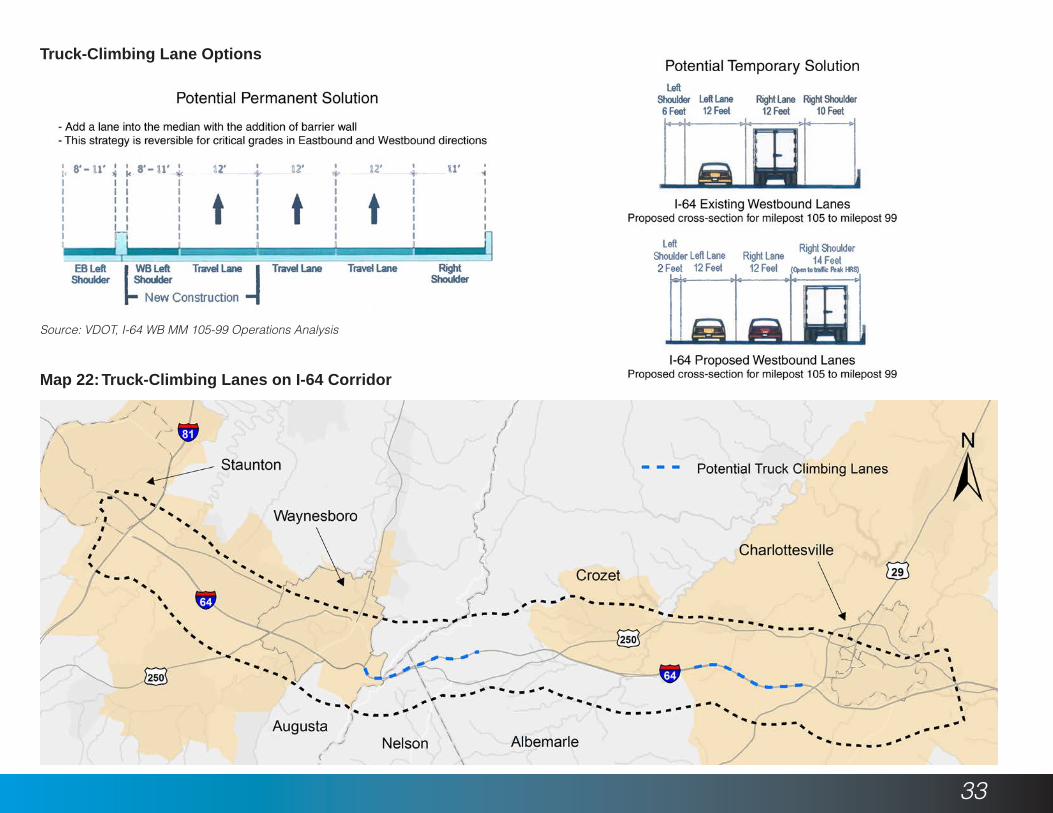
VDOT Freight Operations study on I-64 Westbound segments between mile marker 105 and 99 recommends the construction of a westbound truck-climbing lane for heavy vehicles on these segments. According to this study, the existing conditions of these highway segments meet the AASHTO criteria for truck-climbing lanes to be warranted. Specifically, the segments meet the Critical Length of Grade and Service Flow Volume criteria by having length of grade exceeding the critical length of grade and a service flow volume greater than 1,000 vehicles per hour per lane (vphpl) but less than 1,700 vphpl.
The Study suggests two potential solutions: a temporary solution, and a permanent solution. The temporary solution refers to the temporary use of highway shoulders for truck climbing or the use of shoulders for general purpose traffic with trucks using the existing left lane. The potential permanent solution is to add a lane into the median with the addition of a barrier wall.
The working group recommends that similar studies should be conducted for the I-64 segments between mile markers 113 and 119 in both directions.
I-64 Truck-climbing lanes
This chapter highlights a number of important project recommendations that if implemented will reduce congestion, improve safety, and enhance transportation options. The chapter provides details on select projects including information on location, type and actions. A full table of recommendations is included on page 42 and on Map.28. Several recommendations included in this plan are additional phases to ongoing projects, or projects that have been recently added to the Six Year Plan. These projects are included because of their importance to the overall performance of the corridor.
The SAWMPO included the Crozet Tunnel project in its Long-Range Transportation plan for 2040. The Crozet Blue Ridge Tunnel (western portal and access) is a mid-term project that aims for the complete restoration of the tunnel and improvement of the western approach to the tunnel. The project has received a total of $ 1,450,000 in TAP funding.
Crozet Tunnel connections
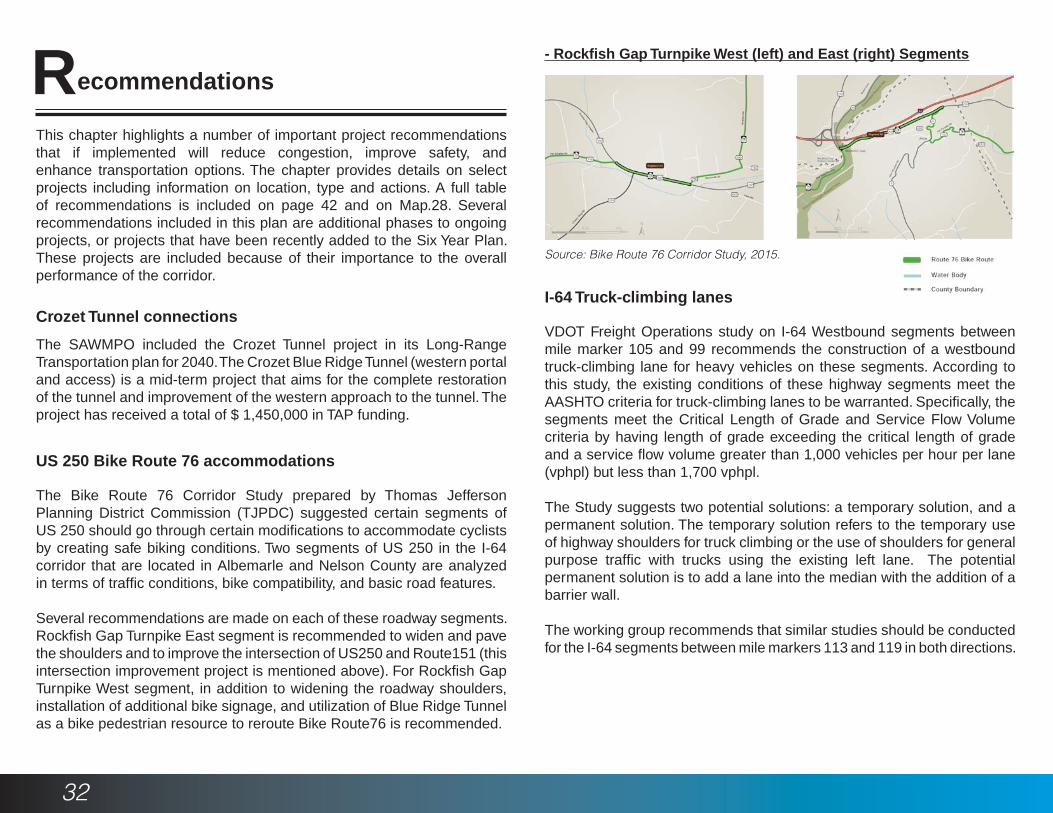
The Bike Route 76 Corridor Study prepared by Thomas Jefferson Planning District Commission (TJPDC) suggested certain segments of US 250 should go through certain modifications to accommodate cyclists by creating safe biking conditions. Two segments of US 250 in the I-64 corridor that are located in Albemarle and Nelson County are analyzed in terms of traffic conditions, bike compatibility, and basic road features.
Several recommendations are made on each of these roadway segments. Rockfish Gap Turnpike East segment is recommended to widen and pave the shoulders and to improve the intersection of US250 and Route151 (this intersection improvement project is mentioned above). For Rockfish Gap Turnpike West segment, in addition to widening the roadway shoulders, installation of additional bike signage, and utilization of Blue Ridge Tunnel as a bike pedestrian resource to reroute Bike Route76 is recommended.
US 250 Bike Route 76 accommodations
- Rockfish Gap Turnpike West (left) and East (right) Segments
Source: Bike Route 76 Corridor Study, 2015.
33
Source: VDOT, I-64 WB MM 105-99 Operations Analysis
Map 22: Truck-Climbing Lanes on I-64 Corridor
Truck-Climbing Lane Options

34
The US 250 and Route151 intersection is currently a T-shaped, high traffic intersection located in western Albemarle county. This improvement project will install a roundabout at the intersection to address safety issues dealing with geometric deficiencies. This $5.8 million project is part of TJPDC’s Rural Long-range Transportation Plan of 2035 and funded through Smart Scale in July 2017 with estimated delivery in 2027. The project is currently in its design phase. In April 2017, as an intermediate measure, a temporary traffic signal was installed at the intersection.
US 250 and Route 151 Intersection Improvements Interchange Improvements
In addition to the interchange improvement at Exit 118, several areas previously identified as congestion and safety hotspots also need appropriate measures to address deficiencies. Such interchanges include Exit 94 in Waynesboro, Exit 120 in Charlottesville, and Exit 124 at Pantops. The I-64 interchange at Exit 124 project involves increase of the capacity and rebuilding of the interchange to be safer for higher volumes of traffic. The Preliminary Engineering and Right-of-way acquisition of the project are estimated to cost $32,184,069; Interim Improvements are estimated at $1,157,999.
Map 23: Intersection and Interchange Improvements in I-64 Corridor
35
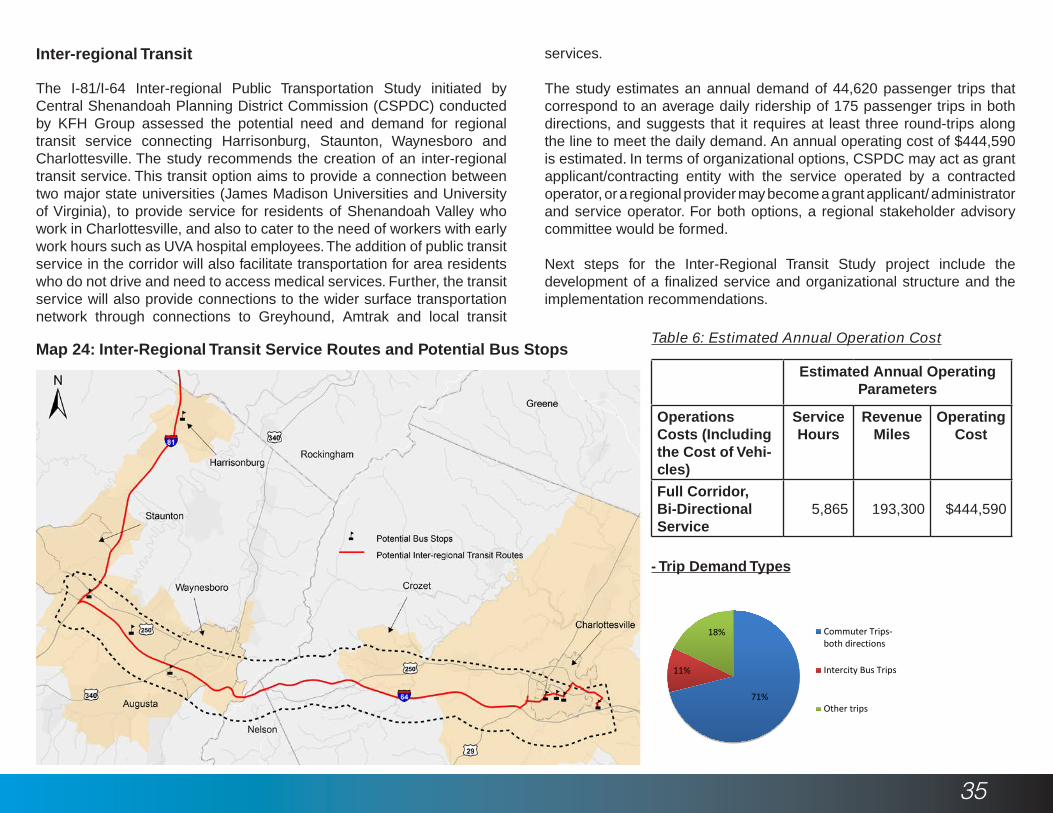
The I-81/I-64 Inter-regional Public Transportation Study initiated by Central Shenandoah Planning District Commission (CSPDC) conducted by KFH Group assessed the potential need and demand for regional transit service connecting Harrisonburg, Staunton, Waynesboro and Charlottesville. The study recommends the creation of an inter-regional transit service. This transit option aims to provide a connection between two major state universities (James Madison Universities and University of Virginia), to provide service for residents of Shenandoah Valley who work in Charlottesville, and also to cater to the need of workers with early work hours such as UVA hospital employees. The addition of public transit service in the corridor will also facilitate transportation for area residents who do not drive and need to access medical services. Further, the transit service will also provide connections to the wider surface transportation network through connections to Greyhound, Amtrak and local transit
Inter-regional Transit services.
The study estimates an annual demand of 44,620 passenger trips that correspond to an average daily ridership of 175 passenger trips in both directions, and suggests that it requires at least three round-trips along the line to meet the daily demand. An annual operating cost of $444,590 is estimated. In terms of organizational options, CSPDC may act as grant applicant/contracting entity with the service operated by a contracted operator, or a regional provider may become a grant applicant/ administrator and service operator. For both options, a regional stakeholder advisory committee would be formed.
Next steps for the Inter-Regional Transit Study project include the development of a finalized service and organizational structure and the implementation recommendations.
- Trip Demand Types
Estimated Annual Operating Parameters
Operations Costs (Including the Cost of Vehi-cles)
Service Hours
Revenue Miles
Operating Cost
Full Corridor, Bi-Directional Service
5,865 193,300 $444,590
71%
11%
18% Commuter Trips-both directions
Intercity Bus Trips
Other trips
Map 24: Inter-Regional Transit Service Routes and Potential Bus StopsTable 6: Estimated Annual Operation Cost
36
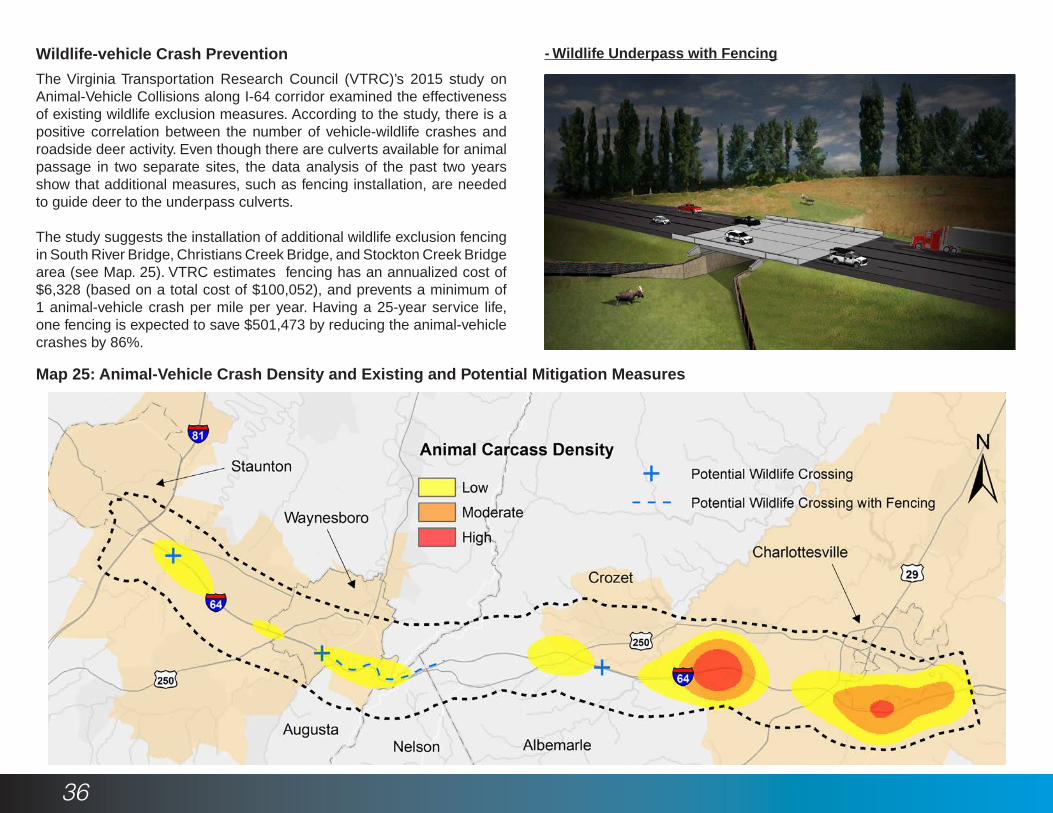
Wildlife-vehicle Crash Prevention
The Virginia Transportation Research Council (VTRC)’s 2015 study on Animal-Vehicle Collisions along I-64 corridor examined the effectiveness of existing wildlife exclusion measures. According to the study, there is a positive correlation between the number of vehicle-wildlife crashes and roadside deer activity. Even though there are culverts available for animal passage in two separate sites, the data analysis of the past two years show that additional measures, such as fencing installation, are needed to guide deer to the underpass culverts.
The study suggests the installation of additional wildlife exclusion fencing in South River Bridge, Christians Creek Bridge, and Stockton Creek Bridge area (see Map. 25). VTRC estimates fencing has an annualized cost of $6,328 (based on a total cost of $100,052), and prevents a minimum of 1 animal-vehicle crash per mile per year. Having a 25-year service life, one fencing is expected to save $501,473 by reducing the animal-vehicle crashes by 86%.
Map 25: Animal-Vehicle Crash Density and Existing and Potential Mitigation Measures
- Wildlife Underpass with Fencing
37
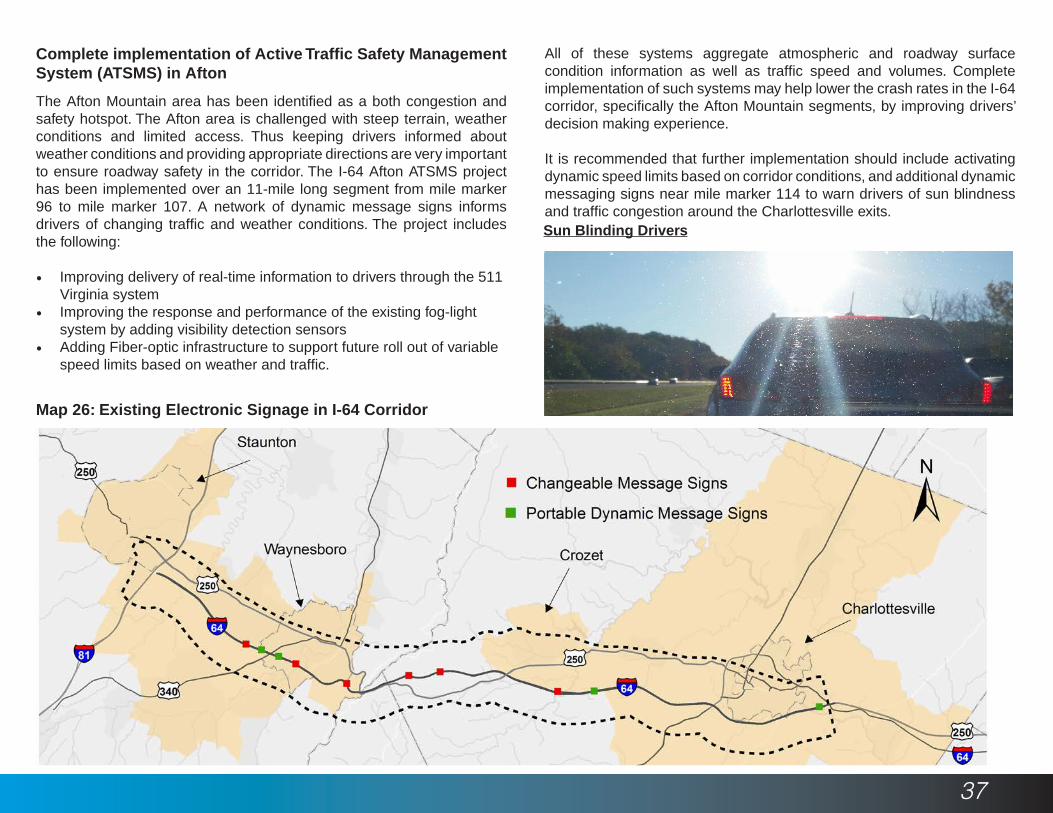
Complete implementation of Active Traffic Safety Management System (ATSMS) in Afton
The Afton Mountain area has been identified as a both congestion and safety hotspot. The Afton area is challenged with steep terrain, weather conditions and limited access. Thus keeping drivers informed about weather conditions and providing appropriate directions are very important to ensure roadway safety in the corridor. The I-64 Afton ATSMS project has been implemented over an 11-mile long segment from mile marker 96 to mile marker 107. A network of dynamic message signs informs drivers of changing traffic and weather conditions. The project includes the following:
• Improving delivery of real-time information to drivers through the 511 Virginia system
• Improving the response and performance of the existing fog-light system by adding visibility detection sensors
• Adding Fiber-optic infrastructure to support future roll out of variable speed limits based on weather and traffic.
Map 26: Existing Electronic Signage in I-64 Corridor
All of these systems aggregate atmospheric and roadway surface condition information as well as traffic speed and volumes. Complete implementation of such systems may help lower the crash rates in the I-64 corridor, specifically the Afton Mountain segments, by improving drivers’ decision making experience.
It is recommended that further implementation should include activating dynamic speed limits based on corridor conditions, and additional dynamic messaging signs near mile marker 114 to warn drivers of sun blindness and traffic congestion around the Charlottesville exits.Sun Blinding Drivers
38
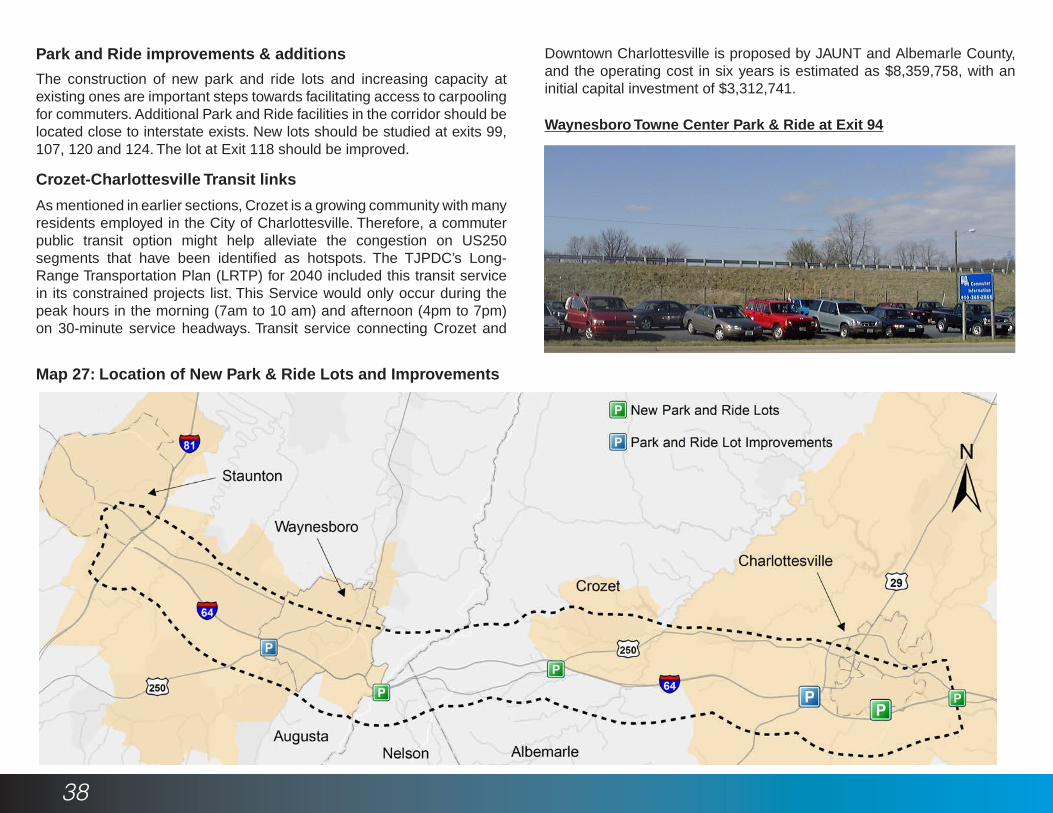
Park and Ride improvements & additions
The construction of new park and ride lots and increasing capacity at existing ones are important steps towards facilitating access to carpooling for commuters. Additional Park and Ride facilities in the corridor should be located close to interstate exists. New lots should be studied at exits 99, 107, 120 and 124. The lot at Exit 118 should be improved.
Crozet-Charlottesville Transit links
As mentioned in earlier sections, Crozet is a growing community with many residents employed in the City of Charlottesville. Therefore, a commuter public transit option might help alleviate the congestion on US250 segments that have been identified as hotspots. The TJPDC’s Long-Range Transportation Plan (LRTP) for 2040 included this transit service in its constrained projects list. This Service would only occur during the peak hours in the morning (7am to 10 am) and afternoon (4pm to 7pm) on 30-minute service headways. Transit service connecting Crozet and
Map 27: Location of New Park & Ride Lots and Improvements
Downtown Charlottesville is proposed by JAUNT and Albemarle County, and the operating cost in six years is estimated as $8,359,758, with an initial capital investment of $3,312,741.
Waynesboro Towne Center Park & Ride at Exit 94
39
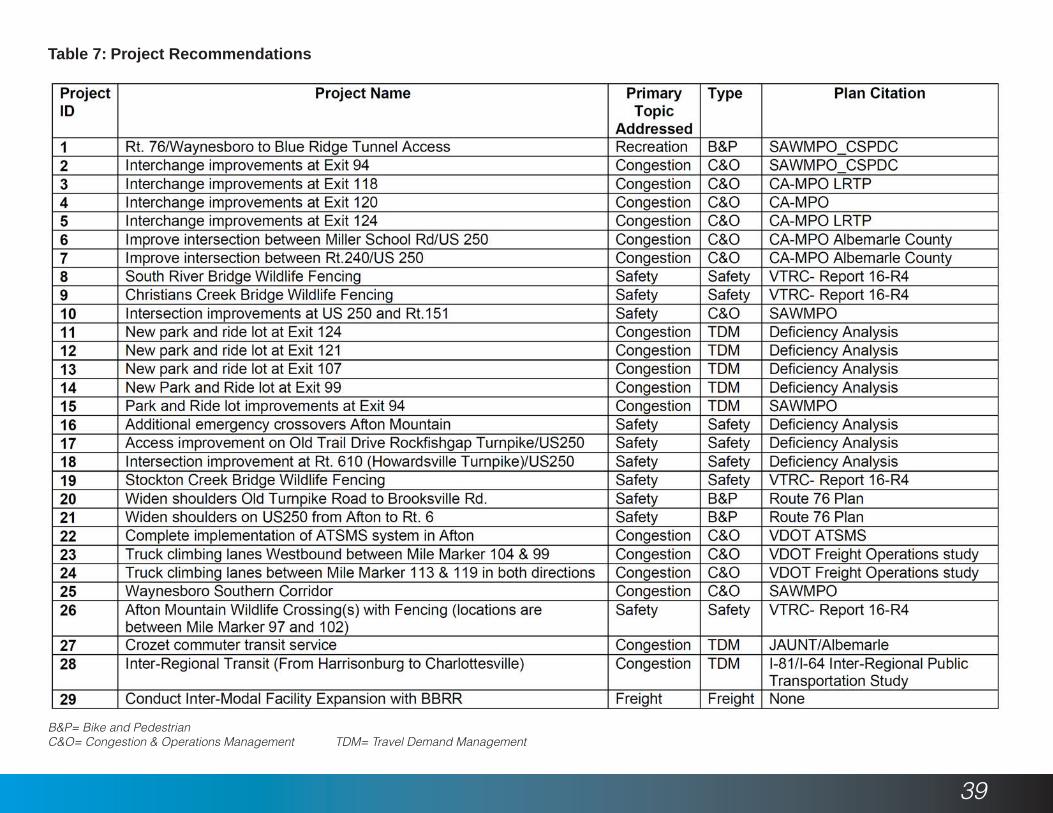
Table 7: Project Recommendations
B&P= Bike and Pedestrian C&O= Congestion & Operations Management TDM= Travel Demand Management
40
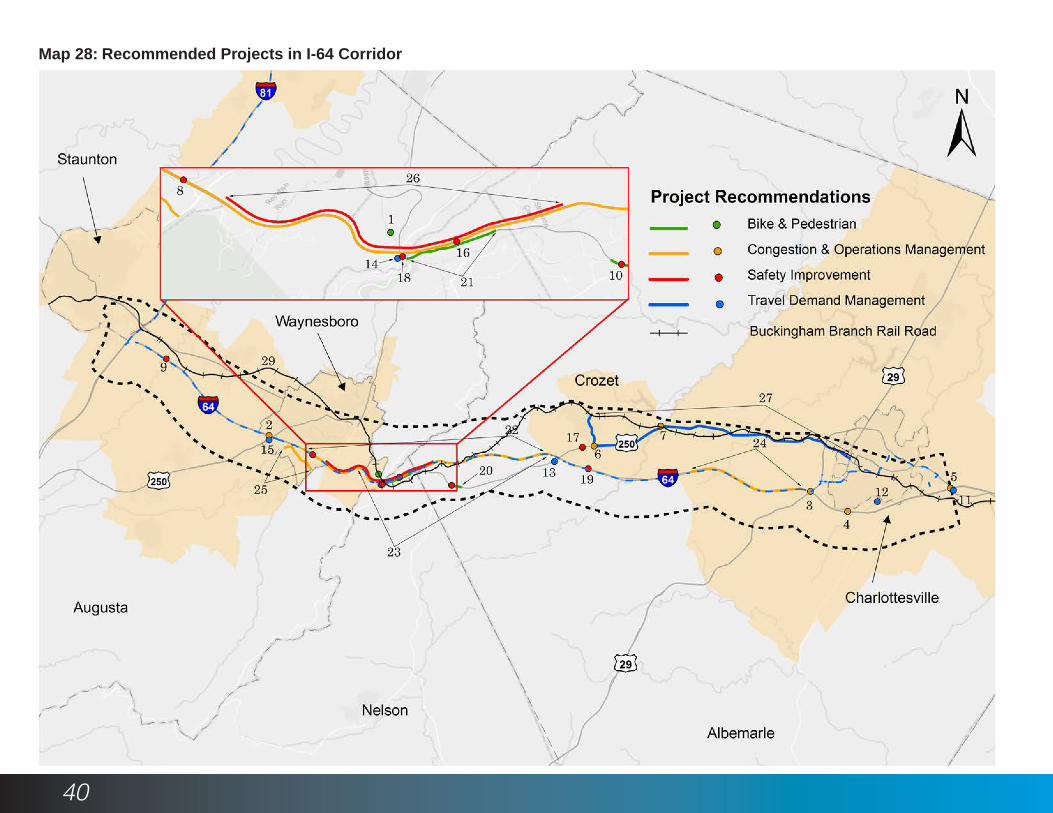
Map 28: Recommended Projects in I-64 Corridor
41
IMPLEMENTATION
There are several opportunities to implement recommendations form the plan. For projects requiring funding they can go through the Long-Range Transportation planning process and be added into the respective MPO or rural constrained list. In doing so, projects would become eligible for federal funding and could then go through the Virginia Smart Scale transportation funding prioritization process. Projects addressing a specific need related to safety can be funded through the Highway Safety Improvement Program (HSIP). Where projects addressing bike and pedestrian facilities can be funded through the Transportation Alternatives Program TAP.
Some project recommendations included in this plan have already begun to move forward. These include several projects that have been funded and placed onto the State’s six-year plan:
• Waynesboro Town Center Park and Ride Lot• Phase I of interchange improvements to exit 118• Intersection improvements at US-250 and State Route 240• Intersection improvements at US-250 and State Route 151
Several projects on the recommended projects list table (Table 6.) should be considered for Smart Scale Round 3 funding. These projects are:
Park and Ride facilities at exit 107 and 114Study the feasibility of adding park and ride lots within close proximity to the interstate exist. Lots should be sized appropriately and be designed to easily accommodate future transit service. It is recommended that where possible the new lots be located within existing rights-of-way.
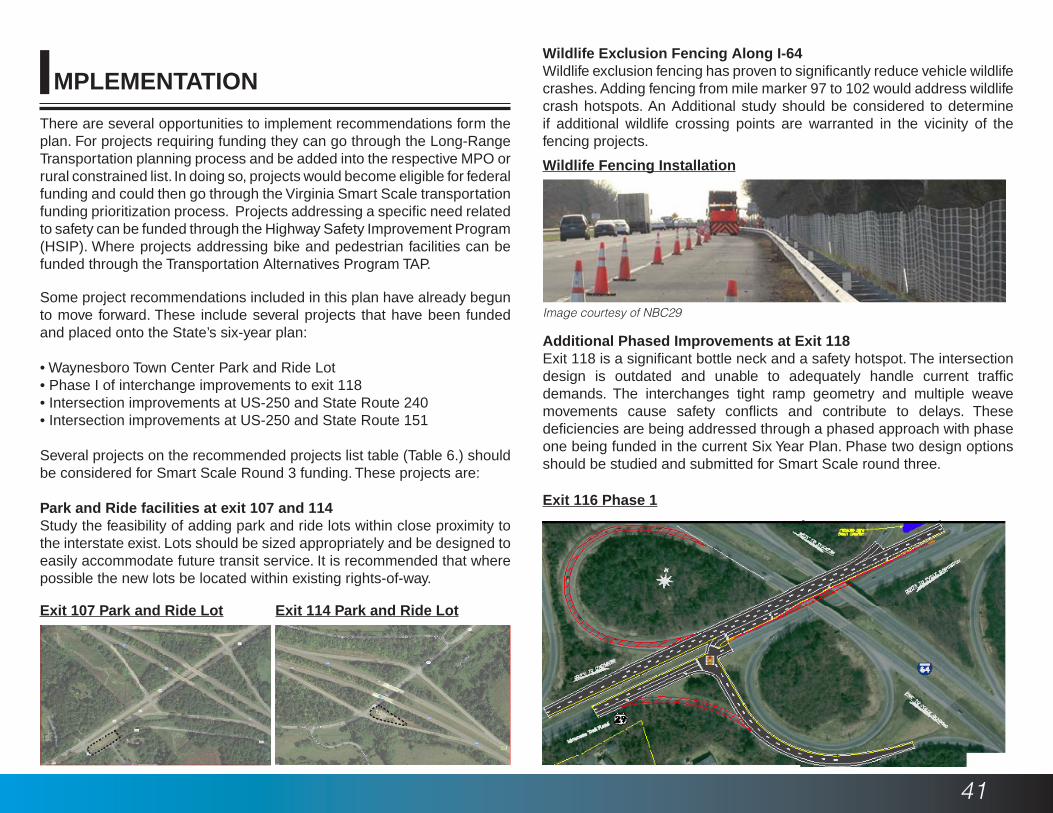
Wildlife Exclusion Fencing Along I-64Wildlife exclusion fencing has proven to significantly reduce vehicle wildlife crashes. Adding fencing from mile marker 97 to 102 would address wildlife crash hotspots. An Additional study should be considered to determine if additional wildlife crossing points are warranted in the vicinity of the fencing projects.
Additional Phased Improvements at Exit 118Exit 118 is a significant bottle neck and a safety hotspot. The intersection design is outdated and unable to adequately handle current traffic demands. The interchanges tight ramp geometry and multiple weave movements cause safety conflicts and contribute to delays. These deficiencies are being addressed through a phased approach with phase one being funded in the current Six Year Plan. Phase two design options should be studied and submitted for Smart Scale round three.
Exit 116 Phase 1
Wildlife Fencing Installation
Image courtesy of NBC29
Exit 107 Park and Ride Lot Exit 114 Park and Ride Lot