singapore property weekly issue 153.pdf
TRANSCRIPT

ContributeDo you have articles and insights and articles that you’d like to share with thousands of readers interested in the Singapore property market? Send them to us at [email protected], and if they’re good enough, we’ll publish them here, on our blog and even on Yahoo! News.
AdvertiseWant to get your brand, product, service or property listing out to thousands of Singapore property investors at a very reasonable cost? Head over to www.propwise.sg/advertise/ to find out more.
CONTENTS
p2 The “Resurrection” of Property Prices
p6 Singapore Property News This Week
p12 Resale Property Transactions
(April 7 – April 15)
Welcome to the 153th edition of the Singapore Property Weekly.
Hope you like it!
Mr. Propwise
FROM THE
EDITOR
SINGAPORE PROPERTY WEEKLY Issue 153
Page | 2Back to Contents
By Property Soul (guest contributor)
The Easter holiday celebrates the
resurrection of Jesus Christ from death on the
third day, a critical belief in Christianity. By
coincidence, this past Easter also marked the
“resurrection” of the purchase price for a
private property bought in the mid-1990s by a
friend of my father-in-law, i.e. the current
market prices have finally recovered to the
level that he bought it at.
I am not surprised that it took him almost 20
years to break-even. I just wonder how many
people are comfortable telling others how
long it took for their overpriced property to
“return to life” again.
The “Resurrection” of Property Prices
SINGAPORE PROPERTY WEEKLY Issue 153
Page | 3Back to Contents
Why the Property Price Index can be
deceiving
The URA‟s Property Price Index (PPI) shows
that the property price peak in the second
quarter of 1996 was surpassed by a new high
sometime in the middle of 2010. However, the
PPI is an index that only shows the average
price of all caveats lodged when buyers
exercise their Option to Purchase. It monitors
the general price movement of all private
residential properties, but hides all the
deviations from the average PPI.
PPI includes all the transacted units from
property new launches sold at „future prices‟
by the developers. It also encompasses
resale units from relatively new projects that
are able to sell at higher prices. There are
relatively few transactions from projects that
are 15, 20 years or even older. After all, with
so many new launches coming up every
quarter, who cares about such old
developments?
What goes up must come down
It is naïve to believe that prices can rise
indefinitely. The market never goes up or
down forever. It is destined to change course
at a certain point of time.
Nothing can defy the law of gravity: If you
drop a ball from a height, it will bounce back
from the ground and reach for the sky again.
And the higher it bounces, the nearer to the
point where you will see the ball falling again.
Forget the sales talk about how property
prices can only go up, how property investors
always prosper in the long-term, and how this
time is going to be different.
SINGAPORE PROPERTY WEEKLY Issue 153
Page | 4Back to Contents
The Japanese property bubble that burst in
the late 1980s started two lost decades (and
still counting). The question is: How long are
you prepared to wait to see the resurrection
of your purchase price?
How history repeats itself
Many people are asking: What will happen to
the Singapore property market?
If you want to understand the financial
markets and how it will turn out, don‟t study
economics or finance. You should delve into
history. For history doesn't only show you how
to read the present, it also tells you the future
from the past.
Don't just look at the name and date of a
historical event. Read the details. You will find
that there are many lessons to be learnt
because there are so many up and downs in
the history of the property industry.
If the history of Singapore is not long enough,
look outside the country. Look at what has
happened in the property markets in any
country in Asia, US or Europe.
If the property market has not given you too
many hints, you can look outside of real
estate to study the history of different market
bubbles. We have experienced many booms
in our history: the railway industry in the
1840s, the commodity market in the early
1970s, technology stocks in the late 1990s,
and the US housing market in the 2000s.
These booms all developed into speculative
manias, before they finally collapsed and
caused an economic upheaval.
SINGAPORE PROPERTY WEEKLY Issue 153
Page | 5Back to Contents
Technology evolves over time. Things change
in the long run. But the ignorance and greed
of human nature remain the same.
Once you understand the past, you can
explain why things are where they are now.
Once you know what is going on at present, it
is not difficult to tell what will happen in the
near future.
Stay calm, be intact
I am not a doomsayer. But please keep in
mind that:
When the market is hot, there is no need
to be too excited. Likewise, when the
market is gloomy, it is not necessary to
be too pessimistic.
Buy new launch projects before prices go up
again?
All overseas properties promise handsome
profit?
Any time is a good time to buy property?
Property prices will always go up?
Property is a safe investment for the long-
term?
Whenever you hear people making these
statements, you don't even bother to argue.
You can just keep quiet and smile.
By guest contributor Property Soul, a
successful property investor, blogger, and
author of the newly released No B.S. Guide to
Property Investment.
SINGAPORE PROPERTY WEEKLY Issue 153
Singapore Property This Week
Page | 6Back to Contents
Residential
100 of 131 units in The Sorrento sold
100 of the 131 units have been sold in The
Sorrento – a five-storey freehold
condominium on West Coast Road which
offers one-to three-bedroom units from 441 to
1,808 sq ft and is expected to be granted the
temporary occupation permit (TOP) in
1Q2015. The rapid sales were the result of
attractive prices ($1,380 to $1,600 psf) and
the sense of exclusivity offered through the
condo‟s small scale and freehold status.
Other developments such as Icon@Pasir
Panjang, Seasuites, Village@Pasir Panjang
and Whitehaven have also achieved
transacted prices of $1,600-1,700 psf.
(Source: Business Times)
11,000 Singaporean families purchased
exec condos from 4Q2010 to 4Q2013
According to Minister for National
Development Khaw Boon Wan, 11,000
Singaporean households purchased
executive condominiums (EC) from Q4 2010
to Q4 2013. Approximately 86 percent of the
buyers are HDB residents and 55 percent are
second-timer families. Due to the increase of
the income ceiling for ECs in 2011 – from
$10,000 to $12,000, there have been
changes in terms of EC buyers‟ profile over
SINGAPORE PROPERTY WEEKLY Issue 153
Page | 7Back to Contents
that one-year period, where the share of
second-timers increased from 43 percent to
57 percent and those aged from 35 to 44
increased from 35 percent to 43 percent.
(Source: Business Times)
HDB resale prices dropped 1.6% in Q1
2014
Resale prices of HDB flats have decreased
by 1.6 percent in Q1, with the number of
transactions falling 5 percent to 3,781,
making it the third consecutive quarter where
prices slid. According to ERA Realty,
government measures of reducing the
mortgage servicing ratio from 35 percent to
30 percent limited buyers from owning more
expensive flats. Furthermore, the minimum
three-year waiting period for newly minted
permanent residents before they can
purchase resale flats, the availability of two-
room build-to-order (BTO) flats for singles
and the cessation of reporting cash-over-
valuation (COV) held back market activities.
Due to the slowdown in resale activities, the
sub-letting market has seen improvement
where subletting transactions rose 17 percent
quarter-on-quarter in Q1 to 8,485.
(Source: Business Times)
Increase in foreigners’ proportion of home
purchases
Transactions of private home purchases in
Q1 dropped to 2,076 units, seeing
Singaporeans‟ share falling to 70 percent
from 73 percent in Q1 2013, PRs‟ share rising
to 19 percent from 16 percent in Q4 2013 and
foreigners‟ share – mainly coming from
mainland Chinese, Malaysians, Indonesians
and Indians – climbing up to 10 percent from
9 percent in Q4 2013.
SINGAPORE PROPERTY WEEKLY Issue 153
Page | 8Back to Contents
Due to the additional buyer‟s stamp duty and
the high home ownership rate, purchasing
activities among Singaporeans have slowed
down, while with the regulation that new PRs
must wait for three years before being
allowed to purchase public flats, those who
are in urgent need of accommodation started
setting their eyes on the private housing
market.
(Source: Business Times)
51 percent of units purchased by HDB
owners were below 800 sq ft
A total of 892 non-landed private homes were
purchased by HDB owners in Q1 2014, 453
units or 51 percent of which were of areas of
up to 800 sq ft, showing an increase from 44
percent in 2013. On the contrary, in terms of
the equivalent area, merely 29 percent of the
1,014 non-landed private homes were
acquired by private home owners. Smaller
units are preferable among those with HDB
addresses as the required investment sum is
more affordable and they can benefit from the
progressive payment scheme if they buy in
the primary market, where 581 units or 65
percent of the total 892 private homes were
purchased from developers in Q1.
(Source: Business Times)
0.7 percent drop in private residential
rentals quarter-on-quarter in 1Q2014
On a quarter-on-quarter basis, private
housing rentals fell 0.7 percent for the second
consecutive quarter, as a consequence of the
growth in completed private homes, more
restriction on foreign tenants in Singapore
and a stricter property tax system. Private
residential completions are estimated to
reach 17,138 units in 2014, higher than the
SINGAPORE PROPERTY WEEKLY Issue 153
Page | 9Back to Contents
13,150 units in 2013, whereas demand will
not match this supply due to tighter
regulations on hiring foreign executives.
Additionally, a stricter property tax policy took
effect from Jan 1, 2014, stating that landlords
can no longer claim vacancy refunds on
property tax. Overall, consultants estimate a
5-10 percent dip in private housing rentals for
the full year.
(Source: Business Times)
Commercial
Lian Beng purchases 70,000 sq ft at 24
Leng Kee Road for $46.2m
A site of approximately 70,000 sq ft at 24
Leng Kee Road has been purchased by Lian
Beng Group for $46.2m. It is expected that
the area will be developed to prepare for the
entry to the automotive business of Wealth
Assets Pte Ltd – a joint venture company
between Lian Beng Group and parallel
importer Vincar. The tender attracted around
a dozen bidders as the Leng Kee
Road/Alexandra Road area is regarded as
Singapore‟s key auto belt.
(Source: Business Times)
15% increase in Singapore’s office rents
this year
Office rents in Singapore are anticipated to
increase to 15 percent this year owing to the
rise in demand, where international
companies such as Cargill Inc and Bordier &
Cie are having their offices in the central
business district. Additionally, landlords are
getting more bargaining power due to the lack
of completed developments in 2015 and the
increase in office occupancy rates – which,
SINGAPORE PROPERTY WEEKLY Issue 153
Page | 10Back to Contents
according to DTZ, rose to 95.1 percent from
the last quarter. Compared to the previous
quarter, rents in Marina Bay area rose by 4.5
percent, while compared to the same period
in 2012, rents in the central business district
increased by 8.4 percent in 4Q2013.
(Source: Business Times)
Two units in Orchard Towers and one unit
in Marine Parade for sale
Two commercial units in Orchard Towers and
one in Marine Parade Central are open for
sale, with no advanced indicative prices but
guiding prices from sales of shops nearby.
The freehold units in Orchard Towers occupy
a strata area of approximately 8,105 sq ft,
covering the ground floor and the basement.
A third-floor unit in Orchard Towers was sold
for $6,636 psf last year. With 62 years
remaining on the lease, the unit in Marine
Parade Central occupies a strata area of
about 25,833 sq ft over the ground and
second floors of Block 87. Sales of ground
floor and basement shops in nearby The Flow
ranged from $4,008 to $5,789 psf during the
past nine months.
(Source: Business Times)
Retail rentals in Central Region showed
0.3 percent drop: URA
According to the Urban Redevelopment
Authority (URA)‟s data, there was a decline of
0.3 percent in rentals at retail malls in the
Central Region, covering retailers and non-
shop space such as food and beverage,
entertainment, and health and fitness in the
downtown area and city fringe.
SINGAPORE PROPERTY WEEKLY Issue 153
Page | 11Back to Contents
However, skepticism about the index‟s
reliability was raised as according to several
retailers, rentals have significantly increased
in the past three years. URA‟s data set may
not have captured the full scene as it does
not look at suburban malls in Jurong East,
Tampines and Bedok.
(Source: Business Times)
Annual supply of 2.1m sq m of industrial
space over the next three years
According to JTC Corp‟s data, there is an
average annual supply of industrial space of
2.1 million square metres (sq m) coming on-
stream over the next three years, of which 28
percent is multiple-user factory space, 37
percent is single-user factory space, 25
percent is warehouse space, and the rest
business park space. This is double of the
annual average demand. Concerns have
been raised as there is no dearth in industrial
space and the appropriate use of industrial
space needs to be restructured, in order to
capture more manufacturing companies.
(Source: Business Times)
SINGAPORE PROPERTY WEEKLY Issue 153
Page | 12Back to Contents
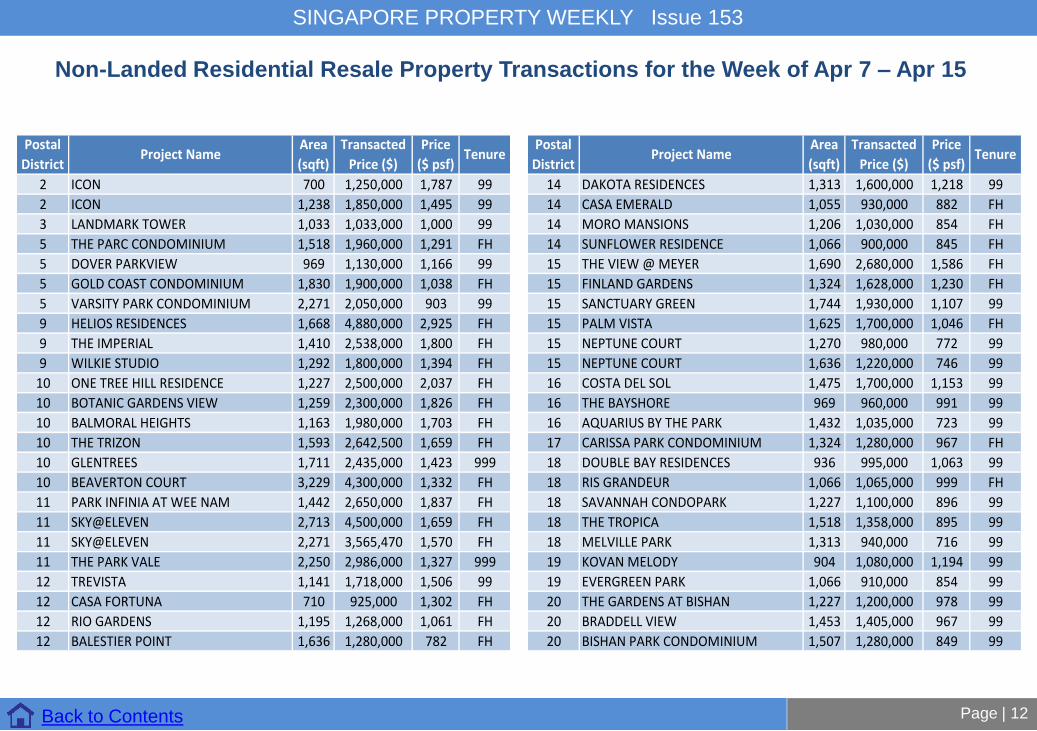
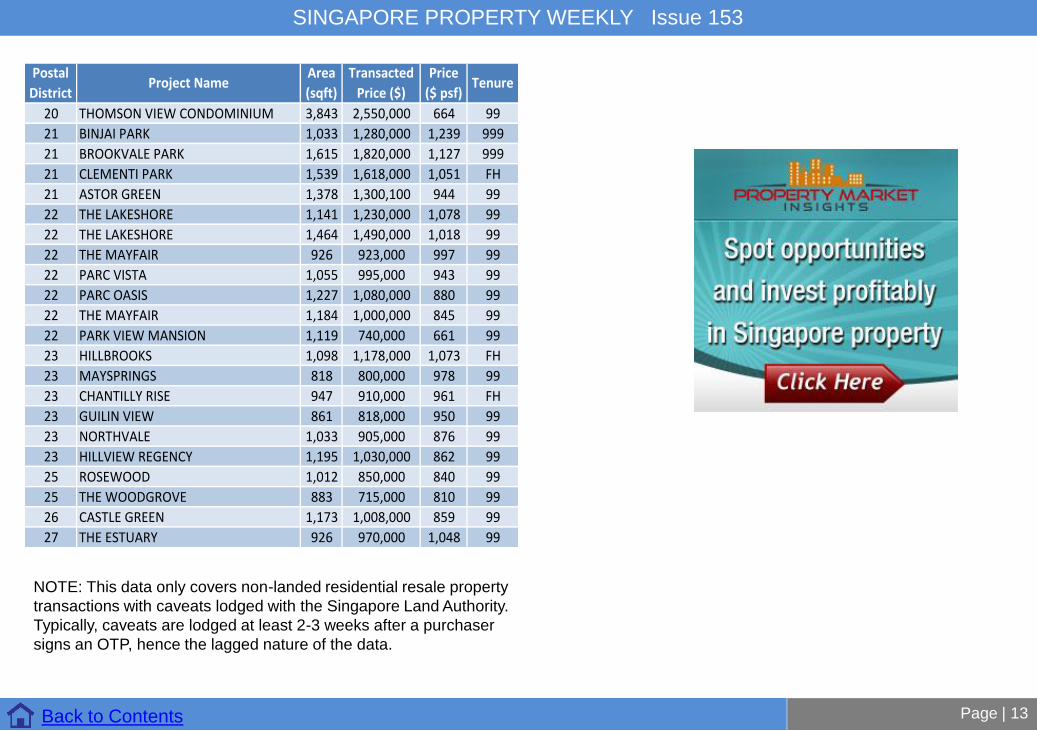
Non-Landed Residential Resale Property Transactions for the Week of Apr 7 – Apr 15
Postal
DistrictProject Name
Area
(sqft)
Transacted
Price ($)
Price
($ psf)Tenure
2 ICON 700 1,250,000 1,787 99
2 ICON 1,238 1,850,000 1,495 99
3 LANDMARK TOWER 1,033 1,033,000 1,000 99
5 THE PARC CONDOMINIUM 1,518 1,960,000 1,291 FH
5 DOVER PARKVIEW 969 1,130,000 1,166 99
5 GOLD COAST CONDOMINIUM 1,830 1,900,000 1,038 FH
5 VARSITY PARK CONDOMINIUM 2,271 2,050,000 903 99
9 HELIOS RESIDENCES 1,668 4,880,000 2,925 FH
9 THE IMPERIAL 1,410 2,538,000 1,800 FH
9 WILKIE STUDIO 1,292 1,800,000 1,394 FH
10 ONE TREE HILL RESIDENCE 1,227 2,500,000 2,037 FH
10 BOTANIC GARDENS VIEW 1,259 2,300,000 1,826 FH
10 BALMORAL HEIGHTS 1,163 1,980,000 1,703 FH
10 THE TRIZON 1,593 2,642,500 1,659 FH
10 GLENTREES 1,711 2,435,000 1,423 999
10 BEAVERTON COURT 3,229 4,300,000 1,332 FH
11 PARK INFINIA AT WEE NAM 1,442 2,650,000 1,837 FH
11 SKY@ELEVEN 2,713 4,500,000 1,659 FH
11 SKY@ELEVEN 2,271 3,565,470 1,570 FH
11 THE PARK VALE 2,250 2,986,000 1,327 999
12 TREVISTA 1,141 1,718,000 1,506 99
12 CASA FORTUNA 710 925,000 1,302 FH
12 RIO GARDENS 1,195 1,268,000 1,061 FH
12 BALESTIER POINT 1,636 1,280,000 782 FH
Postal
DistrictProject Name
Area
(sqft)
Transacted
Price ($)
Price
($ psf)Tenure
14 DAKOTA RESIDENCES 1,313 1,600,000 1,218 99
14 CASA EMERALD 1,055 930,000 882 FH
14 MORO MANSIONS 1,206 1,030,000 854 FH
14 SUNFLOWER RESIDENCE 1,066 900,000 845 FH
15 THE VIEW @ MEYER 1,690 2,680,000 1,586 FH
15 FINLAND GARDENS 1,324 1,628,000 1,230 FH
15 SANCTUARY GREEN 1,744 1,930,000 1,107 99
15 PALM VISTA 1,625 1,700,000 1,046 FH
15 NEPTUNE COURT 1,270 980,000 772 99
15 NEPTUNE COURT 1,636 1,220,000 746 99
16 COSTA DEL SOL 1,475 1,700,000 1,153 99
16 THE BAYSHORE 969 960,000 991 99
16 AQUARIUS BY THE PARK 1,432 1,035,000 723 99
17 CARISSA PARK CONDOMINIUM 1,324 1,280,000 967 FH
18 DOUBLE BAY RESIDENCES 936 995,000 1,063 99
18 RIS GRANDEUR 1,066 1,065,000 999 FH
18 SAVANNAH CONDOPARK 1,227 1,100,000 896 99
18 THE TROPICA 1,518 1,358,000 895 99
18 MELVILLE PARK 1,313 940,000 716 99
19 KOVAN MELODY 904 1,080,000 1,194 99
19 EVERGREEN PARK 1,066 910,000 854 99
20 THE GARDENS AT BISHAN 1,227 1,200,000 978 99
20 BRADDELL VIEW 1,453 1,405,000 967 99
20 BISHAN PARK CONDOMINIUM 1,507 1,280,000 849 99
SINGAPORE PROPERTY WEEKLY Issue 153
Page | 13Back to Contents
NOTE: This data only covers non-landed residential resale property
transactions with caveats lodged with the Singapore Land Authority.
Typically, caveats are lodged at least 2-3 weeks after a purchaser
signs an OTP, hence the lagged nature of the data.
Postal
DistrictProject Name
Area
(sqft)
Transacted
Price ($)
Price
($ psf)Tenure
20 THOMSON VIEW CONDOMINIUM 3,843 2,550,000 664 99
21 BINJAI PARK 1,033 1,280,000 1,239 999
21 BROOKVALE PARK 1,615 1,820,000 1,127 999
21 CLEMENTI PARK 1,539 1,618,000 1,051 FH
21 ASTOR GREEN 1,378 1,300,100 944 99
22 THE LAKESHORE 1,141 1,230,000 1,078 99
22 THE LAKESHORE 1,464 1,490,000 1,018 99
22 THE MAYFAIR 926 923,000 997 99
22 PARC VISTA 1,055 995,000 943 99
22 PARC OASIS 1,227 1,080,000 880 99
22 THE MAYFAIR 1,184 1,000,000 845 99
22 PARK VIEW MANSION 1,119 740,000 661 99
23 HILLBROOKS 1,098 1,178,000 1,073 FH
23 MAYSPRINGS 818 800,000 978 99
23 CHANTILLY RISE 947 910,000 961 FH
23 GUILIN VIEW 861 818,000 950 99
23 NORTHVALE 1,033 905,000 876 99
23 HILLVIEW REGENCY 1,195 1,030,000 862 99
25 ROSEWOOD 1,012 850,000 840 99
25 THE WOODGROVE 883 715,000 810 99
26 CASTLE GREEN 1,173 1,008,000 859 99
27 THE ESTUARY 926 970,000 1,048 99