small firms in portugal: a selective survey of stylized...
TRANSCRIPT
PEJDOI 10.1007/s10258-007-0018-9
ORIGINAL ARTICLE
Small firms in Portugal: a selective survey of stylizedfacts, economic analysis, and policy implications
Luís M. B. Cabral
Received: 1 March 2006 / Accepted: 15 February 2007© Springer-Verlag 2007
Abstract I survey a number of stylized facts pertaining to the dynamics of firmentry, growth, and exit in competitive industries. I focus particularly on data forPortugal, although I also consider, for comparison purposes, data from othercountries. I then present a series of theoretical models that attempt to explainthe stylized facts and evaluate the welfare impact of market distortions. Finally,I derive a number of policy implications, all centered around the notion ofeconomic mobility.
JEL Classification L11
Keywords Small firms · Firm dynamics · Public policy
1 Introduction
Discussions about microeconomic policy in Portugal are fraught with lack ofconsensus, not only with respect to what should be done but also with respectto basic facts about the Portuguese economy microstructure. Some complainthat small firms fail and exit too often; but others complain that the governmentpolicies of different sorts maintain many firms artificially alive. Many insistthat Portuguese firms have very low productivity levels; but at the same time,
This paper was prepared for presentation at the 2006 Banco de Portugal Conference,Desenvolvimento Económico no Espaço Europeu.
L. M. B. Cabral (B)New York University, New York, NY, USAe-mail: [email protected], [email protected]
L. M. B. CabralCEPR, London, UK
L.M.B. Cabral
we celebrate the success stories of Portuguese firms that are nothing short ofEuropean and world leaders. Some say that there are too many small firmsor that there are not enough large firms (as there are in neighboring Spain,for example). When it comes to diagnosing the microeconomic problems facedby the Portugal, the list invariably includes high barriers to entry and growth,financing constraints, bureaucracy, high levels of taxation, and labor marketimperfections (too difficult to lay off workers); but there is no clear consensusas to what factors are relatively more important.
This paper has the ambitious goal of adding clarity to this debate. I proposeto do so in three steps. First, I survey a series of stylized facts about entry,exit, and growth rates, and about the industry distributions of firm size andproductivity level. Although my primary interest is in the Portuguese economy,I consider data from a variety of countries. In fact, one of the striking empiricalobservations is how regular the main stylized facts are across countries. Next, Ibriefly survey some of the theoretical developments that address these stylizedfacts, mostly in a competitive (price taking) dynamic context. I stress theimplications of these models in terms of welfare, specifically the welfare cost ofmarket distortions. Finally, I derive implications for microeconomic policy. Inparticular, I stress the importance of economic mobility, a broad concept thatdenotes the absence of distortions to the activity of small firms.
For readers less familiar with recent developments in industrial organiza-tion, this paper may seem a bit off the industrial organization-beaten (IO)track. In fact, most of the study of industrial organization over the past fewdecades has focused on concentrated industries and firms with market power.1
To some extent, the influx of game theory into industrial organization, for allits benefits, has created a bias away from industries where market power is ofsecondary importance. Moreover, from our study of the perfect competitionmodel, there would seem to be very little more to say about industry dynamicsand the properties of the long-run equilibrium beyond what we learn in aneconomics principles course.2 In fact, firm behavior under the perfect compe-tition model is almost trivial: remain active if price is higher than the minimumof average cost; and, conditionally on remaining active, choose output so thatprice equals marginal cost. What else is there to study?
The striking empirical regularities of competitive industry dynamics, as wellas the interesting theoretical results that they imply, suggest that there is alot to study. In particular, there is a lot to be said regarding public policy.The common wisdom holds that competition policy is needed primarily inindustries with market power. By contrast, I will argue that competition policyalso plays a central role in so-called “competitive industries.”
Before proceeding, it might be appropriate to repeat the disclaimer con-tained in the title: this paper is a selective survey. In particular, I should stressthat the recent theoretical and empirical literature has blossomed beyondthe limits of a short survey paper. My main purpose in summarizing recent
1See, for example, Tirole (1988).2See Cabral (2005) for a discussion of this point.
Small firms in Portugal
research is simply to provide support for the microeconomic policy claims, notto offer a complete picture of the extent to which the literature has progressed.
2 Industry dynamics: stylized facts
In this section, I present a series of stylized facts regarding firm dynamics:entry, growth, and exit rates (Section 2.1), firm size (Section 2.2), productivity(Section 2.3), and distortions to economic activity (Section 3.4).
2.1 Entry, growth, and exit
One of the most robust stylized facts of competitive industry dynamics is that,in any given year, entry and exit occur simultaneously. To put it differently, netentry rates are a small fraction of gross entry rates. Moreover, one finds thatentry and exit rates are highly correlated across industries; that is, industrieswith higher than average entry rates also exhibit higher than average exit rates.
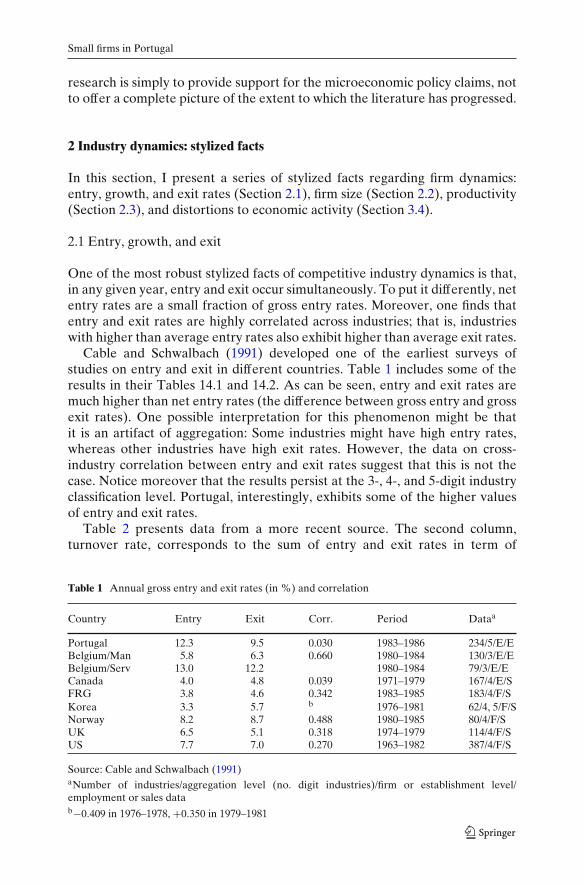
Cable and Schwalbach (1991) developed one of the earliest surveys ofstudies on entry and exit in different countries. Table 1 includes some of theresults in their Tables 14.1 and 14.2. As can be seen, entry and exit rates aremuch higher than net entry rates (the difference between gross entry and grossexit rates). One possible interpretation for this phenomenon might be thatit is an artifact of aggregation: Some industries might have high entry rates,whereas other industries have high exit rates. However, the data on cross-industry correlation between entry and exit rates suggest that this is not thecase. Notice moreover that the results persist at the 3-, 4-, and 5-digit industryclassification level. Portugal, interestingly, exhibits some of the higher valuesof entry and exit rates.
Table 2 presents data from a more recent source. The second column,turnover rate, corresponds to the sum of entry and exit rates in term of
Table 1 Annual gross entry and exit rates (in %) and correlation
Country Entry Exit Corr. Period Dataa
Portugal 12.3 9.5 0.030 1983–1986 234/5/E/EBelgium/Man 5.8 6.3 0.660 1980–1984 130/3/E/EBelgium/Serv 13.0 12.2 1980–1984 79/3/E/ECanada 4.0 4.8 0.039 1971–1979 167/4/E/SFRG 3.8 4.6 0.342 1983–1985 183/4/F/SKorea 3.3 5.7 b 1976–1981 62/4, 5/F/SNorway 8.2 8.7 0.488 1980–1985 80/4/F/SUK 6.5 5.1 0.318 1974–1979 114/4/F/SUS 7.7 7.0 0.270 1963–1982 387/4/F/S
Source: Cable and Schwalbach (1991)aNumber of industries/aggregation level (no. digit industries)/firm or establishment level/employment or sales datab−0.409 in 1976–1978, +0.350 in 1979–1981

L.M.B. Cabral
Table 2 Turnover rate(employment-weighted) andcorrelation between entryand exit rates
Sources: Bartelsman et al.(2004, 2003)
Country Turnover Correlation
Portugal 9.3 0.64US 7.0 0.86Western Germany 3.9 0.87France 7.0 0.73Italy 8.6 0.53Denmark 10.2 0.75Finland 11.9 0.75
employment. The entry rate, for example, is given by the total number of newjobs created by entrants divided by the total number of workers in the industry.The correlation rates between entry and exit are also weighted by employmentlevel.
Notice that turnover rates are quite different in Tables 1 and 2. For example,Table 1 implies a turnover rate (in terms of number of firms) of 21.8%for Portugal, whereas Table 2 shows a much lower value, 9.3%. The mainreason for the discrepancy is that Table 2 presents employment-weighted rates,whereas Table 1 refers only to the number of firms.
The lower rates in Table 2, compared to Table 1, suggest that entrants andexiters are of smaller size than incumbent firms. In fact, a second importantstylized fact is that market penetration rates are a small fraction of entry rates.Table 3 includes data on entrants and exiters relative size in different countries.In all countries, the entrants initial size is less than one half the industryaverage size. In six of eight countries, it is less than one quarter. Except forthe US, Portugal has the lowest ratio of entrant and exiter size with respect toindustry average size.
Turning to the dynamics of each individual firm, a third stylized fact is thatsurvival rates tend to be increasing in firm size and in firm age. For Portugal,Mata and Portugal (1994) estimate baseline hazard rates (that is, conditionalprobabilities of exit) after t years of 0.19, 0.14, 0.12, and 0.11 for the first 4 years.Based on the same dataset, Mata et al. (1994) also show that the probabilityof survival is increasing in current size. As with the previous stylized facts,similar results have been obtained for other countries. For the US, Evans(1987) estimates that a 1% change in firm size and a 1% change in firm age
Table 3 Entrants and exitersrelative size (as a percentageof incumbent firms)
Source: Cable andSchwalbach (1991)
Country Entrants Exiters
Portugal 8.0 11.8Belgium/Manufacturing 28.5 21.3Belgium/Services 32.8 32.2Canada 9.6 7.8FRG 22.1 18.8Korea 12.1Norway 12.6 11.3UK 44.9 61.2US 6.7 6.9
Small firms in Portugal
lead, respectively, to a 7 and a 13% change in the probability of survival overa 5-year period.
To conclude this subsection, I present a stylized fact regarding firm growth:Growth rates are typically decreasing in size, especially for small size levels;and decreasing with age. For Portugal, Mata and Portugal (1994) present someevidence to this effect. Newborn domestic firms have an expected growth rateof 22.5%, whereas 7-year-old firm only expect a 6.7% growth rate. Mata andPortugal do not explicitly explain the effects of age controlling for size andsize controlling for age. For the US, Evans (1987) does so. He estimates that,over a 10-year period, a 1% increase in initial size leads to a 0.68% increasein ending-period size, that is, growth is considerably less than proportionate.He also finds that, over the same period, a 1% increase in initial age impliesa 1.42% decrease in final size. Hall (1987) derives qualitatively similar resultsbased on a different sample of US firms. Dunne and Hughes (2002) estimatethat, over a 5-year period, a 1% increase in initial size leads to a 0.93% increasein ending-period size (this would correspond to 0.932 ≈ 0.86 over a period of10 years; compare with Evans’ results). Finally, studies for other countries findresults that are broadly consistent. See, for example, Fagiolo and Luzzi (2004)on data from Italy.
To summarize, this subsection depicts a typical industry as having manyentrants and exiters each period. A typical entrant is smaller than the industryaverage and grows faster than the industry average. Entrants are more likelyto exit than older entrants, especially when they remain small in size. Finally,these facts are fairly robust both across industries and across countries. Inparticular, Portugal seems fairly typical.
2.2 Firm size
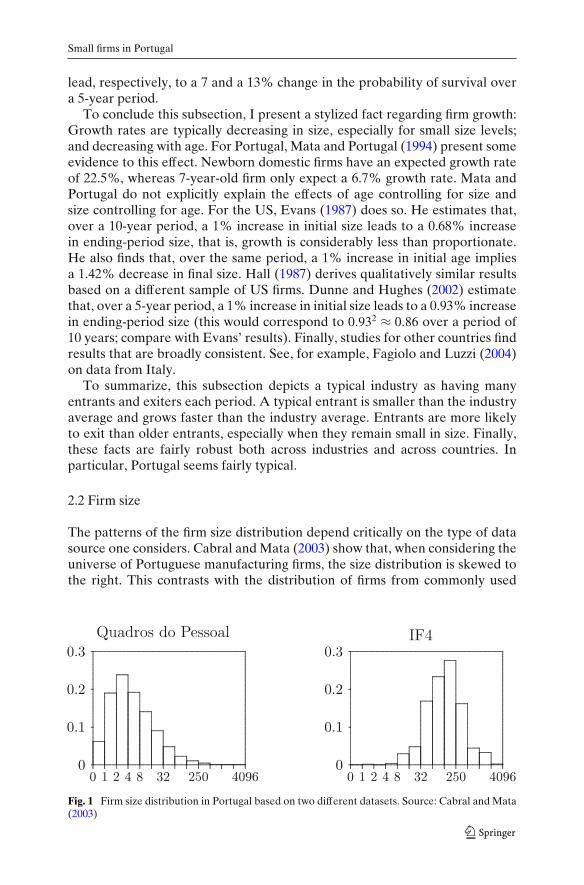
The patterns of the firm size distribution depend critically on the type of datasource one considers. Cabral and Mata (2003) show that, when considering theuniverse of Portuguese manufacturing firms, the size distribution is skewed tothe right. This contrasts with the distribution of firms from commonly used
Fig. 1 Firm size distribution in Portugal based on two different datasets. Source: Cabral and Mata(2003)

L.M.B. Cabral
Fig. 2 Firm size distribution in Portugal and in the US. Source: Cabral and Mata (2003)
databases, such as Compustat or Amadeus, for which the lognormal is a betterapproximation. Figure 1 illustrates this contrast. On the left, we have the sizedistribution based on a comprehensive dataset (from Quadros do Pessoal).On the right, the distribution from a dataset with similar characteristics toCompustat and Amadeus. One cannot reject that the right-hand distributionis lognormal, but the one on the left is certainly more right-skewed than alognormal.
The lognormal distribution has traditionally played an important role in thestudy of the firm size distribution. Empirically, the distribution seems to fitwell data from Compustat and similar databases. Theoretically, the lognormalis the limiting distribution of a firm growth process such that growth rates areindependent of firm size.3 When one looks at more comprehensive datasets,including small and micro firms, then lognormality is no longer the rule; norare growth rates independent of size (see the previous section).
The pattern of right-skewness, with proportionately more small firms thanlarge firms (with respect to the lognormal distribution), is not unique toPortugal. Figure 2 depicts the distribution of firm size for manufacturing firmsin Portugal and the US. Despite the significant differences in size and level ofeconomic development, the distributions are relatively similar.
A related stylized fact documented by Cabral and Mata (2003) for Por-tuguese firms is the evolution of the firm size distribution. They show thatthe distribution of log size of a given cohort of firms is very skewed at birthbut gradually becomes more symmetric. Once again, similar results have beenobtained for other countries, namely, Ireland and Italy.4
In recent research, Bartelsman et al. (2003) present some systematic evi-dence on firm size and firm size distribution across a series of countries. Table 4presents the relative weight of firms with fewer than 20 employees. As canbe seen, the number of firms in that category is virtually identical in Portugaland the US (consistently with Fig. 2). However, when we consider the fraction
3See Gibrat (1931) and Sutton (1997).4See Angelini and Generale (2005); Barrios et al. (2005); Lotti and Santarelli (2004). However,Fagiolo and Luzzi (2004) fail to detect such evolution in the skewness of the firm size distribution.

Small firms in Portugal
Table 4 Relative importanceof firms with fewer than 20employees: fraction of totaleconomy (%)
Source: Bartelsman et al.(2003)
Number of firms Number of employees
Portugal 86.3 27.7US 86.7 16.6Western Germany 87.9 23.6France 78.6 34.4Italy 93.1 38.1Denmark 90.0 30.2Finland 92.6 25.8The Netherlands 95.8 31.2
of employees accounted for by firms with fewer than 20 employees, then thenumber is much lower for the US. This reflects the fact that the right tail ofthe US distribution of firm size is much thicker.
Table 5 presents data on average firm size in various countries. Again,Portugal seems broadly in line with other European countries. Table 5 alsopresents data on the subcategories Manufacturing and Services. The cross-country patterns of firm size seem broadly robust with respect to the typeof firms considered. In fact, Bartelsman et al. (2003) show that industrycomposition accounts for a small fraction of the cross-country differences infirm size.
The results from Table 5 may seem puzzling. After all, Portugal’s largestfirms pale in size when compared to their European counterparts; and accord-ingly, one might expect average firm size to be smaller in Portugal (and theemployment share of small firms to be larger). The solution to this apparentpuzzle, at least to some extent, is to be found in what we might call the extreme-statistic fallacy. Consider two random variables, X and Y. Let E(X, m, n) bethe average value of the m highest values of x out of a sample of n values.Then, even if the distributions of X and Y were the same, we would inevitablyobtain E(X, m, nX) > E(Y, m, nY) so long as nX > nY . So, the fact that the fivelargest German firms are greater than the five largest Portuguese firms does notnecessarily imply that German firms are on average greater than Portuguesefirms; just like the fact the five tallest German men are taller than the five tallestPortuguese men does not imply Germans are on average taller.
In summary, Portugal does not seem to be an outlier in terms of firm size andthe firm size distribution. It is often said that there are too many small firms
Table 5 Average firm size(number of employees)
Source: Bartelsman et al.(2003)
Economy Manufacturing Services
Portugal 16.8 31.0 11.4US 26.4 80.3 21.4Western Germany 17.0 39.1 11.5France 33.5 32.1 35.7Italy 10.5 15.3 6.8Canada 12.7 40.5 12.0Denmark 13.3 30.4 12.7Finland 13.0 27.8 9.9The Netherlands 6.5 18.3 5.3

L.M.B. Cabral
Fig. 3 Distribution ofproductivity levels: anexample
in Portugal and that average firm size is too small. However, when lookingat small and medium-sized enterprises (SME), it is hard to find a significantdifference between Portugal and the average OECD country.
2.3 Productivity
There is extensive evidence, although not extensive systematic evidence, thatproductivity in Portugal is substantially lower than the average of all Europeancountries. A report by McKinsey benchmarks Portugal with reference to agroup of four other European countries and estimates a productivity gap ofabout 30%.
I am not aware of any systematic estimate of the distribution of productivitylevels by industry in Portugal. Estimates for the US indicate high indices ofvariability. Considering how similar different countries are on other dimen-sions, it seems reasonable to expect Portuguese industries to exhibit similarlevels of dispersion of productivity levels.
An estimate based on a survey of Portuguese innovators indicates a co-efficient of variation greater than 1.5 Such high value of the coefficient ofvariation has important implications. In particular, it makes little sense touse the difference in means and generalize that Portuguese firms are notproductive: the fallacy of the average.
A simple calculation will help make the point. Assume that the distributionof productivity levels is lognormal (which makes sense based on the distrib-utions in other countries). Assume moreover that the standard deviation isequal to the mean. Then even if Portuguese firms have an average productivity50% lower than the European average, 20% of Portuguese firms have aproductivity level higher than the European median, or 11% above Europeanaverage.
5Pedro Conceição (personal communication).
Small firms in Portugal
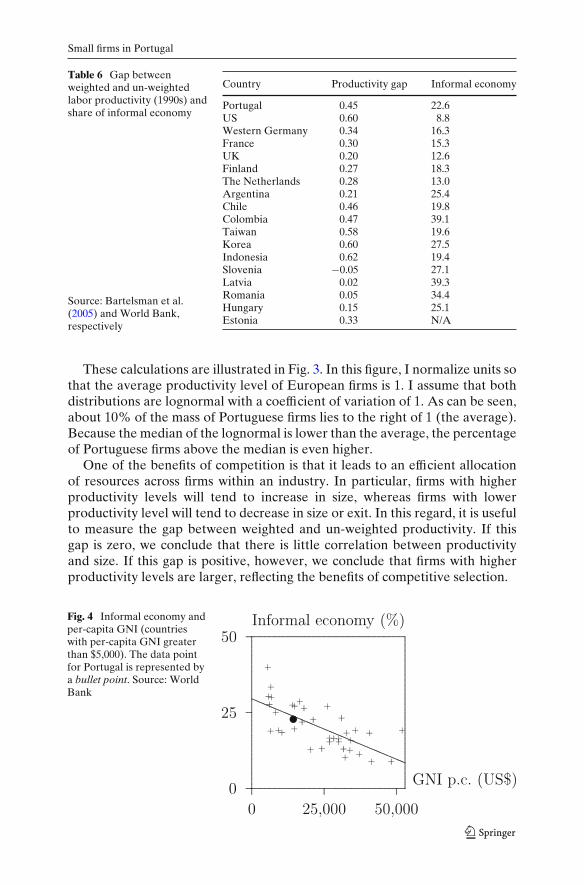
Table 6 Gap betweenweighted and un-weightedlabor productivity (1990s) andshare of informal economy
Source: Bartelsman et al.(2005) and World Bank,respectively
Country Productivity gap Informal economy
Portugal 0.45 22.6US 0.60 8.8Western Germany 0.34 16.3France 0.30 15.3UK 0.20 12.6Finland 0.27 18.3The Netherlands 0.28 13.0Argentina 0.21 25.4Chile 0.46 19.8Colombia 0.47 39.1Taiwan 0.58 19.6Korea 0.60 27.5Indonesia 0.62 19.4Slovenia −0.05 27.1Latvia 0.02 39.3Romania 0.05 34.4Hungary 0.15 25.1Estonia 0.33 N/A
These calculations are illustrated in Fig. 3. In this figure, I normalize units sothat the average productivity level of European firms is 1. I assume that bothdistributions are lognormal with a coefficient of variation of 1. As can be seen,about 10% of the mass of Portuguese firms lies to the right of 1 (the average).Because the median of the lognormal is lower than the average, the percentageof Portuguese firms above the median is even higher.
One of the benefits of competition is that it leads to an efficient allocationof resources across firms within an industry. In particular, firms with higherproductivity levels will tend to increase in size, whereas firms with lowerproductivity level will tend to decrease in size or exit. In this regard, it is usefulto measure the gap between weighted and un-weighted productivity. If thisgap is zero, we conclude that there is little correlation between productivityand size. If this gap is positive, however, we conclude that firms with higherproductivity levels are larger, reflecting the benefits of competitive selection.
Fig. 4 Informal economy andper-capita GNI (countrieswith per-capita GNI greaterthan $5,000). The data pointfor Portugal is represented bya bullet point. Source: WorldBank
L.M.B. Cabral
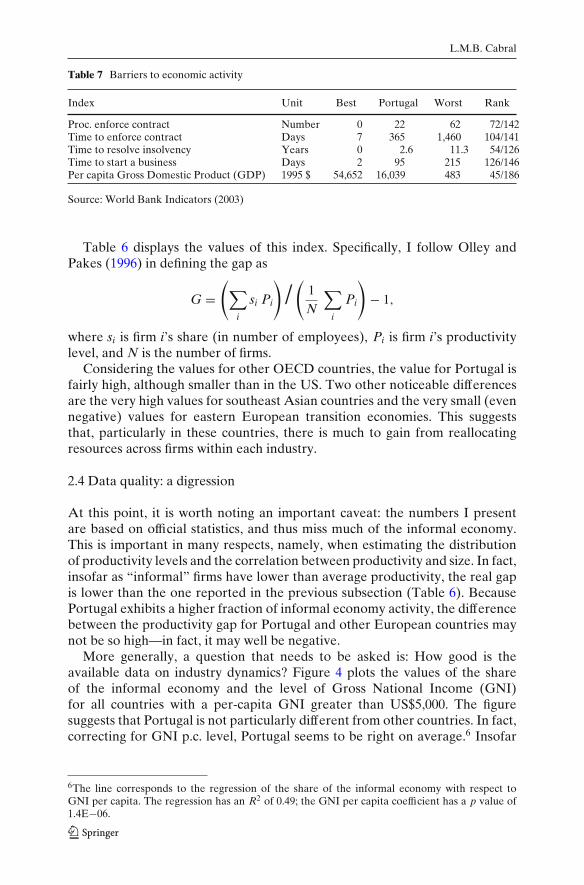
Table 7 Barriers to economic activity
Index Unit Best Portugal Worst Rank
Proc. enforce contract Number 0 22 62 72/142Time to enforce contract Days 7 365 1,460 104/141Time to resolve insolvency Years 0 2.6 11.3 54/126Time to start a business Days 2 95 215 126/146Per capita Gross Domestic Product (GDP) 1995 $ 54,652 16,039 483 45/186
Source: World Bank Indicators (2003)
Table 6 displays the values of this index. Specifically, I follow Olley andPakes (1996) in defining the gap as
G =(∑
i
si Pi
)/
(1
N
∑i
Pi
)− 1,
where si is firm i’s share (in number of employees), Pi is firm i’s productivitylevel, and N is the number of firms.
Considering the values for other OECD countries, the value for Portugal isfairly high, although smaller than in the US. Two other noticeable differencesare the very high values for southeast Asian countries and the very small (evennegative) values for eastern European transition economies. This suggeststhat, particularly in these countries, there is much to gain from reallocatingresources across firms within each industry.
2.4 Data quality: a digression
At this point, it is worth noting an important caveat: the numbers I presentare based on official statistics, and thus miss much of the informal economy.This is important in many respects, namely, when estimating the distributionof productivity levels and the correlation between productivity and size. In fact,insofar as “informal” firms have lower than average productivity, the real gapis lower than the one reported in the previous subsection (Table 6). BecausePortugal exhibits a higher fraction of informal economy activity, the differencebetween the productivity gap for Portugal and other European countries maynot be so high—in fact, it may well be negative.
More generally, a question that needs to be asked is: How good is theavailable data on industry dynamics? Figure 4 plots the values of the shareof the informal economy and the level of Gross National Income (GNI)for all countries with a per-capita GNI greater than US$5,000. The figuresuggests that Portugal is not particularly different from other countries. In fact,correcting for GNI p.c. level, Portugal seems to be right on average.6 Insofar
6The line corresponds to the regression of the share of the informal economy with respect toGNI per capita. The regression has an R2 of 0.49; the GNI per capita coefficient has a p value of1.4E−06.
Small firms in Portugal
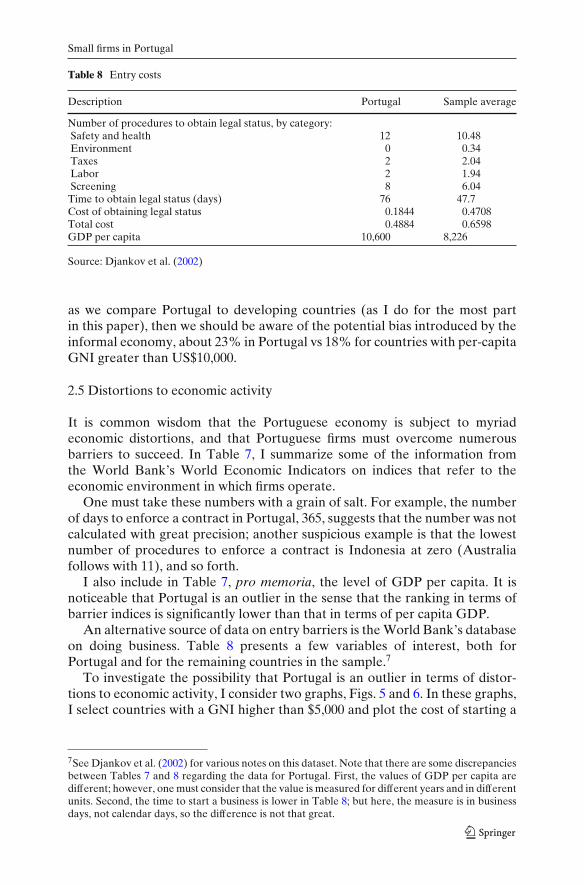
Table 8 Entry costs
Description Portugal Sample average
Number of procedures to obtain legal status, by category:Safety and health 12 10.48Environment 0 0.34Taxes 2 2.04Labor 2 1.94Screening 8 6.04
Time to obtain legal status (days) 76 47.7Cost of obtaining legal status 0.1844 0.4708Total cost 0.4884 0.6598GDP per capita 10,600 8,226
Source: Djankov et al. (2002)
as we compare Portugal to developing countries (as I do for the most partin this paper), then we should be aware of the potential bias introduced by theinformal economy, about 23% in Portugal vs 18% for countries with per-capitaGNI greater than US$10,000.
2.5 Distortions to economic activity
It is common wisdom that the Portuguese economy is subject to myriadeconomic distortions, and that Portuguese firms must overcome numerousbarriers to succeed. In Table 7, I summarize some of the information fromthe World Bank’s World Economic Indicators on indices that refer to theeconomic environment in which firms operate.
One must take these numbers with a grain of salt. For example, the numberof days to enforce a contract in Portugal, 365, suggests that the number was notcalculated with great precision; another suspicious example is that the lowestnumber of procedures to enforce a contract is Indonesia at zero (Australiafollows with 11), and so forth.
I also include in Table 7, pro memoria, the level of GDP per capita. It isnoticeable that Portugal is an outlier in the sense that the ranking in terms ofbarrier indices is significantly lower than that in terms of per capita GDP.
An alternative source of data on entry barriers is the World Bank’s databaseon doing business. Table 8 presents a few variables of interest, both forPortugal and for the remaining countries in the sample.7
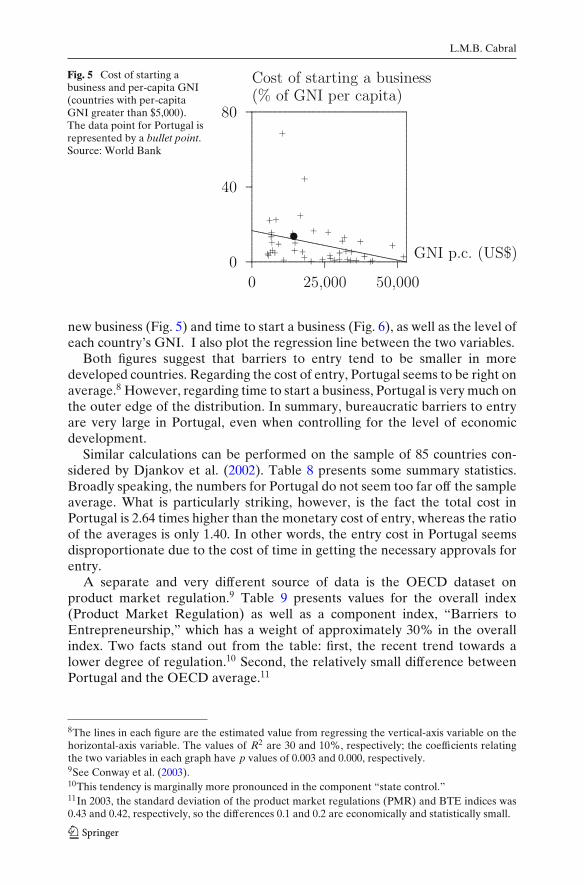
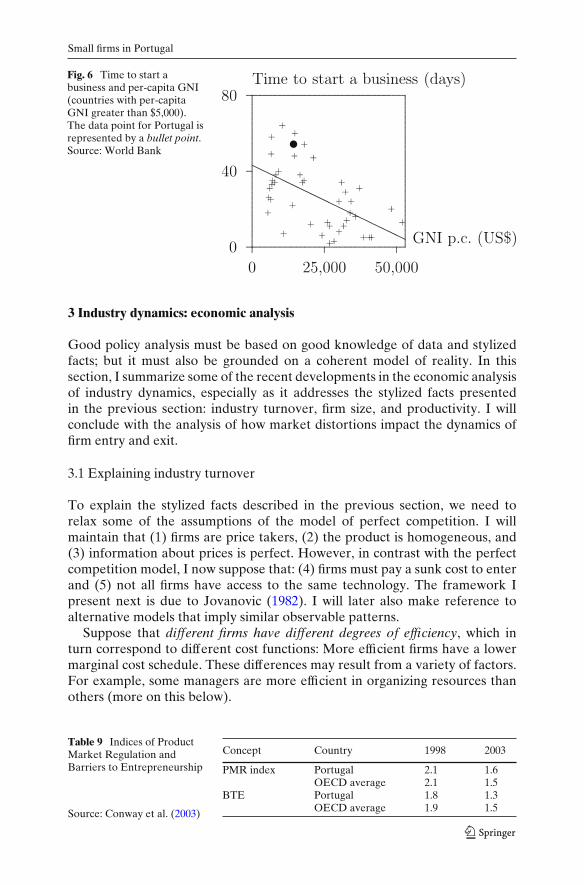
To investigate the possibility that Portugal is an outlier in terms of distor-tions to economic activity, I consider two graphs, Figs. 5 and 6. In these graphs,I select countries with a GNI higher than $5,000 and plot the cost of starting a
7See Djankov et al. (2002) for various notes on this dataset. Note that there are some discrepanciesbetween Tables 7 and 8 regarding the data for Portugal. First, the values of GDP per capita aredifferent; however, one must consider that the value is measured for different years and in differentunits. Second, the time to start a business is lower in Table 8; but here, the measure is in businessdays, not calendar days, so the difference is not that great.
L.M.B. Cabral
Fig. 5 Cost of starting abusiness and per-capita GNI(countries with per-capitaGNI greater than $5,000).The data point for Portugal isrepresented by a bullet point.Source: World Bank
new business (Fig. 5) and time to start a business (Fig. 6), as well as the level ofeach country’s GNI. I also plot the regression line between the two variables.
Both figures suggest that barriers to entry tend to be smaller in moredeveloped countries. Regarding the cost of entry, Portugal seems to be right onaverage.8 However, regarding time to start a business, Portugal is very much onthe outer edge of the distribution. In summary, bureaucratic barriers to entryare very large in Portugal, even when controlling for the level of economicdevelopment.
Similar calculations can be performed on the sample of 85 countries con-sidered by Djankov et al. (2002). Table 8 presents some summary statistics.Broadly speaking, the numbers for Portugal do not seem too far off the sampleaverage. What is particularly striking, however, is the fact the total cost inPortugal is 2.64 times higher than the monetary cost of entry, whereas the ratioof the averages is only 1.40. In other words, the entry cost in Portugal seemsdisproportionate due to the cost of time in getting the necessary approvals forentry.
A separate and very different source of data is the OECD dataset onproduct market regulation.9 Table 9 presents values for the overall index(Product Market Regulation) as well as a component index, “Barriers toEntrepreneurship,” which has a weight of approximately 30% in the overallindex. Two facts stand out from the table: first, the recent trend towards alower degree of regulation.10 Second, the relatively small difference betweenPortugal and the OECD average.11
8The lines in each figure are the estimated value from regressing the vertical-axis variable on thehorizontal-axis variable. The values of R2 are 30 and 10%, respectively; the coefficients relatingthe two variables in each graph have p values of 0.003 and 0.000, respectively.9See Conway et al. (2003).10This tendency is marginally more pronounced in the component “state control.”11In 2003, the standard deviation of the product market regulations (PMR) and BTE indices was0.43 and 0.42, respectively, so the differences 0.1 and 0.2 are economically and statistically small.
Small firms in Portugal
Fig. 6 Time to start abusiness and per-capita GNI(countries with per-capitaGNI greater than $5,000).The data point for Portugal isrepresented by a bullet point.Source: World Bank
3 Industry dynamics: economic analysis
Good policy analysis must be based on good knowledge of data and stylizedfacts; but it must also be grounded on a coherent model of reality. In thissection, I summarize some of the recent developments in the economic analysisof industry dynamics, especially as it addresses the stylized facts presentedin the previous section: industry turnover, firm size, and productivity. I willconclude with the analysis of how market distortions impact the dynamics offirm entry and exit.
3.1 Explaining industry turnover
To explain the stylized facts described in the previous section, we need torelax some of the assumptions of the model of perfect competition. I willmaintain that (1) firms are price takers, (2) the product is homogeneous, and(3) information about prices is perfect. However, in contrast with the perfectcompetition model, I now suppose that: (4) firms must pay a sunk cost to enterand (5) not all firms have access to the same technology. The framework Ipresent next is due to Jovanovic (1982). I will later also make reference toalternative models that imply similar observable patterns.
Suppose that different firms have different degrees of efficiency, which inturn correspond to different cost functions: More efficient firms have a lowermarginal cost schedule. These differences may result from a variety of factors.For example, some managers are more efficient in organizing resources thanothers (more on this below).
Table 9 Indices of ProductMarket Regulation andBarriers to Entrepreneurship
Source: Conway et al. (2003)
Concept Country 1998 2003
PMR index Portugal 2.1 1.6OECD average 2.1 1.5
BTE Portugal 1.8 1.3OECD average 1.9 1.5
L.M.B. Cabral
Suppose moreover that each firm is uncertain about its own efficiency. Whena firm first enters an industry, it has only a vague idea of what its efficiency is.As times goes by, and based on each period’s experience, the firm graduallyforms a more precise estimate of its true efficiency. In each period, the firmchooses optimal output based on its current expectation of efficiency; roughlyspeaking, the output level such that price is equal to expected marginal cost.
Given the above elements, we conclude that firms that get a series of badsignals (high production costs) gradually become “pessimistic” about theirefficiency level, gradually decrease their output, and, eventually, may decideto exit the industry (as variable profit is insufficient to compensate for the fixedcost). By contrast, firms that receive a series of good signals (low productioncosts) remain active and gradually increase their output.
This model of competitive selection is consistent with several of the stylizedfacts described in the previous section. In particular, the model is consistentwith the stylized fact of simultaneous entry and exit in the same industry.Firms that accumulate a series of very unfavorable productivity signals holda very unfavorable estimate of their own efficiency. As a result, their expectedvalue from remaining active is negative, which in turn leads them to exit.New entrants have no information regarding their efficiency. Their expectedefficiency is, therefore, much better than the exiting firms’: No news is betterthan bad news. This justifies that their expected value from being active ispositive, in fact, greater than the entry cost. In summary, it is possible fora firm with no information about its efficiency to enter, whereas a firm withunfavorable information about efficiency exits.
Efficient firms are firms with a low marginal cost function. Because firmsequate price to (expected) marginal cost, it follows that more efficient firmssell a higher output. Together with the previous results, this implies that exiters(the active firms with lowest expected efficiency) are also the firms with loweroutput. By selection, the firms that remain active have an efficiency higherthan average. In particular, higher than the average entrant’s. It follows thatentrants’ output is lower than the surviving firms’ average output. In this way,the model is also consistent with the stylized fact that firms that enter and firmsthat exit are smaller than average.
Finally, the competitive selection model is also consistent with the empir-ical observation that the firm size distribution is neither single valued norindeterminate, as the perfect competition model would imply. In fact, a givenpopulation distribution of efficiency levels implies a particular distribution offirm sizes.12
Jovanovic (1982) model is not the only one that is consistent with the typeof stylized facts described in Section 2. Other important broad frameworksinclude Hopenhayn (1992) and Ericson and Pakes (1995). In fact, I will come
12It may be worth to point out that the competitive selection model does not depend on firmsbeing asymmetric with respect to costs. We could alternatively assume that some firms’ productsare better than others’.

Small firms in Portugal
to these later in the paper. In particular, I will show how Ericson and Pakes(1995) address one of the main criticisms to the Jovanovic model, namely, thatit does not explain why different firms have different efficiency levels in thefirst place.
3.2 Explaining the evolution of new firms
As mentioned in Section 2.2, new firms are characterized by a very right-skewed distribution. As time moves on, the size distribution of that cohortshifts to the right and becomes closer to a log-normal. One first naturalinterpretation of this pattern is that the smallest of the small firms are exitingin greater numbers, leaving a set of survivors that has a more symmetric distri-bution (in particular with fewer very small firms). However, using Portuguesedata, Cabral and Mata (2003) reject this interpretation: They show that the sizedistribution of 1984 entrants is very similar to the 1984 size distribution of the1984 entrants that survived until 1991, which contradicts the hypothesis thatselection is doing most of the work.
Cabral and Mata (2003) propose an alternative hypothesis, namely, thatfinancing constraints play an important role. Among the set of entrants, somefirms start off very small because they do not have the resources to start off attheir efficient level. As they gradually become less financially constrained, thedistribution moves to the right and becomes more symmetric (as found in thedata).
Barrios et al. (2005) corroborate this explanation with data from Ireland.They show that the above evolution of firm size skewness is found in Irish firmsbut not in multinational firms. This seems consistent with the hypothesis thatmultinational firms are less financially constrained and therefore not subjectto the above dynamics. However, Fagiolo and Luzzi (2004), using Italian data,reject the hypothesis that financing constraints have a significant effect. Basedon firm level survey data where respondents indicate if they are financiallyconstrained, they construct two distributions of new firm size distribution: thatof financially constrained firms and that of not financially constrained firms.The difference between the two distributions is minimal.
Albuquerque and Hopenhayn (2004) and Cooley and Vincenzo (2001)propose more structural models that incorporate financing constraints. Inparticular, Cooley and Vincenzo (2001) show how financing constraints explainthe fact that growth rates are decreasing in size (controlling for age) anddecreasing in age (controlling for size).
An alternative explanation for the evolution of firm size focuses on the roleof sunk costs. Cabral (1995) provides a theoretical explanation for the negativerelation between firm size and firm growth among new entrants. The idea isthat capacity and technology choices involve some degree of sunkness (that is,investments for which value is foregone upon exit). Because small entrants aremore likely to exit than large entrants, it is optimal for small entrants to investmore gradually, and thus experience higher expected growth rates upon entrythan large entrants do.
L.M.B. Cabral
3.3 Explaining variability in productivity
The characterization of the firm size distribution provided by Jovanovic’smodel is, to a great extent, tautological: The distribution of efficiency levels isassumed rather than derived; a more satisfactory model would also explain thedistribution of efficiency levels. One possibility is to assume that firms investin R&D and that efficiency levels result from these R&D investments. This iswhat the model by Ericson and Pakes (1995) does.
Ericson and Pakes (1995) consider a model where each firm’s productivityresults from rationally chosen R&D investments. Specifically, in each period,firms decide whether to remain active, and if so, how much to invest in R&D.Investment leads to a stochastic improvement in the firm’s type, which can beinterpreted in a way similar to Jovanovic (1982).13
Ericson and Pakes (1995) derive a rational expectations Markov equilib-rium, which is ergodic. In the long-run, there will be a distribution of firm typesand firm sizes. In other words, instead of assuming a distribution of types, asin Jovanovic (1982), we now derive such distribution as an equilibrium result.The key to heterogeneity of firm types is, therefore, the randomness of theinvestment process.
It seems reasonable to assume differences in efficiency and productivityresult from luck of the draw in the R&D process. Still one may wonderhow such large differences in productivity as those reported in the previoussection can be sustained in the long run. After all, one of the main effectsof competition is precisely to weed out the under-performers. One possi-ble explanation, advanced by Syverson (2004a), is that product differentia-tion allows firms to survive with below-par productivity levels. Consistentlywith this explanation, Syverson (2004a) shows that industries with greaterdegree of product differentiation are also industries with greater variabilityin productivity.
An alternative explanation is that not all industries are that competitive. Ifthe more productive firms price above cost, then less efficient firms may be ableto survive (if with lower margins). Syverson (2004b) tests this hypothesis inthe concrete industry. He shows that, in geographical areas where there is lesscompetition, there is also greater variability in productivity levels. A relatedtest is that of Asplund and Nocke (2005). They show that, in geographicalmarkets where demand density is greater, and thus market competition moreintense, the average life span of an entrant is lower. Although they do notdirectly present theoretical or empirical results on productivity level, this resultis consistent with Syverson (2004b) on the disciplining effects of competition.
In summary, firm heterogeneity (namely, in terms of productivity level)is a combination of exogenous firm attributes (managerial ability, company
13Ericson and Pakes (1995) also consider the possibility of non-competitive behavior by firms.
Small firms in Portugal
culture, etc.) and luck in the investment process.14 Although typical industriesexhibit a significant degree of variation in productivity levels, such dispersionis smaller in more competitive industries (e.g., industries with lower degree ofproduct differentiation).
3.4 Market distortions and welfare
The fundamental theorem of welfare economics states that, under perfectcompetition, the market solution is efficient. But, as we have seen in Section 2,the perfect competition model does not stand up to the facts very well. Whatthen can be said of the market efficiency result? To my knowledge, Hopenhayn(1992) provides the most general extension of the fundamental theorem.Based on an extension of Jovanovic’s (1982) model, he shows that the marketequilibrium is efficient if firms are price takers —even if efficiency varies acrossfirms and across periods. This is a strong result. In particular, if there are noentry barriers, then the equilibrium level of firm turnover (possibly with highfirm turnover compared to the net entry rate) is socially optimal.
In other words, for all its differences with respect to perfect competition,competitive selection maintains one important property: efficiency. So long asfirms act as price takers, the equilibrium solution, absent any artificial barriers,is socially efficient. Each firm’s output decision in each period is efficient: Priceequal to expected marginal cost is the most efficient output decision, that is,the one that maximizes total surplus. Moreover, it can be shown that the firm’sentry and exit decisions are also optimal from a social point of view. The basicidea is the same as in the model of perfect competition: A very small firm hasa negligible impact on other firms and on price. It follows that it internalizesall of the costs and benefits from entering or exiting the industry: What is goodfor the firm is good for society.
It might seem inefficient to have firms entering and exiting a given industrysimultaneously. But we must remember that firms are uncertain about theirefficiency. The only way to determine a firm’s efficiency is to actually enter theindustry. A central planner who attempted to maximize total surplus wouldnot be able to do better than the market. In summary, it can be shown that theequilibrium under competitive selection is efficient.
It follows that distortions to the natural workings of the market lead to alower level of social welfare. A particularly careful illustration of this pointis provided by Hopenhayn and Rogerson (1993). Based on the Hopenhayn’s(1992) model of competitive selection, Hopenhayn and Rogerson (1993)estimate the impact of a distortion to the process of firm creation and de-struction. Specifically, they consider the impact of firing costs. The results are
14Pakes and Ericson (1998) test the relative importance of these two sources of heterogeneity.They show that firm type is ergodic in manufacturing but not in services. This is consistent withthe interpretation that Jovanovic’s (1982) story does a better story at explaining the dynamicsof firms in the services sector, whereas Ericson and Pakes (1995) is a better model of firms inmanufacturing.
L.M.B. Cabral
staggering: For example, they estimate that a tax on dismissals equivalent to1 year’s wages reduces steady-state utility by more than 2% measured in termsof consumption. The welfare loss comes about from an 8% reduction in firmturnover. This implies that less efficient firms are active, whereas other, moreactive firms, remain inactive. Also, the labor adjustment cost implies that somefirms are smaller or greater (in terms of number of employees) than would beefficient. Hopenhayn and Rogerson (1993) estimate that, for more than 90% ofthe firms, the gap between the marginal productivity of labor and wage wouldbe greater than 5%.
I suspect that Hopenhayn and Rogerson’s (1993) analysis yields a lowerbound of the welfare loss from barriers to entry and mobility. The reason is thatthey assume all firms are subject to the same barrier. But casual observationsuggests that, just as there is significant variability in firm productivity, there isalso significant variability in the barriers to entry and mobility that each firmfaces.
To get an idea of the magnitude of this effect, consider the following simplemodel. Suppose there are 1,000 price-taking firms each with capacity 1.15 Iassume that marginal cost is constant and normally distributed with mean 100.Consistently with the empirical evidence, I assume a coefficient of variationof 1, so standard deviation is also 100. Market inverse demand is given byp = 200 − 0.01Q, where Q is total output (number of active firms).
I first compute the equilibrium in this economy. This amounts to orderingfirms by marginal cost, thus obtaining market supply; and then finding thesupply–demand equilibrium.
Suppose now that this economy is subject to a series of distortions. Specif-ically, firm i’s marginal cost is changed by ti, where ti is normally distributedwith mean μ and standard deviation σ . I assume the value tiqi is a transfer, sothe only social cost implied by ti is the distortion it creates.
The social cost of distortion ti can be divided into two terms. First, assumingno change in costs, ti leads to a gap between price and marginal cost andthe corresponding Harberger excess burden triangle (allocative inefficiency).Second, for a given output level, ti also implies an increase in production costcompared to the minimum total production cost (productive inefficiency).
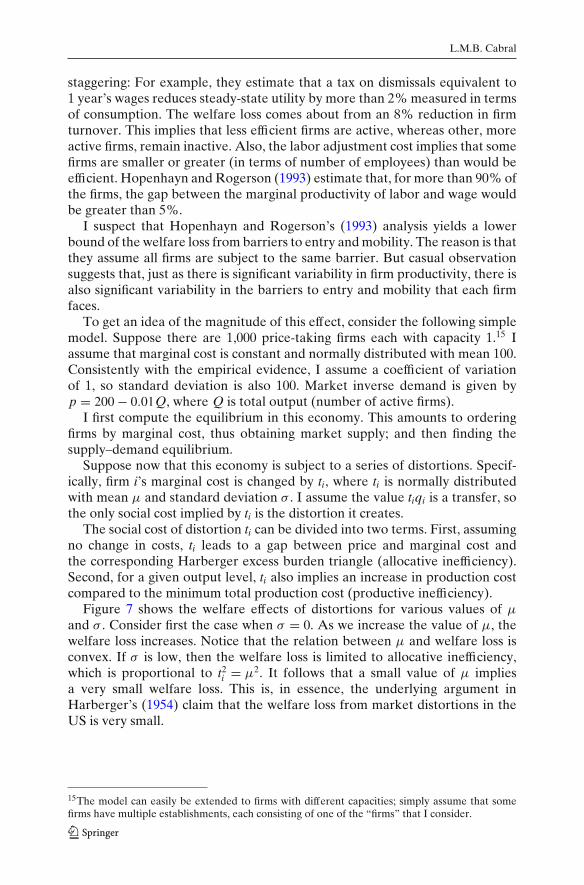
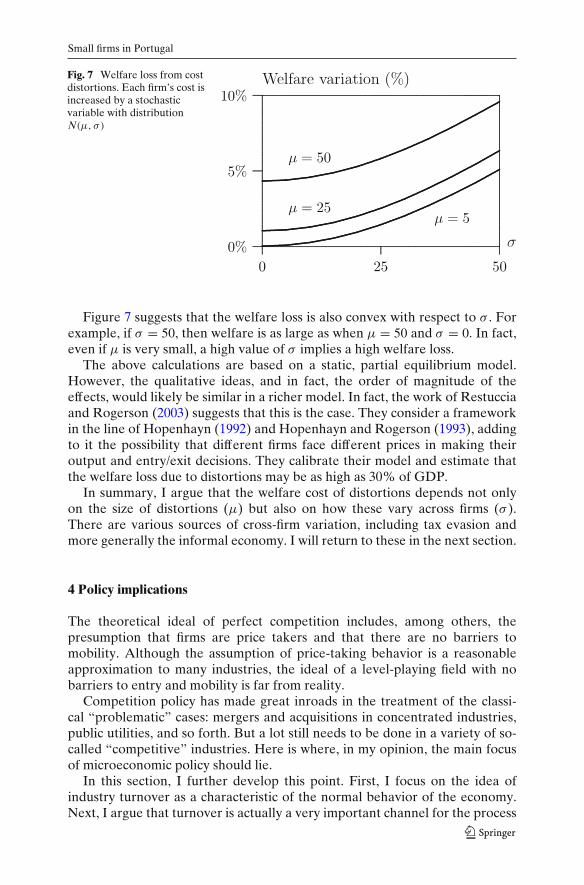
Figure 7 shows the welfare effects of distortions for various values of μ
and σ . Consider first the case when σ = 0. As we increase the value of μ, thewelfare loss increases. Notice that the relation between μ and welfare loss isconvex. If σ is low, then the welfare loss is limited to allocative inefficiency,which is proportional to t2
i = μ2. It follows that a small value of μ impliesa very small welfare loss. This is, in essence, the underlying argument inHarberger’s (1954) claim that the welfare loss from market distortions in theUS is very small.
15The model can easily be extended to firms with different capacities; simply assume that somefirms have multiple establishments, each consisting of one of the “firms” that I consider.
Small firms in Portugal
Fig. 7 Welfare loss from costdistortions. Each firm’s cost isincreased by a stochasticvariable with distributionN(μ, σ )
Figure 7 suggests that the welfare loss is also convex with respect to σ . Forexample, if σ = 50, then welfare is as large as when μ = 50 and σ = 0. In fact,even if μ is very small, a high value of σ implies a high welfare loss.
The above calculations are based on a static, partial equilibrium model.However, the qualitative ideas, and in fact, the order of magnitude of theeffects, would likely be similar in a richer model. In fact, the work of Restucciaand Rogerson (2003) suggests that this is the case. They consider a frameworkin the line of Hopenhayn (1992) and Hopenhayn and Rogerson (1993), addingto it the possibility that different firms face different prices in making theiroutput and entry/exit decisions. They calibrate their model and estimate thatthe welfare loss due to distortions may be as high as 30% of GDP.
In summary, I argue that the welfare cost of distortions depends not onlyon the size of distortions (μ) but also on how these vary across firms (σ ).There are various sources of cross-firm variation, including tax evasion andmore generally the informal economy. I will return to these in the next section.
4 Policy implications
The theoretical ideal of perfect competition includes, among others, thepresumption that firms are price takers and that there are no barriers tomobility. Although the assumption of price-taking behavior is a reasonableapproximation to many industries, the ideal of a level-playing field with nobarriers to entry and mobility is far from reality.
Competition policy has made great inroads in the treatment of the classi-cal “problematic” cases: mergers and acquisitions in concentrated industries,public utilities, and so forth. But a lot still needs to be done in a variety of so-called “competitive” industries. Here is where, in my opinion, the main focusof microeconomic policy should lie.
In this section, I further develop this point. First, I focus on the idea ofindustry turnover as a characteristic of the normal behavior of the economy.Next, I argue that turnover is actually a very important channel for the process

L.M.B. Cabral
of industry productivity growth. Finally, I present the ideal of economicmobility as one of the main goals of competition policy.
4.1 Turnover and welfare
One of the most common misperceptions regarding micro policy is that itshould protect firms from failing and exiting. It is true that the immediate effectof saving a firm from exiting is to save a number of jobs equal to that firm’semployment. But such policy would imply a significant welfare cost in terms ofresource misallocation. A firm that is artificially kept alive implies a firm thatwill not be created, knowing that the latter would probably be more efficientthan the former. In this regard, the welfare cost estimates by Hopenhayn andRogerson (1993) are particularly telling.
One variation of the above misperception is that public policy should protectsmall firms especially because their turnover rate is typically higher thanaverage (as documented in Section 2). But again, a high turnover rate maywell be part of the natural process of experimentation inherent to a healthycompetitive industry. In fact, the cost of experimentation is smaller for smallfirms, and so it is only natural that, in equilibrium, we observe higher entryand exit rates for small firms. So, as a matter of principle, one cannot saythat because their turnover rate is higher small firms should be particularlyprotected.
Having said that, it is true that some market imperfections hit small firms ina particular way. For example, imperfect credit market conditions are likely tobias the market against small firms. In general, any imperfections that increasea firm’s fixed cost slant the field against small firms. The solution is then tocorrect as much as possible for those credit market imperfections.
4.2 Productivity growth
One of the most important results from the analysis of time series productivitydata is the importance of industry turnover in the process of productivitygrowth. There are essentially two ways in which to increase average productiv-ity in a given industry. One is to increase the productivity level of each firm; theother one is to increase the relative weight of higher productivity firms. Publicpolicy frequently heralds the former and places less emphasis on the latter.Government programs to improve the quality of human and physical capitalinputs have greater political impact; whereas fostering a more fluid process offirm entry and exit, if anything, carries a political cost. This is unfortunate, forthe empirical evidence is that resource reallocation is the primary source ofproductivity growth.
Olley and Pakes (1996) offer an interesting case study of the role of turnoverin productivity growth. They look at the 1980’s deregulation process in theUS telecommunications equipment industry. The common wisdom is thatderegulation improves efficiency by forcing incumbent firms to become moreefficient. Although telecommunications equipment firms indeed became more
Small firms in Portugal
efficient after deregulation, the greatest source of industry improvement wasthe process of capital reallocation among incumbent firms.
The exercise of productivity growth accounting leads to different results indifferent economies and industries; it also depends on the particular definitionof productivity.16 However, the common message of all of these exercises isthe importance of the process of industry turnover, both in terms of entry andexit and in terms of resource reallocation among incumbents.
This naturally leads to the question: What can public policy do about it?I next argue that one of the primary areas of competition policy ought to beguaranteeing the basic conditions of economic mobility: a level-playing fieldwhere competition may work effectively towards the selection of the moreefficient firms.
4.3 Economic mobility
The Fundamental Theorem of Welfare Economics is remarkably robust.Although it is usually formulated in the context of perfect competition, whichis based on a lot of assumptions, one only really needs to assume (a) price-taking behavior and (b) free entry, exit, and mobility. In particular, as shownby Hopenhayn (1992), market efficiency is consistent with firm heterogeneityand imperfect information.
Most firms in the Portuguese or any other economy, especially small- andmedium-sized firms, face a fairly flat demand curve. It follows that price-takingbehavior is a fairly good first-order approximation. We are, thus, left withcondition (b). Unlike price-taking behavior, the ideal of economic mobilityis very far from the reality of the Portuguese and most other economies.
Contrary to the increasingly discredited advocates of a strong industrialpolicy (e.g., government investment in national champions), a growing ma-jority of economics scholars advocates that the best microeconomic policy isa good competition policy. And within micro policy I would advocate thatpromoting economic mobility plays a central role. Competition policy typicallyfocuses on concentrated industries, industries where firms have market power.Competitive industries (that is, industries where firms are price takers) arefrequently given less importance. But the term “competitive” can be deceiving:Price-taking behavior is an important step towards efficient competition, butit is not the only one. One must make sure that “competitive” industries aretruly competitive. This is where economic mobility comes in.
I denote by economic mobility the set of conditions ensuring that, incompetitive industries (industries where firms are price takers), competitionleads to an efficient equilibrium. Barriers to entry, such as the bureaucraticcosts of creating a new firm, are an obvious instance of a distortion thatdrives the market equilibrium away from the efficient outcome idealized bythe Fundamental Theorem. If all firms were equal, barriers to entry would notbe a very big problem: Fewer firms might enter than with no barriers, but the
16See Ahn (2001) for a survey.
L.M.B. Cabral
loss would not be that great if the size of the barrier was not that great.17 But allfirms are not equal; and so, more than higher prices, the implication of a barrierto entry is a lower rate of turnover and thus a less than perfect replacement ofless efficient incumbents.
But economic mobility is not just about barriers to entry. The empiricalevidence suggests that much of the reallocation of productive resources takesplace among active firms. Any artificial barrier that encumbers this processhas an effect on turnover similar to a barrier to entry. One example is givenby severance payments and, more generally, legal and economic restrictions tolayoffs; but there are other examples.
Another point suggested by the analysis in the previous section is that acrucial aspect of economic mobility is not so much the size of distortions buthow they differ across firms. In fact, the loss of productive efficiency is morelikely to come from the variation in the size of distortions than its size. It is badenough if potential entrants must pay an extra cost to become active; but it ismuch worse if some potential entrants must pay a higher cost than others.
There are several sources of cross-firm variation in barriers to entry andmobility. For example, when entry entails complicated bureaucratic steps, theworst thing that can happen is that some firms may be able to evade thosebureaucratic costs. Other important sources include fiscal evasion and moregenerally avoidance of government imposed regulations (labor, environmen-tal, and so forth). The point is that fiscal evasion, for example, is not simply aproblem of fairness, it is also an efficiency problem.
In sum, economic mobility is a set of conditions that create level-playingfields, one where firms can easily enter and exit, grow and shrink, accordingto their relative efficiency - an environment where market selection leads toefficient selection.
5 Final remarks
Most of microeconomics research in the past few decades has been devoted toshowing when and why markets do not work. The game theory revolution—promptly taken up by industrial economists—stresses the importance of mar-ket power. Other scholars, from Akerlof to Spence to Stiglitz, focus onasymmetric information and market failures. In the 1980s, work by Arthuret al. highlights the importance of increasing returns and non-ergodic marketoutcomes. It would seem that classical and neo-classical economics are dead.
In fact, the Fundamental Theorem of Welfare Economics is alive and well.True, there are industries with special problems of market power, asymmetricinformation, natural-monopoly structures, and so forth. But for the most part,
17This is, in essence, the point of Harberger’s (1954) estimate of the social cost from monopoly: Ifthe distortion is small, then the welfare loss is of second order.
Small firms in Portugal
the assumption of price-taking behavior is a fairly good first-order approxima-tion. And the Fundamental Theorem is then the best guide to public policy:create a level-playing field and let the market do the rest.
Acknowledgements I am grateful to Alberto Castro, José Mata, and two referees for theircomments.
References
Ahn S (2001) Firm dynamics and productivity growth: a review of micro evidence from OECDcountries, OECD Economics Department working paper 297, Paris, France
Albuquerque R, Hopenhayn H (2004) Optimal lending contracts and firm dynamics. Rev EconStud 71:285–315
Angelini P, Generale A (2005) Firm size distribution: do financial constraints explain it all?Evidence from survey data. Bank of Italy, Economic Research Department, Rome, Italy
Asplund M, Nocke V (2005) Firm turnover in imperfectly competitive markets. Rev Econ Stud73(2):295–327
Barrios S, Gorg H, Strobl E (2005) The evolution of the firm size distribution and nationality ofOwnership. Econ Bull 12:1–11
Bartelsman E, Haltiwanger J, Scarpetta S (2004) Microeconomic evidence of creative destructionin industrial and developing countries. IZA discussion paper 1374
Bartelsman E, Haltiwanger J, Scarpetta S (2005) Measuring and analyzing cross-country differ-ences in firm dynamics. Free University Amsterdam, University of Maryland, World Bank
Bartelsman E, Scarpetta S, Schivardi F (2003) Comparative analysis of firm demographics and sur-vival: micro-level evidence for the OECD countries, OECD Economics Department workingpaper 348
Cable J, Schwalbach J (1991) International comparisons of entry and exit. In: Geroski PA,Schwalbach J (eds) Entry and market contestability. An International Comparison, Oxford,pp 257–281
Cabral L (1995) Sunk costs, firm size and firm growth. J Ind Econ 43:161–172Cabral L (2000) Introduction to industrial organization. MIT, Cambridge, MACabral L (2005) Economic mobility. In: Proceedings of the I Lisbon conference on competition
law and economics, the Hague. Kluwer Law International, The NetherlandsCabral L, Mata J (2003) On the evolution of the firm size distribution: facts and theories. Am Econ
Rev 93:1075–1090Conway P, Janod V, Nicoletti G (2003) Product market regulation in OECD countries: 1998 to
2003. OECD Economics Department working paper 419Cooley TF, Vincenzo Q (2001) Financial markets and firm dynamics. Am Econ Rev 91(5):1286–
1310 (December)Djankov S, La Porta R, Lopez-de-Silanes F, Shleifer A (2002) The regulation of entry. Q J Econ
117:1–38Dunne T, Hughes A (1994) Age, size, growth and survival: UK companies in the 1980s. J Ind Econ
17:115–140Dunne T, Roberts M, Samuelson L (1989) The growth and failure of U.S. manufacturing plants.
Q J Econ 104:671–688Ericson R, Pakes A (1995) Markov-perfect industry dynamics: a framework for empirical work.
Rev Econ Stud 62:53–82Evans D (1987) The relation between firm growth, size, and age: estimates for 100 manufacturing
industries. J Ind Econ 35:567–581Fagiolo G, Luzzi A (2004) Do liquidity constraints matter in explaining firm size and growth?
Some evidence from the Italian manufacturing industry. LEM working paper 2004/08,Sant’Anna School of Advanced Studies, April
Geroski P (1991) Market dynamics and entry. Blackwell, OxfordGeroski P (1996) What do we know about entry? Int J Ind Organ 13:421–440Geroski P, Schwalbach J (eds)(1991) Entry and market contestability. Blackwell, Oxford

L.M.B. Cabral
Gibrat R (1931) Les Inegalités Economiques. Applications: Aux Inégalités des Richesses, a laConcentration des Entreprises, Aux Populations des Villes, Aux Statistiques des Familles,etc., d’une Loi nouvelle: La Loi de L’ffect Proportionnel. Sirey, Paris
Hall B (1987) The relationship between firm size and firm growth in the U.S. manufacturing sector.J Ind Econ 35:583–606
Harberger AC (1954) Monopoly and resource allocation. Am Econ Rev 44:77–87Hopenhayn H (1992) Entry, exit, and firm dynamics in long run equilibrium. Econometrica
60:1127–1150Hopenhayn H, Rogerson R (1993) Job turnover and policy evaluation: a general equilibrium
analysis. J Polit Econ 101:915–938Jovanovic B (1982) Selection and evolution of industry. Econometrica 50:649–670Lotti F, Santarelli E (2004) Industry dynamics and the distribution of firm sizes: a non parametric
approach. South Econ J 70:443–466Lucas R (1978) On the size distribution of business firms. Bell J Econ 9:508–523Mata J, Portugal P (1994) Life duration of new firms. J Ind Econ 42:227–246Mata J, Portugal P, Guimarães P (1994) The survival of new plants: start-up conditions and post-
entry evolution. Int J Ind Organ 13:459–481Olley SG, Pakes A (1996) The dynamics of productivity in the telecommunications equipment
industry. Econometrica 64:1263–1297Pakes A, Ericson R (1998) Empirical implications of alternative models of firm dynamics. J Econ
Theory 79:1–45Restuccia D, Rogerson R (2003) Policy distortions and aggregate productivity with heterogeneous
plants. University of Toronto and Arizona State University, Toronto, Canada; and Phoenix,Arizona
Sutton J (1997) Gibrat’s legacy. J Econ Lit 35:40–59Syverson C (2004a) Product substitutability and productivity dispersion. Rev Econ Stat 86:534–50Syverson C (2004b) Market structure and productivity: a concrete example. J Polit Econ 112:
1181–1222Tirole J (1988) The theory of industrial organization. MIT, Cambridge, MA