special city council meeting agenda - city of...
TRANSCRIPT
Special City Council Meeting Agenda
Thursday, October 26, 2017 – 2:00 p.m. Council Chambers, Guelph City Hall, 1 Carden Street
Please turn off or place on non-audible all electronic devices during the meeting. Please note that an electronic version of this agenda is available on guelph.ca/agendas. Open Meeting– 2:00 p.m.
Disclosure of Pecuniary Interest and General Nature Thereof Special Council - Presentation and Delegations for Non-Tax
Supported Budgets and Tax Supported and Non-Tax Supported Capital Budget
CON-2017.47 2018 Non-Tax Supported Operating Budget Presentation: Trevor Lee, Deputy CAO, Corporate Services Scott Stewart, Deputy CAO, Infrastructure, Development and Enterprise Kealy Dedman, General Manager, Engineering Capital Infrastructure Services/City Engineer Brad Coutts, General Manager, Court Services Todd Salter, General Manager, Planning, Urban Design and Building Services Peter Busatto, General Manager, Environmental Services Delegations: Joe Farwell, CAO, Grand River Conservation Authority Sonja Radoja, Manager of Finance, Grand River Conservation Authority Recommendation:
That Report No. CS-2017-29 titled ‘2018 Non-Tax Supported Operating Budget’ be referred to the November 2, 2017 Council Budget meeting.
1. That for Stormwater Services the following be approved:
1. 2018 Stormwater Services Operating Budget in the amount of
$6,052,000, inclusive of reserve transfers as outlined in ATT-1; 2. A City of Guelph stormwater base charge of $4.60 per month per
Equivalent Residential Unit (ERU) effective January 1, 2018; and
City of Guelph Council Agenda – October 26, 2017 Page 1 of 3

3. That the Stormwater Fees and Services By-Law be passed.
2. A 2017 Court Services Operating Budget in the amount of $3,940,300, inclusive of the reserve transfer, as outlined in ATT-1.
3. A 2017 Ontario Building Code Administration Operating Budget in the
amount of $3,515,670, inclusive of the reserve transfer, as outlined in ATT-1.
4. That for Water and Wastewater Services the following be approved:
1. Proposed expansion package in the net amount of $126,300 for
Water Services as outlined in ATT-2; 2. 2018 Water and Wastewater Services Operating Budgets in the
amounts of $30,966,468 and $31,411,049 respectively, inclusive of the expansion request and reserve transfers, as outlined in ATT-1;
3. A City of Guelph water volume charge of $1.72 per cubic metre effective January 1, 2018 and wastewater volume charge of $1.84 per cubic metre, effective January 1, 2018;
4. That the City of Guelph water and wastewater basic service charges remain consistent with 2017 per ATT-3 effective January 1, 2018; and
5. That Water Services and Wastewater Services Fees and Services By-Law be passed.
CON-2017.48 2018-2027 Capital Budget and Forecast Presentation: Trevor Lee, Deputy CAO, Corporate Services Tara Baker, General Manager, Finance/Treasurer Delegations: Carolyn Weatherson, Rotary Club of Guelph Jim MacKenzie, Rotary Club of Guelph Anne Gajerski-Cauley Paul Costello, Council of Canadians Guelph Chapter Correspondence: Susan Watson Recommendation:
That Report No. CS-2017-81 titled ‘2018–2027 Capital Budget and Forecast’ be referred to the November 2, 2017 Council meeting;
1. That the 2018 Capital Budget in the gross amount of $90,788,062 be
approved;
City of Guelph Council Agenda – October 26, 2017 Page 2 of 3

2. 2019-2027 Capital Forecast in the gross amount of $1,179,706,044 be received for information.
Adjournment
City of Guelph Council Agenda – October 26, 2017 Page 3 of 3

Page 1 of 10
Staff Report
To City Council
Service Area Corporate Services
Date Thursday, October 26, 2017
Subject 2018 Non-Tax Supported Operating Budget Report Number CS-2017-29
Recommendation
That Report No. CS-2017-29 titled ‘2018 Non-Tax Supported Operating Budget’ be referred to the November 2, 2017 Council Budget meeting.
1. That for Stormwater Services the following be approved:
1. 2018 Stormwater Services Operating Budget in the amount of $6,052,000, inclusive of reserve transfers as outlined in ATT-1;
2. A City of Guelph stormwater base charge of $4.60 per month per Equivalent Residential Unit (ERU) effective January 1, 2018; and
3. That the Stormwater Fees and Services By-Law be passed.
2. A 2017 Court Services Operating Budget in the amount of $3,940,300,
inclusive of the reserve transfer, as outlined in ATT-1. 3. A 2017 Ontario Building Code Administration Operating Budget in the amount
of $3,515,670, inclusive of the reserve transfer, as outlined in ATT-1.
4. That for Water and Wastewater Services the following be approved:
1. Proposed expansion package in the net amount of $126,300 for Water
Services as outlined in ATT-2; 2. 2018 Water and Wastewater Services Operating Budgets in the amounts
of $30,966,468 and $31,411,049 respectively, inclusive of the expansion request and reserve transfers, as outlined in ATT-1;
3. A City of Guelph water volume charge of $1.72 per cubic metre effective
January 1, 2018 and wastewater volume charge of $1.84 per cubic metre, effective January 1, 2018;
4. That the City of Guelph water and wastewater basic service charges remain consistent with 2017 per ATT-3 effective January 1, 2018; and
5. That Water Services and Wastewater Services Fees and Services By-Law be passed.

Page 2 of 10
Executive Summary
Purpose of Report
To present the proposed 2018 Non-Tax Supported Operating Budget for Council
deliberation and approval.
Key Findings
All non-tax supported budgets utilize a strategy of sound financial planning combined with comprehensive financial management tools to ensure the
appropriate levels of expenditure, reserve and reserve fund management, and sourcing of external funding.
The Stormwater budget and corresponding rate is prepared following the Council approved sustainable funding strategy. New in 2018 is the incorporation of the
credit and rebate program which was approved by Council in July of 2017. (See IDE 17-87 Stormwater Service Fee - Credit Program Feasibility Report)
Water and Wastewater budgets and corresponding rates are prepared taking into consideration the average of local water bills for the City’s list of comparable
municipalities, while ensuring regulatory compliance and progress towards financial and infrastructure sustainability.
Financial Implications
Based on the recommended changes to user fees and rates (Water, Wastewater and Stormwater), the average annual household impact is estimated at $23 based
on the average annual water consumption of a three person household (180 cubic metres) and the monthly Stormwater fee for one Equivalent Residential Unit (ERU).
The 2018 Court Services budget increased by 1.0 per cent compared to the 2017 budget. This budget has two components with year over year changes as follows:
the Provincial Offences Act (POA) Court Services budget decreased by 3.2 per cent; and the Parking Ticket Fine Collections budget increased by 12.1 per cent.
The 2018 Ontario Building Code (OBC) Administration budget increased by 3.7 per cent compared to the 2017 budget.
Report
The City of Guelph's proposed Non-Tax Supported Budget includes Stormwater
Services, Court Services, Ontario Building Code (OBC) Administration budgets, Water Services, and Wastewater Services. The Non-Tax Supported Operating
budget maintains the health and safety of the community, meets legislative requirements, and supports exceptional customer service. The departments are self-supporting and do not require funding from the tax levy. The costs associated
with these respective services will be completely recovered through user fees and other non-tax supported revenues.

Page 3 of 10
The proposed 2018 operating budgets for all five departments reflect operating increases including compensation, goods and services, internal charges, and contributions to and from reserves and reserve funds. Where required, an
expansion has been requested to allow for more efficient and effective service delivery, ensure legislative compliance, and to meet Council approved service
standards. Corporate pressures such as compensation, utilities, fuel, and payment in lieu of
taxes have been incorporated into the base budget. Compensation increases are approximately 3.0 per cent year-over-year and utilities and payment in lieu of taxes
are approximately 2.6 per cent.
Stormwater Services
Stormwater Services are projecting an increase to user rates for 2018 and beyond. Consistent with the Council-approved sustainable funding strategy, staff
recommends a rate increase in 2018 of $0.60, which has an average annual household impact of $7.20 bringing the average residential bill to $55.20 annually.
Significant changes to the Stormwater Services Operating Budget include:
Revenue
$1,831,000 increase in user fees due to City growth and ongoing database
reconciliation resulting in approximately 21,000 additional ERUs.
Ongoing work through Corporate Asset Management has refined the
sustainable funding target to $11.1 million.
Expenses
$385,747 increase to support the corporate locates program;
$330,000 increase to introduce the credit and rebate program; and
$1,541,853 increase in the transfer to capital reserve to work towards the
annual sustainable level.
Court Services
The 2018 Court Services operating budget supports the running of operations as efficiently and effectively as possible. There are no expansions being requested in
2018. The overall Court Services budget increased by 1.0 per cent compared to the 2017 budget. This budget has two components with year-over-year changes as follows: the Provincial Offences Act (POA) Court Services budget decreased by 3.2
per cent; and the Parking Ticket Fine Collections budget increased by 12.1 per cent.
Significant changes to the Court Services Operating Budget include: Revenue
$108,700 decrease in POA fine revenue due to declining charge volumes.
Includes $24,000 increase in revenue for new collections processing fee.
$129,700 increase in the transfer from parking ticket fine collections budget to
Bylaw, Operations (tax-supported budget) due to the increase in fine revenues.
Page 4 of 10
Expenses
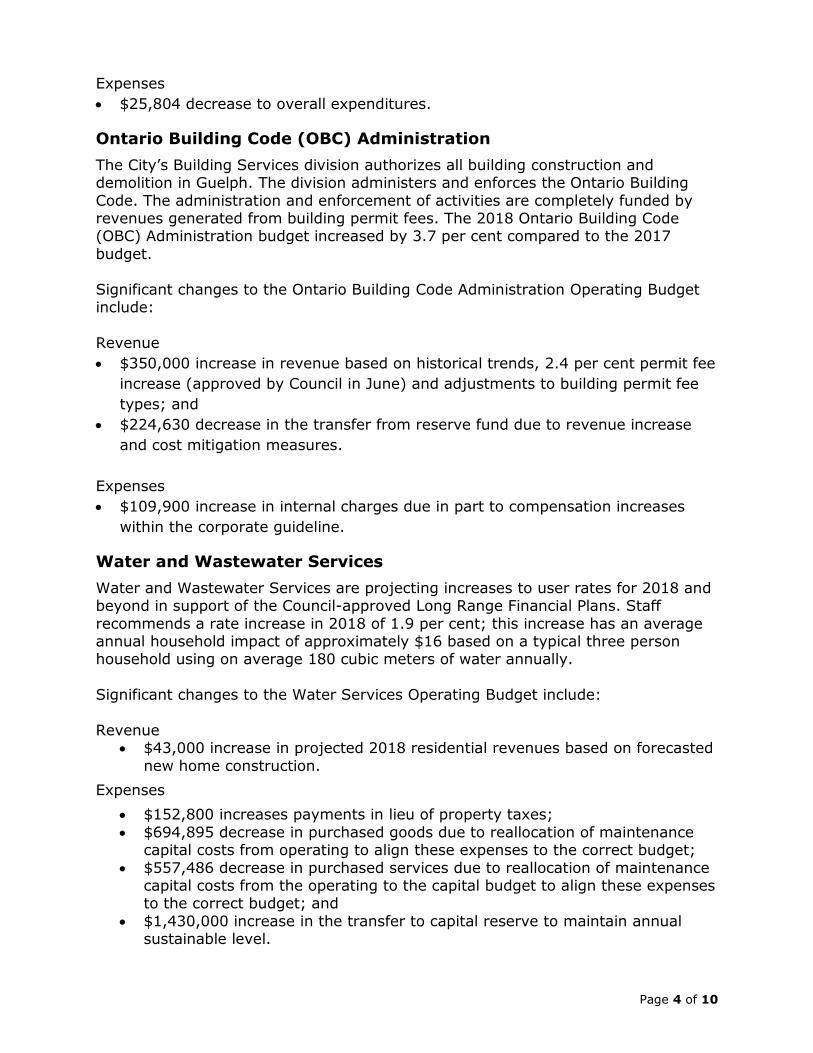
$25,804 decrease to overall expenditures.
Ontario Building Code (OBC) Administration
The City’s Building Services division authorizes all building construction and demolition in Guelph. The division administers and enforces the Ontario Building
Code. The administration and enforcement of activities are completely funded by revenues generated from building permit fees. The 2018 Ontario Building Code (OBC) Administration budget increased by 3.7 per cent compared to the 2017
budget.
Significant changes to the Ontario Building Code Administration Operating Budget include:
Revenue
$350,000 increase in revenue based on historical trends, 2.4 per cent permit fee
increase (approved by Council in June) and adjustments to building permit fee
types; and
$224,630 decrease in the transfer from reserve fund due to revenue increase
and cost mitigation measures.
Expenses
$109,900 increase in internal charges due in part to compensation increases
within the corporate guideline.
Water and Wastewater Services
Water and Wastewater Services are projecting increases to user rates for 2018 and beyond in support of the Council-approved Long Range Financial Plans. Staff
recommends a rate increase in 2018 of 1.9 per cent; this increase has an average annual household impact of approximately $16 based on a typical three person household using on average 180 cubic meters of water annually.
Significant changes to the Water Services Operating Budget include:
Revenue
$43,000 increase in projected 2018 residential revenues based on forecasted
new home construction.
Expenses
$152,800 increases payments in lieu of property taxes;
$694,895 decrease in purchased goods due to reallocation of maintenance capital costs from operating to align these expenses to the correct budget;
$557,486 decrease in purchased services due to reallocation of maintenance capital costs from the operating to the capital budget to align these expenses to the correct budget; and
$1,430,000 increase in the transfer to capital reserve to maintain annual sustainable level.

Page 5 of 10
Significant changes to the Wastewater Services Operating Budget include:
Revenue
$46,000 increase in projected 2018 residential revenues based on forecasted new home construction; and
$200,000 increase in revenue received from industrial effluent to sanitary sewers that do not meet the sewer use by-law. Agreements enable industrial operations to continue while working towards compliance.
Expenses
$146,100 increase in payments in lieu of property tax; $165,700 decrease in water and electricity costs due to on-going
collaborative work with the Climate Change Office; and $250,000 increase in the capital reserve transfer to work towards the annual
sustainable level.
Financial Implications
Water, Wastewater and Stormwater Services
The following volumetric rates, basic charge and monthly stormwater charges are
proposed for 2018:
n/a 2017 2018 Change
Water volume charge $/cubic metre $1.67 $1.72 $0.05
Water basic charge $/day $0.26 $0.26 $0.00
Wastewater volume charge $/cubic metre $1.80 $1.84 $0.04
Wastewater basic charge $/day $0.32 $0.32 $0.00
Average residential annual bill (Water &
Wastewater)
$836.30 $852.50 $16.20 or 1.9%
Stormwater monthly charge $4.00 $4.60 $0.60
Average residential annual bill (Water,
Wastewater & Stormwater)
$884.30 $907.70 $23.40 or
2.6%
These rates reflect an overall increase of 2.6 per cent or approximately $23 to the
average residential household.
Consultations
The public was invited to a delegation evening on October 26, 2017. The public
meeting notification was placed in local newspapers and on the City’s website.

Page 6 of 10
Corporate Administrative Plan
Overarching Goals Financial Stability
Innovation
Service Area Operational Work Plans Our Services - Municipal services that make lives better Our People- Building a great community together
Our Resources - A solid foundation for a growing city
Attachments
ATT-1 Reserve and Reserve Fund Transfers ATT-2 Expansion: Meter Installer ATT-3 2018 Water and Wastewater Basic Service Charge Summary
Attachments provided under a separate cover
2018 Stormwater Services Operating Budget 2018 Court Services Operating Budget 2018 Ontario Building Code Administration Operating Budget
2018 Water Services Operating Budget 2018 Wastewater Services Operating Budget
Departmental Approval
Karen Newland, Manager Finance Client Services
Report Author
Patricia Zukowski, Corporate Analyst Raquel Gurr, Corporate Analyst
__________________________ __________________________ Approved By Recommended By
Tara Baker Trevor Lee Treasurer, GM of Finance Deputy CAO, Corporate Services (519) 822-1260 ext. 2334 (519) 822-1260 ext. 2281

Page 7 of 10
ATT-1 Reserve and Reserve Fund Transfers
n/a 2018 Transfer
Building Services OBC Stabilization Reserve Fund
($165,670)
Courts Capital Reserve Fund $398,109
Water Services Capital Reserve Fund $14,400,000
Wastewater Services Capital Reserve Fund $13,500,000
Stormwater Contingency Reserve ($380,000)*
Stormwater Capital Reserve Fund $4,494,150
* 2018 transfer includes $480,000 transferred from 2017 projected surplus per
Credit/Rebate Policy Council Report.

Page 8 of 10
ATT-2 Expansion: Meter Installer
Service area: IDE- Environmental Services
Department: Water Services
Category: Growth
Corporate Administrative Plan Connection: Service Investment
Number of FTEs: 1 FTE
Table 1, Budget impacts
Year Expense Funding Source
2018 $126,300 Non-Tax Supported Operating
2019 $ 74,400 Non-Tax Supported Operating
2020 $ 75,800 Non-Tax Supported Operating
Overview of request
Water Services currently possesses 3 FTE meter installers who are responsible for the installation of new meters in support of community growth, maintenance/
replacement of existing meter assets, and customer metering field issue investigation and resolution. With staffing levels remaining static for this service
during community growth and a significant proportion of this team’s workload being reactive (i.e. subject to pace/magnitude of community development and based on field reading issues realized through the routine monthly billing of approximately
44,000 customer meters) capacity of the City’s meter shop is greatly constrained at this time. The American Water Works Association (AWWA) requires that billing
meters for water and wastewater possess an active asset life of 15 years, after which point meter inaccuracy or failure may be experienced. Based on this performance standard, 18,515 meters (or 44.7% of the City’s residential sector
metering stock) is currently outside of its asset life cycle and subject to under-registry through ongoing capture of data in support of utility revenue billing.
Benefits
Anticipated benefits of this expansion include: Enhanced staffing capacity would allow for more proactive maintenance/
management of the City’s metering assets, thus increasing meter accuracy
and associated revenues to the City.
Provision of the necessary number of base staff, four,(4) required to initiate
meter installer on-call rotation, thus halting the practice of certified
distribution operators responding to meter-based customer issues after hours
at overtime wage premiums.
Expansion would support reallocation of lower value work within the team to
allow more senior employees to implement enhanced standard of care for

Page 9 of 10
large volume/revenue billing meters and improving revenue security
amongst these more significant billing meters.
Risks of not proceeding with request Risks of not supporting this expansion include the following:
Ongoing promotion of current asset renewal investment backlog;
Loss of potential revenues and/or failure to collect adequate water/ wastewater revenues;
Private property damage associated with City not appropriately managing its assets thus driving damages should devices/fittings fail within private premises;
Increased claim volumes and payouts by the City as aged meters and fittings continue to deteriorate and fail; and
Loss of reputation from customer billing inequities claims.
Options considered Options considered include the following:
Do nothing: not preferred as this comes to emphasize and perpetuate current risk;
Seek contract position in lieu of FTE: not supported under collective bargaining agreement for duration required;
Outsource works: not supported due to conflict with current union duties and
collective bargaining agreement; and Hire Meter Installer FTE: preferred alternative to conduct ongoing base meter
replacement and maintenance works.

Page 10 of 10
ATT-3 2018 Water and Wastewater Basic Service Charge Summary (stated as a daily charge)
Water Basic Service Charge
Meter
size
2017 Basic
Service Charge
2018 Basic
Service Charge
$ Change
5/8 "x1/2 $0.26 $0.26 $0.00
3/4 " $0.26 $0.26 $0.00
1 " $0.35 $0.35 $0.00
1 1/2 " $0.91 $0.91 $0.00
2 " $1.99 $1.99 $0.00
3 " $4.21 $4.21 $0.00
4 " $7.26 $7.26 $0.00
6 " $13.61 $13.61 $0.00
8 " $23.71 $23.71 $0.00
10 " $39.14 $39.14 $0.00
Wastewater Basic Service Charge
Meter
size
2017 Basic
Service Charge
2018 Basic
Service Charge
$ Change
5/8 "x1/2 $0.32 $0.32 $0.00
3/4 " $0.32 $0.32 $0.00
1 " $0.52 $0.52 $0.00
1 1/2 " $1.37 $1.37 $0.00
2 " $3.09 $3.09 $0.00
3 " $6.27 $6.27 $0.00
4 " $11.22 $11.22 $0.00
6 " $21.08 $21.08 $0.00
8 " $37.13 $37.13 $0.00
10 " $61.87 $61.87 $0.00

1
2018 Draft Budget City of Guelph November 2, 2017

2
About the Grand River Watershed
300 km
Length
6,800 km2 larger than Prince Edward Island
Area

3
About the Grand River Watershed
Lake Erie at Port Maitland
Flows into
11,000 km
Length of rivers and streams
Speed, Eramosa, Nith and Conestogo
4 major tributaries

4
About the Grand River Watershed
Close to one million
Population
39 municipalities and two First Nations 80% of people live in five cities: Kitchener, Waterloo, Guelph, Cambridge, Brantford
Boundaries
5
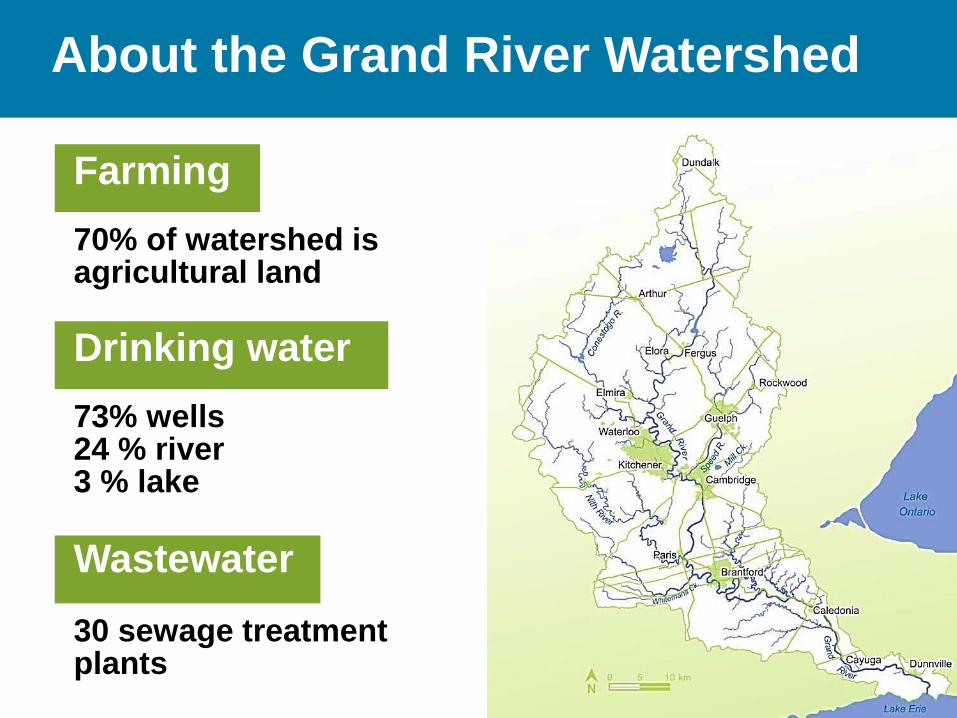
About the Grand River Watershed
70% of watershed is agricultural land
Farming
73% wells 24 % river 3 % lake
Drinking water
30 sewage treatment plants
Wastewater

6
About the Grand River Watershed
• The Grand River lies at the heart of one of the richest, fastest growing regions in Ontario.
• The vitality of the watershed has been linked to the river and the natural environment.
• The Grand River watershed faces important and evolving challenges…

7
Critical Issues
• Need for water supplies, sewage treatment, groundwater recharge
Population Growth

8
Critical Issues
• impact on water quality and quantity
• erosion needs to be addressed to protect farmland and water quality
Extensive Agriculture

9
Critical Issues
• the issue of our time – presents new challenges including increased frequency of extreme events (floods, droughts, ice storms, etc.)
Climate Change
Photo: Guelph Today

10
GRCA Strategic Plan
Objectives: 1. Protect life and
minimize property damage
2. Improve watershed health
3. Connect people with the environment

11
Understanding and Responding
• Seven dams reservoirs actively managed to reduce flood damages and maintain flows
Protect life and minimize property damage

12
Understanding and Responding
• Working with senior levels of government to find innovative ways to improve floodplain mapping
• Ability to regulate hazard areas and prevent building in wetlands
Protect life and minimize property damage

13
Understanding and Responding
• Deliver value and innovation
• Improved flood forecasting and warning
Protect life and minimize property damage

14
Understanding and Responding
Protect life and minimize property damage
• Improved monitoring and preparedness
• Adapting to climate change

15
Understanding and Responding
Planning and Development • GRCA assists member
municipalities in the development of official plans and zoning by-laws
• GRCA provides technical advice on Planning Act applications, including input from biologists, water resource engineers and resource planners
Protect life/ property & Improve watershed health

16
Understanding and Responding
• Grand River Source Protection Plan took effect July 1, 2016
• Province funded 100% of Plan’s development
• Guelph-Guelph/Eramosa Water Quantity Policy Development Study is now getting started
Improve watershed health

17
Understanding and Responding
The Water Management Plan builds resiliency to address challenges related to climate change, population growth and agriculture.
The Wastewater Optimization Program builds upon the successful optimization work in municipalities like Guelph.
Improve watershed health

18
Understanding and Responding
Rural Water Quality Program Watershed Success 1998-2016:
• Over 5,500 projects
• $16 million in grant
• More than $45 million invested
Improve watershed health
19
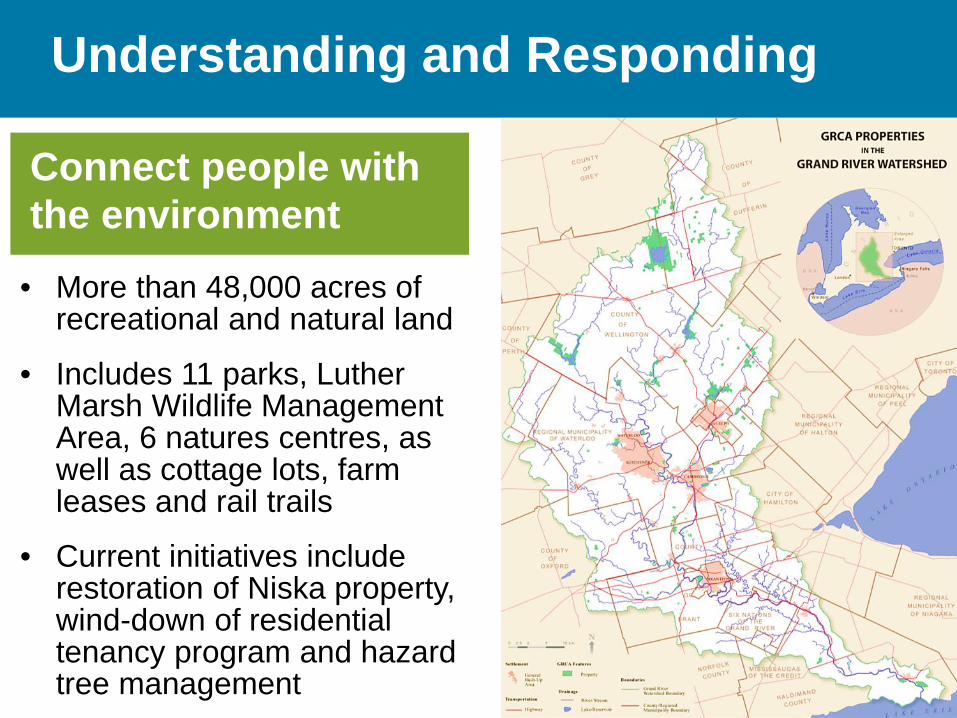
Understanding and Responding
Connect people with the environment
• More than 48,000 acres of recreational and natural land
• Includes 11 parks, Luther Marsh Wildlife Management Area, 6 natures centres, as well as cottage lots, farm leases and rail trails
• Current initiatives include restoration of Niska property, wind-down of residential tenancy program and hazard tree management

20
Understanding and Responding
Connect people with the environment
GRCA Parks/Conservation Areas • Weather dependent • Revenue forecasts are prone to
significant fluctuations • 2015, 2016 and 2017 have been
good years for revenue Natural Areas • Increasing management and cost
pressures due to population growth and changing demographics

21
Some thoughts on Nature …
If we teach them, they will understand it. If they understand it, they will value it. If they value it, they will protect it.
The Future needs: Biologists, Engineers, Resource Managers, Planners, Accountants, Educators, Economists. We must all communicate, collaborate and cooperate.
Understanding and Responding
Connect people with the environment

22
Understanding and Responding
Future Guelph Lake Nature Centre • Project timelines contingent on
funding – goal is for construction to take place within next 5 years
• GRCF has raised about $1.2 million
• Estimated cost – between $2 and $2.5 million
• Will be located in Guelph Lake Park, and will serve both nature centre and park programs
• Will be added to budget once timelines and funding confirmed
Connect people with the environment

23
2018 Draft Budget
Timetable
September 22, 2017 → Draft #1 to General Meeting
January 24, 2018 → Municipalities advised of Meeting Date for Budget
January 26, 2018 → Draft #2 to General Meeting
February 23, 2018 → Board Approval, 2018 Budget & Levy (AGM)
(Presentations to municipal councils between October 2017 and February 2018 as required)

24
2018 Draft Budget
Overview
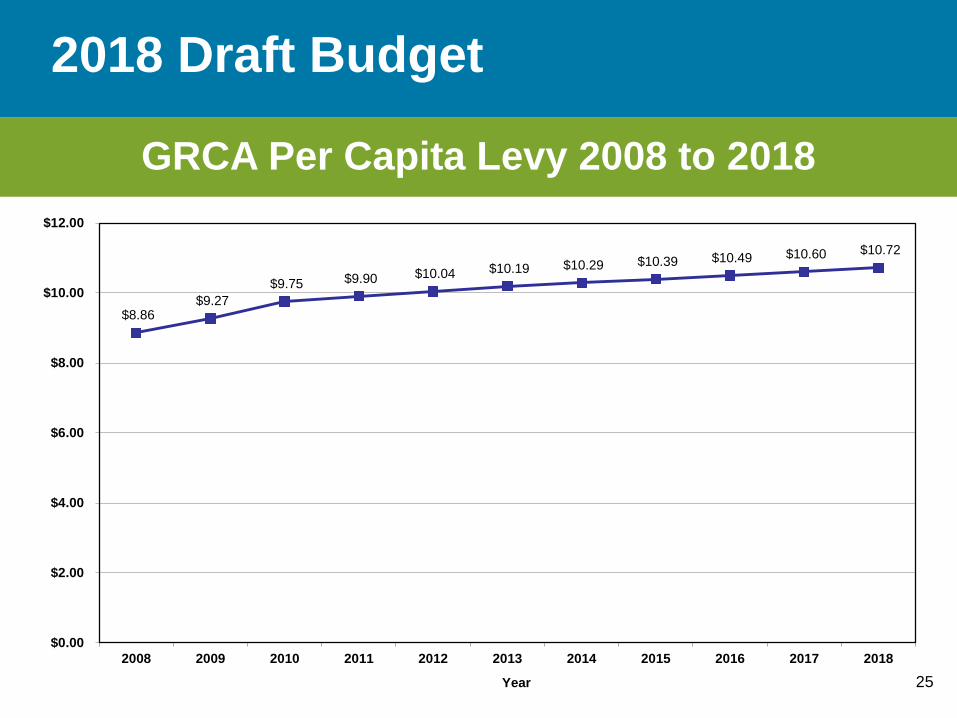
• 2018 expenditures: $32.0 million ($31 million in 2017) • Municipal dollars highly leveraged ($1 in municipal
levy matched by $2 from other sources) • Per capita municipal levy: $10.72
25
2018 Draft Budget
GRCA Per Capita Levy 2008 to 2018
$8.86 $9.27
$9.75 $9.90 $10.04 $10.19 $10.29 $10.39 $10.49 $10.60 $10.72
$0.00
$2.00
$4.00
$6.00
$8.00
$10.00
$12.00
2008 2009 2010 2011 2012 2013 2014 2015 2016 2017 2018
Year
26
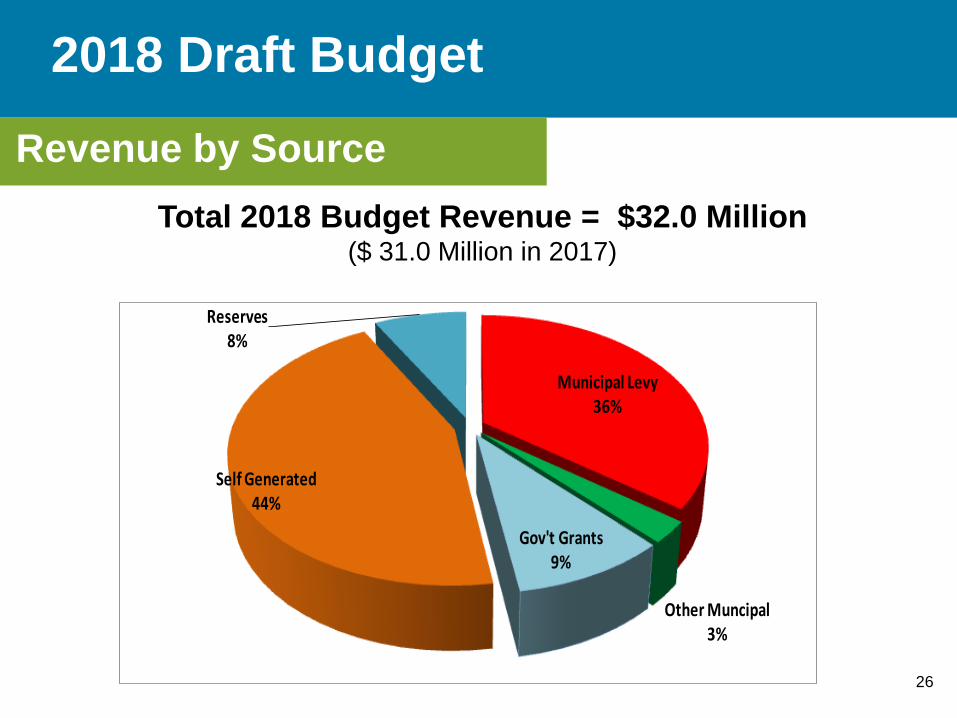
2018 Draft Budget Revenue by Source
Total 2018 Budget Revenue = $32.0 Million ($ 31.0 Million in 2017)
Municipal Levy36%
Other Muncipal3%
Gov't Grants9%
Self Generated44%
Reserves8%

27
2018 Draft Budget
Revenue
General Municipal Levy • Increasing by 2.5%
to $11,352,000 in 2018
• Operating Levy increasing 2.8% or $277,000
• Capital Levy held constant at $1,050,000

28
2018 Draft Budget
Revenue
Special Projects • Expenses are offset
100% by special funding sources
• Do not use general municipal levy to fund these projects

29
2018 Draft Budget Expenditures by Category
Base Programs (Operating)
78%
Base Programs (Capital)
12%
Special Projects10%
2018 Budget Expenditures = $32.0 Million ($ 31.0 million in 2017)

30
2018 Draft Budget
Expenditures
Operating Budget ($24.9 million) • Watershed
Management (dams, flood forecasting, planning, lands
• Conservation Areas
• Corporate Services and Communication

31
2018 Draft Budget
Expenditures
Capital Budget ($3.8 million) • Water Control Structures
• Conservation Areas

32
2018 Draft Budget
Expenditures
Special Projects ($3.2 million) • Floodplain Mapping • Parkhill Hydro Turbine • Children’s Water Festivals • Water Management Plan • Mill Creek Rangers • Source Protection Program • Emerald Ash Borer • Rural Water Quality Program

33
2018 Draft Budget
Grand River Conservation Authority Summary of Municipal Levy - 2018 Budget
% CVA in 2017 CVA CVA-Based 2018 Budget 2018 Budget 2018 Budget Actual Watershed (Modified) CVA in Watershed Apportionment Operating Levy Capital Levy Total Levy 2017 Levy % Change
Brant County 84.0% 5,778,502,491 4,853,942,092 3.20% 329,962 33,630 363,592 354,137 2.7% Brantford C 100.0% 12,178,149,735 12,178,149,735 8.04% 827,847 84,376 912,223 897,489 1.6% Amaranth Twp 82.0% 651,361,270 534,116,241 0.35% 36,308 3,701 40,009 39,009 2.6% East Garafraxa Twp 80.0% 498,143,467 398,514,773 0.26% 27,090 2,761 29,851 29,452 1.4% Town of Grand Valley 100.0% 396,850,584 396,850,584 0.26% 26,977 2,750 29,727 27,291 8.9% Melancthon Twp 56.0% 481,524,449 269,653,692 0.18% 18,331 1,868 20,199 19,694 2.6% Southgate Twp 6.0% 815,068,745 48,904,125 0.03% 3,324 339 3,663 3,620 1.2% Haldimand County 41.0% 5,888,880,157 2,414,440,864 1.59% 164,129 16,728 180,857 183,117 -1.2% Norfolk County 5.0% 8,186,035,325 409,301,766 0.27% 27,824 2,836 30,660 30,831 -0.6% Halton Region 10.3% 36,402,339,213 3,765,423,823 2.48% 255,966 26,089 282,055 271,150 4.0% Hamilton City 4.7% 77,135,348,277 3,625,361,369 2.39% 246,445 25,118 271,563 263,512 3.1% Oxford County 37.7% 3,548,847,438 1,337,821,840 0.88% 90,943 9,269 100,212 99,302 0.9% North Perth T 2.0% 1,770,295,097 35,405,902 0.02% 2,407 245 2,652 2,563 3.5% Perth East Twp 40.0% 1,600,912,173 640,364,869 0.42% 43,531 4,437 47,968 45,952 4.4% Waterloo Region 100.0% 86,368,658,180 86,368,658,180 56.99% 5,871,175 598,402 6,469,577 6,314,548 2.5% Centre Wellington Twp 100.0% 4,246,127,695 4,246,127,695 2.80% 288,644 29,419 318,063 312,036 1.9% Erin T 49.0% 2,223,001,923 1,089,270,942 0.72% 74,047 7,547 81,594 81,701 -0.1% Guelph C 100.0% 22,830,352,868 22,830,352,868 15.06% 1,551,964 158,179 1,710,143 1,646,748 3.8% Guelph Eramosa Twp 100.0% 2,374,434,372 2,374,434,372 1.57% 161,409 16,451 177,860 175,520 1.3% Mapleton Twp 95.0% 1,408,733,893 1,338,297,198 0.88% 90,975 9,272 100,247 95,992 4.4% Wellington North Twp 51.0% 1,432,770,017 730,712,708 0.48% 49,672 5,063 54,735 53,415 2.5% Puslinch Twp 75.0% 2,216,998,019 1,662,748,514 1.10% 113,030 11,520 124,550 127,922 -2.6%
Total 278,433,335,385 151,548,854,151 100.00% 10,302,000 1,050,000 11,352,000 11,075,000 2.5%

34
Questions?

Page 1 of 10
Staff Report
To City Council
Service Area Corporate Services
Date Thursday, October 26, 2017
Subject 2018-2027 Capital Budget & Forecast Report Number CS-2017-81
Recommendation
That Report No. CS-2017-81 titled ‘2018–2027 Capital Budget and Forecast’ be referred to the November 2, 2017 Council meeting;
1. That the 2018 Capital Budget in the gross amount of $90,788,062 be approved;
2. 2019-2027 Capital Forecast in the gross amount of $1,179,706,044 be received for information.
Executive Summary
Purpose of Report
To introduce the recommended 2018-2027 Capital Budget and Forecast.
Key Findings
For the first time, we are providing Council with a single, fully-integrated capital budget for approval separate from the respective operating budgets that fund the
various capital reserves.
The 2018 budget is, as expected, heavily focused on infrastructure renewal, with 79 per cent of the requested budget going towards projects that will provide for the replacement, renewal or reconstruction of existing City assets. These projects
ensure that the City is able to deliver services while maintaining health and safety standards and meeting legislative requirements.
The recommended 2018-2027 Capital Budget and Forecast represents the administration’s response to the challenge of balancing a wide and complex range
of short-term and long-term needs within existing resources. Funding levels are not sufficient to meet all the capital needs of the City and as a result, prioritization was
required and many projects were deferred into future years. The recommended budget also maintains capital reserve funds in accordance with best practice and
the Reserve and Reserve Fund Policy.

Page 2 of 10
In the development of the capital budget, an integrated, cross-functional budget team used the following elements when prioritizing capital investments for 2018:
Health and safety of our community
Legislated or regulatory environment mandated Contractual obligations Council Shared Agenda, previous Council decisions, and the Corporate
Administrative Plan Enterprise Risk Management Criterion
Resource capacity Based on this process, staff is recommending the following:
2018 Capital Budget $90,788,062
2019-2027 Forecast $1,179,706,044 The 2019-2027 Capital Forecast is not fully funded; based on the current capital
transfer rates it is underfunded by $420 million. The focus of staff over the next year will be to review and re-sequence the underlying projects to meet available
funding. This will result in a forecast that extends over a 20-25 year period. Staff will start this work as soon as the 2018 Capital Budget is approved, with the goal of providing a fully-funded 10 year forecast to Council as part of the 2019 budget
process.
Financial Implications
The recommended 2018 operating budget includes a transfer to capital reserves of $30,360,354 which is equal to 13.49 per cent of last year’s net tax levy. This is the
same percentage transfer as 2017, with the one per cent dedicated infrastructure levy included. By maintaining the percentage at a constant rate, the transfer to
capital increases by $1,225,467; approximately a 0.5 per cent increase in the tax levy.
The Stormwater Operating Budget includes a transfer to capital reserves of $4,494,150, an increase of $1,541,853 over 2017.
The Water Operating Budget includes a transfer to capital reserves of $14,400,000, an increase of $1,430,000 over 2017.
The Wastewater Operating Budget includes a transfer to capital reserves of
$13,500,000, an increase of $250,000 over 2017.
Debt totalling $250,000 is included in the 2018 Capital Budget.
The funding breakdown of the total 2018 Capital Budget is as follows: rate funded
reserves (40%), tax funded reserves (25%), grants (16%), development charges (17%) and other (2%).

Page 3 of 10
79%
9%
12%
Infrastructure
Renewal, 79%
City Building, 9%
Growth, 12%
Report
The recommended 2018-2027 Capital Budget and Forecast was provided to Guelph
City Council and the public on October 12, 2017.
One Capital Budget For the first time we are providing Council with a single, fully-integrated capital
budget for approval separate from the respective operating budgets that fund the various capital reserves. The 2018 Capital Budget of $90,788,062 is funded from numerous sources and combining all projects into one document demonstrates the
complete integration of those funding sources. The capital budget will also be approved in advance of the operating budget, which further demonstrates the
distinction between capital reserve transfers (operating budget) and capital expenditures (capital budget). As we work to achieve sustainable levels of capital funding for all City assets, this distinction will assist in focusing on the long-term
funding needs versus the short-term project priorities.
In line with the recently approved Capital Transfer Allocation Policy, the 10 year forecast shows the tax funded reserves being closely aligned with the policy.
Figure 1 - Tax funding allocation 2018-2027
The total 2018 budget, including all sources of funding, is heavily focused on infrastructure renewal, with 79 per cent of the requested budget going towards
projects that will provide for the replacement, renewal or reconstruction of existing City assets. These projects ensure that the City is able to deliver services while maintaining health and safety standards and meeting legislative requirements. The
17 per cent of the budget attributed to growth is primarily funded through development charges and supports projects required to meet the increased demand
on City services by new residents and businesses. The four per cent of the budget invested in City building reflects ongoing projects to enhance City services to improve the overall benefit to all citizens.

Page 4 of 10
64% 10%
26%
Infrastructure Renewal, 64%
City Building, 10%
Growth, 26%
Figure 2 Figure 3
2018 Capital expenditure type 2019-2027 Capital expenditure type
Developing the Budget
The following elements were considered by the City when prioritizing capital investments for 2018 and identifying investments for 2019 through 2027.
• Health and safety of our community • Legislated or regulatory environment mandated
• Contractual obligations • Council Shared Agenda, previous Council decisions, and the Corporate
Administrative Plan • Enterprise Risk Management Criterion • Resource capacity
The recommended 2018-2027 Capital Budget and Forecast represents the
administration’s response to the challenge of balancing a wide and complex range of short-term and long-term needs within existing resources. The 2018 capital requirements are constrained to current funding levels meaning that through
prioritization, some projects were deferred to future years. The approval of the Dedicated Infrastructure Levy in 2017 enabled the City to step in the right direction
towards funding tax supported capital at a sustainable level but we have not yet met this target
The 2019-2027 forecast is an extensive list of the projects required to maintain existing services, accommodate demands of growth, and achieve the community’s
vision for the City. Currently this forecast is underfunded by $420 million, which means that many of the projects identified are not achievable based on current
funding levels.
79%
4%
17%
Infrastructure Renewal, 79%
City Building, 4%
Growth, 17%

Page 5 of 10
Figure 4 - 2019-2027 Tax Funded Projects, Cumulative
In order to present a fully funded forecast in 2019, projects will need to be
prioritized and deferred within available funding levels, resulting in the current 10 year project list possibly extending out to 20-25 years. Staff will start this work as soon as the 2018 Capital Budget is approved, with the goal of providing a fully
funded forecast to Council as part of the 2019 budget process.
The forecast development will be informed by the Corporate Asset Management Plan and work to better define levels of service, corporate risk and full lifecycle costs. Throughout the process staff will engage Council to ensure alignment with
Council objectives and priorities as well as identify challenges and opportunities as they arise.
Programs of Work This is the second year for the Programs of Work and a number of improvements
have been implemented to enhance these documents. Most significantly, a transition has been made to focus on the services we deliver to the community. This means that the programs are aligned to the services received by the public and
not from a perspective of how the Corporation is aligned internally or the type of asset used to provide the service. This significant change will allow Council and the
public to better understand the level of investment in the various services as well as the risks to these services if these investments are not made. This also aligns with
work being completed by the Corporate Asset Management division to identify the City’s core services and define their current levels and the impacts of adjusting or maintaining those levels.
When Council approves Growth and City Building capital projects, there are direct
operating cost increases and pressures that need to be considered as part of the capital project approval. Operating impacts in future years from 2018 capital projects have been identified within each Program of Work. Departments have
0
100
200
300
400
500
600
700
800
2019 2020 2021 2022 2023 2024 2025 2026 2027
Mill
ion
s
Required Available

Page 6 of 10
worked to identify projects that will lead to increased or decreased operating costs in 2019 and beyond. This is a new level of maturity of the City of Guelph’s budget
and needs to be a key capital budget consideration for Council. These costs will be included as part of the 2019 base operating budget for Council approval next year
and will continue to be a portion of the ongoing operating costs. Further work will be done to project the long-term impacts of the complete 10 year forecast for inclusion in the 2019 capital Programs of Work.
Figure 5 - 2019 Operating Impacts
Program of Work Division 2019 Operating
Impact
Corporate Administration IT Licencing $80,000
Corporate Administration Corporate Asset Management $60,000
Downtown Implementation Parks Operations $15,000
Transportation System Road & Right of way $28,700
Water Services Water Services $209,600
Active Transportation Parks Operations $14,160
Parks & Open Spaces Parks Operations $7,500
Transit Mobility Transit $145,000
Total Tax Supported $350,360
Total Non-tax Supported $209,600
Financial Implications
2018 Budget The 2018 Capital Budget is constrained by the availability of tax funding within City
reserves. Departments have worked to maximize external sources of funding where possible in order to put forward a comprehensive and fully-funded budget.

Page 7 of 10
The 2018 Capital Budget is funded from the following sources:
Figure 6 - 2018 Capital Budget Funding sources
The following reserve transfers have been recommended as part of the 2018
operating budgets;
Tax Supported Operating Budget transfer $30,360,254 To be allocated as follows:
Contaminated Site Reserve Fund $1,045,000
Infrastructure Renewal Reserve Fund $23,452,204 Growth Reserve Fund $2,931,525
City Building Reserve Fund $2,931,525 Stormwater rate supported operating budget transfer $4,572,850
Water rate supported operating budget transfer of $14,400,000
Wastewater rate supported operating budget transfer of $13,500,000
Reserve Fund Forecasted Balances
Capital reserves are important to address unexpected events such as asset breakdown, partnerships with other levels of government such as GO/Metrolinx,
matching funds for grant opportunities that become available during the year and to plan for long term large asset replacement such as major facilities. Part of the sustainable funding approach is to ensure capital reserves are built to accommodate
these activities and to mitigate against fluctuations in the tax rate in any given year. The Dedicated Infrastructure Levy assists in building tax supported funding to
this sustainable level based on a 100 year capital replacement forecast.
26%
17%
16%
1%
40%
0% Tax Reserves, 26%
Development Charges,
17%
Grants, 16%
Own Revenues, 1%
Rate Reserves, 40%
Partner, 1%

Page 8 of 10
$0
$50
$100
$150
$200
$250
2018 2019 2020 2021 2022 2023 2024 2025 2026 2027
Mill
ion
s
Current & 2018 Proposed Current & 9 Yr Forecast Maximum
Tax Funded Capital 2018 Year End
Contaminated Sites $133,000 Infrastructure Renewal $2,550,000 Growth $1,050,000
City Building $250,000
Rate Funded Stormwater $50,000 Wastewater $50,650,000
Water $31,175,000
Current & Long-term Debt Strategy
The 2018 Capital Budget includes $250,000 of debt funding which will be repaid
from future tax supported capital transfers to reserves. The use of debt to cash flow projects over a period of time allows for the smoothing of expenditures in line with
available funding. As debt principle and interest payments come from the same funding for current projects, use of debt has to be balanced against the need for current funding. Based on current forecasts, the City will stay compliant with its
debt servicing to operating fund and total debt to operating fund ratios. These are key to ensuring long-term ability to carry existing and future debt obligations.
The use of debt to provide cash flow for large capital investments is a key component of the Long-Term Financial Strategy of the City. The current nine year
forecast includes debt funding for three significant projects, South End Community Centre, Main Branch Library and Downtown Redevelopment. Based on the level of
debt funding forecasted, the City will still be within its debt limits throughout the period. The repayment of debt comes from the same capital reserves that fund the annual capital budget. Increased levels of debt repayment put pressure on these
reserves and limit the amount of annual projects that can be funded. A balance must be met in order to allow large scale projects to move forward while still
allowing for annual capital expenditures.
Figure 7 - 10 Year Debt Forecast
See Capital Budget Document, Appendix 1 for details

Page 9 of 10
2019-2027 Forecast
The 2019-2027 forecast, which is not fully funded, has long-term financial impacts
for the Corporation. As identified in the Corporate Asset Management Plan, the long-term level of sustainable funding required is much larger than is currently being budgeted within the various operating budgets. This underfunding means that
the current $501 million corporate infrastructure backlog will continue to grow until funding reaches sustainable levels. The tax supported infrastructure backlog is
estimated at $220 million. Without proactive levy increases by Council for the level of tax funds transferred from the operating budget to capital reserves, sustainability will not be reached. This will be addressed in greater detail as part of
the staff recommended continuation of the dedicated capital levy for 2018.
Consultations
The 2018 Capital Budget was built by an integrated capital planning team that included members from all departments, and led by Corporate Asset Management
and Finance. This team worked collaboratively to achieve the goal of presenting Council with a 2018 Capital Budget that addresses the organizations key priorities.
This team will continue to work on delivering a 10 year capital budget to Council in 2018 that is fully funded and identifies the relevant impacts of the decisions made
to get to that state.
Corporate Administrative Plan
Overarching Goals Service Excellence
Financial Stability Innovation
Service Area Operational Work Plans Our Services - Municipal services that make lives better
Our People- Building a great community together Our Resources - A solid foundation for a growing city
Attachments
None

Page 10 of 10
Departmental Approval
Daryush Esmaili, Manager of Corporate Asset Management
Report Author
Greg Clark, CPA, CMA
__________________________ __________________________
Approved By Recommended By Tara Baker, CPA, CA Trevor Lee
GM Finance & City Treasurer Deputy CAO Corporate Services 519-822-1260 Ext 2084 519-822-1260 Ext 2281 [email protected] [email protected]

From: Susan Watson Sent: October-12-17 7:39 AM To: Clerks; Mayors Office; Dan Gibson; Bob Bell; James Gordon; Andy VanHellemond; Phil Allt; June Hofland; Mike Salisbury; Christine Billings; Leanne Piper; Cathy Downer; Mark MacKinnon; Karl Wettstein Subject: New main library funding in the 2018 budget
Dear Mayor Guthrie and Members of Council:
This month, Requests for Proposals for development of the Baker St. site will be issued to the private sector with the requirement that a new main library be the institutional anchor for the site.
In 2011, Garwood-Jones and Hanham Architects, together with Foresite Facility Planning LLC prepared a fully costed Building Program and Functional Plan for a new main library.
https://www.guelphpl.ca/en/about-us/resources/Documents/11506FinalReport.pdf
The estimated square footage was 90,000 square feet (p.20) and the cost estimate prepared by Hanscomb Ltd was $64,243,300 (p.52). I assume that this document is the basis for the square footage projections which will be included in the RFPs.
In the same way, the cost projections in this report need to form the basis for financial planning in relation to the library for the 2018 budget cycle. Applying inflation calculations to the $64,243,300 projected cost will take the total just over $70 million in 2018 dollars.
On page 61 of the 2011 Building Program and Functional Plan, the consultants laid out the following nine steps described in the City of Guelph Community Services report CS-AD-0924 dated November 30, 2009:
9.1 Business Modelling, Budget & Funding Requirements
Guelph Public Library staff and the City of Guelph will develop different funding models by which the new Main Library could be constructed.
9.2 Model Assessment & Targets
Guelph Public Library staff and the City of Guelph will continue to review the models with potential partners.
9.3 Fundraising & Feasibility Strategy
The Guelph Public Library Board will review fundraising strategies, goals and targets.
9.4 Further Land Assembly
The City of Guelph needs to acquire additional buildings.

9.5 Development Permissions
Zoning and relevant planning documents and plans require updating to reflect the proposed development
9.6 Securing a Design Team / Construction Partner
Guelph Public Library staff and the City of Guelph need to secure a design team and a construction partner. The composition of this team will be influenced by steps 9.1 and 9.2.
9.7 Design
Design of the Library will proceed.
9.8 Site Preparation for Construction
Further site work is required to be carried out by the City of Guelph to prepare the site for construction.
9.9 Construction
Construction of the new Main Library will commence.
In moving to issue the RFPs this month, the City has completely jumped over the first 5 steps to #6 – “Securing a design team/construction partner.” However, the report states that #6 will be influenced by steps 1 & 2 – working out the funding models.
It is imperative that the City move immediately to play catch-up in defining options for funding models, assessing and tallying resources and setting aside funds. There are several key reasons why this is an urgent matter:
1) Grants from higher levels of government:
The next budget deliberations will not conclude until January of 2019. Money set aside for the new main library in the budget or in a reserve will provide seed money for any grants which may come available from higher levels of government in the next 14 months.
Halifax funded their new 57.6 million dollar main library with $26.3 million from the municipality, $18.3 million from the Federal Government and $13 million from the Province of Nova Scotia.

https://www.theglobeandmail.com/news/national/halifax-looks-forward-to-the-opening-of-its-very-own-library-of-the-future/article20090514/
The Feds and the Province will not give us money if we ourselves are not prepared to invest in our own library. One-third of the projected $70 million cost of a new main library ($23.3 million) may be a prudent amount to set aside in the 2018 budget to be ready for any grant opportunities. It would be irresponsible to fail to position ourselves to take advantage of such opportunities.
2) Democratic decision-making around the funding model.
No open, democratic discussion has yet taken place as to whether, as a community, we wish to pursue up-front capital funding OR a Public-Private-Partnership (P3) with the private sector in which a developer builds us a central library and we rent it.
There is no such thing as free lunch. Either we pay for a library up front through capital funding, or we pay at the back end by renting from a developer who will expect to make a reasonable profit.
Not setting aside a portion of the required funding for the library in the 2018 budget backs us into a P3 scenario without an explicit discussion or decision-making process having taken place.
3) Credibility with private sector bidders:
One of the very first questions any developer will ask is: “How is the library being funded?” Right now the answer is: “We don’t know”. This is not a scenario which will inspire confidence on the part of the private investors. We need to get our act together and provide specifics around the assets and contributions the City is bringing to the table. The third “P” of P3 is “partnership”. The City needs to be prepared to make a financial contribution even if we go the P3 route.
4) Flexibility to choose the best deal for taxpayers:
There seems to be an unspoken expectation that bidders on the Baker St. RFP will lay out proposals for various P3s. If we have no Plan B in terms of capital funding, then we put ourselves in a position of “beggars can’t be choosers”. City Council needs to carefully assess the terms of any P3 proposal and determine whether Guelph taxpayers are best served by a P3 agreement or through up-front capital funding. We need to have viable options available to us.
5) Resources to keep Baker St. development moving forward:
A proposal will be chosen in June of 2018. If there is no money set aside for the library, does this mean nothing will happen until the next budget is approved in January of 2019? If the goal is to keep development of the Baker St. site moving forward, then we need to commit financial resources in this budget cycle.

Staff needs to support Council and the library board by taking stock and itemizing what money and assets we have available to fund the library:
1) How much money in the new main library account from Development Charges?
2) How much money is in the reserve for the remaining land acquisition for the Baker St. lot?
3) How much money from our parkland dedication reserves will be needed for the public square which is anticipated in the Downtown Secondary plan to be situated adjacent to the library?
4) What is the appraised value of the current library property? Although it is owned by the library and not the City, will there be some sort of property/land exchange when the library moves to Baker St., or a sale of the current library site and building?
5) What is the current appraised value per hectare of the City-owend land on the Baker St. lot? Aside from cash, this is the biggest asset at play in construction of a new main library.
6) Friends of the Library have been accumulating money from the annual book sale to gift to the library when a new main library is built. I believe that amount is now over $500,000.
7) What kind of contributions would we expect to come from a public fundraising campaign?
8) What annual revenues can be expected from tenants such as the Action Read Community Literacy Centre, the Guelph Tool Library and a commercial café?
Setting aside money in the 2018 budget either as a budget line item or in the library reserve fund is a fiscally prudent thing to do when expecting such a large expense. It makes sense to spread the financial impact over a period of several years. At the same time, no final decision to spend a set sum of money is being made at this point in time. If a 2018 reincarnation of Andrew Carnegie were to appear and gift us with a new main library, those funds will still be available to be used elsewhere.
The importance of the library investment:
Councillor Karl Wettstein captured a key perspective on the library at a September Council meeting when he said he preferred to think of Council as “investors” in a new main library, rather than “bankers.”
As stewards of tax dollars, Councillors need to be clear on the ROI – return on investment for all citizens.
It is critical to keep in mind not just what Council can do for library users, but what the library itself will do for the City, and in particular the downtown. In all cities, a main library is a key economic generator. The Baker St. position paper I have attached from the Downtown Advisory Committee talks about maximizing a city-owned asset from both economic and social standpoints.

The DAC position paper projects more than 3,100 visits to a new main library every day. Other cities have seen an uptick in library usage when a new central library is opened. Careful thought was given to where to site our new main library in order to receive the maximum benefits from the street activity that will be generated.
We have already seen the tremendous benefits of strategic investment in public places in the downtown in the success of Market Square. This space is animated with social and economic activity both summer and winter. The positioning of the library on upper Wyndham Street was intended to act as an anchor at the other end of the downtown to generate pedestrian movement along Wyndham Street. The full benefits of a new main library may not be realized in another location. This is not an abstract issue. Meridian Credit Union has just announced that it is closing its branch on the corner of Wyndham and Wellington. It is critical that Council make a financial commitment now to make sure the construction of the new main library on the Baker St. site moves forward in a timely way.
Community Benefits:
I would like to draw your attention to an excellent study done by the Calgary Public Library, published in 2016.
http://addin.ca/wp-content/uploads/2016/10/CalgaryLibraryCommunityBenefitsStudy.pdf
The study looks at both Return on Investment (ROI) and Economic Impact and compares a number of other community libraries. The following information is contained in the Executive Summary on p.4.
For every dollar invested in the Calgary Public Library during the 2013/14 study period, the community received a Return on Investment of between $2.66 and $5.73 in direct benefits, with a midpoint ROI of $4.20. Every dollar invested in the Calgary Public Library during the study period generated an Economic Impact between $3.30 and $6.38, with a midpoint value of $4.84.
The body of the study goes into more detail on the social benefits:
1. Championing Literacy, Education, and Lifelong Learning
2. Supporting a Thriving, Prosperous, and Cohesive Community
3. Strengthening Calgary’s Vibrant Neighbourhoods
4. Enhancing Access to the Arts, Culture, Entertainment, and Leisure

Guelph citizens can expect to enjoy a similar return on our investment. For every dollar that goes into the library, I can expect a direct benefit of $4.20 in the money I save by accessing goods and services through my library that I would otherwise have to purchase.
This study also quantifies the economic impact of library investments at a midpoint return value of $4.84 for each dollar invested.
This New York Times article captures the resurgence of libraries in Canadian cities:
https://www.nytimes.com/newsletters/2017/07/22/canada-letter?nlid=25433847
Other municipalities have grasped the importance of investment in this key community asset. Here is a list of recent initiatives:
Halifax:
http://www.cbc.ca/news/canada/nova-scotia/5-neat-things-about-halifax-s-new-central-library-1.2630836
Edmonton:
http://www.cbc.ca/news/canada/edmonton/56m-revamp-proposed-for-stanley-milner-library-1.2636251
Calgary:
http://www.calgaryherald.com/news/calgary/Design+stunning+central+library+unveiled/10175733/story.html
Kitchener:
https://beta.theglobeandmail.com/life/home-and-garden/architecture/kitcheners-new-watering-hole-city-library-undergoes-46-million-renovation/article24923476/?ref=http://www.theglobeandmail.com&
Hillsburgh, Wellington County:
https://www.wellington.ca/en/discover/new-hillsburgh-branch.asp
Fergus (Note: Wellington Archives are not housed in their central library but co-located with the County Museum)
https://www.southwesternontario.ca/news-story/5989712-renovated-expanded-fergus-library-re-opens/

Thank you for reviewing the material I have submitted. I look forward to a robust discussion during budget deliberations.
Sincerely,
Susan Watson