sportech plc (“sportech” or the “group”) interim results for the six months ended 30 … ·...
TRANSCRIPT
24 August 2017
Sportech PLC (“Sportech” or the “Group”)
Interim results for the six months ended 30 June 2017
Sportech, one of the world’s leading regulated gaming technology suppliers and operators, is pleased to announce its interim results for the six months ended 30 June 2017.
Group Highlights
Technology investment delivering global expansion in: o Asia (Hong Kong) o Europe (Denmark and Netherlands) o US (additional Connecticut licensing)
Group has cash of £76.2m at 30 June 2017, and no bank debt following the cancellation of the bank facility, which totalled £75m at 30 June 2016
Successful VAT claim - final receipt of outstanding cash in March 2017 taking refund to £97m
Returned £21m to shareholders through Tender Offer in March 2017
Following shareholder approval, Court process commenced to create approximately £55m of reserves to enable a substantial return to shareholders
Completion of £83m sale of The Football Pools announced on 26 June 2017
Total Group EBITDA of £3.9m from continuing operations (2016: £4.1m)
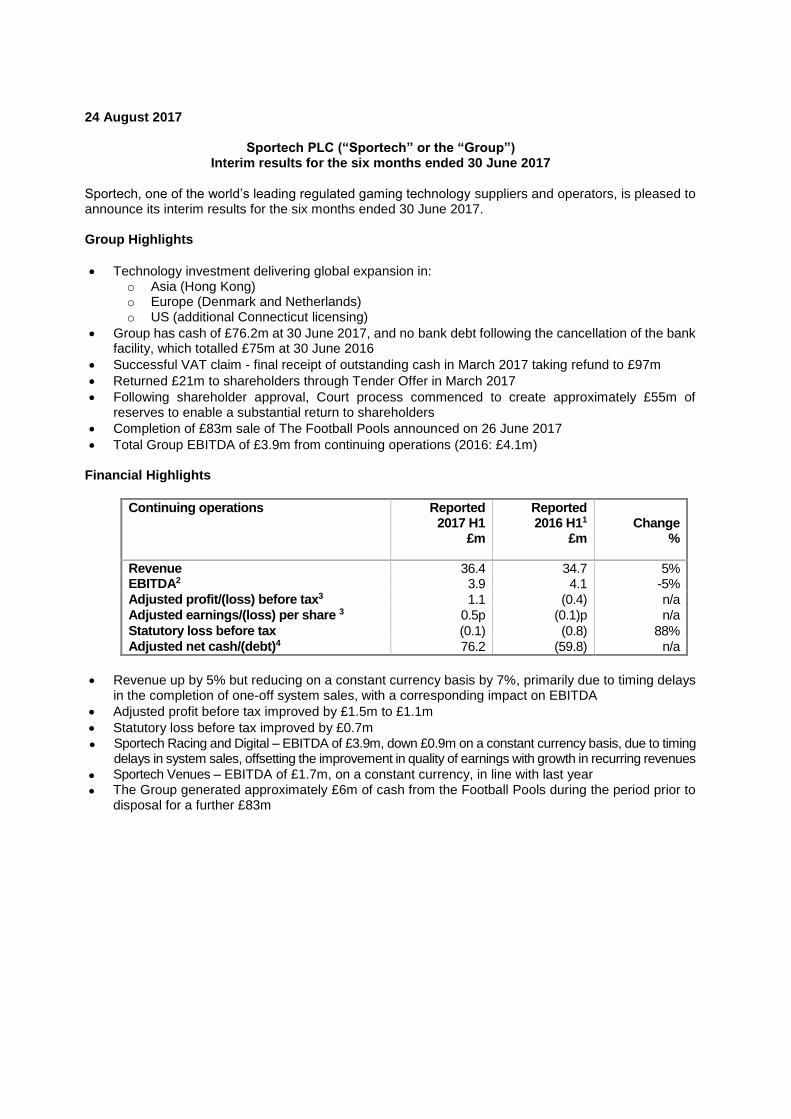
Financial Highlights
Continuing operations Reported 2017 H1
£m
Reported 2016 H11
£m
Change
%
Revenue 36.4 34.7 5% EBITDA2 3.9 4.1 -5% Adjusted profit/(loss) before tax3 1.1 (0.4) n/a Adjusted earnings/(loss) per share 3 0.5p (0.1)p n/a
Statutory loss before tax (0.1) (0.8) 88% Adjusted net cash/(debt)4 76.2 (59.8) n/a
Revenue up by 5% but reducing on a constant currency basis by 7%, primarily due to timing delays in the completion of one-off system sales, with a corresponding impact on EBITDA
Adjusted profit before tax improved by £1.5m to £1.1m
Statutory loss before tax improved by £0.7m
Sportech Racing and Digital – EBITDA of £3.9m, down £0.9m on a constant currency basis, due to timing delays in system sales, offsetting the improvement in quality of earnings with growth in recurring revenues
Sportech Venues – EBITDA of £1.7m, on a constant currency, in line with last year
The Group generated approximately £6m of cash from the Football Pools during the period prior to disposal for a further £83m
Ian Penrose, Chief Executive of Sportech PLC, said: “2017 has seen the transformation of the Group continue. We were successful with the £97m VAT legal case in the Supreme Court, we modernised and sold the Football Pools for £83m, repaid over £60m in debt and returned £21m to shareholders with further substantial shareholder returns still to come from the £76m cash balance. Following significant investment into our technology and licensing, Sportech has now established a strategic base to grow our business globally through our unique regulated gaming business based in North America together with our expanding presence in Asia. We have transitioned our business away from the UK market which is encountering regulatory headwinds, and await with interest the Supreme Court’s decision in the US on the future of sports betting. With our strong balance sheet and cash balances, we have the resources to fund attractive growth opportunities, meet ongoing commitments and deliver substantial returns to shareholders.”
(1) 2016 revenue and EBITDA are those at reported currency excluding the results of the Football Pools segment. (2) EBITDA is stated before amortisation of acquired intangibles, impairment of assets, exceptional items and share option
expense. (3) Adjusted profit figures are stated before amortisation of acquired intangibles, impairment of assets, exceptional items, share
of loss after tax and impairment of joint ventures and associates, and other finance income. (4) Adjusted net cash/(debt) represents cash balances net of overdrafts and customer funds. The Spot the Ball VAT repayment
was also excluded prior to the Supreme Court ruling, in the Group’s favour, in December 2016.
For further information, please contact:
Sportech PLC Tel: +44 (0)20 7268 2400 Ian Penrose, Chief Executive Mickey Kalifa, Chief Financial Officer Brunswick Group LLP Tel: +44 (0)20 7404 5959 Jonathan Glass, Stuart Donnelly Investec Bank PLC Tel: +44 (0)20 7597 4000 Patrick Robb, Henry Reast
Forward-looking statements Certain statements in this Interims Statement are forward-looking. Although the Group believes that the expectations reflected in this forward-looking statement are reasonable, it can give no assurance that these expectations will prove to be correct. As these statements involve risks and uncertainties, actual results may differ materially from those expressed or implied by these forward-looking statements.
Sportech PLC (“Sportech” or the “Group”) Preliminary results for the six months ended 30 June 2017
Group Overview The Group is a highly-focused gaming technology and betting organisation with its primary business operations based in North America, with growing activities across Europe and Asia. We provide gaming technology solutions (in our Racing and Digital division) for customers in horseracing and lotteries and to professional sports teams (NFL, NBA, NHL and MLB) and other gaming operators. Sportech’s core technology system (QuantumTM) is the most widely deployed tote based betting software in the world, currently powering 99 customers worldwide and facilitating commingling between 244 betting organisations, in 37 countries and 38 US states, processing an estimated $11.6 billion in annual betting turnover. Our Venues division comprises our betting activities in the state of Connecticut and in the Netherlands. In Connecticut, we operate under an exclusive and in perpetuity licence for all legal betting currently permitted by the State. This is carried out in 16 venues and across digital platforms. In the Netherlands, our betting activities currently centre around 12 betting shops, a number of point of sale positions and the digital platform, all under an exclusive licence. Globally we employ over 800 people.
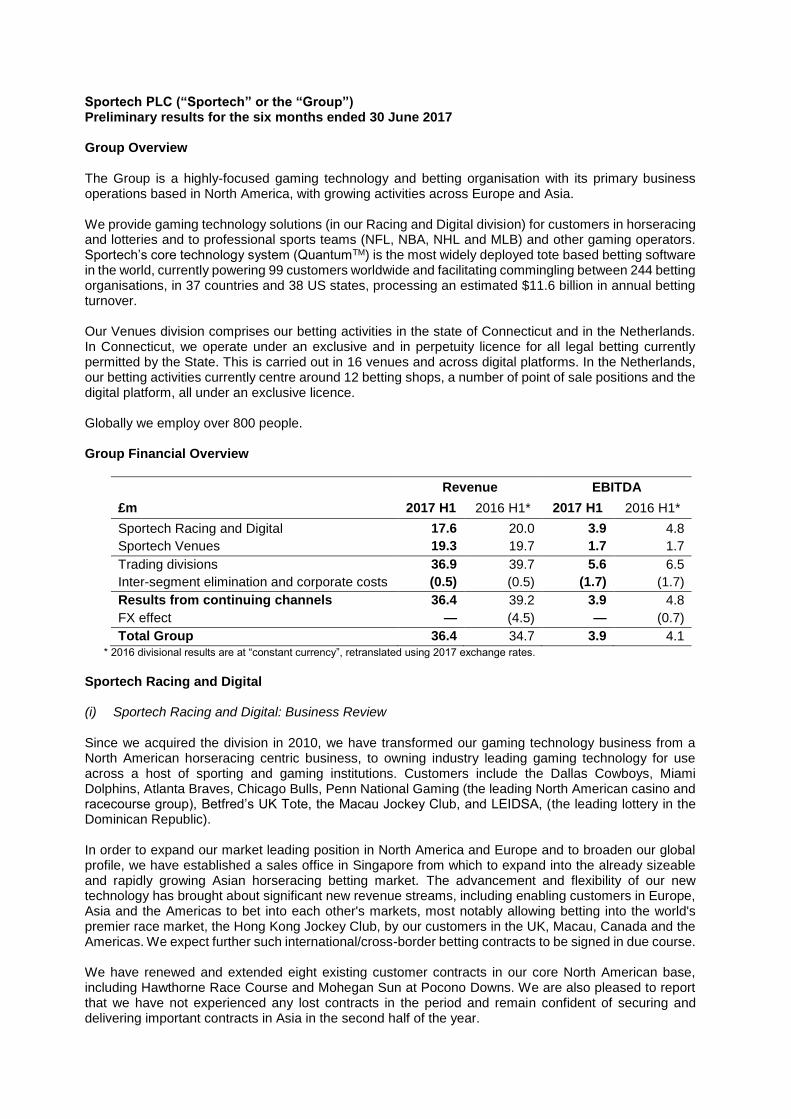
Group Financial Overview
Revenue EBITDA
£m 2017 H1 2016 H1* 2017 H1 2016 H1*
Sportech Racing and Digital 17.6 20.0 3.9 4.8
Sportech Venues 19.3 19.7 1.7 1.7
Trading divisions 36.9 39.7 5.6 6.5
Inter-segment elimination and corporate costs (0.5) (0.5) (1.7) (1.7)
Results from continuing channels 36.4 39.2 3.9 4.8
FX effect — (4.5) — (0.7)
Total Group 36.4 34.7 3.9 4.1 * 2016 divisional results are at “constant currency”, retranslated using 2017 exchange rates.
Sportech Racing and Digital (i) Sportech Racing and Digital: Business Review Since we acquired the division in 2010, we have transformed our gaming technology business from a North American horseracing centric business, to owning industry leading gaming technology for use across a host of sporting and gaming institutions. Customers include the Dallas Cowboys, Miami Dolphins, Atlanta Braves, Chicago Bulls, Penn National Gaming (the leading North American casino and racecourse group), Betfred’s UK Tote, the Macau Jockey Club, and LEIDSA, (the leading lottery in the Dominican Republic). In order to expand our market leading position in North America and Europe and to broaden our global profile, we have established a sales office in Singapore from which to expand into the already sizeable and rapidly growing Asian horseracing betting market. The advancement and flexibility of our new technology has brought about significant new revenue streams, including enabling customers in Europe, Asia and the Americas to bet into each other's markets, most notably allowing betting into the world's premier race market, the Hong Kong Jockey Club, by our customers in the UK, Macau, Canada and the Americas. We expect further such international/cross-border betting contracts to be signed in due course. We have renewed and extended eight existing customer contracts in our core North American base, including Hawthorne Race Course and Mohegan Sun at Pocono Downs. We are also pleased to report that we have not experienced any lost contracts in the period and remain confident of securing and delivering important contracts in Asia in the second half of the year.

The Bump 50:50 business continues to make good progress. Bump, which supplies in-stadia electronic lotteries to professional sports teams, is growing rapidly from a customer base of seven in June 2014 to 48 professional sports teams within three years. Revenues have grown at 55% CAGR since acquisition. Newly secured and renewed customers, obtained or renewed, in the first half of the year include the Atlanta Braves, the Detroit Lions, Jacksonville Jaguars and three Raceways featuring NASCAR events, and since the half year, we have secured the Columbus Blue Jackets (NHL). Bump has also secured approval for online and mobile sales in the province of Manitoba (Canada), expected to commence in the autumn. Using our technology, this will be the first time a team can sell its lottery outside of the stadium addressing a significantly larger customer base. We expect an increase in sales following this development and anticipate this to be the first of many teams to move online as other states and provinces enact similar regulation. In February 2017, the Group’s Indian joint venture partner, Playwin, India’s largest lottery provider, commenced its betting operations in the State of Sikkim. We are watching developments in the market with great interest.
(ii) Sportech Racing and Digital: Financial Review
Revenue EBITDA
£m 2017 H1 2016 H1* 2017 H1 2016 H1*
Recurring Revenues
Tote services and maintenance contracts 13.0 12.4 2.0 1.0
Digital services including sports and other
lotteries 4.1 3.8 1.8 1.9
17.1 16.2 3.8 2.9
System software and equipment sales 0.5 3.8 0.1 1.9
FX effect — (2.2) — (0.5)
Total 17.6 17.8 3.9 4.3
* 2016 channel results are at “constant currency”, retranslated using 2017 exchange rates.
Total revenue is broadly in line with last year at £17.6m (2016: £17.8m) and EBITDA for the division was reduced for the first six months, at £3.9m (2016: £4.3m). Variances to prior year include foreign exchange benefits in revenue and EBITDA of £2.2m and £0.5m respectively. Revenue from tote services and maintenance contracts has increased from £12.4m to £13.0m and EBITDA has increased 100% to £2.0m as a result of the commencement of our contract to enable commingling into horseracing pools in Hong Kong, through our customer, Betfred. Digital services including sports and other lotteries has performed in line with prior year and is positioned well for growth as we continue to drive our Bump business forward. Revenue from system software and equipment sales has decreased by £3.3m (87%). 2016 sales were generated in Asia as a result of our increased activities. We expect sales in H2 to be secured and delivered in this region, demonstrating the benefit of our expanded international focus in recent years. Sportech Venues (i) Sportech Venues: Business Review Sportech Venues operates all betting on horseracing, greyhound racing and jai alai in the state of Connecticut under an exclusive and in perpetuity licence for retail, telephone and online. The business, which is operated with close consultation and oversight from the State, is the only legally permitted betting operator in Connecticut outside of the tribal casinos. We continue to develop our retail estate as we endeavour to broaden our revenue streams, increase the product offering and create a modern environment to eat, drink and place bets.
We have now completed the construction of our flagship sports bar, restaurant and betting venue in downtown Stamford, which opened in June 2017. This venue, in common with our venue in Bradley, has been developed in partnership with Bobby Valentine, who relocated his existing Stamford sports bar and restaurant into the new facility. We have received positive customer feedback and early trading has been encouraging. The business currently offers wagering on horseracing, greyhounds and jai alai. In due course, dependent on there being changes in the regulatory environment, we intend to develop these operations into a wider portfolio of sports and gaming products. With this in mind, and following several years of positioning and lobbying by the Group, we were delighted when the Governor of the state of Connecticut signed into law a new Bill which authorised the extension of our licence from 18 to 24 venues. Equally, the Bill has also required regulators to consider the future for sports betting in Connecticut, should it be permitted federally. Developments advanced on the future of sports betting in the United States when the Supreme Court on 27 June 2017, agreed that it would consider whether the existing ban on betting on sports imposed by PASPA is legal. Oral arguments are scheduled for the autumn/winter and a decision expected by June 2018. We are progressing with unlocking value through the sale (and leaseback) of the nine-acre Sports Haven site in New Haven, Connecticut.
In the Netherlands, we were successful in June 2017, following an open tender process in obtaining a new five-year licence for the exclusive right to carry out tote betting on horseracing. This is operated in nine betting shops, 38 other outlets with point-of-sale terminals and online through our site www.runnerz.nl. Having operated in the past under a few short-term temporary licences, we are now able to plan and operate for the medium term.
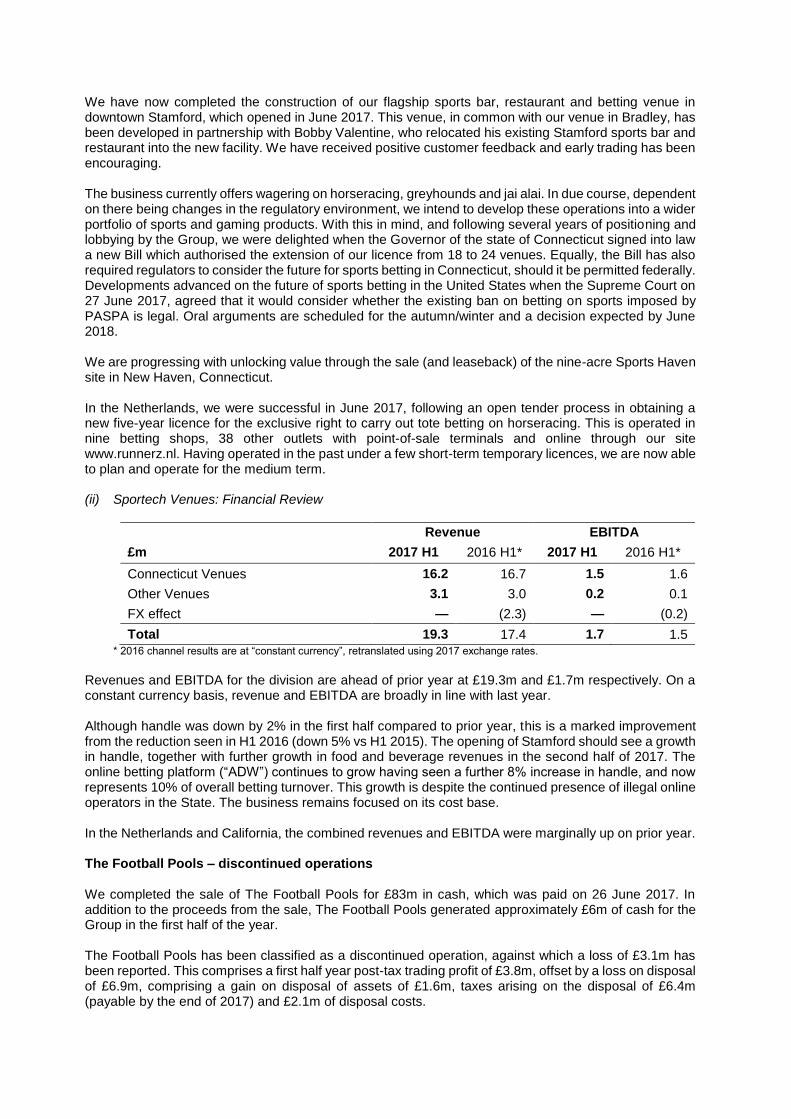
(ii) Sportech Venues: Financial Review
Revenue EBITDA
£m 2017 H1 2016 H1* 2017 H1 2016 H1*
Connecticut Venues 16.2 16.7 1.5 1.6
Other Venues 3.1 3.0 0.2 0.1
FX effect — (2.3) — (0.2)
Total 19.3 17.4 1.7 1.5
* 2016 channel results are at “constant currency”, retranslated using 2017 exchange rates. Revenues and EBITDA for the division are ahead of prior year at £19.3m and £1.7m respectively. On a constant currency basis, revenue and EBITDA are broadly in line with last year.
Although handle was down by 2% in the first half compared to prior year, this is a marked improvement from the reduction seen in H1 2016 (down 5% vs H1 2015). The opening of Stamford should see a growth in handle, together with further growth in food and beverage revenues in the second half of 2017. The online betting platform (“ADW”) continues to grow having seen a further 8% increase in handle, and now represents 10% of overall betting turnover. This growth is despite the continued presence of illegal online operators in the State. The business remains focused on its cost base. In the Netherlands and California, the combined revenues and EBITDA were marginally up on prior year. The Football Pools – discontinued operations We completed the sale of The Football Pools for £83m in cash, which was paid on 26 June 2017. In addition to the proceeds from the sale, The Football Pools generated approximately £6m of cash for the Group in the first half of the year. The Football Pools has been classified as a discontinued operation, against which a loss of £3.1m has been reported. This comprises a first half year post-tax trading profit of £3.8m, offset by a loss on disposal of £6.9m, comprising a gain on disposal of assets of £1.6m, taxes arising on the disposal of £6.4m (payable by the end of 2017) and £2.1m of disposal costs.
Corporate costs Following the sale of The Football Pools, the Group has commenced a programme of reducing central costs. The benefits of these actions which will be seen in the second half of 2017 and the full year of 2018. Costs have remained static in H1 2017 at £1.7m (2016: £1.7m). In addition, we also have a non-cash share option expense under IFRS 2 of £0.5m (2016: £0.1m).
Depreciation and amortisation The Group’s normal depreciation and amortisation charge decreased in the period to £2.1m (2016: £3.0m). In addition, the Group incurred a non-cash amortisation charge of £0.1m (2016: £0.3m) on the intangible assets acquired with Datatote in 2013. Exceptional costs The Group has exceptional administration costs of £0.3m, significantly reduced from prior year (2016: £2.0m). The costs in 2017 comprise further licensing costs in relation to New Jersey (£0.1m), accrued contingent consideration costs for Bump (£0.1m) and pre-construction costs for new venue builds (£0.1m). Net finance costs The significant reduction in Group net interest costs in the period to £0.2m (2016: £1.4m) arises from substantially lower average net debt levels this year. In addition, other finance charges amounted to £0.6m (2016: income of £2.3m) representing foreign exchange losses arising from the retranslation of foreign currency denominated inter-company loans and cash balances held within the Group.
Taxation A tax charge for the period of £nil (2016: £0.2m) has been provided at the weighted average applicable tax rate for the Group of (3.68)% (2016: 23.3%) together with the tax effects of permanent differences and other adjustments. The underlying effective tax rate of 6.61% (2016: 8.29%) is similar to prior year. The Group has a net deferred tax asset of £3.4m (2016: £0.9m), representing primarily foreign taxes withheld which can be utilised against future profits. Tax payments of £12.1m were made during the period (2016: £1.1m), principally representing final payments for prior-year tax liabilities including tax payable on the Spot the Ball receipt of £13.8m (less adjustments for overestimated UK tax payments in 2016 following the impairments made to assets in the final quarter) and overseas tax deducted at source in the US. VAT claim The Group received the outstanding payment of £3.1m from HMRC in March 2017 taking the total VAT repayment claim on the "Spot the Ball" game to £97m. Net cash/net current assets The Group held cash balances of £76.2m at 30 June 2017. As a result, the Group’s remaining bank facility of £50.0m was cancelled. Net current assets amounted to £64.4m (December 2016: £8.2m). Foreign exchange Following the sale of The Football Pools, the Group generates approximately 78% of revenues in USD and 18% of revenues in Euros, with the balance being generated in Sterling and Canadian Dollars. Movements in overseas currency rates are closely monitored by management and action taken to minimise cash flow risk arising from this. The Group has benefited in its reported results from the weakening of GBP from H1 2016, with an EBITDA benefit versus prior year of £0.7m. We have entered into hedging instruments to protect a portion of the Group EBITDA denominated in USD, at £1 : $1.29 to year end.
Capital expenditure Capital expenditure in the period was £8.6m (2016: £3.7m), of which £5.2m related to the newly opened 20,000 sq ft Stamford venue.
Dividend and capital distribution Sportech returned £21m (representing approximately 10% of the share capital of the Company at that time) to shareholders in March 2017, by way of a tender offer. Following the completion of the Court process to create £55m of distributable reserves, the Board will announce its intention regarding a further significant return to shareholders. Shareholders’ funds Total equity and the Group’s net assets at 30 June 2017 have reduced to £122.2m (31 December 2016: £148.8m), principally as a result of the return to shareholders.
Board and employees The Group announced on 27 January 2017 that Andrew Gaughan was appointed to the Board as an Executive Director. On 24 May 2017 Roger Withers retired as Chairman and Richard McGuire was appointed to the role. In addition, Richard Cooper was appointed to the Board as Independent Non-executive Director and Chairman of the Audit Committee. Sportech is a global business which places significant demands upon executives and employees. The Board would like to thank them for their dedication and commitment to the Group.
Outlook Following significant investment into our technology and licensing, Sportech has now established a strategic base to grow our business globally through our unique regulated gaming business based in North America together with our expanding presence in Asia. We have transitioned our business away from the UK market which is encountering regulatory headwinds and await with interest the Supreme Court’s decision in the US on the future of sports betting. With our strong balance sheet and cash balances, we have the resources to fund attractive growth opportunities, meet ongoing commitments and deliver substantial returns to shareholders. We have had a good first half, are trading in line with management expectations, and are looking forward to delivering further progress in 2017.
Ian Penrose Chief Executive
24 August 2017
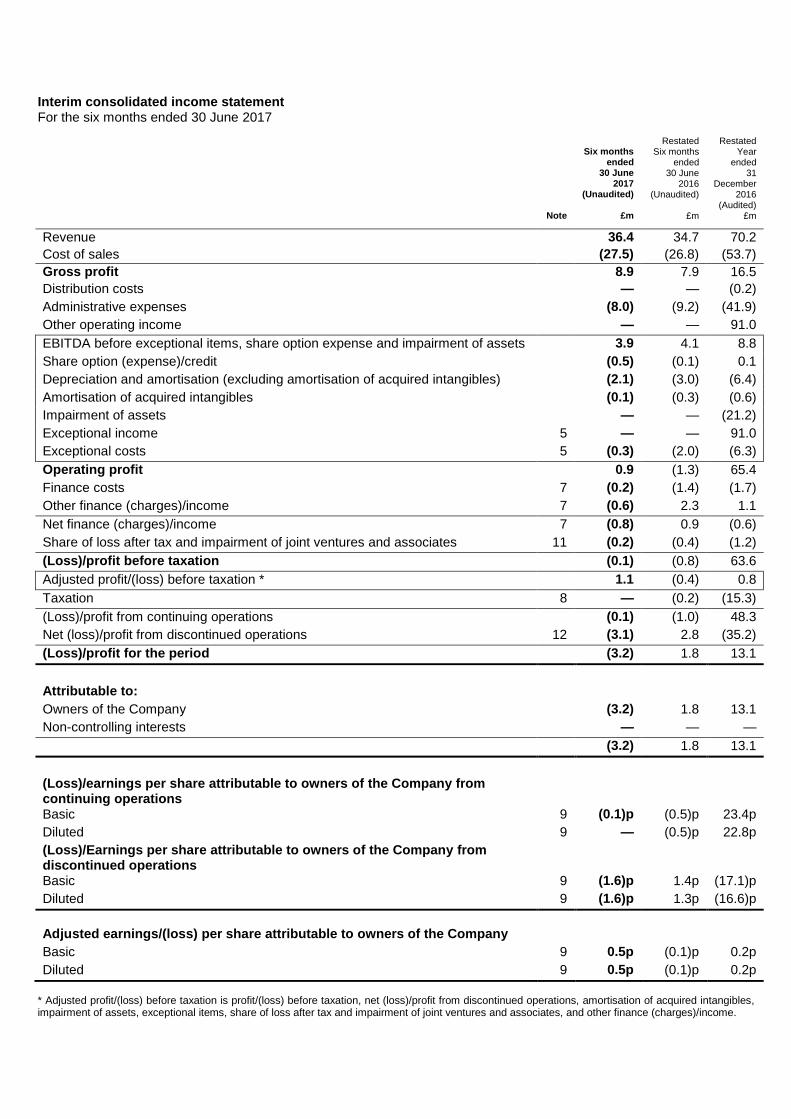
Interim consolidated income statement For the six months ended 30 June 2017
Six months ended
30 June 2017
(Unaudited)
Restated
Six months ended
30 June 2016
(Unaudited)
Restated
Year ended
31 December
2016 (Audited)
Note £m £m £m
Revenue 36.4 34.7 70.2
Cost of sales (27.5) (26.8) (53.7)
Gross profit 8.9 7.9 16.5
Distribution costs — — (0.2)
Administrative expenses (8.0) (9.2) (41.9)
Other operating income — — 91.0
EBITDA before exceptional items, share option expense and impairment of assets 3.9 4.1 8.8
Share option (expense)/credit (0.5) (0.1) 0.1
Depreciation and amortisation (excluding amortisation of acquired intangibles) (2.1) (3.0) (6.4)
Amortisation of acquired intangibles (0.1) (0.3) (0.6)
Impairment of assets — — (21.2)
Exceptional income 5 — — 91.0
Exceptional costs 5 (0.3) (2.0) (6.3)
Operating profit 0.9 (1.3) 65.4
Finance costs 7 (0.2) (1.4) (1.7)
Other finance (charges)/income 7 (0.6) 2.3 1.1
Net finance (charges)/income 7 (0.8) 0.9 (0.6)
Share of loss after tax and impairment of joint ventures and associates 11 (0.2) (0.4) (1.2)
(Loss)/profit before taxation (0.1) (0.8) 63.6
Adjusted profit/(loss) before taxation * 1.1 (0.4) 0.8
Taxation 8 — (0.2) (15.3)
(Loss)/profit from continuing operations (0.1) (1.0) 48.3
Net (loss)/profit from discontinued operations 12 (3.1) 2.8 (35.2)
(Loss)/profit for the period (3.2) 1.8 13.1
Attributable to:
Owners of the Company (3.2) 1.8 13.1
Non-controlling interests — — —
(3.2) 1.8 13.1
(Loss)/earnings per share attributable to owners of the Company from continuing operations
Basic 9 (0.1)p (0.5)p 23.4p
Diluted 9 — (0.5)p 22.8p
(Loss)/Earnings per share attributable to owners of the Company from discontinued operations
Basic 9 (1.6)p 1.4p (17.1)p
Diluted 9 (1.6)p 1.3p (16.6)p
Adjusted earnings/(loss) per share attributable to owners of the Company
Basic 9 0.5p (0.1)p 0.2p
Diluted 9 0.5p (0.1)p 0.2p
* Adjusted profit/(loss) before taxation is profit/(loss) before taxation, net (loss)/profit from discontinued operations, amortisation of acquired intangibles, impairment of assets, exceptional items, share of loss after tax and impairment of joint ventures and associates, and other finance (charges)/income.
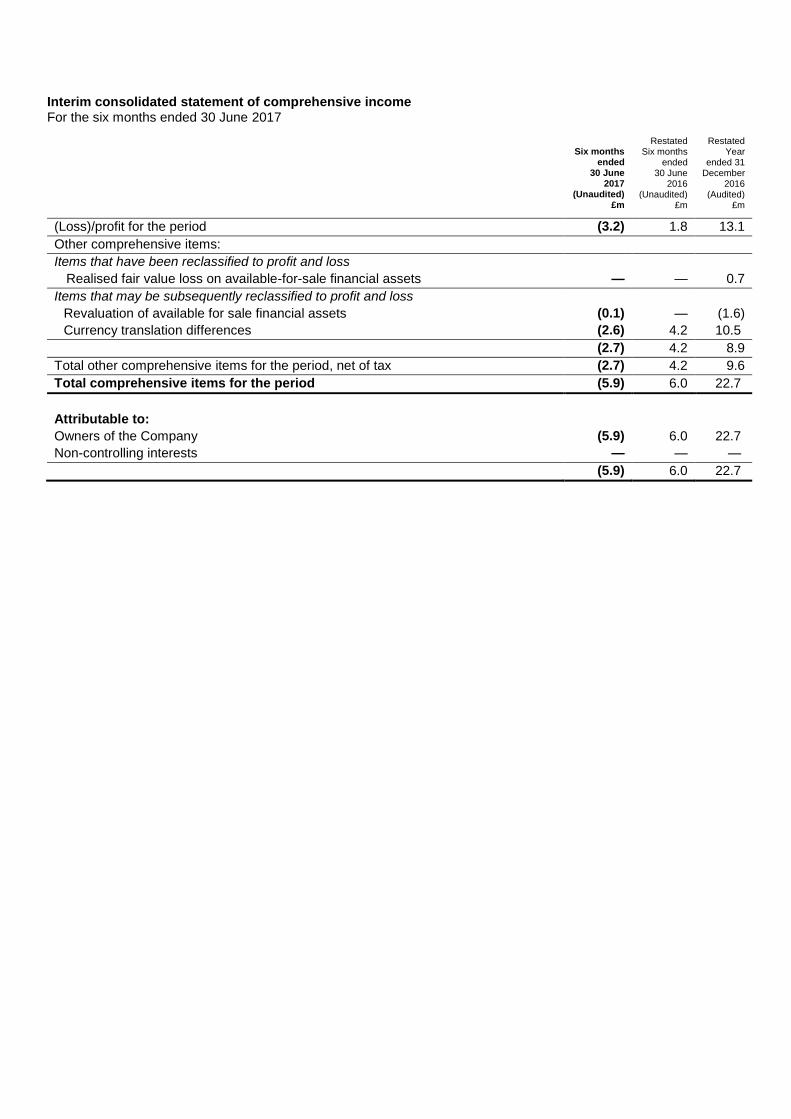
Interim consolidated statement of comprehensive income For the six months ended 30 June 2017
Six months ended
30 June 2017
(Unaudited)
Restated
Six months ended
30 June 2016
(Unaudited)
Restated
Year ended 31
December 2016
(Audited)
£m £m £m
(Loss)/profit for the period (3.2) 1.8 13.1
Other comprehensive items:
Items that have been reclassified to profit and loss
Realised fair value loss on available-for-sale financial assets — — 0.7
Items that may be subsequently reclassified to profit and loss
Revaluation of available for sale financial assets (0.1) — (1.6)
Currency translation differences (2.6) 4.2 10.5
(2.7) 4.2 8.9
Total other comprehensive items for the period, net of tax (2.7) 4.2 9.6
Total comprehensive items for the period (5.9) 6.0 22.7
Attributable to:
Owners of the Company (5.9) 6.0 22.7
Non-controlling interests — — —
(5.9) 6.0 22.7
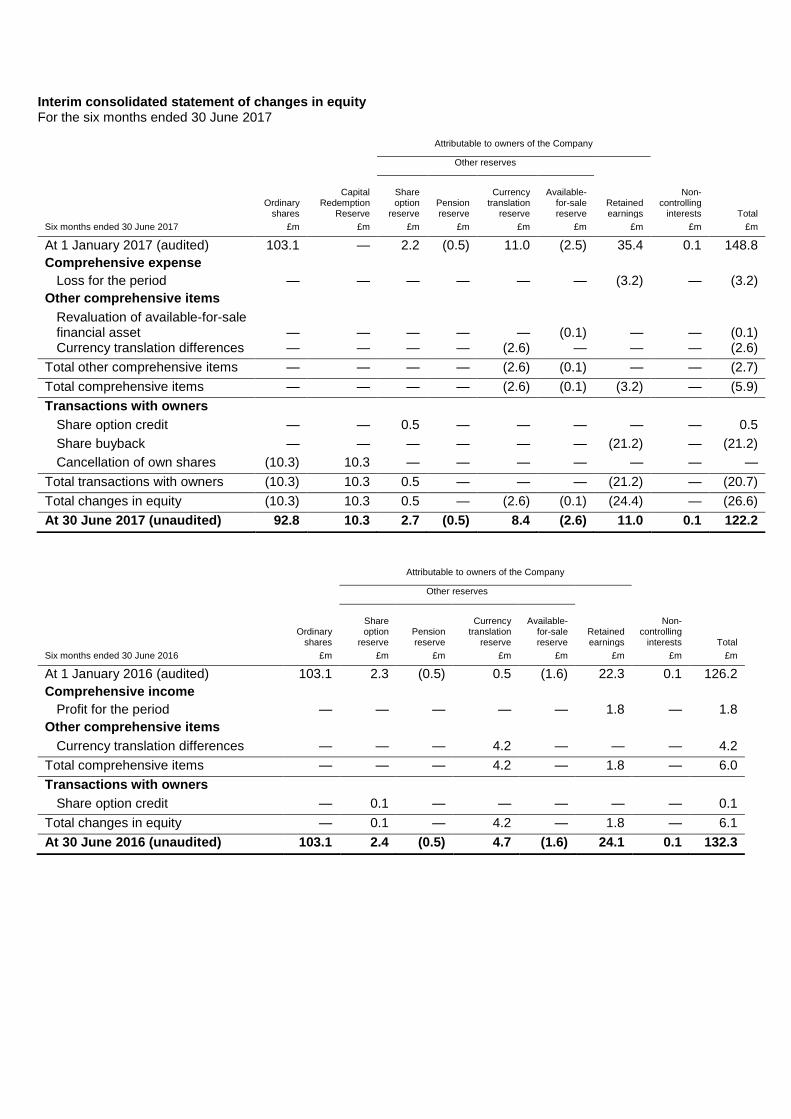
Interim consolidated statement of changes in equity For the six months ended 30 June 2017
Attributable to owners of the Company
Other reserves
Ordinary shares
Capital
Redemption Reserve
Share option
reserve
Pension reserve
Currency
translation reserve
Available-
for-sale reserve
Retained earnings
Non-
controlling interests
Total
Six months ended 30 June 2017 £m £m £m £m £m £m £m £m £m
At 1 January 2017 (audited) 103.1 — 2.2 (0.5) 11.0 (2.5) 35.4 0.1 148.8
Comprehensive expense
Loss for the period — — — — — — (3.2) — (3.2)
Other comprehensive items
Revaluation of available-for-sale financial asset
—
—
—
—
—
(0.1)
—
—
(0.1)
Currency translation differences — — — — (2.6) — — — (2.6)
Total other comprehensive items — — — — (2.6) (0.1) — — (2.7)
Total comprehensive items — — — — (2.6) (0.1) (3.2) — (5.9)
Transactions with owners
Share option credit — — 0.5 — — — — — 0.5
Share buyback — — — — — — (21.2) — (21.2)
Cancellation of own shares (10.3) 10.3 — — — — — — —
Total transactions with owners (10.3) 10.3 0.5 — — — (21.2) — (20.7)
Total changes in equity (10.3) 10.3 0.5 — (2.6) (0.1) (24.4) — (26.6)
At 30 June 2017 (unaudited) 92.8 10.3 2.7 (0.5) 8.4 (2.6) 11.0 0.1 122.2
Attributable to owners of the Company
Other reserves
Ordinary shares
Share option
reserve
Pension reserve
Currency
translation reserve
Available-
for-sale reserve
Retained earnings
Non-
controlling interests
Total
Six months ended 30 June 2016 £m £m £m £m £m £m £m £m
At 1 January 2016 (audited) 103.1 2.3 (0.5) 0.5 (1.6) 22.3 0.1 126.2
Comprehensive income
Profit for the period — — — — — 1.8 — 1.8
Other comprehensive items
Currency translation differences — — — 4.2 — — — 4.2
Total comprehensive items — — — 4.2 — 1.8 — 6.0
Transactions with owners
Share option credit — 0.1 — — — — — 0.1
Total changes in equity — 0.1 — 4.2 — 1.8 — 6.1
At 30 June 2016 (unaudited) 103.1 2.4 (0.5) 4.7 (1.6) 24.1 0.1 132.3

Attributable to Owners of the Company
Other reserves
Ordinary
shares
Share option
reserve
Pension reserve
Currency translation
reserve
Available-for-sale reserve
Retained earnings
Non-controlling
interests
Total
Year ended 31 December 2016 £m £m £m £m £m £m £m £m
At 1 January 2016 (audited) 103.1 2.3 (0.5) 0.5 (1.6) 22.3 0.1 126.2
Comprehensive income
Profit for the year — — — — — 13.1 — 13.1
Other comprehensive items
Realised fair value losses on available-for-sale financial assets
— — — — 0.7 — — 0.7
Revaluation of available for sale financial assets
— — — — (1.6) — — (1.6)
Currency translation differences — — — 10.5 — — — 10.5
Total other comprehensive items — — — 10.5 (0.9) — — 9.6
Total comprehensive items — — — 10.5 (0.9) 13.1 — 22.7
Transactions with owners
Share option debit — (0.1) — — — — — (0.1)
Total changes in equity — (0.1) — 10.5 (0.9) 13.1 — 22.6
At 31 December 2016 (audited) 103.1 2.2 (0.5) 11.0 (2.5) 35.4 0.1 148.8

Interim consolidated balance sheet As at 30 June 2017
As at 30 June 2017
(Unaudited)
As at 30 June 2016
(Unaudited)
As at 31 December
2016 (Audited)
Note £m £m £m
ASSETS
Non-current assets
Goodwill 13 — 121.3 81.8
Intangible fixed assets 10 26.4 45.1 27.8
Property, plant and equipment 10 26.3 27.1 26.2
Net investment in joint ventures and associates 11 1.3 2.1 1.4
Trade and other receivables 14 2.2 2.4 2.6
Deferred tax assets 3.4 1.7 3.1
59.6 199.7 142.9
Current assets
Trade and other receivables 14 12.3 11.7 14.6
Available for sale financial assets 21 1.2 2.9 1.3
Inventories 3.2 2.5 2.5
Cash and cash equivalents 15 79.0 36.5 39.6
95.7 53.6 58.0
TOTAL ASSETS 155.3 253.3 200.9
LIABILITIES
Current liabilities
Financial liabilities 18 (0.2) (0.3) (0.2)
Trade and other payables 16 (17.2) (23.1) (31.4)
Provisions 17 — (93.4) (0.1)
Current tax liabilities (13.9) (1.5) (18.1)
(31.3) (118.3) (49.8)
Net current assets/(liabilities) 64.4 (64.7) 8.2
Non-current liabilities
Financial liabilities 18 — — (0.1)
Retirement benefit liability (1.3) (1.5) (1.7)
Provisions 17 (0.5) (0.4) (0.5)
Deferred tax liabilities — (0.8) —
(1.8) (2.7) (2.3)
TOTAL LIABILITIES (33.1) (121.0) (52.1)
NET ASSETS 122.2 132.3 148.8
EQUITY
Ordinary shares 22 92.8 103.1 103.1
Capital redemption reserve 22 10.3 — —
Other reserves 8.0 5.0 10.2
Retained earnings 11.0 24.1 35.4
EQUITY ATTRIBUTABLE TO OWNERS OF THE COMPANY 122.1 132.2 148.7
Non-controlling interests 0.1 0.1 0.1
TOTAL EQUITY 122.2 132.3 148.8
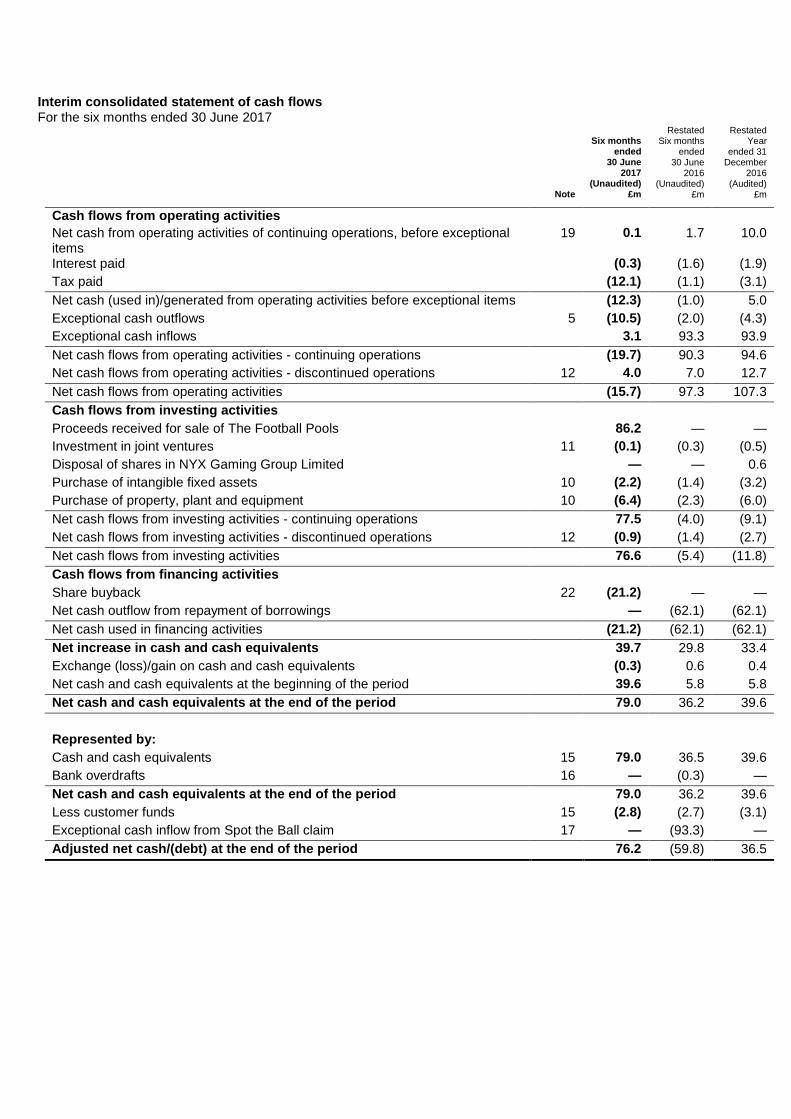
Interim consolidated statement of cash flows For the six months ended 30 June 2017
Six months
ended 30 June
2017 (Unaudited)
Restated Six months
ended 30 June
2016 (Unaudited)
Restated Year
ended 31 December
2016 (Audited)
Note £m £m £m
Cash flows from operating activities
Net cash from operating activities of continuing operations, before exceptional items
19 0.1 1.7 10.0
Interest paid (0.3) (1.6) (1.9)
Tax paid (12.1) (1.1) (3.1)
Net cash (used in)/generated from operating activities before exceptional items (12.3) (1.0) 5.0
Exceptional cash outflows 5 (10.5) (2.0) (4.3)
Exceptional cash inflows 3.1 93.3 93.9
Net cash flows from operating activities - continuing operations (19.7) 90.3 94.6
Net cash flows from operating activities - discontinued operations 12 4.0 7.0 12.7
Net cash flows from operating activities (15.7) 97.3 107.3
Cash flows from investing activities
Proceeds received for sale of The Football Pools 86.2 — —
Investment in joint ventures 11 (0.1) (0.3) (0.5)
Disposal of shares in NYX Gaming Group Limited — — 0.6
Purchase of intangible fixed assets 10 (2.2) (1.4) (3.2)
Purchase of property, plant and equipment 10 (6.4) (2.3) (6.0)
Net cash flows from investing activities - continuing operations 77.5 (4.0) (9.1)
Net cash flows from investing activities - discontinued operations 12 (0.9) (1.4) (2.7)
Net cash flows from investing activities 76.6 (5.4) (11.8)
Cash flows from financing activities
Share buyback 22 (21.2) — —
Net cash outflow from repayment of borrowings — (62.1) (62.1)
Net cash used in financing activities (21.2) (62.1) (62.1)
Net increase in cash and cash equivalents 39.7 29.8 33.4
Exchange (loss)/gain on cash and cash equivalents (0.3) 0.6 0.4
Net cash and cash equivalents at the beginning of the period 39.6 5.8 5.8
Net cash and cash equivalents at the end of the period 79.0 36.2 39.6
Represented by:
Cash and cash equivalents 15 79.0 36.5 39.6
Bank overdrafts 16 — (0.3) —
Net cash and cash equivalents at the end of the period 79.0 36.2 39.6
Less customer funds 15 (2.8) (2.7) (3.1)
Exceptional cash inflow from Spot the Ball claim 17 — (93.3) —
Adjusted net cash/(debt) at the end of the period 76.2 (59.8) 36.5
Notes to the consolidated interim financial statements For the six months ended 30 June 2017 1. General information
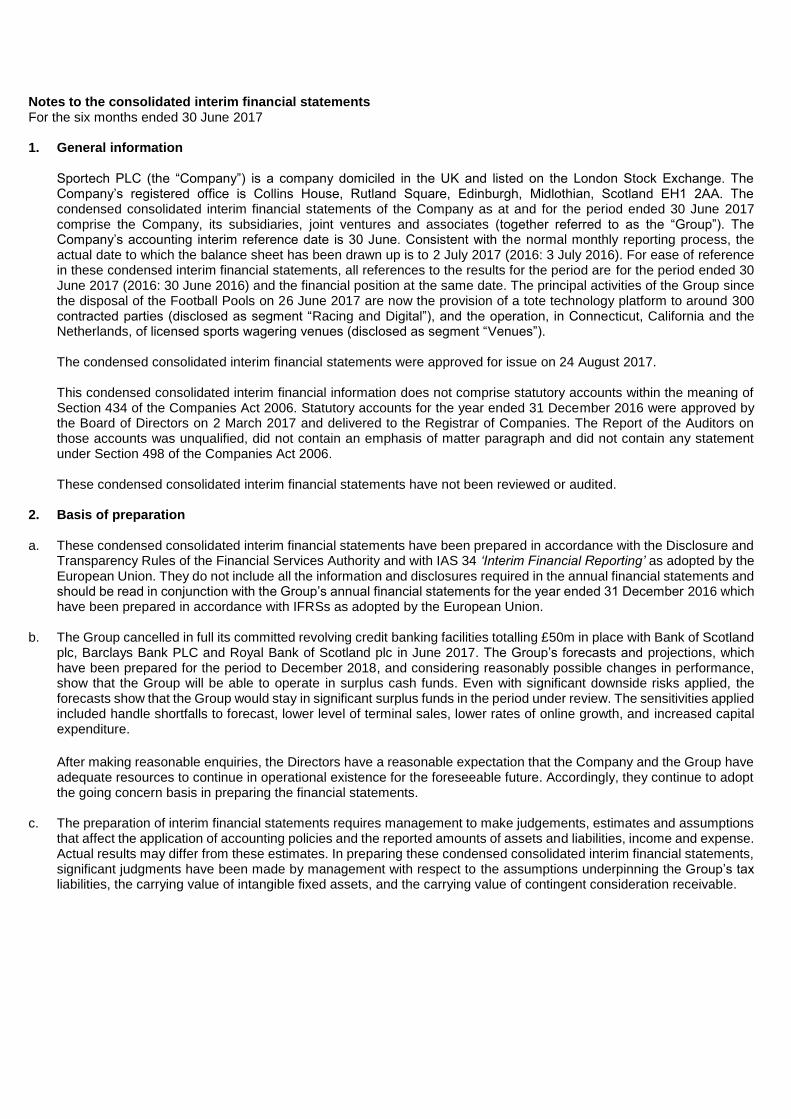
Sportech PLC (the “Company”) is a company domiciled in the UK and listed on the London Stock Exchange. The Company’s registered office is Collins House, Rutland Square, Edinburgh, Midlothian, Scotland EH1 2AA. The condensed consolidated interim financial statements of the Company as at and for the period ended 30 June 2017 comprise the Company, its subsidiaries, joint ventures and associates (together referred to as the “Group”). The Company’s accounting interim reference date is 30 June. Consistent with the normal monthly reporting process, the actual date to which the balance sheet has been drawn up is to 2 July 2017 (2016: 3 July 2016). For ease of reference in these condensed interim financial statements, all references to the results for the period are for the period ended 30 June 2017 (2016: 30 June 2016) and the financial position at the same date. The principal activities of the Group since the disposal of the Football Pools on 26 June 2017 are now the provision of a tote technology platform to around 300 contracted parties (disclosed as segment “Racing and Digital”), and the operation, in Connecticut, California and the Netherlands, of licensed sports wagering venues (disclosed as segment “Venues”). The condensed consolidated interim financial statements were approved for issue on 24 August 2017. This condensed consolidated interim financial information does not comprise statutory accounts within the meaning of Section 434 of the Companies Act 2006. Statutory accounts for the year ended 31 December 2016 were approved by the Board of Directors on 2 March 2017 and delivered to the Registrar of Companies. The Report of the Auditors on those accounts was unqualified, did not contain an emphasis of matter paragraph and did not contain any statement under Section 498 of the Companies Act 2006. These condensed consolidated interim financial statements have not been reviewed or audited.
2. Basis of preparation
a. These condensed consolidated interim financial statements have been prepared in accordance with the Disclosure and Transparency Rules of the Financial Services Authority and with IAS 34 ‘Interim Financial Reporting’ as adopted by the European Union. They do not include all the information and disclosures required in the annual financial statements and should be read in conjunction with the Group’s annual financial statements for the year ended 31 December 2016 which have been prepared in accordance with IFRSs as adopted by the European Union.
b. The Group cancelled in full its committed revolving credit banking facilities totalling £50m in place with Bank of Scotland plc, Barclays Bank PLC and Royal Bank of Scotland plc in June 2017. The Group’s forecasts and projections, which have been prepared for the period to December 2018, and considering reasonably possible changes in performance, show that the Group will be able to operate in surplus cash funds. Even with significant downside risks applied, the forecasts show that the Group would stay in significant surplus funds in the period under review. The sensitivities applied included handle shortfalls to forecast, lower level of terminal sales, lower rates of online growth, and increased capital expenditure.
After making reasonable enquiries, the Directors have a reasonable expectation that the Company and the Group have adequate resources to continue in operational existence for the foreseeable future. Accordingly, they continue to adopt the going concern basis in preparing the financial statements.
c. The preparation of interim financial statements requires management to make judgements, estimates and assumptions that affect the application of accounting policies and the reported amounts of assets and liabilities, income and expense. Actual results may differ from these estimates. In preparing these condensed consolidated interim financial statements, significant judgments have been made by management with respect to the assumptions underpinning the Group’s tax liabilities, the carrying value of intangible fixed assets, and the carrying value of contingent consideration receivable.
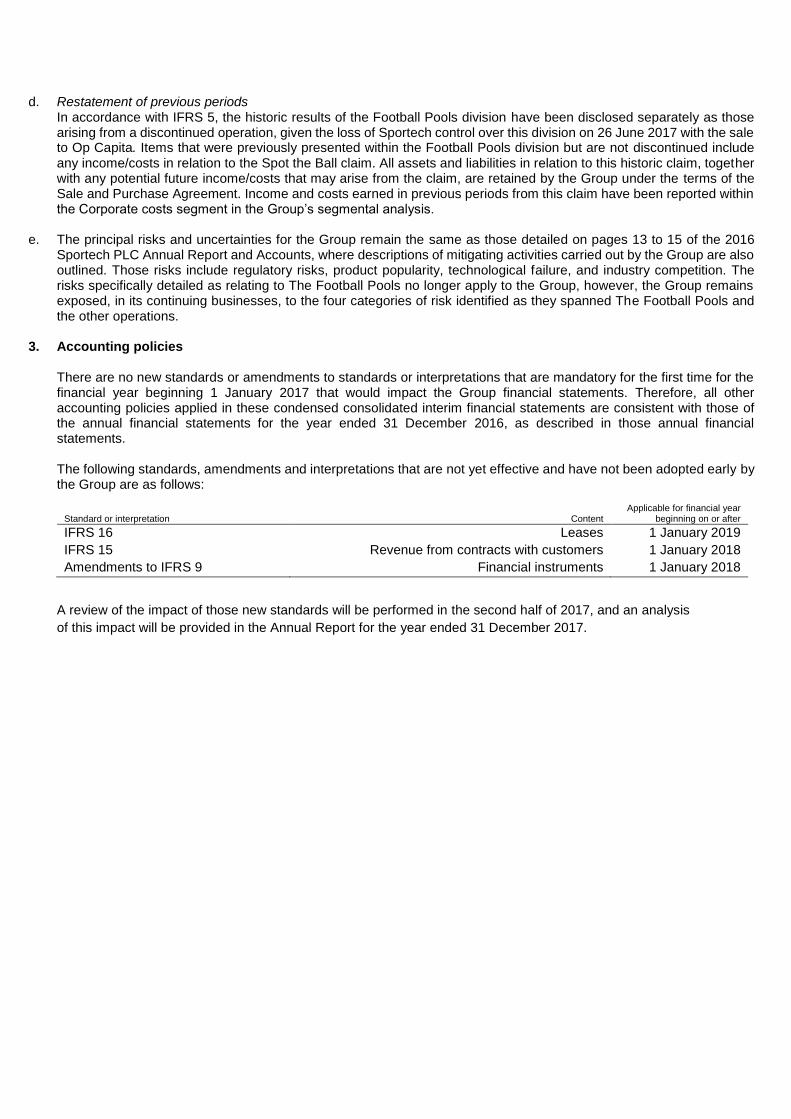
d. Restatement of previous periods In accordance with IFRS 5, the historic results of the Football Pools division have been disclosed separately as those arising from a discontinued operation, given the loss of Sportech control over this division on 26 June 2017 with the sale to Op Capita. Items that were previously presented within the Football Pools division but are not discontinued include any income/costs in relation to the Spot the Ball claim. All assets and liabilities in relation to this historic claim, together with any potential future income/costs that may arise from the claim, are retained by the Group under the terms of the Sale and Purchase Agreement. Income and costs earned in previous periods from this claim have been reported within the Corporate costs segment in the Group’s segmental analysis.
e. The principal risks and uncertainties for the Group remain the same as those detailed on pages 13 to 15 of the 2016 Sportech PLC Annual Report and Accounts, where descriptions of mitigating activities carried out by the Group are also outlined. Those risks include regulatory risks, product popularity, technological failure, and industry competition. The risks specifically detailed as relating to The Football Pools no longer apply to the Group, however, the Group remains exposed, in its continuing businesses, to the four categories of risk identified as they spanned The Football Pools and the other operations.
3. Accounting policies There are no new standards or amendments to standards or interpretations that are mandatory for the first time for the financial year beginning 1 January 2017 that would impact the Group financial statements. Therefore, all other accounting policies applied in these condensed consolidated interim financial statements are consistent with those of the annual financial statements for the year ended 31 December 2016, as described in those annual financial statements. The following standards, amendments and interpretations that are not yet effective and have not been adopted early by the Group are as follows:
Standard or interpretation
Content
Applicable for financial year
beginning on or after
IFRS 16 Leases 1 January 2019
IFRS 15 Revenue from contracts with customers 1 January 2018
Amendments to IFRS 9 Financial instruments 1 January 2018
A review of the impact of those new standards will be performed in the second half of 2017, and an analysis
of this impact will be provided in the Annual Report for the year ended 31 December 2017.
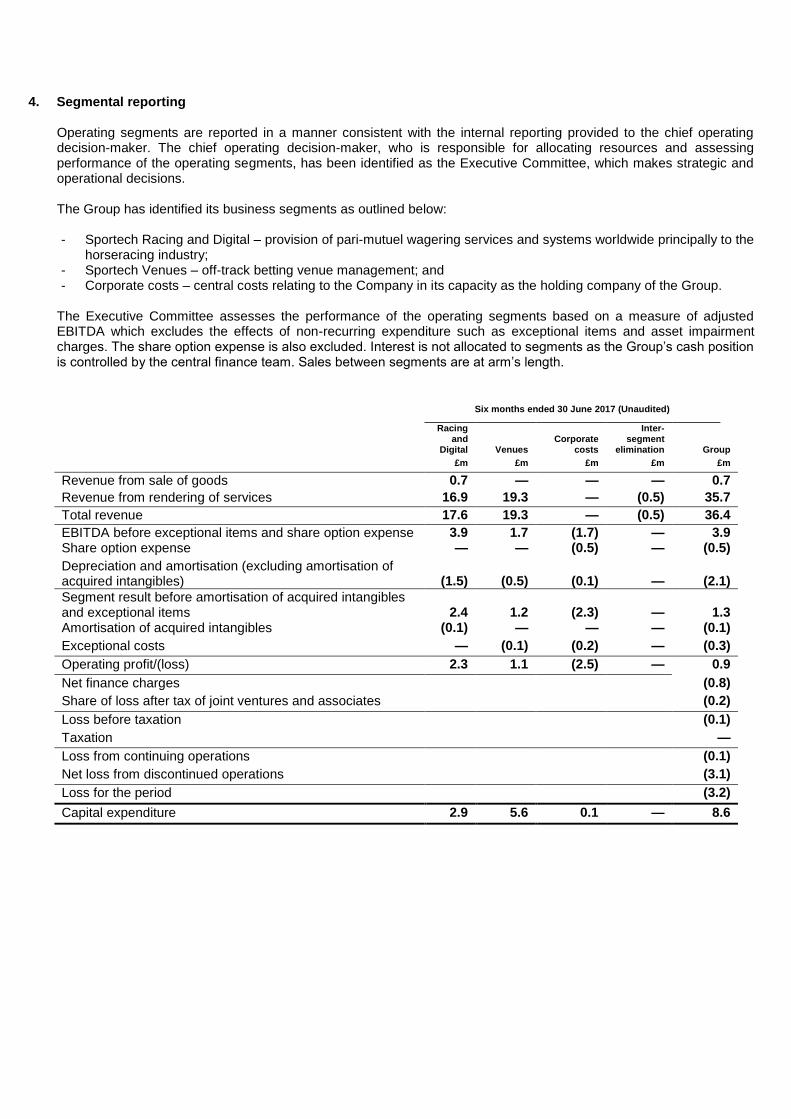
4. Segmental reporting Operating segments are reported in a manner consistent with the internal reporting provided to the chief operating decision-maker. The chief operating decision-maker, who is responsible for allocating resources and assessing performance of the operating segments, has been identified as the Executive Committee, which makes strategic and operational decisions. The Group has identified its business segments as outlined below: - Sportech Racing and Digital – provision of pari-mutuel wagering services and systems worldwide principally to the
horseracing industry; - Sportech Venues – off-track betting venue management; and - Corporate costs – central costs relating to the Company in its capacity as the holding company of the Group.
The Executive Committee assesses the performance of the operating segments based on a measure of adjusted EBITDA which excludes the effects of non-recurring expenditure such as exceptional items and asset impairment charges. The share option expense is also excluded. Interest is not allocated to segments as the Group’s cash position is controlled by the central finance team. Sales between segments are at arm’s length.
Six months ended 30 June 2017 (Unaudited)
Racing and
Digital
Venues
Corporate
costs
Inter-segment
elimination
Group
£m £m £m £m £m
Revenue from sale of goods 0.7 — — — 0.7
Revenue from rendering of services 16.9 19.3 — (0.5) 35.7
Total revenue 17.6 19.3 — (0.5) 36.4
EBITDA before exceptional items and share option expense 3.9 1.7 (1.7) — 3.9 Share option expense — — (0.5) — (0.5)
Depreciation and amortisation (excluding amortisation of acquired intangibles)
(1.5)
(0.5)
(0.1)
—
(2.1)
Segment result before amortisation of acquired intangibles and exceptional items
2.4
1.2
(2.3)
—
1.3
Amortisation of acquired intangibles (0.1) — — — (0.1)
Exceptional costs — (0.1) (0.2) — (0.3)
Operating profit/(loss) 2.3 1.1 (2.5) — 0.9
Net finance charges (0.8)
Share of loss after tax of joint ventures and associates (0.2)
Loss before taxation (0.1)
Taxation —
Loss from continuing operations (0.1)
Net loss from discontinued operations (3.1)
Loss for the period (3.2)
Capital expenditure 2.9 5.6 0.1 — 8.6
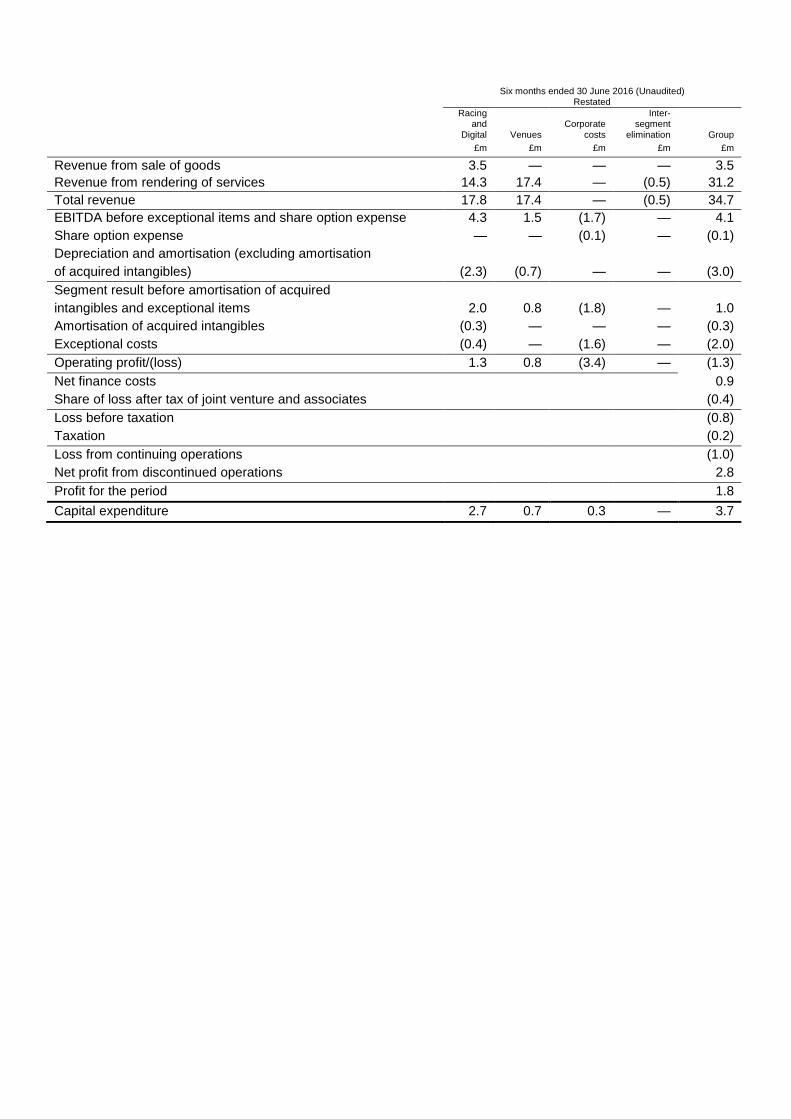
Six months ended 30 June 2016 (Unaudited)
Restated
Racing and
Digital
Venues
Corporate
costs
Inter-segment
elimination
Group
£m £m £m £m £m
Revenue from sale of goods 3.5 — — — 3.5
Revenue from rendering of services 14.3 17.4 — (0.5) 31.2
Total revenue 17.8 17.4 — (0.5) 34.7
EBITDA before exceptional items and share option expense 4.3 1.5 (1.7) — 4.1
Share option expense — — (0.1) — (0.1)
Depreciation and amortisation (excluding amortisation
of acquired intangibles) (2.3) (0.7) — — (3.0)
Segment result before amortisation of acquired
intangibles and exceptional items 2.0 0.8 (1.8) — 1.0
Amortisation of acquired intangibles (0.3) — — — (0.3)
Exceptional costs (0.4) — (1.6) — (2.0)
Operating profit/(loss) 1.3 0.8 (3.4) — (1.3)
Net finance costs 0.9
Share of loss after tax of joint venture and associates (0.4)
Loss before taxation (0.8)
Taxation (0.2)
Loss from continuing operations (1.0)
Net profit from discontinued operations 2.8
Profit for the period 1.8
Capital expenditure 2.7 0.7 0.3 — 3.7
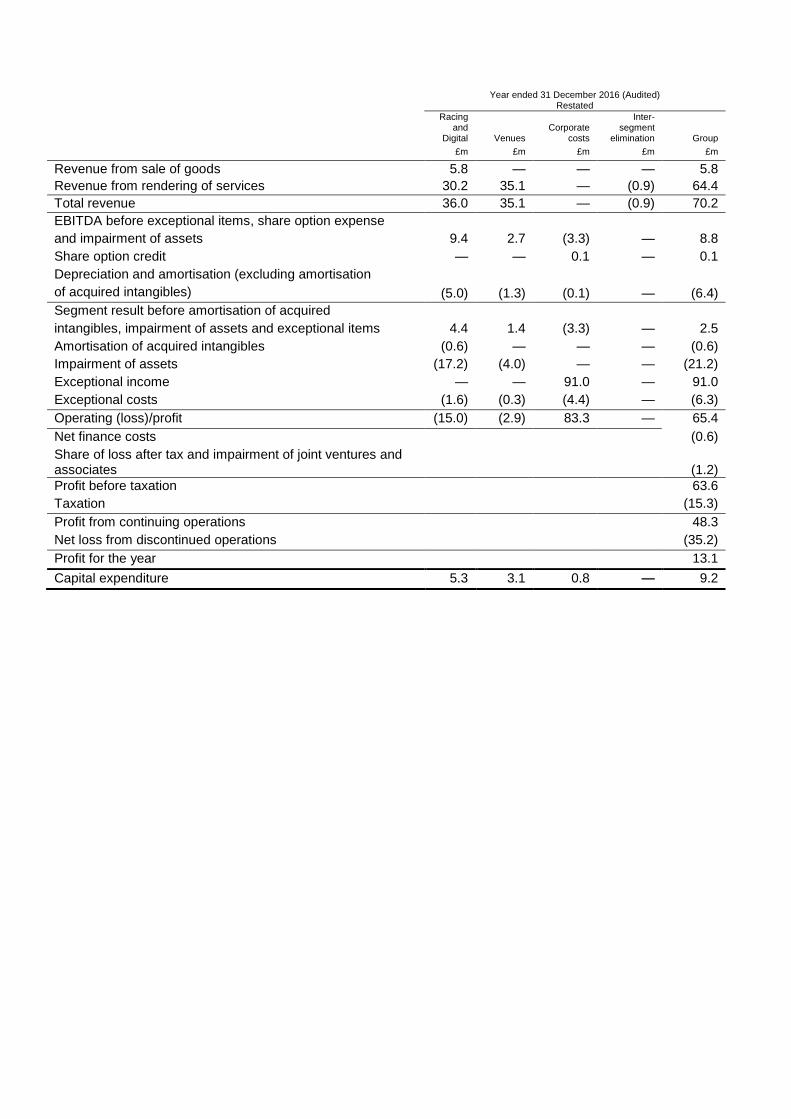
Year ended 31 December 2016 (Audited) Restated
Racing and
Digital
Venues
Corporate
costs
Inter-segment
elimination
Group
£m £m £m £m £m
Revenue from sale of goods 5.8 — — — 5.8
Revenue from rendering of services 30.2 35.1 — (0.9) 64.4
Total revenue 36.0 35.1 — (0.9) 70.2
EBITDA before exceptional items, share option expense
and impairment of assets 9.4 2.7 (3.3) — 8.8
Share option credit — — 0.1 — 0.1
Depreciation and amortisation (excluding amortisation
of acquired intangibles) (5.0) (1.3) (0.1) — (6.4)
Segment result before amortisation of acquired
intangibles, impairment of assets and exceptional items 4.4 1.4 (3.3) — 2.5
Amortisation of acquired intangibles (0.6) — — — (0.6)
Impairment of assets (17.2) (4.0) — — (21.2)
Exceptional income — — 91.0 — 91.0
Exceptional costs (1.6) (0.3) (4.4) — (6.3)
Operating (loss)/profit (15.0) (2.9) 83.3 — 65.4
Net finance costs (0.6)
Share of loss after tax and impairment of joint ventures and associates
(1.2)
Profit before taxation 63.6
Taxation (15.3)
Profit from continuing operations 48.3
Net loss from discontinued operations (35.2)
Profit for the year 13.1
Capital expenditure 5.3 3.1 0.8 — 9.2
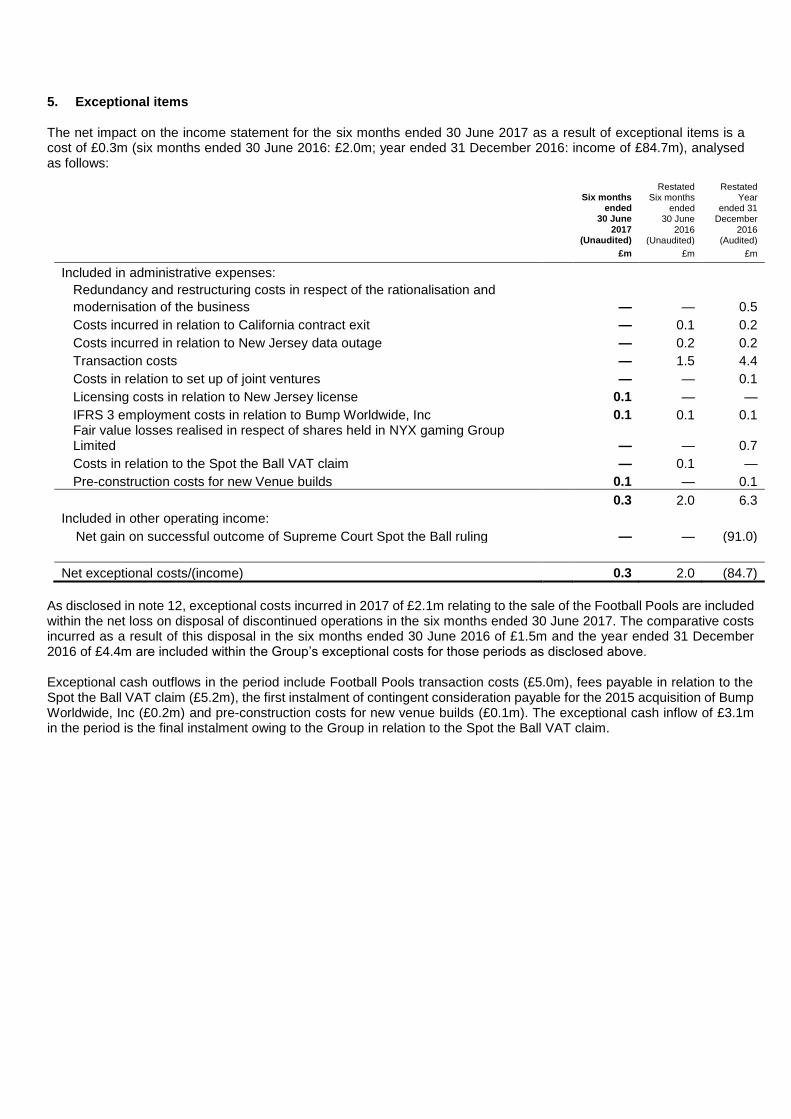
5. Exceptional items The net impact on the income statement for the six months ended 30 June 2017 as a result of exceptional items is a cost of £0.3m (six months ended 30 June 2016: £2.0m; year ended 31 December 2016: income of £84.7m), analysed as follows:
Six months ended
30 June 2017
(Unaudited)
Restated
Six months ended
30 June 2016
(Unaudited)
Restated
Year ended 31
December 2016
(Audited)
£m £m £m
Included in administrative expenses:
Redundancy and restructuring costs in respect of the rationalisation and
modernisation of the business — — 0.5
Costs incurred in relation to California contract exit — 0.1 0.2
Costs incurred in relation to New Jersey data outage — 0.2 0.2
Transaction costs — 1.5 4.4
Costs in relation to set up of joint ventures — — 0.1
Licensing costs in relation to New Jersey license 0.1 — —
IFRS 3 employment costs in relation to Bump Worldwide, Inc 0.1 0.1 0.1 Fair value losses realised in respect of shares held in NYX gaming Group Limited
— — 0.7
Costs in relation to the Spot the Ball VAT claim — 0.1 —
Pre-construction costs for new Venue builds 0.1 — 0.1
0.3 2.0 6.3
Included in other operating income:
Net gain on successful outcome of Supreme Court Spot the Ball ruling — — (91.0)
Net exceptional costs/(income) 0.3 2.0 (84.7)
As disclosed in note 12, exceptional costs incurred in 2017 of £2.1m relating to the sale of the Football Pools are included within the net loss on disposal of discontinued operations in the six months ended 30 June 2017. The comparative costs incurred as a result of this disposal in the six months ended 30 June 2016 of £1.5m and the year ended 31 December 2016 of £4.4m are included within the Group’s exceptional costs for those periods as disclosed above. Exceptional cash outflows in the period include Football Pools transaction costs (£5.0m), fees payable in relation to the Spot the Ball VAT claim (£5.2m), the first instalment of contingent consideration payable for the 2015 acquisition of Bump Worldwide, Inc (£0.2m) and pre-construction costs for new venue builds (£0.1m). The exceptional cash inflow of £3.1m in the period is the final instalment owing to the Group in relation to the Spot the Ball VAT claim.
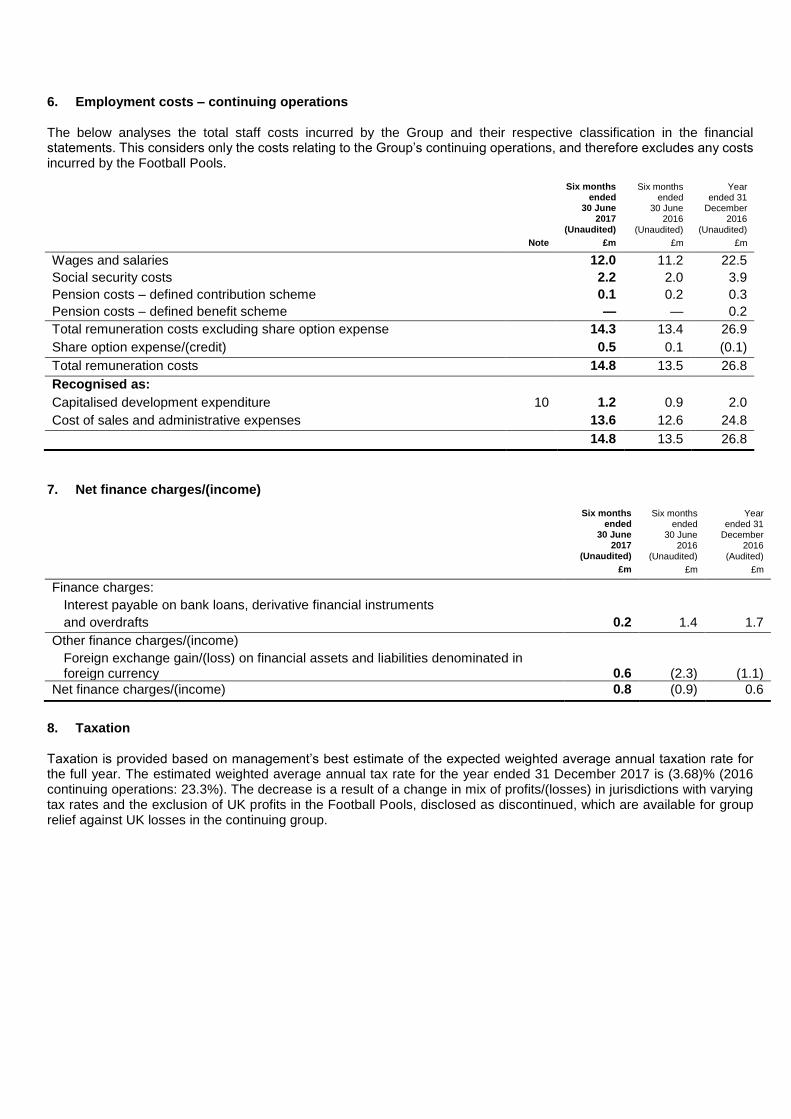
6. Employment costs – continuing operations The below analyses the total staff costs incurred by the Group and their respective classification in the financial statements. This considers only the costs relating to the Group’s continuing operations, and therefore excludes any costs incurred by the Football Pools.
Six months
ended 30 June
2017 (Unaudited)
Six months
ended 30 June
2016 (Unaudited)
Year
ended 31 December
2016 (Unaudited)
Note £m £m £m
Wages and salaries 12.0 11.2 22.5
Social security costs 2.2 2.0 3.9
Pension costs – defined contribution scheme 0.1 0.2 0.3
Pension costs – defined benefit scheme — — 0.2
Total remuneration costs excluding share option expense 14.3 13.4 26.9
Share option expense/(credit) 0.5 0.1 (0.1)
Total remuneration costs 14.8 13.5 26.8
Recognised as:
Capitalised development expenditure 10 1.2 0.9 2.0
Cost of sales and administrative expenses 13.6 12.6 24.8
14.8 13.5 26.8
7. Net finance charges/(income)
Six months
ended 30 June
2017 (Unaudited)
Six months
ended 30 June
2016 (Unaudited)
Year
ended 31 December
2016 (Audited)
£m £m £m
Finance charges:
Interest payable on bank loans, derivative financial instruments
and overdrafts 0.2 1.4 1.7
Other finance charges/(income)
Foreign exchange gain/(loss) on financial assets and liabilities denominated in foreign currency
0.6
(2.3)
(1.1)
Net finance charges/(income) 0.8 (0.9) 0.6
8. Taxation
Taxation is provided based on management’s best estimate of the expected weighted average annual taxation rate for the full year. The estimated weighted average annual tax rate for the year ended 31 December 2017 is (3.68)% (2016 continuing operations: 23.3%). The decrease is a result of a change in mix of profits/(losses) in jurisdictions with varying tax rates and the exclusion of UK profits in the Football Pools, disclosed as discontinued, which are available for group relief against UK losses in the continuing group.
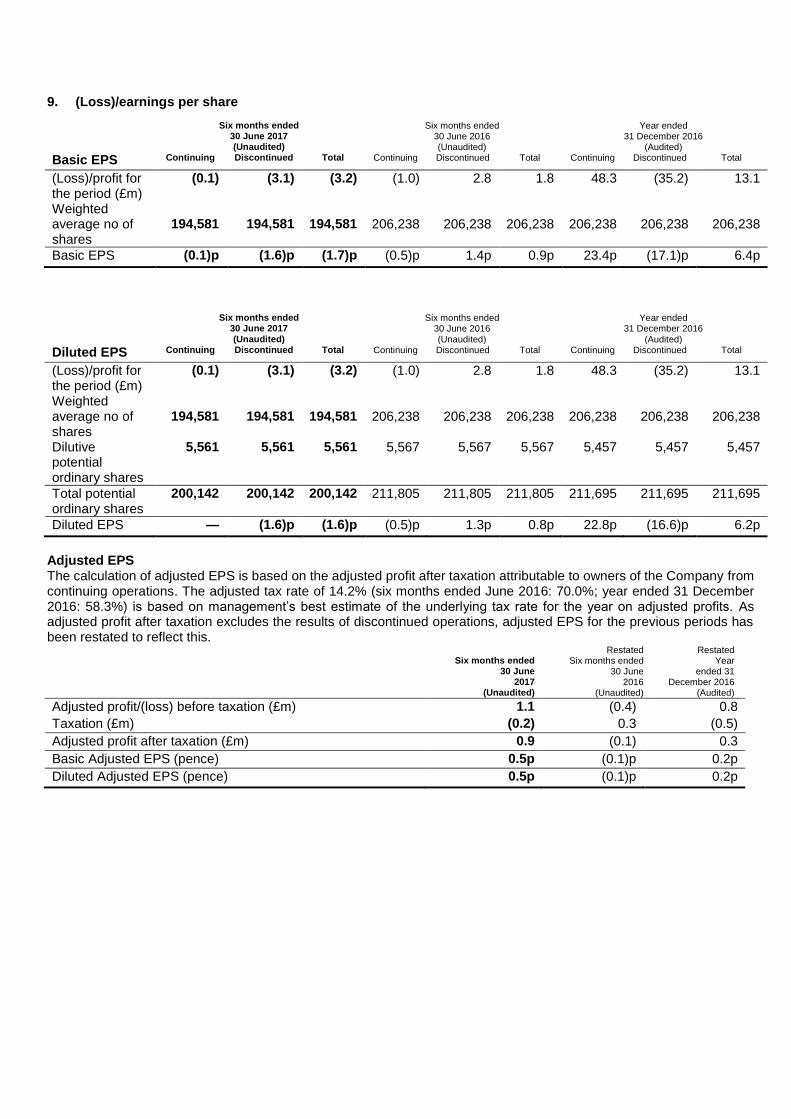
9. (Loss)/earnings per share
Six months ended
30 June 2017 (Unaudited)
Six months ended
30 June 2016 (Unaudited)
Year ended
31 December 2016 (Audited)
Basic EPS Continuing Discontinued Total Continuing Discontinued Total Continuing Discontinued Total
(Loss)/profit for the period (£m)
(0.1) (3.1) (3.2) (1.0) 2.8 1.8 48.3 (35.2) 13.1
Weighted average no of shares
194,581
194,581
194,581
206,238
206,238
206,238
206,238
206,238
206,238
Basic EPS (0.1)p (1.6)p (1.7)p (0.5)p 1.4p 0.9p 23.4p (17.1)p 6.4p
Six months ended
30 June 2017 (Unaudited)
Six months ended
30 June 2016 (Unaudited)
Year ended
31 December 2016 (Audited)
Diluted EPS Continuing Discontinued Total Continuing Discontinued Total Continuing Discontinued Total
(Loss)/profit for the period (£m)
(0.1) (3.1) (3.2) (1.0) 2.8 1.8 48.3 (35.2) 13.1
Weighted average no of shares
194,581
194,581
194,581
206,238
206,238
206,238
206,238
206,238
206,238
Dilutive potential ordinary shares
5,561 5,561 5,561 5,567 5,567 5,567 5,457 5,457 5,457
Total potential ordinary shares
200,142 200,142 200,142 211,805 211,805 211,805 211,695 211,695 211,695
Diluted EPS — (1.6)p (1.6)p (0.5)p 1.3p 0.8p 22.8p (16.6)p 6.2p
Adjusted EPS The calculation of adjusted EPS is based on the adjusted profit after taxation attributable to owners of the Company from continuing operations. The adjusted tax rate of 14.2% (six months ended June 2016: 70.0%; year ended 31 December 2016: 58.3%) is based on management’s best estimate of the underlying tax rate for the year on adjusted profits. As adjusted profit after taxation excludes the results of discontinued operations, adjusted EPS for the previous periods has been restated to reflect this.
Six months ended
30 June 2017
(Unaudited)
Restated Six months ended
30 June 2016
(Unaudited)
Restated Year
ended 31 December 2016
(Audited)
Adjusted profit/(loss) before taxation (£m) 1.1 (0.4) 0.8
Taxation (£m) (0.2) 0.3 (0.5)
Adjusted profit after taxation (£m) 0.9 (0.1) 0.3
Basic Adjusted EPS (pence) 0.5p (0.1)p 0.2p
Diluted Adjusted EPS (pence) 0.5p (0.1)p 0.2p
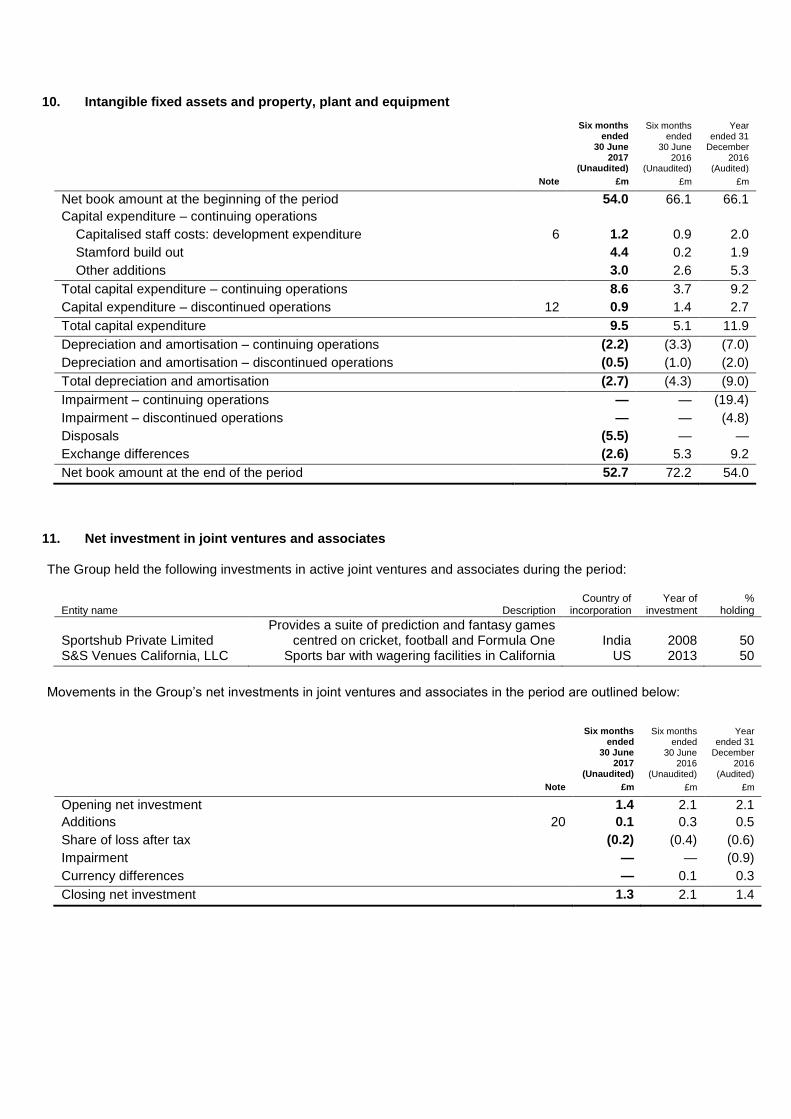
10. Intangible fixed assets and property, plant and equipment
Six months
ended 30 June
2017 (Unaudited)
Six months
ended 30 June
2016 (Unaudited)
Year
ended 31 December
2016 (Audited)
Note £m £m £m
Net book amount at the beginning of the period 54.0 66.1 66.1
Capital expenditure – continuing operations
Capitalised staff costs: development expenditure 6 1.2 0.9 2.0
Stamford build out 4.4 0.2 1.9
Other additions 3.0 2.6 5.3
Total capital expenditure – continuing operations 8.6 3.7 9.2
Capital expenditure – discontinued operations 12 0.9 1.4 2.7
Total capital expenditure 9.5 5.1 11.9
Depreciation and amortisation – continuing operations (2.2) (3.3) (7.0)
Depreciation and amortisation – discontinued operations (0.5) (1.0) (2.0)
Total depreciation and amortisation (2.7) (4.3) (9.0)
Impairment – continuing operations — — (19.4)
Impairment – discontinued operations — — (4.8)
Disposals (5.5) — —
Exchange differences (2.6) 5.3 9.2
Net book amount at the end of the period 52.7 72.2 54.0
11. Net investment in joint ventures and associates The Group held the following investments in active joint ventures and associates during the period:
Entity name Description Country of
incorporation Year of
investment %
holding
Sportshub Private Limited
Provides a suite of prediction and fantasy games centred on cricket, football and Formula One
India
2008
50
S&S Venues California, LLC Sports bar with wagering facilities in California US 2013 50
Movements in the Group’s net investments in joint ventures and associates in the period are outlined below:
Six months
ended 30 June
2017 (Unaudited)
Six months
ended 30 June
2016 (Unaudited)
Year
ended 31 December
2016 (Audited)
Note £m £m £m
Opening net investment 1.4 2.1 2.1
Additions 20 0.1 0.3 0.5
Share of loss after tax (0.2) (0.4) (0.6)
Impairment — — (0.9)
Currency differences — 0.1 0.3
Closing net investment 1.3 2.1 1.4
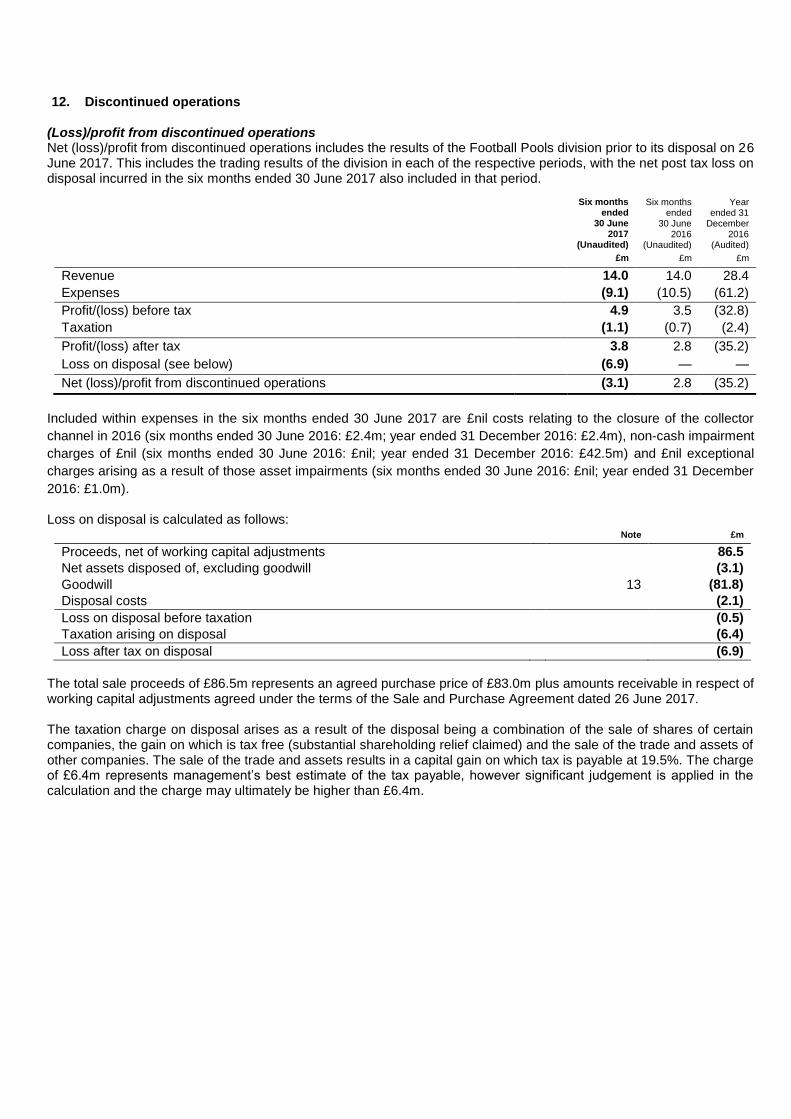
12. Discontinued operations (Loss)/profit from discontinued operations Net (loss)/profit from discontinued operations includes the results of the Football Pools division prior to its disposal on 26 June 2017. This includes the trading results of the division in each of the respective periods, with the net post tax loss on disposal incurred in the six months ended 30 June 2017 also included in that period.
Six months
ended 30 June
2017 (Unaudited)
Six months
ended 30 June
2016 (Unaudited)
Year
ended 31 December
2016 (Audited)
£m £m £m
Revenue 14.0 14.0 28.4
Expenses (9.1) (10.5) (61.2)
Profit/(loss) before tax 4.9 3.5 (32.8)
Taxation (1.1) (0.7) (2.4)
Profit/(loss) after tax 3.8 2.8 (35.2)
Loss on disposal (see below) (6.9) — —
Net (loss)/profit from discontinued operations (3.1) 2.8 (35.2)
Included within expenses in the six months ended 30 June 2017 are £nil costs relating to the closure of the collector
channel in 2016 (six months ended 30 June 2016: £2.4m; year ended 31 December 2016: £2.4m), non-cash impairment
charges of £nil (six months ended 30 June 2016: £nil; year ended 31 December 2016: £42.5m) and £nil exceptional
charges arising as a result of those asset impairments (six months ended 30 June 2016: £nil; year ended 31 December
2016: £1.0m).
Loss on disposal is calculated as follows: Note £m
Proceeds, net of working capital adjustments 86.5
Net assets disposed of, excluding goodwill (3.1)
Goodwill 13 (81.8)
Disposal costs (2.1)
Loss on disposal before taxation (0.5)
Taxation arising on disposal (6.4)
Loss after tax on disposal (6.9)
The total sale proceeds of £86.5m represents an agreed purchase price of £83.0m plus amounts receivable in respect of working capital adjustments agreed under the terms of the Sale and Purchase Agreement dated 26 June 2017. The taxation charge on disposal arises as a result of the disposal being a combination of the sale of shares of certain companies, the gain on which is tax free (substantial shareholding relief claimed) and the sale of the trade and assets of other companies. The sale of the trade and assets results in a capital gain on which tax is payable at 19.5%. The charge of £6.4m represents management’s best estimate of the tax payable, however significant judgement is applied in the calculation and the charge may ultimately be higher than £6.4m.

Cash flows from discontinued operations
Six months
ended 30 June
2017 (Unaudited)
Six months
ended 30 June
2016 (Unaudited)
Year
ended 31 December
2016 (Audited)
Note £m £m £m
Cash flows from operating activities
Cash flows from operations of discontinued operations 4.3 9.0 15.1
Exceptional cash outflows (0.3) (2.0) (2.4)
Net cash flows from operating activities 4.0 7.0 12.7
Cash flows from investing activities
Purchase of tangible fixed assets 10 — — (0.1)
Purchase of intangible fixed assets 10 (0.9) (1.4) (2.6)
Net cash flows used in investing activities (0.9) (1.4) (2.7)
Net movement in cash and cash equivalents - discontinued operations 3.1 5.6 10.0
13. Goodwill
Six months
ended 30 June
2017 (Unaudited)
Six months
ended 30 June
2016 (Unaudited)
Year
ended 31 December
2016 (Audited)
Note £m £m £m
At beginning of period 81.8 121.3 121.3
Impairment – Football Pools — — (37.7)
Impairment - eBet — — (1.8)
Disposal 12 (81.8) — —
At end of period — 121.3 81.8
14. Trade and other receivables
Six months
ended
30 June
2017
(Unaudited)
Six months
ended
30 June
2016
(Unaudited)
Year
ended 31
December
2016
(Audited)
Note £m £m £m
Non-current
Contingent consideration receivable from disposal of Sportech-NYX Gaming, LLC
21 1.5 1.4 1.6
Trade and other receivables 0.7 1.0 1.0
Total non-current trade and other receivables 2.2 2.4 2.6 Current
Trade and other receivables 12.3 11.7 14.6
Total trade and other receivables 14.5 14.1 17.2
Contingent consideration receivable relates to that due on the 2016 disposal of Sportech-NYX Gaming, LLC to NYX Gaming Group Limited. This amount is payable as CAD $1.0m for each customer that goes live on the NYX Real Money Wagering Platform in the US, its territories and Commonwealth, Canada and all sovereign Indian Nations in these countries prior to 28 May 2020, up to a maximum of CAD $3.0m. Management continue to believe that NYX will acquire at least three customers to the relevant platform by this date, and therefore continue to recognise the contingent consideration in full (discounted to today’s value at a rate of 8.3%). Movements on this receivable in the reporting period include unwinding this discount, plus exchange rate movements, given the consideration receivable is denominated in CAD.
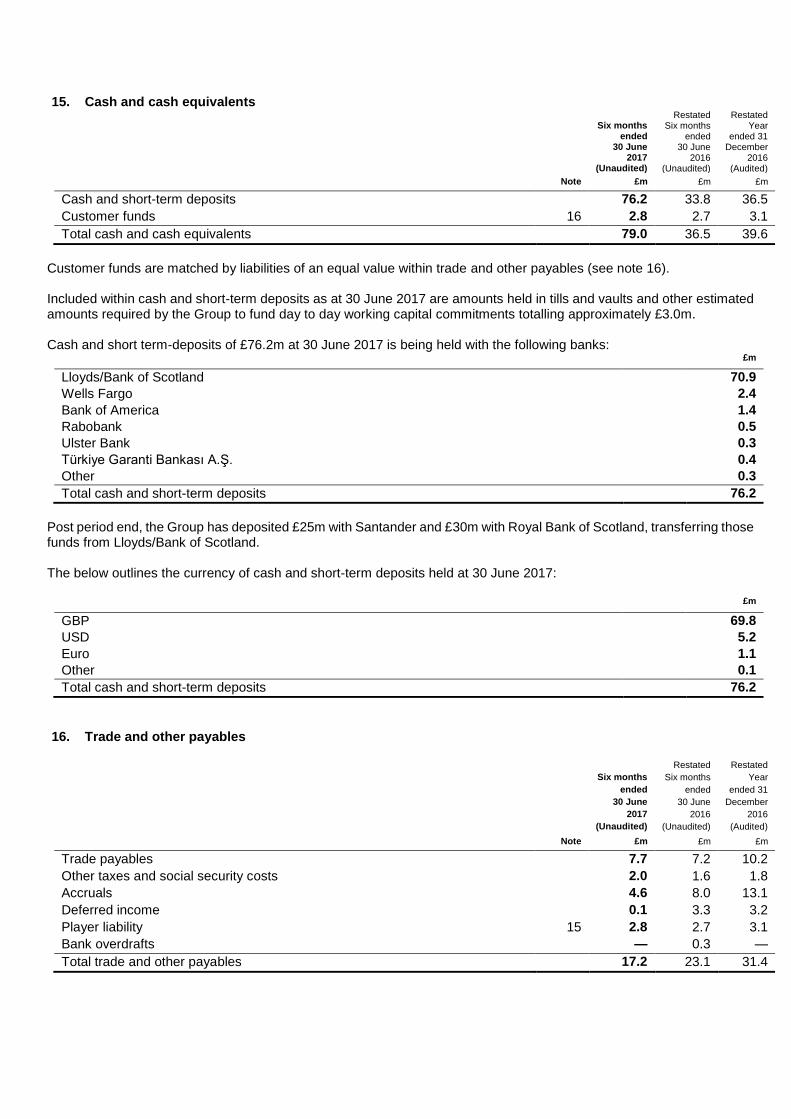
15. Cash and cash equivalents
Six months
ended 30 June
2017 (Unaudited)
Restated Six months
ended 30 June
2016 (Unaudited)
Restated Year
ended 31 December
2016 (Audited)
Note £m £m £m
Cash and short-term deposits 76.2 33.8 36.5
Customer funds 16 2.8 2.7 3.1
Total cash and cash equivalents 79.0 36.5 39.6
Customer funds are matched by liabilities of an equal value within trade and other payables (see note 16). Included within cash and short-term deposits as at 30 June 2017 are amounts held in tills and vaults and other estimated amounts required by the Group to fund day to day working capital commitments totalling approximately £3.0m. Cash and short term-deposits of £76.2m at 30 June 2017 is being held with the following banks:
£m
Lloyds/Bank of Scotland 70.9
Wells Fargo 2.4
Bank of America 1.4
Rabobank 0.5
Ulster Bank 0.3
Türkiye Garanti Bankası A.Ş. 0.4
Other 0.3
Total cash and short-term deposits 76.2
Post period end, the Group has deposited £25m with Santander and £30m with Royal Bank of Scotland, transferring those funds from Lloyds/Bank of Scotland. The below outlines the currency of cash and short-term deposits held at 30 June 2017:
£m
GBP 69.8
USD 5.2
Euro 1.1
Other 0.1
Total cash and short-term deposits 76.2
16. Trade and other payables
Six months
ended
30 June
2017
(Unaudited)
Restated
Six months
ended
30 June
2016
(Unaudited)
Restated
Year
ended 31
December
2016
(Audited)
Note £m £m £m
Trade payables 7.7 7.2 10.2
Other taxes and social security costs 2.0 1.6 1.8
Accruals 4.6 8.0 13.1
Deferred income 0.1 3.3 3.2
Player liability 15 2.8 2.7 3.1
Bank overdrafts — 0.3 —
Total trade and other payables 17.2 23.1 31.4
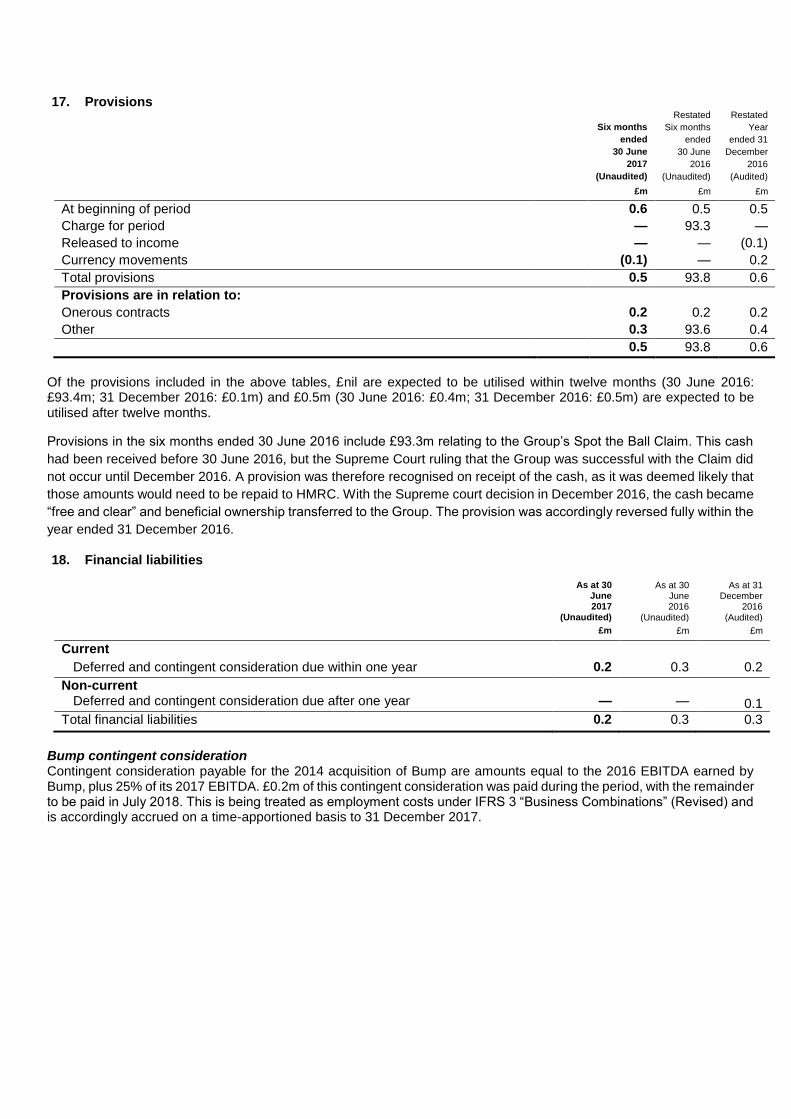
17. Provisions
Six months
ended
30 June
2017
(Unaudited)
Restated
Six months
ended
30 June
2016
(Unaudited)
Restated
Year
ended 31
December
2016
(Audited)
£m £m £m
At beginning of period 0.6 0.5 0.5
Charge for period — 93.3 —
Released to income — — (0.1)
Currency movements (0.1) — 0.2
Total provisions 0.5 93.8 0.6
Provisions are in relation to:
Onerous contracts 0.2 0.2 0.2
Other 0.3 93.6 0.4
0.5 93.8 0.6
Of the provisions included in the above tables, £nil are expected to be utilised within twelve months (30 June 2016: £93.4m; 31 December 2016: £0.1m) and £0.5m (30 June 2016: £0.4m; 31 December 2016: £0.5m) are expected to be utilised after twelve months.
Provisions in the six months ended 30 June 2016 include £93.3m relating to the Group’s Spot the Ball Claim. This cash
had been received before 30 June 2016, but the Supreme Court ruling that the Group was successful with the Claim did
not occur until December 2016. A provision was therefore recognised on receipt of the cash, as it was deemed likely that
those amounts would need to be repaid to HMRC. With the Supreme court decision in December 2016, the cash became
“free and clear” and beneficial ownership transferred to the Group. The provision was accordingly reversed fully within the
year ended 31 December 2016.
18. Financial liabilities
As at 30 June 2017
(Unaudited)
As at 30 June 2016
(Unaudited)
As at 31 December
2016 (Audited)
£m £m £m
Current
Deferred and contingent consideration due within one year 0.2 0.3 0.2
Non-current Deferred and contingent consideration due after one year — — 0.1
Total financial liabilities 0.2 0.3 0.3
Bump contingent consideration Contingent consideration payable for the 2014 acquisition of Bump are amounts equal to the 2016 EBITDA earned by Bump, plus 25% of its 2017 EBITDA. £0.2m of this contingent consideration was paid during the period, with the remainder to be paid in July 2018. This is being treated as employment costs under IFRS 3 “Business Combinations” (Revised) and is accordingly accrued on a time-apportioned basis to 31 December 2017.

19. Cash flow from operating activities Reconciliation of (loss)/profit before taxation to cash flows from operating activities for continuing operations
Six months
ended 30 June
2017 (Unaudited)
Six months
ended 30 June
2016 (Unaudited)
Year
ended 31 December
2016 (Audited)
Restated Restated
£m £m £m
(Loss)/profit before taxation (0.1) (0.8) 63.6
Adjustments for:
Net exceptional costs/(income) 0.3 2.0 (84.7)
Share of loss after tax and impairment of joint ventures and associates 0.2 0.4 1.2
Depreciation 1.3 1.6 3.3
Amortisation of acquired intangibles 0.1 0.3 0.6
Amortisation of other intangibles 0.8 1.4 3.1
Impairment of assets — — 21.2
Finance charges 0.2 1.4 1.7
Other finance charges/(income) 0.6 (2.3) (1.1)
Share option expense/(credit) 0.5 0.1 (0.1)
Changes in working capital of continuing operations:
(Increase)/decrease in trade and other receivables (2.0) (1.6) 1.5
Increase in inventories (0.8) (0.4) —
Decrease in trade and other payables, excluding player liabilities (1.0) (1.5) (1.8)
Increase in customer funds — 1.1 1.5
Net cash from operating activities of continuing operations, before exceptional items 0.1 1.7 10.0
Non-cash transactions There were no significant non-cash transactions during the period (six months ended 30 June 2016: £nil; year ended 31 December 2016: £nil).
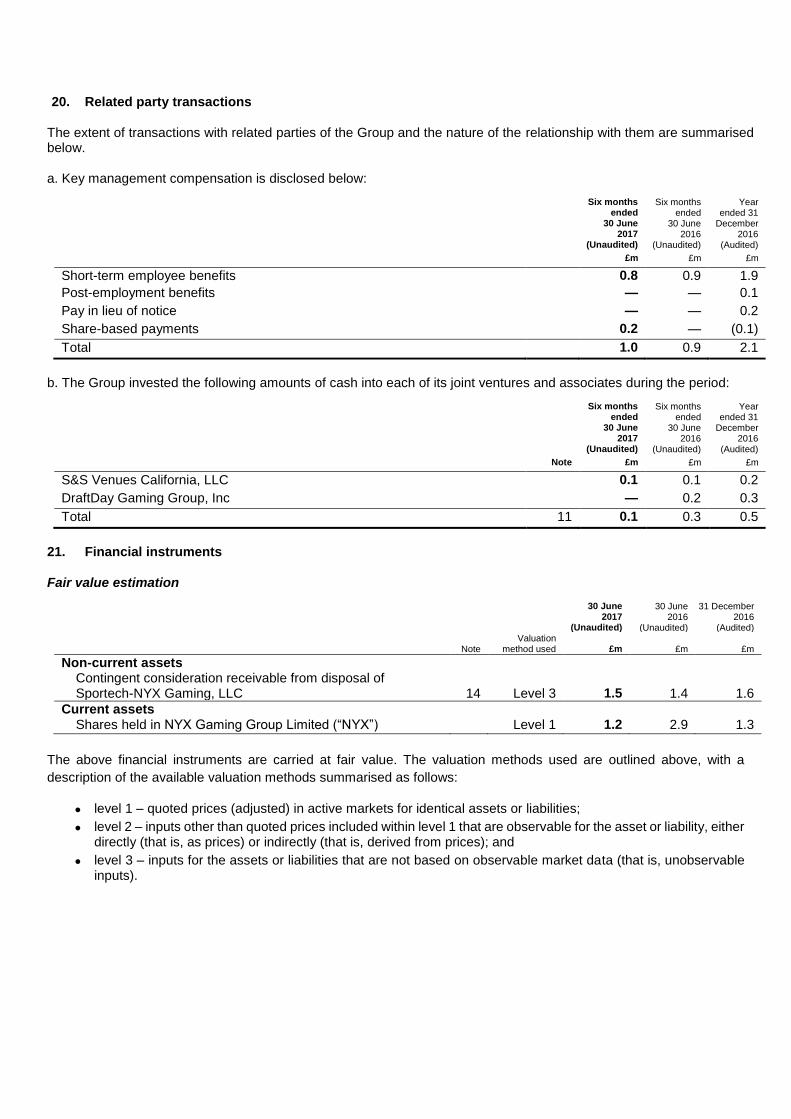
20. Related party transactions The extent of transactions with related parties of the Group and the nature of the relationship with them are summarised below. a. Key management compensation is disclosed below:
Six months
ended 30 June
2017 (Unaudited)
Six months
ended 30 June
2016 (Unaudited)
Year
ended 31 December
2016 (Audited)
£m £m £m
Short-term employee benefits 0.8 0.9 1.9
Post-employment benefits — — 0.1
Pay in lieu of notice — — 0.2
Share-based payments 0.2 — (0.1)
Total 1.0 0.9 2.1
b. The Group invested the following amounts of cash into each of its joint ventures and associates during the period:
Six months
ended 30 June
2017 (Unaudited)
Six months
ended 30 June
2016 (Unaudited)
Year
ended 31 December
2016 (Audited)
Note £m £m £m
S&S Venues California, LLC 0.1 0.1 0.2
DraftDay Gaming Group, Inc — 0.2 0.3
Total 11 0.1 0.3 0.5
21. Financial instruments Fair value estimation
30 June
2017 (Unaudited)
30 June
2016 (Unaudited)
31 December
2016 (Audited)
Note
Valuation method used
£m
£m
£m
Non-current assets Contingent consideration receivable from disposal of Sportech-NYX Gaming, LLC
14
Level 3
1.5
1.4
1.6
Current assets Shares held in NYX Gaming Group Limited (“NYX”) Level 1 1.2 2.9 1.3
The above financial instruments are carried at fair value. The valuation methods used are outlined above, with a
description of the available valuation methods summarised as follows:
level 1 – quoted prices (adjusted) in active markets for identical assets or liabilities;
level 2 – inputs other than quoted prices included within level 1 that are observable for the asset or liability, either directly (that is, as prices) or indirectly (that is, derived from prices); and
level 3 – inputs for the assets or liabilities that are not based on observable market data (that is, unobservable inputs).

The fair value of contingent consideration is included in level 3. Management observe market activity including industry growth and pace of regulatory change in determining the probability that the contingent consideration will be received. As outlined in note 14, it is management’s belief that NYX will sign up at least three new customers to the relevant platform and therefore the maximum amount of contingent consideration receivable has been recognised. The fair value of shares held in NYX are included in level 1, using the quoted share price at the reporting date in determining the amount receivable. Fair value movements on those shares are recognised in the available for sale reserve within equity until the date of their disposal, at which point the gains will be realised in the income statement. At the reporting date, the fair value of those shares is £1.2m, with £2.6m held in the available for sale reserve. 22. Share capital and buyback
Six months
ended 30 June
2017 (Unaudited)
Six months
ended 30 June
2016 (Unaudited)
Year
ended 31 December
2016 (Audited)
£m £m £m
At beginning of period 103.1 103.1 103.1
Share buyback (10.3) — —
At end of period 92.8 103.1 103.1
On 21 March 2017, the Company purchased 20,623,804 of its own ordinary shares from its shareholders at a price of £1.015 per share. This resulted in a shareholder distribution of £20.9m, with costs associated with the buyback of £0.3m being incurred. These ordinary shares acquired were cancelled in full on the same date, giving rise to a capital redemption reserve in the Group’s financial statements. 23. Financial instruments The Group continually monitors the foreign currency risks and takes steps, where practical, to ensure that the net exposure is kept to an acceptable level. In doing so, the Group considers whether use of foreign exchange forward contracts would be appropriate. As at 30 June 2017, the Group had entered into six non-cash settled forward contracts to exchange US Dollars for Sterling in varying amounts between $200,000 and $800,000, totalling $2,850,000 all at a rate of 1.29 USD:GBP. Any difference to the spot rate on expiry date of each contract will be settled in cash and charge/credited to EBITDA. As at 30 June 2017, the fair value of the contracts was £nil. No contracts were in existence as at 30 June 2016 or 31 December 2016. Statement of Directors’ responsibilities The Directors confirm that these condensed consolidated interim financial statements have been prepared in accordance with IAS 34 as adopted by the European Union and that the Interim Management Report includes a fair review of the information required by DTR 4.2.7R and DTR 4.2.8R, namely:
an indication of important events that have occurred during the first six months and their impact on the condensed set of financial statements and a description of the principal risks and uncertainties for the remaining six months of the financial year; and
material related party transactions in the first six months and any material changes in the related party transactions described in the last Annual Report and Accounts.
A list of current Directors of Sportech PLC is maintained on the Sportech PLC website: www.sportechplc.com. On behalf of the Board Ian Penrose Mickey Kalifa Chief Executive Chief Financial Officer 24 August 2017 24 August 2017