staff budget briefing
TRANSCRIPT
STAFF BUDGET BRIEFING FY 2022-23
DEPARTMENT OF REVENUE
JBC WORKING DOCUMENT - SUBJECT TO CHANGE STAFF RECOMMENDATION DOES NOT REPRESENT COMMITTEE DECISION
PREPARED BY: JON CATLETT, JBC STAFF
NOVEMBER 18, 2021
JOINT BUDGET COMMITTEE STAFF 200 E. 14TH AVENUE, 3RD FLOOR · DENVER · COLORADO · 80203
TELEPHONE: (303) 866-2061 · TDD: (303) 866-3472 https://leg.colorado.gov/agencies/joint-budget-committee

TABLE OF CONTENTS Department Overview ....................................................................................................................................................... 1
Department Budget: Recent Appropriations ................................................................................................................. 2 Department Budget: Graphic Overview ......................................................................................................................... 3
General Factors Driving the Budget ................................................................................................................................ 5
Taxation ...................................................................................................................................................................... 5
Specialized Business Group .................................................................................................................................. 10
Summary: FY 2021-22 Appropriation & FY 2022-23 Request ................................................................................ 11 Informational Issue: Division of Motor Vehicles Update.......................................................................................... 15
Summary: ....................................................................................................................................................................... 15
Discussion: .................................................................................................................................................................... 15
DMV Digital Transformation ............................................................................................................................... 15 DMV Operating Trends ........................................................................................................................................ 17
DMV Cash Funds: License Service and Drives ................................................................................................. 18
Informational Issue: Sports Betting Update ................................................................................................................. 25
Summary ........................................................................................................................................................................ 25
Discussion: .................................................................................................................................................................... 25 Appendix A Numbers Pages (Digital Only) ................................................................................................................A1
Appendix B Footnotes and Information Requests ...................................................................................................B1
Appendix C Department Annual Performance Report ...........................................................................................C1
ADDITIONAL RESOURCES
Brief summaries of all bills that passed during the 2020 and 2021 legislative sessions that had a fiscal impact on this department are available in Appendix A of the annual Appropriations Report: https://leg.colorado.gov/sites/default/files/fy21-22apprept_0.pdf
The online version of the briefing document, which includes the Numbers Pages, may be found by searching the budget documents on the General Assembly’s website by visiting leg.colorado.gov/content/budget/budget-documents. Once on the budge documents page, select the name of this department's Department/Topic, "Briefing" under Type, and ensure that Start date and End date encompass the date a document was presented to the JBC.

DEPARTMENT OF REVENUE
DEPARTMENT OVERVIEW
The Department of Revenue regulates, enforces, and administers the state’s tax laws. The Department also issues and maintains records related to drivers licenses, vehicle emission testing stations, registration and titling of motor vehicles, limited stakes gaming, liquor and tobacco retailers, horse racing and pari-mutuel betting, the automobile sales industry, and medical and recreational marijuana retailers, growing facilities, and manufacturing facilities. In addition, the Department operates the State Lottery, including state and multi-state games. The Department is divided into five divisions or business groups, four of which provide direct services to the citizens of the State, and one that provides support for the four direct-service providers.
THE EXECUTIVE DIRECTOR’S OFFICE • Provides overall leadership and administration for the Department, including the central budget
office, accounting and financial services, information technology, internal audit, human resourcesadministration, and includes the Office of Research and Analysis, a citizens' advocate, and theHearings Division.
THE TAXATION BUSINESS GROUP • Is responsible for the collection, administration, and enforcement of individual and corporate
income taxes, sales and use taxes, gasoline and special fuel taxes, and severance taxes, as well as allother taxes collected by the State;
• Provides assistance and information to taxpayers about compliance with Colorado’s tax laws;• Attempts to resolve taxpayer disputes before they reach the court system;• Administers the cigarette tax rebate and the Amendment 35 distribution of cigarette taxes to the
cities and counties; and• Administers the Old Age Heat and Fuel and Property Tax Rebate Program.
THE DIVISION OF MOTOR VEHICLES (DMV) • Is responsible for enforcement and administration of the laws governing driver licensing and
vehicle registration;• Licenses drivers, maintains records of licensed drivers, and applies administrative sanctions against
drivers who violate traffic laws, including for drunk driving and for excessive points;• Oversees the vehicle emissions testing stations (including mobile testing stations);• Registers and titles motor vehicles; and• Administers the motor vehicle insurance identification database to prevent the registration of
vehicles that are not insured.
THE SPECIALIZED BUSINESS GROUP • Regulates and enforces laws related to the limited stakes gaming industry in three historic mining
towns;• Regulates and enforces laws related to the sports betting industry;
18-Nov-2021 1 REV-brf
• Enforces laws regarding liquor and tobacco retailers, including laws against selling those products to minors, and licenses retailers and special events where alcohol is served;
• Regulates horse racing (dog racing is currently inactive) and pari-mutuel betting (including off-track betting);
• Regulates retailers and sales agents in the motor vehicle sales industry; and • Regulates medical and recreational marijuana dispensaries, cultivation, and manufacturing
facilities. THE STATE LOTTERY DIVISION Operates the State Lottery, which sells scratch ticket games and tickets for jackpot games (e.g. Powerball, Lotto, Cash 5, Pick 3, and Mega Millions). The net proceeds of the Lottery benefit the following funds and programs: • The Conservation Trust Fund; • Colorado Division of Parks and Outdoors Recreation; • Great Outdoors Colorado; and • The Public School Capital Construction Assistance Fund. The following table outlines the sum of recent appropriations.
DEPARTMENT BUDGET: RECENT APPROPRIATIONS
FUNDING SOURCE FY 2019-20 FY 2020-21 FY 2021-22 FY 2022-23 *
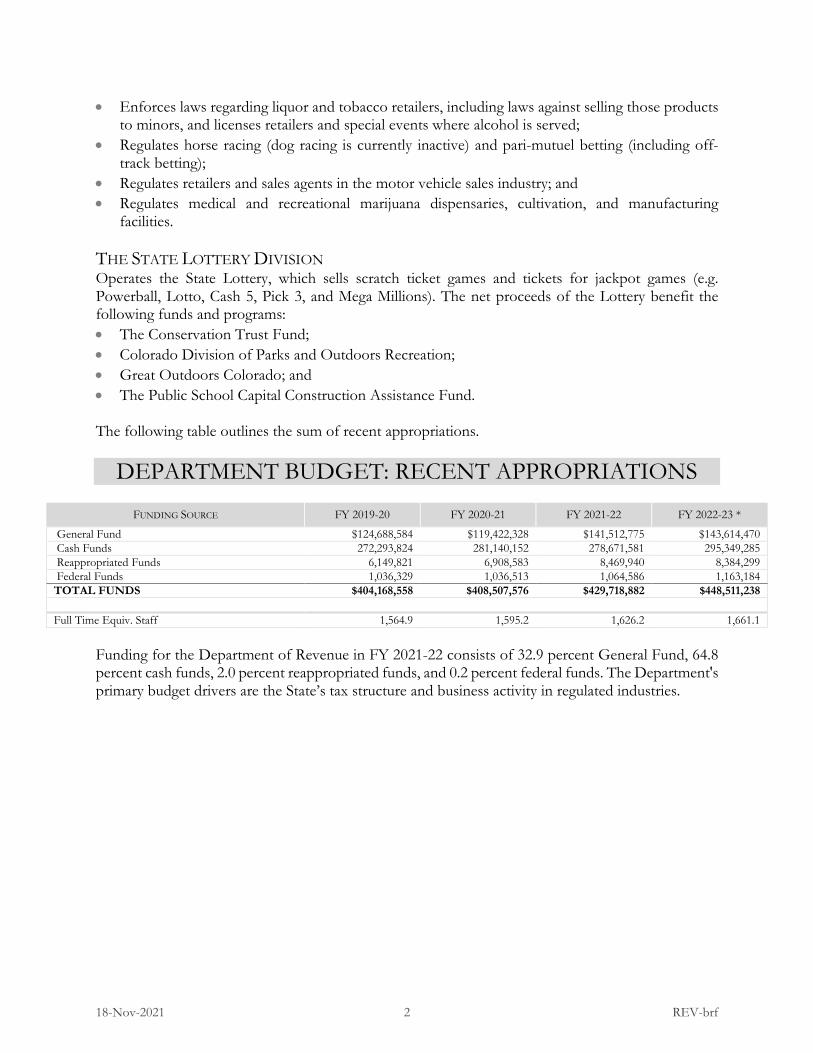
General Fund $124,688,584 $119,422,328 $141,512,775 $143,614,470 Cash Funds 272,293,824 281,140,152 278,671,581 295,349,285 Reappropriated Funds 6,149,821 6,908,583 8,469,940 8,384,299 Federal Funds 1,036,329 1,036,513 1,064,586 1,163,184 TOTAL FUNDS $404,168,558 $408,507,576 $429,718,882 $448,511,238 Full Time Equiv. Staff 1,564.9 1,595.2 1,626.2 1,661.1
Funding for the Department of Revenue in FY 2021-22 consists of 32.9 percent General Fund, 64.8 percent cash funds, 2.0 percent reappropriated funds, and 0.2 percent federal funds. The Department's primary budget drivers are the State’s tax structure and business activity in regulated industries.
18-Nov-2021 2 REV-brf

DEPARTMENT BUDGET: GRAPHIC OVERVIEW
1.1%
Department's Share of Statewide General Fund
Based on the FY 2021-22 appropriation.
0.2%
2.0%
32.9%
64.8%
0% 100%
Federal Funds
Reappropriated Funds
General Fund
Cash Funds
Department Funding Sources
Based on the FY 2021-22 appropriation.
18-Nov-2021 3 REV-brf

0.0%
0.1%
6.4%
22.5%
71.0%
0% 100%
State Lottery
Specialized Business Group
Motor Vehicles
Executive Director's Office
Taxation Business Group
Distribution of General Fund by Division
Based on the FY 2021-22 appropriation.
15.7%
15.9%
17.6%
24.4%
26.4%
0% 100%
Motor Vehicles
Specialized Business Group
Executive Director's Office
Taxation Business Group
State Lottery
Distribution of Total Funds by Division
Based on the FY 2021-22 appropriation.
18-Nov-2021 4 REV-brf

GENERAL FACTORS DRIVING THE BUDGET TAXATION TAX COLLECTIONS The complexity of Colorado's tax structure affects the resources required by the Taxation Business Group, the Department's tax division. In addition to collecting state taxes, the Department collects local taxes for most counties, cities, and special districts in Colorado, and tracks and distributes the collections monthly to the local governments. Local sales taxes collected include city sales tax, county lodging tax, county transit sales tax, special district taxes, and transportation authority tax. In FY 2019-20, the most recent year with finalized and audited data, $8.2 billion dollars in corporate and individual incomes taxes and $4.7 billion in sales, use, and excise taxes were collected. An additional $147.9 million in severance taxes and $2.0 billion in local taxes were also collected by the Department. The following table and chart outline net collections by the Department of state and local taxes.
STATE AND LOCAL TAXES - NET COLLECTIONS BY SOURCE (MILLIONS) FY12-13 FY13-14 FY14-15 FY15-16 FY16-17 FY17-18 FY18-19 FY19-20
Income tax $6,180.7 $6,371.4 $6,995.4 $7,077.0 $7,320.5 $8,293.0 $8,966.2 $8,241.4 Sales, use, and excise taxes 3,358.3 3,589.5 3,884.7 3,971.6 4,205.5 4,504.4 4,678.3 4,710.7 Severance tax 147.7 245.1 292.7 84.1 (7.2) 102.7 217.9 147.9 Total state tax collections $9,686.7 $10,206.0 $11,172.7 $11,132.7 $11,518.7 $12,900.2 $13,862.4 $13,100.0 Local taxes 1,229.6 1,320.8 1,433.2 1,508.0 1,612.4 1,726.7 1,849.9 2,006.0 Total tax collections $10,916.3 $11,526.9 $12,605.9 $12,640.6 $13,131.2 $14,626.9 $15,712.4 $15,106.0
$0.0
$5.0
$10.0
$15.0
FY12-13 FY14-15 FY16-17 FY18-19
Income tax
Tax Collections by Source (millions)
Sales, Use, and Excise Taxes
Local Tax
Severance Tax
18-Nov-2021 5 REV-brf
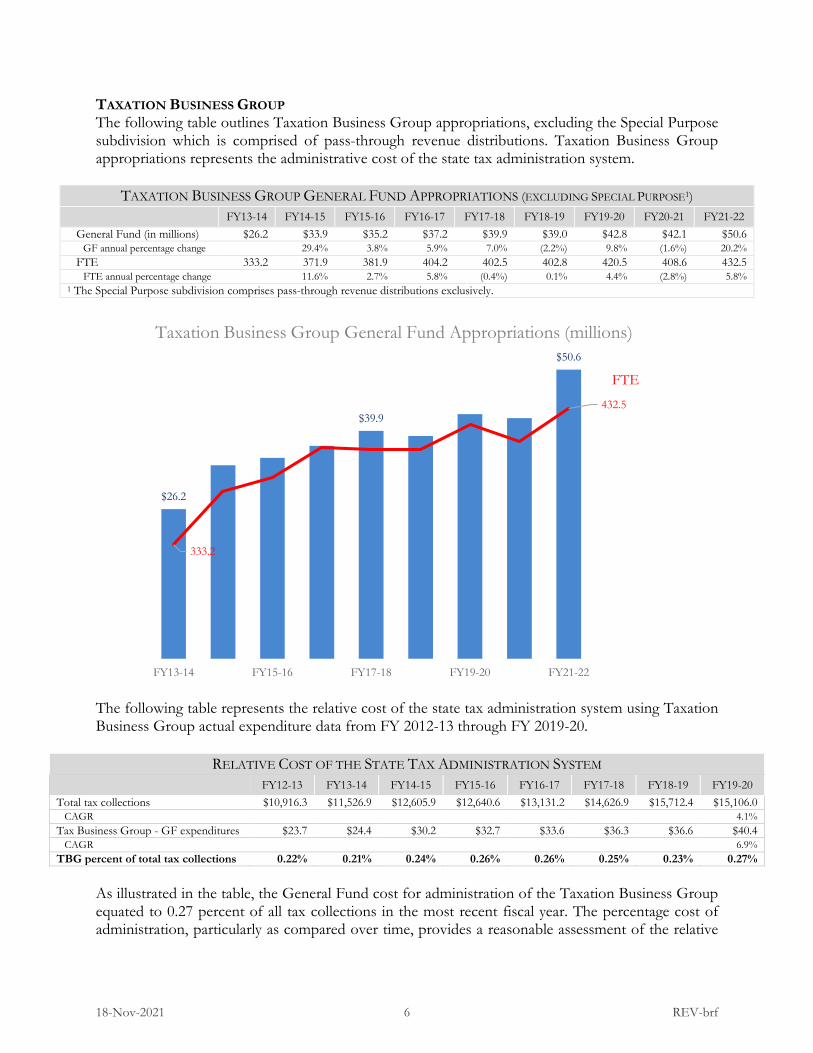
TAXATION BUSINESS GROUP The following table outlines Taxation Business Group appropriations, excluding the Special Purpose subdivision which is comprised of pass-through revenue distributions. Taxation Business Group appropriations represents the administrative cost of the state tax administration system.
TAXATION BUSINESS GROUP GENERAL FUND APPROPRIATIONS (EXCLUDING SPECIAL PURPOSE1) FY13-14 FY14-15 FY15-16 FY16-17 FY17-18 FY18-19 FY19-20 FY20-21 FY21-22
General Fund (in millions) $26.2 $33.9 $35.2 $37.2 $39.9 $39.0 $42.8 $42.1 $50.6 GF annual percentage change 29.4% 3.8% 5.9% 7.0% (2.2%) 9.8% (1.6%) 20.2% FTE 333.2 371.9 381.9 404.2 402.5 402.8 420.5 408.6 432.5 FTE annual percentage change 11.6% 2.7% 5.8% (0.4%) 0.1% 4.4% (2.8%) 5.8% 1 The Special Purpose subdivision comprises pass-through revenue distributions exclusively.
The following table represents the relative cost of the state tax administration system using Taxation Business Group actual expenditure data from FY 2012-13 through FY 2019-20.
RELATIVE COST OF THE STATE TAX ADMINISTRATION SYSTEM FY12-13 FY13-14 FY14-15 FY15-16 FY16-17 FY17-18 FY18-19 FY19-20
Total tax collections $10,916.3 $11,526.9 $12,605.9 $12,640.6 $13,131.2 $14,626.9 $15,712.4 $15,106.0 CAGR 4.1% Tax Business Group - GF expenditures $23.7 $24.4 $30.2 $32.7 $33.6 $36.3 $36.6 $40.4 CAGR 6.9% TBG percent of total tax collections 0.22% 0.21% 0.24% 0.26% 0.26% 0.25% 0.23% 0.27%
As illustrated in the table, the General Fund cost for administration of the Taxation Business Group equated to 0.27 percent of all tax collections in the most recent fiscal year. The percentage cost of administration, particularly as compared over time, provides a reasonable assessment of the relative
$26.2
$39.9
$50.6
333.2
432.5
FY13-14 FY15-16 FY17-18 FY19-20 FY21-22
FTE
Taxation Business Group General Fund Appropriations (millions)
18-Nov-2021 6 REV-brf
administrative cost of the state's tax system and whether it is becoming more or less expensive over time relative to tax collections.
Also as reflected in the table, the compound average annual growth rate (CAAGR) over the eight-year period totals 6.9 percent for the cost of tax administration. This compares to a CAAGR of 4.1 percent for total tax collections. Although not conclusively represented in the data, this slightly increased cost of tax administration and slightly higher CAAGR is likely attributable to the cost of the information technology system known as GenTax.
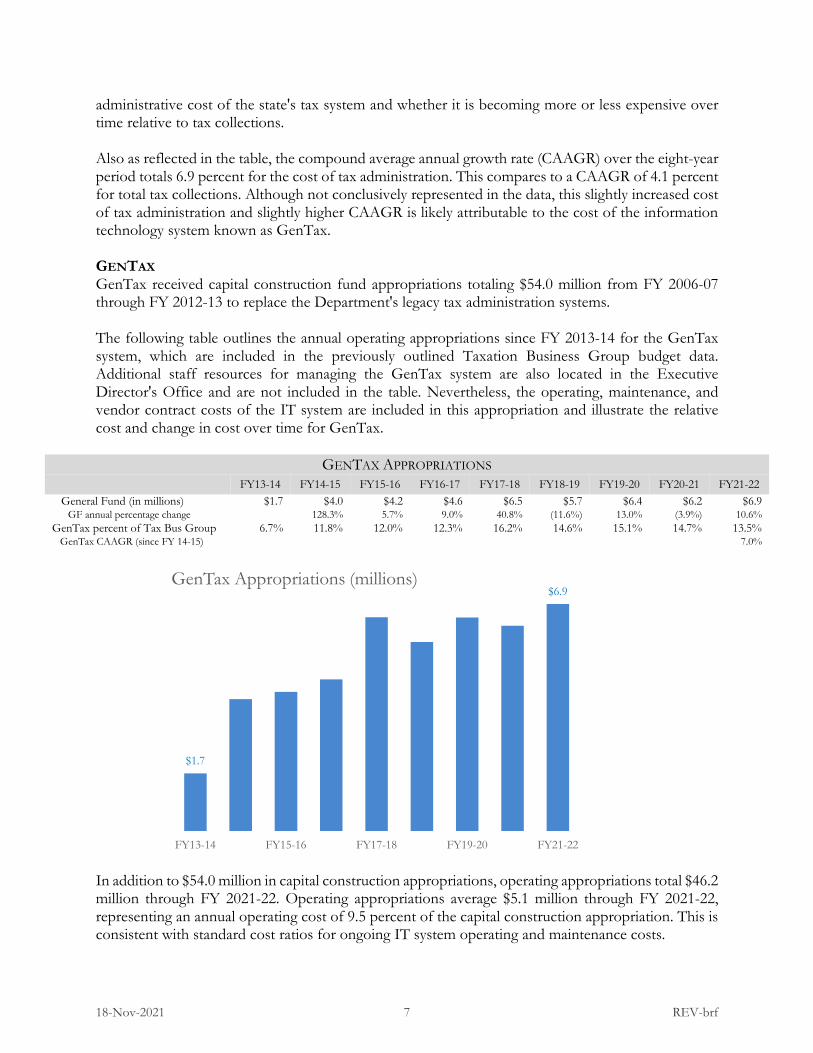
GENTAX GenTax received capital construction fund appropriations totaling $54.0 million from FY 2006-07 through FY 2012-13 to replace the Department's legacy tax administration systems.
The following table outlines the annual operating appropriations since FY 2013-14 for the GenTax system, which are included in the previously outlined Taxation Business Group budget data. Additional staff resources for managing the GenTax system are also located in the Executive Director's Office and are not included in the table. Nevertheless, the operating, maintenance, and vendor contract costs of the IT system are included in this appropriation and illustrate the relative cost and change in cost over time for GenTax.
GENTAX APPROPRIATIONS FY13-14 FY14-15 FY15-16 FY16-17 FY17-18 FY18-19 FY19-20 FY20-21 FY21-22
General Fund (in millions) $1.7 $4.0 $4.2 $4.6 $6.5 $5.7 $6.4 $6.2 $6.9 GF annual percentage change 128.3% 5.7% 9.0% 40.8% (11.6%) 13.0% (3.9%) 10.6% GenTax percent of Tax Bus Group 6.7% 11.8% 12.0% 12.3% 16.2% 14.6% 15.1% 14.7% 13.5% GenTax CAAGR (since FY 14-15) 7.0%
In addition to $54.0 million in capital construction appropriations, operating appropriations total $46.2 million through FY 2021-22. Operating appropriations average $5.1 million through FY 2021-22, representing an annual operating cost of 9.5 percent of the capital construction appropriation. This is consistent with standard cost ratios for ongoing IT system operating and maintenance costs.
$1.7
$6.9
FY13-14 FY15-16 FY17-18 FY19-20 FY21-22
GenTax Appropriations (millions)
18-Nov-2021 7 REV-brf
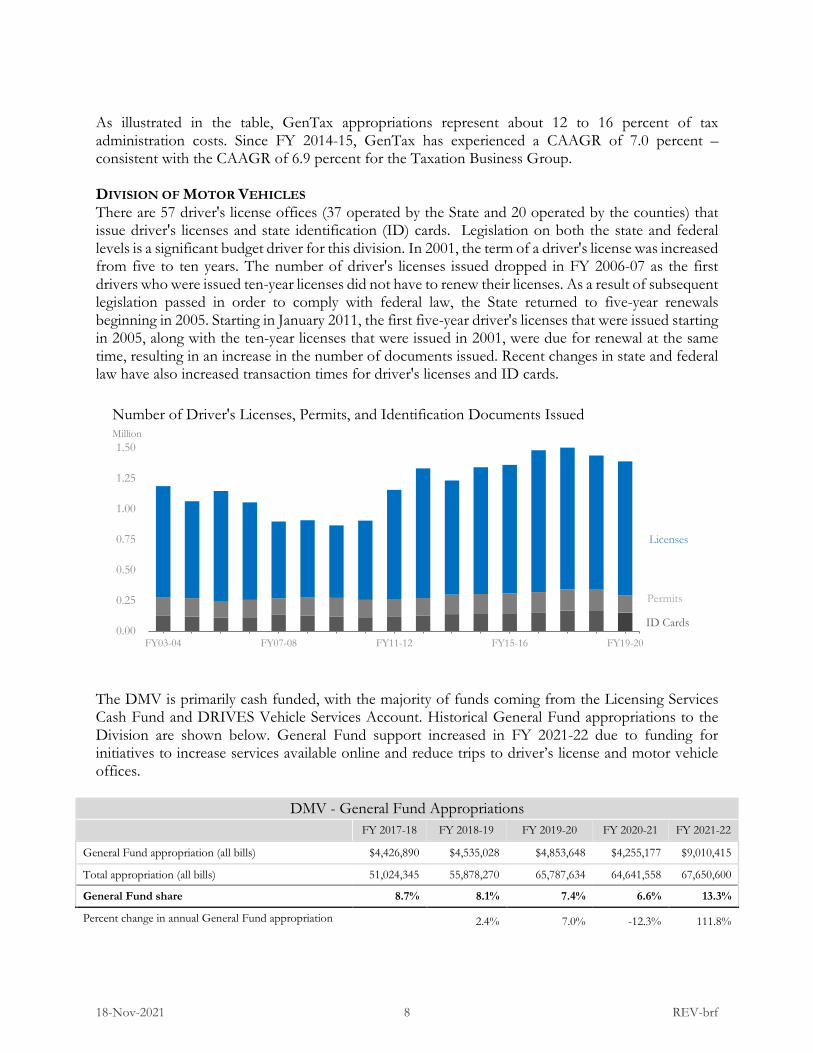
As illustrated in the table, GenTax appropriations represent about 12 to 16 percent of tax administration costs. Since FY 2014-15, GenTax has experienced a CAAGR of 7.0 percent – consistent with the CAAGR of 6.9 percent for the Taxation Business Group. DIVISION OF MOTOR VEHICLES There are 57 driver's license offices (37 operated by the State and 20 operated by the counties) that issue driver's licenses and state identification (ID) cards. Legislation on both the state and federal levels is a significant budget driver for this division. In 2001, the term of a driver's license was increased from five to ten years. The number of driver's licenses issued dropped in FY 2006-07 as the first drivers who were issued ten-year licenses did not have to renew their licenses. As a result of subsequent legislation passed in order to comply with federal law, the State returned to five-year renewals beginning in 2005. Starting in January 2011, the first five-year driver's licenses that were issued starting in 2005, along with the ten-year licenses that were issued in 2001, were due for renewal at the same time, resulting in an increase in the number of documents issued. Recent changes in state and federal law have also increased transaction times for driver's licenses and ID cards.
The DMV is primarily cash funded, with the majority of funds coming from the Licensing Services Cash Fund and DRIVES Vehicle Services Account. Historical General Fund appropriations to the Division are shown below. General Fund support increased in FY 2021-22 due to funding for initiatives to increase services available online and reduce trips to driver’s license and motor vehicle offices.
DMV - General Fund Appropriations FY 2017-18 FY 2018-19 FY 2019-20 FY 2020-21 FY 2021-22
General Fund appropriation (all bills) $4,426,890 $4,535,028 $4,853,648 $4,255,177 $9,010,415
Total appropriation (all bills) 51,024,345 55,878,270 65,787,634 64,641,558 67,650,600
General Fund share 8.7% 8.1% 7.4% 6.6% 13.3%
Percent change in annual General Fund appropriation 2.4% 7.0% -12.3% 111.8%
0.00
0.25
0.50
0.75
1.00
1.25
1.50
FY03-04 FY07-08 FY11-12 FY15-16 FY19-20
ID Cards
Million
Number of Driver's Licenses, Permits, and Identification Documents Issued
Permits
Licenses
18-Nov-2021 8 REV-brf
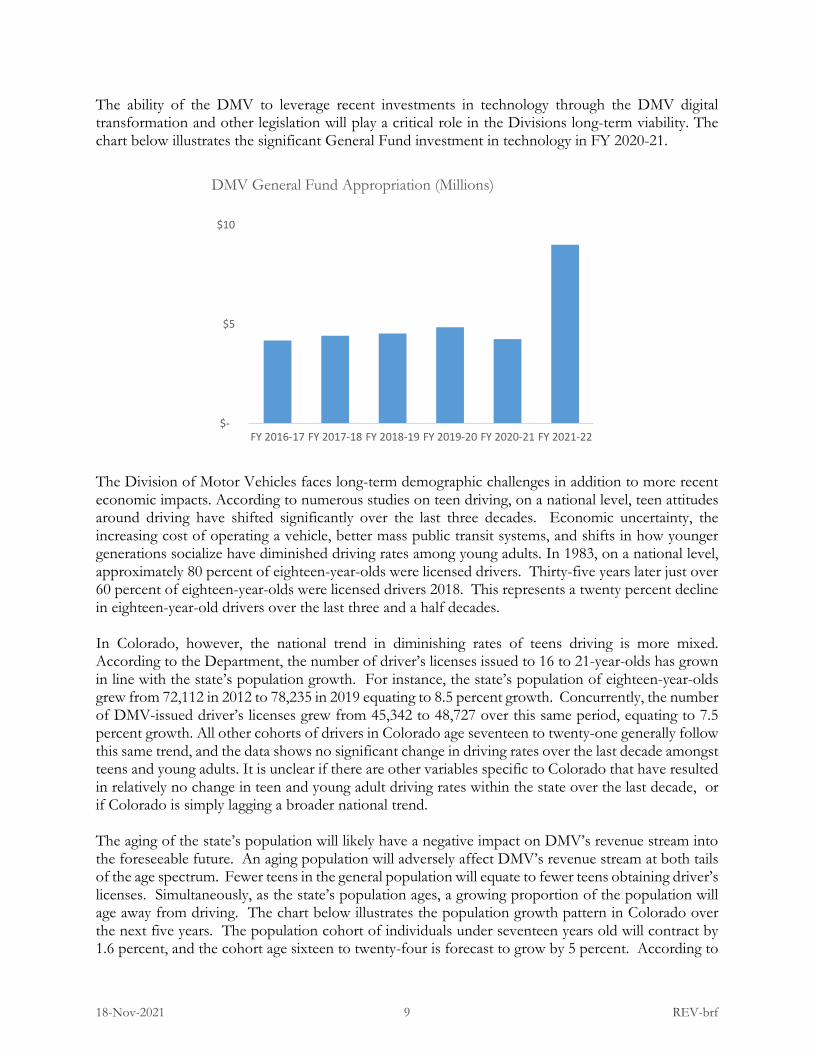
The ability of the DMV to leverage recent investments in technology through the DMV digital transformation and other legislation will play a critical role in the Divisions long-term viability. The chart below illustrates the significant General Fund investment in technology in FY 2020-21.
The Division of Motor Vehicles faces long-term demographic challenges in addition to more recent economic impacts. According to numerous studies on teen driving, on a national level, teen attitudes around driving have shifted significantly over the last three decades. Economic uncertainty, the increasing cost of operating a vehicle, better mass public transit systems, and shifts in how younger generations socialize have diminished driving rates among young adults. In 1983, on a national level, approximately 80 percent of eighteen-year-olds were licensed drivers. Thirty-five years later just over 60 percent of eighteen-year-olds were licensed drivers 2018. This represents a twenty percent decline in eighteen-year-old drivers over the last three and a half decades. In Colorado, however, the national trend in diminishing rates of teens driving is more mixed. According to the Department, the number of driver’s licenses issued to 16 to 21-year-olds has grown in line with the state’s population growth. For instance, the state’s population of eighteen-year-olds grew from 72,112 in 2012 to 78,235 in 2019 equating to 8.5 percent growth. Concurrently, the number of DMV-issued driver’s licenses grew from 45,342 to 48,727 over this same period, equating to 7.5 percent growth. All other cohorts of drivers in Colorado age seventeen to twenty-one generally follow this same trend, and the data shows no significant change in driving rates over the last decade amongst teens and young adults. It is unclear if there are other variables specific to Colorado that have resulted in relatively no change in teen and young adult driving rates within the state over the last decade, or if Colorado is simply lagging a broader national trend. The aging of the state’s population will likely have a negative impact on DMV’s revenue stream into the foreseeable future. An aging population will adversely affect DMV’s revenue stream at both tails of the age spectrum. Fewer teens in the general population will equate to fewer teens obtaining driver’s licenses. Simultaneously, as the state’s population ages, a growing proportion of the population will age away from driving. The chart below illustrates the population growth pattern in Colorado over the next five years. The population cohort of individuals under seventeen years old will contract by 1.6 percent, and the cohort age sixteen to twenty-four is forecast to grow by 5 percent. According to
$-
$5
$10
FY 2016-17 FY 2017-18 FY 2018-19 FY 2019-20 FY 2020-21 FY 2021-22
DMV General Fund Appropriation (Millions)
18-Nov-2021 9 REV-brf
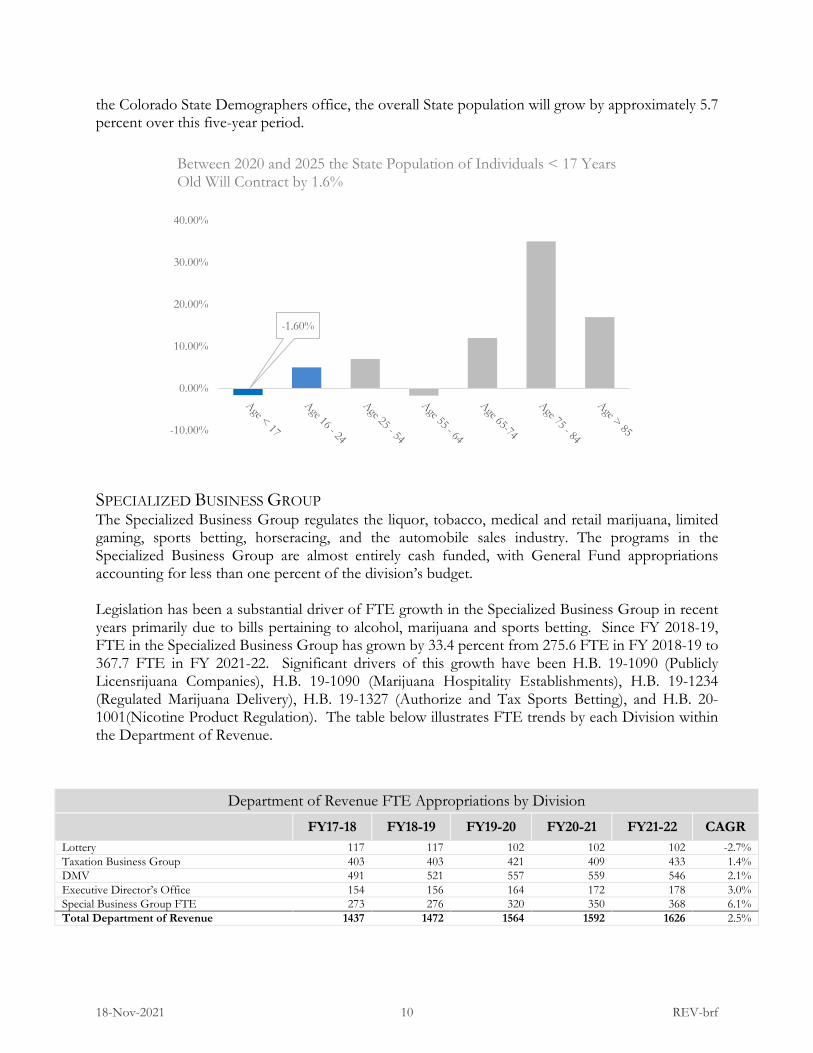
the Colorado State Demographers office, the overall State population will grow by approximately 5.7 percent over this five-year period.
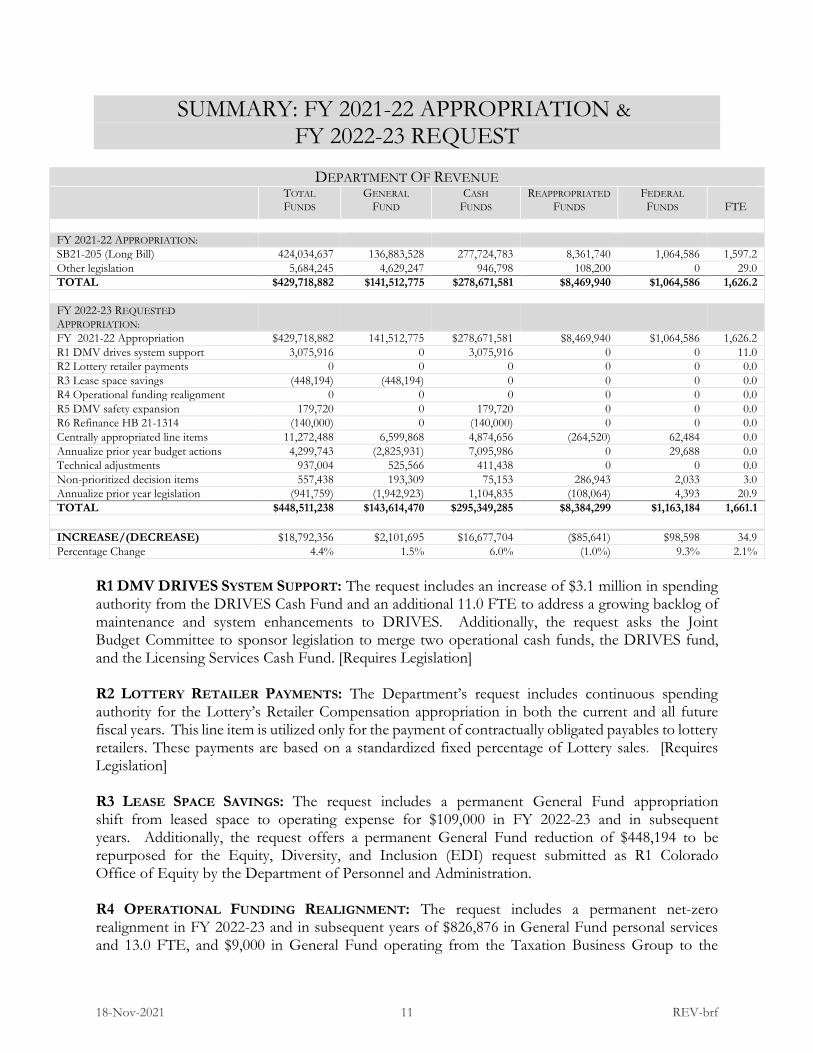
SPECIALIZED BUSINESS GROUP The Specialized Business Group regulates the liquor, tobacco, medical and retail marijuana, limited gaming, sports betting, horseracing, and the automobile sales industry. The programs in the Specialized Business Group are almost entirely cash funded, with General Fund appropriations accounting for less than one percent of the division’s budget. Legislation has been a substantial driver of FTE growth in the Specialized Business Group in recent years primarily due to bills pertaining to alcohol, marijuana and sports betting. Since FY 2018-19, FTE in the Specialized Business Group has grown by 33.4 percent from 275.6 FTE in FY 2018-19 to 367.7 FTE in FY 2021-22. Significant drivers of this growth have been H.B. 19-1090 (Publicly Licensrijuana Companies), H.B. 19-1090 (Marijuana Hospitality Establishments), H.B. 19-1234 (Regulated Marijuana Delivery), H.B. 19-1327 (Authorize and Tax Sports Betting), and H.B. 20-1001(Nicotine Product Regulation). The table below illustrates FTE trends by each Division within the Department of Revenue.
-1.60%
-10.00%
0.00%
10.00%
20.00%
30.00%
40.00%
Between 2020 and 2025 the State Population of Individuals < 17 Years Old Will Contract by 1.6%
Department of Revenue FTE Appropriations by Division FY17-18 FY18-19 FY19-20 FY20-21 FY21-22 CAGR
Lottery 117 117 102 102 102 -2.7% Taxation Business Group 403 403 421 409 433 1.4% DMV 491 521 557 559 546 2.1% Executive Director’s Office 154 156 164 172 178 3.0% Special Business Group FTE 273 276 320 350 368 6.1% Total Department of Revenue 1437 1472 1564 1592 1626 2.5%
18-Nov-2021 10 REV-brf
SUMMARY: FY 2021-22 APPROPRIATION & FY 2022-23 REQUEST
DEPARTMENT OF REVENUE TOTALFUNDS
GENERALFUND
CASH FUNDS
REAPPROPRIATEDFUNDS
FEDERALFUNDS FTE
FY 2021-22 APPROPRIATION: SB21-205 (Long Bill) 424,034,637 136,883,528 277,724,783 8,361,740 1,064,586 1,597.2 Other legislation 5,684,245 4,629,247 946,798 108,200 0 29.0 TOTAL $429,718,882 $141,512,775 $278,671,581 $8,469,940 $1,064,586 1,626.2
FY 2022-23 REQUESTED APPROPRIATION: FY 2021-22 Appropriation $429,718,882 141,512,775 $278,671,581 $8,469,940 $1,064,586 1,626.2 R1 DMV drives system support 3,075,916 0 3,075,916 0 0 11.0 R2 Lottery retailer payments 0 0 0 0 0 0.0 R3 Lease space savings (448,194) (448,194) 0 0 0 0.0 R4 Operational funding realignment 0 0 0 0 0 0.0 R5 DMV safety expansion 179,720 0 179,720 0 0 0.0 R6 Refinance HB 21-1314 (140,000) 0 (140,000) 0 0 0.0 Centrally appropriated line items 11,272,488 6,599,868 4,874,656 (264,520) 62,484 0.0 Annualize prior year budget actions 4,299,743 (2,825,931) 7,095,986 0 29,688 0.0 Technical adjustments 937,004 525,566 411,438 0 0 0.0 Non-prioritized decision items 557,438 193,309 75,153 286,943 2,033 3.0 Annualize prior year legislation (941,759) (1,942,923) 1,104,835 (108,064) 4,393 20.9 TOTAL $448,511,238 $143,614,470 $295,349,285 $8,384,299 $1,163,184 1,661.1
INCREASE/(DECREASE) $18,792,356 $2,101,695 $16,677,704 ($85,641) $98,598 34.9 Percentage Change 4.4% 1.5% 6.0% (1.0%) 9.3% 2.1%
R1 DMV DRIVES SYSTEM SUPPORT: The request includes an increase of $3.1 million in spending authority from the DRIVES Cash Fund and an additional 11.0 FTE to address a growing backlog of maintenance and system enhancements to DRIVES. Additionally, the request asks the Joint Budget Committee to sponsor legislation to merge two operational cash funds, the DRIVES fund, and the Licensing Services Cash Fund. [Requires Legislation]
R2 LOTTERY RETAILER PAYMENTS: The Department’s request includes continuous spending authority for the Lottery’s Retailer Compensation appropriation in both the current and all future fiscal years. This line item is utilized only for the payment of contractually obligated payables to lottery retailers. These payments are based on a standardized fixed percentage of Lottery sales. [Requires Legislation]
R3 LEASE SPACE SAVINGS: The request includes a permanent General Fund appropriation shift from leased space to operating expense for $109,000 in FY 2022-23 and in subsequent years. Additionally, the request offers a permanent General Fund reduction of $448,194 to be repurposed for the Equity, Diversity, and Inclusion (EDI) request submitted as R1 Colorado Office of Equity by the Department of Personnel and Administration.
R4 OPERATIONAL FUNDING REALIGNMENT: The request includes a permanent net-zero realignment in FY 2022-23 and in subsequent years of $826,876 in General Fund personal services and 13.0 FTE, and $9,000 in General Fund operating from the Taxation Business Group to the
18-Nov-2021 11 REV-brf
Executive Director’s Office (EDO). The realignment moves the GenTax System Support Office (SSO) team from the Taxation Business Group into the Innovation Strategy and Delivery (ISD) team in EDO. Additionally, the Department requests a permanent net-zero realignment in FY 2022-23 and in subsequent years of $1,062,746 in cash fund spending authority for personal services and 17.0 FTE, and $8,500 in cash fund spending authority for operating from the DMV Administration and Driver Services to the EDO. The realignment moves the DRIVES Development Support (DDS) team from DMV into the Innovation, Strategy, and Delivery team in the EDO.
R5 DMV SAFETY EXPANSION: The request includes a permanent increase of $179,720 in cash fund spending authority for the Division of Motor Vehicles (DMV) in FY 2022-23 and in subsequent years for security guards at four additional driver license offices. Currently, the DMV has thirty-seven driver’s license offices, of which fourteen have existing security in place. The Department has identified four of the twenty-three remaining unsecured locations as high risk for altercations.
R6 REFINANCE HB 21-1314: The request asks the JBC to sponsor legislation to change the funding source identified in H.B. 21-1314 (Section 39-28.8-501 (7)(a), C.R.S.), Department of Revenue Action Against Certain Documents and requests a 10 percent reduction to the amounts appropriated for this purpose. The revision would eliminate the funding transferred from the Marijuana Tax Cash Fund (MTCF) to fund DMV hearings and license services activities, and instead provide “off-the-top” spending authority from the Highway Users Tax Fund (HUTF). [Requires Legislation]
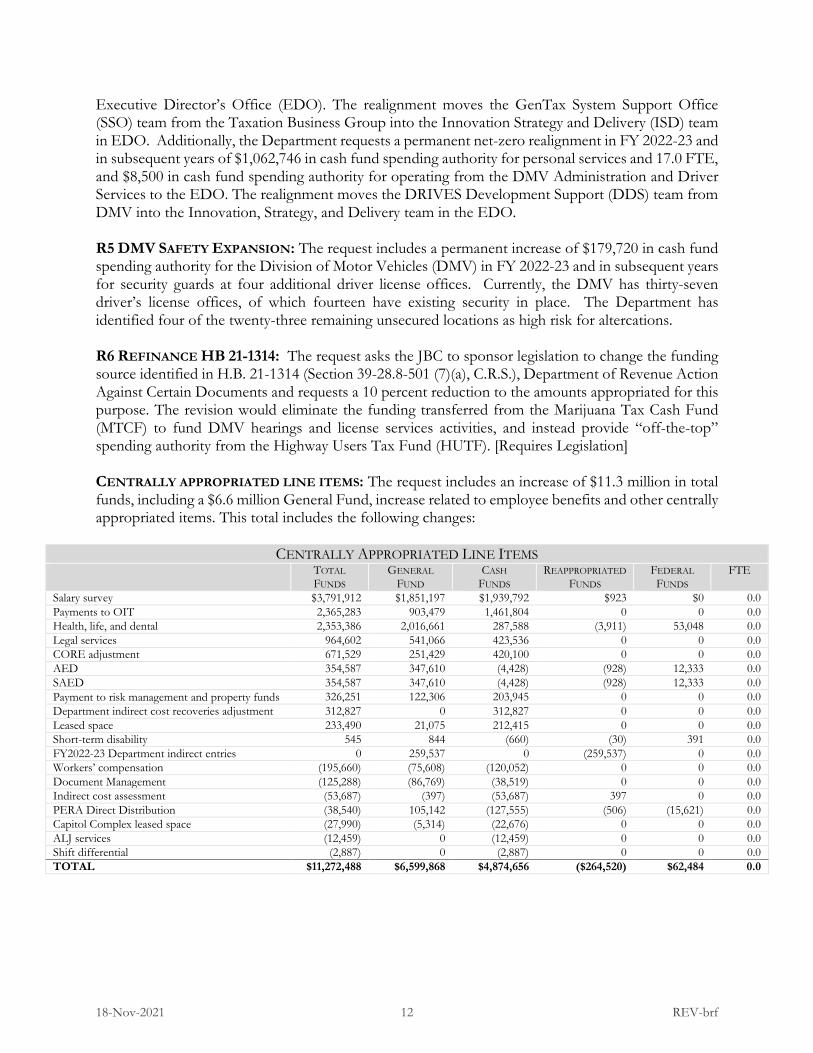
CENTRALLY APPROPRIATED LINE ITEMS: The request includes an increase of $11.3 million in total funds, including a $6.6 million General Fund, increase related to employee benefits and other centrally appropriated items. This total includes the following changes:
CENTRALLY APPROPRIATED LINE ITEMS TOTALFUNDS
GENERALFUND
CASH FUNDS
REAPPROPRIATEDFUNDS
FEDERALFUNDS
FTE
Salary survey $3,791,912 $1,851,197 $1,939,792 $923 $0 0.0 Payments to OIT 2,365,283 903,479 1,461,804 0 0 0.0 Health, life, and dental 2,353,386 2,016,661 287,588 (3,911) 53,048 0.0 Legal services 964,602 541,066 423,536 0 0 0.0 CORE adjustment 671,529 251,429 420,100 0 0 0.0 AED 354,587 347,610 (4,428) (928) 12,333 0.0 SAED 354,587 347,610 (4,428) (928) 12,333 0.0 Payment to risk management and property funds 326,251 122,306 203,945 0 0 0.0 Department indirect cost recoveries adjustment 312,827 0 312,827 0 0 0.0 Leased space 233,490 21,075 212,415 0 0 0.0 Short-term disability 545 844 (660) (30) 391 0.0 FY2022-23 Department indirect entries 0 259,537 0 (259,537) 0 0.0 Workers’ compensation (195,660) (75,608) (120,052) 0 0 0.0 Document Management (125,288) (86,769) (38,519) 0 0 0.0 Indirect cost assessment (53,687) (397) (53,687) 397 0 0.0 PERA Direct Distribution (38,540) 105,142 (127,555) (506) (15,621) 0.0 Capitol Complex leased space (27,990) (5,314) (22,676) 0 0 0.0 ALJ services (12,459) 0 (12,459) 0 0 0.0 Shift differential (2,887) 0 (2,887) 0 0 0.0 TOTAL $11,272,488 $6,599,868 $4,874,656 ($264,520) $62,484 0.0
18-Nov-2021 12 REV-brf
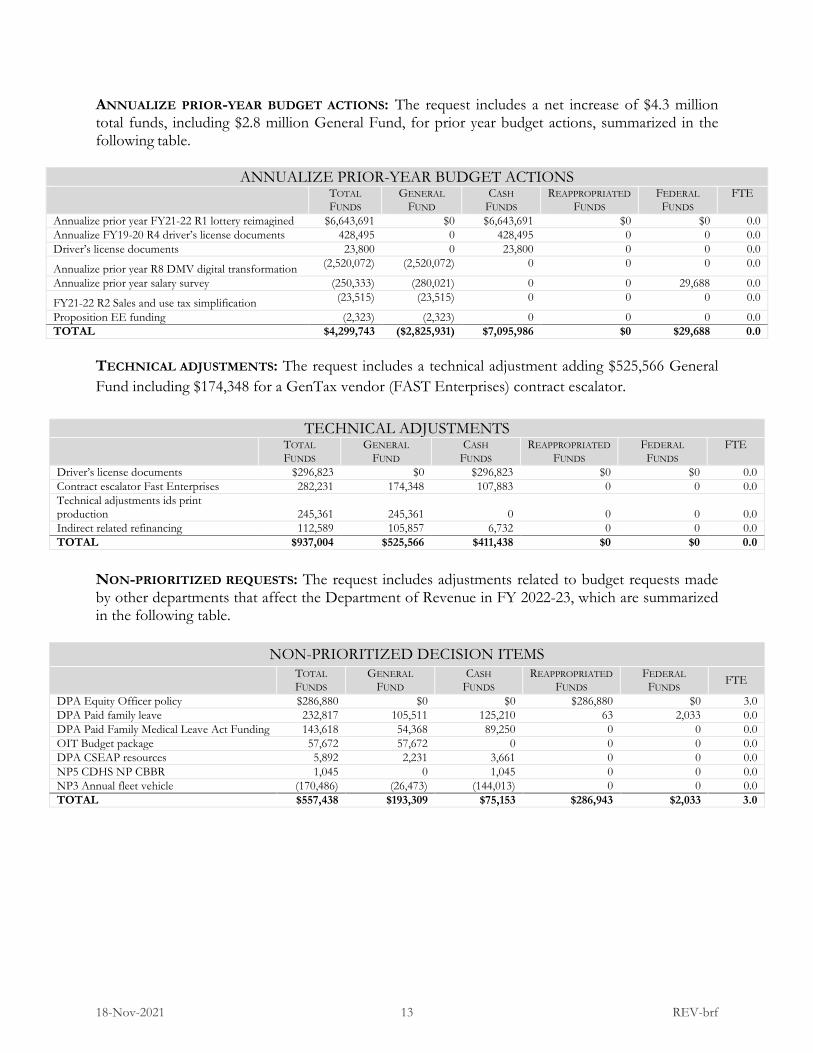
ANNUALIZE PRIOR-YEAR BUDGET ACTIONS: The request includes a net increase of $4.3 million total funds, including $2.8 million General Fund, for prior year budget actions, summarized in the following table.
ANNUALIZE PRIOR-YEAR BUDGET ACTIONS TOTALFUNDS
GENERALFUND
CASH FUNDS
REAPPROPRIATEDFUNDS
FEDERALFUNDS
FTE
Annualize prior year FY21-22 R1 lottery reimagined $6,643,691 $0 $6,643,691 $0 $0 0.0 Annualize FY19-20 R4 driver’s license documents 428,495 0 428,495 0 0 0.0 Driver’s license documents 23,800 0 23,800 0 0 0.0
Annualize prior year R8 DMV digital transformation (2,520,072) (2,520,072) 0 0 0 0.0
Annualize prior year salary survey (250,333) (280,021) 0 0 29,688 0.0
FY21-22 R2 Sales and use tax simplification (23,515) (23,515) 0 0 0 0.0
Proposition EE funding (2,323) (2,323) 0 0 0 0.0 TOTAL $4,299,743 ($2,825,931) $7,095,986 $0 $29,688 0.0
TECHNICAL ADJUSTMENTS: The request includes a technical adjustment adding $525,566 General Fund including $174,348 for a GenTax vendor (FAST Enterprises) contract escalator.
TECHNICAL ADJUSTMENTS TOTALFUNDS
GENERALFUND
CASH FUNDS
REAPPROPRIATEDFUNDS
FEDERALFUNDS
FTE
Driver’s license documents $296,823 $0 $296,823 $0 $0 0.0 Contract escalator Fast Enterprises 282,231 174,348 107,883 0 0 0.0 Technical adjustments ids print production 245,361 245,361 0 0 0 0.0 Indirect related refinancing 112,589 105,857 6,732 0 0 0.0 TOTAL $937,004 $525,566 $411,438 $0 $0 0.0
NON-PRIORITIZED REQUESTS: The request includes adjustments related to budget requests made by other departments that affect the Department of Revenue in FY 2022-23, which are summarized in the following table.
NON-PRIORITIZED DECISION ITEMS TOTAL FUNDS
GENERAL FUND
CASH FUNDS
REAPPROPRIATED FUNDS
FEDERAL FUNDS FTE
DPA Equity Officer policy $286,880 $0 $0 $286,880 $0 3.0 DPA Paid family leave 232,817 105,511 125,210 63 2,033 0.0 DPA Paid Family Medical Leave Act Funding 143,618 54,368 89,250 0 0 0.0 OIT Budget package 57,672 57,672 0 0 0 0.0 DPA CSEAP resources 5,892 2,231 3,661 0 0 0.0 NP5 CDHS NP CBBR 1,045 0 1,045 0 0 0.0 NP3 Annual fleet vehicle (170,486) (26,473) (144,013) 0 0 0.0 TOTAL $557,438 $193,309 $75,153 $286,943 $2,033 3.0
18-Nov-2021 13 REV-brf
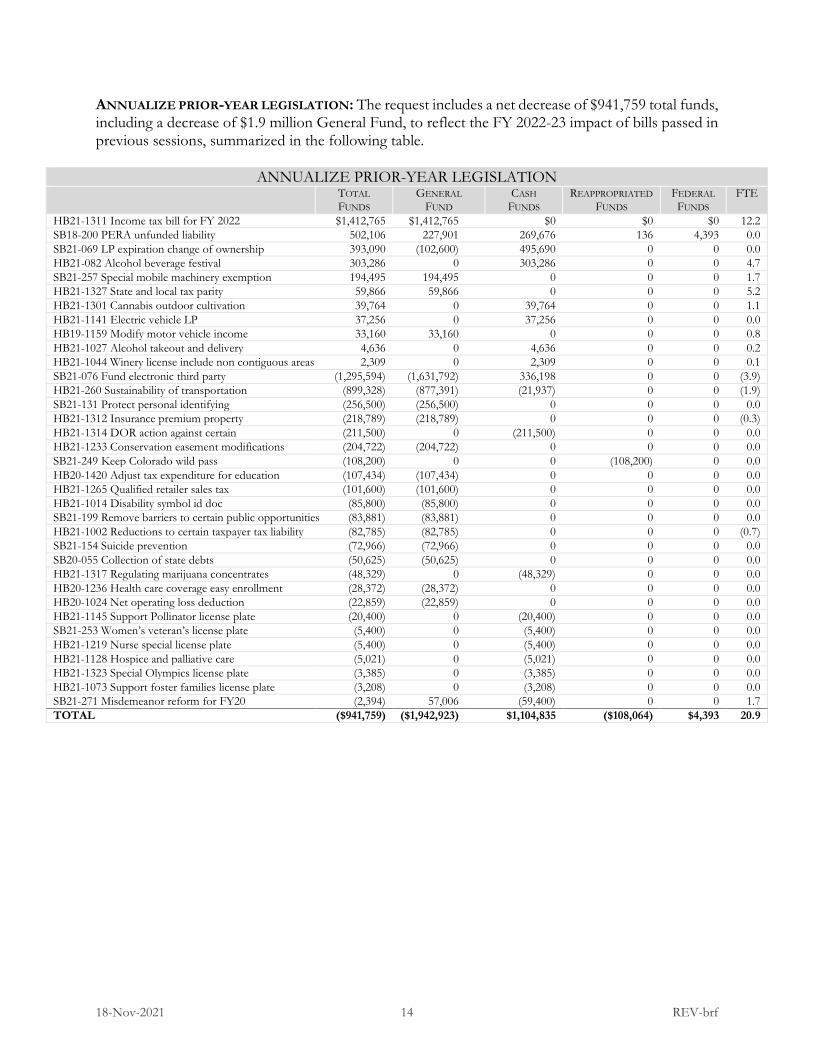
ANNUALIZE PRIOR-YEAR LEGISLATION: The request includes a net decrease of $941,759 total funds, including a decrease of $1.9 million General Fund, to reflect the FY 2022-23 impact of bills passed in previous sessions, summarized in the following table.
ANNUALIZE PRIOR-YEAR LEGISLATION TOTALFUNDS
GENERALFUND
CASH FUNDS
REAPPROPRIATEDFUNDS
FEDERALFUNDS
FTE
HB21-1311 Income tax bill for FY 2022 $1,412,765 $1,412,765 $0 $0 $0 12.2 SB18-200 PERA unfunded liability 502,106 227,901 269,676 136 4,393 0.0 SB21-069 LP expiration change of ownership 393,090 (102,600) 495,690 0 0 0.0 HB21-082 Alcohol beverage festival 303,286 0 303,286 0 0 4.7 SB21-257 Special mobile machinery exemption 194,495 194,495 0 0 0 1.7 HB21-1327 State and local tax parity 59,866 59,866 0 0 0 5.2 HB21-1301 Cannabis outdoor cultivation 39,764 0 39,764 0 0 1.1 HB21-1141 Electric vehicle LP 37,256 0 37,256 0 0 0.0 HB19-1159 Modify motor vehicle income 33,160 33,160 0 0 0 0.8 HB21-1027 Alcohol takeout and delivery 4,636 0 4,636 0 0 0.2 HB21-1044 Winery license include non contiguous areas 2,309 0 2,309 0 0 0.1 SB21-076 Fund electronic third party (1,295,594) (1,631,792) 336,198 0 0 (3.9) HB21-260 Sustainability of transportation (899,328) (877,391) (21,937) 0 0 (1.9) SB21-131 Protect personal identifying (256,500) (256,500) 0 0 0 0.0 HB21-1312 Insurance premium property (218,789) (218,789) 0 0 0 (0.3) HB21-1314 DOR action against certain (211,500) 0 (211,500) 0 0 0.0 HB21-1233 Conservation easement modifications (204,722) (204,722) 0 0 0 0.0 SB21-249 Keep Colorado wild pass (108,200) 0 0 (108,200) 0 0.0 HB20-1420 Adjust tax expenditure for education (107,434) (107,434) 0 0 0 0.0 HB21-1265 Qualified retailer sales tax (101,600) (101,600) 0 0 0 0.0 HB21-1014 Disability symbol id doc (85,800) (85,800) 0 0 0 0.0 SB21-199 Remove barriers to certain public opportunities (83,881) (83,881) 0 0 0 0.0 HB21-1002 Reductions to certain taxpayer tax liability (82,785) (82,785) 0 0 0 (0.7) SB21-154 Suicide prevention (72,966) (72,966) 0 0 0 0.0 SB20-055 Collection of state debts (50,625) (50,625) 0 0 0 0.0 HB21-1317 Regulating marijuana concentrates (48,329) 0 (48,329) 0 0 0.0 HB20-1236 Health care coverage easy enrollment (28,372) (28,372) 0 0 0 0.0 HB20-1024 Net operating loss deduction (22,859) (22,859) 0 0 0 0.0 HB21-1145 Support Pollinator license plate (20,400) 0 (20,400) 0 0 0.0 SB21-253 Women’s veteran’s license plate (5,400) 0 (5,400) 0 0 0.0 HB21-1219 Nurse special license plate (5,400) 0 (5,400) 0 0 0.0 HB21-1128 Hospice and palliative care (5,021) 0 (5,021) 0 0 0.0 HB21-1323 Special Olympics license plate (3,385) 0 (3,385) 0 0 0.0 HB21-1073 Support foster families license plate (3,208) 0 (3,208) 0 0 0.0 SB21-271 Misdemeanor reform for FY20 (2,394) 57,006 (59,400) 0 0 1.7 TOTAL ($941,759) ($1,942,923) $1,104,835 ($108,064) $4,393 20.9
18-Nov-2021 14 REV-brf
INFORMATIONAL ISSUE: DIVISION OF MOTOR VEHICLES UPDATE
The FY 2020-21 DMV digital transformation has begun to return measurable results to Colorado citizens. However, the License Service Cash Fund (LSCF), which supports the issuance of drivers’ licenses, is projected to end FY 2022-23 with a deficit balance of $182,003. An FY 2022-23 Departmental request to merge the two primary cash funds of the DMV, DRIVES and LSCF, will delay the insolvency of LSCF, but based on current forecasts, the combined cash fund would deplete its reserves by FY 2024-25.
SUMMARY:
• The DMV was appropriated a one-time increase of $2.5 million General Fund in FY 2021-22 to support the DMV’s digital expansion. This initiative includes funding to expand self-service kiosks to include new transaction types, creation of a cloud-based virtual call center utilizing artificial intelligence technology, expanding vehicle titling and registration services to third parties, a statewide marketing campaign to promote online services, and establishment of mobile driver’s license offices to reach remote and limited mobility residents. The ability of the DMV to leverage these technological enhancements and increase operating efficiency will be pivotal in the DMV’s long-term sustainability and ability to provide high-quality service, while reducing costs.
• Shifts in population growth rates, as well as generational shifts in attitudes around driving, will affect the DMV’s revenue model for the foreseeable future. Volatility in document issuance will continue to challenge the DMV’s cash flow. In recent years, DMV operational costs have continued to rise, while driver’s license issuance has dropped resulting in related annual expenditures exceeding annual revenues.
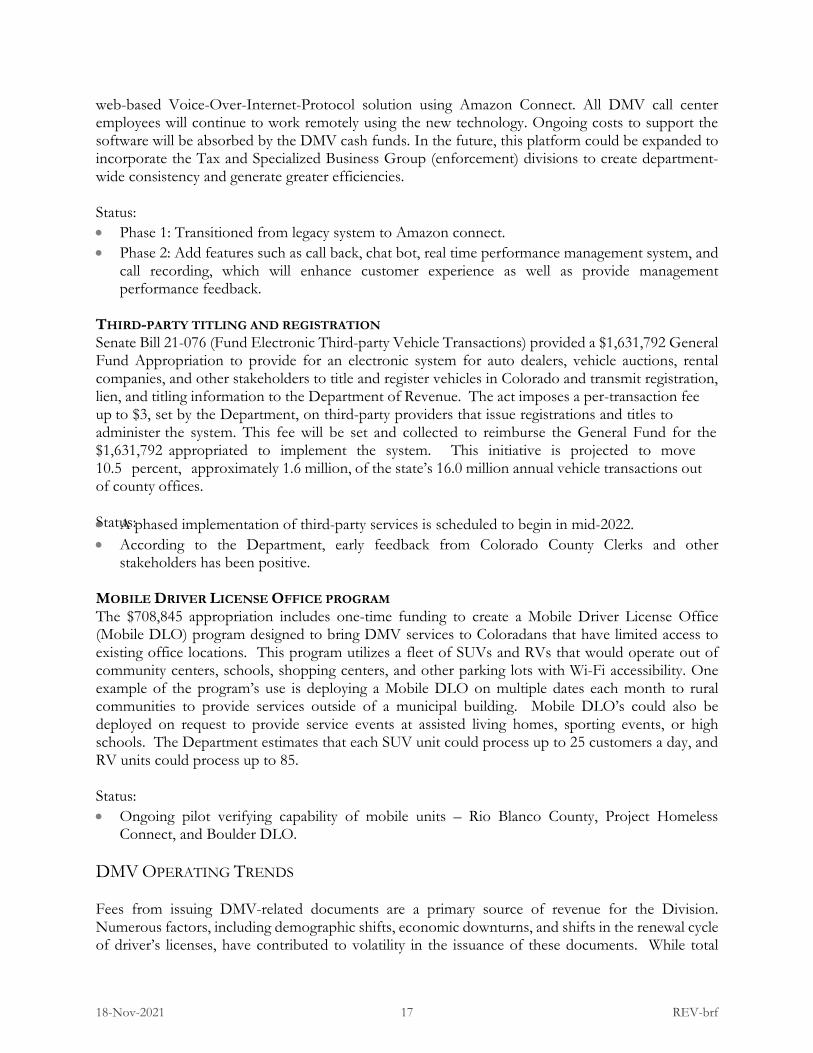
• The two primary DMV cash funds, DRIVES and Licensing Service Cash Fund (LSCF) have been impacted by the pandemic as well as other demographic and economic challenges. While revenues and expenditures from the DRIVES fund are projected to grow at relatively similar rates, expenditures from LSCF are projected to continue to grow faster than revenue, and based on current projections LSCF will have cumulative deficits of $17.9 million by FY 2024-25. The Department’s proposal to combine these funds would delay the insolvency of the LSCF, but not eliminate it.
DISCUSSION:
DMV DIGITAL TRANSFORMATION COVID-19 exposed the limitations of the current DMV operating model, and necessitated a significant shift in how DMV functions and delivers services. Prior to the pandemic, the DMV had begun to automate. On-line services had increased in both availability and customer utilization, and self-service kiosks had been deployed to counties across the state. The pandemic accelerated the pace of this automation. In order to fund these technological enhancements in FY 2021-22 DMV was appropriated $2.5 million in General Fund support.
18-Nov-2021 15 REV-brf
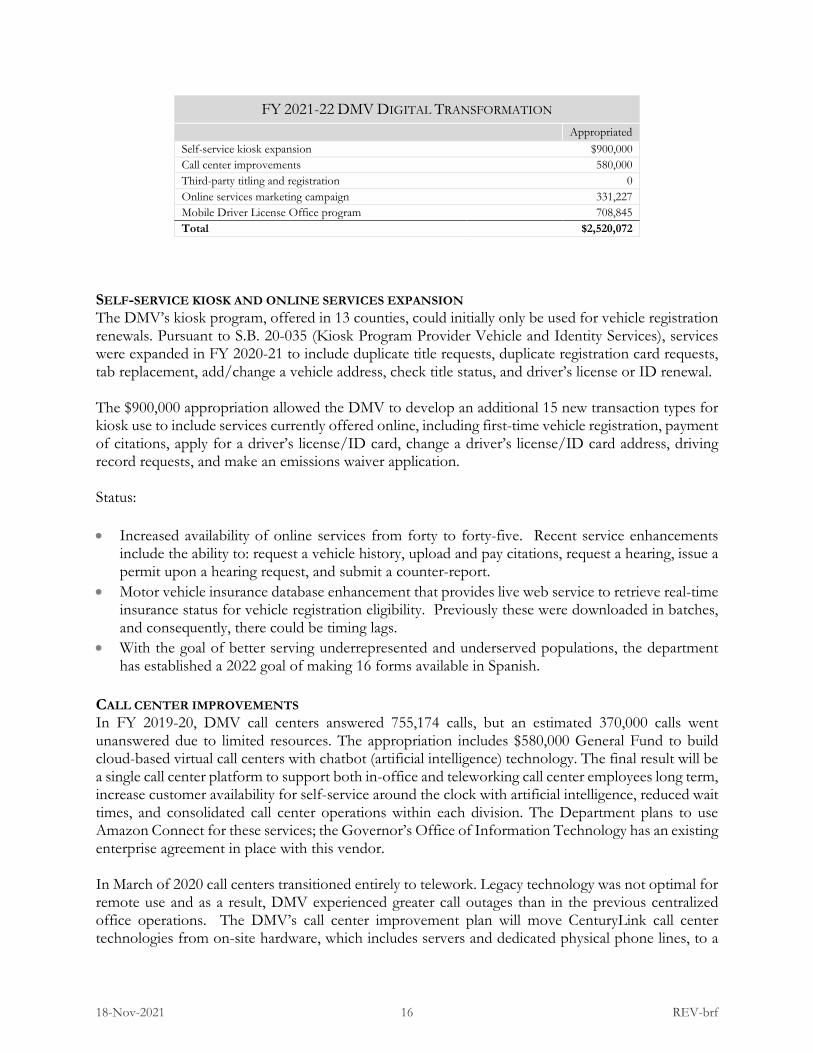
FY 2021-22 DMV DIGITAL TRANSFORMATION Appropriated
Self-service kiosk expansion $900,000 Call center improvements 580,000 Third-party titling and registration 0 Online services marketing campaign 331,227 Mobile Driver License Office program 708,845 Total $2,520,072
SELF-SERVICE KIOSK AND ONLINE SERVICES EXPANSION The DMV’s kiosk program, offered in 13 counties, could initially only be used for vehicle registration renewals. Pursuant to S.B. 20-035 (Kiosk Program Provider Vehicle and Identity Services), services were expanded in FY 2020-21 to include duplicate title requests, duplicate registration card requests, tab replacement, add/change a vehicle address, check title status, and driver’s license or ID renewal.
The $900,000 appropriation allowed the DMV to develop an additional 15 new transaction types for kiosk use to include services currently offered online, including first-time vehicle registration, payment of citations, apply for a driver’s license/ID card, change a driver’s license/ID card address, driving record requests, and make an emissions waiver application.
Status:
• Increased availability of online services from forty to forty-five. Recent service enhancementsinclude the ability to: request a vehicle history, upload and pay citations, request a hearing, issue apermit upon a hearing request, and submit a counter-report.
• Motor vehicle insurance database enhancement that provides live web service to retrieve real-timeinsurance status for vehicle registration eligibility. Previously these were downloaded in batches,and consequently, there could be timing lags.
• With the goal of better serving underrepresented and underserved populations, the departmenthas established a 2022 goal of making 16 forms available in Spanish.
CALL CENTER IMPROVEMENTS In FY 2019-20, DMV call centers answered 755,174 calls, but an estimated 370,000 calls went unanswered due to limited resources. The appropriation includes $580,000 General Fund to build cloud-based virtual call centers with chatbot (artificial intelligence) technology. The final result will be a single call center platform to support both in-office and teleworking call center employees long term, increase customer availability for self-service around the clock with artificial intelligence, reduced wait times, and consolidated call center operations within each division. The Department plans to use Amazon Connect for these services; the Governor’s Office of Information Technology has an existing enterprise agreement in place with this vendor.
In March of 2020 call centers transitioned entirely to telework. Legacy technology was not optimal for remote use and as a result, DMV experienced greater call outages than in the previous centralized office operations. The DMV’s call center improvement plan will move CenturyLink call center technologies from on-site hardware, which includes servers and dedicated physical phone lines, to a
18-Nov-2021 16 REV-brf
web-based Voice-Over-Internet-Protocol solution using Amazon Connect. All DMV call center employees will continue to work remotely using the new technology. Ongoing costs to support the software will be absorbed by the DMV cash funds. In the future, this platform could be expanded to incorporate the Tax and Specialized Business Group (enforcement) divisions to create department-wide consistency and generate greater efficiencies.
Status: • Phase 1: Transitioned from legacy system to Amazon connect.• Phase 2: Add features such as call back, chat bot, real time performance management system, and
call recording, which will enhance customer experience as well as provide managementperformance feedback.
THIRD-PARTY TITLING AND REGISTRATION Senate Bill 21-076 (Fund Electronic Third-party Vehicle Transactions) provided a $1,631,792 General Fund Appropriation to provide for an electronic system for auto dealers, vehicle auctions, rental companies, and other stakeholders to title and register vehicles in Colorado and transmit registration, lien, and titling information to the Department of Revenue. The act imposes a per-transaction fee up to $3, set by the Department, on third-party providers that issue registrations and titles to administer the system. This fee will be set and collected to reimburse the General Fund for the $1,631,792 appropriated to implement the system. This initiative is projected to move 10.5 percent, approximately 1.6 million, of the state’s 16.0 million annual vehicle transactions out of county offices.
Status: • A phased implementation of third-party services is scheduled to begin in mid-2022.• According to the Department, early feedback from Colorado County Clerks and other
stakeholders has been positive.
MOBILE DRIVER LICENSE OFFICE PROGRAM The $708,845 appropriation includes one-time funding to create a Mobile Driver License Office (Mobile DLO) program designed to bring DMV services to Coloradans that have limited access to existing office locations. This program utilizes a fleet of SUVs and RVs that would operate out of community centers, schools, shopping centers, and other parking lots with Wi-Fi accessibility. One example of the program’s use is deploying a Mobile DLO on multiple dates each month to rural communities to provide services outside of a municipal building. Mobile DLO’s could also be deployed on request to provide service events at assisted living homes, sporting events, or high schools. The Department estimates that each SUV unit could process up to 25 customers a day, and RV units could process up to 85.
Status: • Ongoing pilot verifying capability of mobile units – Rio Blanco County, Project Homeless
Connect, and Boulder DLO.
DMV OPERATING TRENDS
Fees from issuing DMV-related documents are a primary source of revenue for the Division. Numerous factors, including demographic shifts, economic downturns, and shifts in the renewal cycle of driver’s licenses, have contributed to volatility in the issuance of these documents. While total
18-Nov-2021 17 REV-brf

DMV documents issued decreased by 11 percent between FY 2017-18 and FY 2020-21 from 1.56 million documents in FY 2017-18 to 1.39 million documents in FY 2020-21, FTE over this same period grew by 14 percent, from 490.5 FTE in FY 2017-18 to 559.4 FTE in FY 2020-21. Note that DMV FTE appropriations did decrease by 2.4 percent in FY 2021-22.
While DMV personnel clearly have broad and diverse responsibilities, a principal function of the Division is the issuance of driver’s licenses, permits, and identification cards. Issuance of these documents represents a primary Divisional revenue driver, specifically to the License Service Cash Fund. Consequently, the number of documents issued per FTE captures a limited measurement of Division productivity. This productivity metric peaked in FY 2017-18 when 3,173.6 documents were issued per FTE. In the following years, productivity declined as FTE continued to rise and the number of DMV documents issued declined.
DMV DOCUMENTS / FTE FY14-15 FY15-16 FY16-17 FY17-18 FY18-19 FY19-20 FY20-21 FY21-22
Number of Driver's Licenses, Permits, and Identification Documents Issued 1,340,682 1,359,574 1,479,873 1,557,902 1,437,473 1,388,375 1,388,0001 - Department of Motor Vehicles FTE Appropriation 482.3 490.1 490.5 491 521 557 559 546 Total Documents per FTE 2,780 2,774 3,017 3,174 2,760 2,492 2,481 Percent Change in Documents per FTE -0.2% 8.8% 5.2% -13.0% -9.7% -0.4%1 Department Projection
DMV CASH FUNDS: LICENSE SERVICE AND DRIVES
The two primary cash funds that support DMV operations are the DRIVES Cash Fund (DRIVES) and the License Service Cash Fund (LSCF). The DRIVES Cash Fund is funded through title fees, registration fees, and specific ownership tax (SOT) transaction fees. LSCF is funded predominantly through document fees, which account for approximately 90 percent of the funds revenue. While the DRIVES fund projects a relatively stable balance through 2025, LSCF is projected to end FY 2022-23 with a small negative balance, however, deficits are forecast to increase for the next three fiscal years, and the fund is currently projected to end FY2024-25 with a -$17.9 million balance. The chart
1,341 1,360 1,480
1,558 1,437 1,388 1,388
482.3 491
559 546
FY14-15 FY15-16 FY16-17 FY17-18 FY18-19 FY19-20 FY20-21 FY21-22
Total DMV Documents Issued
FTE
Total documents issued by the DMV has declined in recent years, but FTE continues to trend upwards.
18-Nov-2021 18 REV-brf
and graph below show two years of actual and four years of projected year ending balances for the Divisions two primary cash funds, DRIVES and LSCF.
CASH FUND FISCAL YEAR ENDING BALANCE FY18-19 FY19-20 FY20-21 FY21-22* FY22-23* FY23-24* FY24-25*
Colorado DRIVES Fund $18,176,245 $18,145,138 $18,737,271 $19,884,029 $18,962,937 $18,132,093 $17,370,200 Licensing Services Cash Fund $20,681,332 $15,013,579 $10,594,491 $7,886,284 ($182,003) ($9,011,465) ($17,908,552) *Projected
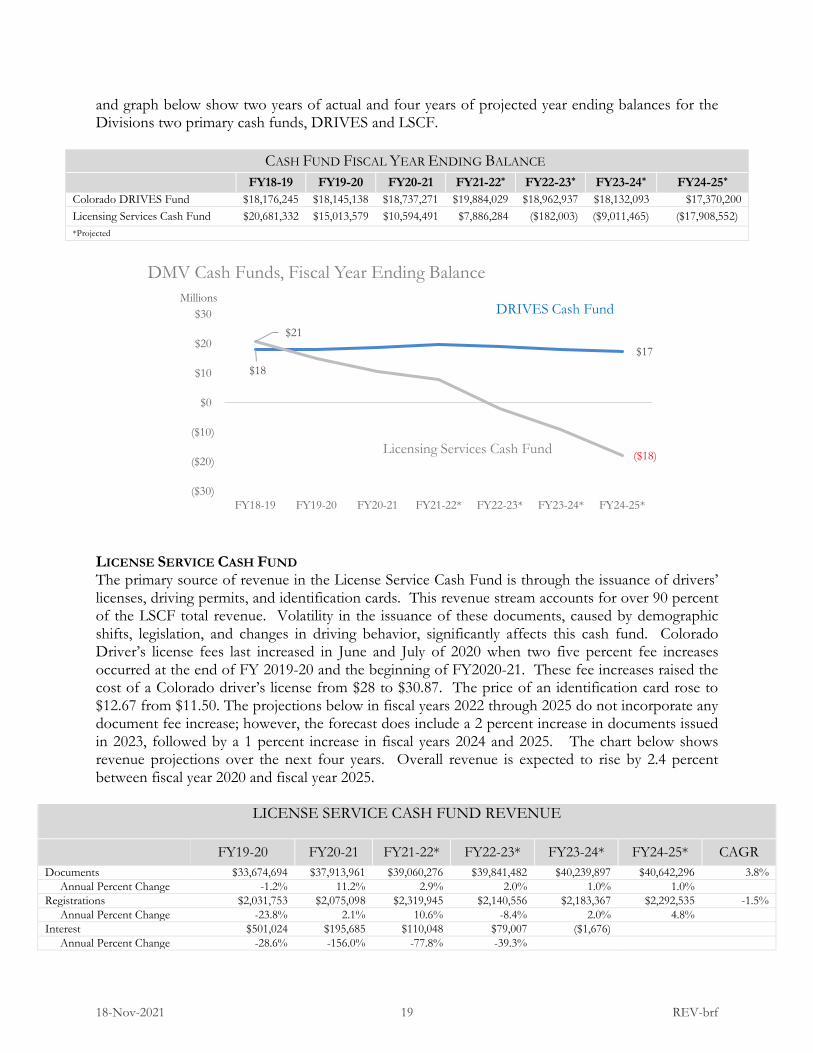
LICENSE SERVICE CASH FUND The primary source of revenue in the License Service Cash Fund is through the issuance of drivers’ licenses, driving permits, and identification cards. This revenue stream accounts for over 90 percent of the LSCF total revenue. Volatility in the issuance of these documents, caused by demographic shifts, legislation, and changes in driving behavior, significantly affects this cash fund. Colorado Driver’s license fees last increased in June and July of 2020 when two five percent fee increases occurred at the end of FY 2019-20 and the beginning of FY2020-21. These fee increases raised the cost of a Colorado driver’s license from $28 to $30.87. The price of an identification card rose to $12.67 from $11.50. The projections below in fiscal years 2022 through 2025 do not incorporate any document fee increase; however, the forecast does include a 2 percent increase in documents issued in 2023, followed by a 1 percent increase in fiscal years 2024 and 2025. The chart below shows revenue projections over the next four years. Overall revenue is expected to rise by 2.4 percent between fiscal year 2020 and fiscal year 2025.
LICENSE SERVICE CASH FUND REVENUE
FY19-20 FY20-21 FY21-22* FY22-23* FY23-24* FY24-25* CAGR Documents $33,674,694 $37,913,961 $39,060,276 $39,841,482 $40,239,897 $40,642,296 3.8% Annual Percent Change -1.2% 11.2% 2.9% 2.0% 1.0% 1.0% Registrations $2,031,753 $2,075,098 $2,319,945 $2,140,556 $2,183,367 $2,292,535 -1.5% Annual Percent Change -23.8% 2.1% 10.6% -8.4% 2.0% 4.8% Interest $501,024 $195,685 $110,048 $79,007 ($1,676) Annual Percent Change -28.6% -156.0% -77.8% -39.3%
$18
$17
$21
($18)
($30)
($20)
($10)
$0
$10
$20
$30
FY18-19 FY19-20 FY20-21 FY21-22* FY22-23* FY23-24* FY24-25*
Millions
DMV Cash Funds, Fiscal Year Ending Balance
DRIVES Cash Fund
Licensing Services Cash Fund
18-Nov-2021 19 REV-brf

LICENSE SERVICE CASH FUND REVENUE
FY19-20 FY20-21 FY21-22* FY22-23* FY23-24* FY24-25* CAGR Misc. Revenue $22,459 $17,989 $14,877 $12,500 $12,500 $12,500 -11.06% Annual Percent Change -157.4% -24.8% -20.9% -19.0% 0.0% 0.0%
TOTAL REVENUE $36,229,930 $40,202,733 $41,505,146 $42,073,545 $42,434,088 $42,947,331 2.4% Annual Percent Change -3.0% 9.9% 3.1% 1.4% 0.8% 1.2%
The graph below illustrates the various revenue streams to the LSCF in FY 2020-21. The cash fund is overwhelmingly reliant on document fees, which accounted for 94.2 percent of all revenue in FY 2020-21.
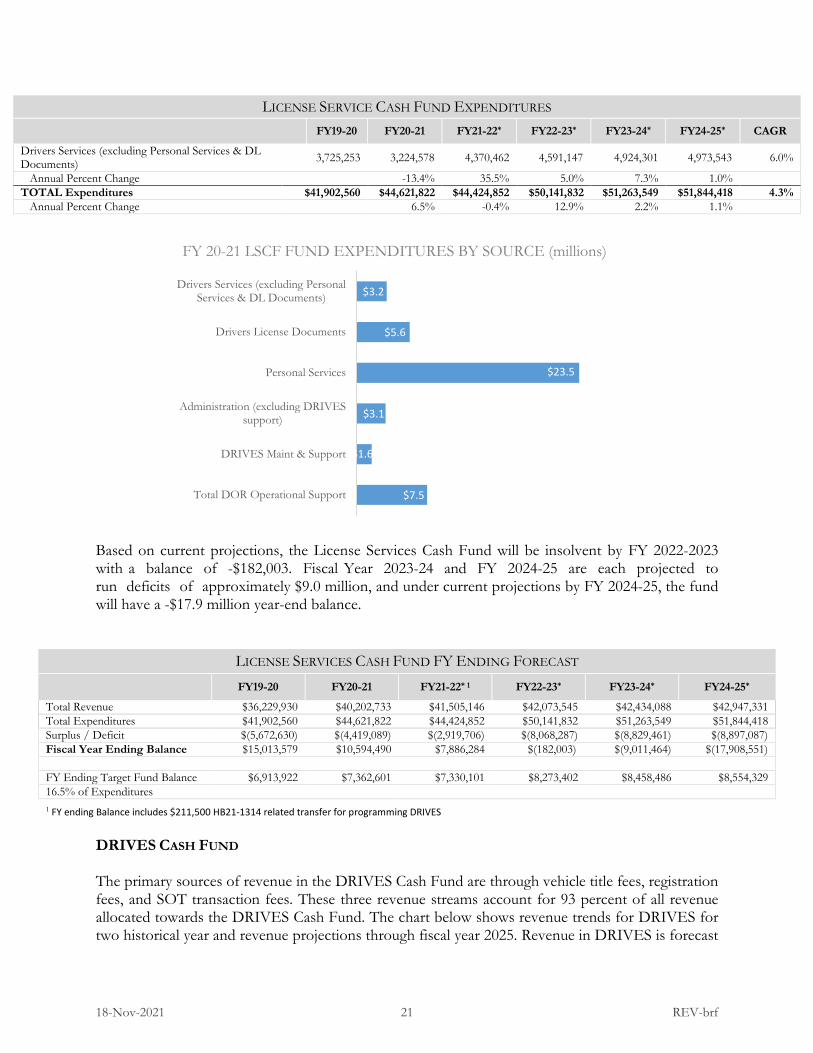
License Service Cash Fund Expenditures are projected to grow by a 4.3 percent compound annual growth rate between FY 2019-20 and FY 2024-25. The primary drivers of growth in LSCF expenditures are Administration expense, DRIVES maintenance and support, and Department of Revenue Operational Support. Based on Department projections, Personal Services is forecast to grow at only 2.2 percent over this five-year period, however this category is the largest expenditure in the LSCF, and accounts for approximately 53 percent of all LSCF expenditures.
LICENSE SERVICE CASH FUND EXPENDITURES FY19-20 FY20-21 FY21-22* FY22-23* FY23-24* FY24-25* CAGR
Total DOR Operational Support $5,723,091 $7,481,997 $3,836,452 $8,290,086 $8,372,987 $8,445,149 8.1% Annual Percent Change 30.7% -48.7% 116.1% 1.0% 0.9% DRIVES Maintenance & Support 1 ,532,640 1,645,140 2,346,847 2,398,712 2,470,674 2,544,794 10.7% Annual Percent Change 7.3% 42.7% 2.2% 3.0% 3.0% Administration (excluding DRIVES support) 1,679,244 3,118,859 2,877,963 2,979,195 3,038,778 3,099,554 13.0% Annual Percent Change 85.7% -7.7% 3.5% 2.0% 2.0% Personal Services 23,585,458 23,503,083 24,313,453 25,529,126 26,039,708 26,300,106 2.2% Annual Percent Change -0.3% 3.4% 5.0% 2.0% 1.0% Driver’s License Documents 5,656,874 5,648,165 6,679,675 6 ,353,566 6,417,101 6,481,272 2.8% Annual Percent Change -0.2% 18.3% -4.9% 1.0% 1.0%
$37.91
$2.08
$0.20
$0.02
Documents
Registrations
Interest
Miscellaneous
License Service Cash Fund Revenues by Souce FY 20-21 (millions)
18-Nov-2021 20 REV-brf
LICENSE SERVICE CASH FUND EXPENDITURES FY19-20 FY20-21 FY21-22* FY22-23* FY23-24* FY24-25* CAGR
Drivers Services (excluding Personal Services & DL Documents) 3,725,253 3,224,578 4,370,462 4,591,147 4,924,301 4,973,543 6.0%
Annual Percent Change -13.4% 35.5% 5.0% 7.3% 1.0% TOTAL Expenditures $41,902,560 $44,621,822 $44,424,852 $50,141,832 $51,263,549 $51,844,418 4.3% Annual Percent Change 6.5% -0.4% 12.9% 2.2% 1.1%
Based on current projections, the License Services Cash Fund will be insolvent by FY 2022-2023 with a balance of -$182,003. Fiscal Year 2023-24 and FY 2024-25 are each projected to run deficits of approximately $9.0 million, and under current projections by FY 2024-25, the fund will have a -$17.9 million year-end balance.
LICENSE SERVICES CASH FUND FY ENDING FORECAST FY19-20 FY20-21 FY21-22* 1 FY22-23* FY23-24* FY24-25*
Total Revenue $36,229,930 $40,202,733 $41,505,146 $42,073,545 $42,434,088 $42,947,331 Total Expenditures $41,902,560 $44,621,822 $44,424,852 $50,141,832 $51,263,549 $51,844,418 Surplus / Deficit $(5,672,630) $(4,419,089) $(2,919,706) $(8,068,287) $(8,829,461) $(8,897,087) Fiscal Year Ending Balance $15,013,579 $10,594,490 $7,886,284 $(182,003) $(9,011,464) $(17,908,551)
FY Ending Target Fund Balance $6,913,922 $7,362,601 $7,330,101 $8,273,402 $8,458,486 $8,554,329 16.5% of Expenditures 1 FY ending Balance includes $211,500 HB21-1314 related transfer for programming DRIVES
DRIVES CASH FUND
The primary sources of revenue in the DRIVES Cash Fund are through vehicle title fees, registration fees, and SOT transaction fees. These three revenue streams account for 93 percent of all revenue allocated towards the DRIVES Cash Fund. The chart below shows revenue trends for DRIVES for two historical year and revenue projections through fiscal year 2025. Revenue in DRIVES is forecast
$7.5
$1.6
$3.1
$23.5
$5.6
$3.2
Total DOR Operational Support
DRIVES Maint & Support
Administration (excluding DRIVESsupport)
Personal Services
Drivers License Documents
Drivers Services (excluding PersonalServices & DL Documents)
FY 20-21 LSCF FUND EXPENDITURES BY SOURCE (millions)
18-Nov-2021 21 REV-brf
to grow by a compound annual growth rate of 2.1 percent between fiscal year 2020 and fiscal year 2025.
DRIVES CASH FUND REVENUE
FY19-20 FY20-21 FY21-22* FY22-23* FY23-24* FY24-25* CAGR
Title Fees $5,813,978 $6,138,345 $6,331,137 $6,521,071 $6,586,282 $6,652,145 2.7% Annual Percent Change 5.6% 3.1% 3.0% 1.0% 1.0% Registration Fees $ 2,544,163 $ 2,556,529 $ 2,664,105 $ 2,744,028 $ 2,771,468 $ 2,799,183 1.9% Annual Percent Change 0.5% 4.2% 3.0% 1.0% 1.0% MIIDB Fees $ 509,948 $ 512,548 $ 416,347 $ 428,837 $ 433,125 $ 437,457 -3.0% Annual Percent Change 0.5% -18.8% 3.0% 1.0% 1.0% SOT Transaction Fees $ 3,315,767 $ 3,420,992 $ 3,562,484 $ 3,669,358 $ 3,706,052 $ 3,743,112 2.5% Annual Percent Change 3.2% 4.1% 3.0% 1.0% 1.0% Misc. Revenue $ 579,430 $ 480,743 $ 521,556 $ 537,203 $ 542,575 $ 548,001 -1.1% Annual Percent Change -17.0% 8.5% 3.0% 1.0% 1.0% Total $12,763,286 $13,109,157 $13,495,629 $13,900,497 $14,039,502 $14,179,898 2.1% Annual Percent Change 2.7% 2.9% 3.0% 1.0% 1.0%
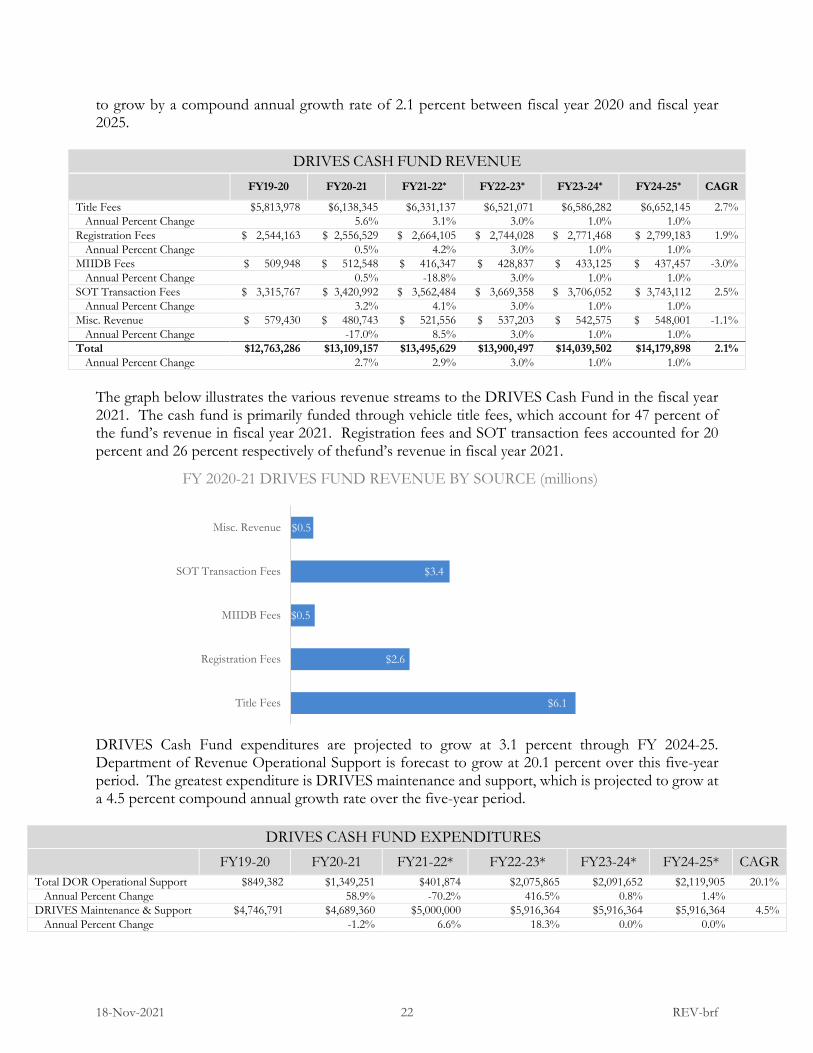
The graph below illustrates the various revenue streams to the DRIVES Cash Fund in the fiscal year 2021. The cash fund is primarily funded through vehicle title fees, which account for 47 percent of the fund’s revenue in fiscal year 2021. Registration fees and SOT transaction fees accounted for 20 percent and 26 percent respectively of thefund’s revenue in fiscal year 2021.
DRIVES Cash Fund expenditures are projected to grow at 3.1 percent through FY 2024-25. Department of Revenue Operational Support is forecast to grow at 20.1 percent over this five-year period. The greatest expenditure is DRIVES maintenance and support, which is projected to grow at a 4.5 percent compound annual growth rate over the five-year period.
DRIVES CASH FUND EXPENDITURES FY19-20 FY20-21 FY21-22* FY22-23* FY23-24* FY24-25* CAGR
Total DOR Operational Support $849,382 $1,349,251 $401,874 $2,075,865 $2,091,652 $2,119,905 20.1% Annual Percent Change 58.9% -70.2% 416.5% 0.8% 1.4% DRIVES Maintenance & Support $4,746,791 $4,689,360 $5,000,000 $5,916,364 $5,916,364 $5,916,364 4.5% Annual Percent Change -1.2% 6.6% 18.3% 0.0% 0.0%
$6.1
$2.6
$0.5
$3.4
$0.5
Title Fees
Registration Fees
MIIDB Fees
SOT Transaction Fees
Misc. Revenue
FY 2020-21 DRIVES FUND REVENUE BY SOURCE (millions)
18-Nov-2021 22 REV-brf

DRIVES CASH FUND EXPENDITURES FY19-20 FY20-21 FY21-22* FY22-23* FY23-24* FY24-25* CAGR
Administration (excluding DRIVES support) $814,635 $923,382 $ 1,305,357 $ 783,027 $788,963 $796,852 -0.4%
Annual Percent Change 13.3% 41.4% -40.0% 0.8% 1.0% Personal Services $3,022,901 $2,707,283 $2,503,598 $ 2,219,982 $2,219,982 $2,242,182 -5.8% Annual Percent Change -10.4% -7.5% -11.3% 0.0% 1.0% Vehicle Services (excluding Personal Services) $1,007,041 $770,082 $867,735 $922,386 $949,421 $962,522 -0.9%
Annual Percent Change -23.5% 12.7% 6.3% 2.9% 1.4% County Support Services $2,361,603 $2,077,666 $2,270,050 $ 2,903,965 $2,903,965 $2,903,965 4.2% Annual Percent Change -12.0% 9.3% 27.9% 0.0% 0.0% Total Expenditures $12,802,353 $12,517,024 $12,348,614 $14,821,589 $14,870,347 $14,941,790 3.1% Annual Percent Change -2.2% -1.3% 20.0% 0.3% 0.5%
The graph below illustrates DRIVES Cash Fund expenditures for FY 2020-2021. DRIVES maintenance and support accounted for 37.5 percent of all cash fund expenditures. Personal Services and County Support Services accounted for 21.6 percent and 16.6 percent of all FY 2020-21 DRIVES Cash Fund expenditures.
The DRIVES Cash Fund shows relatively level revenue and expenditure projections over the next four years. The DRIVES Cash Fund fiscal year ending balance for 2020 was $18.1 million. It is projected to end FY 2024-25 with a $17.3 million balance.
DRIVES CASH FUND FISCAL YEAR ENDING BALANCE FY19-20 FY20-21 FY21-22* FY22-23* FY23-24* FY24-25*
Total Revenue $12,763,286 $13,109,157 $13,495,629 $13,900,497 $14,039,502 $14,179,898 Total Expenditures 12,802,353 12,517,024 12,348,614 14,821,589 14,870,347 14,941,790 Surplus / Deficit (39,067) 592,133 1,147,015 (921,092) (830,845) (761,892) Fiscal Year Ending Balance 18,145,137 18,737,270 19,884,285 18,963,193 18,132,348 17,370,456 FY Ending Target Fund Balance 2,112,388 2,065,309 2,037,521 2,445,562 2,453,607 2,465,395 16.5% of Expenditures
$1.3
$4.7
$0.9
$2.7
$0.8
$2.1
Total DOR Operational Support
DRIVES Maint & Support
Administration (excluding DRIVES support)
Personal Services
Vehicle Services (excluding Personal Services)
County Support Services
FY 20-21 DRIVES FUND EXPENDITURES BY SOURCE (millions)
18-Nov-2021 23 REV-brf
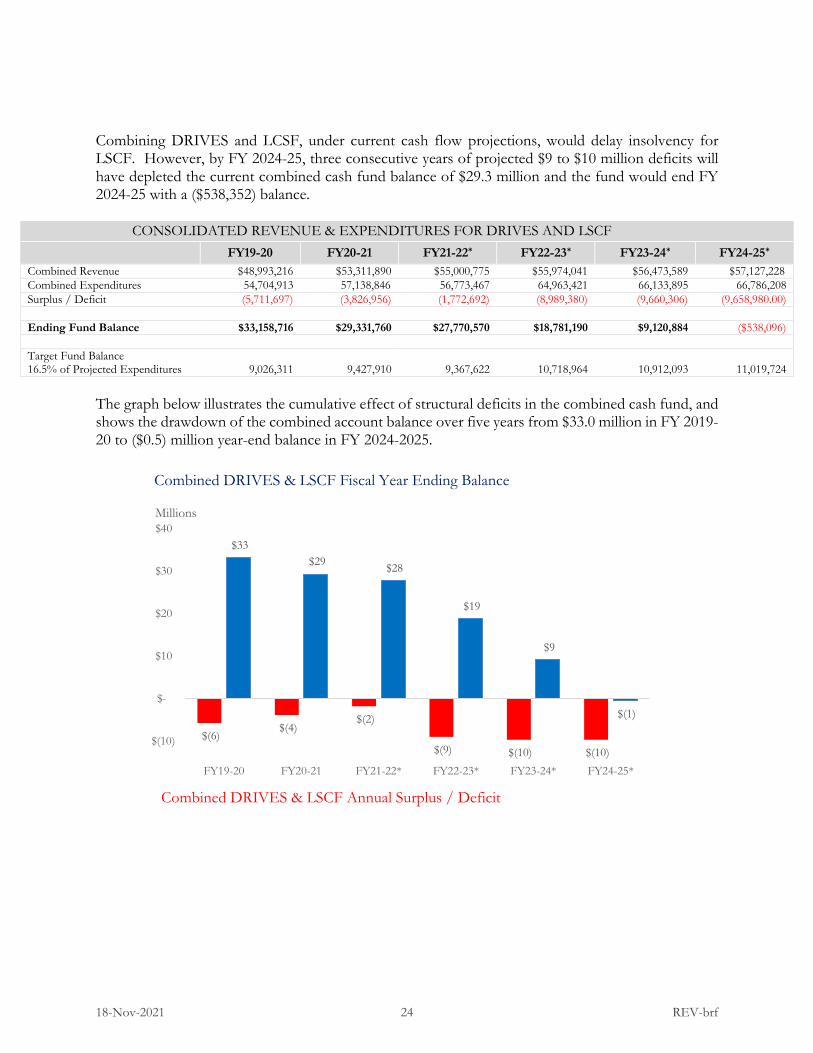
Combining DRIVES and LCSF, under current cash flow projections, would delay insolvency for LSCF. However, by FY 2024-25, three consecutive years of projected $9 to $10 million deficits will have depleted the current combined cash fund balance of $29.3 million and the fund would end FY 2024-25 with a ($538,352) balance.
CONSOLIDATED REVENUE & EXPENDITURES FOR DRIVES AND LSCF FY19-20 FY20-21 FY21-22* FY22-23* FY23-24* FY24-25*
Combined Revenue $48,993,216 $53,311,890 $55,000,775 $55,974,041 $56,473,589 $57,127,228 Combined Expenditures 54,704,913 57,138,846 56,773,467 64,963,421 66,133,895 66,786,208 Surplus / Deficit (5,711,697) (3,826,956) (1,772,692) (8,989,380) (9,660,306) (9,658,980.00)
Ending Fund Balance $33,158,716 $29,331,760 $27,770,570 $18,781,190 $9,120,884 ($538,096)
Target Fund Balance 16.5% of Projected Expenditures 9,026,311 9,427,910 9,367,622 10,718,964 10,912,093 11,019,724
The graph below illustrates the cumulative effect of structural deficits in the combined cash fund, and shows the drawdown of the combined account balance over five years from $33.0 million in FY 2019-20 to ($0.5) million year-end balance in FY 2024-2025.
$(6)$(4)
$(2)
$(9) $(10) $(10)
$33 $29 $28
$19
$9
$(1)
$(10)
$-
$10
$20
$30
$40
FY19-20 FY20-21 FY21-22* FY22-23* FY23-24* FY24-25*
Millions
Combined DRIVES & LSCF Fiscal Year Ending Balance
Combined DRIVES & LSCF Annual Surplus / Deficit
18-Nov-2021 24 REV-brf

INFORMATIONAL ISSUE: SPORTS BETTING UPDATE
SUMMARY
Since Colorado became the seventeenth state to legalize sports betting over $3.5 billion has been wagered on sporting events in the state. Revenue from the program primarily benefits the Colorado Water Implementation Cash Fund, and to date, nearly $20.0 million in revenue has been generated from the program.
• In 2018, the U.S. Supreme Court ruling Murphy v. National Collegiate Athletic Association opened thedoor for legalized sports gambling within the United States. The ruling pushed the issue of sportswagering to individual states allowing state legislatures to pass statutes legalizing sports gambling.
• Following the Supreme Court decision, the Colorado General Assembly passed H.B. 19–1327 andreferred the issue to voters through Proposition DD. On November 5, 2019, Proposition DDpassed, and Colorado became the seventeenth state to allow legalized sports wagering.
• Sports gaming commenced in Colorado on May 1, 2020. Since then, nearly $3.5 billion has beenwagered within Colorado borders by sports bettors and $8,564,616 has been distributed to theprogram beneficiaries. These beneficiaries include the Water Implementation Cash Fund, whichreceived $7,945,834. A required 6 percent, or $488,782, was disbursed to the Hold HarmlessFund, established to compensate entities that receive tax revenue from traditional gambling whocan prove they were adversely impacted by sports gambling. The Office of Behavioral Healthreceived an annual distribution of $130,000 to fund gambling addiction services. Previously, inMarch of 2021, the Division of Gaming transferred $1,552,397 to the state’s General Fund torepay the state’s initial investment to set up the legalized market
• Currently, there are seventeen licensed retail sports betting operators and twenty-five licensedonline operators. These operators pay a fee of up to $125,000 every other year for licensure.Licensure fees, as well as enforcement fines, are allocated towards administrative costs. All feeand tax revenue is allocated to the Sports Betting Cash Fund, which ended FY 2020-21 with abalance of $8.6 million.
DISCUSSION: Sports betting is the act of wagering on the outcome of a sporting event or an individual athletes performance. Passage of Proposition DD in November of 2019 legalized sports wagering in the state of Colorado. Revenue from sports wagering is generated for the state of Colorado primarily through licensure fees of sports betting operators, and a ten percent tax on all sports betting proceeds. Revenue collected by the State is allocated towards the following activities:
• Six percent of annual revenues are allocated to a hold-harmless fund to compensate entities thatreceive revenue from traditional sources of gambling and horseracing, such as casino cities andcounties, community colleges, and the State Historical Fund. These entities may apply for fundingfrom the hold harmless fund if they can prove that they lost money due to a decrease in the amountbet on traditional gambling and horse racing following the legalization of sports betting.
18-Nov-2021 25 REV-brf
• $130,000 per year is allocated to the Office of Behavioral Health in the Department of HumanServices to fund gambling addiction services, including a gambling crisis hotline and gamblingaddiction counselors.
• The balance is credited to the Water Plan Implementation Cash Fund, established to address thestate’s water needs including projects funded under the Colorado Water Plan and water obligationsoutlined in interstate water compacts and federal law.
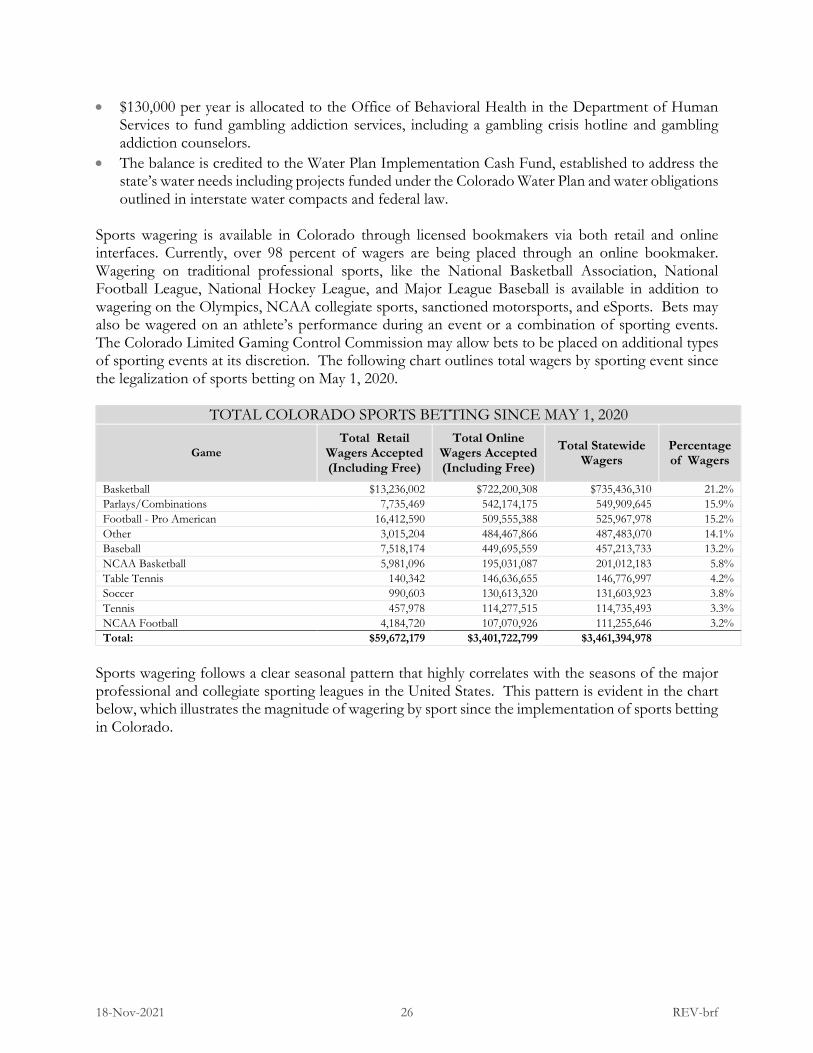
Sports wagering is available in Colorado through licensed bookmakers via both retail and online interfaces. Currently, over 98 percent of wagers are being placed through an online bookmaker. Wagering on traditional professional sports, like the National Basketball Association, National Football League, National Hockey League, and Major League Baseball is available in addition to wagering on the Olympics, NCAA collegiate sports, sanctioned motorsports, and eSports. Bets may also be wagered on an athlete’s performance during an event or a combination of sporting events. The Colorado Limited Gaming Control Commission may allow bets to be placed on additional types of sporting events at its discretion. The following chart outlines total wagers by sporting event since the legalization of sports betting on May 1, 2020.
TOTAL COLORADO SPORTS BETTING SINCE MAY 1, 2020
Game Total Retail
Wagers Accepted (Including Free)
Total Online Wagers Accepted (Including Free)
Total Statewide Wagers
Percentage of Wagers
Basketball $13,236,002 $722,200,308 $735,436,310 21.2% Parlays/Combinations 7,735,469 542,174,175 549,909,645 15.9% Football - Pro American 16,412,590 509,555,388 525,967,978 15.2% Other 3,015,204 484,467,866 487,483,070 14.1% Baseball 7,518,174 449,695,559 457,213,733 13.2% NCAA Basketball 5,981,096 195,031,087 201,012,183 5.8% Table Tennis 140,342 146,636,655 146,776,997 4.2% Soccer 990,603 130,613,320 131,603,923 3.8% Tennis 457,978 114,277,515 114,735,493 3.3% NCAA Football 4,184,720 107,070,926 111,255,646 3.2% Total: $59,672,179 $3,401,722,799 $3,461,394,978
Sports wagering follows a clear seasonal pattern that highly correlates with the seasons of the major professional and collegiate sporting leagues in the United States. This pattern is evident in the chart below, which illustrates the magnitude of wagering by sport since the implementation of sports betting in Colorado.
18-Nov-2021 26 REV-brf

The chart below examines a month–month comparison of gaming proceeds from two months, June and July between the years 2020 and 2021. This monthly comparison of year-over-year data eliminates the seasonal effect evident in the chart above.
Colorado Sports Betting Year / Year Comparison July 2020 July 2021 Change August 2020 August 2021 Change
Total $53,987,021 $166,675,534 209% $121,126,610 $196,689,841 62.38%
TAX REVENUE: The chart below shows the monthly tax revenue generated from sports gambling. The seasonality in tax revenue correlates to the cyclical nature of the sports betting market. To date, nearly $20.0 million in tax revenue has been generated from sports betting in Colorado.
$-
$100
$200
$300
June '20 October '20 February '21 June '21
MillionsColorado Sports Betting Wagers - Prior 15 Months
Baseball - MLB Football - NFL Tennis Soccer Basketball - NBA
$-
$0.40
$0.80
$1.20
July '20Sports Betting Monthly
Tax Revenue
November '20 March '21 July '21
Millions
Colorado Sports Betting Monthly Tax RevenueSports Betting Tax
18-Nov-2021 27 REV-brf
On September 23, 2021, the Colorado Limited Gaming Control Commission approved the first distribution from tax revenues collected in the first full fiscal year of legalized sports betting. A total of $8,564,616 was distributed to the beneficiaries as designated in H.B. 19-1327. The Water Implementation Cash Fund received $7,945,834. A required 6 percent was disbursed to the Hold Harmless Fund, totaling $488,782. The Office of Behavioral Health received an annual distribution of $130,000, of which Rocky Mountain Crisis Partners received $30,000 to operate a problem gambling hotline. Prior to this distribution, in March of 2021, the Division of Gaming transferred $1,552,397 to the state’s General Fund to repay the State’s initial investment to set up the legalized market.
According to researchers at Goldman Sachs, the market for sports betting could grow by up to 40 percent annually over the next decade. Sixteen months of Colorado sports gaming data show a general upward trend in sports gaming revenue with a significant seasonal effect. The seasonality in sports betting correlates to the calendar of the major professional and collegiate sports leagues in the United States. The growth of the Colorado sports betting market is difficult to forecast due to limited data and the impact of the Covid-19 pandemic. However, it would not be unreasonable to project Colorado’s sports betting tax revenue to trend with the growth of the overall national sports betting market. Over time and with more monthly data, the seasonal effect of sports betting in Colorado will become more apparent and the ability to project future revenue from Colorado sports betting should be more reliable.
18-Nov-2021 28 REV-brf

APPENDIX A NUMBERS PAGES (DIGITAL ONLY)
Appendix A details actual expenditures for the last two fiscal years, the appropriation for the current fiscal year, and the requested appropriation for next fiscal year. This information is listed by line item and fund source. Appendix A is only available in the online version of this document.
18-Nov-2021 A1 REV-brf

Appendix A: Numbers Pages
FY 2019-20Actual
FY 2020-21Actual
FY 2021-22Appropriation
FY 2022-23Request
Request vs.Appropriation
DEPARTMENT OF REVENUEMark Ferrandino, Executive Director
(1) EXECUTIVE DIRECTOR'S OFFICE
(A) Administration and SupportPersonal Services 9,220,635 11,141,307 13,336,056 15,371,351 *
FTE 136.5 145.0 145.0 172.1General Fund 3,877,533 5,277,113 5,012,845 5,916,985Cash Funds 300,778 219,713 814,631 1,941,896Reappropriated Funds 5,042,324 5,644,481 7,508,576 7,512,466Federal Funds 0 0 4 4
Health, Life, and Dental 13,409,236 14,493,017 16,992,741 19,346,127General Fund 5,275,428 3,833,915 6,547,644 8,564,305Cash Funds 8,002,942 10,646,037 10,328,497 10,616,085Reappropriated Funds 34,422 13,065 8,002 4,091Federal Funds 96,444 0 108,598 161,646
Short-term Disability 147,347 158,490 163,744 164,290 *General Fund 57,479 61,023 73,725 74,569Cash Funds 88,393 97,307 88,898 88,239Reappropriated Funds 258 160 74 44Federal Funds 1,217 0 1,047 1,438
18-Nov-2021 A2 REV-brf
Appendix A: Numbers Pages
FY 2019-20Actual
FY 2020-21Actual
FY 2021-22Appropriation
FY 2022-23Request
Request vs.Appropriation
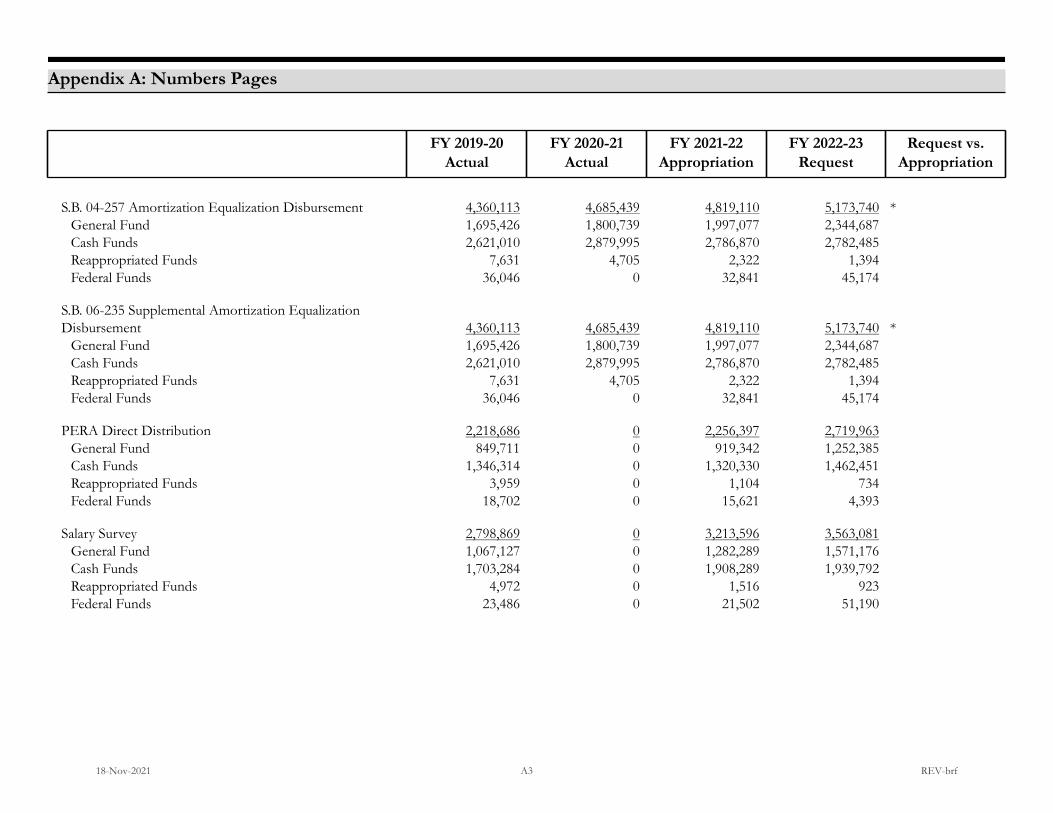
S.B. 04-257 Amortization Equalization Disbursement 4,360,113 4,685,439 4,819,110 5,173,740 *General Fund 1,695,426 1,800,739 1,997,077 2,344,687Cash Funds 2,621,010 2,879,995 2,786,870 2,782,485Reappropriated Funds 7,631 4,705 2,322 1,394Federal Funds 36,046 0 32,841 45,174
S.B. 06-235 Supplemental Amortization EqualizationDisbursement 4,360,113 4,685,439 4,819,110 5,173,740 *
General Fund 1,695,426 1,800,739 1,997,077 2,344,687Cash Funds 2,621,010 2,879,995 2,786,870 2,782,485Reappropriated Funds 7,631 4,705 2,322 1,394Federal Funds 36,046 0 32,841 45,174
PERA Direct Distribution 2,218,686 0 2,256,397 2,719,963General Fund 849,711 0 919,342 1,252,385Cash Funds 1,346,314 0 1,320,330 1,462,451Reappropriated Funds 3,959 0 1,104 734Federal Funds 18,702 0 15,621 4,393
Salary Survey 2,798,869 0 3,213,596 3,563,081General Fund 1,067,127 0 1,282,289 1,571,176Cash Funds 1,703,284 0 1,908,289 1,939,792Reappropriated Funds 4,972 0 1,516 923Federal Funds 23,486 0 21,502 51,190
18-Nov-2021 A3 REV-brf

Appendix A: Numbers Pages
FY 2019-20Actual
FY 2020-21Actual
FY 2021-22Appropriation
FY 2022-23Request
Request vs.Appropriation
Shift Differential 114,613 123,918 102,026 99,139General Fund 0 0 0 0Cash Funds 114,613 123,918 102,026 99,139Reappropriated Funds 0 0 0 0Federal Funds 0 0 0 0
Paid Family Medical Leave Fund 0 0 0 143,618 *General Fund 0 0 0 54,368Cash Funds 0 0 0 89,250Reappropriated Funds 0 0 0 0Federal Funds 0 0 0 0
Paid Family Medical Leave Initiative 0 0 0 232,817General Fund 0 0 0 105,511Cash Funds 0 0 0 125,210Reappropriated Funds 0 0 0 63Federal Funds 0 0 0 2,033
Workers' Compensation 939,970 692,913 544,854 349,194General Fund 364,681 264,266 207,799 132,191Cash Funds 575,289 428,647 337,055 217,003Reappropriated Funds 0 0 0 0Federal Funds 0 0 0 0
Operating Expenses 1,439,497 1,772,807 3,292,764 3,399,974 *General Fund 1,141,897 1,545,317 2,143,002 2,216,377Cash Funds 297,600 227,490 1,149,762 1,159,747Reappropriated Funds 0 0 0 23,850Federal Funds 0 0 0 0
18-Nov-2021 A4 REV-brf

Appendix A: Numbers Pages
FY 2019-20Actual
FY 2020-21Actual
FY 2021-22Appropriation
FY 2022-23Request
Request vs.Appropriation
Postage 2,662,721 2,403,106 97,272 152,880General Fund 2,469,257 2,049,195 52,165 52,165Cash Funds 193,464 353,911 45,107 100,715Reappropriated Funds 0 0 0 0Federal Funds 0 0 0 0
Legal Services 6,258,994 5,871,769 4,894,253 5,858,855General Fund 3,482,635 3,145,162 2,410,120 2,903,333Cash Funds 2,776,359 2,726,607 2,484,133 2,955,522Reappropriated Funds 0 0 0 0Federal Funds 0 0 0 0
Administrative Law Judge Services 2,099 1,405 12,770 311General Fund 0 0 0 0Cash Funds 2,099 1,405 12,770 311Reappropriated Funds 0 0 0 0Federal Funds 0 0 0 0
Payment to Risk Management and Property Funds 310,447 273,106 425,411 757,554 *General Fund 120,609 104,158 162,245 286,782Cash Funds 189,838 168,948 263,166 470,772Reappropriated Funds 0 0 0 0Federal Funds 0 0 0 0
Vehicle Lease Payments 529,808 560,096 873,881 738,765 *General Fund 160,623 153,683 130,204 103,731Cash Funds 369,185 406,413 743,677 635,034Reappropriated Funds 0 0 0 0Federal Funds 0 0 0 0
18-Nov-2021 A5 REV-brf
Appendix A: Numbers Pages
FY 2019-20Actual
FY 2020-21Actual
FY 2021-22Appropriation
FY 2022-23Request
Request vs.Appropriation
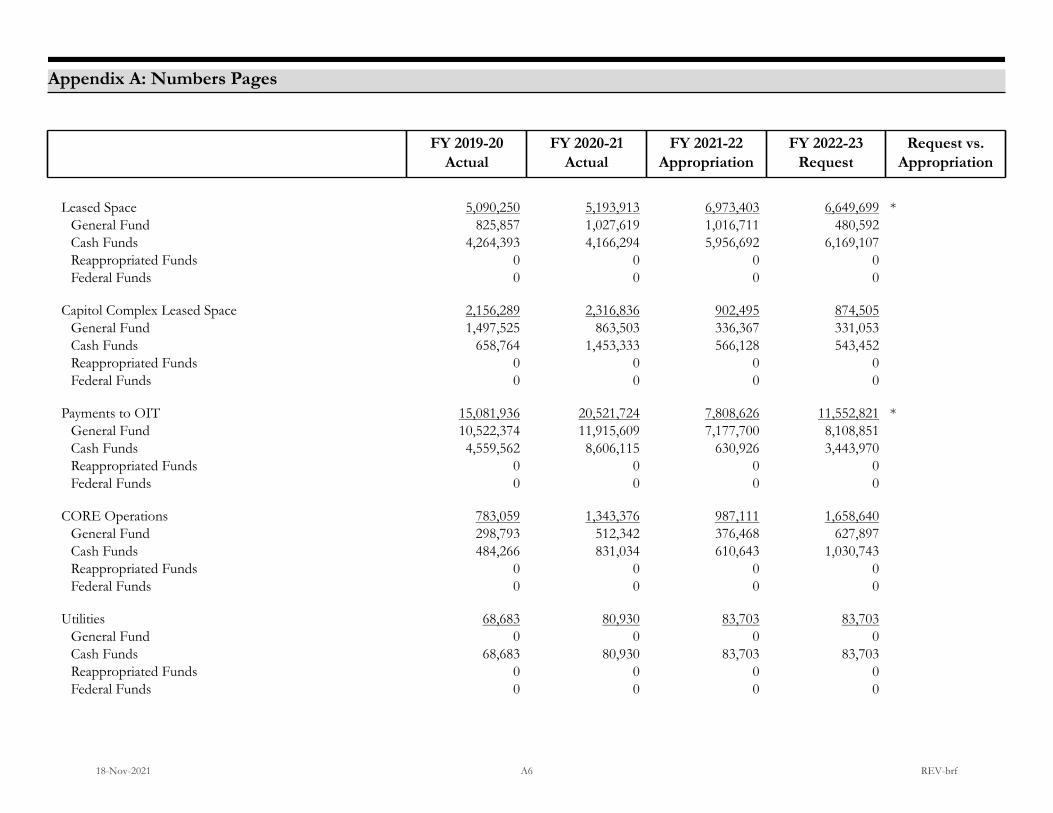
Leased Space 5,090,250 5,193,913 6,973,403 6,649,699 *General Fund 825,857 1,027,619 1,016,711 480,592Cash Funds 4,264,393 4,166,294 5,956,692 6,169,107Reappropriated Funds 0 0 0 0Federal Funds 0 0 0 0
Capitol Complex Leased Space 2,156,289 2,316,836 902,495 874,505General Fund 1,497,525 863,503 336,367 331,053Cash Funds 658,764 1,453,333 566,128 543,452Reappropriated Funds 0 0 0 0Federal Funds 0 0 0 0
Payments to OIT 15,081,936 20,521,724 7,808,626 11,552,821 *General Fund 10,522,374 11,915,609 7,177,700 8,108,851Cash Funds 4,559,562 8,606,115 630,926 3,443,970Reappropriated Funds 0 0 0 0Federal Funds 0 0 0 0
CORE Operations 783,059 1,343,376 987,111 1,658,640General Fund 298,793 512,342 376,468 627,897Cash Funds 484,266 831,034 610,643 1,030,743Reappropriated Funds 0 0 0 0Federal Funds 0 0 0 0
Utilities 68,683 80,930 83,703 83,703General Fund 0 0 0 0Cash Funds 68,683 80,930 83,703 83,703Reappropriated Funds 0 0 0 0Federal Funds 0 0 0 0
18-Nov-2021 A6 REV-brf

Appendix A: Numbers Pages
FY 2019-20Actual
FY 2020-21Actual
FY 2021-22Appropriation
FY 2022-23Request
Request vs.Appropriation
Statewide training 0 0 0 0General Fund 0 0 0 0Cash Funds 0 0 0 0Reappropriated Funds 0 0 0 0Federal Funds 0 0 0 0
Merit Pay 0 0 0 0General Fund 0 0 0 0Cash Funds 0 0 0 0Reappropriated Funds 0 0 0 0Federal Funds 0 0 0 0
SUBTOTAL - (A) Administration and Support 71,953,365 76,319,591 72,599,323 84,064,767 15.8%FTE 136.5 145.0 145.0 172.1 18.7%
General Fund 35,402,381 34,354,383 31,842,780 37,471,645 17.7%Cash Funds 31,237,846 36,298,092 33,020,173 38,737,111 17.3%Reappropriated Funds 5,101,197 5,667,116 7,523,916 7,544,959 0.3%Federal Funds 211,941 0 212,454 311,052 46.4%
(B) Hearings DivisionPersonal Services 2,178,429 2,288,991 2,503,848 2,795,124 *
FTE 32.0 33.0 33.3 33.3General Fund 0 (29,512) 0 0Cash Funds 2,178,429 2,318,503 2,503,848 2,795,124Reappropriated Funds 0 0 0 0Federal Funds 0 0 0 0
18-Nov-2021 A7 REV-brf

Appendix A: Numbers Pages
FY 2019-20Actual
FY 2020-21Actual
FY 2021-22Appropriation
FY 2022-23Request
Request vs.Appropriation
Operating Expenses 85,747 67,979 110,412 110,412General Fund 0 0 0 0Cash Funds 85,747 67,979 110,412 110,412Reappropriated Funds 0 0 0 0Federal Funds 0 0 0 0
Indirect Cost Assessment 168,054 186,966 253,913 259,689General Fund 0 0 0 0Cash Funds 168,054 186,966 253,913 259,689Reappropriated Funds 0 0 0 0Federal Funds 0 0 0 0
SUBTOTAL - (B) Hearings Division 2,432,230 2,543,936 2,868,173 3,165,225 10.4%FTE 32.0 33.0 33.3 33.3 (0.0%)
General Fund 0 (29,512) 0 0 0.0%Cash Funds 2,432,230 2,573,448 2,868,173 3,165,225 10.4%Reappropriated Funds 0 0 0 0 0.0%Federal Funds 0 0 0 0 0.0%
TOTAL - (1) Executive Director's Office 74,385,595 78,863,527 75,467,496 87,229,992 15.6%FTE 168.5 178.0 178.3 205.4 15.2%
General Fund 35,402,381 34,324,871 31,842,780 37,471,645 17.7%Cash Funds 33,670,076 38,871,540 35,888,346 41,902,336 16.8%Reappropriated Funds 5,101,197 5,667,116 7,523,916 7,544,959 0.3%Federal Funds 211,941 0 212,454 311,052 46.4%
18-Nov-2021 A8 REV-brf
Appendix A: Numbers Pages
FY 2019-20Actual
FY 2020-21Actual
FY 2021-22Appropriation
FY 2022-23Request
Request vs.Appropriation
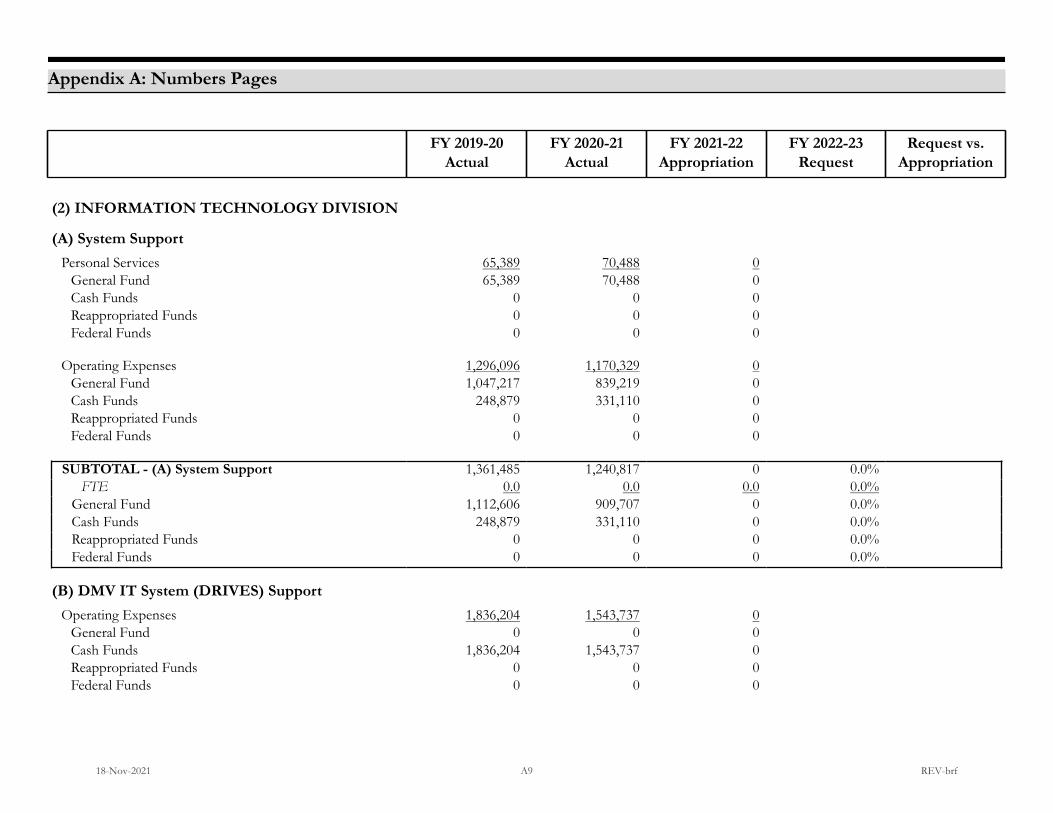
(2) INFORMATION TECHNOLOGY DIVISION
(A) System SupportPersonal Services 65,389 70,488 0
General Fund 65,389 70,488 0Cash Funds 0 0 0Reappropriated Funds 0 0 0Federal Funds 0 0 0
Operating Expenses 1,296,096 1,170,329 0General Fund 1,047,217 839,219 0Cash Funds 248,879 331,110 0Reappropriated Funds 0 0 0Federal Funds 0 0 0
SUBTOTAL - (A) System Support 1,361,485 1,240,817 0 0.0%FTE 0.0 0.0 0.0 0.0%
General Fund 1,112,606 909,707 0 0.0%Cash Funds 248,879 331,110 0 0.0%Reappropriated Funds 0 0 0 0.0%Federal Funds 0 0 0 0.0%
(B) DMV IT System (DRIVES) SupportOperating Expenses 1,836,204 1,543,737 0
General Fund 0 0 0Cash Funds 1,836,204 1,543,737 0Reappropriated Funds 0 0 0Federal Funds 0 0 0
18-Nov-2021 A9 REV-brf
Appendix A: Numbers Pages
FY 2019-20Actual
FY 2020-21Actual
FY 2021-22Appropriation
FY 2022-23Request
Request vs.Appropriation
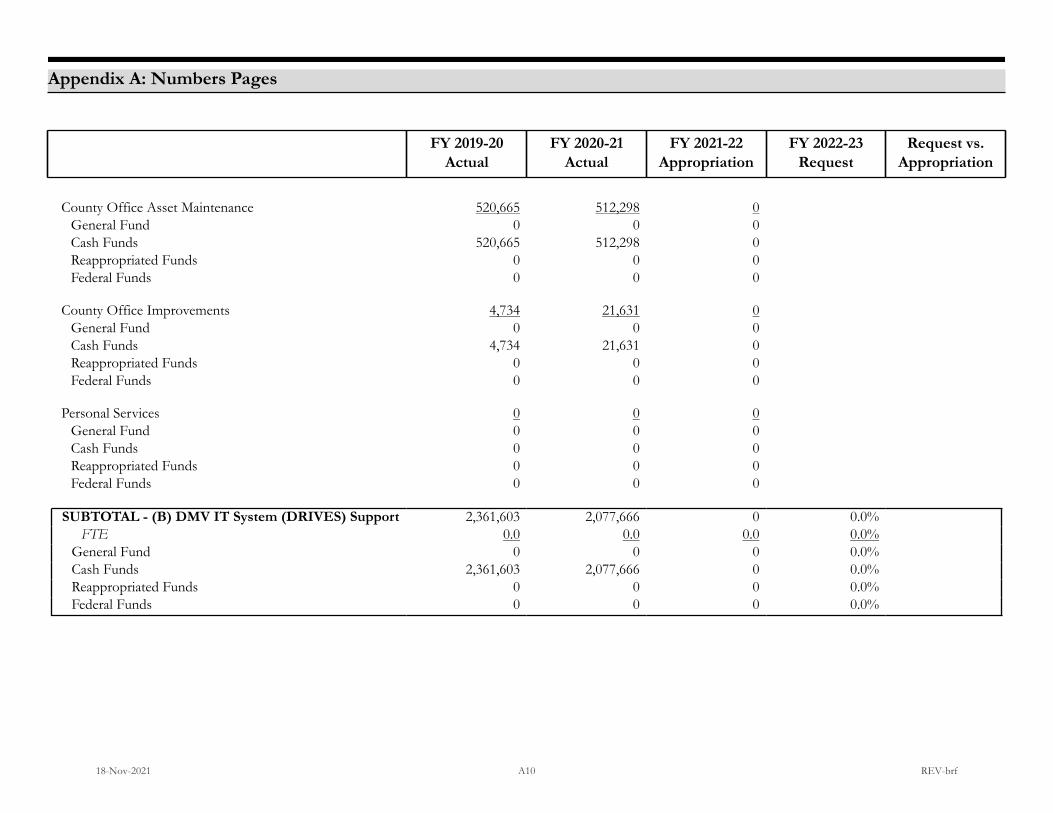
County Office Asset Maintenance 520,665 512,298 0General Fund 0 0 0Cash Funds 520,665 512,298 0Reappropriated Funds 0 0 0Federal Funds 0 0 0
County Office Improvements 4,734 21,631 0General Fund 0 0 0Cash Funds 4,734 21,631 0Reappropriated Funds 0 0 0Federal Funds 0 0 0
Personal Services 0 0 0General Fund 0 0 0Cash Funds 0 0 0Reappropriated Funds 0 0 0Federal Funds 0 0 0
SUBTOTAL - (B) DMV IT System (DRIVES) Support 2,361,603 2,077,666 0 0.0%FTE 0.0 0.0 0.0 0.0%
General Fund 0 0 0 0.0%Cash Funds 2,361,603 2,077,666 0 0.0%Reappropriated Funds 0 0 0 0.0%Federal Funds 0 0 0 0.0%
18-Nov-2021 A10 REV-brf
Appendix A: Numbers Pages
FY 2019-20Actual
FY 2020-21Actual
FY 2021-22Appropriation
FY 2022-23Request
Request vs.Appropriation
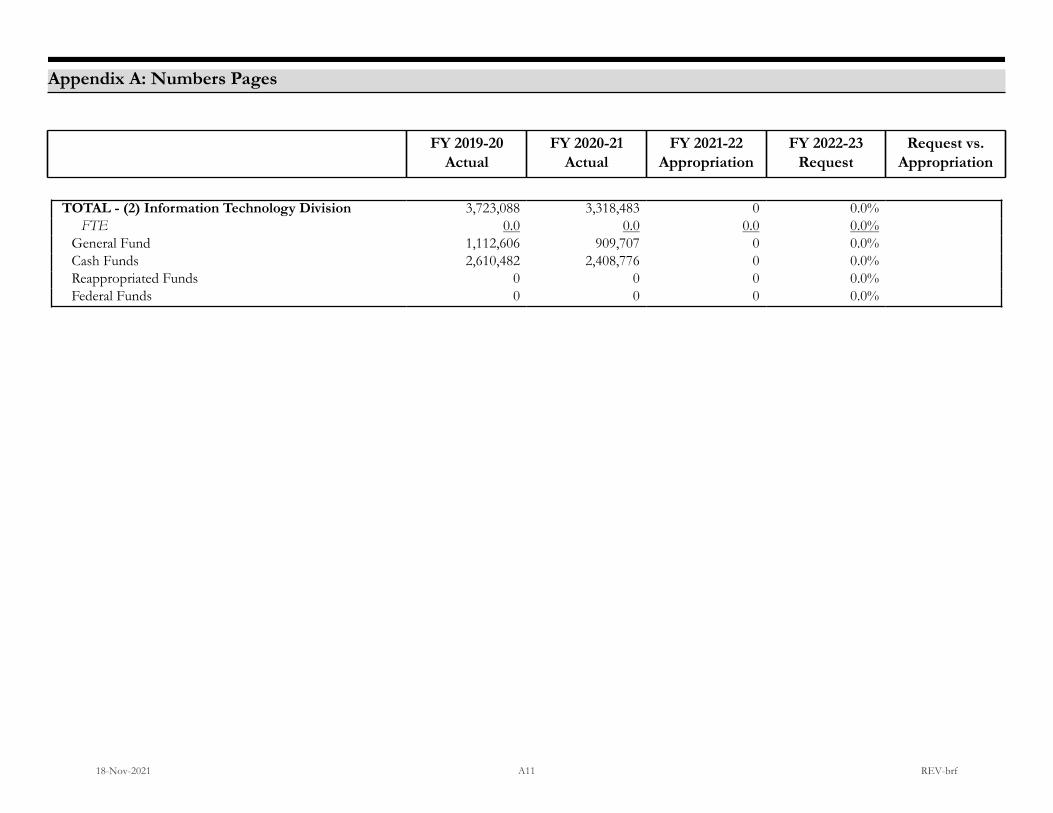
TOTAL - (2) Information Technology Division 3,723,088 3,318,483 0 0.0%FTE 0.0 0.0 0.0 0.0%
General Fund 1,112,606 909,707 0 0.0%Cash Funds 2,610,482 2,408,776 0 0.0%Reappropriated Funds 0 0 0 0.0%Federal Funds 0 0 0 0.0%
18-Nov-2021 A11 REV-brf

Appendix A: Numbers Pages
FY 2019-20Actual
FY 2020-21Actual
FY 2021-22Appropriation
FY 2022-23Request
Request vs.Appropriation
(3) TAXATION BUSINESS GROUP
(A) AdministrationPersonal Services 387,272 491,614 567,667 578,260
FTE 5.0 5.0 5.0 5.0General Fund 367,838 465,612 542,905 558,467Cash Funds 19,434 26,002 24,762 19,793Reappropriated Funds 0 0 0 0Federal Funds 0 0 0 0
Operating Expenses 10,350 10,209 12,543 12,543General Fund 10,350 10,209 12,543 12,543Cash Funds 0 0 0 0Reappropriated Funds 0 0 0 0Federal Funds 0 0 0 0
Tax Administration IT System (GenTax) Support 6,234,496 5,982,763 6,872,126 6,463,171General Fund 6,017,990 5,982,763 6,854,234 6,445,279Cash Funds 216,506 0 17,892 17,892Reappropriated Funds 0 0 0 0Federal Funds 0 0 0 0
IDS Print Production 0 0 4,728,872 4,971,755General Fund 0 0 4,728,872 4,971,755Cash Funds 0 0 0 0Reappropriated Funds 0 0 0 0Federal Funds 0 0 0 0
18-Nov-2021 A12 REV-brf
Appendix A: Numbers Pages
FY 2019-20Actual
FY 2020-21Actual
FY 2021-22Appropriation
FY 2022-23Request
Request vs.Appropriation
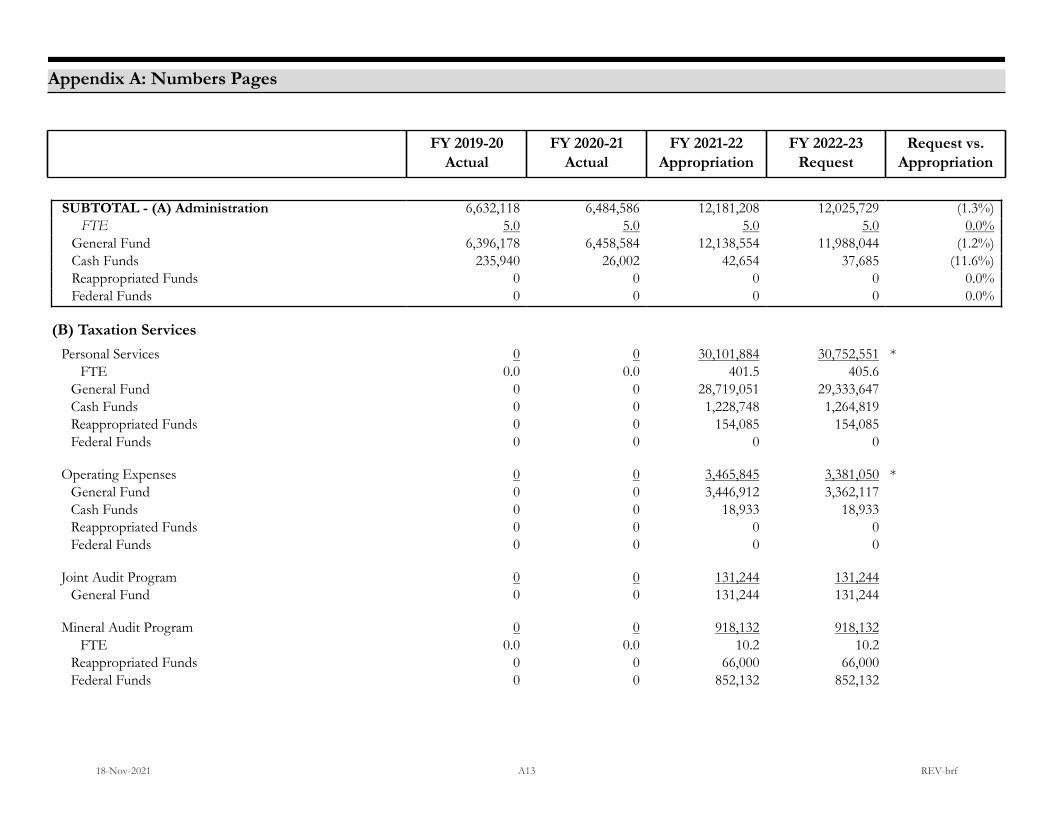
SUBTOTAL - (A) Administration 6,632,118 6,484,586 12,181,208 12,025,729 (1.3%)FTE 5.0 5.0 5.0 5.0 0.0%
General Fund 6,396,178 6,458,584 12,138,554 11,988,044 (1.2%)Cash Funds 235,940 26,002 42,654 37,685 (11.6%)Reappropriated Funds 0 0 0 0 0.0%Federal Funds 0 0 0 0 0.0%
(B) Taxation ServicesPersonal Services 0 0 30,101,884 30,752,551 *
FTE 0.0 0.0 401.5 405.6General Fund 0 0 28,719,051 29,333,647Cash Funds 0 0 1,228,748 1,264,819Reappropriated Funds 0 0 154,085 154,085Federal Funds 0 0 0 0
Operating Expenses 0 0 3,465,845 3,381,050 *General Fund 0 0 3,446,912 3,362,117Cash Funds 0 0 18,933 18,933Reappropriated Funds 0 0 0 0Federal Funds 0 0 0 0
Joint Audit Program 0 0 131,244 131,244General Fund 0 0 131,244 131,244
Mineral Audit Program 0 0 918,132 918,132FTE 0.0 0.0 10.2 10.2
Reappropriated Funds 0 0 66,000 66,000Federal Funds 0 0 852,132 852,132
18-Nov-2021 A13 REV-brf

Appendix A: Numbers Pages
FY 2019-20Actual
FY 2020-21Actual
FY 2021-22Appropriation
FY 2022-23Request
Request vs.Appropriation
Document Management 0 0 4,634,987 4,714,433General Fund 0 0 4,596,468 4,714,433Cash Funds 0 0 38,519 0Reappropriated Funds 0 0 0 0Federal Funds 0 0 0 0
Fuel Tracking System 0 0 501,145 504,071FTE 0.0 0.0 1.5 1.5
General Fund 0 0 126 126Cash Funds 0 0 501,019 503,945Reappropriated Funds 0 0 0 0Federal Funds 0 0 0 0
Indirect Cost Assessment 0 0 11,364 11,847General Fund 0 0 0 0Cash Funds 0 0 11,364 11,847Reappropriated Funds 0 0 0 0Federal Funds 0 0 0 0
SUBTOTAL - (B) Taxation Services 0 0 39,764,601 40,413,328 1.6%FTE 0.0 0.0 413.2 417.3 1.0%
General Fund 0 0 36,893,801 37,541,567 1.8%Cash Funds 0 0 1,798,583 1,799,544 0.1%Reappropriated Funds 0 0 220,085 220,085 0.0%Federal Funds 0 0 852,132 852,132 0.0%
18-Nov-2021 A14 REV-brf

Appendix A: Numbers Pages
FY 2019-20Actual
FY 2020-21Actual
FY 2021-22Appropriation
FY 2022-23Request
Request vs.Appropriation
(C) Tax ConfereePersonal Services 1,485,244 1,455,173 1,574,018 1,602,937
FTE 13.6 13.6 13.6 13.6General Fund 1,485,244 1,455,173 1,476,735 1,505,654Cash Funds 0 0 0 0Reappropriated Funds 0 0 97,283 97,283Federal Funds 0 0 0 0
Operating Expenses 57,742 45,175 60,905 60,905General Fund 57,742 45,175 60,905 60,905Cash Funds 0 0 0 0Reappropriated Funds 0 0 0 0Federal Funds 0 0 0 0
SUBTOTAL - (C) Tax Conferee 1,542,986 1,500,348 1,634,923 1,663,842 1.8%FTE 13.6 13.6 13.6 13.6 0.0%
General Fund 1,542,986 1,500,348 1,537,640 1,566,559 1.9%Cash Funds 0 0 0 0 0.0%Reappropriated Funds 0 0 97,283 97,283 0.0%Federal Funds 0 0 0 0 0.0%
(D) Special PurposeCigarette Tax Rebate 8,894,085 9,264,323 8,686,720 8,686,720
General Fund 8,894,085 9,264,323 8,686,720 8,686,720Cash Funds 0 0 0 0Reappropriated Funds 0 0 0 0Federal Funds 0 0 0 0
18-Nov-2021 A15 REV-brf

Appendix A: Numbers Pages
FY 2019-20Actual
FY 2020-21Actual
FY 2021-22Appropriation
FY 2022-23Request
Request vs.Appropriation
Amendment 35 Distribution to Local Governments 1,184,931 1,172,966 1,265,742 1,265,742General Fund 0 0 0 0Cash Funds 1,184,931 1,172,966 1,265,742 1,265,742Reappropriated Funds 0 0 0 0Federal Funds 0 0 0 0
Old Age Heat and Fuel and Property Tax Assistance Grant 5,842,930 6,358,838 6,327,420 6,327,420General Fund 5,842,930 6,358,838 6,327,420 6,327,420Cash Funds 0 0 0 0Reappropriated Funds 0 0 0 0Federal Funds 0 0 0 0
Commercial Vehicle Enterprise Sales Tax Refund 86,752 46,068 120,524 120,524General Fund 0 0 0 0Cash Funds 86,752 46,068 120,524 120,524Reappropriated Funds 0 0 0 0Federal Funds 0 0 0 0
Retail Marijuana Sales Tax Distribution to LocalGovernments 22,640,528 28,987,553 34,830,000 34,830,000
General Fund 22,640,528 28,987,553 34,830,000 34,830,000Cash Funds 0 0 0 0Reappropriated Funds 0 0 0 0Federal Funds 0 0 0 0
18-Nov-2021 A16 REV-brf
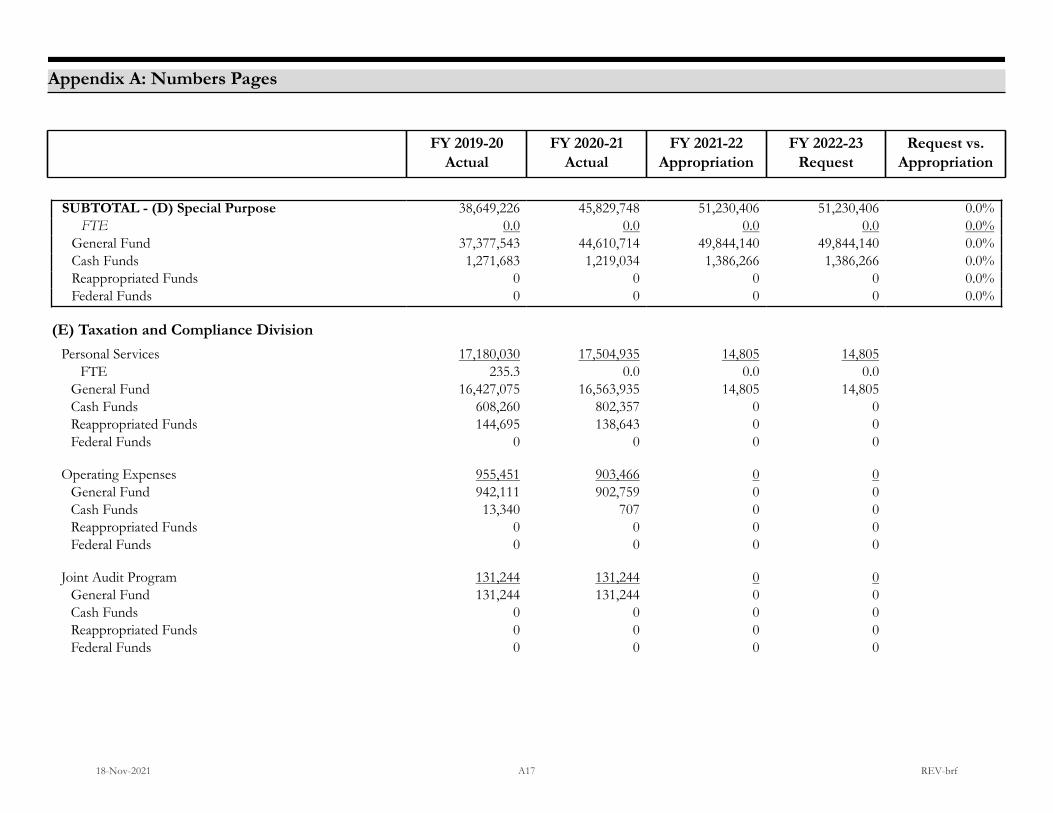
Appendix A: Numbers Pages
FY 2019-20Actual
FY 2020-21Actual
FY 2021-22Appropriation
FY 2022-23Request
Request vs.Appropriation
SUBTOTAL - (D) Special Purpose 38,649,226 45,829,748 51,230,406 51,230,406 0.0%FTE 0.0 0.0 0.0 0.0 0.0%
General Fund 37,377,543 44,610,714 49,844,140 49,844,140 0.0%Cash Funds 1,271,683 1,219,034 1,386,266 1,386,266 0.0%Reappropriated Funds 0 0 0 0 0.0%Federal Funds 0 0 0 0 0.0%
(E) Taxation and Compliance DivisionPersonal Services 17,180,030 17,504,935 14,805 14,805
FTE 235.3 0.0 0.0 0.0General Fund 16,427,075 16,563,935 14,805 14,805Cash Funds 608,260 802,357 0 0Reappropriated Funds 144,695 138,643 0 0Federal Funds 0 0 0 0
Operating Expenses 955,451 903,466 0 0General Fund 942,111 902,759 0 0Cash Funds 13,340 707 0 0Reappropriated Funds 0 0 0 0Federal Funds 0 0 0 0
Joint Audit Program 131,244 131,244 0 0General Fund 131,244 131,244 0 0Cash Funds 0 0 0 0Reappropriated Funds 0 0 0 0Federal Funds 0 0 0 0
18-Nov-2021 A17 REV-brf
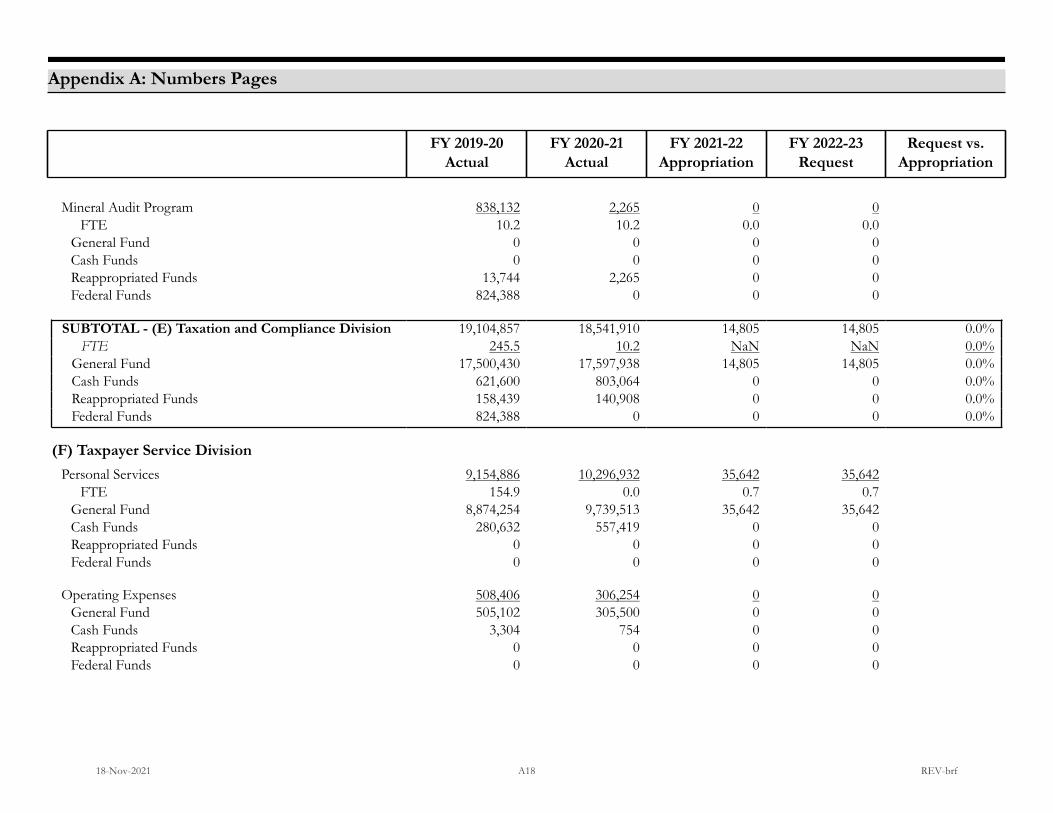
Appendix A: Numbers Pages
FY 2019-20Actual
FY 2020-21Actual
FY 2021-22Appropriation
FY 2022-23Request
Request vs.Appropriation
Mineral Audit Program 838,132 2,265 0 0FTE 10.2 10.2 0.0 0.0
General Fund 0 0 0 0Cash Funds 0 0 0 0Reappropriated Funds 13,744 2,265 0 0Federal Funds 824,388 0 0 0
SUBTOTAL - (E) Taxation and Compliance Division 19,104,857 18,541,910 14,805 14,805 0.0%FTE 245.5 10.2 NaN NaN 0.0%
General Fund 17,500,430 17,597,938 14,805 14,805 0.0%Cash Funds 621,600 803,064 0 0 0.0%Reappropriated Funds 158,439 140,908 0 0 0.0%Federal Funds 824,388 0 0 0 0.0%
(F) Taxpayer Service DivisionPersonal Services 9,154,886 10,296,932 35,642 35,642
FTE 154.9 0.0 0.7 0.7General Fund 8,874,254 9,739,513 35,642 35,642Cash Funds 280,632 557,419 0 0Reappropriated Funds 0 0 0 0Federal Funds 0 0 0 0
Operating Expenses 508,406 306,254 0 0General Fund 505,102 305,500 0 0Cash Funds 3,304 754 0 0Reappropriated Funds 0 0 0 0Federal Funds 0 0 0 0
18-Nov-2021 A18 REV-brf

Appendix A: Numbers Pages
FY 2019-20Actual
FY 2020-21Actual
FY 2021-22Appropriation
FY 2022-23Request
Request vs.Appropriation
Seasonal Tax Processing 296,391 296,391 0 0General Fund 296,391 296,391 0 0Cash Funds 0 0 0 0Reappropriated Funds 0 0 0 0Federal Funds 0 0 0 0
Document Management 5,260,588 4,855,832 0 0General Fund 5,260,588 4,855,832 0 0Cash Funds 0 0 0 0Reappropriated Funds 0 0 0 0Federal Funds 0 0 0 0
Fuel Tracking System 497,426 499,472 0 0FTE 1.5 1.5 0.0 0.0
General Fund 0 2,419 0 0Cash Funds 497,426 497,053 0 0Reappropriated Funds 0 0 0 0Federal Funds 0 0 0 0
Indirect Cost Assessment 8,674 9,603 0 0General Fund 0 0 0 0Cash Funds 8,674 9,603 0 0Reappropriated Funds 0 0 0 0Federal Funds 0 0 0 0
18-Nov-2021 A19 REV-brf
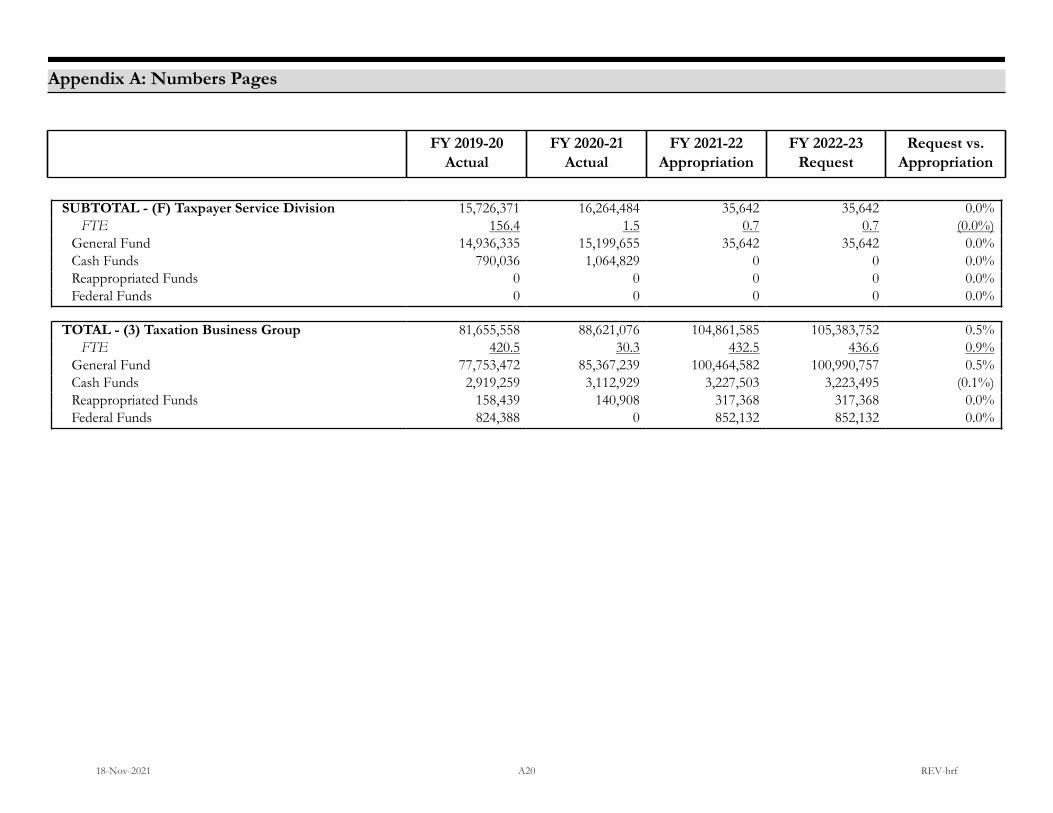
Appendix A: Numbers Pages
FY 2019-20Actual
FY 2020-21Actual
FY 2021-22Appropriation
FY 2022-23Request
Request vs.Appropriation
SUBTOTAL - (F) Taxpayer Service Division 15,726,371 16,264,484 35,642 35,642 0.0%FTE 156.4 1.5 0.7 0.7 (0.0%)
General Fund 14,936,335 15,199,655 35,642 35,642 0.0%Cash Funds 790,036 1,064,829 0 0 0.0%Reappropriated Funds 0 0 0 0 0.0%Federal Funds 0 0 0 0 0.0%
TOTAL - (3) Taxation Business Group 81,655,558 88,621,076 104,861,585 105,383,752 0.5%FTE 420.5 30.3 432.5 436.6 0.9%
General Fund 77,753,472 85,367,239 100,464,582 100,990,757 0.5%Cash Funds 2,919,259 3,112,929 3,227,503 3,223,495 (0.1%)Reappropriated Funds 158,439 140,908 317,368 317,368 0.0%Federal Funds 824,388 0 852,132 852,132 0.0%
18-Nov-2021 A20 REV-brf
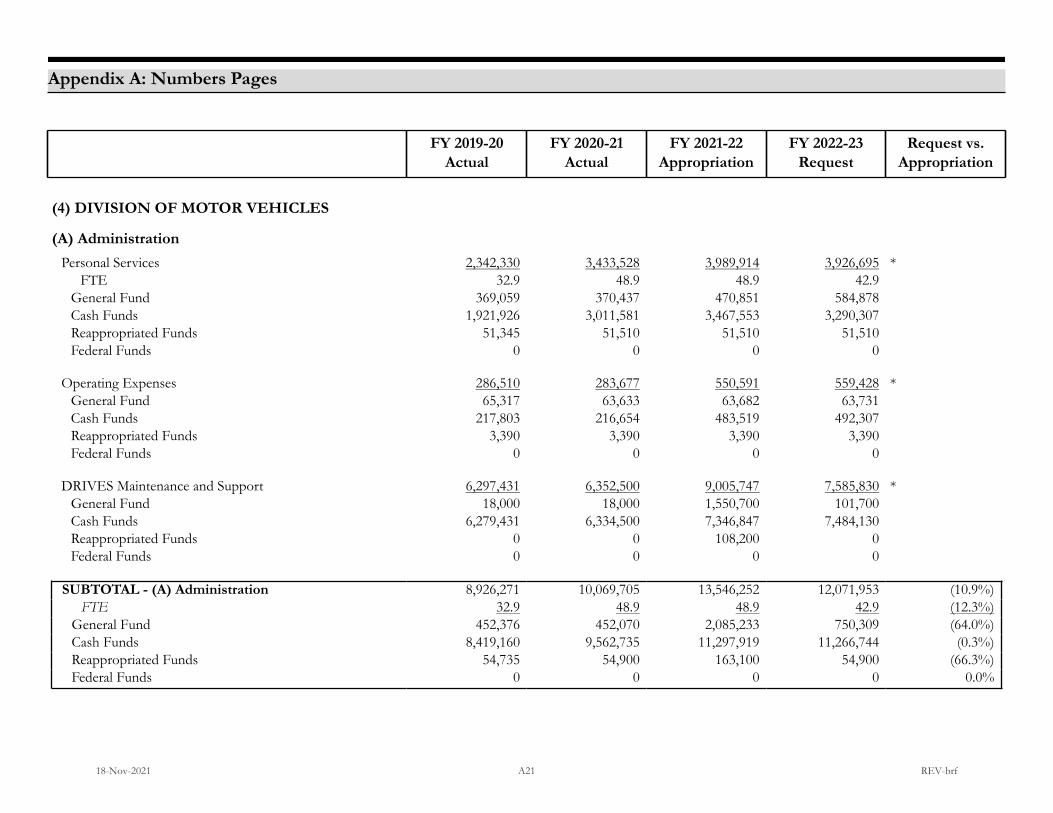
Appendix A: Numbers Pages
FY 2019-20Actual
FY 2020-21Actual
FY 2021-22Appropriation
FY 2022-23Request
Request vs.Appropriation
(4) DIVISION OF MOTOR VEHICLES
(A) AdministrationPersonal Services 2,342,330 3,433,528 3,989,914 3,926,695 *
FTE 32.9 48.9 48.9 42.9General Fund 369,059 370,437 470,851 584,878Cash Funds 1,921,926 3,011,581 3,467,553 3,290,307Reappropriated Funds 51,345 51,510 51,510 51,510Federal Funds 0 0 0 0
Operating Expenses 286,510 283,677 550,591 559,428 *General Fund 65,317 63,633 63,682 63,731Cash Funds 217,803 216,654 483,519 492,307Reappropriated Funds 3,390 3,390 3,390 3,390Federal Funds 0 0 0 0
DRIVES Maintenance and Support 6,297,431 6,352,500 9,005,747 7,585,830 *General Fund 18,000 18,000 1,550,700 101,700Cash Funds 6,279,431 6,334,500 7,346,847 7,484,130Reappropriated Funds 0 0 108,200 0Federal Funds 0 0 0 0
SUBTOTAL - (A) Administration 8,926,271 10,069,705 13,546,252 12,071,953 (10.9%)FTE 32.9 48.9 48.9 42.9 (12.3%)
General Fund 452,376 452,070 2,085,233 750,309 (64.0%)Cash Funds 8,419,160 9,562,735 11,297,919 11,266,744 (0.3%)Reappropriated Funds 54,735 54,900 163,100 54,900 (66.3%)Federal Funds 0 0 0 0 0.0%
18-Nov-2021 A21 REV-brf

Appendix A: Numbers Pages
FY 2019-20Actual
FY 2020-21Actual
FY 2021-22Appropriation
FY 2022-23Request
Request vs.Appropriation
(B) Driver ServicesPersonal Services 22,672,826 21,340,705 24,382,216 24,784,851 *
FTE 444.7 428.5 427.2 426.9General Fund 3,264,481 2,647,300 3,234,246 2,900,377Cash Funds 19,296,143 18,572,586 21,027,151 21,762,139Reappropriated Funds 112,202 120,819 120,819 122,335Federal Funds 0 0 0 0
Operating Expenses 2,310,816 1,472,558 3,465,126 2,538,299 *General Fund 411,155 411,155 1,524,707 414,260Cash Funds 1,889,491 1,051,233 1,930,249 2,113,869Reappropriated Funds 10,170 10,170 10,170 10,170Federal Funds 0 0 0 0
Drivers License Documents 5,656,874 5,648,165 6,415,955 7,109,465General Fund 0 0 3,498 3,498Cash Funds 5,656,874 5,648,165 6,412,457 7,105,967Reappropriated Funds 0 0 0 0Federal Funds 0 0 0 0
Ignition Interlock Program 598,476 589,878 669,106 682,567FTE 6.9 6.9 6.9 6.9
General Fund 0 0 0 0Cash Funds 598,476 589,878 669,106 682,567Reappropriated Funds 0 0 0 0Federal Funds 0 0 0 0
18-Nov-2021 A22 REV-brf

Appendix A: Numbers Pages
FY 2019-20Actual
FY 2020-21Actual
FY 2021-22Appropriation
FY 2022-23Request
Request vs.Appropriation
Indirect Cost Assessment 2,145,672 2,482,987 3,375,370 3,274,478General Fund 0 0 0 0Cash Funds 2,145,672 2,482,987 3,375,370 3,274,478Reappropriated Funds 0 0 0 0Federal Funds 0 0 0 0
SUBTOTAL - (B) Driver Services 33,384,664 31,534,293 38,307,773 38,389,660 0.2%FTE 451.6 435.4 434.1 433.8 (0.1%)
General Fund 3,675,636 3,058,455 4,762,451 3,318,135 (30.3%)Cash Funds 29,586,656 28,344,849 33,414,333 34,939,020 4.6%Reappropriated Funds 122,372 130,989 130,989 132,505 1.2%Federal Funds 0 0 0 0 0.0%
(C) Vehicle ServicesPersonal Services 2,723,524 2,560,101 2,534,289 2,962,604 *
FTE 56.7 46.6 46.6 50.5General Fund 483,164 502,180 611,006 626,188Cash Funds 2,240,360 2,057,921 1,923,283 2,336,416Reappropriated Funds 0 0 0 0Federal Funds 0 0 0 0
Operating Expenses 18,597,061 202,582 1,292,845 401,040 *General Fund 26,157 26,157 941,257 40,987Cash Funds 18,570,904 176,425 351,588 360,053Reappropriated Funds 0 0 0 0Federal Funds 0 0 0 0
18-Nov-2021 A23 REV-brf

Appendix A: Numbers Pages
FY 2019-20Actual
FY 2020-21Actual
FY 2021-22Appropriation
FY 2022-23Request
Request vs.Appropriation
License Plate Ordering 6,067,808 5,270,486 7,104,477 7,326,372General Fund 216,315 216,315 610,468 216,315Cash Funds 5,851,493 5,054,171 6,494,009 7,110,057Reappropriated Funds 0 0 0 0Federal Funds 0 0 0 0
Motorist Insurance Identification Database Program 314,539 252,287 342,443 344,394FTE 1.0 1.0 1.0 1.0
General Fund 0 0 0 0Cash Funds 314,539 252,287 342,443 344,394Reappropriated Funds 0 0 0 0Federal Funds 0 0 0 0
Emissions Program 1,284,372 1,082,814 1,172,261 1,201,525FTE 15.0 15.0 15.0 15.0
General Fund 0 0 0 0Cash Funds 1,284,372 1,082,814 1,172,261 1,201,525Reappropriated Funds 0 0 0 0Federal Funds 0 0 0 0
Indirect Cost Assessment 380,561 423,381 446,295 454,537General Fund 0 0 0 0Cash Funds 380,561 423,381 446,295 454,537Reappropriated Funds 0 0 0 0Federal Funds 0 0 0 0
18-Nov-2021 A24 REV-brf

Appendix A: Numbers Pages
FY 2019-20Actual
FY 2020-21Actual
FY 2021-22Appropriation
FY 2022-23Request
Request vs.Appropriation
SUBTOTAL - (C) Vehicle Services 29,367,865 9,791,651 12,892,610 12,690,472 (1.6%)FTE 72.7 62.6 62.6 66.5 6.2%
General Fund 725,636 744,652 2,162,731 883,490 (59.1%)Cash Funds 28,642,229 9,046,999 10,729,879 11,806,982 10.0%Reappropriated Funds 0 0 0 0 0.0%Federal Funds 0 0 0 0 0.0%
(D) County Support ServicesOperating Expenses 0 0 2,356,535 2,356,535
General Fund 0 0 0 0Cash Funds 0 0 2,356,535 2,356,535Reappropriated Funds 0 0 0 0Federal Funds 0 0 0 0
County Office Asset Maintenance 0 0 511,430 511,430General Fund 0 0 0 0Cash Funds 0 0 511,430 511,430Reappropriated Funds 0 0 0 0Federal Funds 0 0 0 0
County Office Improvements 0 0 36,000 36,000General Fund 0 0 0 0Cash Funds 0 0 36,000 36,000Reappropriated Funds 0 0 0 0Federal Funds 0 0 0 0
18-Nov-2021 A25 REV-brf
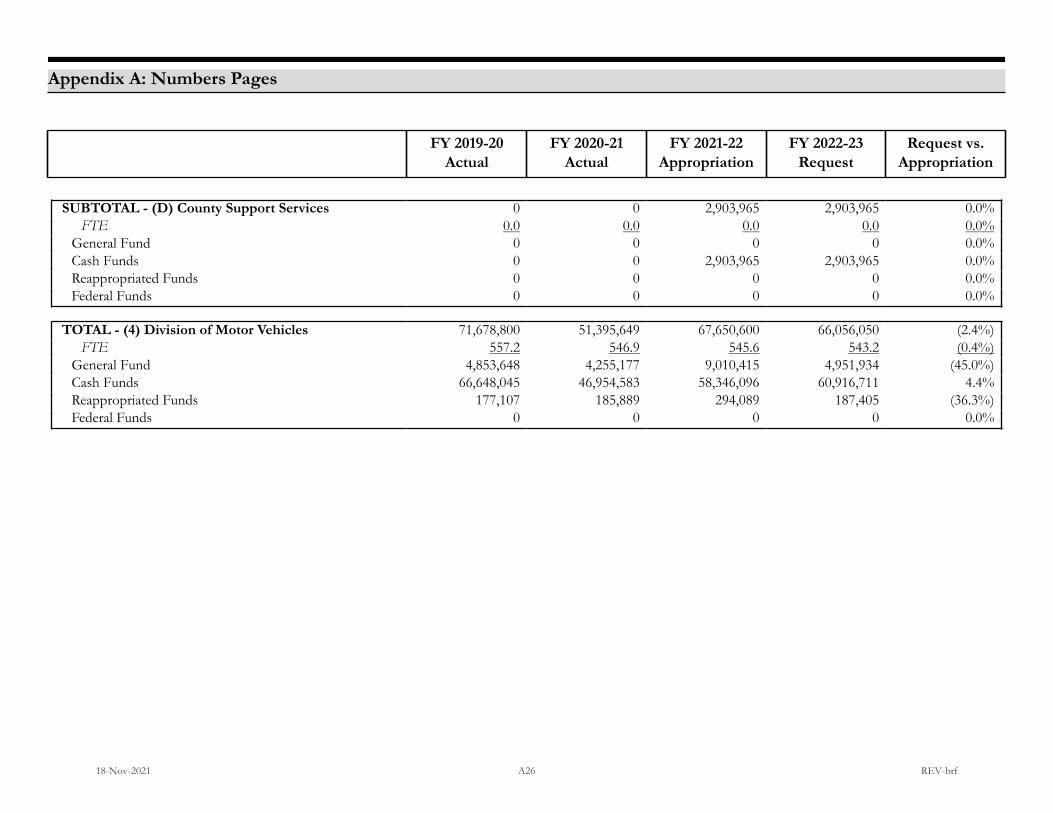
Appendix A: Numbers Pages
FY 2019-20Actual
FY 2020-21Actual
FY 2021-22Appropriation
FY 2022-23Request
Request vs.Appropriation
SUBTOTAL - (D) County Support Services 0 0 2,903,965 2,903,965 0.0%FTE 0.0 0.0 0.0 0.0 0.0%
General Fund 0 0 0 0 0.0%Cash Funds 0 0 2,903,965 2,903,965 0.0%Reappropriated Funds 0 0 0 0 0.0%Federal Funds 0 0 0 0 0.0%
TOTAL - (4) Division of Motor Vehicles 71,678,800 51,395,649 67,650,600 66,056,050 (2.4%)FTE 557.2 546.9 545.6 543.2 (0.4%)
General Fund 4,853,648 4,255,177 9,010,415 4,951,934 (45.0%)Cash Funds 66,648,045 46,954,583 58,346,096 60,916,711 4.4%Reappropriated Funds 177,107 185,889 294,089 187,405 (36.3%)Federal Funds 0 0 0 0 0.0%
18-Nov-2021 A26 REV-brf

Appendix A: Numbers Pages
FY 2019-20Actual
FY 2020-21Actual
FY 2021-22Appropriation
FY 2022-23Request
Request vs.Appropriation
(5) SPECIALIZED BUSINESS GROUP
(A) AdministrationPersonal Services 833,900 651,842 1,098,437 1,119,913
FTE 10.5 11.0 11.0 11.0General Fund 7,524 7,694 7,694 7,871Cash Funds 550,144 414,972 761,114 782,413Reappropriated Funds 276,232 229,176 329,629 329,629Federal Funds 0 0 0 0
Operating Expenses 9,414 4,124 13,934 13,934General Fund 111 111 111 111Cash Funds 6,803 2,710 8,885 8,885Reappropriated Funds 2,500 1,303 4,938 4,938Federal Funds 0 0 0 0
SUBTOTAL - (A) Administration 843,314 655,966 1,112,371 1,133,847 1.9%FTE 10.5 11.0 11.0 11.0 0.0%
General Fund 7,635 7,805 7,805 7,982 2.3%Cash Funds 556,947 417,682 769,999 791,298 2.8%Reappropriated Funds 278,732 230,479 334,567 334,567 0.0%Federal Funds 0 0 0 0 0.0%
18-Nov-2021 A27 REV-brf

Appendix A: Numbers Pages
FY 2019-20Actual
FY 2020-21Actual
FY 2021-22Appropriation
FY 2022-23Request
Request vs.Appropriation
(B) Limited Gaming DivisionPersonal Services 8,247,537 7,969,273 8,904,849 9,096,251
FTE 99.3 106.0 106.0 106.0General Fund 712,021 0 0 0Cash Funds 7,535,516 7,969,273 8,904,849 9,096,251Reappropriated Funds 0 0 0 0Federal Funds 0 0 0 0
Operating Expenses 924,467 615,706 1,131,445 1,130,731General Fund 219,838 0 0 0Cash Funds 704,629 615,706 1,131,445 1,130,731Reappropriated Funds 0 0 0 0Federal Funds 0 0 0 0
Payments to Other State Agencies 4,663,576 4,316,731 4,936,279 4,936,279General Fund 0 0 0 0Cash Funds 4,663,576 4,316,731 4,936,279 4,936,279Reappropriated Funds 0 0 0 0Federal Funds 0 0 0 0
Distribution to Gaming Cities and Counties 66,187,496 107,005,904 23,788,902 23,788,902General Fund 0 0 0 0Cash Funds 66,187,496 107,005,904 23,788,902 23,788,902Reappropriated Funds 0 0 0 0Federal Funds 0 0 0 0
18-Nov-2021 A28 REV-brf
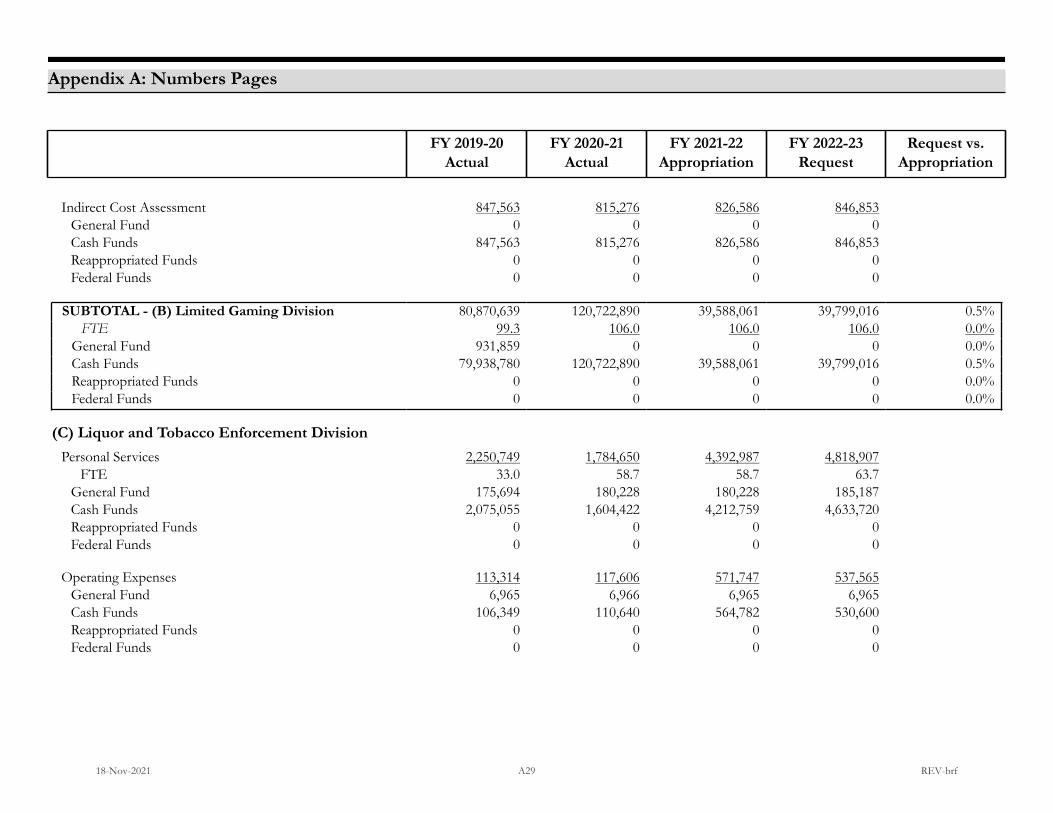
Appendix A: Numbers Pages
FY 2019-20Actual
FY 2020-21Actual
FY 2021-22Appropriation
FY 2022-23Request
Request vs.Appropriation
Indirect Cost Assessment 847,563 815,276 826,586 846,853General Fund 0 0 0 0Cash Funds 847,563 815,276 826,586 846,853Reappropriated Funds 0 0 0 0Federal Funds 0 0 0 0
SUBTOTAL - (B) Limited Gaming Division 80,870,639 120,722,890 39,588,061 39,799,016 0.5%FTE 99.3 106.0 106.0 106.0 0.0%
General Fund 931,859 0 0 0 0.0%Cash Funds 79,938,780 120,722,890 39,588,061 39,799,016 0.5%Reappropriated Funds 0 0 0 0 0.0%Federal Funds 0 0 0 0 0.0%
(C) Liquor and Tobacco Enforcement DivisionPersonal Services 2,250,749 1,784,650 4,392,987 4,818,907
FTE 33.0 58.7 58.7 63.7General Fund 175,694 180,228 180,228 185,187Cash Funds 2,075,055 1,604,422 4,212,759 4,633,720Reappropriated Funds 0 0 0 0Federal Funds 0 0 0 0
Operating Expenses 113,314 117,606 571,747 537,565General Fund 6,965 6,966 6,965 6,965Cash Funds 106,349 110,640 564,782 530,600Reappropriated Funds 0 0 0 0Federal Funds 0 0 0 0
18-Nov-2021 A29 REV-brf
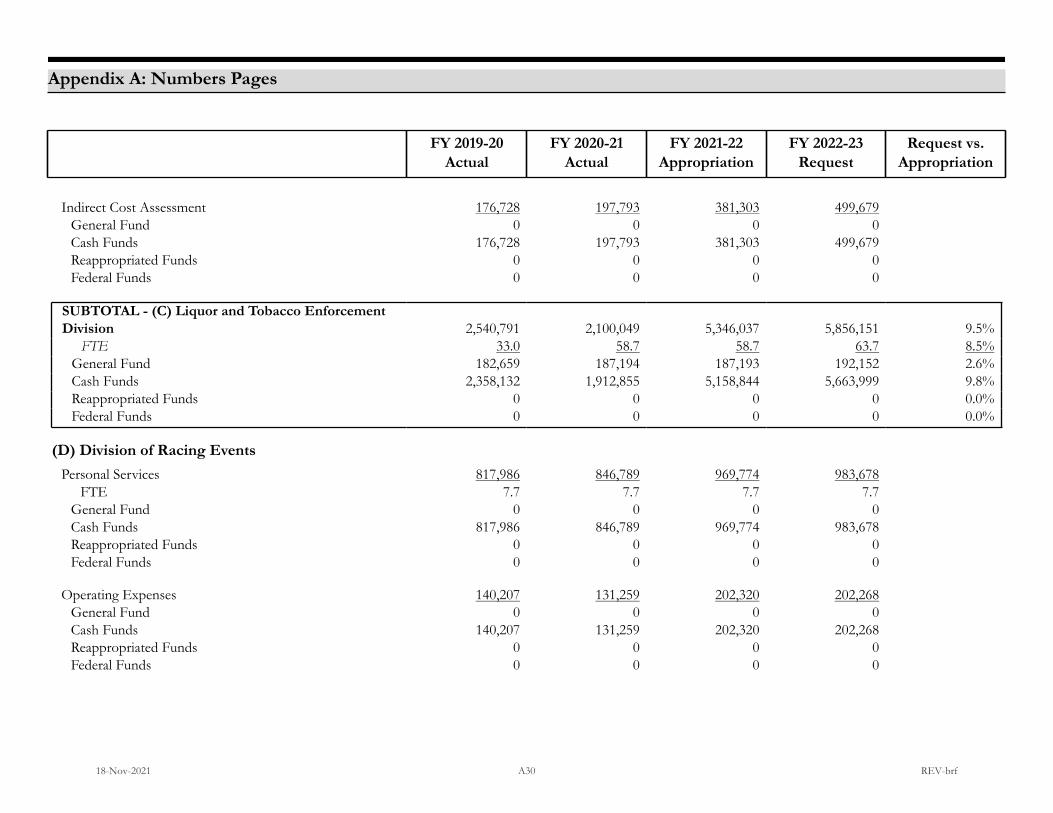
Appendix A: Numbers Pages
FY 2019-20Actual
FY 2020-21Actual
FY 2021-22Appropriation
FY 2022-23Request
Request vs.Appropriation
Indirect Cost Assessment 176,728 197,793 381,303 499,679General Fund 0 0 0 0Cash Funds 176,728 197,793 381,303 499,679Reappropriated Funds 0 0 0 0Federal Funds 0 0 0 0
SUBTOTAL - (C) Liquor and Tobacco EnforcementDivision 2,540,791 2,100,049 5,346,037 5,856,151 9.5%
FTE 33.0 58.7 58.7 63.7 8.5%General Fund 182,659 187,194 187,193 192,152 2.6%Cash Funds 2,358,132 1,912,855 5,158,844 5,663,999 9.8%Reappropriated Funds 0 0 0 0 0.0%Federal Funds 0 0 0 0 0.0%
(D) Division of Racing EventsPersonal Services 817,986 846,789 969,774 983,678
FTE 7.7 7.7 7.7 7.7General Fund 0 0 0 0Cash Funds 817,986 846,789 969,774 983,678Reappropriated Funds 0 0 0 0Federal Funds 0 0 0 0
Operating Expenses 140,207 131,259 202,320 202,268General Fund 0 0 0 0Cash Funds 140,207 131,259 202,320 202,268Reappropriated Funds 0 0 0 0Federal Funds 0 0 0 0
18-Nov-2021 A30 REV-brf
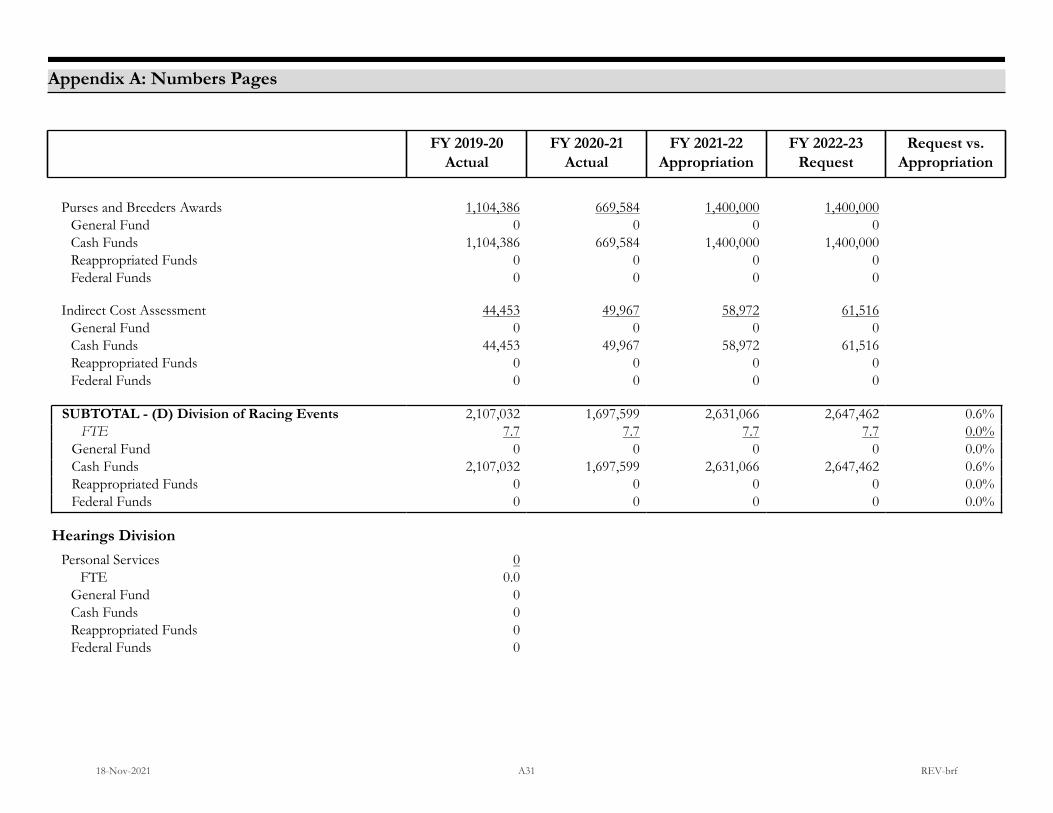
Appendix A: Numbers Pages
FY 2019-20Actual
FY 2020-21Actual
FY 2021-22Appropriation
FY 2022-23Request
Request vs.Appropriation
Purses and Breeders Awards 1,104,386 669,584 1,400,000 1,400,000General Fund 0 0 0 0Cash Funds 1,104,386 669,584 1,400,000 1,400,000Reappropriated Funds 0 0 0 0Federal Funds 0 0 0 0
Indirect Cost Assessment 44,453 49,967 58,972 61,516General Fund 0 0 0 0Cash Funds 44,453 49,967 58,972 61,516Reappropriated Funds 0 0 0 0Federal Funds 0 0 0 0
SUBTOTAL - (D) Division of Racing Events 2,107,032 1,697,599 2,631,066 2,647,462 0.6%FTE 7.7 7.7 7.7 7.7 0.0%
General Fund 0 0 0 0 0.0%Cash Funds 2,107,032 1,697,599 2,631,066 2,647,462 0.6%Reappropriated Funds 0 0 0 0 0.0%Federal Funds 0 0 0 0 0.0%
Hearings DivisionPersonal Services 0
FTE 0.0General Fund 0Cash Funds 0Reappropriated Funds 0Federal Funds 0
18-Nov-2021 A31 REV-brf
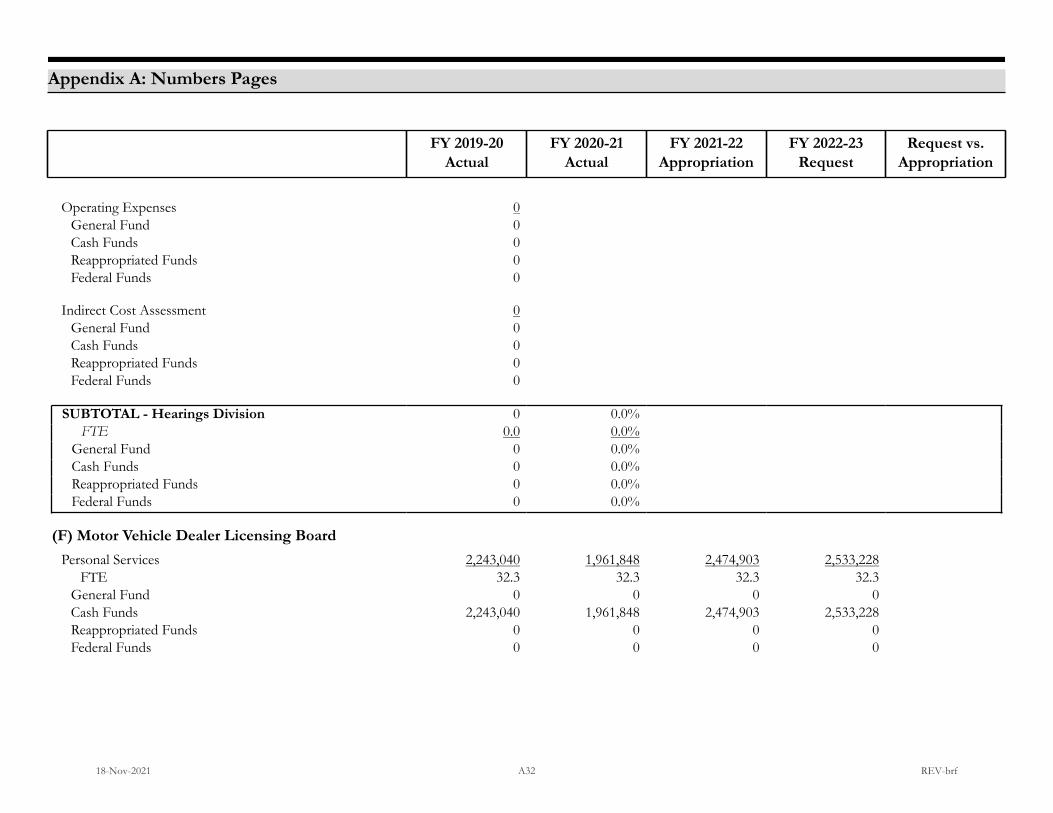
Appendix A: Numbers Pages
FY 2019-20Actual
FY 2020-21Actual
FY 2021-22Appropriation
FY 2022-23Request
Request vs.Appropriation
Operating Expenses 0General Fund 0Cash Funds 0Reappropriated Funds 0Federal Funds 0
Indirect Cost Assessment 0General Fund 0Cash Funds 0Reappropriated Funds 0Federal Funds 0
SUBTOTAL - Hearings Division 0 0.0%FTE 0.0 0.0%
General Fund 0 0.0%Cash Funds 0 0.0%Reappropriated Funds 0 0.0%Federal Funds 0 0.0%
(F) Motor Vehicle Dealer Licensing BoardPersonal Services 2,243,040 1,961,848 2,474,903 2,533,228
FTE 32.3 32.3 32.3 32.3General Fund 0 0 0 0Cash Funds 2,243,040 1,961,848 2,474,903 2,533,228Reappropriated Funds 0 0 0 0Federal Funds 0 0 0 0
18-Nov-2021 A32 REV-brf

Appendix A: Numbers Pages
FY 2019-20Actual
FY 2020-21Actual
FY 2021-22Appropriation
FY 2022-23Request
Request vs.Appropriation
Operating Expenses 116,351 194,055 325,887 325,670General Fund 0 0 0 0Cash Funds 116,351 194,055 325,887 325,670Reappropriated Funds 0 0 0 0Federal Funds 0 0 0 0
Indirect Cost Assessment 186,486 209,603 247,372 258,051General Fund 0 0 0 0Cash Funds 186,486 209,603 247,372 258,051Reappropriated Funds 0 0 0 0Federal Funds 0 0 0 0
SUBTOTAL - (F) Motor Vehicle Dealer LicensingBoard 2,545,877 2,365,506 3,048,162 3,116,949 2.3%
FTE 32.3 32.3 32.3 32.3 0.0%General Fund 0 0 0 0 0.0%Cash Funds 2,545,877 2,365,506 3,048,162 3,116,949 2.3%Reappropriated Funds 0 0 0 0 0.0%Federal Funds 0 0 0 0 0.0%
(G) Marijuana EnforcementMarijuana Enforcement 12,587,665 10,773,174 15,275,137 15,513,120
FTE 133.8 152.0 152.0 153.1General Fund 0 0 0 0Cash Funds 12,587,665 10,773,174 15,275,137 15,513,120Reappropriated Funds 0 0 0 0Federal Funds 0 0 0 0
18-Nov-2021 A33 REV-brf

Appendix A: Numbers Pages
FY 2019-20Actual
FY 2020-21Actual
FY 2021-22Appropriation
FY 2022-23Request
Request vs.Appropriation
Transfers to Other Departments 0 1,336,719 200,991 200,991General Fund 0 0 0 0Cash Funds 0 1,336,719 200,991 200,991Reappropriated Funds 0 0 0 0Federal Funds 0 0 0 0
Indirect Cost Assessment 706,911 862,812 1,202,172 1,361,951General Fund 0 0 0 0Cash Funds 706,911 862,812 1,202,172 1,361,951Reappropriated Funds 0 0 0 0Federal Funds 0 0 0 0
SUBTOTAL - (G) Marijuana Enforcement 13,294,576 12,972,705 16,678,300 17,076,062 2.4%FTE 133.8 152.0 152.0 153.1 0.7%
General Fund 0 0 0 0 0.0%Cash Funds 13,294,576 12,972,705 16,678,300 17,076,062 2.4%Reappropriated Funds 0 0 0 0 0.0%Federal Funds 0 0 0 0 0.0%
TOTAL - (5) Specialized Business Group 102,202,229 140,514,715 68,403,997 69,629,487 1.8%FTE 316.6 367.7 367.7 373.8 1.7%
General Fund 1,122,153 194,999 194,998 200,134 2.6%Cash Funds 100,801,344 140,089,237 67,874,432 69,094,786 1.8%Reappropriated Funds 278,732 230,479 334,567 334,567 0.0%Federal Funds 0 0 0 0 0.0%
18-Nov-2021 A34 REV-brf
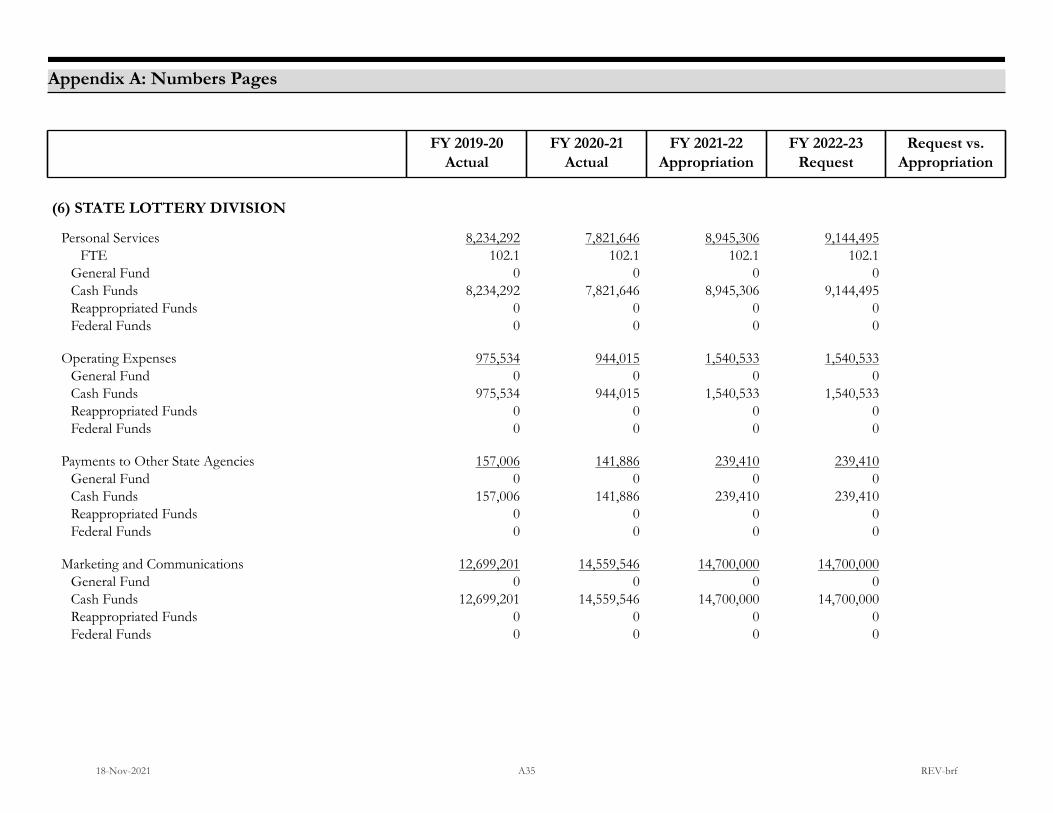
Appendix A: Numbers Pages
FY 2019-20Actual
FY 2020-21Actual
FY 2021-22Appropriation
FY 2022-23Request
Request vs.Appropriation
(6) STATE LOTTERY DIVISION
Personal Services 8,234,292 7,821,646 8,945,306 9,144,495FTE 102.1 102.1 102.1 102.1
General Fund 0 0 0 0Cash Funds 8,234,292 7,821,646 8,945,306 9,144,495Reappropriated Funds 0 0 0 0Federal Funds 0 0 0 0
Operating Expenses 975,534 944,015 1,540,533 1,540,533General Fund 0 0 0 0Cash Funds 975,534 944,015 1,540,533 1,540,533Reappropriated Funds 0 0 0 0Federal Funds 0 0 0 0
Payments to Other State Agencies 157,006 141,886 239,410 239,410General Fund 0 0 0 0Cash Funds 157,006 141,886 239,410 239,410Reappropriated Funds 0 0 0 0Federal Funds 0 0 0 0
Marketing and Communications 12,699,201 14,559,546 14,700,000 14,700,000General Fund 0 0 0 0Cash Funds 12,699,201 14,559,546 14,700,000 14,700,000Reappropriated Funds 0 0 0 0Federal Funds 0 0 0 0
18-Nov-2021 A35 REV-brf

Appendix A: Numbers Pages
FY 2019-20Actual
FY 2020-21Actual
FY 2021-22Appropriation
FY 2022-23Request
Request vs.Appropriation
Multi-State Lottery Fees 157,515 156,370 177,433 177,433General Fund 0 0 0 0Cash Funds 157,515 156,370 177,433 177,433Reappropriated Funds 0 0 0 0Federal Funds 0 0 0 0
Vendor Fees 12,650,591 15,418,546 26,123,699 27,757,019General Fund 0 0 0 0Cash Funds 12,650,591 15,418,546 26,123,699 27,757,019Reappropriated Funds 0 0 0 0Federal Funds 0 0 0 0
Retailer Compensation 49,968,974 61,103,090 60,845,933 65,856,304 *General Fund 0 0 0 0Cash Funds 49,968,974 61,103,090 60,845,933 65,856,304Reappropriated Funds 0 0 0 0Federal Funds 0 0 0 0
Indirect Cost Assessment 655,953 636,573 762,890 796,763General Fund 0 0 0 0Cash Funds 655,953 636,573 762,890 796,763Reappropriated Funds 0 0 0 0Federal Funds 0 0 0 0
Ticket Costs 3,808,623 4,537,165 0 0General Fund 0 0 0 0Cash Funds 3,808,623 4,537,165 0 0Reappropriated Funds 0 0 0 0Federal Funds 0 0 0 0
18-Nov-2021 A36 REV-brf

Appendix A: Numbers Pages
FY 2019-20Actual
FY 2020-21Actual
FY 2021-22Appropriation
FY 2022-23Request
Request vs.Appropriation
Travel 65,206 0 0 0General Fund 0 0 0 0Cash Funds 65,206 0 0 0Reappropriated Funds 0 0 0 0Federal Funds 0 0 0 0
Research 10,150 0 0 0General Fund 0 0 0 0Cash Funds 10,150 0 0 0Reappropriated Funds 0 0 0 0Federal Funds 0 0 0 0
TOTAL - (6) State Lottery Division 89,383,045 105,318,837 113,335,204 120,211,957 6.1%FTE 102.1 102.1 102.1 102.1 0.0%
General Fund 0 0 0 0 0.0%Cash Funds 89,383,045 105,318,837 113,335,204 120,211,957 6.1%Reappropriated Funds 0 0 0 0 0.0%Federal Funds 0 0 0 0 0.0%
TOTAL - Department of Revenue 423,028,315 468,032,287 429,718,882 448,511,238 4.4%FTE 1,564.9 1,225.0 1,626.2 1,661.1 2.1%
General Fund 120,244,260 125,051,993 141,512,775 143,614,470 1.5%Cash Funds 296,032,251 336,755,902 278,671,581 295,349,285 6.0%Reappropriated Funds 5,715,475 6,224,392 8,469,940 8,384,299 (1.0%)Federal Funds 1,036,329 0 1,064,586 1,163,184 9.3%
18-Nov-2021 A37 REV-brf

APPENDIX B FOOTNOTES AND INFORMATION REQUESTS
UPDATE ON LONG BILL FOOTNOTES
The General Assembly includes footnotes in the annual Long Bill to: (a) set forth purposes, conditions, or limitations on an item of appropriation; (b) explain assumptions used in determining a specific amount of an appropriation; or (c) express legislative intent relating to any appropriation. Footnotes to the 2020 Long Bill (H.B. 20-1360) can be found at the end of each departmental section of the bill at https://leg.colorado.gov/bills/HB20-1360. The Long Bill footnotes relevant to this document are listed below.
The Department had no footnotes in the FY 2021-22 Long Bill.
UPDATE ON LONG BILL REQUESTS FOR INFORMATION
The Joint Budget Committee annually submits requests for information to executive departments and the judicial branch via letters to the Governor, other elected officials, and the Chief Justice. Each request is associated with one or more specific Long Bill line item(s), and the requests have been prioritized by the Joint Budget Committee as required by Section 2-3-203 (3), C.R.S. Copies of these letters are included as an Appendix in the annual Appropriations Report (Appendix H in the FY 2021-22 Report):
https://leg.colorado.gov/sites/default/files/fy21-22apprept_0.pdf
All Departments -- Based on the Department's most recent available record, what is the FTE vacancy and turnover rate: (1) by department; (2) by division; (3) by program for programs with at least 20 FTE; and (4) by occupational class for classes that are located within a larger occupational group containing at least 20 FTE. To what does the Department attribute this turnover/vacancy experience? Do the statewide compensation policies or practices administered by the Department of Personnel help or hinder the department in addressing vacancy or turnover issues?
Comment: The Department submitted the report as requested. The Department had a point-in-time vacancy rate of 7% as of June 30, 2021, compared to the total appropriated FTE of 1,600. There were 215 separations out of 1,505 active employees, equating to a 13.5% turnover rate. Division, program, and occupational class data with at least 20 FTE is not currently available, but will be provided as soon as it becomes available. Highlights of the Department’s response include:
• The Department was not immune from the high turnover rates experienced during the COVID-19 pandemic. The following were the top reasons provided by departing staff for their separations:Accepted New Job Outside State System, Full Service Retirement, personal reasons.
18-Nov-2021 B1 REV-brf

• The following are the employee classifications with the highest turnover during FY 2020-21:Administrative Assistant II (32 Separations), Tax Examiner I (25 Separations), Technician II (24Separations), Administrative Assistant III (16 Separations), Criminal Investigator I (12Separations).
• The Divisions in DOR with the highest turnover for FY 2020-21: Taxation (105 separations),Motor Vehicle (69 separations)
For more information, see the Total Compensation Briefing document dated 11/15/21.
18-Nov-2021 B2 REV-brf

APPENDIX C DEPARTMENT ANNUAL PERFORMANCE REPORT
Pursuant to Section 2-7-205 (1)(b), C.R.S., the Department of Revenue is required to publish an Annual Performance Report for the previous fiscal year by November 1 of each year. This report is to include a summary of the Department’s performance plan and most recent performance evaluation for the designated fiscal year. In addition, pursuant to Section 2-7-204 (3)(a)(I), C.R.S., the Department is required to develop a Performance Plan and submit the plan for the current fiscal year to the Joint Budget Committee and appropriate Joint Committee of Reference by July 1 of each year. For consideration by the Joint Budget Committee in prioritizing the Department's FY 2022-23 budget request, the FY 2020-21 Annual Performance Report and the FY 2021-22 Performance Plan can be found at the following link: https://www.colorado.gov/pacific/performancemanagement/department-performance-plans
18-Nov-2021 C1 REV-brf