starbuck´s brand effects - distinguishing unconscious
TRANSCRIPT

Starbuck´s brand effects
- distinguishing unconscious ´wanting`
and conscious liking in consumers’
choice of coffee brand A consumer behavioral study based on marketing and consumer neuroscientific measuring methods
Student: Imane Bouzidi Cpr.nr: xx.xx.xx.-xxxx
Cand.Merc.IMM ( International Marketing and Management)
Master´s thesis
Supervisor: Thomas Zöga Ramsøy
Department: Decision
Neuroscience Research Group
(DNRG).
Hand in date: 26th
of April - 2013
Number of characters: 175.536 Number of pages: 80

2
Abstract This thesis presents a behavioral and consumer neuroscientific analysis of how the Starbucks brand
affects the Danish consumer mindset. It specifically looks at how Danes relate to the Starbucks
brand in terms of their emotions and behaviors. The intention is first of all to explore the main
theoretical factors that have a general relation to brand effects on consumers and their motivations
leading to final coffee brand choice. Among several psychological brand aspects and consumer
neuroscientific theories, the main focus in this study is on two of the consumer´s motivational
systems: unconscious ´wanting` and conscious liking. The hypothesis being proposed throughout is
that the measurements of the Danish consumer´s pre-assumptions (liking) towards the brands will
be connected to their final brand choice. In addition to this, it is assumed that they will prefer the
taste (which points to liking) and consume more (which points to ´wanting`) of the high quality
coffee than of the low quality coffee, even though they are blind tested. Finally, based on their high
brand equity, diversity and popularity, it is expected that Starbucks will be the most highly
preferred brand among its Danish competitors. The findings derived from these results serve as a
supplement to the theoretical foundation of the hypotheses. These are tested in an experimental
coffee tasting set-up in Copenhagen Business School, Solbjerg plads. The structuring of the
experiment process and the subsequent analysis is primarily based on the marketing consumer-
based-brand-equity model, the neuroscientific value-based model of choice and finally an integrated
´wanting` and liking perspective. The test was conducted on 122 randomly chosen participants, age:
20-40, living in Denmark and equally distributed between male and female. The respondents were
asked to taste four different brands; Starbucks, Baresso, Ricco and Waynes. The branded coffee
samples did not contain coffee from the original suppliers. It contained two different qualities of
coffee, a high and a low, sponsored by the supplier ´Kontra`. In the first part of the experiment, the
respondents were exposed to a chronological order where the brands contained: Starbucks: High
quality, Baresso; High quality, Ricco; Low quality and Waynes; Low quality. In the second part, the
qualities were reversed in order to optimize the statistical results.
Overall, the findings demonstrated that the Starbucks brand had a high positive effect on the Danish
consumer´s taste experiences, amount of consumed coffee and on measurements of how well they
liked the taste. Compared with the competitors: Baresso, Ricco and Waynes, the Starbucks brand
had a very strong positive bond to the Danish consumers and was associated with several positive
statements.
3
Authors´ acknowledgement While I take full responsibility for the content of this thesis, it must be said that it could not have
been written without the blessings from God and the help and support of numerous people.
I would therefore particularly like to thank my incredible mother Aziza Elhasni and father Ahmed
Bouzidi for standing by me with their unlimited support and understanding throughout my whole
educational process. Specifically these last 7 months which have been a long trip full of new
knowledge, excitement and personal development.
Equally, I’d like to thank my brothers who made me smile every day, visited me on campus and
were forced to listen to my never-ending consumer neuroscientific discussions. Also, a great thanks
to my grandmother who humbly backed me up in hard times, and my grandfather, an honorable
man, who inspired me to always seek knowledge. He would have been proud. Finally, thanks to the
big family (aunts, uncles and cousins) for supporting and encouraging me.
This thesis is dedicated to all of you.
Also, I would like to send thanks to my advisor and manager, Neuroscientist Thomas Zoëga
Ramsøy for being a source of inspiration and for his advice and professional guidance throughout.
Thanks also go to the specialists Martin Skov and Dalia Bagdziunaite for their inspiring consumer
discussions and to all of the Decision Neuroscience Research group members for sharing their
knowledge and experience.
Also big thanks to the coffee consultant Morten Münchow for his friendly assistance and to the
supplier Kontra for their great energy and service and for delivering all sponsored items and
equipment required for the experiment –you guys played an important role.
Finally, thanks and appreciation to Fida Amjad for his professional photos, Jamal Mir for assisting
me on the thesis video trailer, Amnah Sharif and Merve Altintas for giving constructive feedback,
Mariam Mai for designing the process sketches and Carina Linea for her artful front-page drawing.

4
Table of Content
Abstract ............................................................................................................................................................. 2
Authors´ acknowledgement .............................................................................................................................. 3
1. Introduction ................................................................................................................................................... 5
1.5 Concept definition and research question .............................................................................................. 9
2. Starbucks ..................................................................................................................................................... 12
3. Theoretical approach, Part 1: The articulation of brand effects on consumers ......................................... 20
3.1 Consumer motivation systems .............................................................................................................. 20
3.2 The concept of a brand and human needs as a motivation factor ....................................................... 21
3.3 Brand equity .......................................................................................................................................... 22
3.4 Associations and consumer based brand equity (CBBE) ....................................................................... 23
3.5 Brand associations from a mental box .................................................................................................. 25
3.6 Non-conscious decision-making ............................................................................................................ 25
4. Theoretical approach, part 2: Consumer neuroscience .............................................................................. 27
4.1 Consciousness and unconsciousness ..................................................................................................... 27
4.2 The decision making process ................................................................................................................. 28
4.3 Framing .................................................................................................................................................. 28
4.4 Value-based-model of choice ................................................................................................................ 29
4.5 The reward system ................................................................................................................................ 32
4.6 Noticeable brain systems in consumer choice, ´wanting` and liking .................................................... 37
5. Research design ........................................................................................................................................... 41
6. Test results................................................................................................................................................... 51
7. Result discussion .......................................................................................................................................... 58
8. Analysis, part 1: Exploring the findings ....................................................................................................... 64
9. Analysis, part 2: Measuring the effects of how consumers perceive and relate to the Starbucks brand... 71
10. Discussion, from a marketing perspective ................................................................................................ 76
11. Conclusion ................................................................................................................................................. 80
12. Where do the coffee suppliers go from here ............................................................................................ 82
13. References ................................................................................................................................................. 84
14. Appendices ................................................................................................................................................ 92
5
“Brands must “establish emotional ties”. The people who line up for Starbucks, aren´t there just for the
coffee. “It´s the romance of the coffee experience, the feeling of warmth.” (Klein, 2009 p.20)
1. Introduction
1.1 Foreword to the study
Coffee drinking is an old and well-known tradition observed in the everyday life of almost every
person. Typically, this ritual helps connect people, create a cozy atmosphere or just give you a boost
in the morning. Coffee started out as a drink one enjoyed during breaks from a hard days’s
work. Over time, the concept of coffee and its associations has developed dramatically. Nowadays
coffee is associated with expensive trips to cafés, to-go coffee, cold coffee drinks found in the
supermarket, latte, Macchiato, Frappuchino and others. The list is endless. Increasingly, smaller as
well as more mainstream coffee shops like, for example, Starbucks and Costa coffee are opening
around the world.
With the explosion of mainstream coffee shops – one might wonder: What actually influences
coffee drinkers’ taste experience and coffee choice? Is it the actual quality of the coffee, the coffee
flavor, the coffee brand, or a combination of all?
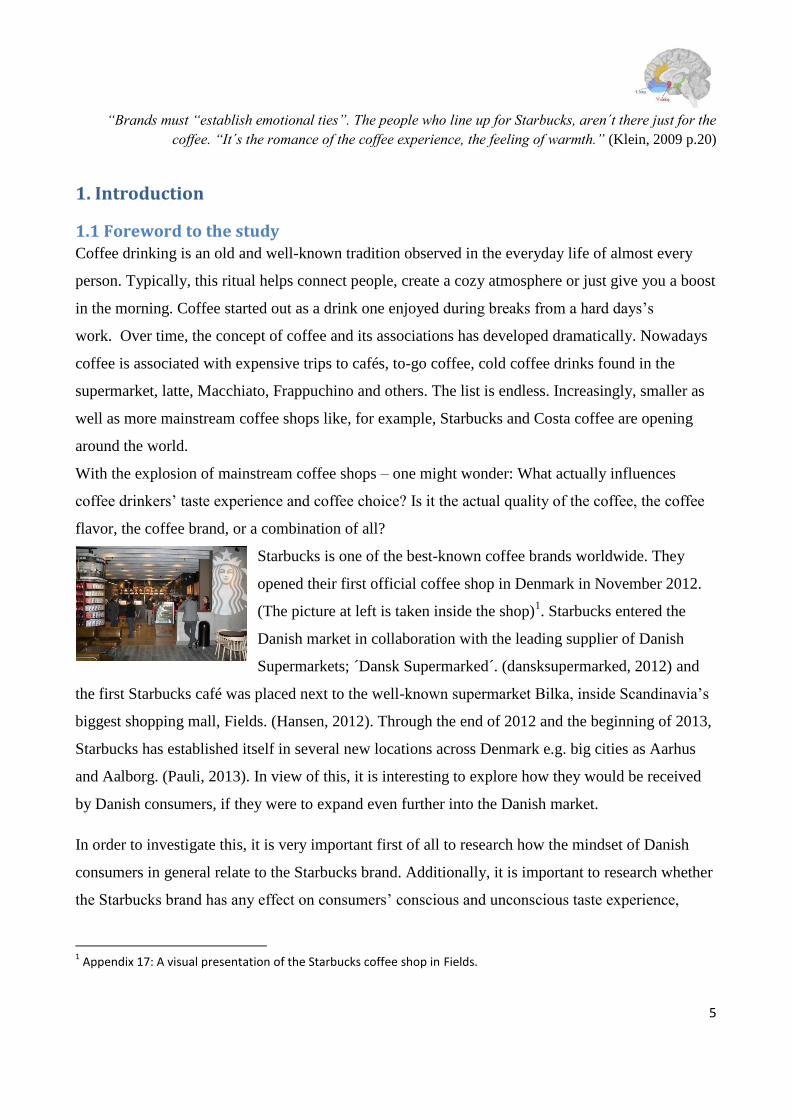
Starbucks is one of the best-known coffee brands worldwide. They
opened their first official coffee shop in Denmark in November 2012.
(The picture at left is taken inside the shop)1. Starbucks entered the
Danish market in collaboration with the leading supplier of Danish
Supermarkets; ´Dansk Supermarked´. (dansksupermarked, 2012) and
the first Starbucks café was placed next to the well-known supermarket Bilka, inside Scandinavia’s
biggest shopping mall, Fields. (Hansen, 2012). Through the end of 2012 and the beginning of 2013,
Starbucks has established itself in several new locations across Denmark e.g. big cities as Aarhus
and Aalborg. (Pauli, 2013). In view of this, it is interesting to explore how they would be received
by Danish consumers, if they were to expand even further into the Danish market.
In order to investigate this, it is very important first of all to research how the mindset of Danish
consumers in general relate to the Starbucks brand. Additionally, it is important to research whether
the Starbucks brand has any effect on consumers’ conscious and unconscious taste experience,
1 Appendix 17: A visual presentation of the Starbucks coffee shop in Fields.
6
brand perceptions, reaction patterns and choice behaviors. This requires a study of the elements
connected with Danish consumers’ motivation factors in relation to choice of coffee brand. Finally,
a comparison with other existing and more grounded Danish coffee chains must be explored to
research the choice patterns and to represent the several choice options consumers may have in real
life consumption situations.
Investigations such as these will offer a hint as to how successful the company will be in relation to
a general Danish brand acceptance and indicate whether or not Starbucks has a chance of winning
over Danish coffee drinkers in order to gain a successful market share. So in order to explore the
psychological and biological factors, that lead Danish consumers toward certain choice behaviors, a
scientific theory from consumer neuroscience and investigative research methods from marketing
will be applied.
This research will, however, not lead to conclusions regarding how successful Starbucks will be on
the market, as this requires deeper economic insights along with ideal strategic and organization
business information. This thesis will focus on exploring the Starbucks brand as it stands in the
minds of Danish consumers. Since Starbucks is a semi-new concept in Denmark, and the company
at this moment is making strategies of where and when to open upcoming stores, (Pauli,2013) the
timing of this thesis is very current and usable for market analysis at Starbucks, but also for the
competitors market strategies.
1.2 Background information to the area of research Recent developments in neuroscience, have made it clear that motivation can be conscious
(referring to the liking system) and unconscious (referring to the ´wanting` system), and that these
processes have distinct neural foundations. (Bargh, 2002). The unconscious ´wanting` system is
rooted in the brain’s basal ganglia functions and especially in the ventral striatum, while conscious
liking is thought to rely more on cortical processing, especially in the brain’s medial orbitofrontal
cortex. (Plassmann et al 2012; Ramsøy 2012, lec.5). Notably, the ´wanting` system is thought to be
inaccessible to subjective reports, yet have a strong and direct impact on actual choice behaviors.
Conversely, the subjective liking system is more related to experienced utility and reports of liking,
and provides another motivational force to actual choice behaviors.(Ramsøy 2012, lec.5)
7
While cognitive2 neuroimaging methods can provide means to study these systems, their impact on
behavior allows the employment of behavioral measures of ´wanting` and liking. These are two
different brain circuits effected by emotions meanwhile appearing as motivational driving forces in
consumer choice. To this end, one central aim of this paper is to test, in accordance with the
Starbucks brand effects, whether behavioral measures of ´wanting` – such as actual consumption –
is dissociable from measures of liking – such as subjective reports of experienced utility and final
choice. In this context liking will therefore refer to the pleasure derived from drinking a certain
coffee brand, whereas the ´wanting` refers to the appetitive motivation to drink. (Havermans et al,
2011).
Stimuli that typically trigger an imbalance between the liking and ´wanting` systems are e.g. brands.
Various theorists have defined "brand" as follows: a particular make of goods/products which are
produced in order to satisfy, motivate or stimulate the consumers’ basic needs through the
individual’s own creation of narratives and given values. The added values which the certain brand
stimulates require an understanding of the actual historic and cultural context. (A.H Moshlow,
(1970): John p. Jones, Chernatony and Riley, (1998): Holt, (2004): Mc – Craken (1886:2005)).
1.3 The brand oriented irrational consumer Traditional neo-classical economy is primarily based on the consumers being completely rational
and unemotional subjects in decision making. This indicates that consumers have established, well-
defined preferences and are able to make rational choices based on these preferences.(Polokangas,
2010; Camerer et al, 1995).
Consumer decision making and buying patterns seem to be determined by several factors other than
rational evaluations. The information model given in neo-classical economics can not explain why
e.g. expensive branded goods are chosen rather than similar goods without brand value -- choices
which are completely irrational. (Finn Nielsen et al.2005). To this date, many consumers believe
that they are rational consumers. Thaler et al 2009, refer to these consumers as homo economicus,
or economic man “The notion that each of us thinks and chooses unfailingly well.” (Thaler et al
2 Definition: Cognition: “the mental action or process of acquiring knowledge and understanding through thought,
experience, and the senses. [count noun] a perception, sensation, idea, or intuition resulting from the process of
cognition.”( Oxford Dictionary, online.)

8
2009, p. 6). An example of a typical irrational consumption is the consumption of coffee at
Starbucks, as its price, according to specialists, cannot be justified (Nielsen et al.2005; Schwaner-
Albright, 2008). Yet customers around the world gladly and continuously pay the price. This
example indicates that other factors than price are controlling consumers’ buying decisions and that,
overall, these consumers are in fact not rational.
McCraken (2005) explains these consumer choices as being effected by the surrounding culture. As
he states several times, products hold intangible benefits or meanings which can be transferred from
the product to the consumer. In this way the consumer uses the brand as a tool to construct his or
her own identity, (Finn Nielsen et al. 2005: McCraken 2005). By triggering the consumer’s
´emotions` and ´feelings`3 the brand values lead consumers to make irrational choices. In relation to
this, Bechara and Damasio state that changing “feelings”, in body and brain, can act as a
neurobiological mechanism to impact subjects’ decision-making. (Polokangas, 2010; Bechara et al
2005). Again, this indicates that brands are intangible tools motivating consumers to purchase
brands in order to experience emotional stimulation.
In contrast to classical economic theories, neuroscientific research has shown, that there appears to
be a role for emotions and subconscious processes in the decision-making, which leads to anomalies
in the expected behavior (Polokangas, 2010; Kenning el als 2005; Schmidt 2008). The constant
development in research produces better insights into, how the human decision process works. As a
result of this development the consumer has gone from being part of an information-economy to an
experience-based economy, where consumers search for self-promotion and individualization
(Jensen, 2006).
3 Appendix: 15 Defining emotions and feelings: Emotion: are physiological unconscious responses coping with objects
and situations that are potentially dangerous or advantageous.(Damasio, 2001). The same way stimulus can have a
conscious and unconscious effect on human mind so can emotions. Feelings are easier to measure, as they are
conscious, opposite to emotions which are body responses. Human uses feelings to e.g. express their state of mind
when evaluating a specific episode or before taking a certain action. Feelings and emotions are two different
motivation systems. (Bernard et al, 2010) In relation to this study, feelings are connected to the consumers conscious
liking whereas emotions are connected to their unconscious “wanting”.

9
1.4 Consumer neuroscience: an approach to explore brand effects Within the field of neuroscience, four main areas can be distinguished: Neuroeconomics, decision
neuroscience, consumer neuroscience and neuromarketing. The two research areas neuromarketing
and consumer neuroscience are very connected and often overlap each other. Neuromarketing
focuses on consumer relations while consumer neuroscience focuses on academic methods and
tools. (Hubert et al, 2008). For example, “One important contribution of consumer neuroscience is
the emphasis on emotions and their influence on consumer decision-making”. (Hubert et al, 2008
p.287). As on cognitive consumer behavior4, the applied theories will mainly be drawn from a
consumer neuroscience perspective.
In recent years, important factors which influence consumer decision making have been a highly
discussed and investigated subject. (Naqvi, 2006). This has been the case as marketers have been
interested in discovering new methods to increase consumer attention and consumption. The
methods marketers tend to use have therefore been developing along with the expanding knowledge
within neuroscience. “One of the studies in the field stated that brain processes information faster
than the conscious deliberations, hence these processes can generate behavior that does not follow
the normative behavior of human” (Camerer et al. 2005). This indicates that consumers are
unconsciously affected by ads and stimulus leading the consumer to want and maybe also purchase
something without he or she being aware of the primer motivation process. Brands are known to be
affective stimulus, as a large portion of what people do involves decisions about brands. Erik de
Plessis, refers to this as the life branding manifestation: Brands appear in everything humans do,
whether it is the clothes they wear, the products they eat and drink, the company they work for, or
the partner they marry (Plessis, Erik 2011). These decisions may seem very superficial, but whether
the use of brands take up in consumers own self-development of perceived image or they put in a
distance towards the brands, their presence has an influence on their behavior.
1.5 Concept definition and research question The overarching purpose of this study is to examine how Danish consumers` mindsets relate to the
international coffee brand Starbucks. This will be carried out by using marketing and consumer
neuroscientific theories and methods, which will facilitate an investigation of the notable
4 Definition: Russel W. Belk refers to Consumer behavior as “the object to which the consumer is directly responding
will be regarded as a unique source of behavioral influence.”(Belk, 2013 p. 158) He continuously divedes the process of consumer behavior in three steps: Situation or Object = Stimilus, Person= Organism and Behavior = Reponse.

10
motivational forces underlying Danish consumers’ choice behaviors in relation to conscious and
unconscious responses, that determine judgment and choice. To the best of my knowledge, this
thesis covers a theoretical research area, no studies have yet investigated, namely: The impact of
how consumers’ ´wanting` and liking system reacts in the context of consumer brand choices. Also
there have been no behavioral studies on, how different types of brand associations have an effect
on the consumers ´wanting` and liking for a brand. (Plassmann et al, 2012). Finally it was
discovered that no scientific research study has ever investigated consumer ´wanting` system by
exploring their amount of fluid-consumption. Based on this the research question is as follows:
How does the Danish consumers relate to the brand, Starbucks? Specifically, how does Starbucks
have an effect on Danish consumer´s unconscious and conscious motivation systems and
decision-making?
The research question has the following sub-questions:
How do coffee brands effect consumer taste experience?
Are consumers able to distinguish between the different flavors in coffee qualities? Or are
brands the main determinants of taste experience?
How does the Danish mindset relate to Starbucks compared to competitors?
How do the consumers´ conscious liking and unconscious ´wanting` system relate to
Starbucks?
1.6 Thesis model
1.7 Research limitations In order to carry out the research question dealing with two broad theoretical business worlds;
marketing and consumer neuroscience, it has been essential to incorporate many, theoretical,

11
methodological and empirical limitations. Any choice of method and focus has therefore meant ,that
other options have been sacrificed.
In the theoretical part, a detailed description of all the human needs will be omitted as only the
needs of self-articulation, are relevant in the context of consumer motivation, perception and brand
choice. A thorough theoretical explanation of decision-making will furthermore be omitted as the
theoretical focus will be on the theory of unconscious ´wanting` and conscious liking.
Furthermore, a presentation of how brands stimulate and affect consumers will be limited to
exploring two ´brand equity´ approaches by the leading strategic brand management scholars David
Aaker and Kevin Keller.
Continuously the motivational and unconscious elements that can be triggered leading up to a
decision-making will be explored using theorists Chartrand et al., while the overall behavior in a
choice situation will be addressed from a neurocognitive point of view and limited to theorists
Plassmann et al.
Within the scientific field of consumer neuroscience and consumer decision making many theories
are highly interconnected and overlapping. It is therefore necessary to further limit the explanations
of following subjects: memories, sights, emotions, feelings, the development of gestalts and
thoughts.5 Also, will the learning system from the reward pathways be omitted in the analysis as
this does not have a high contextual relation to the testing process.
In the methodological part, the research field will be limited to investigation and interpretation of
the chained and Danish coffee shop market. Because of the size of this project, the data will be
narrowed down to include only quantitative data obtained through the research questionnaire at
CBS, Copenhagen. Starbucks´ is mentioned only in reference to the immaterial brand equity
resources, the material resources like coffee products and accessories are therefore omitted.
In relation to the presented theory, the research methods used to explore the unconscious ´wanting`
and conscious liking will be restricted to marketing methods, whereas applied theory will be drawn
from consumer neuroscience. Throughout the study, an analysis of the affected biological brain
areas will be omitted. Similarly, a deep clarification and analysis of linkage between liking and
biological Opiods systems will be omitted as this is still a vague scientific area. Also, an analysis of
5 It will though be possible to find explanations of highly relevant subjects in, Appendix 15: A definition and
perspective of emotions, feelings, gestalts and thoughts.

12
the respondent’s physical-liking reactions will be omitted as this requires observations of e.g. facial
expressions etc.6 Furthermore a description of the respondents’ brand attachment and commitments
to all the brands will be omitted as the focus will be on their relation to Starbucks.
Finally, an analysis of the collected data will be limited to one type of statistical approach; this will
be a continuous comparison between all four presented brands.7
1.8 Possible research biases caused by limitations When designing the research process, there is always a chance of running into biased areas. In this
thesis a critical point of view has been taken into account, which is why the following biased areas
will be presented. Since the target group is set to represent the Danish consumer´s choice behaviors
and relations to the brand Starbucks, the generalization of the answers can be a bias as there was a
higher representation of respondents from 20-30 years old than 30-40 years old. Furthermore, the
set-up location had an effect on which type of respondents, that was accessible to the study. These
were primarily business students or business related people. Therefore it cannot be prevented, that
the results could have been different if collected on a different public place. As respondents were
typically students, a bias may be found in validity aspects. Given that students are often in a rush,
some may have answered the questionnaire too fast and too randomly, only to get a free coffee to
go. In the experiment process, the respondents were asked to taste the coffee samples from small
plastic cups only consuming a max of 50 cl. The small amount of poured coffee could have had an
effect on the ´wanting` results, as the respondents could have been prevented from leaving leftovers
if the respondents unconsciously connected the small cups with a need to empty them.
2. Starbucks
2.1 A brief look into the history of Starbucks and their business strategy In the early 1980s a small shop which specialized in coffee, tea and spices was founded. One of the
staff members was a man named Howard Schultz. He had a great interest in Italian beans and coffee
culture. As time passed Howard Schultz became convinced that specialty coffee and the special way
of consuming it had a chance of great success in America. His goal was to reach out to new
undiscovered customer groups by re-creating the Italian coffee culture in the US. His motivation
6 Appendix 1: Facial ´liking` characteristics across both mammals and humans
7 Further explanation of the statistical approach can be found in the validity section 5.6.

13
and innovative thinking formed the basis of the Starbucks concept. In 1985 Howard Schultz started
his own Starbucks shop and in 1986 the coffee firm had developed into a local phenomenon with a
great number of cafes in and around Seattle. (Klein, 2002). In 1987, he changed the company name
from “Starbucks, Coffee, tea and spices” to “Starbucks”. (Finn Nielsen, 2005). Hence, Starbucks
was born and a successful journey awaited.
Today (2013) Starbucks has around 17,000 stores in 55 countries and stands as the premier roaster
and retailer of specialty coffee in the world. (Starbucks.com). The highest number of stores is to be
found in the USA, while the least number of stores are placed in Scandinavia.
Source: The world wide Starbucks map shows the location of Starbucks cafes across the world.
Googlemapsmania.com
So far, Denmark has three Starbucks stores. Two placed at the Copenhagen airport and one which
recently opened in Scandinavia’s biggest shopping mall: Fields, Amager.
Before the first Starbucks opened in Fields, November 2012, many Danes had been familiar with
the brand from travelling abroad, viewing international media and product placements in a high
number of American TV shows and films. Starbucks Company has succeeded in becoming a strong
international coffee supplier. In addition, besides being a popular brand, Starbucks has also
succeeded in being integrated into and associated with a part of American culture.8
Their expansion strategy is based on aggressive clustering and “cannibalization” (Klein, 2002) as
they only enter areas, where they are certain to be the leaders. (Ibid). As a rule, they plan the actual
8
Appendix 2: Respondents Free association test. Notice how the research respondents several times associated
Starbucks with USA, America or American culture.
14
expansion time down to the moment, where they will be able to become the leading retailer and
coffee brand. They are therefore also being referred to”…as head lice in a kindergarten”. (Klein
2002, p.136). Their “cannibalization” strategy deals with filling an area with coffee shops until the
competition is so hard that sales start to decline. This diminishes the competitors’ chance of
survival. Furthermore, Starbucks is known for taking over profitable areas by finding a popular,
well-placed, independent café and pulling away the lease from under their feet. (Ibid). Different
literature shows, that there is a consensus around viewing Starbucks branding strategy as being
emotional. This means that they focus their marketing approaches towards stimulating the
consumer’s senses and emotions by e.g. music, scents, cozy atmosphere etc. This approach is one
major factor which lets them differentiate themselves among competitors in the coffee industry.
2.2 Starbucks: A differentiated brand Marketing specialists agree that if a business wants to be successful, then it must focus its energy on
producing brands instead of products. (Klein, 2002) - something which Starbucks has definitely
accomplished. Starbucks has managed to build a successful and recognized brand by focusing on
storytelling, coffee bean quality, shop environment, innovative coffees, etc. For example, something
as basic as the staff’s outfit rules has been managed strictly. It is well known, for instance, that the
staff is not allowed to wear any kind of perfume as it can interfere and compete with the
surrounding scent of coffee. (Ibid).
Their shops aren’t just non-room as walmart and McDonalds, it’s an intimate corner, where
sophisticated people can meet up and share “The coffee community…friendship…network? It’s not
shit to the masses, it’s intelligent furniture, it’s cosmetic as political activism, it’s the bookstore as a
real old library, it’s the café who is willing to look you straight in the eyes and connect with you”.
(Klein, 2002 p.136).
This statement indicates, what the goal of the brand is all about. By
specializing and differentiating their products, soundings and values they take
an ordinary product like ´a cup of coffee` and transform it into a spiritual
designer object. (Klein, 2002). For example, Starbucks was the innovator of
the famous iced coffee, Frappuccino (left picture). This creation was a
response to customer demands. (Grant 2010). This leads us to the slightly understanding of why
loyal Starbucks customers and brand loyal customers in general are willing to pay an unlimited

15
price. According to Michelli, 2007 Starbucks uses an emotional branding strategy as emotions are
the primary point of their strategy and the goal is to create an emotional relationship with the
customers. (Michelli, 2007). The Starbucks brand strategy is primarily based on “The Starbucks
experience” and “The five principles”. (Ibid). The Starbucks experience strives to give the
customers a special and theatrical experience by building a comfortable and inviting environment
for them to buy their coffee. Besides this, the five principles focus on creating a special coffee
experience by ensuring a good quality of beans and coffee procedure. (Ibid). The key to this is
creating a connection between the customers and the employees, who they refer to as partners.
Through this connection they are furthermore supposed to create an emotional relation, which in the
end leads the customer to brand attachment. (Finn Nielsen, 2006). Michelli 2007, states “The
connection is achieved by communication through firstly the employees and also the artifacts in the
coffee shop, such as design, music, the quality of the coffee and even down to the number of toilet
paper plies, as everything matters when expressing the wanted brand image”. (Michelli, 2007; Finn
Nielsen 2006 p. 7). In conjunction with this, the author Bedbury (2002), states about the Starbucks
success, that they have been able to focus all their extensions on the essential mantra: quality. This
is true of their choice of music, coffee menu, products sold etc. Lastly the scientist Park et al, 2006
gives further reasons why Starbucks can be highlighted as a good example of a successful brand.
The brand is built around a set of visually and pleasing atmosphere factors allowing the customer to
experience relaxation and self-indulgence. “This gesthetic/hedonic experience is supposed to gratify
the self and thus to evoke an emotional connection.” (Park et al, 2006; Finn Nielsen et al, 2005 p.8).
2.2.1 Table: Starbuck´s diversification model
The concept´s touch points Business areas
Logo design :
(Colorful, notable , easy to recognize
and remember)
Story telling:
CSR politics (Starbucks share planet,
Fair Trade Certified Coffee, Partnership
with Bono and Global Fund)
The Starbucks experience
- Coffee beans of high consistent quality.
- Employee involvement.
Figuring in the market of:
Owned Coffee bars (Primer target)
Licensed Stores (Primer target)
Distribution of Starbucks retail packs
to Detail (supermarket, specialized
stores, chains etc.)
Licensing of Starbucks brands to
PepsiCo and Unilever for the supply
of Starbucks bottled drinks.
Financial services, store card with
Visa Credit card.

16
- Community relations and social purpose.
- Every Starbucks is to adopt its unique
neighborhood in layout.
- Clustering of 20 or more stores in each
urban hub.
The 5 principles
Emotional strategy tactics
Environments:
Creative, modern and cozy shop interior.
Dominating coffee scent in shops
Arrangements fitted to consumer
segments. E.g. integrates study sections.
Products:
Innovative product range
Leaders within developing new drinks
Instant coffee, 2009 introduces new
instant coffee.
Merchandise (coffee accessories,
coffee machines etc.)
Coffee vans and outside sales (to
go´)
Online sales (Starbucks.com etc.)
Collaborations with tangible product
suppliers e.g. Tassimo coffee
machines etc.
Composed by the author of this thesis. Source :www.starbucks.com and Grant, Robert. M (2010). Contemporary
Strategy analysis. Seventh edition. Wiley.
2.3 Facing the challenge of maintaining a strong brand success With every success comes a challenge - a truth to which Starbucks can certainly testify. After 20
years of expansion and rising profits, Starbucks’ downturn was rapid and unexpected. (Grant,
2010). Even though the coffee chain had been growing with 20% a year during their best times
(Bonamici & Fortune, 2004) the corporation experienced, how changes turned against them.
In the early 2000s they experienced a tendency of customers deselecting and
avoiding Starbucks. (Thompson et al,2006: Thompson, 2004) and in October
2006, their share price had declined by more than 75%. (Grant, 2010).
Customers began to express their negative political attitudes towards the
corporation, claiming, for example, that Starbucks supported the Israeli
military. Starbucks of course denied this claim and wrote an official message on their website.
(www.starbucks.com). For the corporation, this led to a struggle with maintaining the brand´s
trustworthiness, meanwhile fighting to uphold their focus on the business strategy. In the summer
2008, the owner had announced the closure of 600 U.S stores. (Grant, 2010).
17
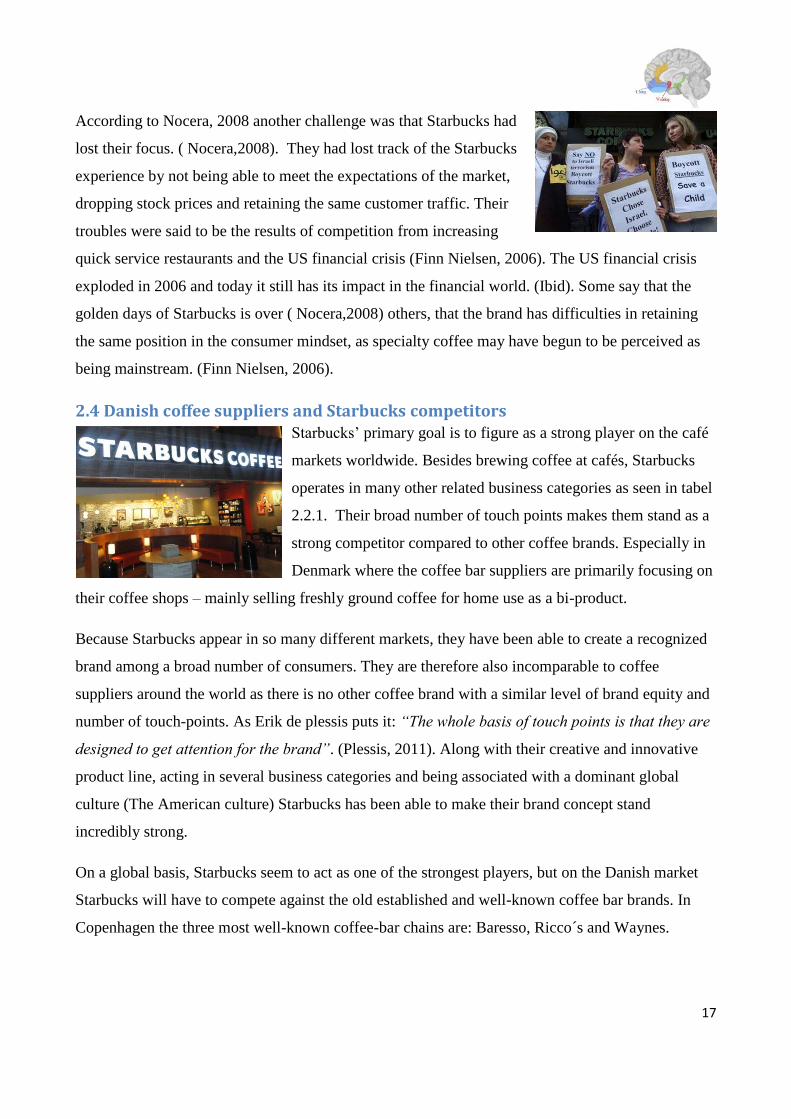
According to Nocera, 2008 another challenge was that Starbucks had
lost their focus. ( Nocera,2008). They had lost track of the Starbucks
experience by not being able to meet the expectations of the market,
dropping stock prices and retaining the same customer traffic. Their
troubles were said to be the results of competition from increasing
quick service restaurants and the US financial crisis (Finn Nielsen, 2006). The US financial crisis
exploded in 2006 and today it still has its impact in the financial world. (Ibid). Some say that the
golden days of Starbucks is over ( Nocera,2008) others, that the brand has difficulties in retaining
the same position in the consumer mindset, as specialty coffee may have begun to be perceived as
being mainstream. (Finn Nielsen, 2006).
2.4 Danish coffee suppliers and Starbucks competitors Starbucks’ primary goal is to figure as a strong player on the café
markets worldwide. Besides brewing coffee at cafés, Starbucks
operates in many other related business categories as seen in tabel
2.2.1. Their broad number of touch points makes them stand as a
strong competitor compared to other coffee brands. Especially in
Denmark where the coffee bar suppliers are primarily focusing on
their coffee shops – mainly selling freshly ground coffee for home use as a bi-product.
Because Starbucks appear in so many different markets, they have been able to create a recognized
brand among a broad number of consumers. They are therefore also incomparable to coffee
suppliers around the world as there is no other coffee brand with a similar level of brand equity and
number of touch-points. As Erik de plessis puts it: “The whole basis of touch points is that they are
designed to get attention for the brand”. (Plessis, 2011). Along with their creative and innovative
product line, acting in several business categories and being associated with a dominant global
culture (The American culture) Starbucks has been able to make their brand concept stand
incredibly strong.
On a global basis, Starbucks seem to act as one of the strongest players, but on the Danish market
Starbucks will have to compete against the old established and well-known coffee bar brands. In
Copenhagen the three most well-known coffee-bar chains are: Baresso, Ricco´s and Waynes.
18
2.4.1 Baresso
Baresso is Denmark´s most well-known and widespread coffee chain. The concept was established
by Kenneth Luciani and his wife in 1999. Rumor says, that they started the
concept because Starbucks wasn’t interested in letting the couple franchise the
Starbucks brand, since they didn’t believe Denmark would grow into being a
potential coffee market. The couple therefore started their own coffee shop
´Baresso´ in May 1999 at Højbro Plads, Copenhagen. Their Franchise strategy
started in 2002. By the time they sold it to other investors, the concept had developed into a great
success. So far, Baresso has 44 coffee shops in Denmark while 18 of them are placed in
Copenhagen. (Baresso.dk) Their vision is to be the leading brand of special coffee in Scandinavia.
Their business philosophy is centered around: quality products, storytelling, cozy surroundings,
professional staff training, right placing, and optimal use of resources. (Ibid). The visiting
customers are typically male and females in the age range of 20 – 40 years old, using the
surroundings for private and professional meetings. Their product range is broad and innovative as
they often create new coffee drinks, fitting the seasons or holidays. They sell a range of their own
branded coffee products incl. ten different coffee beans to brew at home. Their logo is a bean,
backed up by the eye-catching red color ,which also makes their brand signs stand out in the streets
of Copenhagen.
2.4.2 Ricco
Ricco is the second largest coffee chain in Denmark. It is known for its
low profiled placing and retro surroundings. The Concept was founded by
the present owner Ricco Sørensen. The first coffee shop opened in 2001 at
Istedgade, Copenhagen – a place known for its low class, open-minded
“hippie” atmosphere. At this moment the chain has 13 coffee bars around Copenhagen, - mainly
franchised and with a staff group of 5 different nationalities. “ It's about all types of people being
welcome. “I don’t differentiate on their background, age, appearance, language or ancestry…My
approach is to love all people and the product.” (Ravnsborg, 2010). Ricco Sørensen started the
coffee chain with the vision of focusing on the coffee quality while welcoming all types of people
to use the place as either a working place, chill out place or simply just to catch a cozy talk with the
other visiting guests. The business philosophy is centered around: Seeking to define what coffee is
all about, embracing the culture of coffee and its quality, being open-minded and welcoming all.
19
The visiting customers are typically local, loyal and authentic types who view the concept of
“mainstream” as the main enemy. (Ibid). The fact that Ricco has developed into a coffee chain is
therefore not something the first targeted and primary customer group finds very surprising. Their
broad range of coffee variants is imported from 15 coffee areas and besides the menu card one can
find coffee related accessories. Their logo is a combination of the black conservative color and
smooth simple design. Since the logo isn’t that eye-catching it easily blends in with the surrounding
area, which of course fits their brand concept very well.
2.4.3 Waynes
Waynes is the newest international coffee chain which has been implemented
in Denmark. So far, the brand has one coffee shop which opened in 2007, at
the shopping mall “Spinderiet”, Valby. The brand is not as familiar among
Danes as many of its competitors. The corporation has its roots in Sweden,
where it started the first coffee shop in 1994. It is the leading coffee chain in
Scandinavia and so far has 120 coffee shops distributed among 8 countries and a turnover of 300
million kr. (www.business.dk).The business explosion is typically done by Franchise. The
atmosphere is inspired by modern European city life, Italian coffee culture, domestic urban
environment, the Swedish Fika tradition9
and a touch of American pastry practice. Their slogan
is“The tastiest coffee break in town”(waynes.com) which they back up with their vision of giving
the customers a place to enjoy a well-deserved break while enjoying high quality coffee and
pastry.(waynes.com). Besides their menu card they sell a small selection of their own branded
coffee and accessories. Their blue and white logo is very eye-catching, but is not yet recognizable to
very many Danes, since the brand sign has been put up in clear white at the shop in Valby. In 2012,
rumors said that the corporation was planning on expanding into the Danish market. (Morten,
2012). So far, there are no signs of newly opened shops.
9 Fika tradition: Too"fikar" is almost a necessity in the Swedish culture. It refers to a brake were one drinks coffee
with a cake or a bun. (http://matochdryck.skane.org)
20
3. Theoretical approach, Part 1: The articulation of brand effects on
consumers
If one wants to understand modern brain research, such as consumer´s liking and ´wanting` effects
on choice, one needs to understand emotions and specifically feelings. (Plessis, 2010). If one further
want to understand brand decision one need to understand decision-making (Ibid) and the
motivational factors leading to it. As the goal of this research is to explore how Danish consumers
relate to the Starbucks brand and which impact it may have on their ´wanting` and liking systems,
the upcoming chapter ´part 1` will first of all explore important theoretical areas related to brand
effect on decision making while ´part 2` will explore cognitive and consumer neuroscientific
theories.
3.1 Consumer motivation systems Consumer motivations are triggered by the many stimuli surrounding us in everyday life. These can
be ads in the grocery store, the speech of others, unconscious emotions, conscious feelings, news
received ,colors and shapes etc. (Simonson, 2005) These motivations can both be conscious and
unconscious and is typically influenced by the countries cultural variations. (Usunier et al, 2009).
For ages many studies have worked with exploring effortful consideration or judgment in relation to
conscious decision making such as gambling theories. (Bargh, 2002). Today, newer studies within
consumer neuroscience have explored the importance in understanding unconscious motivation
factors as these are very prevalent in the everyday lives of consumers. (Ibid).
Consumers in the real world have many other goals and needs in their everyday than conscious
processing of product-relevant information and advertising. (Ibid). Consumers therefore often tend
to get effected by unconscious stimuli driving them to un-rational consumption of e.g. high prices
and brands they find trustworthy. In relation to this it is relevant to integrate and present the
importance of unconscious motivational factors leading to unconscious goal pursuits. Consumers
can be driven by several motivation factors, including cognitive processes, relating to a need for
proper attention and judgment (Ibid) from the outside world. These “goals can be activated, and
then operate, all outside of awareness “ (Barg, 2002.p.282). According to Bargh non-conscious
motivations are viewed as “self-protective motivation, performance- or achievement-related
motivation, and interpersonal goals.” (Bargh, 2002. P.280). According to Levy 1959, consumers
21
are not functionally oriented as their behaviors are affected by the symbols encountered in the
identification of goods. (Sirgy, 2013). These statements underline the fact that the consumer´s
motivation system is controlled by other factors than functionality and that product symbols seem to
have a high influence on non-conscious decision-making.
Sirgy further explains that motivations can be controlled by the consumer’s actual self (referring to
how the consumer perceives him- or herself) ideal self (referring to how the consumer would like to
perceive him- or herself) and social self (referring to how the consumers present themselves to
others). (Sirgy, 2013). Striving for a certain self-image can lead to the specific behavior of carrying
certain brands. In this relation, Trucker 1957 states that “consumers´ personalities can be defined
through product use.” (Sirgy, 2013.p.287). The list of motivation factors is long, but lastly it must
be said that emotions10
are often assumed to be a direct source of motivation “for instance when
assuming that people are motivated to approach pleasure and avoid pain.” (Dai et al, 2010. P.324).
3.2 The concept of a brand and human needs as a motivation factor The roots of the word ”Branding” come from the American phrase of ”to stigmatize”, which was
used in the context of cowboys stigmatizing their cows so that they could recognize them. (Klein,
2000). The concept was introduced in the marketing jargon as early as the 1850s and has since
evolved in several directions. (Klein, 2000). Around the year 1880, manufacturers faced the
challenge of standardized mass production in terms of differentiating themselves. They changed the
purpose of advertising from “informing” to “convincing” by creating an image around the company
and its products. (Klein, 2000). This was the beginning of brand history.
In general, a brand is characterized as a collection of symbols, experiences and associations which
positions and differentiates a product, service, company, organization, person or place. (Huber,
2003). If a product is branded (or marked with a logo) it is done to ensure that the audience can
recognize and differentiate the company in relation to the competitor´s products. (Aaker,
1991).More precisely Aaker, 1991 defines a brand as “A distinguishing name and/or symbol (such
as a logo, trademark, or package design) intended to identify the goods or services of either one
seller or a group of sellers, and to differentiate those goods or services from those of competitors.”
(Aaker, 1991, p. 7).
10
Appendix 15: Defining emotions and feelings in the context of this thesis study.

22
According to Chernatony and Riley, a brand is described as”..a multidimensional construction
which matches a firm’s functional and emotional values with the psychosocial consumer
needs.”(Chernatony et al, 1998 p. 427). All humans have needs at any given time. These needs can
be grouped into two categories, the biogenic needs and the psychogenic needs. Biogenic needs arise
from physiological states of tension like hunger, thirst or discomfort. (Kotler et al, 2009).
Psychogenic needs arise from psychological states of tension such as the need for recognition,
esteem or belonging. (Ibid). When a need is aroused to a certain level of intensity it becomes a
motive, which drives us to act in order to reach a goal. (Ibid). According to Abraham Mashlow11
´needs` can be divided into 5 steps: 1. Physiological needs, 2. Safety needs, 3. Social needs 4.
Esteem needs and 5. Self-actualization needs. (Mashlow 1970) People will always try to satisfy
their most important needs first, as these cover the physiological needs and safety. In order to
function optimally, humans must balance all levels of needs whether they be feeding hunger,
searching for human relations, self-indulgence by services or products and brands. Some say that
the concept of appetite comes from the need of food. Just like this concept, it can be assumed that
the appetite/the motive to buy brand “reflects hedonic motives rather than homeostatic needs.”
(Havermans, 2011 p.286).
A human need that has been dominating most of the modern consumer trends, especially in young
consumer groups, has been the need for social acceptance, self-actualization and recognition. These
consumers are typically postmodern youngsters with a high consumption of expensive branded
materials and services like drinking branded soft drinks or wearing popular and expensive
clothing.12
3.3 Brand equity Aaker and Keller are the two most significant theorists analyzing brand equity in a manner that
could be closely related to the cognitive neuroscientific understanding of decision-making. They
both describe which measuring elements a brand needs to fulfill in order to obtain brand equity and
create consumer loyalty. Brand equity and consumer loyalty is important as:
11
Appendix 5.a: Mashlow´s hierarchy of needs. 12
Appendix 3.a: The market and culture of coffee in Denmark. Section 3.4:exploring Danish postmodern consumers.
23
“Brands create a crucial role in establishing emotional bonds with their customers. In particular,
brand loyalty is important for companies. Loyal customers not only buy more products of a brand
they also tend to try new offerings and tell friends about it.” (Scaeher et al, 2007 p.141).
According to David Aaker, brand equity is defined as “the set of brand assets and liabilities linked
to the brand, its name, and symbol, that adds or subtracts values to a product or service for a
firm/or its customers”. (Aaker, 1991 p.15-16). He further explains that in order for assets or
liabilities to be considered part of brand equity they must be linked to the name and or/symbol of
the brand. (Aaker, 1991). In this case, the more positive associations the respondents have to the
coffee logos, the higher brand equity. It is very important for a firm to have strong brand equity
because if a consumer knows that a product comes from a certain brand it can affect the experience
of wearing the product. “The user can actually feel different”. (Aaker, 1991, p.16). Similarly, Aaker
states that consumer reactions link to ´brand loyalty´ whereas ´brand awareness´ and ´perceived
quality´ reflect the mental elements of the brand by the associations drawn. (David Aaker, 1996).13
3.4 Associations and consumer based brand equity (CBBE) In relation to measuring a firm's brand equity, ´Associations´ are important features as these state
what the respective consumers relate the brand to. Furthermore he states “Associations represent
bases for purchase decisions and for brand loyalty”. (Aaker, 1991. P. 110). The value of
associations can be seen in the figure below. Aaker explains that it is important to research what the
consumers (in this case respondents) relate the brand to, by reflecting on the following questions:
“What mental images if any does the brand stimulate? Is that image a competitive advantage?”
(Aaker, 1991. P.28). In this thesis, considerable weight is given to the respondents’ associations in
order to further investigate whether there is a relation between the association and the consumer’s
´wanting` and liking measuring and final brand choice. The respondent’s behavioral reactions are
linked to the brand knowledge that fluctuates in the consumer’s minds. (Keller, 2008). He refers to
this as ´Consumer-based brand equity´ (CBBE). Keller defines CBBE “as the differential effect of
brand knowledge on consumer response to the marketing of the brand." (Keller 2012. P. 54). He
also states that the CBBE model is a brilliant theory to understand consumer behavior as it provides
a unique point of view into what brand equity is, how it should be built, measured and managed.
(Keller, 2012). To get an insight into the consumer’s brand knowledge, Keller requests “The
13
Appendix 5: David Aaker´s brand equity model.
24
associative network memory model” developed by psychologists. This model views memory as a
network of nodes and links stored information (e.g. verbal, visual, abstract or contextual) with
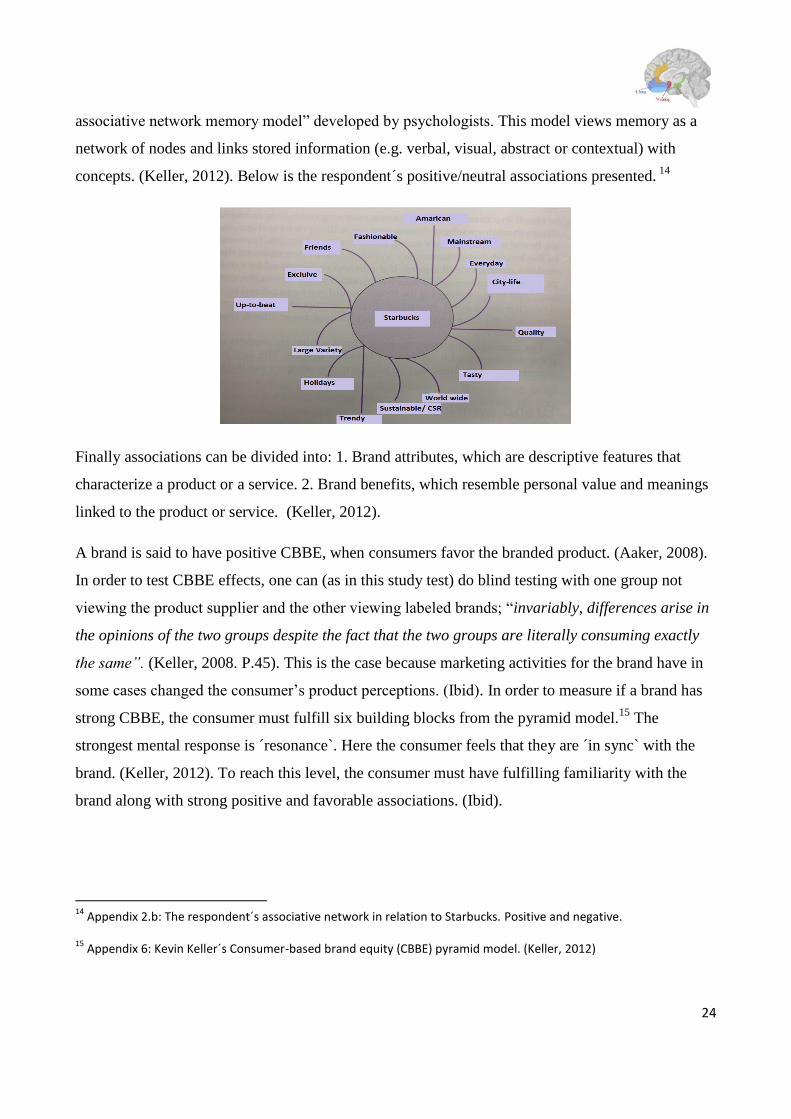
concepts. (Keller, 2012). Below is the respondent´s positive/neutral associations presented. 14
Finally associations can be divided into: 1. Brand attributes, which are descriptive features that
characterize a product or a service. 2. Brand benefits, which resemble personal value and meanings
linked to the product or service. (Keller, 2012).
A brand is said to have positive CBBE, when consumers favor the branded product. (Aaker, 2008).
In order to test CBBE effects, one can (as in this study test) do blind testing with one group not
viewing the product supplier and the other viewing labeled brands; “invariably, differences arise in
the opinions of the two groups despite the fact that the two groups are literally consuming exactly
the same”. (Keller, 2008. P.45). This is the case because marketing activities for the brand have in
some cases changed the consumer’s product perceptions. (Ibid). In order to measure if a brand has
strong CBBE, the consumer must fulfill six building blocks from the pyramid model.15
The
strongest mental response is ´resonance`. Here the consumer feels that they are ´in sync` with the
brand. (Keller, 2012). To reach this level, the consumer must have fulfilling familiarity with the
brand along with strong positive and favorable associations. (Ibid).
14
Appendix 2.b: The respondent´s associative network in relation to Starbucks. Positive and negative.
15 Appendix 6: Kevin Keller´s Consumer-based brand equity (CBBE) pyramid model. (Keller, 2012)

25
3.5 Brand associations from a mental box
According to Aaker,1991 a brand is defined as a mental construct in the minds of consumers. He
refers to this as a ´mental box`. After receiving information about a certain brand the consumers
label this information and save it in their `box´. (Aaker, 1991) For example, when a consumer is on
a vacation trip abroad and happens to grab a coffee at a Starbucks, the experience gets labeled as
´Starbucks` in the box.
The consumer has two storing dimensions: Heavy or light. The heavy information has a greater
chance of being retrieved in the long run. (Ibid). The consumer also partitions the information in a
positive or negative box. (Aaker, 1996). So, when respondents in this thesis are asked to draw
associations to the individual brands, their memories, pictures and experiences are taken from their
mental boxes.16
3.6 Non-conscious decision-making It is known that humans are goal driven beings guided by needs and wishes, always pointing
towards future events. (Chartrand et al, 2008; Bernard et al, 2010). Goals are described as being a
key motivational construct guiding consumer choice. (Chartrand et al. 2008). Sigmund Freud was
the first scientist who found that a person is not fully capable of understanding or being aware of his
or her motivations. (Kotlers et al. 2009). Another scientist, Panksepp, explained this behavior by
referring to the seven emotional systems: Seeking, fear, rage, panic, lust, care and play. (Ibid) The
emotional system therefore has a great impact on the motivation that drives consumers to buy
brands. Both goals and consumer choices are often nonconscious and affected by situational cues
which can influence behavior without one’s awareness. (Chartrand et al, 2008). Often the activated
goal, say, the choice of a certain coffee brand, gets pursued as if it were consciously chosen and
does not register in one’s awareness until actually chosen. (Ibid). This process is presented in the
sketch below.
16
Appendix 2: Free association test results Appendix 2.a: Analysis of the Starbucks associations and 2.b: The respondents associative network in relation to Starbucks.

26
3.6.1 Figure: Nonconscious Goal Pursuit in brand relation
Source. Composed by the author of this thesis. Inspired by the theory of Chartrand et al. 2008
Chartrand 2008, states that goals: 1. Can be triggered unconsciously, 2. Be present unconsciously,
3. be affected unconsciously and 4. performed unconsciously. (Chartrand et al, 2008). This may
explain why consumers are often unaware of their own consumer behavior. Neuroscientists have
stated that there is a strong connection between brand names and preferences as brand names
influence consumers’ thoughts, memory, feelings and actions. (Aaker,1999: Keller, 2008). Brands
therefore have an effect on preferences because consumers see the brand as an extension of
themselves. In this way, brands are used as a symbolic representation of one´s ideal past, present
and/or future self. (Park et al.2006).
A brand plays multiple roles in consumer choice. “These roles may include brands' effects on
consumer preferences; on brand and quantity choice; and on consideration.”(Huber,2003 p.679).
The effects are typically material, but can also be psychological (e.g., associative network memory),
sociological (such as brand communities), and economic processes (brands as signals under
uncertainty). (Ibid). It is the brand credibility that typically affects the consumer’s choice set
formation and conditional brand choice. (Ibid) “As a signal of product positioning, the most
important characteristic of a brand is its credibility.”(Huber, 2003 p. 679). Therefore, the stronger
the credibility of the brand, the stronger its potential effect on consumer loyalty and final choice.
According to a study done by Knutson, it has been discovered that the brain shows signs of
activation in the VS and NAcc long before human awareness. (PLassmann et al.2012; Ballard &
Knutson, 2009). This lends additional weight to the former statement by Chartrands et al. 2008
which described the fact that consumers are able to pursue non-conscious goals and choose specific
brands without being aware of any active decision.
3.7 Preliminary conclusion This section has shed light on the fact that brands are one of the strongest stimulating factors
affecting consumer decision-making. This is due to the satisfaction of consumers’ psychological,

27
social and self-actualization needs. It has been repeatedly shown that triggering factors, which
contributed to a motivational process, might appear as completely non-conscious goal pursuits.
These were stimulated by certain brand names which affected consumer associations, perceptions
and finally actions (choice).
4. Theoretical approach, part 2: Consumer neuroscience
The complex relations between emotions and cognition form a base for decision-making. Cognitive
neuroscience is the research and understanding of phenomena like perception, attention, memory
and problem solving. Whereas consumer neuroscience can advance our understanding of the
consumer psychology of brands (Plassmann et al.2012) by using knowledge from cognitive
neuroscience. Consumer neuroscience is therefore a tool to understand and predict consumer
behavior (Plassman et al, 2011) but also a tool to understand how a brand affects certain human
affections (feelings/emotions) and stimulus. The upcoming section will provide a deeper insight
into relevant approaches relating to the motivation systems ´wanting` and liking. These approaches
are based on the biological and cognitive physiological reactions that challenge the traditional
economic, sociological, anthropological and marketing related research propositions. (Plessis,
2011). In order to appreciate the full understanding of the presented theories and the upcoming
analysis, an explanation of consciousness and unconsciousness will lead this section.
4.1 Consciousness and unconsciousness The clarification of how to define the term consciousness is something scientists and philosophers
have been struggling with through the ages. But generally, consciousness is defined as the
subjective feeling one has of the perceptions, sensations, thoughts and events at any time. (Ramsøy,
lec.3). As the experience of consciousness depends on the individual subject, so do the definitions.
In relation to this challenge, the theorists Bernard Baars (1988, 1994) and Francis Crick &
Christof Koch (1998) quotes: “Everyone has a rough idea of what is meant by being conscious. For
now, it is better to avoid a precise definition of consciousness because of the dangers of premature
definition.” (1998, p. 97) The philosopher Descartes, was one of the first scientists to express
consciousness in relation to human mind set. His famous statement became “I think, therefore I
am”. (Bernard et al, 2010 p.241). In relation to this, consciousness can be explained as the
28
experience of the universe and how one knows it. (Ibid) According to Bernard et al, 2010
consciousness is defined by the use of ITT (Integrated theory of consciousness), this states that
“ consciousness is a large amount of differentiated information that is also highly integrated. In
this context, integrated information means information that is accessible to the entire system as
a whole….the amount of integrated information that you and I have in our brains correspond to
our repertoire of possible conscious states.”(Bernard et al, 2010 p.242).
According to neuroscientist Thomas Ramsøy, consciousness can be roughly described as: a
controlled process, a demanding mental resource, a condition, a reaction to stimuli, signs of willed
behavior and ability to communicate. (Ramsøy,2012. lec. 3). He further explains that consciousness
can be a state of mind and a content. A state of mind refers to wakefulness, attention and contact
with social surroundings while content refers to a conscious experience. One can have a clear or
vague experience, but it is also possible in some situations to receive and process information in the
sub-consciousness. This happens through subliminal cues. (Ramsøy, lec.3).
Following the definition from Ramsøy and Bernard et al, 2010, consciousness, in relation to the
respondents, can be understood as their mental state being in control, which requires effort. In
contrast, then, their effortless states of mind, will be referred to as unconscious. If this happens the
respondents will also not be aware of how their goals were an influence on their judgment and
behavior. (Bargh, 2002). In some of the situations it will be seen that the respondents are using
effort without action. In these situations the respondents are in a sub-conscious state of mind.
4.2 The decision making process In order to understand the neurobiological and psychological mechanisms that determine the
brand’s effect on consumers’ preference and choices, the following theoretical areas will be
explained: The value-based model of choice, the reward system´s unconscious ´wanting` and
conscious liking. Additionally, the activated brain areas will be explored and visualized in order to
give the reader a better understanding of how the respondent´s motivational and decision-making
process may have been activated.
4.3 Framing Framing can be defined as an inevitable process of selective influence over the individual’s
perception of the meanings attributed to words or phrases. It is generally considered in thoughts,
29
consisting of the mental representations, interpretations, and simplifications of reality. (Druckman,
2001). In relation to the coffee tasting experiment, the use of framing was integrated in both 1. The
manipulating and convincing experiment set-up and 2. The presented lines of introduction, since the
respondents were convinced that the coffee samples came from the presented brands and that there
was no hidden agenda. This encouraged many respondents to answer in a certain interpreted
direction, believing that the samples were actually differentiated.
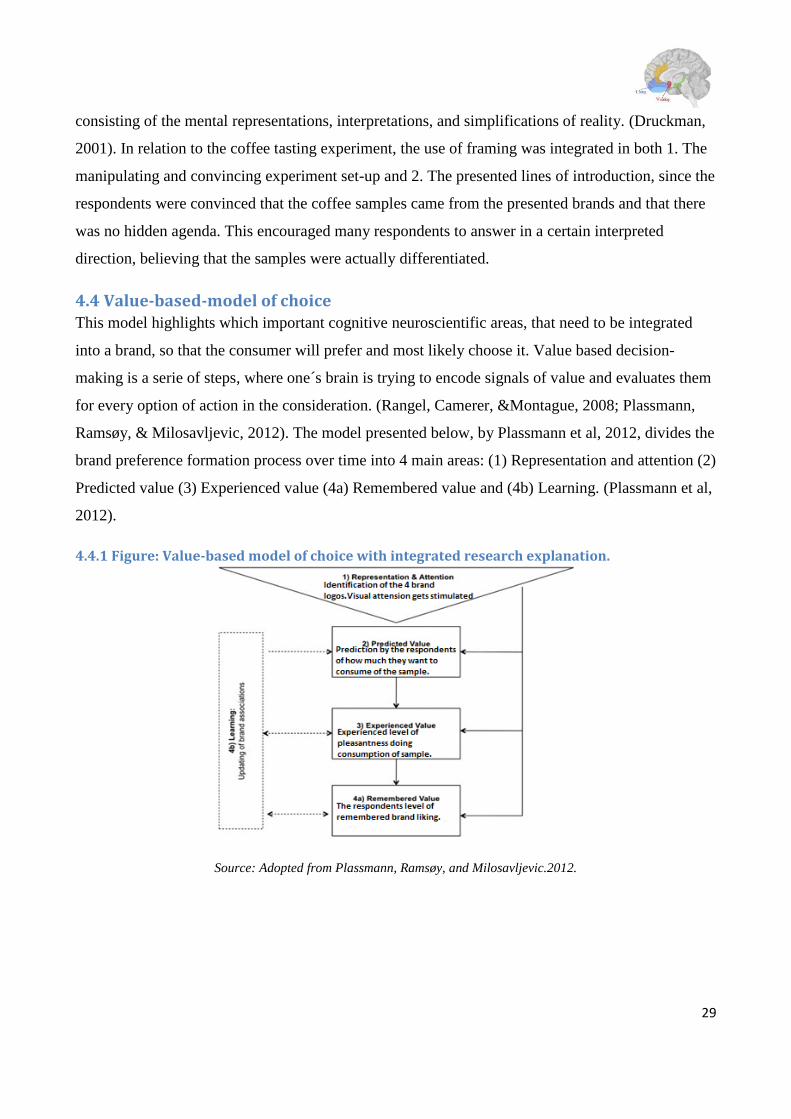
4.4 Value-based-model of choice This model highlights which important cognitive neuroscientific areas, that need to be integrated
into a brand, so that the consumer will prefer and most likely choose it. Value based decision-
making is a serie of steps, where one´s brain is trying to encode signals of value and evaluates them
for every option of action in the consideration. (Rangel, Camerer, &Montague, 2008; Plassmann,
Ramsøy, & Milosavljevic, 2012). The model presented below, by Plassmann et al, 2012, divides the
brand preference formation process over time into 4 main areas: (1) Representation and attention (2)
Predicted value (3) Experienced value (4a) Remembered value and (4b) Learning. (Plassmann et al,
2012).
4.4.1 Figure: Value-based model of choice with integrated research explanation.
Source: Adopted from Plassmann, Ramsøy, and Milosavljevic.2012.
30
4.4.1.1 Representation &Attention
In the first step of the model the consumer is presented with the given object - in this case study, the
four coffee brands. At this moment attention is defined as a mechanism that is responsible for
selecting the information that gains preferential status above available information. (Plassmann et.
al. 2011). The things which grab human´s interest and fluctuate in their surroundings may often turn
out to be the things they notice and turn their attention towards. This is why consumer ´attention`
can be guided and affected by incentive as e.g. the consumer´s social status, self-esteem,
recognition and cultural norms. These incentives are then transferred to the items and brands the
consumer wishes to show the world (e.g. coffee brand drink).
The consumer’s visual information related to the brand is instantly filtered through the filters and
processed by the nervous system. Meanwhile a large number of brain areas register and encode
relevant information about the external environment, memories, internal states, etc. (Plassmann et.
al, 2011). The strongest signal from the outside world will be selected through a competitive
process and enter the working memory. The level of signal strength depends on how the visual
attention and focus on the brand get stimulated. This can be heightened by many different factors
and marketing strategies, including repeated exposure of ads, product placement in movies etc.,
positive association, or by having experienced an episode which lets one´s memories reflect on the
brand.
4.4.1.2 Predicted value
Predicted Value is the absolute evaluation of how much a consumer thinks he or she wants to
consume a product. (Plassmann et al, 2011). In this second step, the brand stimulates the consumers
valuing process. Here, it is very possible to affect the consumer’s rational evaluation as preference
can be affected by unconscious stimuli. An example is the design and development of good brand
commercials. Commercials can make consumers alter their choice values and preferences by
changing their consolidated memory, for instance by making them pass the values (positive
associations) seen on the screen onto, say, the taste of a product. (Plassmann et al, 2011).
4.4.1.3 Experienced value
The third step, the experienced value, also known as the outcome value is defined as,”…the (a)
valence and (b) intensity of the consumption experience.”(plassmann et al.2012. p. 25).
Experienced value is ´the true value` that should matter the most for consumers in value based
decision-making. (Plassmann et al, 2012). In the context of this research the valence and intensity is

31
the experienced pleasantness of the consumed coffee brands. For example, if the taste evaluations
show differences between the individuals tasting the same coffee, this indicates that the sample
tastes get assigned with different measures of experience depending on the individual’s relationship
with the brand. One study example that illustrates this would be a blind test experiment, which
provided insight about how humans trick their own rational choice-decision. Results showed that
respondents from this test liked and preferred the taste of a Pepsi Cola drink rather than a Coca Cola
drink, but when asked to name the preferred brand the respondent wanted to buy, the majority
chooses Coca Cola. (Koldbye, C. 2008). This test indicates how consumers often ´want` one
product but ´like` another. (Plessis 2011, Read Montage).
”These findings suggest that the outcome valuation system is modulated by higher cognitive
processes that determine expectancies and beliefs – a phenomenon recently referred to as the
”placebo effects of marketing” actions or ”expectation bias””(Plassmann et al. 2012.p.26).
The interaction between the predicted value and the experienced value is said to be a very important
step in the value-based-decision model, as it is here the consumer either meets his/her prediction or
gets motivational values for another brand.
4.4.1.4 Remembered Value: Memory
One of the most important elements in consumer choice is the last step (4a) the consumer´s
remembered value of the brand exposures. As our human information capacity is limited, so is our
memory.
The memory can be defined as ”a process consisting of three steps: encoding, consolidation and
retention.” (Plassmann et al. 2011, p.21). When information comes into our brain human
automatically asign it a value. (Ramsøy, lec. 5) It is therefore important for a brand to stand out and
trigger the right brain areas. According to ´The perception-to-memory` the brand processing and our
experience of the world ”relies on a mechanism that transcends the traditional borders between
perception, cognition and memory.” (Plassmann et al. 2011, p.22). When looking at an object, the
human mind combines or associates the properties of that object. (Plassmann et al. 2011). Therefor
it is no great leap to declare that a brand icon provokes a process were different informational parts
are associated. When exposing the brain towards brand objects the brand should be seen as
associations, where any information that is related to the particular brand is also part of its

32
associative network. (Plassmann et al, 2011). In the case of Starbucks, it is a company which put
great effort into affecting consumers’ memory by being represented in several business channels in
order to constantly stimulate and influence consumer recognition.
4.5 The reward system It is well known that on some levels, human behavior is controlled by the “reward circuit” which is
the release of dopamine and other neurotransmitters. (Bernard et al, 2010). It is also known that
brands can function as reward stimuli. (Schaefer et al, 2007). The level of dopamine controls the
pleasure consumers gain from using one brand instead of another. ( Erik de Plessis, 2011). It is
therefore not only the functional reward consumers are looking for when trying to satisfy the reward
circuit, but also, and maybe even more importantly, the dopamine feeling (Barnard et al, 2010) and
social benefits as well. (Schaefer et al, 2007).17
The reward system is known as a seeking system, which makes humans curious about their world.
The system promotes goal-directed behavior towards a variety of objects such as food, shelter, sex,
etc. (Barnard et al, 2010). This seeking system includes classical reward pathways in the brain stem
as well as other subcortical areas. (Barnard et al.2010). Positive stimuli motivate the reward-
targeted behavior, whereas negative stimuli cause avoidance.
4.5.1 Figure: The Dopamine reward parthways Source: The reward circuit – www.thebrain.mcgill.ca
The reward system can be divided into anticipation
and experience. (Ramsøy, lec. 5). These are two
different preference systems controlled by the
dopaminergic neurons: the Mesolimbic dopamine
pathway and Mesocortical dopamine pathway.
(Barnard et al, 2010).- Their pathways are marked
with blue. Both are activated by reward stimulus.
(Ibid). The dopamine neurons are, however, more
responsive to anticipation of reward than actual
receipt of reward. (Ibid). Therefore, when a
17
Appendix 7: Reward components
33
consumer buys a brand, the consumer’s dopamine level gets activated and the consumer may
experience a higher feeling of pleasantness in the actual process, than afterwards when
owning/receiving the product. Continiously It has been proven through recent studies that a brand
can work as a reward cue letting the brain systems learn and react to the rewarding properties of the
brand in the same way as neurobiological, natural reinforces as sex, food, facial attractiveness, etc.
(Erk et al.,2002; Schaefer & Rotte,2007).
The reward system contains three main areas which has an important role in consumer decisions
and value calculations: The ´wanting`, liking and ´learning` system. These will be explored in
following section.
4.5.2 ´Wanting`, liking, learning
According to modern cognitive neuroscience, ´wanting` and liking are two different preference
indicators that can be analyzed at both conscious and unconscious levels.18
´Wanting` and liking
can be defined as reflections of the individual’s beliefs which reveal their bio-psychological
processes. In order to explore the physiological effects, similarities and differences among
mammals and humans, researchers have been exploring this field for a long time. A famous test
done on children is e.g. the ´marshmallow- experiment`, which examined children’s ´wanting` and
liking systems, through measuring their reaction time. The test explored how children can be
struggling with a dilemma: immediate gratification (eating the marshmallow now, the ´wanting`
system) and long term deliberate decision (wait and get rewarded with an extra marshmallow, the
liking system). (Ramsøy lec.5; Youtube.com).
18
A behavioral economic perspective to the ´wanting` and liking theory is ´The dual process` theory by psychologist
Daniel Kahnemann. This theory is incredibly similar and parallel to the ´wanting` and liking theories from cognitive
neuroscience as they both deal with the aspects of conscious and unconscious pattern in human cognition and behavior.
Surprisingly the theorists individually managed to develop two different theories speaking almost of the same findings
within the same period of time and despite that they come from two scientific fields. More in Appendix 8: David
Kahnemann´s system 1 and system 2.Another cognitive perspective to the ´wanting` and liking theory and
Kahnemann´s the dual process perspective is “The two cognitive systems” by Khaler et al, 2009. This theory also
speaks of the conscious and unconscious thinking patterns by dividing them into “The automatic system and the
reflective system”. These are very similar to system 1 and system 2.
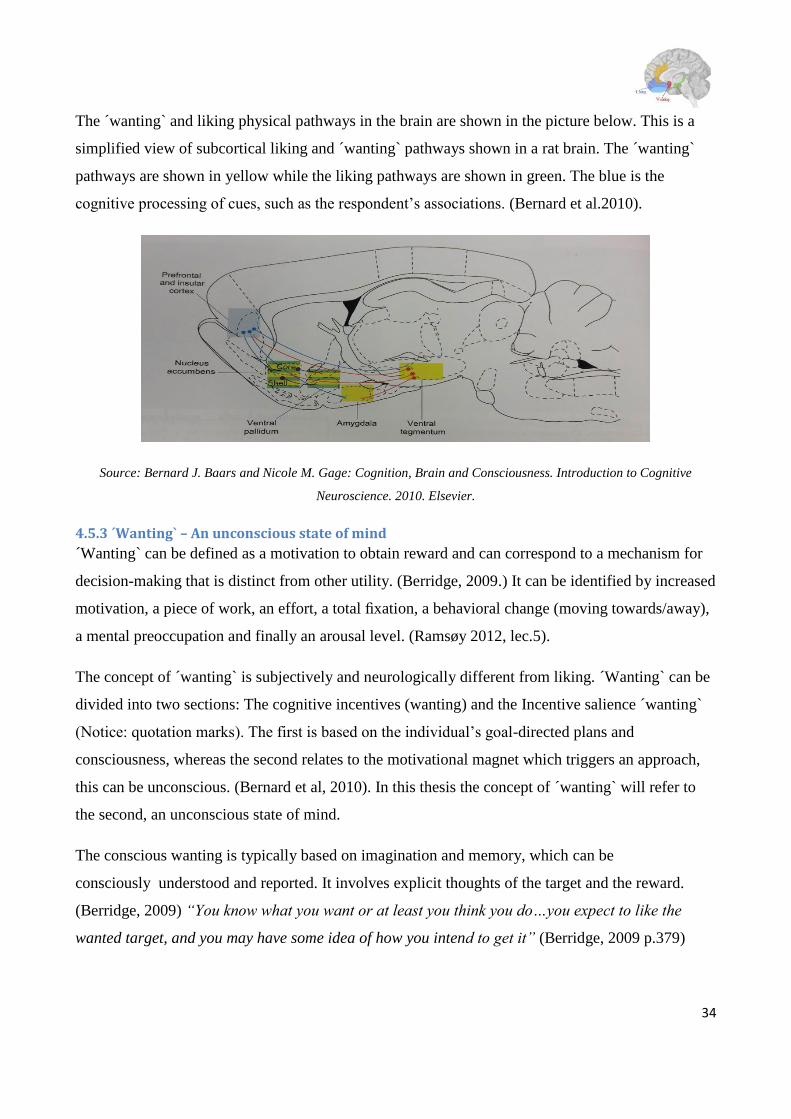
34
The ´wanting` and liking physical pathways in the brain are shown in the picture below. This is a
simplified view of subcortical liking and ´wanting` pathways shown in a rat brain. The ´wanting`
pathways are shown in yellow while the liking pathways are shown in green. The blue is the
cognitive processing of cues, such as the respondent’s associations. (Bernard et al.2010).
Source: Bernard J. Baars and Nicole M. Gage: Cognition, Brain and Consciousness. Introduction to Cognitive
Neuroscience. 2010. Elsevier.
4.5.3 ´Wanting` – An unconscious state of mind
´Wanting` can be defined as a motivation to obtain reward and can correspond to a mechanism for
decision-making that is distinct from other utility. (Berridge, 2009.) It can be identified by increased
motivation, a piece of work, an effort, a total fixation, a behavioral change (moving towards/away),
a mental preoccupation and finally an arousal level. (Ramsøy 2012, lec.5).
The concept of ´wanting` is subjectively and neurologically different from liking. ´Wanting` can be
divided into two sections: The cognitive incentives (wanting) and the Incentive salience ´wanting`
(Notice: quotation marks). The first is based on the individual’s goal-directed plans and
consciousness, whereas the second relates to the motivational magnet which triggers an approach,
this can be unconscious. (Bernard et al, 2010). In this thesis the concept of ´wanting` will refer to
the second, an unconscious state of mind.
The conscious wanting is typically based on imagination and memory, which can be
consciously understood and reported. It involves explicit thoughts of the target and the reward.
(Berridge, 2009) “You know what you want or at least you think you do…you expect to like the
wanted target, and you may have some idea of how you intend to get it” (Berridge, 2009 p.379)
35
This applies, for instance, when test respondents see the different coffee brands and consciously
start to imagine which one is more pleasurable in taste.
The unconscious ´wanting` is a brain system which is separated from expectations, conscious
planning (Berridge, 2008) and sometimes feelings. (Berridge, 2009). It can be triggered by sudden,
intense, temporary, reversible and repeatable reward-related cues (Berridge, 2009) such as the smell
of freshly brewed coffee. In the unconscious ´wanting` the person typically anticipates liking the
eventual outcome. (Barridge,2009). As mentioned before, it is this interpretation which will be used
in this study.
Typically the conscious and unconscious wanting systems work in tandem as the unconscious
´wanting` is the one which directs the behavior by enhancing the conscious desires to action.
(Berridge, 2009). For instance, when respondents in the coffee tasting test provide an overview of
the presented brands and consciously19
reach out for a sample, letting the unconscious behavior
decide the amount of fluid that gets poured into the cup.
The unconscious ´wanting` can be very strong, often stronger than the conscious wanting. An
example of this is studies done on compulsive behaviors, showing that it can be very typical, that
people ´want` something they don’t necessarily like, as with, say, smoking (Ramsøy 2012, lec 5)
and overeating (Berridge, 2009b). Because the ´wanting` can be an unconscious reaction, it is very
typical and often expected to find different results in ´wanting` vs. liking tests. This is in fact
assumed in the coffee tasting test where respondents are to taste the samples and afterwards
evaluate the level of their liking/disliking. (H1 vs. H6). When tasting the samples the respondents
won’t know that the amount of consumed coffee actually expresses their unconscious ´wanting` of
the product while the evaluation expresses their conscious liking. It is also possible to discover the
respondent’s ´wanting` by observing their facial expressions as the incentive salience transforms the
sensory shape, smell or sound into an attractive and attention-riveting incentive, leading the
respondents to either smile, be more focused, motivated, etc.(Berridge,2009:Ramsøy lec5 2012).
These methods will, however, not be practiced in this study.
19
The respondents were conscious when picking up the samples, as they were told in which chronological order to
taste them.
36
4.5.4 Liking – A conscious state of mind
The hedonic feeling of liking has been shown to be dissociable from the dopamine system and has
homologous facial characteristics across both mammals and humans. (Bernard et al, 2010). The
understanding of liking (pleasure) can be divided into 2 sections: conscious pleasure liking and core
hedonic impact “liking”. The first is when explicit, hedonic feelings are expressed e.g. conscious
liking or pleasure rating while the next is an objective/affective reaction, e.g. a facial expression of
“liking” (smile, sticking tongue out, etc.). (Bertrand et. al, 2010). Facial expressions reflect the
unconscious “liking”, but in most cases the conscious liking gets viewed as the core liking. In this
thesis liking will refer to the conscious state of mind.
In the traditional branding theories liking is typically referred to as a feeling. (Aaker, 1991; Keller,
2008). In research studies liking typically gets measured by parameters such as preference rating,
subjective scaling, etc. According to the branding literature, liking a certain brand can occur if the
brand repeats exposure (Aaker,1991) or is surrounded by positive associations. Starbucks has been
publishing their brand through several differentiated media, aiming for more potential customers to
like them.
4.5.5 Learning
Learning is a system which enables people to be more strategic in their decision-making. In order to
learn, our brain constantly updates values and associations regarding a specific context-related
action. When new knowledge is gained, it can, if systematized, develop into learning. (Berridge et
al, 2003).
In relation to the theories mentioned above, learning can be motivated by both ´wanting` and liking
but can be done without any of them. According to studies done by Pessiglione et al. 2008, it has
been concluded that “even without conscious processing of contextual cues, our brain can learn
their reward value and use them to provide a bias on decision making.”(Ramsøy, lec.5, 2012). In
the coffee test, it was observed that respondents after having tasted the first two samples, may have
noticed that the taste might have been the same, but because they were told that all samples were
different, they took this knowledge and let it influence their evaluation and final decision making.

37
4.6 Noticeable brain systems in consumer choice, ´wanting` and liking
4.6.1 Human brain
The brain is one of the most complex human organs. It consist of a number of highly complex and
intertwined structures. (Bernard et al, 2010). In cognitive neuroscience the focus is primarily on the
cortex, often considered to involve the highest level of processing. (Ibid). The cortex is vital for
cognitive functions and constantly interacts with deeper structures such as the thalamus, basal
ganglia, cerebellum, hippocampus and limbic regions.20
(Ibid) Consequently, these regions play an
important role in the understanding of consumer decision-making. The cortex is responsible, among
other things, for sense regions such as vision, hearing and tasting. All Areas which seem to be
activated when respondents are making decisions.
4.6.2 Figure: Prominent brain structures related to value computation
Source: Adopted from Plassmann et al.2012. The red writing are own implemented descriptions.
When it comes to our visual system (Visual cortex 1) it contains two cortical routes: The Dorsal
visual (the ´where way`) and the ventral visual (´the what way`). (The green arrows in the picture.)
The first is involved with spatial deployment of attention. Whereas the second is responsible for
object recognition. (Plassmann et al, 2012). The ´where way` helps the respondents identify the four
20
Cortex is a flat sheet that is folded into the upper cranium, covering the brain. See drawings, with explanation of the
cortex and the sense areas presented in colors :Appendix 4: The Cortex

38
brands, while the ´what` lets them recognize and understand which brand they have a preference
for. When the dorsal visual area is activated the stream proceeds to the dlPFC.21
. (The purple spot in
the picture). This area along with the vmPFC/mOFC (blue colors in the right model) and the
stratiatum are important sections which are activated when the respondent is involved with the
value creation of the presented coffee brands. (Levy et al. 2011). The mOFC predicts the preference
and liking of a product whereas the Nacc is related to the ´wanting` system. (Ramsøy, lec.4). The
OFC is a cortical processing placed especially in the medial orbifrontal cortex. The OFC is e.g.
activated if the neural system encodes a negative experience like an unpleasant taste. (PLassmann et
al. 2012; Small et al, 2001:2003). The likeability of something that creates a pleasant taste
sensation, like a great cup of coffee, is registered by the shell of the nucleus accumbens. (Bernard et
al, 2010). fMRI studies have shown activity in the OFC (medial part in particular) at the time a
reward is being enjoyed. (Plassmann et al. 2011). One might therefore predict that this area is
activated if the respondents find the taste of the samples positive. The pathway of liking reactions
typically runs through a neutrally modulated brain network, incl. shell of the nucleus accumbens,
ventral pallidum, and brainstem parabrachial nucleus (shown by the green color). (Bernard et al,
2010).
Another area which gets activated when the respondents, are evaluating the presented tasting
samples, is the hippocampus. The Hippocampus is the brain´s memory system which is also
responsible for all the respondent´s knowledge of associations with the brands.
During the process of consumer choice, there are different components which influence the
decision-making, namely the so-called bottom-up and the top-down. The bottom-up system filters
and selects the most important information the person is exposed to. This occurs on two levels, the
low and the high level. The low level divides the visual inputs into features like colors, luminance,
size, shape, orientation, etc. (Plassmann et al, 2011). The low-level becomes activated when
respondents view the brand logos, whereas the higher-level factors potentially gain automatic,
preferential access to working memory (faces, text, novelty, one’s name, etc). (Ibid). Both the low
21
Abbreviations: ACC= Anterior Cingulate Cortex; dlPFC= Dorsolateral Prefrontal Cortex; mOFC= Medial Orbifrontal
Cortex; lOPFC= Lateral Orbifrontal Cortex; NAcc= Nucleus Accumbens; vmPFC= Ventromedial Prefrontal Cortex; VS=
Ventral Striatum.

39
level features and the higher level factors are combined in the brain and pre-attention scan paths are
created. (Ibid).
Secondly, the top-down control depends on goal and expectations. The relevant information for
goal attainment will be attended to more than irrelevant information: when human are hungry, for
example, they pay more attention to food. (Ramsøy, lec 3). The top-down control is activated when
respondents are to evaluate whether the taste of the samples fits their predicted value and
expectations.
According to research it is very easy to affect consumers’ preferences by manipulating their
´wanting` and liking systems with regard to certain brands without their knowledge. (Bringer, 2013-
documentary, dr2). One way to do this would be by developing important stimuli that interfere with
the Nacc system as this system receives input from dopaminergic neurons in the ventral tegmental
(VTA). (Plassmann et al. 2011). The dopamine neurons are essential for controlling or
manipulating consumer behavior as these create the desire felt as ´wanting`. This Nacc (The red
area in the model) is also very important when striving to affect consumers emotionally as this is
connected and placed in a hierarchy of mind regions with high sensory processing. (Plassmann et al
2011).
When the respondent is asked to evaluate the consumed samples their level of ´wanting` is
controlled by the level of released dopamine and activated in the Nacc/VS area. (Ramsøy lec. 5).
Finally when the respondent is about to choose the coffee brand he or she wants to take along, it can
be assumed, based on earlier studies, that the left frontal region is activated, as this area is
associated with either positive emotional experience or the motivational drive to approach an object.
(Plassmann et al, 2012; Harmon-Jones, 2003).

40
4.7 Figure: Connecting value-based decision making with the theory of ´wanting`
and liking.
The two different motivational brain systems ´wanting` and liking is in this section integrated into
the model of value based decision making to explore the relaions the theories share.
In the second step ´Predicting value` of the value based model of choice, one would expect to see a
strong reaction of ´wanting´. This is not 100% unconscious, as it is also thought to be responsible
for conscious gut feelings, etc. The third step ´experienced value` represents 100% of liking as it
refers to the hedonic experience, which is the subjective utility experience.
The two systems are therefore connected to different areas in the consumer’s decision making. The
´wanting` and liking systems are supported by two different neural systems (Neurotransmitters):
Dopamine and Opioid. The reward system´s ´ wanting´ relates to many of the deeper and
unconscious brain areas e.g. food ´wanting` (Havermans, 2009) which is connected to the
dopamine level.22
The liking system which relates to subjective experiences of pleasantness such as
food liking (Havermans et al, 2009) is supported by the orbifrontal cortex and mediated by the
22
Dopamine : Is a substance which, upon release, leads to a feeling of pleasantness. It Maintains psychomotor and
motivational focus and alertness (Conscious arousal). (Bernard et al.2010)
41
Opioid system, primary sensory and valuation regions (Litt, 2010) 23
. Both systems work together in
decision-making and there is evidence that they can operate completely outside of conscious
awareness. (Berridge & Robinson, 1995; Litt, 2010).
4.8 Preliminary conclusion In this section various modern cognitive neuroscientific approaches have been presented. All
theories have been integrated according to their individual and combined contributions to greater
insight and understanding of the many aspects of consumer decision-making. The initial approach
´framing` set the stage for the overall approach to the research of this thesis. Next, the ´value-based-
model of choice´ presented the 4 stepped process a consumer had to go through in a decision-
making situation. Lastly, the theory of ´wanting´, liking and learning added an in-depth description
of the human psychological and biological (conscious and unconscious) decision process.
5. Research design
5.1 Research method In order to investigate the research question an experiment stage was set up. The experiment’s
chronological order was based on a combination of the consumer behavioral marketing approach:
´Hierarchy-of-effects`24
and the consumer neuroscientific behavioral approach: ´Value-based-model
of choice´. By answering a questionnaire, tasting samples and filling in measuring scales, the
respondents were able to show their unconscious behavior and express their conscious opinions.
Each step of the experiment was constructed to create a scientifically valid test. This was done
through hypotheses which would be either scientifically verified or falsified.
The aim of the test was to gain better insights into the relations between respondents’ ´wanting´ and
liking behavior and measurements, to thereby explore the possibility of brands affecting their
decision making.
23
Opioids: An opioid is a psychoactive chemical that works by binding to opioid receptors, which are found principally
in the central and peripheral nervous system. (www.sst.dk)
24 Definition: Hierarchy-of-effects models: With a focus on consumer attitude, behavior, consumption and decision
making their primer goal is to predict how consumers respond to advertising or how they process a communication message. (pelsmacker et al, 2010). (More in section 10.2-10.3)

42
5.2 Research philosophies In order to answer the research question and related sub questions, a number of hypotheses were
developed, these represent my epistemology25
My epistemology in this project plays a central role,
as it determines, how my reality is acknowledged. This further creates my ontology, which has a
significant impact on my hermeneutics and analysis of the data. According to philosophy,
assumptions about reality can be based on four methodological approaches: Positivism, Neo-
positivism, Critical theory and Constructivism. (Cleemann, 2010).26
In the treatment of the hypothesis, my method-perspective will vary between an analytical approach
from the positivistic paradigm (quantitative/scale measuring from questionnaires) and the
constructivist paradigm (qualitative/Open answers in the questionnaire and observations). In order
to arrive at an objective and realistic conclusion in this thesis, I will strive to find an optimal
balance between being naïve realist and trained relativist. Though, as a researcher in my own thesis,
there is a chance, that I'm affected by own constructivist ontology and unconscious gut feelings.
Additionally, since I have developed this research project alone I will place my ontology closer to
the ´critical-theory` paradigm, also known as limited realist, as reflections and knowledge channels
are strictly limited to one’s own network, methods and expertise.
5.3 Hypothesis The following hypothesis was developed as expected behaviors based on presented theories and
observations done on consumers in several coffee environments. For every hypothesis there is a Hx0
hypothesis, which resamples the negation of the listed hypothesis. These will not be listed. The
hypotheses are divided into 4 subject-related sections. The first and last listed hypotheses provide
the scope for this project, while the central listed parameters equal the control parameters.
In relation to the presented research question it will be expected that:
H1: Individuals´ subjective preference for brands has a significant effect on coffee taste preference.
H1: Main Parameter dealing with brand effects.
25
Ontology : What is reality? Epistemology : How does the research recognize the reality? Methodology : How is the
research examined? (Cleemann, 2010).
26 Appendix 9: Paradigms and their assumptions about Ontology, epistemology and Methodology. (Cleemann, 2010).

43
H2: The high quality coffee will be connected with a higher rating, as the coffee quality should
equal the average taste experience and finally the average rating level of taste experience.
H3: Based on the taste, the respondents will be able to detect a difference among the qualities.
H3a: Even though the respondents may have suspected, that some of the presented
brand samples contain the same coffee, they will still rate the tasting of each brand
differently.
H2 – H3a = Control parameters dealing with taste.
H4: The consumers will consume a higher amount of the high quality coffee.
H5: The coffee the respondents consume more of, will be the coffee they choose to take with them
in the end.
H6: The consumers will drink more of the coffee brand they prefer.
H4 – H6 = Control parameters dealing with consumption.
H7: The respondents will rate the brand: Starbucks positively higher (in pre-assumptions) than
competitors in knowing, liking and perceived quality.
H7a: Starbucks will be rated positively higher than competitors in taste perception
regardless of which coffee quality is hiding underneath.
H7 + H7a= Main parameters dealing with Starbucks.
5.4 Experimental design In week 50 (2012) at central hall CBS, 122 subjects were tested (56 women, age mean±
_std =
25.3±4.1) who on average consumed 2.4 cups of coffee (std = 1.3, range 0,5-6). On the day of
testing, they had on average 1.1±1.5 cups (range:0-8.5).
Subjects tested 4 different cups with coffee. On average the cups weighed 33.5±5.5 grams prior to
drinking. After each cup, subjects rated the coffee taste. Between each trial they rinsed with water
for approximately 10 seconds.

44
Unknown to the subjects, there were only two kinds of coffee; one high quality (After dinner) and
one low quality (Artnok Original). Both coffees were supplied by the sponsor Kontra coffee. All
brands attached to the coffee were famous coffee brands. The brands were placed in the same order
throughout the whole experiment to optimize coherency and validation of the results. The integrated
manipulation factors were the two coffee qualities (high; low). These were integrated in order to
make it possible to discover, whether the respondents could actually taste a difference between the
samples. The qualities were chronologically distributed amongst the samples (high;high – low;low)
to increase the chance of respondents noticing the similarities. This set-up along with the last
question27
provided yet another opportunity to research on what level the brand had an effect on
their perceptions.
Finally the respondents were set to choose a final coffee brand to take along. This was integrated to
explore how brands had an effect on final choice decisions as in a real life consumer purchasing
situation. The experiment structure consisted of three main levels:
1. Measuring of consumption.
2. Rating of coffee samples
3. Respondent´s final choice of coffee brand.
These steps were adequate to explore factual and unconscious consumption (´wanting`) of
conscious liking and finally choice of preferred brand (main parameter). The respondents was asked
to taste four brand samples and indicate the taste experiences in order to access their coffee liking.
Their ´wanting` was accessed by the amount of consumption.
In total the coffee tasting process was divided into 6 steps, distributed among a recommended total
durations time of 10 min. per respondent. (Blumberg et al, 2008). The respondents ran through the
first 5 steps of the process 4 times as the samples were tasted and evaluated individually. Figure
5.4.2 presents an overview of the chronological testing process followed by a visual presentation of
the set-up and testing process.
27
Control question: ”Did you notice that some of the tastes were the same? – If yes? Which?”

45
5.4.1 The chronological order of the questionnaire.
The three main steps of the questionnaire forms the division of the overall research structure: liking,
´wanting`, the respondents own reflections and final coffee choice.28
The aim of this questionnaire
was to characterize the respondent’s general coffee consumption and pre-assumption/associations
towards the presented brands.
The structure was based on following steps:
1. Pre-assumptions measuring/ associations These results represented their liking
estimations
2. Amount of consumed coffee from the
samples
These results represented their
´wanting` estimations
3. Final scale measuring’s after tasting the
samples and final choice
These results represented the relation
between their ´wanting` vs. liking
estimations
5.4.1.1 The questioner
28
Appendix 11: Questioner
Pre-assumption test The coffee test Debriefing test

46
5.4.2 Figure: The coffee testing process
Source: Composed by the author of this thesis,2013. Representing the structure and main testing process.
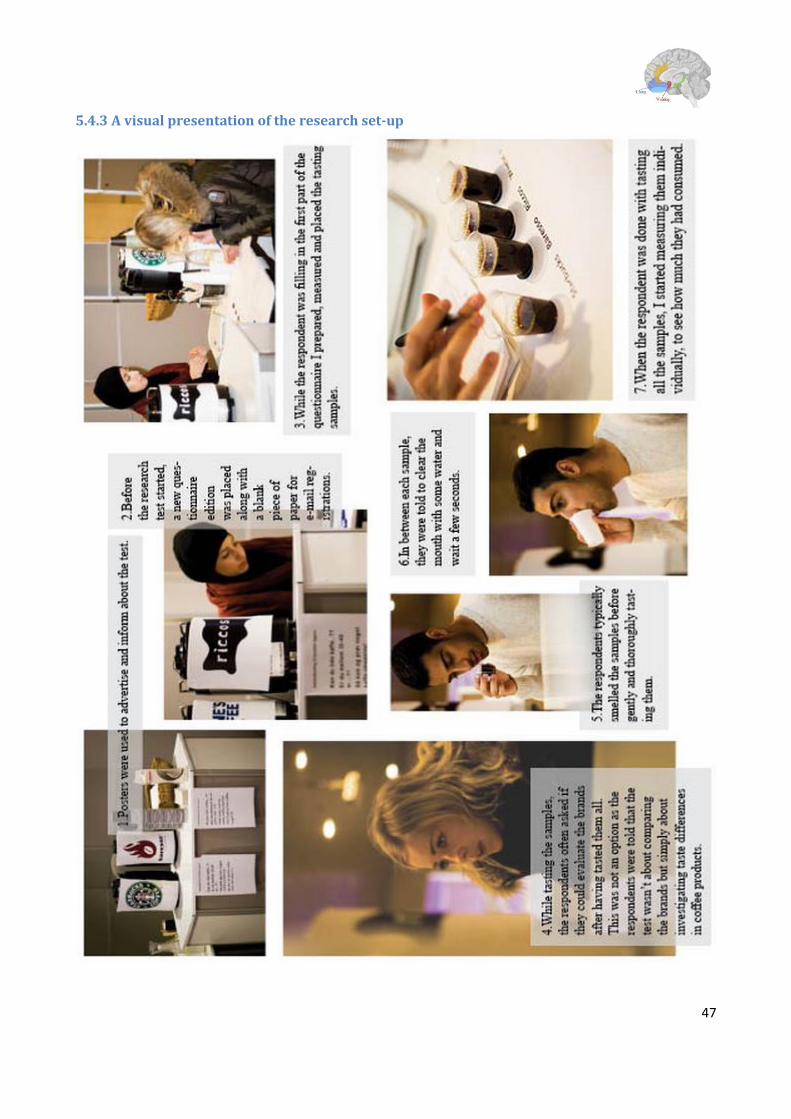
47
5.4.3 A visual presentation of the research set-up
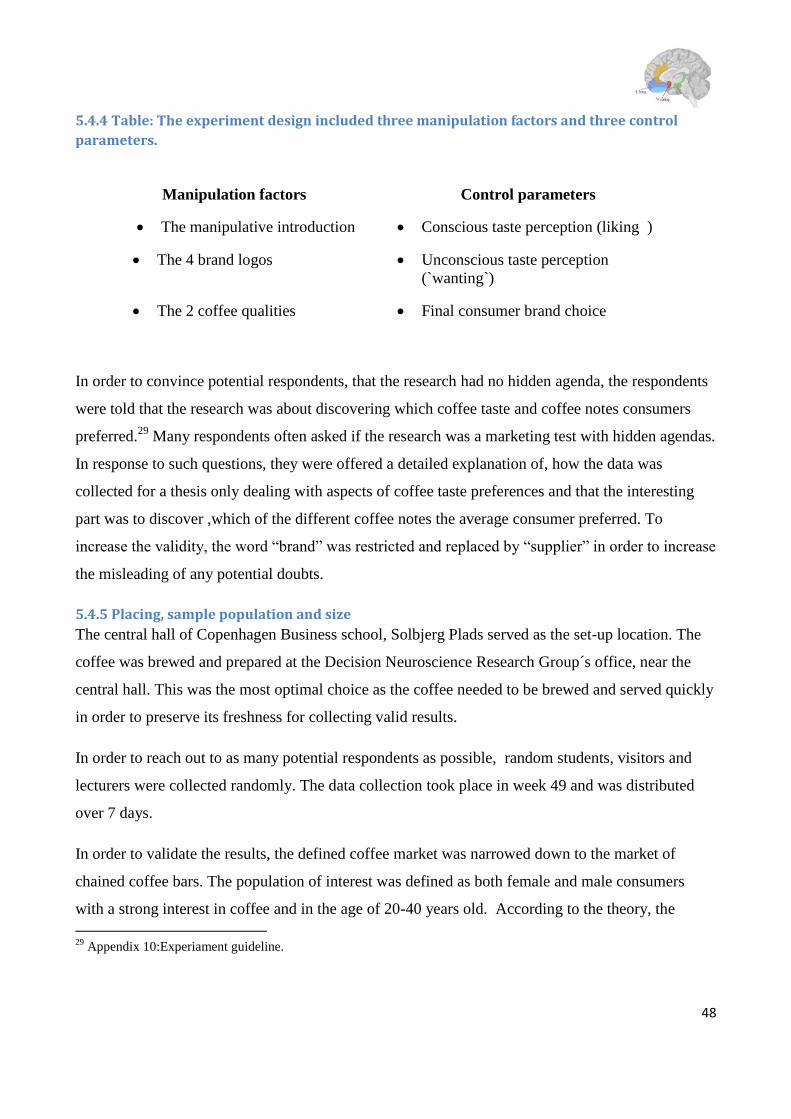
48
5.4.4 Table: The experiment design included three manipulation factors and three control
parameters.
Manipulation factors Control parameters
The manipulative introduction Conscious taste perception (liking )
The 4 brand logos Unconscious taste perception
(`wanting`)
The 2 coffee qualities Final consumer brand choice
In order to convince potential respondents, that the research had no hidden agenda, the respondents
were told that the research was about discovering which coffee taste and coffee notes consumers
preferred.29
Many respondents often asked if the research was a marketing test with hidden agendas.
In response to such questions, they were offered a detailed explanation of, how the data was
collected for a thesis only dealing with aspects of coffee taste preferences and that the interesting
part was to discover ,which of the different coffee notes the average consumer preferred. To
increase the validity, the word “brand” was restricted and replaced by “supplier” in order to increase
the misleading of any potential doubts.
5.4.5 Placing, sample population and size
The central hall of Copenhagen Business school, Solbjerg Plads served as the set-up location. The
coffee was brewed and prepared at the Decision Neuroscience Research Group´s office, near the
central hall. This was the most optimal choice as the coffee needed to be brewed and served quickly
in order to preserve its freshness for collecting valid results.
In order to reach out to as many potential respondents as possible, random students, visitors and
lecturers were collected randomly. The data collection took place in week 49 and was distributed
over 7 days.
In order to validate the results, the defined coffee market was narrowed down to the market of
chained coffee bars. The population of interest was defined as both female and male consumers
with a strong interest in coffee and in the age of 20-40 years old. According to the theory, the
29
Appendix 10:Experiament guideline.

49
number of respondents (the size) to a pilot group should range from 50-100 subjects (Blumberg et
al.,2008). The aim was to collect around 100-150 respondents and the end result was 122
respondents.
The collection method used was a stratified data type, which allowed dividing the population into
subpopulations where the simple random technique was used. (Blumberg et al, 2008). The
subpopulation let me narrow down the segmented population to only include Danish coffee drinkers
from Copenhagen. This group was chosen as representatives of a general Danish coffee drinker.
The required characteristics in the segment were: 20-40 years old, liked coffee and had been living
in Denmark (for a minimum of 1 year).
5.5 Measurement equipment
The basic elements in the study were printed questionnaires, a scale, big cups, sample cups, sugar,
stirrers and most importantly, the two different qualities of coffee. To prevent the respondents from
being influenced by stimuli beside the logos and the framing presentation, the sample cups were
clear, neutral and all equal in size. In order to set-up a convincing stage, the following equipment
was used: four transferrable coffee tanks with attached coffee logos on, two desks, chairs, informing
posters and background stage settings.
5.5.1 Measuring methods in the questionnaire
“Sensitivity of a scale is an important measurement concept, when changes in attitudes are under
investigation”. (Zikmund et al, 2010 p.309 ). This definition refers to the ability of the scale to
represent the respondents’ variability. When measuring consumer attitudes and behavior, the typical
approach is by using rating scales. Rating scales come in many versions applicable for different
setups. All, however, have individual drawbacks as they each frame the subjective answer of the
participants. (Blumberg et al.,2010).
The questionnaire was formatted so that the scales of measurement varied from nominal, open
answers and interval types of data. Nominal refers to yes/no answers while open answers refers to
the respondents using their own words to answer. Lastly, the interval refers to the scaled range of
values. This was the primary method in both the questionnaire and taste preference evaluation.
Interval data are scales, which incorporate the concept of equality of interval. (Blumberg et al,
2010). Interval scales are used in e.g. intelligent scores, semantic differential scales and multipoint
50
graphical scales. (Blumberg et al, 2010). The last one mentioned is relevant in the context of this
study as the respondents, were asked to rate the taste preference on a 10 cm (like vs. dislike) scale.
Since the interval between each rating step is equal in length and value adding this method can be
defined as interval data. A more precise definition of this measuring method, however, is the term:
Visual analogue scale, as this scale gives a precise attitude measurement for each individual
respondent across the present values. (Wewers & Lowe,1990).
Furthermore, the questionnaire included a well-organized and short response strategy provided so,
that the respondent wouldn’t be able to tell, what the study was actually about, as the focus was put
on one’s relationship to coffee and on the taste. As an example of how the questionnaire was
constructed, instead of asking “How well do you know the following brand?”, the respondents were
asked “How well do you know the following coffee suppliers?”.30
5.6 Validity and Reliability Validity refers to, whether a measurement accomplishes its claims (Blumberg et al, 2008) and to
whether the measurement represents the concept accurately (Zikmund et al, 2010). In order to
optimize the quality of validity the research process and design structure (experiment setup and
questionnaire) were carefully planned in details. Great effort, for instance, was put into maintaining
a similar personal appearance and tone of voice with all the respondents. In order to make the
statistical findings and final conclusion more valid, a higher number of respondents could have been
included. Also, a broader and more varied pool of respondents could have presented a more
nuanced and valid final result, leading to an even better understanding of how well Danish
consumers relate to the Starbucks brand. Finally, an interesting observation was made. Throughout
this thesis the statistical results had been compared amongst all the presented four brands. However,
it came to my attention, that if the brands had been statistically divided into a high-brand equity
category (Starbucks/Baresso) and a low-brand equity category (Ricco/waynes) the results from
figure 6.9, would have presented another overall picture as the respondents in this case consumed
the high quality coffee in relation to the high-brand equity category and the low quality coffee in the
low-brand equity category. This could have indicated whether, on an unconscious level, the
respondents were able to detect the quality tastes and potentially connect them with the right brands.
This would be particularly interesting because in figure 6.5 the respondents’ evaluation resulted in a
30
Appendix 11: Questioner, part 1 “Before tasing coffee”

51
preference for the low quality in 3 out of 4 cases. In light of this, it becomes clear, that conclusions
and results from research studies are indeed affected by the way the statistical data is treated.
The concept of reliability refers to the question of, whether the study will produce similar results in
repeated trials. (Zikmund et al, 2010). If a similar target group was tested somewhere else in
Denmark with the same experiment setup and questionnaire the likelihood of similar results would
be expected to vary between a low ->medium similarity. It should be taken into account, that there
might be a difference in the level of brand insights and therefore also the level of brand effects on
taste perception between Danish consumers from central areas and consumers from smaller cities.
Furthermore, in relation to testing ‘wanting’ and liking reactions it is very uncertain, whether
respondents would choose the same answer, even if the test was done on the same respondents as
the first time. This is due to the fact that consumers construct their preferences on the spot
(Lichtenstein, 2006; Payne et al, 1992; Dai, 2010) and therefore can have different representations
of a preference in different contexts. (Dai, 2010). The respondents’ ´wanting` and liking results
further depend on the timing of the test and the individual respondent´s emotional moods.
Besides this there are no overtly inconsistent or surprising elements in the study, which would be
able to further affect the reliability quality.
6. Test results
The first aim of the test was to research whether the brand and the quality had an effect on
´wanting` (consumption), liking (preference) and final choice. To this end, a questionnaire was sat
up and a multivariate random effect analysis with liking and consumption as the dependent variable
was run: using brand name and coffee quality as the independent variables. The interaction between
brand and quality, were also included. Subjects were used as the random factor.
6.1 Figure: Results from the pre-assumption test.
The results from the pre-assumption test showed that in all cases Starbucks scored the highest
positive scale measuring. They also received the highest scores of positive and negative
associations. However, Starbucks was the only brand for which all respondents (100%) left an
association; in comparison, Waynes was evaluated on associations by only 19,67% of the
participating respondents.
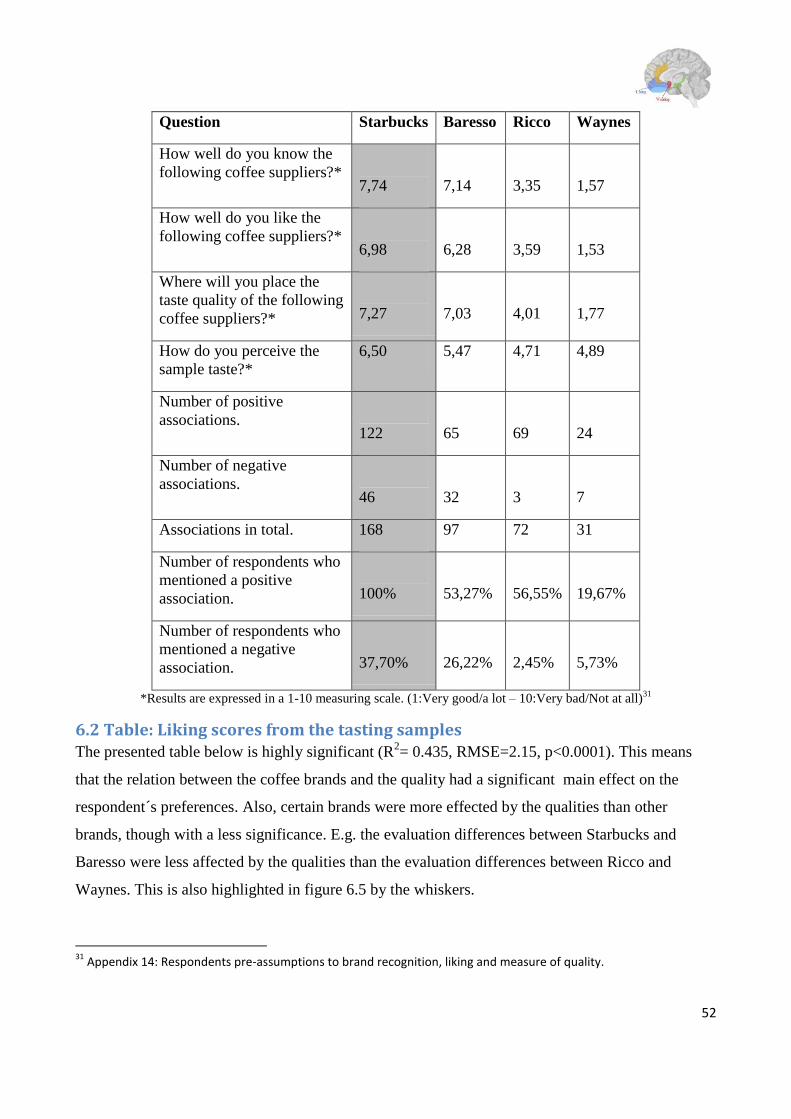
52
Question Starbucks Baresso Ricco Waynes
How well do you know the
following coffee suppliers?*
7,74
7,14
3,35
1,57
How well do you like the
following coffee suppliers?*
6,98
6,28
3,59
1,53
Where will you place the
taste quality of the following
coffee suppliers?*
7,27
7,03
4,01
1,77
How do you perceive the
sample taste?*
6,50 5,47 4,71 4,89
Number of positive
associations.
122
65
69
24
Number of negative
associations.
46
32
3
7
Associations in total. 168 97 72 31
Number of respondents who
mentioned a positive
association.
100%
53,27%
56,55%
19,67%
Number of respondents who
mentioned a negative
association.
37,70%
26,22%
2,45%
5,73%
*Results are expressed in a 1-10 measuring scale. (1:Very good/a lot – 10:Very bad/Not at all)31
6.2 Table: Liking scores from the tasting samples The presented table below is highly significant (R
2= 0.435, RMSE=2.15, p<0.0001). This means
that the relation between the coffee brands and the quality had a significant main effect on the
respondent´s preferences. Also, certain brands were more effected by the qualities than other
brands, though with a less significance. E.g. the evaluation differences between Starbucks and
Baresso were less affected by the qualities than the evaluation differences between Ricco and
Waynes. This is also highlighted in figure 6.5 by the whiskers.
31
Appendix 14: Respondents pre-assumptions to brand recognition, liking and measure of quality.
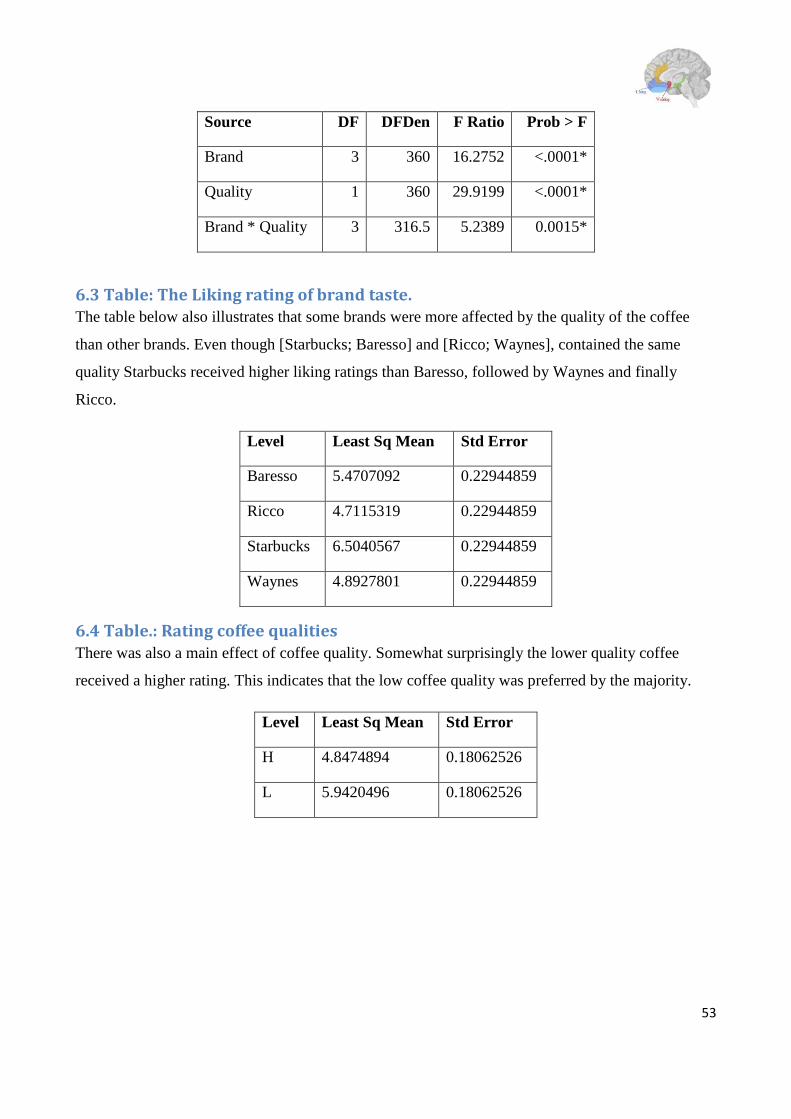
53
Source DF DFDen F Ratio Prob > F
Brand 3 360 16.2752 <.0001*
Quality 1 360 29.9199 <.0001*
Brand * Quality 3 316.5 5.2389 0.0015*
6.3 Table: The Liking rating of brand taste. The table below also illustrates that some brands were more affected by the quality of the coffee
than other brands. Even though [Starbucks; Baresso] and [Ricco; Waynes], contained the same
quality Starbucks received higher liking ratings than Baresso, followed by Waynes and finally
Ricco.
Level Least Sq Mean Std Error
Baresso 5.4707092 0.22944859
Ricco 4.7115319 0.22944859
Starbucks 6.5040567 0.22944859
Waynes 4.8927801 0.22944859
6.4 Table.: Rating coffee qualities There was also a main effect of coffee quality. Somewhat surprisingly the lower quality coffee
received a higher rating. This indicates that the low coffee quality was preferred by the majority.
Level Least Sq Mean Std Error
H 4.8474894 0.18062526
L 5.9420496 0.18062526

54
6.5 Figure: Tasting perception, brand and quality
Finally, there was an interaction between brand and quality, as shown in the figure below. The
figure shows, that high brand equity suppliers [Starbucks; Baresso] are less effected by the quality
difference than [Ricco; Waynes]. This appears as the taste evaluations are liked almost similarly
and the whiskers are small.
6.6 Table: Consumption of samples It was descovered that brand and quality had a high explanatory effect on consumption (R
2=0.83,
RMSE=5.3, p<0.0001), and that this was caused by the significant individual effects of brand and
quality, but no interaction effect.
Source DF DFDen F Ratio Prob > F
Brand 3 360 13.5720 <.0001*
Quality 1 360 13.1596 0.0003*
Brand*Quality 3 316.5 1.8662 0.1352
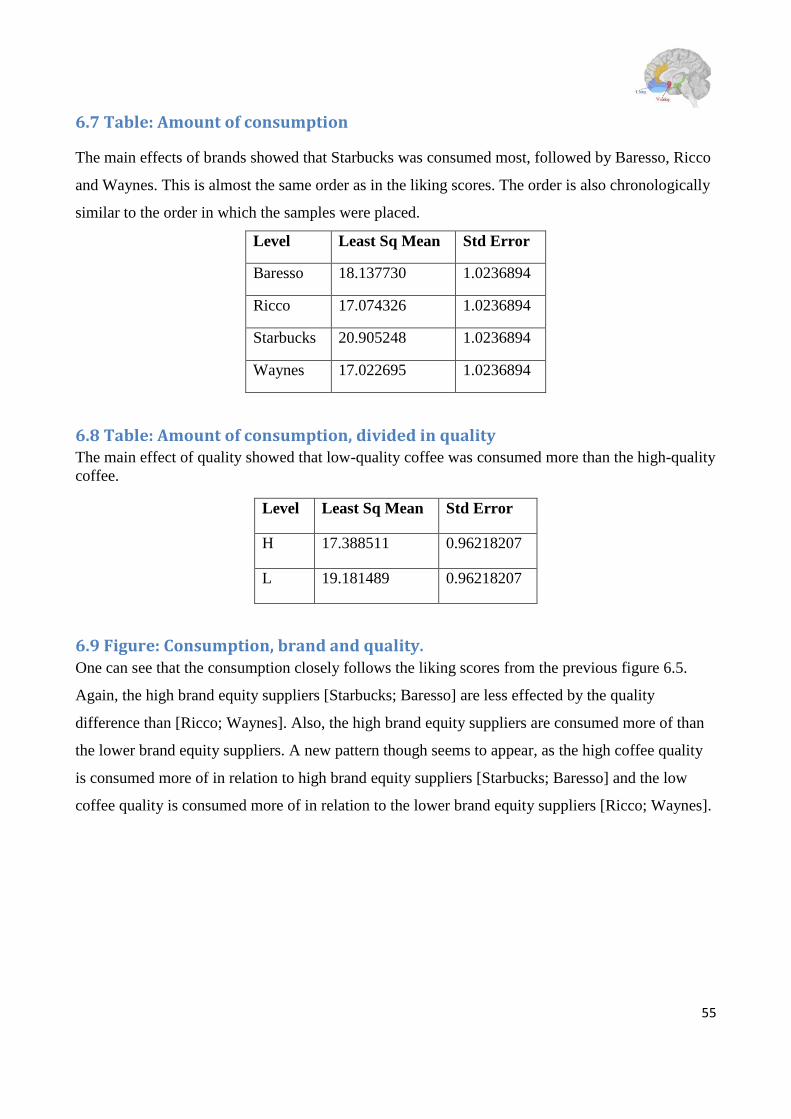
55
6.7 Table: Amount of consumption
The main effects of brands showed that Starbucks was consumed most, followed by Baresso, Ricco
and Waynes. This is almost the same order as in the liking scores. The order is also chronologically
similar to the order in which the samples were placed.
Level Least Sq Mean Std Error
Baresso 18.137730 1.0236894
Ricco 17.074326 1.0236894
Starbucks 20.905248 1.0236894
Waynes 17.022695 1.0236894
6.8 Table: Amount of consumption, divided in quality The main effect of quality showed that low-quality coffee was consumed more than the high-quality
coffee.
Level Least Sq Mean Std Error
H 17.388511 0.96218207
L 19.181489 0.96218207
6.9 Figure: Consumption, brand and quality. One can see that the consumption closely follows the liking scores from the previous figure 6.5.
Again, the high brand equity suppliers [Starbucks; Baresso] are less effected by the quality
difference than [Ricco; Waynes]. Also, the high brand equity suppliers are consumed more of than
the lower brand equity suppliers. A new pattern though seems to appear, as the high coffee quality
is consumed more of in relation to high brand equity suppliers [Starbucks; Baresso] and the low
coffee quality is consumed more of in relation to the lower brand equity suppliers [Ricco; Waynes].
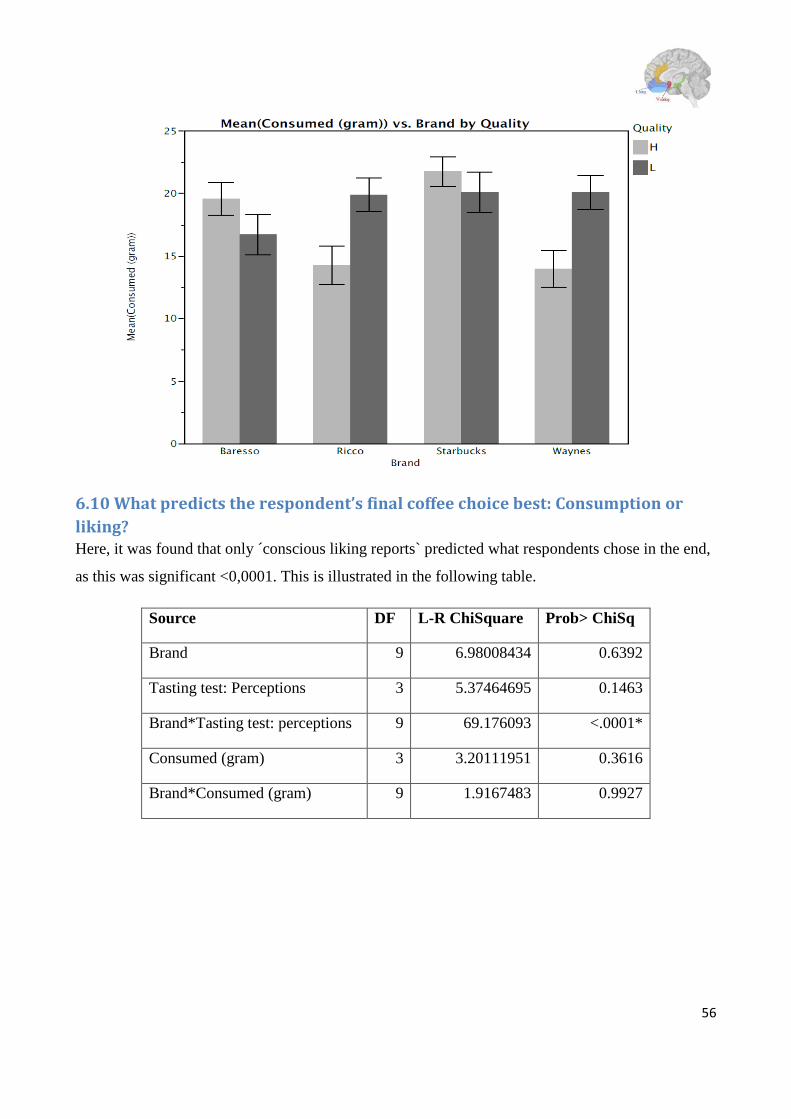
56
6.10 What predicts the respondent’s final coffee choice best: Consumption or
liking? Here, it was found that only ´conscious liking reports` predicted what respondents chose in the end,
as this was significant <0,0001. This is illustrated in the following table.
Source DF L-R ChiSquare Prob> ChiSq
Brand 9 6.98008434 0.6392
Tasting test: Perceptions 3 5.37464695 0.1463
Brand*Tasting test: perceptions 9 69.176093 <.0001*
Consumed (gram) 3 3.20111951 0.3616
Brand*Consumed (gram) 9 1.9167483 0.9927

57
6.11 Figure: Respondents choice of coffee brand ´to go`.
The figure shows that when subjects chose a particular brand (bottom; B, R, S, W) it was associated
with higher liking scores for that particular brand (bottom bars), but not so much similar changes in
mean consumption (top bars). Bars indicate mean value, whiskers denote SEM (standard error of
the mean). Among the 4 brands, Starbucks is the only one where both liking and consumption is
highest.
Starbucks 46%
Baresso 17%
Ricco 22%
Waynes 15%
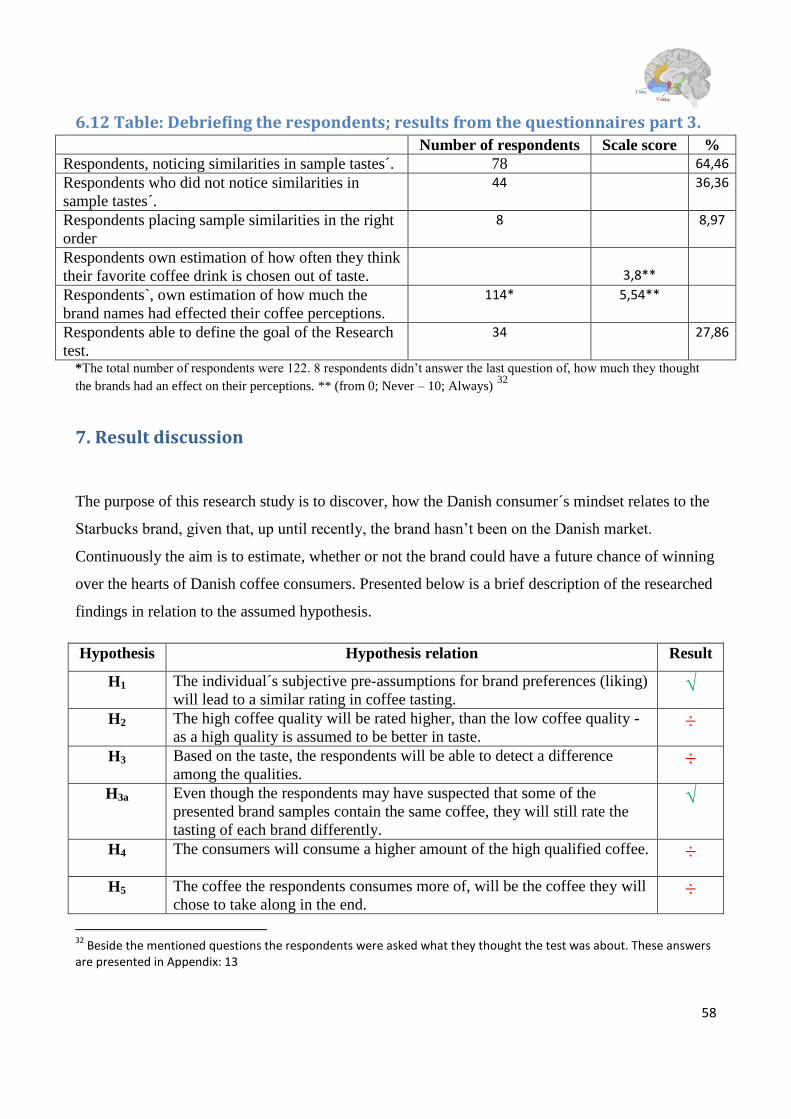
58
6.12 Table: Debriefing the respondents; results from the questionnaires part 3. Number of respondents Scale score %
Respondents, noticing similarities in sample tastes´. 78 64,46
Respondents who did not notice similarities in
sample tastes´.
44 36,36
Respondents placing sample similarities in the right
order
8 8,97
Respondents own estimation of how often they think
their favorite coffee drink is chosen out of taste.
3,8**
Respondents`, own estimation of how much the
brand names had effected their coffee perceptions.
114* 5,54**
Respondents able to define the goal of the Research
test.
34 27,86
*The total number of respondents were 122. 8 respondents didn’t answer the last question of, how much they thought
the brands had an effect on their perceptions. ** (from 0; Never – 10; Always) 32
7. Result discussion
The purpose of this research study is to discover, how the Danish consumer´s mindset relates to the
Starbucks brand, given that, up until recently, the brand hasn’t been on the Danish market.
Continuously the aim is to estimate, whether or not the brand could have a future chance of winning
over the hearts of Danish coffee consumers. Presented below is a brief description of the researched
findings in relation to the assumed hypothesis.
Hypothesis Hypothesis relation Result
H1 The individual´s subjective pre-assumptions for brand preferences (liking)
will lead to a similar rating in coffee tasting. √
H2 The high coffee quality will be rated higher, than the low coffee quality -
as a high quality is assumed to be better in taste. ÷
H3 Based on the taste, the respondents will be able to detect a difference
among the qualities. ÷
H3a Even though the respondents may have suspected that some of the
presented brand samples contain the same coffee, they will still rate the
tasting of each brand differently.
√
H4 The consumers will consume a higher amount of the high qualified coffee. ÷
H5 The coffee the respondents consumes more of, will be the coffee they will
chose to take along in the end. ÷
32
Beside the mentioned questions the respondents were asked what they thought the test was about. These answers are presented in Appendix: 13
59
H6 The consumers will drink more of the coffee brand they prefer. √
H7 The respondents will rate the brand: Starbucks positively higher (in pre-
assumptions) than competitors in knowing, liking and perceived quality. √
H7a Starbucks will be rated positively higher than competitors in taste
perception regardless of which coffee quality that hides beneath. √
*The hypothesis are divided into four categories: H1 = Main hypothesis H2-H3a= Control parameter (taste) H4-H6=
Control parameter (consumption) H7-H7a= Starbucks related parameters.
In order to explore the research areas, the brand effects on the consumer´s brand perceptions,
reaction patterns, conscious/unconscious taste experience and final decision-making was
investigated. This theoretical research approach was chosen as developments within consumer and
cognitive neuroscience had claimed that motivation systems could be conscious and unconscious.
The research required a tasting experiment, which took place at Copenhagen Business School in
Copenhagen. Respondents were here tested on both their unconscious ´wanting´ throughout a
consumption test and their conscious liking by answering several questions in a questionnaire.
A research of the conscious liking system which referred to the pleasure derived from eating or
drinking specific things and ´wanting`, which referred to the appetitive motivation to consume the
coffee, was made. (Havermans, 2011). From the theoretical description, it was postulated that the
´wanting` system would be inaccessible to subjective reports, yet have a strong and direct impact
on actual choice behaviors. This was not scientifically verified as it turned out to be the subjective
liking system (related to experienced utility and reports of liking), which provided a motivational
force to actual choice behaviors.
The results showed, that the respondents’ taste experiences and preferences were extremely affected
by their primer brand expectations, associations and assumptions. When told that they were
drinking a certain brand, it showed that their expectations and sympathy to this brand affected, how
they experienced the taste. An example of this was when respondents thought that Starbucks tasted
better than Baresso even though they in both cases were drinking the same coffee.
Another main factor uncovered by the test was that the quality put into the samples also had a
remarkable effect on respondents’ taste experience but yet the final experience all depended on
which brand the respondents thought they were drinking. In contrast to what was expected, it was
discovered that the respondents preferred the low quality coffee rather than the high quality coffee.

60
Finally, the results also showed that the respondents consumed more of the brand they had
expressed a preference for in the questionnaire. The most popular brand in both the scale
evaluations and tasting test results was Starbucks, as the brand was rated with the highest scores of
likability and measured with the highest consumption level in the ´wanting` test.
H1: Individuals´ subjective preference for brands has a significant effect on coffee taste
preference.
Measuring the respondents brand assumption before doing the sample tasting test, showed that there
was a connection between brand equity and the respondent’s brand knowledge to the brand, liking
and placing of quality. The respondents expressed, that they knew the strongest brands (Starbucks
and Baresso) better than the weaker brands (Ricco, Waynes), they had a higher preference towards
them and rated their qualities higher than less familiar brands.33
In the first part of the questionnaire
it was noticed that the respondents placed their liking preference evaluations remarkably close to
the results from the first question about brand knowing, in fact Starbucks was given 7,74 in
knowing, 6,98 in liking and 7,27 in quality – all results close to 7. Waynes on the other hand was
given 1,57 in knowing, 1,53 in liking and 1,77 in quality – all close to the average of 1,5.34
When comparing these results with the tasting evaluations, it also gives a clear indication of
relations between pre-assumption ratings and final ratings. The first three presented brands:
Starbucks, Baresso and Ricco showed a clear connection, whereas the last brand; Waynes stood out.
In pre-assumption ratings, Waynes was rated with the average number of 1,53 while it scored 4.89
in tasting ratings. These findings indicate, that the pre-assumption stage has an important role in
preference evaluations as the ratings illustrate a connection between the individual´s subjective pre-
assumptions for brand preferences (liking) and similar results in the tasting evaluations. H1 is
therefore accepted. Furthermore the results are relevant to a discussion of, whether the preference
system and final choice can be measured by the first glace at the brand or the brand name. If so,
then the first contact with a brand or a brand name is crucial, because that is the moment when
important brand associations are first formed. Whether the first contact leads to final choice is still a
topic that is being investigated by scientists.
33
Appendix 14: Respondents pre-assumptions to brand recognition, liking and measure of quality.
34 Ibid

61
H2: The high quality coffee will be connected with a higher rating, as the coffee quality should
equal the average taste experience and finally the average rating level of taste experience.
Although it was expected that the high quality would taste better, the respondents expressed a
preference for the low quality; on average more of this was consumed (figure 6.9) and it was also
rated higher (Figure 6.5). An explanation for this reaction, might be that consumers tend to prefer
the taste they are used to. According to an earlier thesis dealing with coffee brands, it was
concluded that there are psychological factors in coffee taste formation. (Guldbæk et al. 1992). The
writers stated that taste is determined by one’s habits. For example, if one is used to drinking a
certain coffee one will unconsciously create a preference for this taste, as the taste experience is
created throughout a learning process affected by habits, psychological and social factors. (Ibid).
More than 95 % of the respondents in this study were students and typically students tend to drink
cheap cafeteria coffee, for instance from the school cafeteria. This is the taste they are accustomed
to, familiar with, able to recognize when tasting and therefore also the taste they are more likely to
prefer. Since the high quality coffee wasn’t rated higher than the low quality coffee, H2 was not
scientifically verified. These results indicate that when respondents are not exposed to brands, their
evaluations are more valid. If the respondents were told which of the samples were the high quality
and which were the low, the answers would very probably had been reversed as consumers
typically strive to appear sophisticated, wealthy and signal social reinforcers. (Schaefner, 2007).
H3: Based on the taste, the respondents will be able to detect a difference among the qualities.
Since the majority of respondents preferred the low quality coffee, the test indicates that the
respondents were able to taste a difference in flavor. As mentioned earlier, 64,46% noticed that
some of the flavors were identical. Of these only 8,97 % could determine, which samples that tasted
similar. Often the respondents would think, that non similar samples were similar and vice versa.
This indicates that the majority were not able to distinguish between the different qualities. As the
respondents also evaluated the quality of the coffee samples very differently depending on which
brand they were “hidden” under, the data indicates that the respondents’ taste perceptions were
highly affected by the brand names. E.g. the Starbucks coffee and Waynes coffee are evaluated
differently in taste preferences, even though the coffee taste was the exact same. (Table 6.6).
Besides this the results shows, that Starbucks and Baresso aren’t as affected by quality taste as

62
Ricco and waynes are. This could support to a discussion of whether lower brand equity suppliers
run a higher risk of losing consumer acceptance unless their taste is convincingly good. This in turn
speek to whether consumers seek to buy values, storytelling and experiences in high brand equity
coffee shops meanwhile being convinced that the coffee they drink is a fine quality. The matter of
why respondents got seduced into preferring and choosing Starbucks in cases where it contained the
low quality will be discussed in the analysis.
As the respondents were able to taste a difference among the qualities, but not able to distinguish
between them and since the majority furthermore was affected by the brand names, H3 was not
scientifically verified.
H3a: Even though the respondents may have suspected that some of the presented brand
samples contain the same coffee, they will still rate the tasting of each brand differently.
Out of the 64,46% participating respondents, who noticed similarities in the sample tastes, only 8
(8,97%) could pick out the samples that tasted similar with any accuracy. Out of these 8
respondents, only 1 had an inconsistency between his evaluations and his gut feelings of sample
similarities. Even though he was able to point out precisely which brands that tasted similar, he still
mysteriously managed to evaluate the brands very differently.
As for those who answered yes to noticing similarities in tastes, but weren’t able to distinguish
where the different qualities were placed, out of these the majority tended to evaluate all the brands
very differently. This indicates that even though they had a hunch about some of the samples being
identical, their ratings were not influenced by their gut feelings. Consequently, because the gut-
feelings may have been “unconscious” cues indicating that some of the samples were the same, the
respondents weren’t able to point out were as they weren’t conscious of the fact. H3a is therefore
accepted.
H4: The consumers will consume a higher amount of the high quality coffee.
According to the results presented in the Table 6.4 it is clear ,that the low quality coffee was
preferred. Figure 6.5 also shows that on average the low quality was preferred 3 out of 4 times. The
Table 6.8 demonstrates that the number of consumed low quality was 19.18, while the number of
63
consumed high quality was 17.38. Since the high quality was the least consumed sample, H4 was
not scientifically verified.
These results are worth noticing as it is likely that more of the high quality coffee would have been
consumed if the respondents had been informed about this. In this case their ´wanting` would have
been affected by their liking of the idea that high quality coffee tastes better because it is more
extravagant and expensive.
H5: The coffee the respondents consume more of, will be the coffee they choose to take with
them in the end.
This is in other words the measuring of whether the respondents` ´wanting` leads to final choice.
Figure 6.11 presents a grouping of, how the respondents who chose the individual brands reacted
both in terms of liking and consumption. In every single case, the respondents who chose to take a
Starbucks, Baresso, Ricco or Waynes along to go had expressed a preference for that taste prior to
making their decision. Only one brand stood out and indicated a relation between brand ´to go´,
preference measuring and highest amount of consumption. That brand was Starbucks. In relation to
this, figure 6.11 shows that it is only the liking score, which predicts final choice as the p-value here
is lower than 0,0001 and therefore significant. Starbucks was also the brand, which most of the
respondents chose to take along, followed by Ricco, Baresso and Waynes.35
Since the majority of
the respondents did not choose the brand they had consumed most of along to go, H5 was not
scientifically verified. These findings could lead to a discussion of whether unconscious `wanting´
estimations can ever predict final consumer choices. According to the theory, ´wanting` typically
leads to liking. This was also part of the pattern explored in this study as there was a coherency
between the ´wanting` of Starbucks and the liking of it. But the ´wanting` was, however, not the
strongest measure as the liking estimations were higher and correlated with final brand choice.
35
Figure 6.11: Respondents choice of coffee brand ´to go`
64
H6: The consumers will drink more of the coffee brand they prefer.
As presented in H1, the overall preferred brand in the pre-assumption test, was Starbucks. On
average, the results from figure 6.11 also showed, that the most consumed brand was Starbucks, H6
is therefore accepted.
H7: The respondents will rate the brand: Starbucks positively higher (in pre-assumptions)
than competitors in knowing, liking and perceived quality.
Results showed that in all cases Starbucks was evaluated with slightly higher rates than Baresso.
Since Starbucks managed to get the highest preference scores in both knowing, liking and quality
(Talel 6.1) H7 is accepted.
H7a: Starbucks will be rated positively higher than competitors in taste perception regardless
of which coffee quality is hiding underneath.
As Table 6.4 shows, Starbucks was rated with the highest preference number compared to
competitors in both qualities, H7a is therefore accepted.
8. Analysis, part 1: Exploring the findings
The following analysis sections will roughly follow the four stepped hypothesis categorization,
based on: Main hypothesis dealing with brand effects, control parameters incl. taste and
consumption, conscious and unconscious reaction and finally Starbucks-related assumptions. Firstly
the overall project findings will be examined, then the presented theories will be used for an
examination of the respondent’s conscious and unconscious state of mind. The respondent’s
motivational behaviors will be addressed throughout, and finally Starbucks-related areas will be
researched. All sections will be presented in relation to the main theoretical subjects ´wanting` and
liking.
8.1 The respondent´s unconscious and conscious states of minds in decision
making. One might wonder, why the brands had such a great emotional effect on the respondents’ taste
experiences. Typically, it requires exclusive neuroscientific measuring methods to be able to
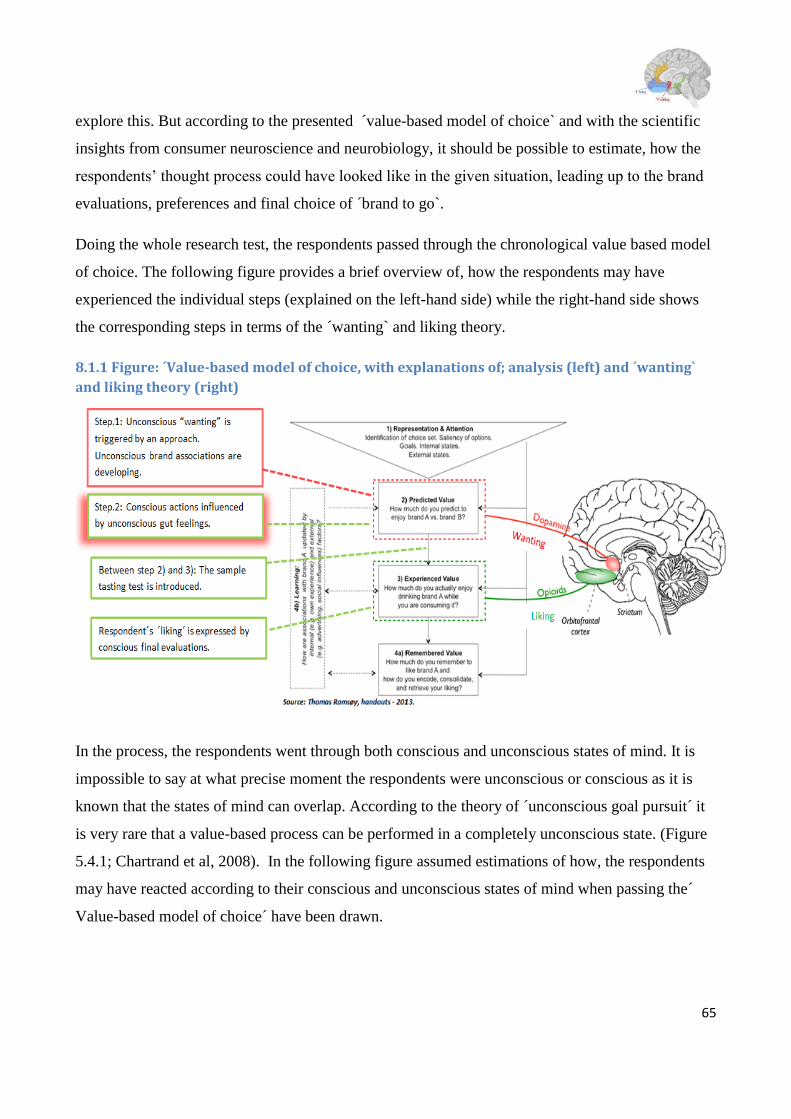
65
explore this. But according to the presented ´value-based model of choice` and with the scientific
insights from consumer neuroscience and neurobiology, it should be possible to estimate, how the
respondents’ thought process could have looked like in the given situation, leading up to the brand
evaluations, preferences and final choice of ´brand to go`.
Doing the whole research test, the respondents passed through the chronological value based model
of choice. The following figure provides a brief overview of, how the respondents may have
experienced the individual steps (explained on the left-hand side) while the right-hand side shows
the corresponding steps in terms of the ´wanting` and liking theory.
8.1.1 Figure: ´Value-based model of choice, with explanations of; analysis (left) and ´wanting`
and liking theory (right)
In the process, the respondents went through both conscious and unconscious states of mind. It is
impossible to say at what precise moment the respondents were unconscious or conscious as it is
known that the states of mind can overlap. According to the theory of ´unconscious goal pursuit´ it
is very rare that a value-based process can be performed in a completely unconscious state. (Figure
5.4.1; Chartrand et al, 2008). In the following figure assumed estimations of how, the respondents
may have reacted according to their conscious and unconscious states of mind when passing the´
Value-based model of choice´ have been drawn.

66
8.1.2 Figure: Nonconscious Goal Pursuit in relation to the respondent´s average reactions.
Source: Composed by the author of this thesis. Inspired by the theory of Chartrand et al, 2008.
In the first part of the value-based model of choice, ´the attention phase´, the respondents typically
noticed the overall big setup placed in the middle of CBS central hall or the eye-catching brand
logos placed on the portable coffee tanks. After having their visual attention stimulated, they were
presented with a framing introduction. At this stage the respondents’ minds were, on an
unconscious level, highly involved in intercepting and relating to the incoming stimulus; e.g. the
presented surroundings, brands, the introduction, their own willingness to participate, former
respondents’ body language, the observing crowd, the coffee scent etc. (step 1- marked with blue).
During this phase the respondents’ minds had also been operating fast, automatically and
effortlessly. (Kahneman, 2003). They had quickly been drawing associations to each logo working
at top speed to evoke the conscious relations (Ibid) and arrive at a clarification of, whether the
respondent was interested in the brands or not.
The attention phase plays an important role, since that is where the interest of potential respondents
was aroused. Equally, this phase also played an important role as the respondents’ final evaluation
could have been affected by the signals received in this phase. According to Simonson, consumers
(in this case respondents) typically are unaware that their decision-making is being affected by the
information processing from the manipulated stimulus or instructions. (Simonson, 2005). If asked,
nor would they be able to verbalize their cognitive processing leading to the choice-making, since
they would believe they were being guided by rational considerations. (Plassmann et al, 2012).

67
This also suggests, that the respondents created their first positive or negative impressions during
this phase. These impressions were subsequently expressed in the questionnaire (part 2), but it can
also be assumed that the results, even later on, were integrated and used in respondents’ final
choices (step 6). As Simonson, 2005 also states“..many choices are made and are strongly affected
by the environment.”(Simonson, 2005 p.211).
The second part in the value-based model was ´predicting value´. During this part the respondents
had been trying to relate to presented logos. It was assumed that the respondents’ actions in this
case, were conscious as they had to give their primary brand opinions on a scale and express, which
associations they had to the brand. The respondent´s opinions had however not been expressed in
full conscience as it is assumed that parts of these estimations were affected by their gut feelings.
Gut feelings are typically hunches based on parts of visceral cues (Edward et al, 2001) encouraging
initiative decision-making. (Mayer, 2012). The gut feelings may therefore have appeared as
unconscious signals indicating the respondents’ ´wanting` needs. This was expressed through the
brand associations as the associations consumers draw to the incoming stimuli contribute to the
value consumers unconsciously pass to the products and use in decision making. (Simonson, 2005).
This indicates, that the conscious opinions they gave on scale had been affected by the unconscious
thoughts and probably also brand associations, which had been fluctuating in their minds seconds
before the test even started. This process is something a respondent or a consumer typically has
very limited insight into, as Simonson states “Unconscious thought tends to improve the quality of
decisions.” (Simonson, 2005 p.211). This also explains, why consumers in general can have
difficulties in explaining why a certain choice is preferred. The answer is, simply because they have
no chance of articulating a conscious insight into their own unconscious thought process.
Before leaving the predicted value and entering, ´the experienced value`, respondents were
presented with a sampling tasting test (part 3). Here they were of course highly conscious of what
was happening. But when the respondents tasted the samples they were unconscious about the fact
that their taste experience could have been affected by the primary scale evaluations. Therefore,
their taste experience had in some degree been framed by the associations and scale brand
evaluations they filled in just seconds before in the first part of the questionnaire.
68
Additionally, when the respondents then had to make a new scale evaluation and express their taste
experience (in step 5), one would expect these to be given rationally and without impact from the
earlier brand evaluations (in step 2). But interestingly enough the results showed an extremely close
relation between the average numbers from the pre-assumption test and the sample tasting test.
8.2 Exploring the respondents´ motivational behaviors in decision-making From the pre-assumption test the respondents expressed the following: they knew the Starbucks
brand best (7,74), liked it the highest (6,98) and placed their quality the highest (7,27).
Surprisingly, they also evaluated the Starbucks tastings to be the best (6,50) and finally the majority
also choose a Starbucks coffee to go (46 %).
This indicates that before the respondents even got to consuming any of the samples, they already
unconsciously had a hunch of how much they “wanted” to consume as they unconsciously related
the individual brands with either positive associations and thinking processes such as “Good,
quality, good taste – I therefore want this product and will enjoy drinking it” or negative
associations and thinking processes such as “Overrated, expensive, commercialized - I don’t like
this brand and therefore not interested in drinking that much of it”. (Appendix 2: Free associations
test; Starbucks).
One might wonder, why the pattern looked like this when there were other strong, more familiar
Danish brands available, such as Baresso. According to theory, the stronger a company´s brand
equity is, the higher chance there is for consumers to know the brand and form positive associations
around it. (Keller, 2012). The better a consumer knows a brand, the higher their chance of
recognizing its logo and associating it with something positive. The brand then has a much better
opportunity of building close relations and customer loyalty. (Keller, 2012). One reason to assume
this is that consumers tend to be creatures of habit36
and also consumer choices and opinions tend to
be controlled by stimulations and storytelling. - ”Brands ´work their magic` by associating
themselves with experiences, which in turn influences subsequent retrieval and recognition”
(Plassmann et al, 2012 p. 27). The more consumers are used to seeing or using a brand, the more
36
Human are creatures of habits. Our everyday life fluctuates around many of the same routines.( Dr Marta Gonzalez
of Northeastern University, Bosto; BBC news; Mobile phones expose human habits). Especially coffee drinkers, who
tend to get a specific close relationship to the certain coffee taste they are used to drinking. (www.politikken.dk:
Kaffedrikkere er vanemennesker).
69
they like it. But because respondents like the brand, it doesn’t mean that they automatically also
´want` it – at least that is what the results showed. (Figure 6.9).
Typically, consumers tend to bend their beliefs to fit with what they are told to believe. An example
of this is a study done by De Araujo et al, 2005. The study showed that activity in the medial OFC
in response to an odor depended on whether subjects believed that they smelled cheddar or body
odor. (Plassmann et al, 2012; De Araujo et al, 2005). This is the exact same reaction explored in this
research, as the results indicated a connection between the liking-measurements and a belief in the
Starbucks sample being best in taste, even though the coffee was similar to Baresso. One can
imagine that if it had been possible to measure their brain reactions, their OFC areas (which links to
their liking) would have been activated, just as prior studies have indicated.
In another study by (Plassmann et al, 2008) it was discovered that an activity in the medial OFC
while consuming wine, depended on the respondent’s beliefs about quality in relation to price.
(Plassmann et al, 2012). Yet, another study discovered that activity in the medial OFC and
experienced values depended on, whether the respondent believed that the paintings being shown to
them were made by a professional artist or an amateur. (Plassmann et al, 2012; Kirk et al, 2009).
Taken in unison, these studies amply demonstrate that the consumer´s (aka respondent´s) individual
experienced valuation systems are motivated and controlled by cognitive processes that develop
certain expectancies and beliefs – a phenomenon often referred to as the ´placebo effects of
marketing´ (Plassmann et al, 2012) or, in psychology, as ´the power of thoughts´. In research done
by neuroscientist De Martino, it was discovered that the framing effect was linked to neural activity
in the amygdala and that another brain region, the orbital and medial prefrontal cortex (OMPFC),
appeared to moderate the role of emotion on decisions. (De Martino et al, 2005). Again, this tells us
that the human brain: thoughts, emotions and decision-making are affected by the way information
or studies are presented, like in this study where brand labels were used as parts of the framing
effects.
Another study by Plassmann et al, 2012 explored the fact that certain recognizable brands had an
effect on respondents’ emotions, memory and their final decision making. Those respondents, who
were loyal customers of a brand had a higher level of rewarding feelings and vice versa with the
non-loyal customers. These results indicate a similarity to the findings of this study, as the strong
70
brands developed an emotional tie, being the dominant motivating factor for the level of the
respondents’ ´wanting`, final liking, preference, choice, loyalty and attachment. In this context, the
study of Coca Cola vs. Pepsi Cola, which was presented earlier on, can also be drawn into
perspective as findings from this research explored how consumers tended to prefer Coca Cola as
the stronger brand compared to Pepsi. (Plassmann et al.2012). In my study respondents showed the
exact same reaction pattern when preferring Starbucks.
All of these examples speak to the fact that consumers’ ( aka respondents’) experienced valuation
systems were modulated by higher cognitive processes such as those found in their liking
evaluations. Therefore if the respondent believed it was a Starbucks, Baresso, Ricco or Wayne
coffee he or she was drinking, the taste experience was fitted to values and associations drawn to
the individual brand.
8.2.1 Preliminary conclusion
Bringing all of the findings together it can be conclude, that this research study explored how two
different motivation systems (the ´wanting` and the liking) based on neurobiology contributed
differently to the understanding of the consumer brand decision-making. To begin with it was
assumed, that the ´wanting` system would be inaccessible to subjective reports and have a strong
and direct impact on actual choice behaviors.
In the theoretical part it was explored how, in accordance with the theorists Plassmann et al, 2012, it
was possible to predict mental processes “without asking consumers directly for their thoughts,
memories, evaluations or decision-making strategies.” (Plassmann et al, 2012 p.22). In this case, it
should have been able to estimate the consumers’ decision-making by measuring their ´wanting` of
the coffee samples, as the ´wanting` system relates to the emotional system which then links to final
decision-making. This was, however, not the case in this study as it appeared to be the liking system
which had a direct impact on the respondent´s choice behaviors. According to the theorists
Berridge, this finding is not unusual as “research suggests that sometimes the link between emotion
and motivation may not be so tightly aligned.” (Berridge, 1999; Dai, 2010).
71
9. Analysis, part 2: Measuring the effects of how consumers perceive and
relate to the Starbucks brand
In extension of my analysis of the respondents’ decision making process, the goal of this section is
to explore why the respondents were affected by the Starbucks brand. (A brief overview is given in
the model of their cognitive brand effects, which can be found in the appendix: 16).
In the research introduction, the questionnaire, and the chronological order of samples, Starbucks
was mentioned first, in order to optimize coherency. It also set the stage of letting the respondents
focus and relate to the main brand as the first thing in every research question. In order to discover
how the respondents related to Starbucks compared to other coffee chained brands in Denmark, it
was essential to integrate a number of possible competitors, which they had to relate to before doing
the coffee tasting test.
In all categories, Starbucks got the highest scores (marked by grey in table 6.1). This clearly
indicates that Starbucks was viewed as the most well-known and preferred brand. The score
difference between Starbucks and Baresso was minimal, however. This shows that even though
Baresso has been in the market for almost 10 years and is highly well-known amongst almost all
Danes, Starbucks is evaluated as being better known and more highly preferred. These are
interesting results indeed, as one would imagine that Danes know a Danish brand better than an
international brand, which they might only have visited while traveling abroad. An explanation for
this behavior can be that the respondents recognize the Starbucks brand more quickly than the
Baresso brand as it was placed as the first brand in the row and also because of its strong brand
equity which makes it more recognizable. In a study by Ambler et al. 2004 it is stated that “Brain
activations in brand choice differed from those for height discrimination, and choice times were
faster when one brand was more familiar.”(Ambler et al, 2004 p.247). Another study by Litt et al,
2011 found that “under pressure, people often prefer what is familiar, which can seem safer than
the unfamiliar.” (Litt et al, 2010. P. 524). This could also be an explanation as to, why the
respondents preferred Starbucks - simply because it might have been the safest choice as it was the
strongest brand they could choose in a time-pressured situation. Continuity, a unitary decision
making model explains that “An alternative is chosen based on part experiences stored in
memory.” (Sirgy et al, 1986 p.164). This corresponds with the assumption of Starbucks being the

72
most recognized brand. Likely, it was assume (as stated earlier) that the respondent´s preferences
might have been decided on a non-conscious level given that much of “judgment and behavior
occur without conscious awareness or intent.” (Bargh, 2002 p. 281). Such choices may also be
referred to as nudges, which according to Thaler et al, 2009 is defined as “a nudge is any factor that
significantly alters the behavior of humans, even though it would be ignored by Econs. Econs
respond primarily to incentives”. (Thaler et al, 2009 p.8). In accordance with the psychological
nudge theory, the Starbucks brand would appear as a nudge as it has a strong unconscious
motivational effect on the respondents leading them to prefer the brand without them knowing
exactly why. (Thaler et al, 2009).37
In the quality rankings, Starbucks was the first runner up. An explanation as to why the respondents
placed the Starbucks quality on the highest level compared to the competitors could have been
because of the fact that, beforehand, the respondents had evaluated Starbucks with the highest score
in the question of, how well they knew the brand. If a respondent had extensive knowledge of a
brand, liked it or associated it with high brand equity values, then the respondent may also have
been very tempted to place their product qualities with similar scores. Indeed, doing the opposite
would have made less sense. The respondents are typically much less aware of their own brand
effecting and have very little insight into their own consumer behavior. Therefore, when the
respondents placed the qualities of the Starbucks products higher than those of the competitors, it
may have been because the respondents had unconscious gestalts fluctuating creating a thought
pattern, which could have been “…since I like them the most it’s because their quality is better than
the others” or “I rated Starbucks the highest, I must do this with their qualities as well, so I won’t
appear as an unsophisticated taste judge”.38
9.1 Analyzing the associations So far no behavioral or scientific study has tried to discover, how brand associations can affect
´wanting` and liking. (Plassmann et al, 2012). In this study, it was discovered that there was a clear
37
The psychological nudge theory is a concept used in “behavioral science, political theory and economics which argues that positive reinforcement and indirect suggestions to try to achieve non-forced compliance can influence the motives, incentives and decision making of groups and individuals alike, at least as effectively – if not more effectively - than direct instruction, legislation, or enforcement”(Wikipedia; http://www.psa.ac.uk) 38
This quote is inspired from a male respondent, whom after the tasting evaluation said: “Well, I guess I answered all
the brands differently as I didn’t want to appear as an unsophisticated taste judge, even though I could taste a
difference”.

73
connection between the number and type of associations and ´wanting` and liking measurements.
For example, Starbucks had the highest number of positive associations, which in itself could have
indicated an unconscious ´wanting` response to the brand (Plassmann et al. 2012) e.g. Plasmann
states:
“Remembered value refers to how different brand associations are encoded, consolidated, and
retrieved in the consumer´s memory. Recent research suggests that parts of these processes happen
on an unconscious level.” (Plassmann et al, 2012. p.27).
In accordance with this statement, it may have been indicated just from an association analysis, that
Starbucks would turn out to be the most preferred brand, as the associations give a clear picture of
the respondents’ likings. Besides getting the highest number (122) of positive associations
compared to competitors they also had an average score of associations, representing 100% of the
number of participants.39
The positive associations the respondents typically used to describe
Starbucks were often “trendy, popular, trendsetter, good taste, nice environment, global, quality
conscious and fair trade etc. St”.40
All these terms denote a strong brand equity and an optimal
marketing strategy approach by Starbucks. The majority of positive associations were typically
brand attributes, which characterized products or services surrounding Starbucks.41
The most
commonly used association was ´Quality´.
As for the negative associations, the respondents were also in agreement about viewing Starbucks
as “expensive, overpriced, overrated, mainstream and too commercialized.”Among these the
majority of associations were also attributes and the most commonly used association was
´expensive`. The respondents’ results furthermore showed, that the brand that got the least negative
associations was Ricco. They got 56,5 % of positive association and only 2,4% of negatives, while
Starbucks got 37,7% negative associations. This leaves us to wonder whether Starbucks’ biggest
competitors might be small cafés as Ricco and not the big mainstream coffee chains as Baresso.
Grant, 2010 supports this notion in a Starbucks analysis which stated that “Starbuck´s traditional
competitors were independent coffee shops and cafes, some of which may grow into local chains.”
(Grant, 2010 p.505).
39
Appendix 2: Free association test results 40
Appendix 2.b: The respondent’s associative network in relation to Starbucks. 41
Appendix 2.a: Analysis of the Starbucks associations.
74
Given that the majority of the associations were brand attributes (147) and not brand benefits, this
does not explain the respondent’s acceptance and preference of Starbucks. But it gives a hint of how
the majority thinks of Starbucks and the fact that they don’t have a majority of negative related
thoughts does say something about their gut-feelings, unconscious relations, and maybe even their
´wanting`-response to the brand as some of the associations can be linked to a stimulation of their
circuit. As Schaefer et al, 2007 write, “Cultural objects associated with wealth and social
dominance modulate the reward circuit”. (Schaefer et al, 2007, p.141). It should also be mentioned
that the two most common contrasting associations, ´quality` and ´expensive`, somehow balance
each other out since quality is typically thought to be expensive. This means that overall Starbucks
is still well-positioned to maintain a positive relation.
9.2 Measuring how the Starbucks brand had an effect on the respondent´s
´wanting` and liking The liking and ´wanting` measurements, presented in table 6.4 and 6.8 showed, that the respondents
liked the taste of the Starbucks samples better than the competitors in both the low and the high
quality coffees. Continuously, the measuring differences between the low and high quality
(whiskers/SEM) showed to be least in the Starbucks bar (Figure 6.11), indicating that it didn’t really
matter which quality coffee the samples contained. In relation to ´wanting` Starbucks was the brand
the respondents consumed most of, yet again regardless of which quality the samples contained.
According to the ´wanting` and liking theory it is typically experienced that ´wanting` leads to
liking or that liking leads to ´wanting`. (Berridge, 2009). In this study, the coherency theory was
verified, as the majority of the respondents’ ´wanting` (consumption) in average also indicated their
liking (scale evaluations).Their liking estimates, however, were a bit higher than their ´wanting`
measurements.(figure 6.11). The results could potentially have turned out to be different as “people
can come to both want something more and like it less”. (Litt et al, 2010). Throughout the testing it
was noticed that a minority of the respondents expressed a disliking towards Starbucks but at the
same time evaluated the taste of the Starbucks samples better than the others. Furthermore they also
tended to choose a Starbucks when asked to pick a coffee to take along. One would imagine an
opposite reaction to have happened given that they had expressed a distance to the brand.
A scientific explanation to his behavior might be, that if they normally had been thwarted from
obtaining this product (due to their disliking) the situation might have incurred them to express their
75
unconscious ´wanting` of the product as “being thwarted from obtaining a desired outcome-can
concurrently increase desire to obtain the outcome, but reduce its actual attractiveness”. (Litt et al,
2010. p. 118). The desires of these respondents were expressed by their ´wanting` measures (which
were positive) and their actual attractiveness by their liking measures (which also were negative)
but their pre-assumptions which had been negative. Their responses indicate, that they (as many
others) had been manipulated by the framing set-up despite the fact that they didn’t even like
Starbucks to begin with.
Results from the liking estimations also showed, that in the Starbucks bar the size of the wisher
(SEM) was smaller in-between measurements of the high and low qualities compared to the
´wanting` estimations. An intriguing interpretation of this observation might be, that the
respondents experienced an emotional “attraction” in response to Starbucks without experiencing a
physical “attraction” to it. (Dai et al, 2010 p.325). A similar reaction was seen in a pizza
experiment, where non-hungry respondents were asked to evaluate the taste of a pizza. This study
showed that even though the respondents were full and did not “want” to eat the pizza they still
were able to rate the taste of the pizza with a positive high liking. (Cornell, Rodin & Weinarten,
1989; Dai et al, 2010). Therefore, it can be stated that even though the respondents in this coffee
test didn’t want to drink the Starbucks coffee, they were still able to evaluate the taste with a
positive score.
Another observed situation which stood out was the fact that the majority chose a Starbucks coffee
´to go`. One might wonder why this was the case when the cup they took with them wasn’t labeled
with the Starbucks logo? If the cups had been labeled it might have been possible to conclude that it
was because it signaled social reinforcers such as wealth and social dominance. (Scaefer et al,
2007). Likewise, it might have been because 1. The brand image related to the respondents’ own
image 2. The brand image was in direct association with their self-concept or 3. It was a
differentiated product image (Sirgy, 2013) and therefore appeared to be a more interesting brand
compared to the Danish competing brands. It is assumed that it must have been adequate and
motivational enough for the respondents, to know/believe for themselves that it was a Starbucks
coffee they were carrying. As Sirgy concludes, “a product having an image of “high status” may
activate both a self-schema involving the self-concept “I” and a corresponding linkage between
that self-concept and the image attribute (self-image) involving “status”. This linkage connects the
76
self-concept “I” with the “status” self-image and is referred to as self-image belief”. (Sirgy, 2013
p. 289).
It is therefore believed, that the respondents choose the Starbucks brand, as this appeared to be the
strongest brand which gave the respondent an opportunity to boost own actual self or ideal self.42
This could furthermore be dominating factors explaining why the respondents both wanted and
liked the Starbucks brand more than the competitors.
According to Usunier et al, 2009 Danish consumers belong to an equalitarianism society.43
(Usunier
et al, 2009). Here they act as individualist and independent selves. Their personal consumption,
preferences and choices typically reflect their taste, values and convictions. (Usunier et al, 2009).
This underlines the assumption of the respondents choosing a Starbucks cup, because of the values
they put into the brand. The topic of comparing consumer self-psychology with ´wanting` and
liking and decision making investigations calls for further research.
This leads to a final explanation of, how the set-up and the contextual situation may have been
leading participants to prefer the Starbucks brand. This could simply have been because the four
presented brands came from different backgrounds. The three presented competitors came from the
coffee-chain market while Starbucks was the only presented brand with a presence in many
diversified markets.“People can have different representations of a preference in different
contexts.” (Dai et al, 2010 p.3) .This could have given rise to a situation, where Starbucks appeared
to be more interesting and special as it was the newest, strongest and most diversified brand.
10. Discussion, from a marketing perspective
The purpose of this perspectival section is not to put down marketing research methods, but simply
to give a brief introduction of how my research findings and consumer neuroscience methods can
contribute to a clarification of the shortcomings in two behavioral consumer marketing models. To
42
Definition: “Actual self refers to how a person perceives herself; ideal self refers to how a person would like to perceive herself; and social self refers to how a person presents herself to others.” (Sirgy, 1982 p.287). 43
Equalitarianism: Strong equalitarian values, where both husband and wife share power throughout all levels of society. (Unusier et al, 2009 p.71)

77
this date marketing science is built on social constructionism and constructivism.44
(Ramsøy
lec.1;Young et al, 2004). Neuroscientists working within marketing fields therefore call for a
neuroscientific theoretical integration or a revision of these models. (Ramsøy lec. 1).
10.1 Consumer neuroscience measuring methods vs. marketing measuring
methods According to the scientist Thomas Ramsøy, the general marketing methods (which still appear in
many scientific books and are used among marketers) are lacking in scientific perspectives, which
implies “a comprehensive view of consumer decision that incorporates the full range of the
decision making process: Conscious and unconscious, Rational and irrational.”(Ramsøy, 2012
lec.1 pp.12). This is the fact as the benefits of using neuromarketing/consumer neuroscience
theories and research methods in exploring marketing related topics is, that it contributes with a
deeper understanding of how the consumer mindset functions and responds to advertising, including
attention, emotions, memory and decision making. (Ramsøy 2012, lec.1). This allows the researcher
to explore consumer psychological behaviors from out of a psychological and neuroscientific
perspective that goes beyond the knowledge marketing models so far have been able to contribute.
Besides this the brand tracking research methods as e.g. eye-tracking and EGG measurements allow
the research to discover, how brand building and brand strategy formulation and execution can be
optimized. 45
By using consumer neuroscientific theories in this thesis it has been possible to explore and analyze,
how two of the consumer´s motivational systems (´wanting` and liking) are affected by strong brand
equity signals. Continuously, it is explored how the motivational liking system had a subsequent
effect on the consumer’s final choice of coffee ´to go`. This process was set up to reflect
consumers’ relations to the Starbucks brand, how it affected their motivational systems and their
decision-making. The data-collection and research set-up was inspired by marketing research
methods, but nevertheless stood out as the applied theoretical perspective was drawn from
consumer neuroscience, such as “The Value-based model of choice”.
44
In this thesis “constructivism is distinguished by its focus on how the individual cognitively engages in the construction of knowledge from social construction which claims that knowledge and meaning are historically and culturally constructed through social processes and action.” (Young et al, 2004 p. 373). 45
Appendix 12: Neuroscientific measuring methods.

78
10.2 Hierarchy-of-effects models An explanatory marketing framework which has been dominating the communication literature for
decades is the hierarchy of effects models. With a focus on consumer attitude, behavior,
consumption and decision making their primer goal is to predict how consumers respond to
advertising or how they process a communication message. (pelsmacker et al, 2010). In these
models the consumers typically go through three different stages, namely “a cognitive, an effective
and a conative stage, or a think-feel-do sequence.”46
(Ibid, p. 86). If this approach is transferred on
to the respondent´s behavioral processes in this thesis, it would have meant that the respondents
1.became aware of the Starbucks brand, 2. developed an affective response or formed a certain
attitude towards the brand and 3. Their feelings our attitudes would have led them to prefer/choose
the Starbucks brand. Therefore, a very simple though unfortunately also a non- adequate
examination of the decision-making process. As the marketing specialist Patrick de Pelsmacker
says: “One thing we have learnt so far is that no single theory can explain it all….it is not
surprising that marketing communication do not always work as they should.” (Pelsmacker et al,
2010 p. 86).
10.3 AIDA model The most well-known and used hierarchy-of-effects models (HOEM) is the AIDA, St Elmo Lewis
model from the 1900s, however the model most frequently referred to in literature is the Lavidge
and Steiner model, 1961. The main differences between these two models are primarily that
Lavidge and Steiner integrates a more descriptive and detailed section within each process step and
divides the stages into three main areas: “cognitive-affective-behavior”. As the AIDA model does
not divide the steps into these stages and since it is also one of the oldest marketing models, the
perspectival focus will be put on the
Lavidge and Steiner model.
Figures: The hierarchy-of-effects models, AIDA,
St Elmo Lewis 1900 (left). Lavidge and Steiner,
1961(Right).Source: (Pelsmacker et al, 2010).
46
Cognitive stage: Consumers engage in a mental thinking process which leads them to awareness and knowledge of the brand. Affective stage: emotional or feeling responses occur. These are associated with the brand leading the consumer to form attitudes to the brand. Conative or behavioral stage: actions are performed, such as buying the product. (Pelsmacker et al, 2010).

79
Throughout the research analysis it was discovered how relevant and how highly difficult it is to
distinguish the consumers’ ´conscious` and ´unconscious` thinking process that leads to brand
awareness and knowledge. This was done by using ´the value-based model of choice` (VBMC) with
an integrated ´wanting` and liking theory and the perspectives from the ´non-conscious goal
pursuits´ model. Furthermore the many factors that play an important role in understanding
consumer awareness, preference and final choices, is discussed. The theoretical and scientific
insights, which were taken into account came from psychological, biological, sociological and
neurological fields though presented through consumer neuroscience. Some of the important
findings were the differences distinguished in the measuring of the consumer´s unconscious
consumption and conscious liking ratings.
Overall, these findings gave a slight though important insight into the shortcomings of the HOEM
(Ladvieger and Steiner) as this model doesn’t take the explored ´unconscious` and biological factors
into account. The model only divides and informs the marketer about the three stepped
psychological procedure which forms the basis of the focus areas: Awareness, knowledge, liking,
preference, conviction and purchase. In accordance to the HOEM it is assumed that the consumer is
full conscious on all levels. Through the ´non-conscious goal pursuits` it was explored that this is
not always the case. Based on the earlier findings it in fact seems as if there is a greater chance of
the consumer being exposed to unconscious motivational driving forces than conscious driving
forces.
In the value-based-model of choice (VBMC) the consumer goes through five steps. Some are
parallel to the HOEM and some are not. These parallel sections are ´1) Representation and
attention` from the VBMC and the ´Awareness` in the HOEM. Also, the ´2) Predicted value` from
the VBMC and the Liking/preference in the HOEM. One of the steps that stands out in the VBMC
are the ´3) experienced value` as this step focuses on the consumer´s level of ´wanting`. The closest
the HOEM comes to this unconscious state of mind is through measuring the consumer’s
knowledge in the cognitive stage which then leads to liking in the affective stage. Thus,
unconscious ´wanting` and ´knowledge` are very different as a consumer´s expressed knowledge
typically is based on a conscious reference stored in memory. In addition to this, a state of mind
which the HOEM does not take into account is the consumer´s/respondent´s encoding,
consolidation and retention of the presented brands. This has a high importance as the respondent’s
80
results can explore how preferred or how popular a brand may be. Furthermore the HOEM does not
account for the essential learning process which can have a great effect on the consumer´s updated
values, associations and final decision-making. Both of these important areas is possible to explore
the ´4a) Remembered Value` and ´4b) Learning` in the VBMC.
10.4 The result findings in a marketing perspective In relation to the result findings and marketing measuring methods, it is explored how consumers’
taste preferences were highly affected by brand logos. This underlines the fact that if a marketing
research is set to discover consumers’ general like or dislike of a product etc. the results would be
biased as the consumers had been informed of or presented with the brand or brand logo.
Another noticeable factor this study indicated was that in research situations, where the time
between tasting, evaluating and final choice of product is short there can be a chance that the results
from ´wanting` and liking will be very similar. The reason for this could either be (as explored
earlier) because the ´wanting` evaluations are affected by the liking evaluations from the pre-
assumptions. Though it could also be that the ´wanting` estimations had been inaccurate measured
as the coffee samples simply had been too small, prohibiting the respondent in leaving potential and
measurable leftovers. In a plain marketing context, these considerations would not even have been
discussed as ´wanting` and liking theories belongs to neuromarketing.
Finally other results highlighted and confirmed the efficiency of using a general marketing practice
which has been practiced for decades. This is the case of questioning consumers about their
preferences and not just observing their behavior. Since the results showed that there was a clear
connection between the liking measuring and the respondent’s final choices, it highlighted the
importance of asking consumers about their preferences and not just measuring them as it was done
with the ´wanting` results. The importance of questioning consumers about their preferences can
further be backed up by the earlier explored theory which indicated that even though ´wanting`
typically leads to liking (Berridge et al, 2007 ) it often occurs that consumers tend to “want” one
thing but “like” another. (Plessis 2011, Read Montage).
11. Conclusion
Several researchers have taken an interest in measuring, how brands and other prestige parameters
have an effect on consumers’ motivational conscious liking and unconscious ´wanting`. Although it

81
was proven to be very difficult to distinguish between these systems based on a behavioral research
framework, it was of course not impossible to explore findings and draw statistical patterns. As
mentioned in the limitation section, it is important to note that many parameters beyond, what has
been possible to explore in this thesis have an effect on consumers’ psychological behavior and
brand choice. This is noteworthy in conjunction with reverse inference and the assumed physical
brain affects. Throughout the study process it was discovered, that so far no behavioral research had
explored, how brands may have an effect on the consumer´s ´wanting` and liking systems, and
neither had any researcher explored the relations between the consumers’ associations and their
´wanting` and liking of a brand. The theoretical presentation in combination with the analysis of the
respondent´s associations allowed us to explore, how the brands hold intangible benefits and
meanings to the consumers. Continuously, it was discovered that the Danish consumer in this way
used brands as a tool to construct their identity and send signals of their self-concept to the
surroundings.
The goal of this thesis study was to answer the central research question: “How does the Danish
consumers relate to the brand, Starbucks? Specifically, how does Starbucks have an effect on
Danish consumer´s unconscious and conscious motivation systems and decision-making?”
Overall, the findings explored how coffee brands in general have an effect on consumers’ taste
experience. In addition to this, it was discovered that the Danish consumers’ taste experiences and
preferences are extremely affected by their primary brand expectations, assumptions and relations.
When the respondents were told that they were drinking a certain brand, it showed that their
expectations and sympathy for this brand affected, how they experienced the taste. In cases where
they had expressed positive pre-assumptions and associations towards a certain brand it also
showed, that they found the specific brand sample to be better in taste. This pattern appeared to
apply very strongly to Starbucks. Even though the Baresso sample (which stood next in row) in all
cases included the exact same coffee, the majority all preferred the taste of the Starbucks samples.
This clearly indicated that Starbucks has a high effect on the Danish consumers motivation systems,
response and choice.
In the course of the analysis, it was explored the fact that Danish consumers were not able to
distinguish between the taste differences in coffee qualities. However, it turned out that the quality

82
put into the samples, had a remarkable effect on the consumers’ liking or disliking of the coffee
taste. To my big surprise it appeared to be the low quality, which was preferred among the majority.
These findings underlined the fact that consumers seem able to act more rationally when blind
tested as their final experiences chiefly depended on the brand name.
The results findings of the (conscious) liking and (unconscious) assumption measuring showed, that
the respondents consumed more of the brand they preferred. This indicated a great interconnection
between liking and assumption estimations. The liking results turned out to be the most important
and dominating measuring factor as the Danish consumers’ liking estimations continuously
corresponded with their final choice of the brand ´to go`. In other words, their motivational
conscious liking system was a stronger measuring factor than their motivational unconscious
´wanting` system. The most preferred brand in both liking and consumption was ultimately
Starbucks, which also was highest rated brand regardless of qualities. When exploring the Danish
consumers’ brand relations and pre-assumptions, it was discovered, that the Starbucks brand
received the highest number of positive associations, along with highest scores of how much they
liked the brand, knew the brand and finally how they placed its qualities.
Based on all the findings, it can be concluded that the Danish consumer mindset relates to Starbucks
in a highly positive manner and seems to be very bonded with its values and framing. Also it may
be assumed that the Starbucks brand can expect a great chance of successfully competing on the
Danish coffee chain market. Considering the high amount of diverse Danish consumers, Starbucks
must of course take into account, that these study results were based on a minor number of
respondents belonging to a certain subgroup. However, the results give a limited indication of the
Danish mentality towards the brand. Although a slight number of respondents expressed a dislike
and/or negative association to the brand, it can be concluded that Starbucks holds dominating
positive relations to the Danish consumers and that the brand has a high effect on both their
motivational ´Wanting` and liking system.
12. Where do the coffee suppliers go from here Throughout this thesis it has been explored how the Danish consumers related to the coffee
supplier, Starbucks. This was done by researching the Danish consumer´s unconscious and
conscious motivational systems, amount of consumed coffee, their brand associations and finally

83
their willingness to choose the brand. Since Starbucks was compared to three Danish coffee
suppliers: Baresso, Ricco and Waynes, it has also been possible to explore the Danish consumer´s
relations to these brands. The discovered findings in this thesis can therefore, beside Starbucks
contribute to an optimization of all the several mentioned coffee supplier´s strategic marketing
initiatives.
As Starbucks in this moment is developing expansion strategies of where and when to expand their
coffee-shops in Denmark, the research findings and methods are highly current. First of all because
they support the fact that Danish consumers have a high interest in the brand and its products,
secondly as the presented consumer neuroscientific theoretical measuring methods indicates how
Starbucks, is able to optimize their strategic marketing methods, by using these research methods. It
is therefore recommend that Starbucks take advantage of an upgraded neuroscientific research
approach (e.g. eye-tracking or an EEG measuring47
) as many new targeted strategies can be
discovered in this way. Even though Starbucks already is a strong and successful brand, these tools
will give them an opportunity to maintain their future success and optimize the Danish tailored
marketing approaches as: advertisement approaches, a cultural fitted product line, shop
surroundings, prices etc. A cultural fitted Starbucks study that can be examined by an eye-tracker is
e.g. a sense marketing study, were the most optimal coffee scent for the shops can be explored.
Furthermore, it is possible to explore the question of how Danish consumer´s would respond to a
price offering coffee campaign. This is very current as Danish consumers are living in a price
offering culture, and known to be one of the most price offering effected consumer´s world-wide.
(Hyltoft, 2012).
Besides Starbucks the research findings can also be applicable to the three competing brands or
other coffee suppliers who unluckily experiences that a Starbucks shop becomes their neighbor.
This study allows these coffee suppliers to examine the consumers associations, so that they will
know which values they need to maintain or further develop in order to compete with Starbucks
which is a strong and dominant coffee-supplier. In addition, the competitors also have an
opportunity to get insights into how and which stimulus that triggers the Danish consumer's
unconscious motivation and choices. A strategic business and marketing knowledge, which is
substantially useable, even for small coffee suppliers.
47
Appendix 12: Measuring methods in neuroscience/neuromarketing
84
13. References
Aaker, D.A. (1991). Managing brand equity: Capitalizing on the value of the brand name. New
York: The free press.
Aaker D.A. (1996). Building strong brands. London: Simon & Schuster UK Ltd.
Andersen, Jacob. (2007). Livet er ikke det værste man har, Kaffens kulturhistorie i Danmark 1665-
2015[Kbh.]; Gyldendal.
Antonio Damasio, (2001). Fundamental feelings. Concept. Macmillian Magazines Ltd.
Ambler Tim, Braeutigam S., John S., Rose S., and Swithen S. (2004). Correlates of shopping
decisions. Psychology and Marketing.
Armiage, Christofer J., Conner M. (2001). Efficacy of the Theory of Planned Behavior: A meta-
analytic review. British Journal of Social Psychology (2001), 40, 471–499
Ajzen, Icek. (2012). Martin Fishbein’s Legacy: The Reasoned Action Approach. The ANNALS of
the American Academy of Political and Social Science 2012 640: 11
Baresso official website page, explored in (2012/2013). through www.Baresso.dk
Bargh, John A.(2002) Losing consciousness: Automatic Influences on consumer judgment,
Behavior, and Motivation.
Ballard, K., & Knutson, B. (2009). Dissociable neural representations of future reward magnitude
and delay during temporal discounting. Neuroimage, 45 (1), 143–150.
Bechara, A. & Damasio, A. (2005). The somatic marker hypothesis: A neural theory of economic
decision. Games and Economic Behavior 2005(52), 336-372.
Bedbury, S. and Fenichell, S. (2002). A new brand world 8 principles for achieving brand
leadership in the 21. St century. New York: Viking
Bernard J. Baars and Nicole M. G. (2010). Cognition, Brain and Consciousness. Introduction to
Cognitive Neuroscience. Elsevier.
Benoit, Bringer (2013). Neuromarketing. Dr2-
http://www.dr.dk/tv/se/neuromarketing/neuromarketing#!/55:33
Bjarke Nielsen, Jan (2006). Ny kaffekultur I Danmark. – www.business.dk
Berridge, K.C., & Robinson, T.E. (1995). The mind of an addicted brain: Neural sensitization of
wanting versus liking. Current Directions in Psychological Science, 4,71-76.
Berridge, K. C. (1999). Pleasure, pain, desire, and dread: Hidden core processes of emotion. In D.
Kahneman, P. Slovic, & N. Schwarz (Eds) Well-being: The foundations of hedonic psychology. Ney
York: Russel Sage Foundation.

85
Berridge, K. C., & Robinson, T. E.: (2003). Parsing reward. TRENDS in Neuroscience , 26 (9).
Berridge, K. C., & Kringelbach, M. L.: (2008). Affective neuroscience of pleasure: reward in
humans and animals. Psychopharmacology (Berl) , 199 (3), 457-480.
Berridge, Kent C, (2009). Wanting and liking: Observations from the neuroscience and psychology
laboratory, Inquiry: An Interdisciplinary Journal of Philosophy, 52:4,
Berridge, Kent C, (2009b). Liking and wanting food rewards: Brain substrates and roles in eating
disorders. Physiol behav. 2009 July 14;97(5).
Berridge, Kent, Smith K. (2007). Opioid Limbic Circuit for Reward: Interaction between Hedonic
Hotspots of Nucleus Accumbens and Ventral Pallidum. The Journal of Neuroscience, February 14,
2007•27(7):1594 –1605
Belk, W. Russel (2013). Variables and consumer behavior.Journal of consumer research. Vol2.nr.3
p.157-164.
Camerer, C., Loewenstein, G & Prelec, D.(2005). Neuroeconomics: How neuroscience can inform
Economics. Journal of Economics Literature XLlll, 9-64.
Chartrand, Huber, Shiv & Tanner, (2008). Nonconscious Goals and consumer choice. Journal of
consumer research.
Chernatony and Riley, (1998). Defining a brand: beyond the literature with experts´ interpretation.
Journal of Marketing Managemen 14, (1998:417-443).
Crone, Mortensen og Morten F. (2009). Caféer presses af krisen. – www.berlingske.dk
Cleemann, Christine. (2010). Figur 1 Grundelementer i det videnskabelige paradigme. Fagets
videnskabteori. HA (almen) 6. sem Institut for ledelse, Politik og Filosofi.
Cornell, C.E., Rodin, J., & Weingarten, H. P. (1989). Stimilus-induced eating when satiated.
Physiology & Behavior, 45, 695-704.
Consumerpriceindex, (CPI) (2012). The development of coffee prices in the periode Dec.2000-
2012. – www.statistikbanken.dk.
Dansk kaffeinformation (2012). Consumer panel service. – www.kaffeinfo.dk
Dansk supermarked (2012). ´Om os´ - www.dansksupermarked.dk
Dai Xianchi, Ariely D., Miguel B. C. (2010). Wanting, Liking, and Preference construction.
Amarican Psychological Association.
de Araujo, I. E., Rolls, E. T., Velazco, M. I., Margot, C., & Cayeux, I. (2005). Cognitive
modulation of olfactory processing. Neuron, 46(4), 671–679
De Martino, B.; Kumaran, D.; Seymour, B.; Dolan, R. J. (2006). Frames, biases, and rational
decision-making in the human brain" Science 313 (5787): 684–687

86
Druckman, J.N. (2001). The Implications of Framing Effects for Citizen Competence. Political
Behavior 23 (3): 225–256.
Finn Nielsen, Ea E. & Morten, T. H. (2005). The Story of Starbucks. Cand.merc.IMM,
Thesis.Copenhagen Business School.
Edward, S. Katkin, Stefan w., Arne ö. (2001) Nonconscious fear conditioning, Visceral Perception,
and the Development of Gut Feelings. Psychlogical Science. Vol 12. Issue.
Erik de Plessis (2011). The branded Mind. what neuroscience really tells us about the puzzle
of the brain and the brand . London ; Kogan Page.
Esch, F. R., Möll, T., Schmitt, B., Elger, C. E., Neuhaus, C., & Weber, B. (2012). Brands on the
brain: What happens neurophysiologically when consumers process and evaluate brands? Journal
of Consumer Psychology
Euromonitor (Dec. 2012). Consumer lifestyles, (1)Denmark hot drinks – (2)Coffee in Denmark –
Denmark cafées/bars. www.eurominitor.com.
Friss Christensen, Mette, (2009). The postmodern coffee consumer – A consumer-driven Global
Value chain analysis of the coffee market. Master Thesis. Business and Development studies.
Copenhagen Business School.
Fugate, D. (2008). Marketing services more effectively with neuromarketing research: a look into
the future. Journal of Services marketing 22/2, 170-173.
Grant, Robert. M (2010). Contemporary Strategy analysis. Seventh edition. Wiley.
Guldbæk Arentsen, L.; Bille, N.; Dethlefsen, T.; Skjøt J., H.; Stolbjerg H., C.; Stage, M. B.;
Svendsen, M. (1992). Forbrugernes kriterier for valg af kaffemærke. bilagsmappe,
Handelshøjskolen i København ; Institut for Erhvervs- og Samfundsforskning; ; København ; HHK.
Harmon-Jones, E. (2003). Clarifying the emotive functions of asymmetrical frontal cortical activity.
Psychophysiology, 40(6), 838–848.
Hansen, Camila B.(2012). Bilka indleder samarbejde med Starbucks. www.food-suply.dk
Hansena, Torben, Møller Jensen.J, Stubbe Solgaarda H.(2004). Predicting online grocery buying
intention: a comparison of thetheory of reasoned action and the theory of planned behavior.
International Journal of Information Management 24 (2004) 539–550.
Havermans, Remco C. (2011). “You say it´s Liking, I say it´s Wanting…”On the difficulty of
disentangling food reward in man. Elsevier. Appetite 57. 286-294.
Havermans, Remco C., Janssen T., Janneke C.A.H, Roefs A., Jansen A. (2009). Food liking, food
wanting, and sensory-specific satiety. Elsevier. Appetite 52. 222-225
Healey, Matthew (2008). What is branding? RotoVision SA.

87
Heding, T., Knudtzen, C. F., & Bjerre, M. (2008). Brand management: Research, Theory, and
Pratice. London: Rutledge, Taylor & Francis group.
Holt, D. (2004). How Brands Become Icons The Principles of Cultural Branding. Boston: Harvard
Business School Publishing.
Huber, Joel. ( 2003). Brand effects on choice and choice set formation under uncertainty. Marketing
Science.
Hubert M, Kenning P (2008). A current overview of consumer neuroscience. Journal of consumer
behavior 7:272-292.
Hyltoft, Henrik (2012). Danske dagligvarepriser midt i feltet blandt 12 europæiske lande. https://www.danskerhverv.dk/Nyheder/Sider/Danske-dagligvarepriser-midt-i-feltet-blandt-12-europaeiske-lande.aspx
Interbrand, 2012. The top 100 brands 2012. www.interbrand.com
Jimmy and Jacob W.: (2009). “An assessment of the attractiveness on the Danish market”. Thesis,
Afsætningsøkonomi, Copenhagen Business School
Kapferer, Jean N., (1992). Strategic brand management. Les Editions d´Organition.
Kenning, P. & Plassmann, H. (2005). Neuroeconomics: An overview from economic perspective.
Brain Research Bulletin 67, 344-353.
Klein, Naomi (2000). NO LOGO; Mærkerne, magten og modstanden. Litteraturådet
Keller, K.L.(1993). Conceptualizing, measuring, and managing Costumer-based brand equity.
Journal of marketing, 57, 1-22.
Keller, K.L.(2008). Strategic brand management, building, measuring, and managing brand equity.
Prentice Hall US
Keller, K.L. (2012). Strategic brand management, a European perspective. Harlow; Financial times
Prentice Hall.
Kirk, U., Skov, M., Hulme, O., Christensen, M. S., & Zeki, S. (2009). Modulation of aesthetic value
by semantic context: An fMRI study. Neuroimage, 44(3), 1125–1132
Knapp, Duane E. (2000). The Brand mindset. New York ; London : McGraw-Hill.
Koldbye, C (2008). Shopping på hjernen. – www.videnskab.dk
Kotler, Philip; Keller, K. L.; Brady M.; Goodmann, M.; Hansen, T.; (2009). ”Marketing
Management”, Pearson Prentice Hall
Kotler, P. (2006). Principles of Marketing. Upper Saddle River, New Jersey, USA
Korsgaard Nielsen, Michael (2012). Kaffeboblen er bristet. – www.business.dk
88
Lee, N., Broderick, A. & Chamberlain, L.( 2006.). What is ‟neuromarketing‟? A discussion and
agenda for future research. International Journal of Psychophysiology 63, 199-204.
Litt, Ab, Uzma K., and Shiv B. (2010). Lusting While Loathing: Parellel Counerdriving of Wanting
and Liking. Psycological Science 21 (1) 118-125.
Litt Ab, Reich T., Maymin S., and Shiv B.(2011). Pressure and Perverse Flights to Familiarity.
Psychological Science 22 (4) 523-531.
Lichtenstein, S., & Slovic, P. (2006). The construction of preference. New York: Cambridge
University Press.
Ifat Levy, Stephanie C. L., Robb B. R. and Paul W. G. (2011). Choice from non-choice: Predicting
consumer preferences from BOLD signals obtained during passive viewing. J Neurosci. Author
manuscript; available in PMC 2011 July 5.
Mashlow A.H. (1970). Motivation and personality. 2nd
edn, Upper Saddle River, NJ:Prentice Hall.
Mayer, Emeran A. (2011). Gut feelings: The emerging biology of gut-brain communiacation.
Nature Reviews Neuroscience 12.
Mellemfolkeligt samvirke (2012). Danskerne og kaffen. – www.danskherognu.dk
McCracken, G. (2005). Culture and Consumption II Markets, Meaning, and Brand Management.
Bloomington, IN: Indiana University Press.
McCracken, G. (1986). Culture and Consumption: A Theoretical Account of the Structure: A
Theoretical Account of the Structure and Movement of the Cultural Meaning of Consumer Goods.
Journal of Consumer Research, 13(1), pp. 71-84.
McCracken, G. (2005). Culture and Consumption II Markets, Meaning, and Brand Management.
Bloomington, IN: Indiana University Press.
Michelli, J.A (2007). The Starbucks experience 5 principles for turning ordinary into extraordinary.
New York: Mc-Graw-Hill.
Mashlow A.H. (1970). Motivation and personality. 2nd edn, Upper Saddle River, NJ:Prentice Hall.
Morten, Jesper (2012). Svensk kaffekæmpe ruller over øresund. – www.business.dk
Naomi Klein, NO LOGO (2000). Taking Aim at the Brand Bullies, London, Flamingo.
Naomi Klein, (2002). No logo, Mærkerne, magten, modstanden. Hardback - 2002, 1. udgave,
Jyllands-Postens Erhvervsbogklub
Nocera, J. (2008). Curing what ails Starbucks. The New York Times. (Online version). Published
Jan.12th
.
Olsen, Jimmy; Wochner, J. (2007). Starbucks Coffee Company, En vurdering af det danske
markeds attraktivitet, Med branding som teoretisk udgangspunkt, Handelshøjskolen i København ;
Institut for Afsætningsøkonomi. AØ.
89
Oxford Dictionary, online - http://oxforddictionaries.com/definition/english/cognition?q=cognition
Pauli, Kim: (2013). Starbucks åbner I Århus og Ålborg. www.jyllands-posten.dk
Park, C.W., MacInnis, D.J., Priester, J., (2006). Beyond attitude: Attachment and consumer
behavior. Seoul Journal of Business 2, 12.
Payne, J. W., Bettman, J.R., & Johnson, E.J. (1992). Behavioral decision research: A constructive
processing perspective. Annual Review of psychology, 43, 87-131.
Pelsmacker, Patrick de, Geuens M., Van den Berg J.(2010). Marketing Communiations. A
European Perspective. Fourth Edition. Prentice Hall.
Plassmann Hilke, John O., Shiv B. & Rangel A., (2007). Marketing actions can modulate neural
representation of experienced pleasantness. Division of the Humanities and Social Sciences,
California Institute of Technology. PNAS.
Plassmann, Hilke ; Ramsøy, T. ; Milosavljevic, M. (2011) Branding the brain: A critical review and
outlook, Journal of Consumer Psychology, 2012, Vol.22(1), pp.18-36
Plassmann, Hilke ; Ramsøy, T. ; Milosavljevic, M. (2012) Branding the brain: A critical review and
outlook, Journal of Consumer Psychology, 2012, Vol.22(1), pp.18-36
Plassmann, H., O'Doherty, J., Shiv, B., & Rangel, A. (2008). Marketing actions can modulate
neural representations of experienced pleasantness. Proceedings of the National Academy of
Sciences (USA), 105(3), 1050–1054
Polokangas, Lauri (2010). Measuring the willingness to purchase using methods of
Neuromarketing. Laurea University of Applied science. Business management programme, thesis.
Ramsøy, Thomas (2012). Power points from teaching lessons: Lecture 2: Neuromarketing; a bird´s
perspective; Lecture 3: Attention, Awareness and consciousness; Lecture 4: Emotions; Lecture 5:
Preference: Wanting and Liking. – www.learn.cbs.dk
Rangel, A., Camerer, C., & Montague, P. (2008). A framework for studying the neurobiology of
value-based decision making. Nature Reviews Neuroscience , 1-12.
Ricco´s official website page, explored in (2012/2013), through www.Ricco.dk
Rolf Jensen “Dream society”, (2006). Forbrugere går fra informationsøkonomi til
oplevelsesøkonomi hvor forbrugerne søger selviscenesættelse og individualisering. McGraw Hill
Professional
Simonson, Itamar: In Defense of consciousness (2005). The role of conscious and unconscious
inputs in consumer choice, Journal of consumer psychology,15 (3), 211-217.
Schmidt, C.( 2008). What neuroeconomics does really mean? Revue d´economie politique Jan-Feb,
7-33.
Starbucks official website page, explored in (2012/2013). from www.starbucks.com
90
Schaefer, M., & Rotte, M. (2007). Favorite brands as cultural objects modulate reward circuit.
Neuroreport, 18(2), 141–145.
Sirgy, M. Jospeh, Pradeep K. T. (1986). An attempt towards an integrated Theory of consumer
psychology and decisionmaking. Permagon Journas Ltd. Systems research. Vol.3 nr.3.
Sirgy, M. Joseph (2013). Self-concept in Consumer Behavior: A Critical Review. Journal of
consumer research.Vol.9.
Small, D. M., Gregory, M. D., Mak, Y. E., Gitelman, D., Mesulam, M. M., & Parrish, T.: (2003).
Dissociation of neural representation of intensity and affective valuation in human gustation.
Neuron, 39(4), 701–711.
Small, D. M., Zatorre, R. J., Dagher, A., Evans, A. C., & Jones-Gotman, M. (2001). Changes in
brain activity related to eating chocolate: From pleasure to aversion. Brain, 124(9), 1720–1733.
Swaner-Albright, O, (2008). Tasting the future of Starbucks coffee from a new machine. The New
York Times.
Søren Ravnsborg (2010). Kaffekonge I væksteventyr. – www.lederne.dk
Sorgenfri Kjær, M. (2009). Din smag er nem at manipulere med. – www.politikken.dk
Thaler, H. Richard and Cass R. S. (2009). Nudge, Improving Decisions About Health, Wealth, and
Happiness. Revised and Expanded Edition. Penguin Books.
Thompson, C., & Arsel, Z. (2004). The Starbucks brandscape and consumers´ (Anticorporate)
Experiences of globalization. Journal of Marketing, 31(3).
Thompson, C., Rindfleisch, A. & Arsel, Z. (2006). Emotional Branding and the Strategic value of
the Doppelgänger brand image. Journal of marketing, 70 (1).
The reward circuit, (2013) www.thebrain.mcgrill.ca
Usunier, Jean Claude, Lee J. (2009). Marketing across Cultures. Fifth edition. Pearson, Prentice
Hall.
Youtube.com – The marshmallow test: http://www.youtube.com/watch?v=QX_oy9614HQ
Young, Richard A., Collin A. (2004). Introduction: Constructivism and social constructionism in
the career field. Journal of vocational behavior. Vol 64. Issue 3.
Waynes official website page, explored in (2012/2013), from www.waynes.com
Weddle E David, Bettman R. James. (1974). Marketing underground: An investigation of
Fishbein´s behavioral intension model . Consumer research. Vol 1.310-318.
Wewers, M., & Lowe, N. (1990). A critical review of visual analogue scales in the measurement of
clinical phenomena. Res Nurs Health , 4 (13), 227-236.

91
Zikmund, W. G., Babin, B. J., Jon, C. C., & Griffin, M. (2010). Business research methods. South-
Western, Cengage Learning.

92
14. Appendices
Appendix 1: Facial ´liking` characteristics across both mamals and humans. ................................................. 93
Appendix 2: Free associations test results ...................................................................................................... 94
Appendix 2.a: Analysis of the Starbucks associations ..................................................................................... 95
Appendix 2.b: The respondent associative network in relation to Starbucks. ................................................ 99
Appendix 3: Danish coffee facts in numbers ................................................................................................. 100
Appendix 3.a: The market and culture of coffee in Denmark ....................................................................... 102
Appendix 4: The Cortex ................................................................................................................................. 108
Appendix 5: David Aaker´s ´brand equity model´.......................................................................................... 109
Appendix 5.a: Mashlow´s hierarchy of needs ............................................................................................... 110
Appendix 6: Kevin Keller´s Consumer Based brand equity (CBBE) pyramid. ............................................... 111
Appendix 7: Reward components ................................................................................................................. 112
Appenix 8: David Kahneman´s System 1 and system 2 ................................................................................. 113
Appendix 9: Paradigms and their assumptions about ontology, epistemology and methodology. ............. 115
Appendix 10: Experiment guideline .............................................................................................................. 116
Appendix 11: Questioner ............................................................................................................................... 117
Appendix 12: Measuring methods in Neuroscience/Neuromarketing ......................................................... 121
Appendix 14: Respondents pre-assumptions to brand recognition, liking and measure of quality. ............ 123
Appendix 15. Defining Emotions, Feelings, Gestalts and Thoughts .............................................................. 124
Appendix 16: Exploring the respondent´s decision making and cognitive brand effects ............................. 127
Appendix 17: Starbucks, Fields ...................................................................................................................... 128

93
Appendix 1: Facial ´liking` characteristics across both mamals and humans.
Source: Bernard J. Baars and Nicole M. Gage: Cognition, Brain and Consciousness. Introduction to Cognitive
Neuroscience. 2010. Elsevier.
Sweet = liking expressions
Bitter = disliking expressions
Liking reactions: Objective indices of hedonic aspects of emotion. Homologous affective facial
expressions by infant human, juvenile organgutan, and adult rat to ´liked` sucrose (top) versus
´disliked` quinine (bottom).
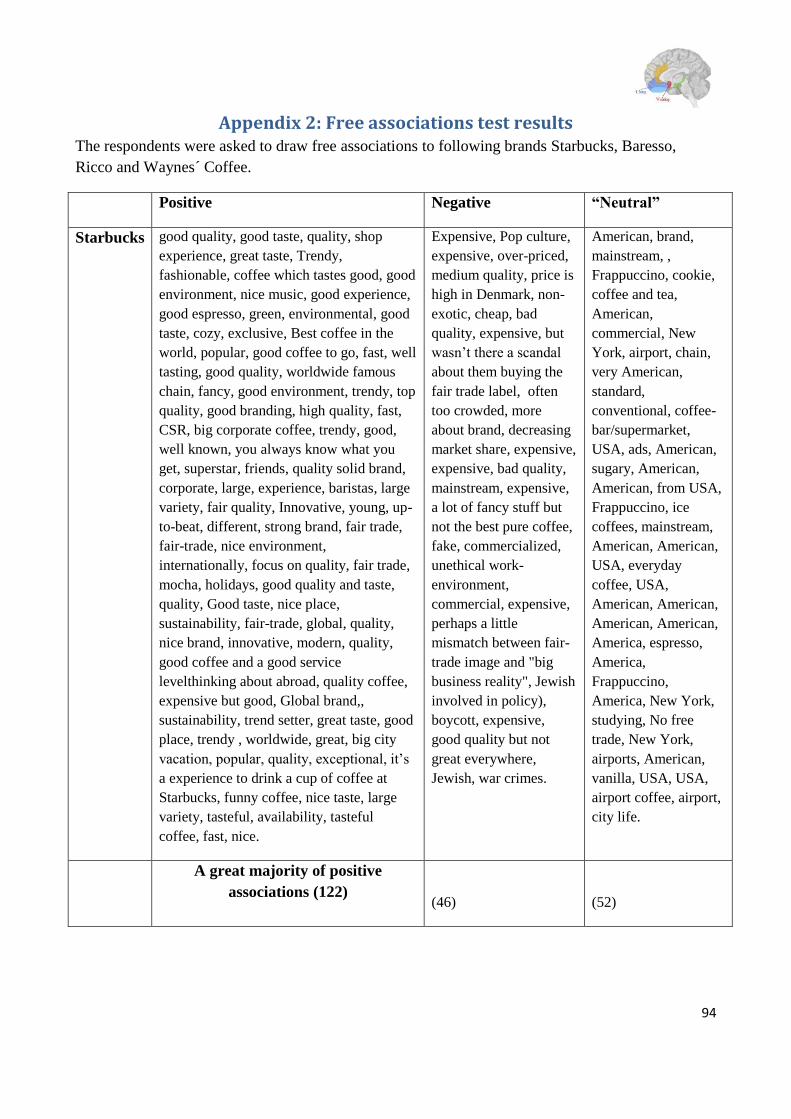
94
Appendix 2: Free associations test results The respondents were asked to draw free associations to following brands Starbucks, Baresso,
Ricco and Waynes´ Coffee.
Positive Negative “Neutral”
Starbucks good quality, good taste, quality, shop
experience, great taste, Trendy,
fashionable, coffee which tastes good, good
environment, nice music, good experience,
good espresso, green, environmental, good
taste, cozy, exclusive, Best coffee in the
world, popular, good coffee to go, fast, well
tasting, good quality, worldwide famous
chain, fancy, good environment, trendy, top
quality, good branding, high quality, fast,
CSR, big corporate coffee, trendy, good,
well known, you always know what you
get, superstar, friends, quality solid brand,
corporate, large, experience, baristas, large
variety, fair quality, Innovative, young, up-
to-beat, different, strong brand, fair trade,
fair-trade, nice environment,
internationally, focus on quality, fair trade,
mocha, holidays, good quality and taste,
quality, Good taste, nice place,
sustainability, fair-trade, global, quality,
nice brand, innovative, modern, quality,
good coffee and a good service
levelthinking about abroad, quality coffee,
expensive but good, Global brand,,
sustainability, trend setter, great taste, good
place, trendy , worldwide, great, big city
vacation, popular, quality, exceptional, it’s
a experience to drink a cup of coffee at
Starbucks, funny coffee, nice taste, large
variety, tasteful, availability, tasteful
coffee, fast, nice.
Expensive, Pop culture,
expensive, over-priced,
medium quality, price is
high in Denmark, non-
exotic, cheap, bad
quality, expensive, but
wasn’t there a scandal
about them buying the
fair trade label, often
too crowded, more
about brand, decreasing
market share, expensive,
expensive, bad quality,
mainstream, expensive,
a lot of fancy stuff but
not the best pure coffee,
fake, commercialized,
unethical work-
environment,
commercial, expensive,
perhaps a little
mismatch between fair-
trade image and "big
business reality", Jewish
involved in policy),
boycott, expensive,
good quality but not
great everywhere,
Jewish, war crimes.
American, brand,
mainstream, ,
Frappuccino, cookie,
coffee and tea,
American,
commercial, New
York, airport, chain,
very American,
standard,
conventional, coffee-
bar/supermarket,
USA, ads, American,
sugary, American,
American, from USA,
Frappuccino, ice
coffees, mainstream,
American, American,
USA, everyday
coffee, USA,
American, American,
American, American,
America, espresso,
America,
Frappuccino,
America, New York,
studying, No free
trade, New York,
airports, American,
vanilla, USA, USA,
airport coffee, airport,
city life.
A great majority of positive
associations (122)
(46)
(52)
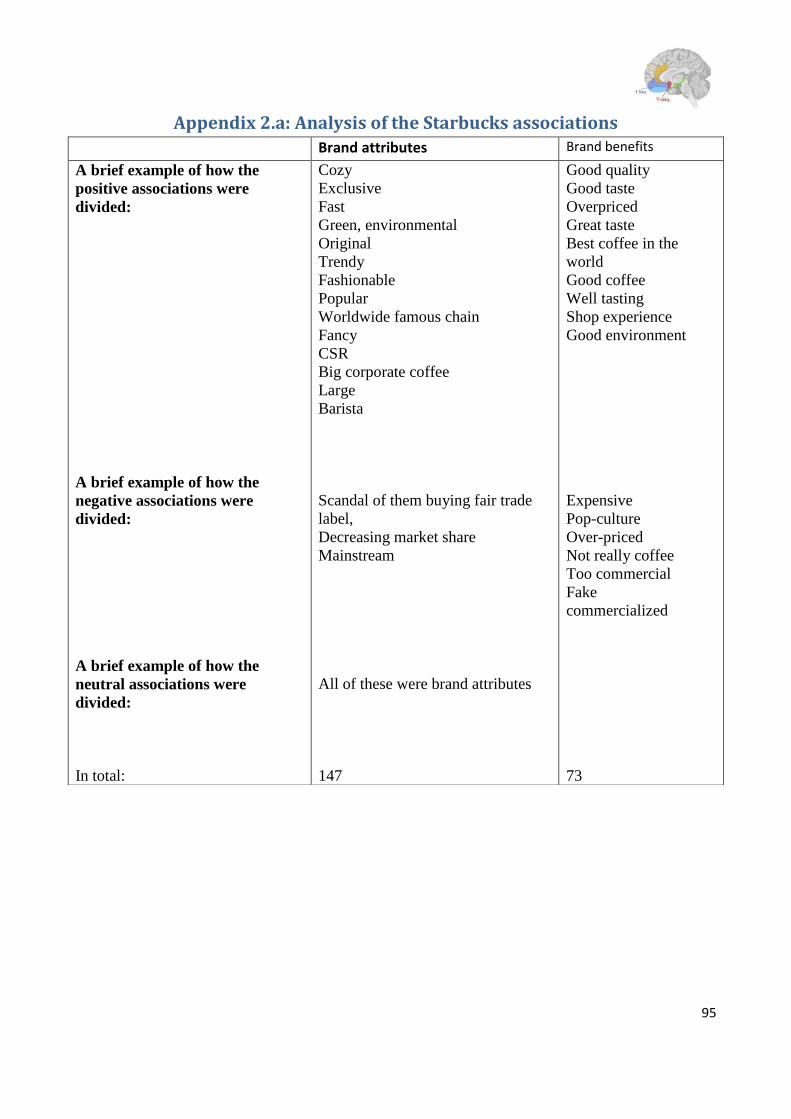
95
Appendix 2.a: Analysis of the Starbucks associations
Brand attributes Brand benefits
A brief example of how the
positive associations were
divided:
A brief example of how the
negative associations were
divided:
A brief example of how the
neutral associations were
divided:
In total:
Cozy
Exclusive
Fast
Green, environmental
Original
Trendy
Fashionable
Popular
Worldwide famous chain
Fancy
CSR
Big corporate coffee
Large
Barista
Scandal of them buying fair trade
label,
Decreasing market share
Mainstream
All of these were brand attributes
147
Good quality
Good taste
Overpriced
Great taste
Best coffee in the
world
Good coffee
Well tasting
Shop experience
Good environment
Expensive
Pop-culture
Over-priced
Not really coffee
Too commercial
Fake
commercialized
73

96
Positive Negative “Neutral”
Baresso Cozy, good quality, good
espresso, Very popular in
Copenhagen, lots of bars, ok
priced coffee, the taste is ok,
nice marketing, trendy, modern,
quality, good taste, sweet, good
coffee, over middle, good
branding, great sofas, relaxing,
comfortable, classic, good, well
known, you always know what
you get, quality, solid brand,
good for fast coffee, Denmark,
Really good but expensive
coffee, strong brand, quality,
good taste, innovative, black
coffee better at Baresso, local,
loyal, reasonable in price and
good, good coffee because of
the brand, good one, very
popular in DK, taste good,
many in central Copenhagen,
great coffee beans, fresh milk,
didn’t know them before
Copenhagen so until now good,
nice atmosphere, big chain in
DK – well known, good taste,
quality, quick afternoon coffee
to go, quality, a place to get
coffee after school or with
friends or hanging out, modern,
fresh, always available, elegant
and cozy, simple, good strong
coffee, cozy-ness, cozy-ness,
nice, Decent, good coffee, but
not an experience as Starbucks,
not so expensive, great coffee,
large variety, tasteful,
availability, tasteful coffee
boring, don’t know
much about them,
standardized taste,
expensive, wannabe,
expensive, not as
well-known as
Starbucks,
unfamiliar,
acceptable coffee,
overpriced, cheap
chain, goes after the
lowest common
denominator, good
but expensive, too
much of a chain
concept, low
standards, everything
else but coffee, non-
exotic, expensive,
Wannabe Starbucks,
expensive compared
to taste, expensive,
expensive, No quality
nor service see them
as a place who are
willing to earn quick
money on selling
coffee, trying to hard
to bee "cool" but are
too expensive taking
their quality in count,
expensive, standard
coffee, bad quality,
expensive,
provincial brand, teenagers,
coffee, cake, juice, Danish,
mainstream, Danish,
equivalent to Starbucks,
Danish, They "sit" on the
Danish coffee chain market,
more café style, Danish
market, Danish brand, Danish
coffee, Danish version of
Starbucks with an Italian twist,
KBH, Copenhagen, The
costumers are in a relation to
business market, Danish,
brand value, cheap café,
franchise, red logo, latte and
other coffee variants with milk
in, European, red logo,
Strøget, Scandinavia, sterile,
Danish, provincial, Danish,
local coffee, mainstream,
Danish version of Starbucks,
Spain, mainstream, fireplace,
Denmark, normal taste,
Copenhagen, Denmark,
hipster, Strøget, Danish, many
of them around CPH, Kongens
Nytorv, to go coffee, Kongens
Nytorv, worldwide,
Copenhagen, Danish
Starbucks, standard coffee bar,
Copenhagen, café, Danish,
Italian roasted beans, Danish
coffee,
A small majority of
positive associations. (65)
(32)
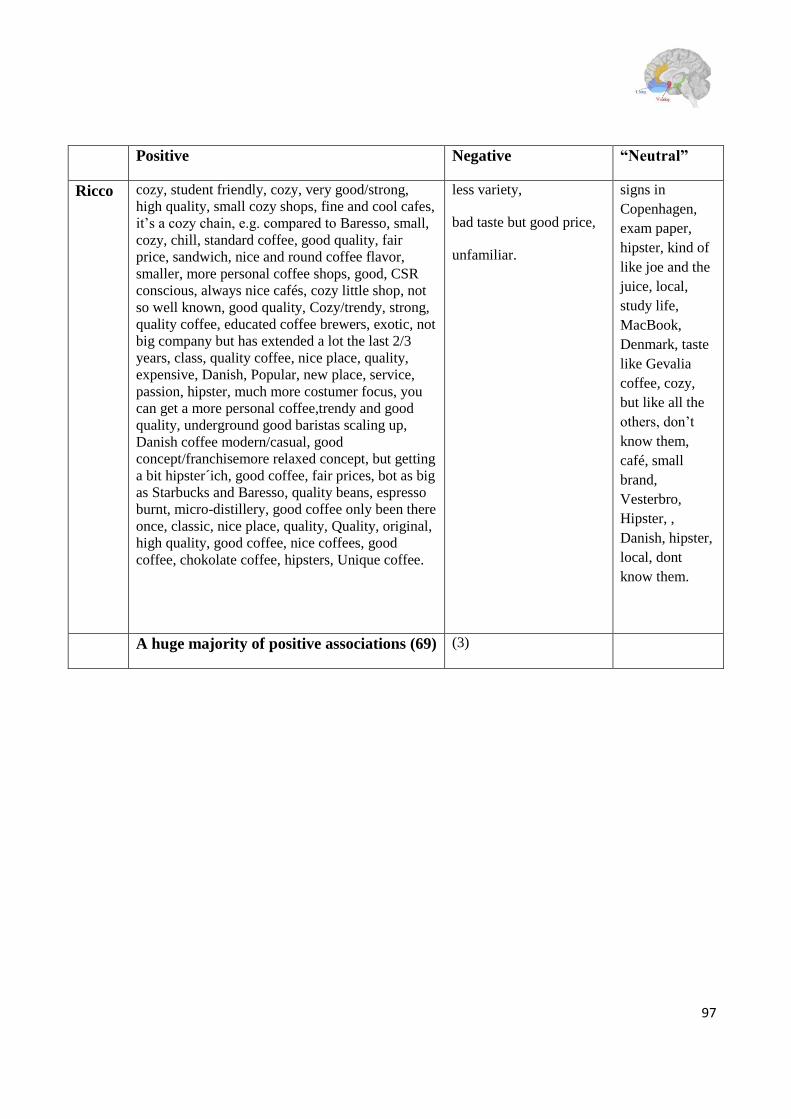
97
Positive Negative “Neutral”
Ricco cozy, student friendly, cozy, very good/strong,
high quality, small cozy shops, fine and cool cafes,
it’s a cozy chain, e.g. compared to Baresso, small,
cozy, chill, standard coffee, good quality, fair
price, sandwich, nice and round coffee flavor,
smaller, more personal coffee shops, good, CSR
conscious, always nice cafés, cozy little shop, not
so well known, good quality, Cozy/trendy, strong,
quality coffee, educated coffee brewers, exotic, not
big company but has extended a lot the last 2/3
years, class, quality coffee, nice place, quality,
expensive, Danish, Popular, new place, service,
passion, hipster, much more costumer focus, you
can get a more personal coffee,trendy and good
quality, underground good baristas scaling up,
Danish coffee modern/casual, good
concept/franchisemore relaxed concept, but getting
a bit hipster´ich, good coffee, fair prices, bot as big
as Starbucks and Baresso, quality beans, espresso
burnt, micro-distillery, good coffee only been there
once, classic, nice place, quality, Quality, original,
high quality, good coffee, nice coffees, good
coffee, chokolate coffee, hipsters, Unique coffee.
less variety,
bad taste but good price,
unfamiliar.
signs in
Copenhagen,
exam paper,
hipster, kind of
like joe and the
juice, local,
study life,
MacBook,
Denmark, taste
like Gevalia
coffee, cozy,
but like all the
others, don’t
know them,
café, small
brand,
Vesterbro,
Hipster, ,
Danish, hipster,
local, dont
know them.
A huge majority of positive associations (69) (3)

98
Positive Negative “Neutral”
Waynes Trendy, new, different,
Original, smart,
great coffee, Starbucks
similar, cheap, typically
good, blue logo, strong
espresso, exotic,
good coffee, ok,
, its ok, cozy, , good
cookies,
seems like they have the
most promising
qualities,
good coffee, good
atmosphere and service,
Vika Atrium,
quick
expensive compared to
quality,
I don’t like the taste and
I don’t now where they
come from, bad
locations, lower value,
bad name, unknown to
people
,
never heard of it,
not very familiar,
haven’t tasted it,
no clue,
not known to
respondents,
Valby, haven’t tasted it,
American,
American, Norwegian,
yet another large coffee
shop/chain,
strange brand name,
average,
Sweden,
Oslo, Kos,
sounds American
(24)
(7)
The majority didn’t
know the brand and
choose not to answer

99
Appendix 2.b: The respondent associative network in relation to
Starbucks.
Figure 1. The respondent´s positive/neutral associations.
Figure 2. The respondent´s negative associations
Source: Keller, K.L. (2012): Strategic brand management, a European perspective. Harlow; Financial times Prentice
Hall. The figure is inspired from Kevin Keller´s association model on p. 59.
The figure represents some common associations mentioned by the respondents in the questioner’s first part.
The brand words links to the power of the brand, as the words refers to the respondents thoughts, feelings,
images, beliefs, perceptions and opinions. (Keller, 2012). Keller states that, “The more deeply a person
thinks about product information and relates it to existing brand knowledge, the stronger the resulting brand
associations”. (Keller, 2012. P. 63). Associations can easily be shared with competitors, which is why every
brand should strive to reach a sustainable competitive advantage or unique selling position.
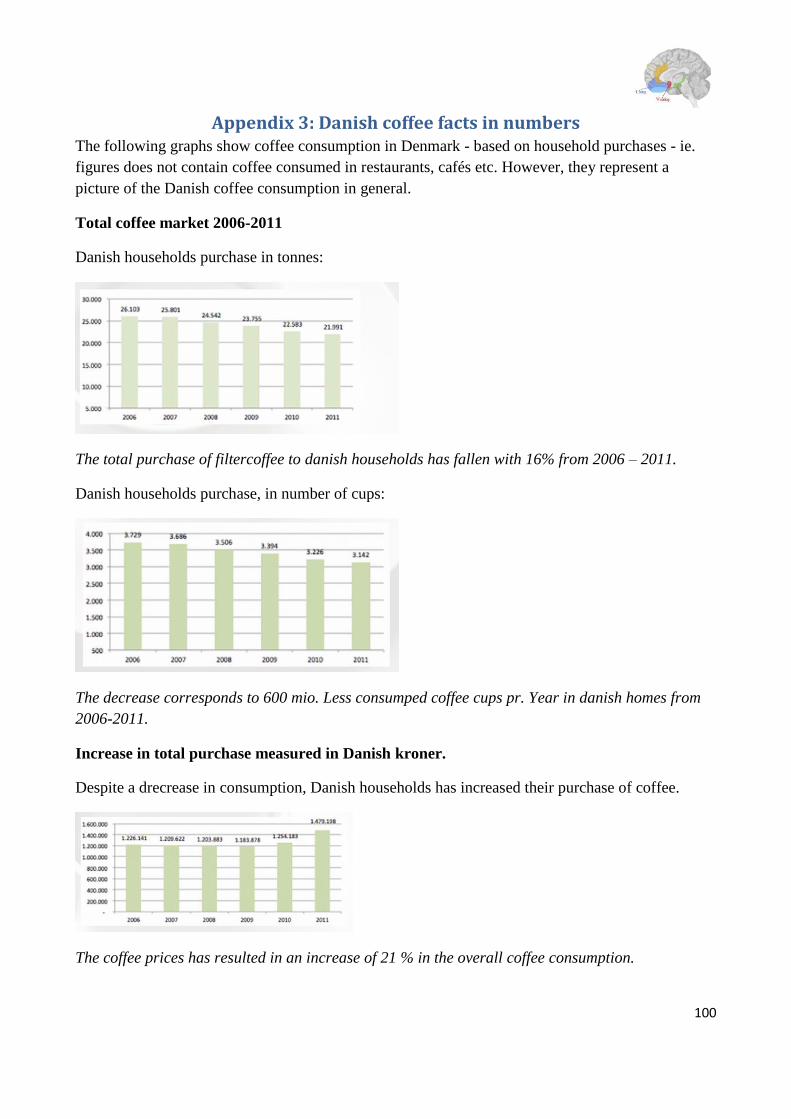
100
Appendix 3: Danish coffee facts in numbers The following graphs show coffee consumption in Denmark - based on household purchases - ie.
figures does not contain coffee consumed in restaurants, cafés etc. However, they represent a
picture of the Danish coffee consumption in general.
Total coffee market 2006-2011
Danish households purchase in tonnes:
The total purchase of filtercoffee to danish households has fallen with 16% from 2006 – 2011.
Danish households purchase, in number of cups:
The decrease corresponds to 600 mio. Less consumped coffee cups pr. Year in danish homes from
2006-2011.
Increase in total purchase measured in Danish kroner.
Despite a drecrease in consumption, Danish households has increased their purchase of coffee.
The coffee prices has resulted in an increase of 21 % in the overall coffee consumption.

101
The quantity of coffee consumed in Danish households – in number of cups
In the periode 2006-2011 the only age group that had a increasing consumption, was the
youngsters up to 29 years old. The increase in this period was 27%. The largest decrease is seen in
the group of 40-49 years old. This decrease is 22%. The consumption among elders in the age +70
years old, are the most stable, with a small decrease of 7%.
Source: (http://kaffeinfo.dk/kaffe-i-tal/danmark/)
Consumerprice index (CPI), The development of coffee prices in the periode dec. 2000- dec.
2012
Source: www.statistikbanken.dk

102
Appendix 3.a: The market and culture of coffee in Denmark
3.1. The roots and sorts of coffee
The concept of coffee originally came from Mokka in Yemen. Though time it became part of a
word market controlled by bean-traders and multinational corporations. This let coffee to be one of
the first bonding drinks shared and enjoyed worldwide, among all communities despite faith and
religion. It is known that the whole world consumes 2.25 mill. Cups of coffee every single day.
(Andersen, 2007).
Just like vine the quality and taste differences of coffee depends on the area the beans come from,
the way they get roasted and how the coffee finally gets brewed and served. The coffee production
methods, varies depending on the individual country whereas the main differences lays in
conditions such as: geographic, climatic and demographic. In overall there are three types of main
botanic coffee sorts, all with individual taste characters: Coffee Arabica (75%), Coffee Robusta
(25%) and finally coffee Liberica(1%). (Guldbæk et al.,1992). The most common used is coffee
Arabica which represents 75% of the produces coffee worldwide.(Ibid) The harvesting of the beans
often gets done by handcraft as the beans are stuck very close to its fruit. (Ibid) The coffee sort is
though not only restricted to the character of botanical type it is also affected by the country of
origin, production region and process. The most common used coffe-sorts are: Brasil-coffee,
Columbia-coffee, Java, African-coffees and Mocca. In Denmark the most common used coffee sort
is Brasil-coffee which is built on the Arabica-type, harvested and brewed according to the original
dry method. (Ibid) The most popular Brasil-coffees in Denmark are the Santos-coffee (sweet, soft
and dry aroma) which is the basic ingredient in a Gevalia coffee and the Minas-coffee which is
more powerful and harsh in taste.
3.2. A brief introduction to the cultural role of coffee in Denmark
In Denmark we drink a lot of coffee. It is very rare that Danes drink morning coffee, noon-coffee,
afternoon coffee, evening coffee and in between there's the coffee breaks where yet another coffee
is typically consumed. This culture has lead Denmark (among Finland and Sweden) to be one of the
leading countries in average number of consumed coffee pr. Citizen. (Mellemfolkeligt samvirke)
Danes has always been a population which takes much enjoyment in drinking a cup of good coffee.
Either alone in a brake or together with others embracing the togetherness. Because coffee is a low-
involvement product it is consumed at all times, but typically coffee is used for coziness and in

103
company with others. Coffee therefore has a cozy and social element in its functional and cultural
roots. Back in the day’s coffee was enjoyed in coffeehouses, café-restaurants, cafeterias or cafés.
Now a day it’s more random to enjoy a qualified coffee at coffee bars or as a “to-go”. The act of
drinking coffee is for many Danes a part of an unconscious ingrown routine which highlights the
day whit a little flavor. Coffee has always been a center for communities letting people come
together across all differences. Besides this, coffee has always been a link in connecting national,
international and global communities.
In Danish culture it is very common to say “let’s have a coffee together” If two parts shares an
interest. The coffee habits though Danish history changed many times. This has led to not only a
change in coffee culture but also a change in cultural history. (Andersen,2007). Danes e.g. went
from buying cheap vacuum packed coffee bags to investing in expensive high coffee qualities
stored in airy bags. Researchers say that in order to cover a year’s consumption of the Danes coffee
habits a field of 350 km2 must be grown. This equals 40.000 ton ground coffee pr. year and 900
Liters. (Ibid) The most addicted coffee drinkers are in between the age of 28-45 years old.
(Danskherognu.dk) 85% of all Danes over the age of 30 years old and 50% under the age of 30
years old drinks coffee.(Danmarkherognu.dk). It’s very common that Danes get familiar with new
cultures and countries by tasting coffee imported from different places. This is a way of showing an
interest in globalization while enjoying or maybe also supporting a good cup of fair-traded coffee.
In Denmark coffee gets consumed at all times and everywhere and has therefore grown to be an
important part of Danish culture.
3.3 A brief introduction of how coffee came to Denmark: A brief historical overview
1665-1669 Coffee enters Danish highclass
1680´ Coffeehouses is introduced and replacing many teahouses
1696 Coffeehouses becomes part of everyday culture, though only for men.
1700´ The concept of coffee drinking expands to civil population, inspired by German and Austria.
1870´ Coffee becomes a Sunday tradition
1900 Innovative, wealthy and technology inspired coffee restaurants is introduced. The first was ´a porta` placed in Kongens Nytorv, central Copenhagen.
1900´ Coffee is introduced as a specialty one serves to guests.
1930´ First coffee bar for workers is opened, inspired from America.
1970´ French inspired cafés enters Danish market.
1970´ A new café culture starts: Having a coffee to see or be seen. The cafés becomes a place for superficial topics, enjoyment and fooling around. Etc.
1980´ Youngsters begins to relate to own reflections, ´two-someness` and coffee dating is

104
introduced.
1995´ The fairtrade wave becomes popular meanwhile small niche coffee bars in Copenhagen starts specializing in only the finest coffee. E.g. Estate coffee, Risteriet and Kontra.
2000´ The mainstream coffee chain, Baresso is introduced. Along arises new chains as e.g. Ricco.
2012´ The big pioneer of ´the cult coffee culture´ Starbucks enters Copenhagen.
2013´ Starbucks opens 2 more coffee bars in Ålborg and Århus. Source: Anders, Jacob, (2007). Livet er ikke det værste man har, Kaffens kulturhistorie i Danmark 1665-2015[Kbh.];
Gyldendal.
3.4. Contemporary coffee tendencies
In private the consumed hot drink is primarily filter coffee, but in the last couple of years more
sophisticated types of coffee e.g. espresso machines has become popular in line with the opening of
specialized coffee bars and cafes. (Euromonitor.com; (2))The most sold coffee is therefore
primarily filter-coffee, however the demand for coffee beans and frozen died coffee has increased in
the last years. (Jimmy Olsen et al. 2007) Outside the good old filter coffee has been replaced with
new more creative and adventures drinks as e.g. coffee latte, Macchiato, Frappachiones etc. There is
though a great difference in which coffee the elder and the youngsters drink (Bjarke Nielsen, 2006)
where the group of elder coffee drinkers sticks with filter coffee the youngster prioritizes expensive
Cafés and specialized coffee shops. This also means that the youngsters gets used to paying a high
price for the coffee. A cup of coffee latte can easily be in between the price of 25-45 kr. Depending
on where you buy it. The price of coffee has in the period of 2006 – 2011 been increasing even
though the price of coffee beans were actually falling (Korsgaard Nielsen, 2012) but since 2011the
price felt with a small amount of almost 4 %. (Consumerpriceindex; Appendix 3) Despite the higher
price in the period 2006-2011 the total volume sales declined by only 2% in 2011, highlighting the
fact of coffee being the favorite hot drink among the majority of Danes. (Euromonitor.com; (1))
The low price fall in 2011 still lets the coffee to be sold very expensive but this doesn’t seem to
scare away the group of coffee lovers, especially not the youngsters. This group can be linked to the
modern and urban lifestyle, - dominating in many cities. (Korsgaard Nielsen, 2012) Despite the
average consumption has been fallen because of the financial crisis the Danish household spending
at coffee has been increasing with 21% in the total coffee consumption. (Dansk kaffeinformation)
Remaining the total volume consumption of coffee to be very high and to be the dominating
category of hot drinks in 2011. (Euromonitor.com- Denmark hot drinks).

105
In terms of the Danish coffee industry it has for a while been developing from being standardized
and homogeny discount consumption to a specialized and exclusive market. (Ibid) This applies
regardless of whether the coffee is enjoyed at home or outside. The requested coffee standards have
simply just risen. This coffee is typically a familiar branded filter coffee (Andersen,2007) as e.g. the
leading brands Merrild and BKI (Euromonitor.com; (1)) . In 2007 the frieze dried instant coffee is
used by coffe drinkers, is 5% and in the last couple of years the amount of coffee beans sold for
home-use has been 10 % of the total amount of sold coffee beans in DK.(Andersen,2007) Coffee
has simply developed into one of this decades big trends, were consumers cultivates the coffee trend
by paying attention to how, when, where and by whom the beans has been treated. Furthermore
Danish consumers has begun to invest in coffee pod machines and fully automatic coffee machines,
wherein the design of it has become increasingly important in the overall kitchen design.
(Euromonitor.com; (1)).
With the developing of the coffee trend a new focus gets started around 2005, namely the focus on
being a qualified “coffee-bartender”, also known as “Barista”. (Ibid) It deals with managing
exclusive art of latte on a level far more advantaged than drawing a foamed heart. A time change
has announced a claim for exclusivity. The presentation of coffee begins to move in a direction of a
level comparable to culture of tasting vine. Denmark manages to win four world championships in
the VM for Baristas.(ibid) It seems as the future will bring even more increase to the field of fresh
coffee beans, instant coffee and fresh ground coffee pods. (Euromonitor.com; (1)).
Despite the economic recession café/coffee bars came out as one of the strongest and furthermore
managed to remain the fastest growing consumer foodservice category in 2011. Their success is
among other things due to the fact that they serve several specialized coffee drinks and homed
cooked foods satisfying a broad costumer group. The competition among chained cafés/bars is very
immature as Baresso Coffee is the only noticeable presence holding a 3% value share of cafés/bars
and 59% of chained cafés/cars. (Euromonitor.com ; (2)).
3.5. The postmodern coffee consumer: Contemporary identity roles
Modern sociologists are often disguising the characteristics of now a day’s youngsters’ and their
self-awareness. In these times, It´s very rare that modern people use a lot of energy considering who
they are, how they get perceived and what they actually want to become. The individual’s self-

106
image and identity has become a work in progress which though time gets created by ones choices,
opinions, consumer patterns, surroundings, brands etc.
This is one of the explanations of why youngsters often tend to spend a lot of time and money on
nursing their own ego and self-image. Tendencies that can often characterize the modern youngsters
behaviors are e.g. that they tend to focus on appearance, image, health, job titles, differentiated
interests, social and professional networking along with enjoying expensive drinks, foods and
presenting themselves though online-social-medias.
Along with the identity roles having changed the nature of consumption has changed as well. The
consumers seem to be looking for experiences rather than just material objects. Just as the
youngsters mentioned above they seek for quality of life and quality in the object they consume.
They e.g. demand greater taste experiences, which challenge their senses and they are willing to pay
high prices for such products. These consumers can be characterize as “postmodern consumers”. In
postmodern cultures human relations are based on the principles of access. (Rifkin, 2000)
The consumer´s importance is placed on access rather than ownership. The goal of one´s activity is
built around playfulness and pleasure which gives essential and commercial access to cultural
experience. (Christensen, 2005) The consumers will often zap from one culture to another,
exploring most possible and avoiding commitment to any lifestyle.” Rifkin finds that postmodern
consumers have short attention spans, are less reflective, and more spontaneous. They are less
analytical and more emotional. They are experimental and count innovation. ” (Friss, 2005)
According to Solomon, Postmodern consumers typically play freely with symbols, styles, products,
truths and fashions creating their own personal expressions while beings less concerned about
norms and standards. (Solomon 1999) Another author, Halliburton, states that postmodern
consumers are individualist viewing quality as more subjective, defined by its aesthetic and cultural
attributes, its authenticity and its ability to provide meaning. (Halliburton 2000:12). “It is in
consumption that the consumer produces not only his physique (physical self) through what he
consumes, but also his mentality and/or worldview.” (Friss, 2005) This statement along with the
definition of a postmodern consumer gives a broader insight to the possible explanation of why
Danish specialized coffee bars have been able to gain success even in times of financial pressure.
Even though it off course aren’t all Danish consumers that can be put under the characterization of
an postmodern consumer, many of the youngsters simply fit perfectly in, as they don’t pay attention
107
to price and value their development of mentality. “Some consumers see coffee consumption as a
meaningful tool for increasing their quality of life and/or creating their image.”(Friss, 2005)
A key word describing postmodernism is individualism. The fact of consumers striving to become
individualist separating and differentiating themselves from the mainstream can be seen in their
consumption of specialized coffee. Even though the prices are high it’s a low involvement product
which ads greater value to the image development balancing the high priced sacrifice. Furthermore
It’s very common that these consumers put great effort in gaining pleasure from every consumption
e.g. good consciousness from buying environmentally responsible products. (Friss, 2005)

108
Appendix 4: The Cortex
Source: Bernard J. Baars and Nicole M. Gage: Cognition, Brain and Consciousness. Introduction to Cognitive
Neuroscience. 2010. Elsevier.
This picture shows the specialized regions of the cortex, the huge covering of the
brain. Cortex is a flat sheet that is folded into the upper cranium. Notice the colored
regions. The colored regions represent (on the right of both figures) the sensory
halves of cortex, also known as the posterior half. This is where we find the vision
(blue) and hearing (yellow) areas.
It is the cortex that is believed to support the specific contents of conscious
experiences. Its posterior half is sensory, its front half is motor and ´future directed`-
cognition, working memory, planning, decision-making.

109
Appendix 5: David Aaker´s ´brand equity model´
Source: Brand equity model adopted from Aaker, 1996, p.9

110
Appendix 5.a: Mashlow´s hierarchy of needs
Source: Kotler, Philip; Keller, Kevin Lane; Brady Maired; Goodmann, Malcolm; Hansen, Torben; (2009): ”Marketing
Management”, Pearson Prentice Hall

111
Appendix 6: Kevin Keller´s Consumer Based brand equity (CBBE) pyramid.
Inspired from: Keller, K.L. (2012): Strategic brand management, a European perspective. Harlow; Financial times
Prentice Hall.p.66
Source:www.vizual.net

112
Appendix 7: Reward components
Source: Bernard J. Baars and Nicole M. Gage: Cognition, Brain and Consciousness. Introduction to Cognitive
Neuroscience. 2010. Elsevier.
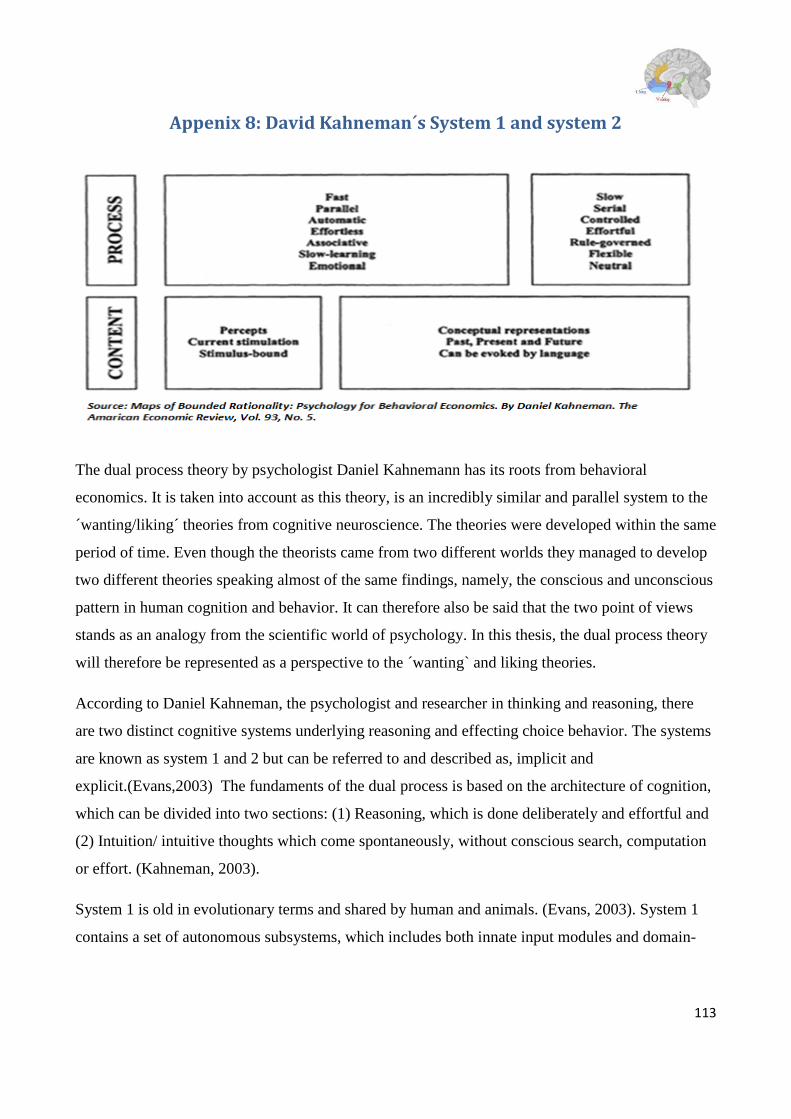
113
Appenix 8: David Kahneman´s System 1 and system 2
The dual process theory by psychologist Daniel Kahnemann has its roots from behavioral
economics. It is taken into account as this theory, is an incredibly similar and parallel system to the
´wanting/liking´ theories from cognitive neuroscience. The theories were developed within the same
period of time. Even though the theorists came from two different worlds they managed to develop
two different theories speaking almost of the same findings, namely, the conscious and unconscious
pattern in human cognition and behavior. It can therefore also be said that the two point of views
stands as an analogy from the scientific world of psychology. In this thesis, the dual process theory
will therefore be represented as a perspective to the ´wanting` and liking theories.
According to Daniel Kahneman, the psychologist and researcher in thinking and reasoning, there
are two distinct cognitive systems underlying reasoning and effecting choice behavior. The systems
are known as system 1 and 2 but can be referred to and described as, implicit and
explicit.(Evans,2003) The fundaments of the dual process is based on the architecture of cognition,
which can be divided into two sections: (1) Reasoning, which is done deliberately and effortful and
(2) Intuition/ intuitive thoughts which come spontaneously, without conscious search, computation
or effort. (Kahneman, 2003).
System 1 is old in evolutionary terms and shared by human and animals. (Evans, 2003). System 1
contains a set of autonomous subsystems, which includes both innate input modules and domain-

114
specific knowledge acquired by a domain-general learning mechanism. (Ibid). In system 1, the mind
operates fast, automatic, effortless, associative and often emotionally charged. (Kahneman, 2003).
System 1 process is generally rapid, parallel and their final product is posted in consciousness.
(Evans, 2003). The thoughts in system 1 are typically controlled by habits and are therefore difficult
to control and modify. (Ibid)
System 2 is evolutionarily recent and only figurate among humans. System 2 permits reasoning and
hypothetical thinking. It is controlled by working memory, capacity and measures of general
intelligence. (Evans, 2003). It typically operates slower, serial, effortful and can be controlled by
rules. (Kahneman,2003).
In the thinking process both systems overlap each other as system 2 monitors the activities in
system 1, together having a great impact on consumers judgment and decision making. Frequently
people decide their actions based on experience or intuition, - relating to system 1. However, people
also tend to make decision as e.g. future possibilities or strategically initiatives which relate and
activate system 2. For instance in the coffee experiment, where respondents before the tasting tend
to express their pre-liking towards the brands they are most familiar with. In this case, system 1 is
activated, - as their minds operates fast and initiative. When respondents later on are set to evaluate
the individual tastes, system 2 is activated as the assignment acquires more effort and e.g. the use of
memory.
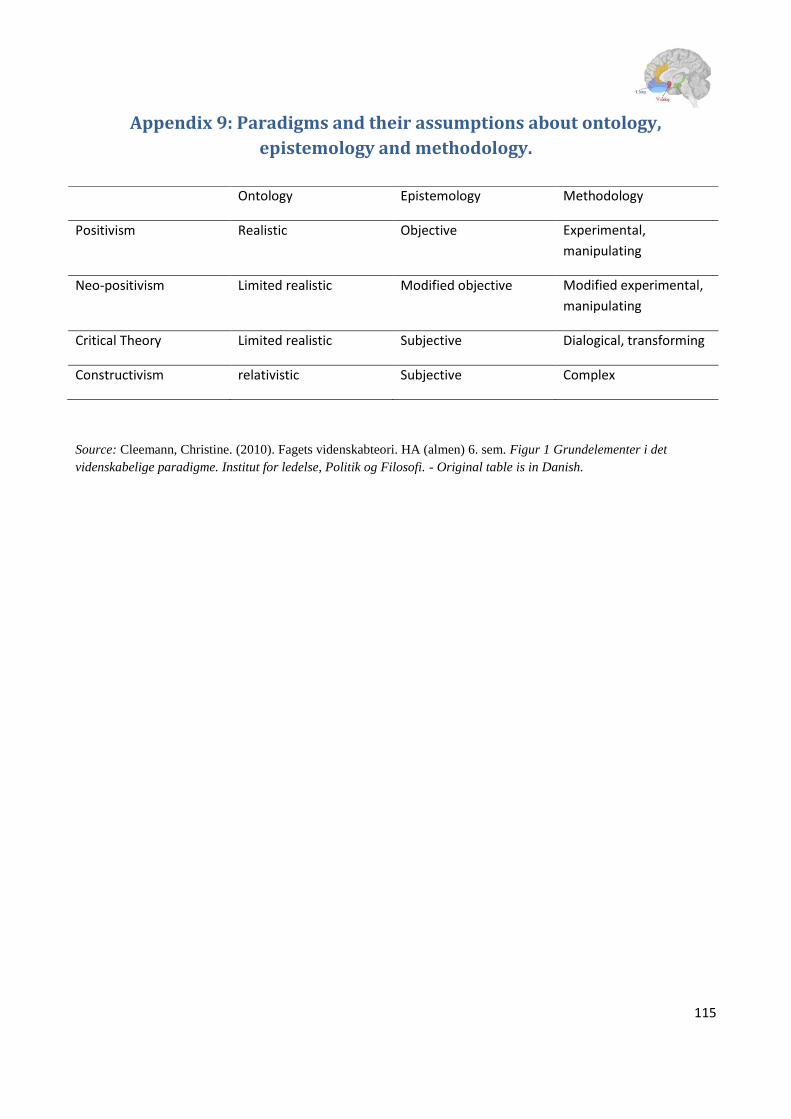
115
Appendix 9: Paradigms and their assumptions about ontology,
epistemology and methodology.
Source: Cleemann, Christine. (2010). Fagets videnskabteori. HA (almen) 6. sem. Figur 1 Grundelementer i det
videnskabelige paradigme. Institut for ledelse, Politik og Filosofi. - Original table is in Danish.
Ontology Epistemology Methodology
Positivism Realistic Objective Experimental,
manipulating
Neo-positivism Limited realistic Modified objective Modified experimental,
manipulating
Critical Theory Limited realistic Subjective Dialogical, transforming
Constructivism relativistic Subjective Complex

116
Appendix 10: Experiment guideline 1. Recruitment: Participants were students and staff passing by the central hall of Copenhagen
business School, Solbjerg Plads. On the set-up, hang big signs informing about the test. In all six
days participant showed great interest and by themselves formed a cue culture on the couch next to
the set-up. As respondents constantly came, the recruitment process became more or less
superfluous.
2. Registration: Participants were provided by registration sheet, were they got introduced to the
experiment procedure and asked to fill in personal information.
3. Introduction and testing procedure:
”Hi, how nice that you would like to try. Please have a seat.”
If asked: “Why are you doing this test? It´s probably a marketing study with hidden agendas? Are you
trying to discover whether the brands have an impact on taste preferences? “ Etc...
I answered (with a convincing smile): “I’m doing this test to collect data for my thesis which is about
coffee and taste preferences. It´s pretty funny to imagine, that one could actually end up writing a thesis
about coffee. But, yes that’s what I´m doing”
“Okay, well the test is about you tasting 4 different versions of black filter coffee, from the 4 presented coffee
suppliers. The samples will be presented without milk, so you have a greater chance of tasting the actual
coffee. To begin with you will be filling out some questions. Meanwhile I will prepare the samples for you.
Then you will have to taste them individually and evaluate each one after having tasted it.Then you will have
to fill out the rest of the questions, while I prepare a final cup of coffee you get to take along as a thanks for
participating. If you want me to add milk in your final coffee I can do that. Do you have some
questions?...Ok then, let’s start. Please fill out the first and second page….”
Meanwhile participant is filling out questions, I ask: “Would you like some sugar in your samples?”
The samples gets measured and placed on the dots under the brand name.
When participant is done filling out questions: “So, this is the four samples you will taste. After having
tasted one please put the cup back at the dot and evaluate immediately on the related scale. In between each
sample I need you to rinse your mouth with a little water and take a little brake before you try the next
sample. Please start from here (Starbuck) and move down. (Baresso -> Ricco -> waynes)
When respondent is done tasting, the samples get measured. “Now, please fill in the rest of the questions”.
The measuring of samples is done. “Which coffee would you like to take along? Sugar? Milk?...
“Thank you for participating, If you want to hear more about the research and which course it is that I´m
doing it in, please fill in your email information’s at the list”.
“Have a nice day”
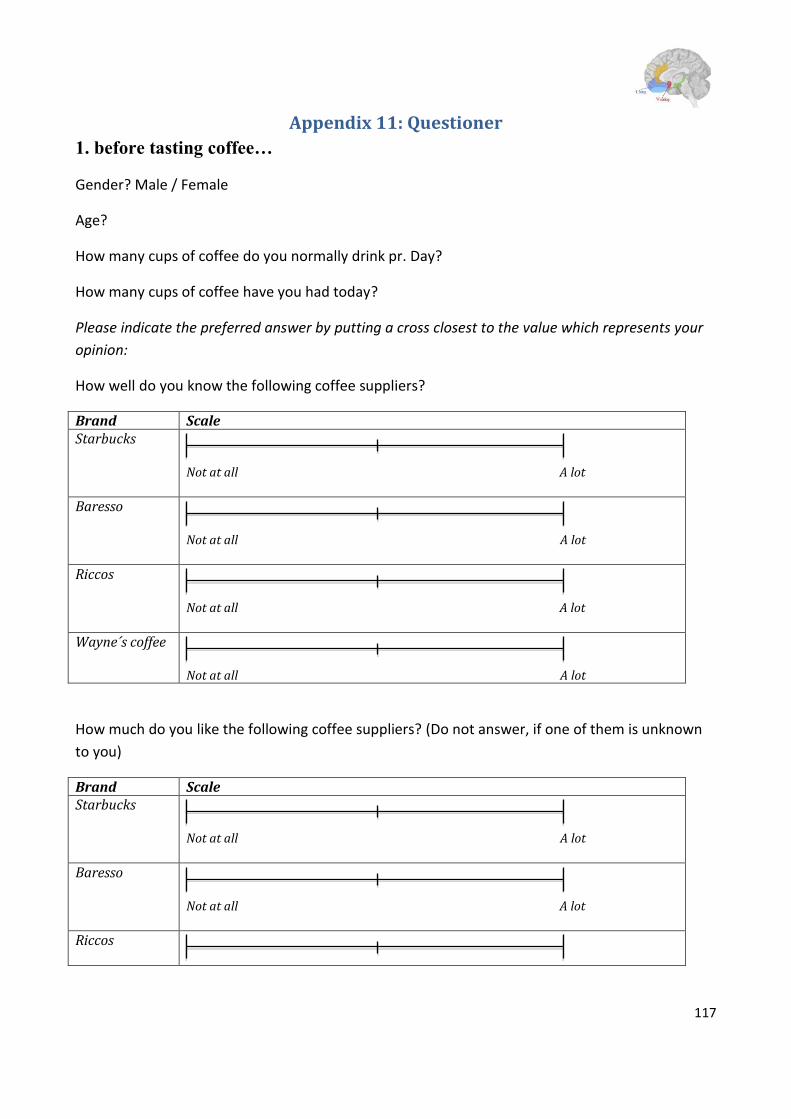
117
Appendix 11: Questioner
1. before tasting coffee…
Gender? Male / Female
Age?
How many cups of coffee do you normally drink pr. Day?
How many cups of coffee have you had today?
Please indicate the preferred answer by putting a cross closest to the value which represents your
opinion:
How well do you know the following coffee suppliers?
Brand Scale Starbucks
Not at all A lot
Baresso
Not at all A lot
Riccos
Not at all A lot
Wayne´s coffee
Not at all A lot
How much do you like the following coffee suppliers? (Do not answer, if one of them is unknown
to you)
Brand Scale Starbucks
Not at all A lot
Baresso
Not at all A lot
Riccos
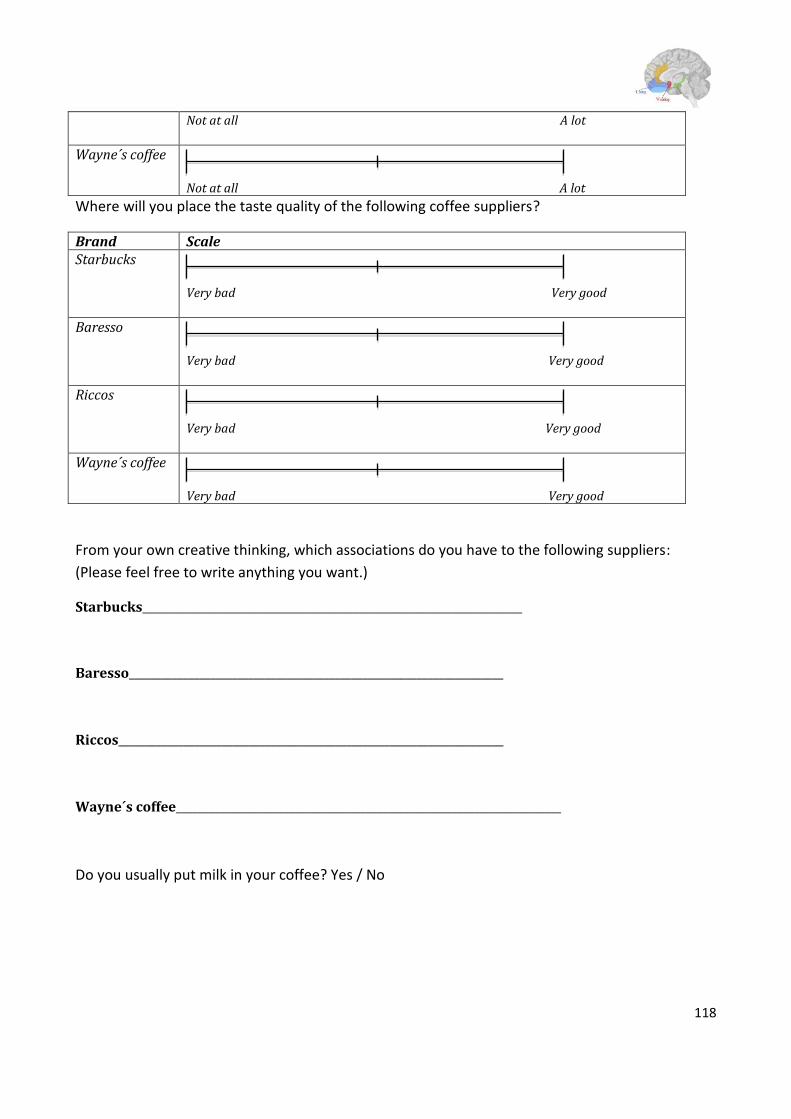
118
Not at all A lot
Wayne´s coffee
Not at all A lot
Where will you place the taste quality of the following coffee suppliers?
Brand Scale Starbucks
Very bad Very good
Baresso
Very bad Very good
Riccos
Very bad Very good
Wayne´s coffee
Very bad Very good
From your own creative thinking, which associations do you have to the following suppliers:
(Please feel free to write anything you want.)
Starbucks______________________________________________________________________
Baresso_____________________________________________________________________
Riccos_______________________________________________________________________
Wayne´s coffee_______________________________________________________________________
Do you usually put milk in your coffee? Yes / No
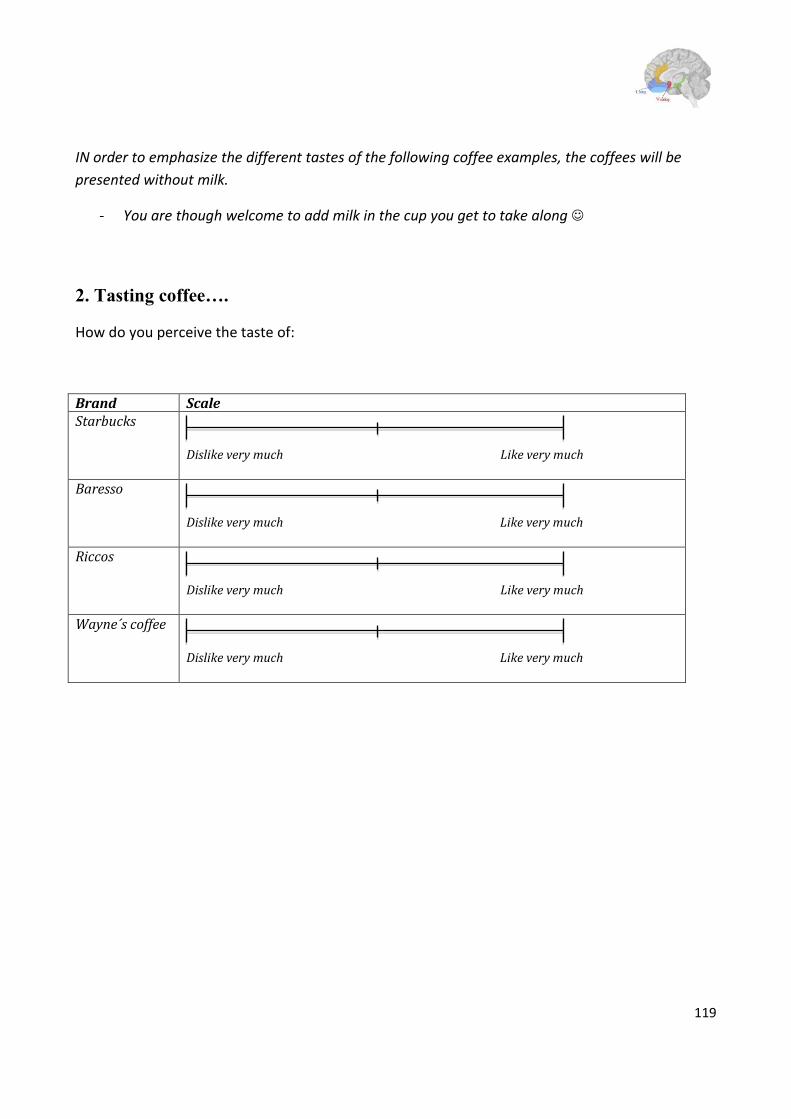
119
IN order to emphasize the different tastes of the following coffee examples, the coffees will be
presented without milk.
- You are though welcome to add milk in the cup you get to take along
2. Tasting coffee….
How do you perceive the taste of:
Brand Scale Starbucks
Dislike very much Like very much
Baresso
Dislike very much Like very much
Riccos
Dislike very much Like very much
Wayne´s coffee
Dislike very much Like very much

120
3. Debriefing on test…
Are there any of the four coffee examples you by any chance would drink again without adding
milk? Yes/no
If yes, which?
On an everyday basis: How often do you think your favorite coffee drink is chosen simply out of
taste?
Always Never
Coffee tasting test:
Did you notice that some of the tastes were the same? Yes/no
If yes, which one?
What do you think this test was about?
Do you think your taste perceptions towards the samples were affected by the brand names?
Not at all A lot
Starbucks – Riccos - Baresso – wayne´s coffee
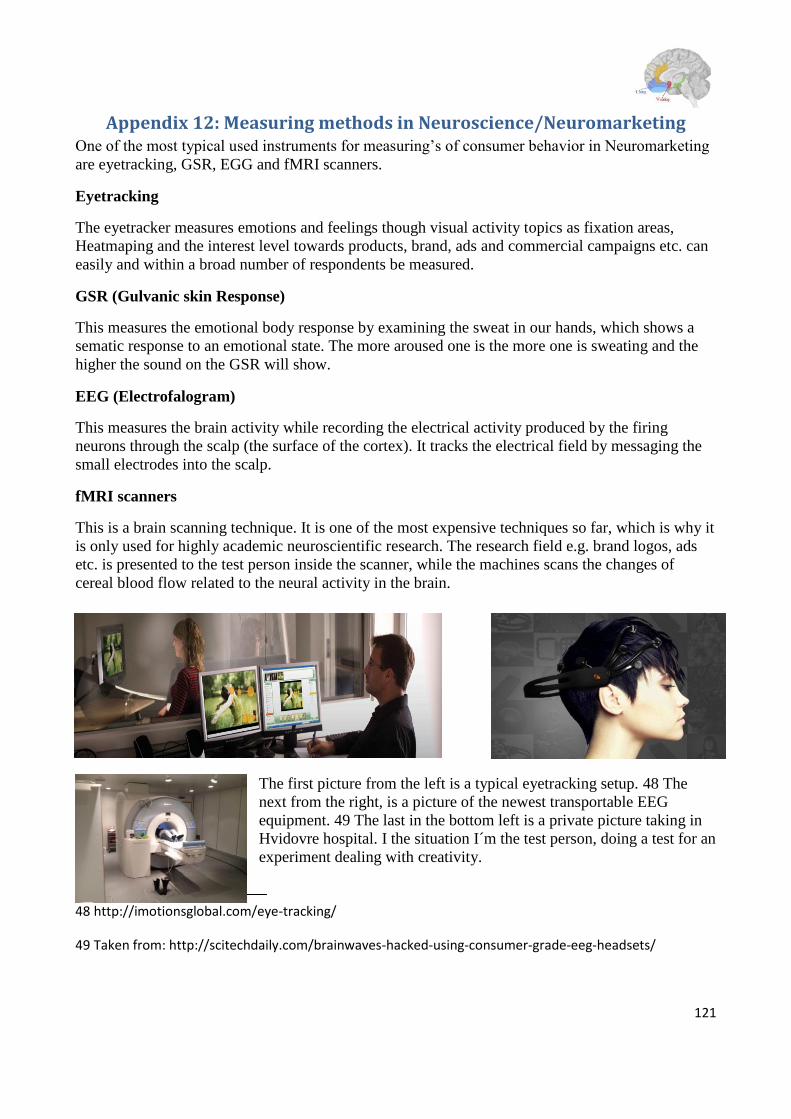
121
Appendix 12: Measuring methods in Neuroscience/Neuromarketing One of the most typical used instruments for measuring’s of consumer behavior in Neuromarketing
are eyetracking, GSR, EGG and fMRI scanners.
Eyetracking
The eyetracker measures emotions and feelings though visual activity topics as fixation areas,
Heatmaping and the interest level towards products, brand, ads and commercial campaigns etc. can
easily and within a broad number of respondents be measured.
GSR (Gulvanic skin Response)
This measures the emotional body response by examining the sweat in our hands, which shows a
sematic response to an emotional state. The more aroused one is the more one is sweating and the
higher the sound on the GSR will show.
EEG (Electrofalogram)
This measures the brain activity while recording the electrical activity produced by the firing
neurons through the scalp (the surface of the cortex). It tracks the electrical field by messaging the
small electrodes into the scalp.
fMRI scanners
This is a brain scanning technique. It is one of the most expensive techniques so far, which is why it
is only used for highly academic neuroscientific research. The research field e.g. brand logos, ads
etc. is presented to the test person inside the scanner, while the machines scans the changes of
cereal blood flow related to the neural activity in the brain.
The first picture from the left is a typical eyetracking setup. 48 The
next from the right, is a picture of the newest transportable EEG
equipment. 49 The last in the bottom left is a private picture taking in
Hvidovre hospital. I the situation I´m the test person, doing a test for an
experiment dealing with creativity.
48 http://imotionsglobal.com/eye-tracking/
49 Taken from: http://scitechdaily.com/brainwaves-hacked-using-consumer-grade-eeg-headsets/

122
Appendix 13: Goal of the test The respondents were asked to give their opinion on what the test was about.
If I would rate according to coffee or brand, Coffee tastes, Associations and products, Taste and how taste
is affected, The taste of the coffee and the difference between them, To see if there is a certain brand
pattern, Taste differences, About coffee taste, Does brand make a difference for our taste, About coffee
habits, or about what flavors triggers your mind, Branding - how onces perception of the quality of a given
brand´s product influences the consumers experience of consuming the products, Taste, quality and
associations with the brand, branding, standardized/similar coffee beans, taste/brand preferences, Coffee
tastes, Noticing the differences, finding out which one consumers prefer, Our brand perception, if
perceived images have an influence on which coffee is preferred, popularity of the brands and weather
they impact our coffee drinking habbits, seeing whether the brand name affects the tasting results, brand
recognition changes the coffee taste, Do you choose your coffee because of the brand, That one choose
from out of perceptions before tasting, taste test and the force of brands, branding, measuring on
brandrecognition, testing the segmentgroups preferences, tasting differences, If the taste of the coffee is
accosiated with the brand, brand significance vs. Brand, brand, to see the similarities between associations
of brand and task, tasting coffee, best taste, branding, emotions vs. Brands, effect of brand brand
knowledge on how much you have to drink to make an evolution, taste of coffee, brand accosiations,
whether the price/brand can have an influence on what you choose to buy or even the taste, how once
favorite coffee is chosen simply out of taste, a survey, quality, coffee tasting, branding, test of the taste,
coffee brands and coffee, that we choose after brand, they are all the same, whether you buy coffee
because of the taste or the brand, whether one gets affected by the brand name, on whether knowing
brand before hand influences the level of desire, costumer decision making, whether people can taste the
difference in flavor? Or whether the big brands er "hyped, pereption bias from brand awareness/attitude,
perception of coffee, brand/reality?, branding and taste or quality, brand loyalty towards coffee brands,
coffee brands and coffee, About the image of these coffees, which coffee people prefer, how the taste of
the coffee has an appeal to different people, tasting my tasting skills vs. Brand wareness, brand affectness,
consumer behavior, taste vs. Brand?, perception, which coffee one likes unconsciousness and how the
brand has an effect on the taste. Maybe you switched the brands or the coffee, effect of the brands (and
pre-driking bias/optimism) and the rating of the coffees, branding influende on what we perceive as
quality, perception of different coffee brands, see if brands have an effect/influence on our feeling about
the product, coffee, whether you can taste the differences in coffee and/or let youself get affected by the
brands, effect of brands, brand, not the taste, To see how perception are effected by brand names, brand,
hvilken kaffe der smagte bedst, coffee, I have no idea, to see wheter people answer from out of their
relationship to brand or the taste of coffee, which coffee producer that is the most populare, consumer
loyalty and maybe branding effects, testing our inception, coffee brands and coffee, promotion or product
development, brand value and perception besides this quality of coffee, recognizing and distinguishing
different brands of coffee, wheater taste is affected by brand name, marketing, brand influencing taste,
about taste and brand, competition, testing brand, type of coffee preference, science project about tast
and culture, sampling and corporate identity, Branding, peoples prefereces towards coffee and cafees,
Coffee tastes, I think the test is to analyze how the individual responses when they know which brand it it,
How stupid Iam when it comes to my test, brands, why someone thinks that one brand is better than the
other, costumer research, brand and costumer taste perception.
,
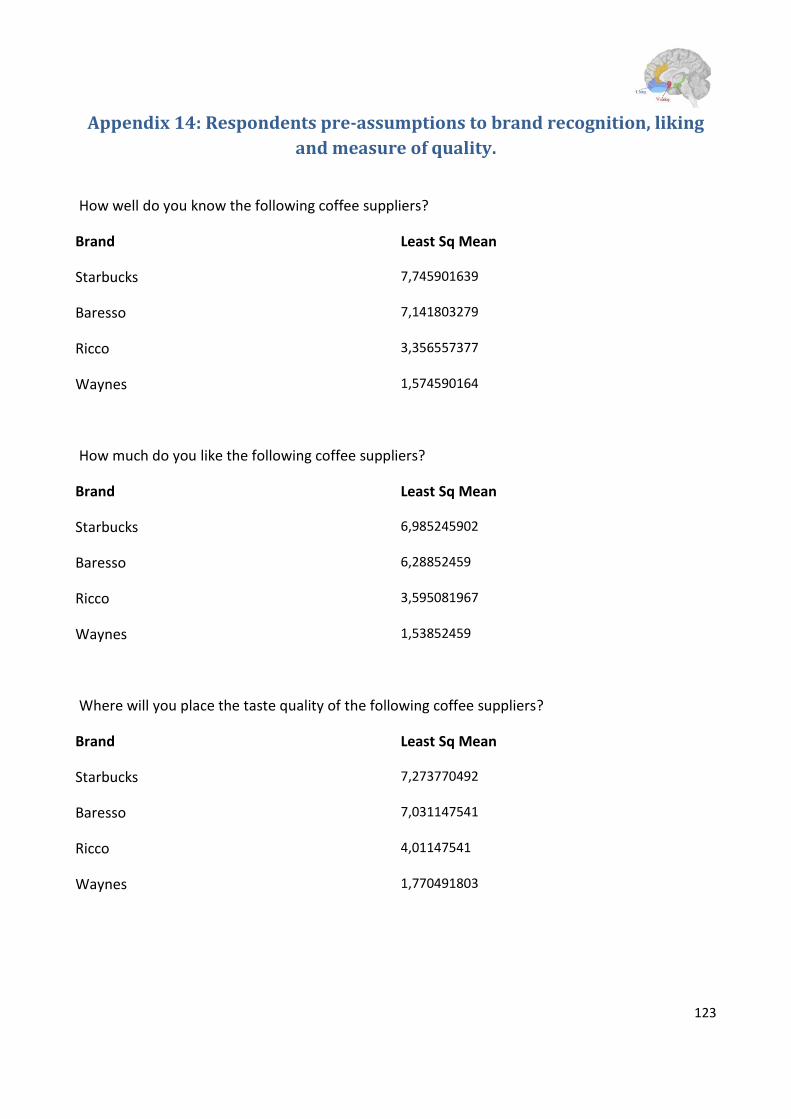
123
Appendix 14: Respondents pre-assumptions to brand recognition, liking
and measure of quality.
How well do you know the following coffee suppliers?
Brand Least Sq Mean
Starbucks 7,745901639
Baresso 7,141803279
Ricco 3,356557377
Waynes 1,574590164
How much do you like the following coffee suppliers?
Brand Least Sq Mean
Starbucks 6,985245902
Baresso 6,28852459
Ricco 3,595081967
Waynes 1,53852459
Where will you place the taste quality of the following coffee suppliers?
Brand Least Sq Mean
Starbucks 7,273770492
Baresso 7,031147541
Ricco 4,01147541
Waynes 1,770491803

124
Appendix 15. Defining Emotions, Feelings, Gestalts and Thoughts Emotions and feelings
Emotional functions are usually related to the limbic system. (Bernard et al, 2010) The limbic
system is built to respond towards evolutionary pressure such as danger (e.g. rage, panic), needs
(e.g. seeking, curiosity, lust, care, play) and acquisition of food (Ibid). Emotions response that are
initiated in the limbic system are typically further processed by regions of the neocortex. (Bernard,
2010) The neocortex is the home base for complex cognitive and social abilities of human beings.
(Ibid) It is in this part of the brain, humans experience the effects of the limbic system, though
added valance. (Bernard et al, 2010) According to Antonio Damasio, an emotion can be defined as:
“a patterned collection of chemical and neural responses that is produced by the brain when it
detects the presence of an emotionally competent stimulus — an object or situation, for
example.”(Damasio, 2001.p.781)
Emotions are used for coping with objects and situations that are potentially dangerous or
advantageous.(Damasio, 2001). Most emotional responses are directly observable with either the
naked eye or psychophysiological and neurophysiological measurements.(Ibid).
Human has emotions, as they are initiated in the limbic system as a response to conditioned stimuli.
(Bernard et al, 2010) The same way stimulus can have a conscious and unconscious effect on
human mind so can emotions. Emotions on a non-conscious level is experienced in the limbic
system, whereas as emotions on a conscious level is experienced in the neocortex. (Ibid) “The
feeling of an emotion” is according to Damasio et al, referred to as an experience of the emotional
response. (Bernard et al, 2010)
The best way to recognize emotions are by overt behavior as e.g.: Reaction to surprising events and
response to threatening situations. (Ramsøy, lec. 4) Emotions can be both positive and negative.
Positive emotions are typically driven by rewards, they approach behaviors and is accompanied by
feeling of anticipation, enjoyment and happiness. Whereas negative emotions are driven by fear and
aversion, they also create avoiding behaviors and get accompanied by feelings of fear, anxiety and
sadness. The Outcome of emotions can either be: Rewards, which increase the likelihood that leads
to a behavior being repeated or punishment, which decrease the likelihood of an a behavior being
repeated. (lec 4). “Emotions feed into constructed preferences that then motivate decisions.” (Dai et
125
al, 2010 p.324). Finally, Emotions are known to proceed feelings but does not automatically lead to
them as emotions typically are unconscious. (lec.4)
Feelings is an organism’s experience of being in a certain conscious emotional state. (Bernard et al,
2010) It is furthermore a commonly used noun for emotions, moods, mood disorders, personality
and culture. (Plessis, 2011). According to Antonio Damasio, feelings are defined as:
“the mental representation of the physiological changes that characterize emotions. Unlike
emotions, which are scientifically public, feelings are indeed private.” (Damasio, 2001.p.781)
Feelings are easier to measure, as they are conscious, opposite to emotions which are body
responses. Human uses feelings to e.g. express their state of mind when evaluating a specific
episode or before taking a certain action.
Feelings and emotions are two different motivation systems. (Bernard et al, 2010) In relation to this
study, feelings are connected to the consumers conscious liking whereas emotions are connected to
their unconscious “wanting”.
Liking and wanting can be used in the context of predicting behavior. (Bernard et al, 2010) In
relation to the coffee tasting test, the respondent´s ´feelings´ was expressed when giving their
opinion on questionaries’ whereas their emotional state of mind (wanting) was expressed by e.g.
facial expressions and body reactions. The correlation of results from liking and wanting are
interesting factors to discover as liking and wanting connect differently to the respondents
subsequent choices and behavior.
Gestalts and thoughts
The process of thinking takes place in the frontal lobes. (Plessis, 2011) In order to understand the
process of thinking, it can be described as an orchestra playing a symphony, hence the orchestra is
the thoughts and brain the symphony. (Ibid) All instruments have important roles to play, each acts
independently but all together in a concert. (Ibid)
In order to explain how thoughs are created, one must define and understand the role of gestalts.
Erik de Plesis, explain the definition of gestalt as, waves crated in a pool – were the brain is the pool
and the waves being neural networks constantly evoking and transmitting – some grabbed by

126
attention, some not. (Plessis, 2011) It is these gestalts that create conscious and unconscious
thoughts.
The process of a human minds thinking can be explained as “Thoughts are developing gestalts
because of neurons recruiting other neurons. As we think about things so these thoughts trigger
neurons and other thoughts” (Plessis, 2011)
This statement, may be an explanation of how the ´unconscious thinking process´, may lead to an
unconscious wanting or crave for a certain object. In relation to the study, the unconscious
floatation of thought gestalts may have been what effected respondents leading them to associate
the presented coffee logo to certain things driving them subsequently to experience the sample taste
in a certain way. The constantly floating gestalts and thoughts are features which play an important
role in the understanding of consumer cognition, liking, wanting and choice which is why it is
found interesting to take into account.
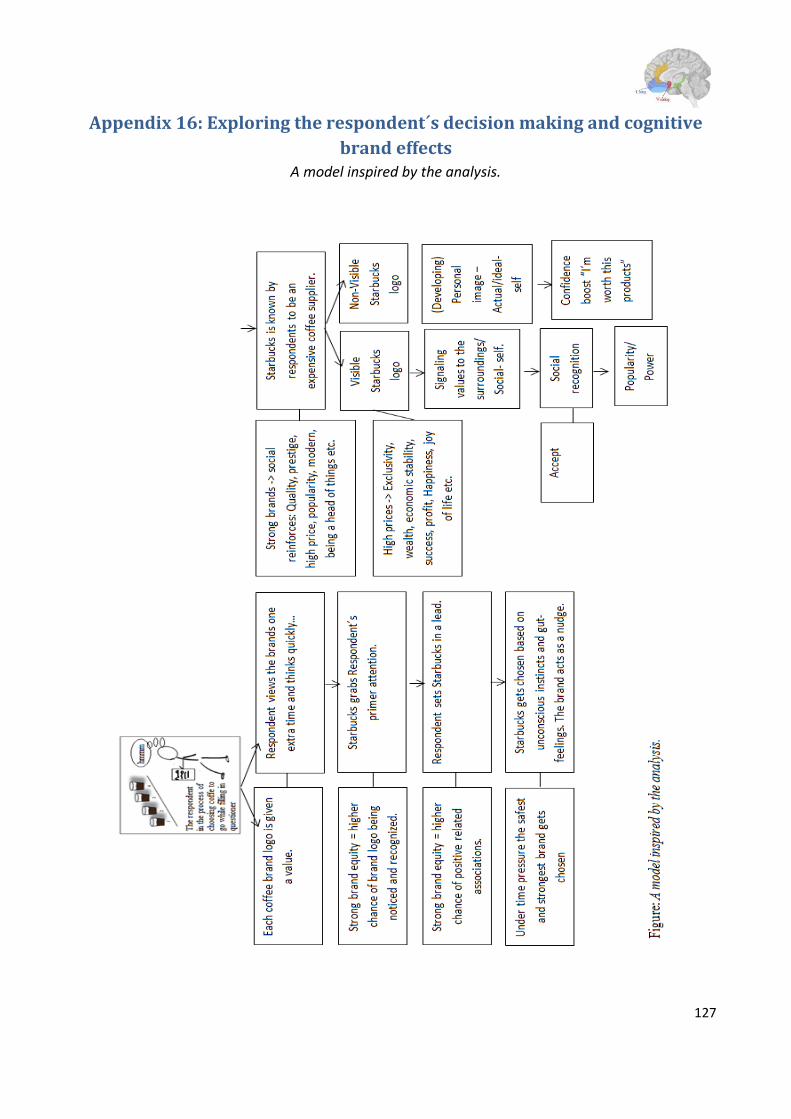
127
Appendix 16: Exploring the respondent´s decision making and cognitive
brand effects A model inspired by the analysis.

128
Appendix 17: Starbucks, Fields
Source: Fields Facebook page - https://www.facebook.com/fieldsshopping?fref=ts
Starbucks grand opening the 29th of November at
Scandinavia’s biggest shopping Mall: Fields.
Visitors were standing in line anxious to out the
coffee.
Starbucks´s front façade in Fields. The coffee
shop is placed next to the supermarket Bilka.
The coffee shop´s furniture and decorations. The
colors are primarily brown, grey and beige. The
atmosphere is cozy and there is a dominating
scent of fresh brewed coffee.
The Starbucks staff is dressed in black and red.