state street bank and trust company ssga s&p 500® index ... · audit 82,200 other 10,744 total...
TRANSCRIPT

State Street Bank and Trust Company
SSgA S&P 500® Index Securities Lending Series Fund
SSgA S&P 500® Index Non-Lending Series Fund
Combined Financial Statements
December 31, 2013

PricewaterhouseCoopers LLP, 125 High Street, Boston, MA 02110 T: (617) 530 5000, F: (617) 530 5001, www.pwc.com/us
Independent Auditor's Report To the Participants and Trustee of State Street Bank and Trust Company SSgA S&P 500® Index Securities Lending Series Fund and State Street Bank and Trust Company SSgA S&P 500® Index Non-Lending Series Fund We have audited the accompanying combined financial statements of SSgA S&P 500® Index Securities Lending Series Fund and SSgA S&P 500® Index Non-Lending Series Fund ("the Fund"), which comprise the combined statement of assets and liabilities, including the combined schedule of investments as of December 31, 2013, and the related combined statements of operations and of changes in net assets and the financial highlights for the year then ended. These financial statements and financial highlights are hereafter collectively referred to as "combined financial statements". Management's Responsibility for the Combined Financial Statements Management is responsible for the preparation and fair presentation of the combined financial statements in accordance with accounting principles generally accepted in the United States of America; this includes the design, implementation and maintenance of internal control relevant to the preparation and fair presentation of combined financial statements that are free from material misstatement, whether due to fraud or error. Auditor's Responsibility Our responsibility is to express an opinion on the combined financial statements based on our audit. We conducted our audit in accordance with auditing standards generally accepted in the United States of America. Those standards require that we plan and perform the audit to obtain reasonable assurance about whether the combined financial statements are free from material misstatement. An audit involves performing procedures to obtain audit evidence about the amounts and disclosures in the combined financial statements. The procedures selected depend on our judgment, including the assessment of the risks of material misstatement of the combined financial statements, whether due to fraud or error. In making those risk assessments, we consider internal control relevant to the Fund’s preparation and fair presentation of the combined financial statements in order to design audit procedures that are appropriate in the circumstances, but not for the purpose of expressing an opinion on the effectiveness of the Fund’s internal control. Accordingly, we express no such opinion. An audit also includes evaluating the appropriateness of accounting policies used and the reasonableness of significant accounting estimates made by management, as well as evaluating the overall presentation of the combined financial statements. We believe that the audit evidence we have obtained is sufficient and appropriate to provide a basis for our audit opinion. Opinion In our opinion, the combined financial statements referred to above present fairly, in all material respects, the financial position of SSgA S&P 500® Index Securities Lending Series Fund and SSgA S&P 500® Index Non-Lending Series Fund at December 31, 2013, and the results of their operations and changes in their net assets and the financial highlights for the year then ended, in accordance with accounting principles generally accepted in the United States of America.
April 11, 2014

State Street Bank and Trust Company
SSgA S&P 500® Index Securities Lending Series Fund
SSgA S&P 500® Index Non-Lending Series Fund
Combined Statement of Assets and Liabilities December 31, 2013
The accompanying notes are an integral part of these combined financial statements. 2
Assets Investments in securities, at value (including securities on loan of $263,190,308)
(cost $36,442,871,223) $ 61,336,798,619
Cash 145,312Investment in State Street Cash Collateral Fund (cost $268,624,795) 268,624,795Receivable for Fund units issued 218,816,182Receivable for investments sold 286,137,111Variation margin receivable 4,512,525Dividends receivable 81,326,580Interest receivable 153,959
Total assets 62,196,515,083
Liabilities Payable for collateral on securities loaned 268,624,795Payable for Fund units redeemed 476,053,348Payable for investments purchased 143,496,807Accrued expenses 1,326,243
Total liabilities 889,501,193
Net Assets, at value $ 61,307,013,890

State Street Bank and Trust Company
SSgA S&P 500® Index Securities Lending Series Fund
SSgA S&P 500® Index Non-Lending Series Fund
Combined Statement of Assets and Liabilities (continued) December 31, 2013
The accompanying notes are an integral part of these combined financial statements. 3
Lending Fund SSgA S&P 500® Index Securities Lending Series Fund - Class I (26,665,171 units outstanding, at $409.59 per unit net asset value) $ 10,921,687,033SSgA S&P 500® Index Securities Lending Series Fund - Class II (25,407,684 units outstanding, at $37.86 per unit net asset value) 961,996,653SSgA S&P 500® Index Securities Lending Series Fund - Class III (9,337,344 units outstanding, at $38.55 per unit net asset value) 359,960,230SSgA S&P 500® Index Securities Lending Series Fund - Class IV (5,730,835 units outstanding, at $38.58 per unit net asset value) 221,085,688SSgA S&P 500® Index Securities Lending Series Fund - Class V (1,319,682 units outstanding, at $19.39 per unit net asset value) 25,594,572SSgA S&P 500® Index Securities Lending Series Fund - Class VI (5,074,467 units outstanding, at $13.98 per unit net asset value) 70,948,580SSgA S&P 500® Index Securities Lending Series Fund - Class VII (3,857,898 units outstanding, at $13.96 per unit net asset value) 53,873,078SSgA S&P 500® Index Securities Lending Series Fund - Class VIII (7,916,847 units outstanding, at $14.46 per unit net asset value) 114,457,913SSgA S&P 500® Index Securities Lending Series Fund - Class IX (72,488,049 units outstanding, at $13.93 per unit net asset value) 1,009,781,009SSgA S&P 500® Index Securities Lending Series Fund - Class XII (5,948,226 units outstanding, at $37.89 per unit net asset value) 225,360,144SSgA S&P 500® Index Securities Lending Series Fund - Class F (1,470,104 units outstanding, at $396.02 per unit net asset value) 582,191,396SSgA S&P 500® Index Securities Lending Series Fund - Class GM-A (9,625,169 units outstanding, at $58.01 per unit net asset value) 558,338,101SSgA S&P 500® Index Securities Lending Series Fund - Class GM-M (16,876,852 units outstanding, at $58.00 per unit net asset value) 978,875,697SSgA S&P 500® Index Securities Lending Series Fund - Class H (4,094,848 units outstanding, at $19.38 per unit net asset value) 79,360,904SSgA S&P 500® Index Securities Lending Series Fund - Class L (1,468,564 units outstanding, at $56.64 per unit net asset value) 83,179,645
$ 16,246,690,643
Non-Lending Fund SSgA S&P 500® Index Non-Lending Series Fund - Class A (1,113,728,333 units outstanding, at $33.23 per unit net asset value) $ 37,003,938,123SSgA S&P 500® Index Non-Lending Series Fund - Class C (29,106,918 units outstanding, at $37.85 per unit net asset value) 1,101,826,310SSgA S&P 500® Index Non-Lending Series Fund - Class D (17,412,335 units outstanding, at $16.70 per unit net asset value) 290,762,213SSgA S&P 500® Index Non-Lending Series Fund - Class E (45,695,967 units outstanding, at $15.84 per unit net asset value) 723,809,864

State Street Bank and Trust Company
SSgA S&P 500® Index Securities Lending Series Fund
SSgA S&P 500® Index Non-Lending Series Fund
Combined Statement of Assets and Liabilities (continued) December 31, 2013
The accompanying notes are an integral part of these combined financial statements. 4
SSgA S&P 500® Index Non-Lending Series Fund - Class K (184,552,160 units outstanding, at $14.55 per unit net asset value) 2,684,637,056SSgA S&P 500® Index Non-Lending Series Fund - Class N (85,929,157 units outstanding, at $37.88 per unit net asset value) 3,255,349,681
$ 45,060,323,247
$ 61,307,013,890

State Street Bank and Trust Company
SSgA S&P 500® Index Securities Lending Series Fund
SSgA S&P 500® Index Non-Lending Series Fund
Combined Statement of Operations Year Ended December 31, 2013
The accompanying notes are an integral part of these combined financial statements. 5
Investment income Dividends $ 1,121,680,730Interest 2,200,991Securities lending fee income (net of related expenses), allocated to the Lending Fund 1,002,798
Total investment income 1,124,884,519
Expenses Management 4,806,446Administrative service fee 8,150,830Administration 1,443,322Audit 82,200Other 10,744
Total expenses 14,493,542
Net investment income (loss) 1,110,390,977
Net realized and unrealized gain (loss): Net realized gain (loss): Investments 1,204,228,004Futures contracts 268,432,049
1,472,660,053
Net change in unrealized appreciation (depreciation): Investments 12,160,448,903Futures contracts 36,610,104
12,197,059,007
Net realized and unrealized gain (loss) 13,669,719,060
Net increase (decrease) in net assets resulting from operations $ 14,780,110,037
State Street Bank and Trust Company
SSgA S&P 500® Index Securities Lending Series Fund
SSgA S&P 500® Index Non-Lending Series Fund
Combined Statement of Changes in Net Assets Year Ended December 31, 2013
The accompanying notes are an integral part of these combined financial statements. 6
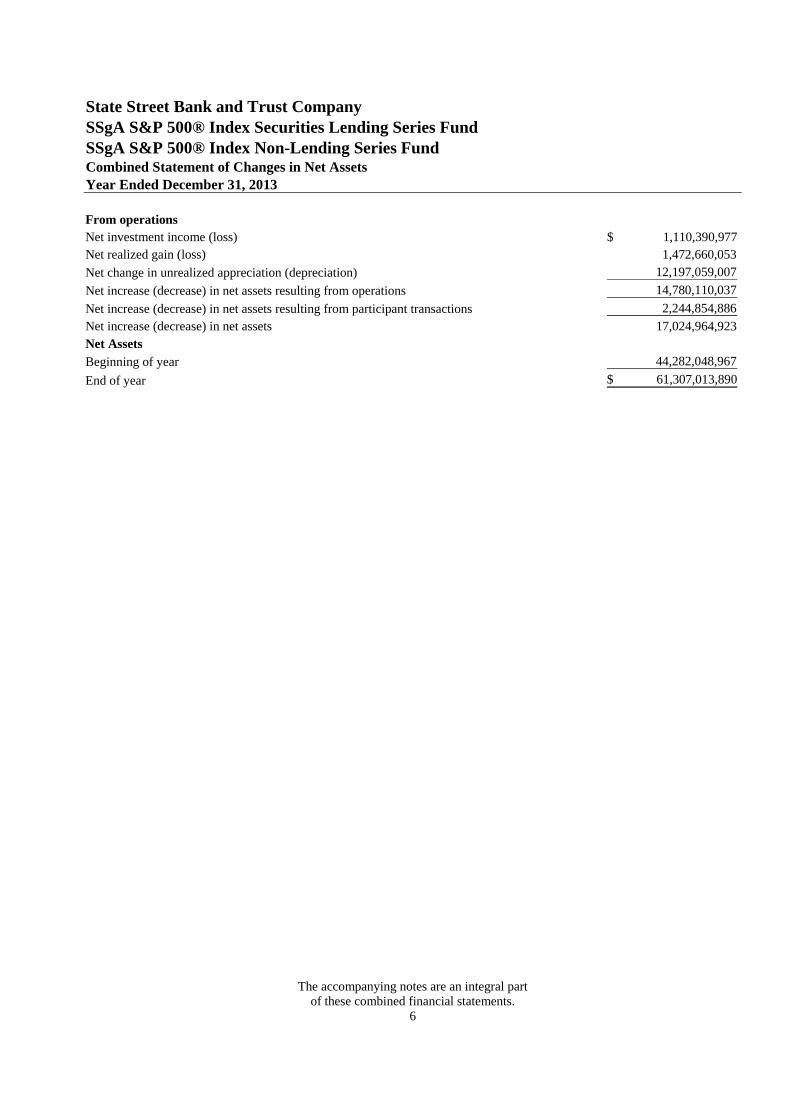
From operations Net investment income (loss) $ 1,110,390,977Net realized gain (loss) 1,472,660,053
Net change in unrealized appreciation (depreciation) 12,197,059,007
Net increase (decrease) in net assets resulting from operations 14,780,110,037
Net increase (decrease) in net assets resulting from participant transactions 2,244,854,886
Net increase (decrease) in net assets 17,024,964,923Net Assets
Beginning of year 44,282,048,967
End of year $ 61,307,013,890

State Street Bank and Trust Company
SSgA S&P 500® Index Securities Lending Series Fund
SSgA S&P 500® Index Non-Lending Series Fund
Combined Statement of Changes in Net Assets (continued) Year Ended December 31, 2013
Units Amount
The accompanying notes are an integral part of these combined financial statements. 7
Units of Participation Participant transactions for the Fund were as follows: Lending Fund Class I Units issued 5,139,168 $ 1,845,219,163Units redeemed (5,902,552) (2,161,612,674)
(763,384) (316,393,511)
Class II Units issued 7,957,829 $ 261,216,924Units redeemed (9,571,605) (317,405,357)
(1,613,776) (56,188,433)
Class III Units issued 2,127,712 $ 71,414,770Units redeemed (3,529,942) (119,448,281)
(1,402,230) (48,033,511)
Class IV Units issued 1,128,814 $ 38,159,333Units redeemed (1,296,649) (42,249,335)
(167,835) (4,090,002)
Class V Units issued 248,140 $ 4,111,304Units redeemed (934,752) (15,593,022)
(686,612) (11,481,718)
Class VI Units issued 1,205,199 $ 14,701,469Units redeemed (863,186) (10,497,120)
342,013 4,204,349
Class VII Units issued 1,611,584 $ 20,942,436Units redeemed (478,161) (5,857,692)
1,133,423 15,084,744
Class VIII Units issued 2,921,148 $ 37,167,497Units redeemed (2,581,577) (34,180,842)
339,571 2,986,655
Class IX Units issued 9,722,858 $ 117,238,060Units redeemed (9,327,760) (116,012,470)
395,098 1,225,590
State Street Bank and Trust Company
SSgA S&P 500® Index Securities Lending Series Fund
SSgA S&P 500® Index Non-Lending Series Fund
Combined Statement of Changes in Net Assets (continued) Year Ended December 31, 2013
Units Amount
The accompanying notes are an integral part of these combined financial statements. 8
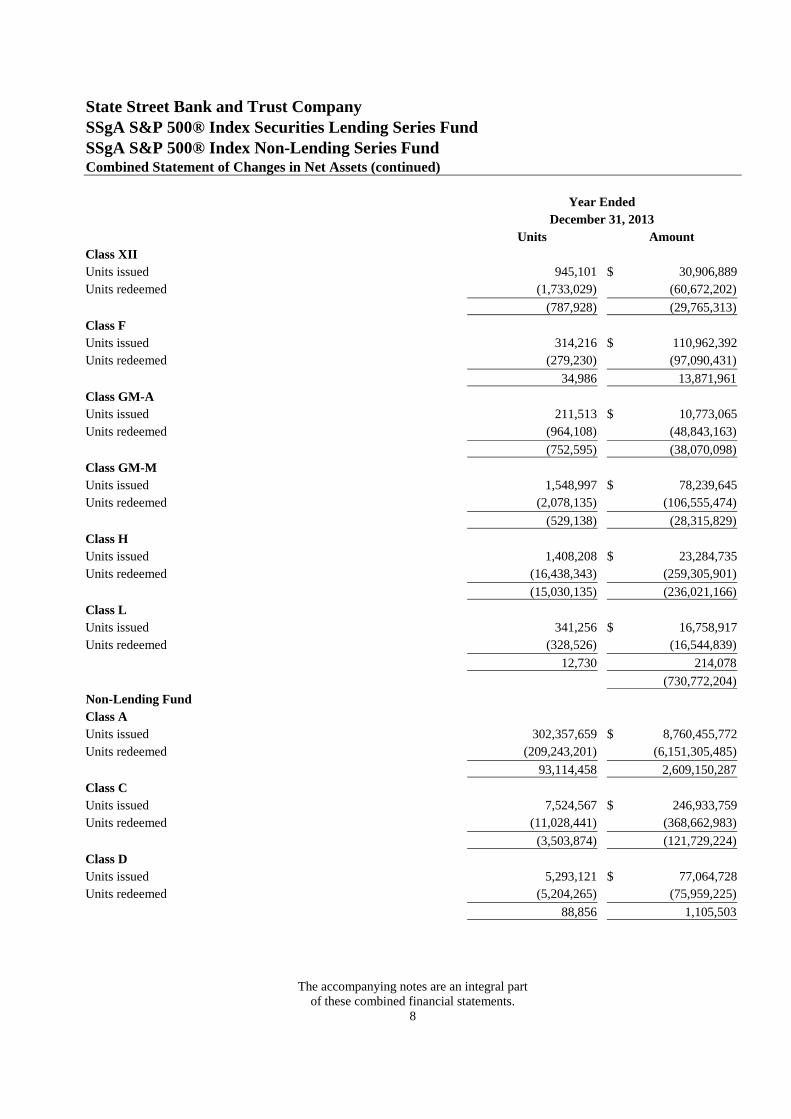
Class XII Units issued 945,101 $ 30,906,889Units redeemed (1,733,029) (60,672,202)
(787,928) (29,765,313)
Class F Units issued 314,216 $ 110,962,392Units redeemed (279,230) (97,090,431)
34,986 13,871,961
Class GM-A Units issued 211,513 $ 10,773,065Units redeemed (964,108) (48,843,163)
(752,595) (38,070,098)
Class GM-M Units issued 1,548,997 $ 78,239,645Units redeemed (2,078,135) (106,555,474)
(529,138) (28,315,829)
Class H Units issued 1,408,208 $ 23,284,735Units redeemed (16,438,343) (259,305,901)
(15,030,135) (236,021,166)
Class L Units issued 341,256 $ 16,758,917Units redeemed (328,526) (16,544,839)
12,730 214,078
(730,772,204)
Non-Lending Fund Class A Units issued 302,357,659 $ 8,760,455,772Units redeemed (209,243,201) (6,151,305,485)
93,114,458 2,609,150,287
Class C Units issued 7,524,567 $ 246,933,759Units redeemed (11,028,441) (368,662,983)
(3,503,874) (121,729,224)
Class D Units issued 5,293,121 $ 77,064,728Units redeemed (5,204,265) (75,959,225)
88,856 1,105,503
State Street Bank and Trust Company
SSgA S&P 500® Index Securities Lending Series Fund
SSgA S&P 500® Index Non-Lending Series Fund
Combined Statement of Changes in Net Assets (continued) Year Ended December 31, 2013
Units Amount
The accompanying notes are an integral part of these combined financial statements. 9
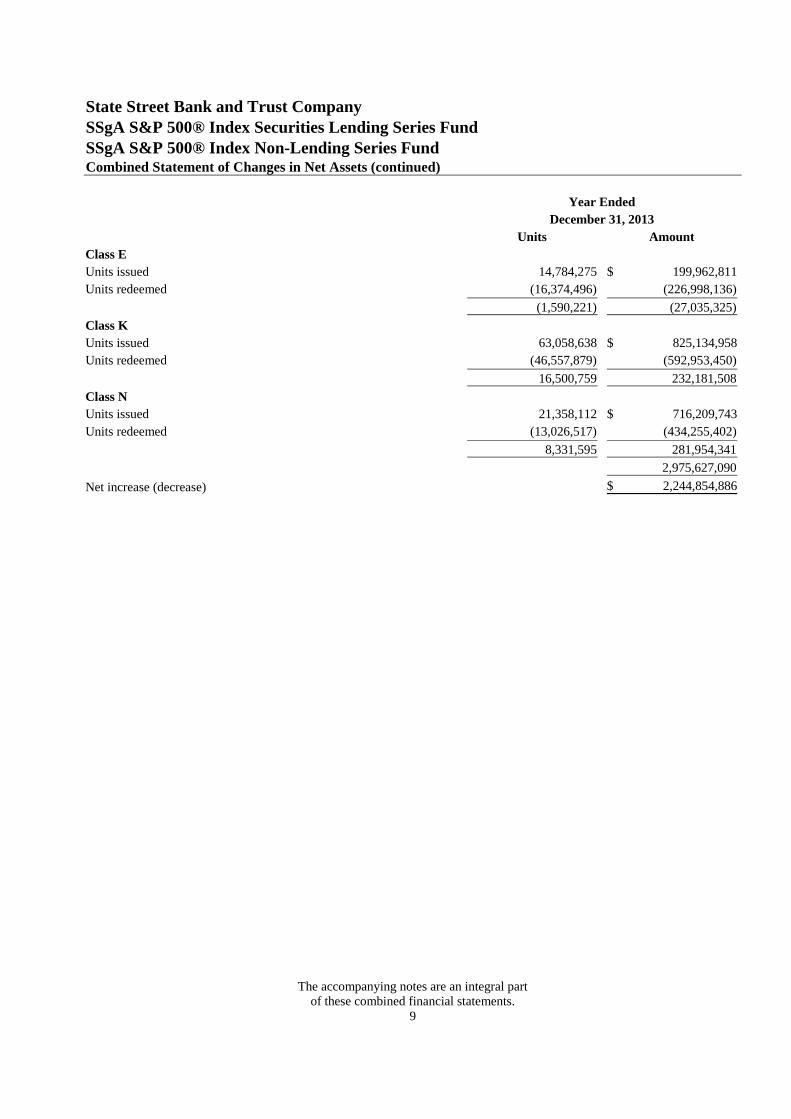
Class E Units issued 14,784,275 $ 199,962,811Units redeemed (16,374,496) (226,998,136)
(1,590,221) (27,035,325)
Class K Units issued 63,058,638 $ 825,134,958Units redeemed (46,557,879) (592,953,450)
16,500,759 232,181,508
Class N Units issued 21,358,112 $ 716,209,743Units redeemed (13,026,517) (434,255,402)
8,331,595 281,954,341
2,975,627,090
Net increase (decrease) $ 2,244,854,886

State Street Bank and Trust Company
SSgA S&P 500® Index Securities Lending Series Fund - Class I
Financial Highlights Year Ended December 31, 2013 (For a Unit of Participation Outstanding Throughout the Year)
The accompanying notes are an integral part of these combined financial statements. 10
Selected Per Unit Data
Net asset value, beginning of year $ 309.36
Net investment income (loss)1 7.59
Net realized and unrealized gain (loss) 92.64
Total from investment operations 100.23
Net asset value, end of year $ 409.59
Total return (%)2 32.40Ratios to Average Net Assets Ratio of expenses (%)3, 4 0.00Ratio of net investment income (loss) (%) 2.11 1 Net investment income (loss) per unit has been calculated based upon an average of daily units outstanding. 2 Calculation is based on the value of a single unit of participation outstanding throughout the year. It represents the
percentage change in the net asset value per unit between the beginning and end of the year. The calculation includes only those expenses charged directly to the Class. The result may be reduced by any administrative or other fees which are incurred in the management or maintenance of individual participant accounts.
3 Please refer to the Additional Expense Information in the accompanying notes for further disclosures regarding expenses. 4 Zero amounts represent those which are less than $0.005 or 0.005% or ($0.005) or (0.005%) if negative.

State Street Bank and Trust Company
SSgA S&P 500® Index Securities Lending Series Fund - Class II
Financial Highlights Year Ended December 31, 2013 (For a Unit of Participation Outstanding Throughout the Year)
The accompanying notes are an integral part of these combined financial statements. 11
Selected Per Unit Data
Net asset value, beginning of year $ 28.61
Net investment income (loss)1 0.68
Net realized and unrealized gain (loss) 8.57
Total from investment operations 9.25
Net asset value, end of year $ 37.86
Total return (%)2 32.34Ratios to Average Net Assets Ratio of expenses (%)3 0.05Ratio of net investment income (loss) (%) 2.06 1 Net investment income (loss) per unit has been calculated based upon an average of daily units outstanding. 2 Calculation is based on the value of a single unit of participation outstanding throughout the year. It represents the
percentage change in the net asset value per unit between the beginning and end of the year. The calculation includes only those expenses charged directly to the Class. The result may be reduced by any administrative or other fees which are incurred in the management or maintenance of individual participant accounts.
3 Please refer to the Additional Expense Information in the accompanying notes for further disclosures regarding expenses.

State Street Bank and Trust Company
SSgA S&P 500® Index Securities Lending Series Fund - Class III
Financial Highlights Year Ended December 31, 2013 (For a Unit of Participation Outstanding Throughout the Year)
The accompanying notes are an integral part of these combined financial statements. 12
Selected Per Unit Data
Net asset value, beginning of year $ 29.16
Net investment income (loss)1 0.66
Net realized and unrealized gain (loss) 8.73
Total from investment operations 9.39
Net asset value, end of year $ 38.55
Total return (%)2 32.20Ratios to Average Net Assets Ratio of expenses (%)3 0.15Ratio of net investment income (loss) (%) 1.95 1 Net investment income (loss) per unit has been calculated based upon an average of daily units outstanding. 2 Calculation is based on the value of a single unit of participation outstanding throughout the year. It represents the
percentage change in the net asset value per unit between the beginning and end of the year. The calculation includes only those expenses charged directly to the Class. The result may be reduced by any administrative or other fees which are incurred in the management or maintenance of individual participant accounts.
3 Please refer to the Additional Expense Information in the accompanying notes for further disclosures regarding expenses.

State Street Bank and Trust Company
SSgA S&P 500® Index Securities Lending Series Fund - Class IV
Financial Highlights Year Ended December 31, 2013 (For a Unit of Participation Outstanding Throughout the Year)
The accompanying notes are an integral part of these combined financial statements. 13
Selected Per Unit Data
Net asset value, beginning of year $ 29.17
Net investment income (loss)1 0.67
Net realized and unrealized gain (loss) 8.74
Total from investment operations 9.41
Net asset value, end of year $ 38.58
Total return (%)2 32.24Ratios to Average Net Assets Ratio of expenses (%)3 0.12Ratio of net investment income (loss) (%) 1.98 1 Net investment income (loss) per unit has been calculated based upon an average of daily units outstanding. 2 Calculation is based on the value of a single unit of participation outstanding throughout the year. It represents the
percentage change in the net asset value per unit between the beginning and end of the year. The calculation includes only those expenses charged directly to the Class. The result may be reduced by any administrative or other fees which are incurred in the management or maintenance of individual participant accounts.
3 Please refer to the Additional Expense Information in the accompanying notes for further disclosures regarding expenses.

State Street Bank and Trust Company
SSgA S&P 500® Index Securities Lending Series Fund - Class V
Financial Highlights Year Ended December 31, 2013 (For a Unit of Participation Outstanding Throughout the Year)
The accompanying notes are an integral part of these combined financial statements. 14
Selected Per Unit Data
Net asset value, beginning of year $ 14.73
Net investment income (loss)1 0.27
Net realized and unrealized gain (loss) 4.39
Total from investment operations 4.66
Net asset value, end of year $ 19.39
Total return (%)2 31.70Ratios to Average Net Assets Ratio of expenses (%)3 0.53Ratio of net investment income (loss) (%) 1.58 1 Net investment income (loss) per unit has been calculated based upon an average of daily units outstanding. 2 Calculation is based on the value of a single unit of participation outstanding throughout the year. It represents the
percentage change in the net asset value per unit between the beginning and end of the year. The calculation includes only those expenses charged directly to the Class. The result may be reduced by any administrative or other fees which are incurred in the management or maintenance of individual participant accounts.
3 Please refer to the Additional Expense Information in the accompanying notes for further disclosures regarding expenses.

State Street Bank and Trust Company
SSgA S&P 500® Index Securities Lending Series Fund - Class VI
Financial Highlights Year Ended December 31, 2013 (For a Unit of Participation Outstanding Throughout the Year)
The accompanying notes are an integral part of these combined financial statements. 15
Selected Per Unit Data
Net asset value, beginning of year $ 10.57
Net investment income (loss)1 0.24
Net realized and unrealized gain (loss) 3.17
Total from investment operations 3.41
Net asset value, end of year $ 13.98
Total return (%)2 32.22Ratios to Average Net Assets Ratio of expenses (%)3 0.12Ratio of net investment income (loss) (%) 1.98 1 Net investment income (loss) per unit has been calculated based upon an average of daily units outstanding. 2 Calculation is based on the value of a single unit of participation outstanding throughout the year. It represents the
percentage change in the net asset value per unit between the beginning and end of the year. The calculation includes only those expenses charged directly to the Class. The result may be reduced by any administrative or other fees which are incurred in the management or maintenance of individual participant accounts.
3 Please refer to the Additional Expense Information in the accompanying notes for further disclosures regarding expenses.

State Street Bank and Trust Company
SSgA S&P 500® Index Securities Lending Series Fund - Class VII
Financial Highlights Year Ended December 31, 2013 (For a Unit of Participation Outstanding Throughout the Year)
The accompanying notes are an integral part of these combined financial statements. 16
Selected Per Unit Data
Net asset value, beginning of year $ 10.57
Net investment income (loss)1 0.23
Net realized and unrealized gain (loss) 3.16
Total from investment operations 3.39
Net asset value, end of year $ 13.96
Total return (%)2 32.11Ratios to Average Net Assets Ratio of expenses (%)3 0.21Ratio of net investment income (loss) (%) 1.89 1 Net investment income (loss) per unit has been calculated based upon an average of daily units outstanding. 2 Calculation is based on the value of a single unit of participation outstanding throughout the year. It represents the
percentage change in the net asset value per unit between the beginning and end of the year. The calculation includes only those expenses charged directly to the Class. The result may be reduced by any administrative or other fees which are incurred in the management or maintenance of individual participant accounts.
3 Please refer to the Additional Expense Information in the accompanying notes for further disclosures regarding expenses.

State Street Bank and Trust Company
SSgA S&P 500® Index Securities Lending Series Fund - Class VIII
Financial Highlights Year Ended December 31, 2013 (For a Unit of Participation Outstanding Throughout the Year)
The accompanying notes are an integral part of these combined financial statements. 17
Selected Per Unit Data
Net asset value, beginning of year $ 10.96
Net investment income (loss)1 0.22
Net realized and unrealized gain (loss) 3.28
Total from investment operations 3.50
Net asset value, end of year $ 14.46
Total return (%)2 31.94Ratios to Average Net Assets Ratio of expenses (%)3 0.35Ratio of net investment income (loss) (%) 1.76 1 Net investment income (loss) per unit has been calculated based upon an average of daily units outstanding. 2 Calculation is based on the value of a single unit of participation outstanding throughout the year. It represents the
percentage change in the net asset value per unit between the beginning and end of the year. The calculation includes only those expenses charged directly to the Class. The result may be reduced by any administrative or other fees which are incurred in the management or maintenance of individual participant accounts.
3 Please refer to the Additional Expense Information in the accompanying notes for further disclosures regarding expenses.

State Street Bank and Trust Company
SSgA S&P 500® Index Securities Lending Series Fund - Class IX
Financial Highlights Year Ended December 31, 2013 (For a Unit of Participation Outstanding Throughout the Year)
The accompanying notes are an integral part of these combined financial statements. 18
Selected Per Unit Data
Net asset value, beginning of year $ 10.59
Net investment income (loss)1 0.17
Net realized and unrealized gain (loss) 3.17
Total from investment operations 3.34
Net asset value, end of year $ 13.93
Total return (%)2 31.48Ratios to Average Net Assets Ratio of expenses (%)3 0.70Ratio of net investment income (loss) (%) 1.41 1 Net investment income (loss) per unit has been calculated based upon an average of daily units outstanding. 2 Calculation is based on the value of a single unit of participation outstanding throughout the year. It represents the
percentage change in the net asset value per unit between the beginning and end of the year. The calculation includes only those expenses charged directly to the Class. The result may be reduced by any administrative or other fees which are incurred in the management or maintenance of individual participant accounts.
3 Please refer to the Additional Expense Information in the accompanying notes for further disclosures regarding expenses.

State Street Bank and Trust Company
SSgA S&P 500® Index Securities Lending Series Fund - Class XII
Financial Highlights Year Ended December 31, 2013 (For a Unit of Participation Outstanding Throughout the Year)
The accompanying notes are an integral part of these combined financial statements. 19
Selected Per Unit Data
Net asset value, beginning of year $ 28.62
Net investment income (loss)1 0.69
Net realized and unrealized gain (loss) 8.58
Total from investment operations 9.27
Net asset value, end of year $ 37.89
Total return (%)2 32.37Ratios to Average Net Assets Ratio of expenses (%)3 0.02Ratio of net investment income (loss) (%) 2.09 1 Net investment income (loss) per unit has been calculated based upon an average of daily units outstanding. 2 Calculation is based on the value of a single unit of participation outstanding throughout the year. It represents the
percentage change in the net asset value per unit between the beginning and end of the year. The calculation includes only those expenses charged directly to the Class. The result may be reduced by any administrative or other fees which are incurred in the management or maintenance of individual participant accounts.
3 Please refer to the Additional Expense Information in the accompanying notes for further disclosures regarding expenses.

State Street Bank and Trust Company
SSgA S&P 500® Index Securities Lending Series Fund - Class F
Financial Highlights Year Ended December 31, 2013 (For a Unit of Participation Outstanding Throughout the Year)
The accompanying notes are an integral part of these combined financial statements. 20
Selected Per Unit Data
Net asset value, beginning of year $ 299.85
Net investment income (loss)1 6.47
Net realized and unrealized gain (loss) 89.70
Total from investment operations 96.17
Net asset value, end of year $ 396.02
Total return (%)2 32.07Ratios to Average Net Assets Ratio of expenses (%)3 0.25Ratio of net investment income (loss) (%) 1.85 1 Net investment income (loss) per unit has been calculated based upon an average of daily units outstanding. 2 Calculation is based on the value of a single unit of participation outstanding throughout the year. It represents the
percentage change in the net asset value per unit between the beginning and end of the year. The calculation includes only those expenses charged directly to the Class. The result may be reduced by any administrative or other fees which are incurred in the management or maintenance of individual participant accounts.
3 Please refer to the Additional Expense Information in the accompanying notes for further disclosures regarding expenses.

State Street Bank and Trust Company
SSgA S&P 500® Index Securities Lending Series Fund - Class GM-A
Financial Highlights Year Ended December 31, 2013 (For a Unit of Participation Outstanding Throughout the Year)
The accompanying notes are an integral part of these combined financial statements. 21
Selected Per Unit Data
Net asset value, beginning of year $ 43.81
Net investment income (loss)1 1.07
Net realized and unrealized gain (loss) 13.13
Total from investment operations 14.20
Net asset value, end of year $ 58.01
Total return (%)2 32.40Ratios to Average Net Assets Ratio of expenses (%)3, 4 0.00Ratio of net investment income (loss) (%) 2.10 1 Net investment income (loss) per unit has been calculated based upon an average of daily units outstanding. 2 Calculation is based on the value of a single unit of participation outstanding throughout the year. It represents the
percentage change in the net asset value per unit between the beginning and end of the year. The calculation includes only those expenses charged directly to the Class. The result may be reduced by any administrative or other fees which are incurred in the management or maintenance of individual participant accounts.
3 Please refer to the Additional Expense Information in the accompanying notes for further disclosures regarding expenses. 4 Zero amounts represent those which are less than $0.005 or 0.005% or ($0.005) or (0.005%) if negative.

State Street Bank and Trust Company
SSgA S&P 500® Index Securities Lending Series Fund - Class GM-M
Financial Highlights Year Ended December 31, 2013 (For a Unit of Participation Outstanding Throughout the Year)
The accompanying notes are an integral part of these combined financial statements. 22
Selected Per Unit Data
Net asset value, beginning of year $ 43.81
Net investment income (loss)1 1.07
Net realized and unrealized gain (loss) 13.12
Total from investment operations 14.19
Net asset value, end of year $ 58.00
Total return (%)2 32.40Ratios to Average Net Assets Ratio of expenses (%)3, 4 0.00Ratio of net investment income (loss) (%) 2.10 1 Net investment income (loss) per unit has been calculated based upon an average of daily units outstanding. 2 Calculation is based on the value of a single unit of participation outstanding throughout the year. It represents the
percentage change in the net asset value per unit between the beginning and end of the year. The calculation includes only those expenses charged directly to the Class. The result may be reduced by any administrative or other fees which are incurred in the management or maintenance of individual participant accounts.
3 Please refer to the Additional Expense Information in the accompanying notes for further disclosures regarding expenses. 4 Zero amounts represent those which are less than $0.005 or 0.005% or ($0.005) or (0.005%) if negative.

State Street Bank and Trust Company
SSgA S&P 500® Index Securities Lending Series Fund - Class H
Financial Highlights Year Ended December 31, 2013 (For a Unit of Participation Outstanding Throughout the Year)
The accompanying notes are an integral part of these combined financial statements. 23
Selected Per Unit Data
Net asset value, beginning of year $ 14.72
Net investment income (loss)1 0.26
Net realized and unrealized gain (loss) 4.40
Total from investment operations 4.66
Net asset value, end of year $ 19.38
Total return (%)2 31.67Ratios to Average Net Assets Ratio of expenses (%)3 0.56Ratio of net investment income (loss) (%) 1.56 1 Net investment income (loss) per unit has been calculated based upon an average of daily units outstanding. 2 Calculation is based on the value of a single unit of participation outstanding throughout the year. It represents the
percentage change in the net asset value per unit between the beginning and end of the year. The calculation includes only those expenses charged directly to the Class. The result may be reduced by any administrative or other fees which are incurred in the management or maintenance of individual participant accounts.
3 Please refer to the Additional Expense Information in the accompanying notes for further disclosures regarding expenses.

State Street Bank and Trust Company
SSgA S&P 500® Index Securities Lending Series Fund - Class L
Financial Highlights Year Ended December 31, 2013 (For a Unit of Participation Outstanding Throughout the Year)
The accompanying notes are an integral part of these combined financial statements. 24
Selected Per Unit Data
Net asset value, beginning of year $ 42.87
Net investment income (loss)1 0.95
Net realized and unrealized gain (loss) 12.82
Total from investment operations 13.77
Net asset value, end of year $ 56.64
Total return (%)2 32.12Ratios to Average Net Assets Ratio of expenses (%)3 0.20Ratio of net investment income (loss) (%) 1.90 1 Net investment income (loss) per unit has been calculated based upon an average of daily units outstanding. 2 Calculation is based on the value of a single unit of participation outstanding throughout the year. It represents the
percentage change in the net asset value per unit between the beginning and end of the year. The calculation includes only those expenses charged directly to the Class. The result may be reduced by any administrative or other fees which are incurred in the management or maintenance of individual participant accounts.
3 Please refer to the Additional Expense Information in the accompanying notes for further disclosures regarding expenses.

State Street Bank and Trust Company
SSgA S&P 500® Index Non-Lending Series Fund - Class A
Financial Highlights Year Ended December 31, 2013 (For a Unit of Participation Outstanding Throughout the Year)
The accompanying notes are an integral part of these combined financial statements. 25
Selected Per Unit Data
Net asset value, beginning of year $ 25.10
Net investment income (loss)1 0.61
Net realized and unrealized gain (loss) 7.52
Total from investment operations 8.13
Net asset value, end of year $ 33.23
Total return (%)2 32.40Ratios to Average Net Assets Ratio of expenses (%)3, 4 0.00Ratio of net investment income (loss) (%) 2.10 1 Net investment income (loss) per unit has been calculated based upon an average of daily units outstanding. 2 Calculation is based on the value of a single unit of participation outstanding throughout the year. It represents the
percentage change in the net asset value per unit between the beginning and end of the year. The calculation includes only those expenses charged directly to the Class. The result may be reduced by any administrative or other fees which are incurred in the management or maintenance of individual participant accounts.
3 Please refer to the Additional Expense Information in the accompanying notes for further disclosures regarding expenses. 4 Zero amounts represent those which are less than $0.005 or 0.005% or ($0.005) or (0.005%) if negative.
State Street Bank and Trust Company
SSgA S&P 500® Index Non-Lending Series Fund - Class C
Financial Highlights Year Ended December 31, 2013 (For a Unit of Participation Outstanding Throughout the Year)
The accompanying notes are an integral part of these combined financial statements. 26
Selected Per Unit Data
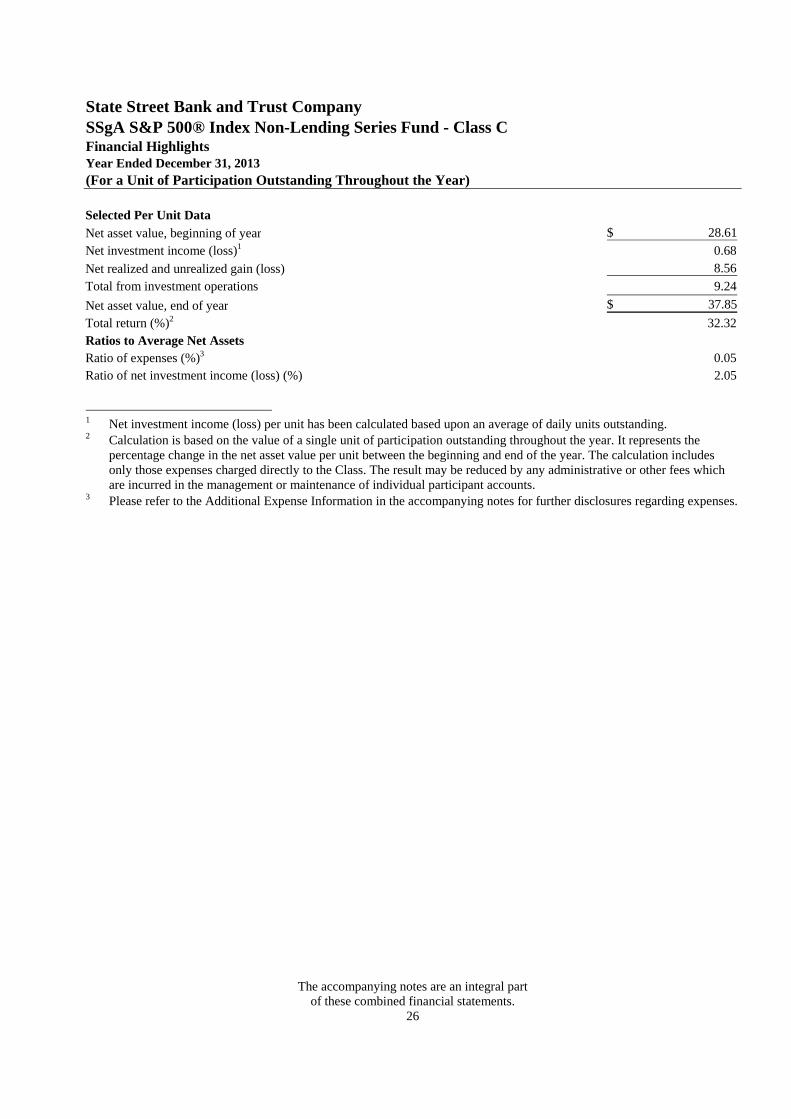
Net asset value, beginning of year $ 28.61
Net investment income (loss)1 0.68
Net realized and unrealized gain (loss) 8.56
Total from investment operations 9.24
Net asset value, end of year $ 37.85
Total return (%)2 32.32Ratios to Average Net Assets Ratio of expenses (%)3 0.05Ratio of net investment income (loss) (%) 2.05 1 Net investment income (loss) per unit has been calculated based upon an average of daily units outstanding. 2 Calculation is based on the value of a single unit of participation outstanding throughout the year. It represents the
percentage change in the net asset value per unit between the beginning and end of the year. The calculation includes only those expenses charged directly to the Class. The result may be reduced by any administrative or other fees which are incurred in the management or maintenance of individual participant accounts.
3 Please refer to the Additional Expense Information in the accompanying notes for further disclosures regarding expenses.

State Street Bank and Trust Company
SSgA S&P 500® Index Non-Lending Series Fund - Class D
Financial Highlights Year Ended December 31, 2013 (For a Unit of Participation Outstanding Throughout the Year)
The accompanying notes are an integral part of these combined financial statements. 27
Selected Per Unit Data
Net asset value, beginning of year $ 12.65
Net investment income (loss)1 0.27
Net realized and unrealized gain (loss) 3.78
Total from investment operations 4.05
Net asset value, end of year $ 16.70
Total return (%)2 32.03Ratios to Average Net Assets Ratio of expenses (%)3 0.27Ratio of net investment income (loss) (%) 1.83 1 Net investment income (loss) per unit has been calculated based upon an average of daily units outstanding. 2 Calculation is based on the value of a single unit of participation outstanding throughout the year. It represents the
percentage change in the net asset value per unit between the beginning and end of the year. The calculation includes only those expenses charged directly to the Class. The result may be reduced by any administrative or other fees which are incurred in the management or maintenance of individual participant accounts.
3 Please refer to the Additional Expense Information in the accompanying notes for further disclosures regarding expenses.

State Street Bank and Trust Company
SSgA S&P 500® Index Non-Lending Series Fund - Class E
Financial Highlights Year Ended December 31, 2013 (For a Unit of Participation Outstanding Throughout the Year)
The accompanying notes are an integral part of these combined financial statements. 28
Selected Per Unit Data
Net asset value, beginning of year $ 11.98
Net investment income (loss)1 0.28
Net realized and unrealized gain (loss) 3.58
Total from investment operations 3.86
Net asset value, end of year $ 15.84
Total return (%)2 32.23Ratios to Average Net Assets Ratio of expenses (%)3 0.12Ratio of net investment income (loss) (%) 1.98 1 Net investment income (loss) per unit has been calculated based upon an average of daily units outstanding. 2 Calculation is based on the value of a single unit of participation outstanding throughout the year. It represents the
percentage change in the net asset value per unit between the beginning and end of the year. The calculation includes only those expenses charged directly to the Class. The result may be reduced by any administrative or other fees which are incurred in the management or maintenance of individual participant accounts.
3 Please refer to the Additional Expense Information in the accompanying notes for further disclosures regarding expenses.
State Street Bank and Trust Company
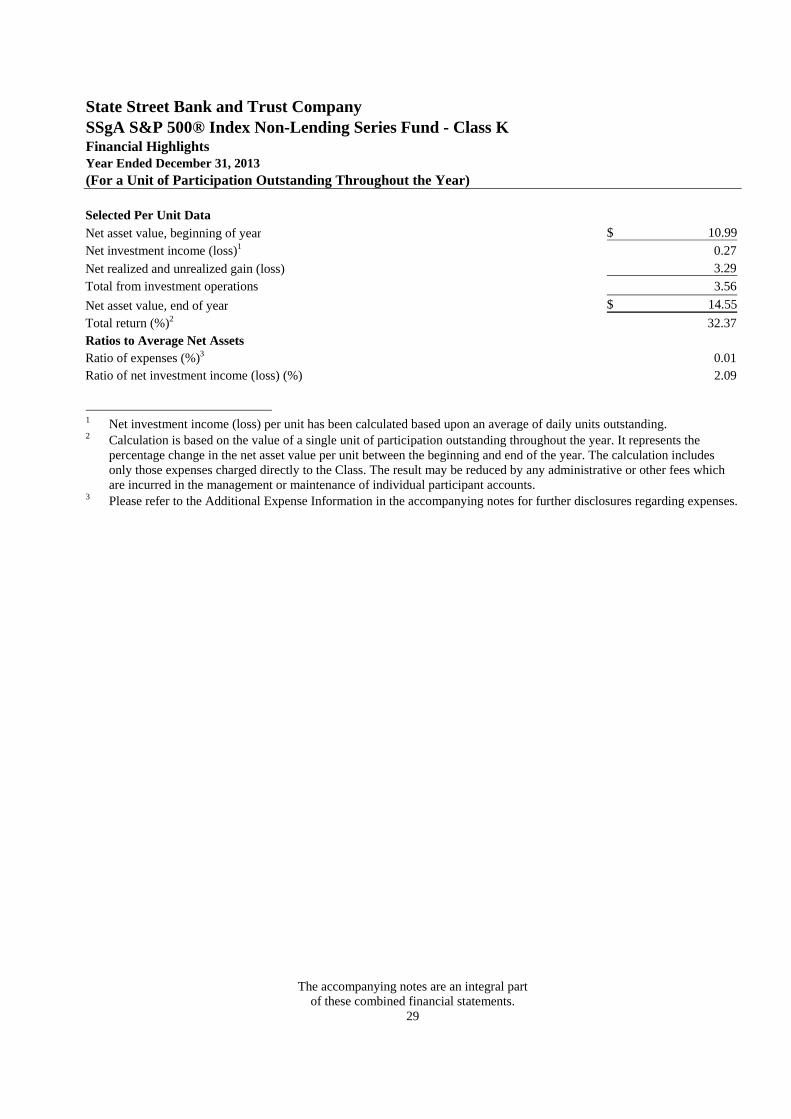
SSgA S&P 500® Index Non-Lending Series Fund - Class K
Financial Highlights Year Ended December 31, 2013 (For a Unit of Participation Outstanding Throughout the Year)
The accompanying notes are an integral part of these combined financial statements. 29
Selected Per Unit Data
Net asset value, beginning of year $ 10.99
Net investment income (loss)1 0.27
Net realized and unrealized gain (loss) 3.29
Total from investment operations 3.56
Net asset value, end of year $ 14.55
Total return (%)2 32.37Ratios to Average Net Assets Ratio of expenses (%)3 0.01Ratio of net investment income (loss) (%) 2.09 1 Net investment income (loss) per unit has been calculated based upon an average of daily units outstanding. 2 Calculation is based on the value of a single unit of participation outstanding throughout the year. It represents the
percentage change in the net asset value per unit between the beginning and end of the year. The calculation includes only those expenses charged directly to the Class. The result may be reduced by any administrative or other fees which are incurred in the management or maintenance of individual participant accounts.
3 Please refer to the Additional Expense Information in the accompanying notes for further disclosures regarding expenses.

State Street Bank and Trust Company
SSgA S&P 500® Index Non-Lending Series Fund - Class N
Financial Highlights Year Ended December 31, 2013 (For a Unit of Participation Outstanding Throughout the Year)
The accompanying notes are an integral part of these combined financial statements. 30
Selected Per Unit Data
Net asset value, beginning of year $ 28.62
Net investment income (loss)1 0.69
Net realized and unrealized gain (loss) 8.57
Total from investment operations 9.26
Net asset value, end of year $ 37.88
Total return (%)2 32.36Ratios to Average Net Assets Ratio of expenses (%)3 0.02Ratio of net investment income (loss) (%) 2.08 1 Net investment income (loss) per unit has been calculated based upon an average of daily units outstanding. 2 Calculation is based on the value of a single unit of participation outstanding throughout the year. It represents the
percentage change in the net asset value per unit between the beginning and end of the year. The calculation includes only those expenses charged directly to the Class. The result may be reduced by any administrative or other fees which are incurred in the management or maintenance of individual participant accounts.
3 Please refer to the Additional Expense Information in the accompanying notes for further disclosures regarding expenses.

State Street Bank and Trust Company
SSgA S&P 500® Index Securities Lending Series Fund
SSgA S&P 500® Index Non-Lending Series Fund
Combined Schedule of Investments (showing percentage of total value of investments)
December 31, 2013
The accompanying notes are an integral part of these combined financial statements. 31
Common Stock - 98.0% (unless otherwise noted) Shares
Value ($)
Advertising - 0.2% Interpublic Group of Companies Inc. 1,517,171 26,853,927
Omnicom Group Inc. 938,066 69,763,968
96,617,895
Aerospace/Defense - 2.0% Boeing Co. 2,519,951 343,948,112 General Dynamics Corp. 1,224,565 117,007,186 L-3 Communications Holdings Inc. 323,078 34,524,115 Lockheed Martin Corp. 980,709 145,792,200 Northrop Grumman Corp. 812,430 93,112,602 Raytheon Co. 1,161,427 105,341,429 Rockwell Collins Inc. 494,460 36,550,483
United Technologies Corp. 3,077,015 350,164,307
1,226,440,434
Agriculture - 1.7% Altria Group Inc. 7,290,119 279,867,668 Archer-Daniels-Midland Co. 2,398,309 104,086,611 Lorillard Inc. 1,342,724 68,049,252 Philip Morris International Inc. 5,839,997 508,838,939
Reynolds American Inc. 1,153,589 57,667,914
1,018,510,384
Airlines - 0.2% Delta Air Lines Inc. 3,116,647 85,614,293
Southwest Airlines Co. 2,539,568 47,845,461
133,459,754
Apparel - 0.6% Michael Kors Holdings Ltd. 648,561 52,656,668 NIKE Inc. 2,723,646 214,187,521 Ralph Lauren Corp. 217,314 38,371,133
VF Corp. 1,283,968 80,042,565
385,257,887
Auto Manufacturers - 0.8% Ford Motor Co. 14,377,631 221,846,846
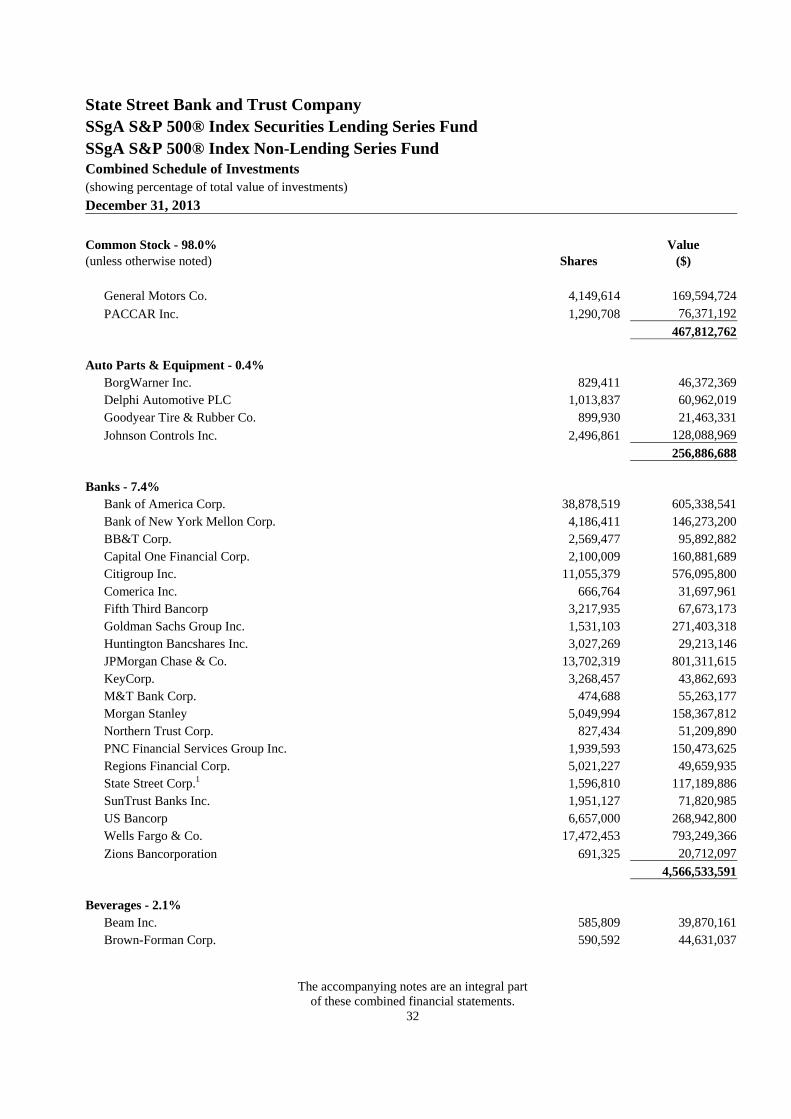
State Street Bank and Trust Company
SSgA S&P 500® Index Securities Lending Series Fund
SSgA S&P 500® Index Non-Lending Series Fund
Combined Schedule of Investments (showing percentage of total value of investments)
December 31, 2013
The accompanying notes are an integral part of these combined financial statements. 32
Common Stock - 98.0% (unless otherwise noted) Shares
Value ($)
General Motors Co. 4,149,614 169,594,724
PACCAR Inc. 1,290,708 76,371,192
467,812,762
Auto Parts & Equipment - 0.4% BorgWarner Inc. 829,411 46,372,369 Delphi Automotive PLC 1,013,837 60,962,019 Goodyear Tire & Rubber Co. 899,930 21,463,331
Johnson Controls Inc. 2,496,861 128,088,969
256,886,688
Banks - 7.4% Bank of America Corp. 38,878,519 605,338,541 Bank of New York Mellon Corp. 4,186,411 146,273,200 BB&T Corp. 2,569,477 95,892,882 Capital One Financial Corp. 2,100,009 160,881,689 Citigroup Inc. 11,055,379 576,095,800 Comerica Inc. 666,764 31,697,961 Fifth Third Bancorp 3,217,935 67,673,173 Goldman Sachs Group Inc. 1,531,103 271,403,318 Huntington Bancshares Inc. 3,027,269 29,213,146 JPMorgan Chase & Co. 13,702,319 801,311,615 KeyCorp. 3,268,457 43,862,693 M&T Bank Corp. 474,688 55,263,177 Morgan Stanley 5,049,994 158,367,812 Northern Trust Corp. 827,434 51,209,890 PNC Financial Services Group Inc. 1,939,593 150,473,625 Regions Financial Corp. 5,021,227 49,659,935 State Street Corp.1 1,596,810 117,189,886 SunTrust Banks Inc. 1,951,127 71,820,985 US Bancorp 6,657,000 268,942,800 Wells Fargo & Co. 17,472,453 793,249,366
Zions Bancorporation 691,325 20,712,097
4,566,533,591
Beverages - 2.1% Beam Inc. 585,809 39,870,161 Brown-Forman Corp. 590,592 44,631,037

State Street Bank and Trust Company
SSgA S&P 500® Index Securities Lending Series Fund
SSgA S&P 500® Index Non-Lending Series Fund
Combined Schedule of Investments (showing percentage of total value of investments)
December 31, 2013
The accompanying notes are an integral part of these combined financial statements. 33
Common Stock - 98.0% (unless otherwise noted) Shares
Value ($)
Coca-Cola Co. 13,842,738 571,843,507 Coca-Cola Enterprises Inc. 880,209 38,843,623 Constellation Brands Inc. 604,298 42,530,493 Dr Pepper Snapple Group Inc. 739,257 36,016,601 Molson Coors Brewing Co. 572,806 32,163,057 Monster Beverage Corp. 492,317 33,364,323
PepsiCo. Inc. 5,590,030 463,637,088
1,302,899,890
Biotechnology - 2.4% Alexion Pharmaceuticals Inc. 714,656 95,092,127 Amgen Inc. 2,748,852 313,808,944 Biogen Idec Inc. 861,506 241,006,304 Celgene Corp. 1,502,050 253,786,368 Gilead Sciences Inc. 5,589,114 420,021,917 Regeneron Pharmaceuticals Inc. 286,123 78,752,495
Vertex Pharmaceuticals Inc. 853,935 63,447,371
1,465,915,526
Building Materials - 0.1% Masco Corp. 1,314,289 29,926,361
Vulcan Materials Co. 473,863 28,156,939
58,083,300
Chemicals - 2.5% Air Products & Chemicals Inc. 773,255 86,434,444 Airgas Inc. 242,650 27,140,403 CF Industries Holdings Inc. 207,839 48,434,801 Dow Chemical Co. 4,420,949 196,290,136 Eastman Chemical Co. 565,704 45,652,313 Ecolab Inc. 988,396 103,060,051 EI du Pont de Nemours & Co. 3,375,692 219,318,709 FMC Corp. 487,794 36,808,935 International Flavors & Fragrances Inc. 303,747 26,116,167 LyondellBasell Industries NV 1,589,668 127,618,547 Monsanto Co. 1,917,353 223,467,492 Mosaic Co. 1,235,062 58,381,381 PPG Industries Inc. 517,643 98,176,171

State Street Bank and Trust Company
SSgA S&P 500® Index Securities Lending Series Fund
SSgA S&P 500® Index Non-Lending Series Fund
Combined Schedule of Investments (showing percentage of total value of investments)
December 31, 2013
The accompanying notes are an integral part of these combined financial statements. 34
Common Stock - 98.0% (unless otherwise noted) Shares
Value ($)
Praxair Inc. 1,073,008 139,523,230 Sherwin-Williams Co. 311,646 57,187,041
Sigma-Aldrich Corp. 436,238 41,010,734
1,534,620,555
Coal - 0.1% Consol Energy Inc. 838,892 31,911,452
Peabody Energy Corp. 984,012 19,217,754
51,129,206
Commercial Services - 2.1% ADT Corp. 725,544 29,362,766 Alliance Data Systems Corp. 178,924 47,044,487 Automatic Data Processing Inc. 1,754,771 141,803,045 Cintas Corp. 367,091 21,874,953 Equifax Inc. 443,583 30,647,149 H&R Block Inc. 996,043 28,925,089 Iron Mountain Inc. 623,860 18,934,151 Mastercard Inc. 377,360 315,269,186 McGraw Hill Financial Inc. 991,076 77,502,143 Moody's Corp. 684,132 53,683,838 Quanta Services Inc. 784,053 24,744,713 Robert Half International Inc. 505,206 21,213,600 Total System Services Inc. 617,020 20,534,426 Visa Inc. 1,856,180 413,334,162
Western Union Co. 2,011,222 34,693,580
1,279,567,288
Computers - 5.7% Accenture PLC 2,317,013 190,504,809 Apple Inc. 3,279,593 1,840,212,428 Cognizant Technology Solutions Corp. 1,105,435 111,626,826 Computer Sciences Corp. 536,627 29,986,717 EMC Corp. 7,499,398 188,609,860 Hewlett-Packard Co. 7,005,122 196,003,314 International Business Machines Corp. 3,720,445 697,843,869 NetApp Inc. 1,234,476 50,786,343 SanDisk Corp. 817,370 57,657,280

State Street Bank and Trust Company
SSgA S&P 500® Index Securities Lending Series Fund
SSgA S&P 500® Index Non-Lending Series Fund
Combined Schedule of Investments (showing percentage of total value of investments)
December 31, 2013
The accompanying notes are an integral part of these combined financial statements. 35
Common Stock - 98.0% (unless otherwise noted) Shares
Value ($)
Seagate Technology PLC 1,178,164 66,165,690 Teradata Corp. 589,673 26,824,225
Western Digital Corp. 767,320 64,378,148
3,520,599,509
Cosmetics/Personal Care - 1.8% Avon Products Inc. 1,581,099 27,226,525 Colgate-Palmolive Co. 3,203,783 208,918,689 Estée Lauder Companies Inc. 938,560 70,692,339
Procter & Gamble Co. 9,908,029 806,612,641
1,113,450,194
Distribution/Wholesale - 0.3% Fastenal Co. 1,001,800 47,595,518 Fossil Group Inc. 174,682 20,951,359 Genuine Parts Co. 568,894 47,326,292
WW Grainger Inc. 225,197 57,519,818
173,392,987
Diversified Financial Services - 2.0% American Express Co. 3,358,191 304,688,669 Ameriprise Financial Inc. 709,153 81,588,053 BlackRock Inc. 461,415 146,024,005 Charles Schwab Corp. 4,241,749 110,285,474 CME Group Inc. 1,142,001 89,601,398 Discover Financial Services 1,745,960 97,686,462 E*Trade Financial Corp. 1,037,532 20,377,128 Franklin Resources Inc. 1,471,637 84,957,604 IntercontinentalExchange Group Inc. 416,368 93,649,491 Invesco Ltd. 1,611,464 58,657,290 Legg Mason Inc. 386,899 16,822,369 NASDAQ OMX Group Inc. 422,574 16,818,445 SLM Corp. 1,590,245 41,791,639
T Rowe Price Group Inc. 954,191 79,932,580
1,242,880,607
Electric - 2.5% AES Corp. 2,291,825 33,254,381

State Street Bank and Trust Company
SSgA S&P 500® Index Securities Lending Series Fund
SSgA S&P 500® Index Non-Lending Series Fund
Combined Schedule of Investments (showing percentage of total value of investments)
December 31, 2013
The accompanying notes are an integral part of these combined financial statements. 36
Common Stock - 98.0% (unless otherwise noted) Shares
Value ($)
Ameren Corp. 884,379 31,979,145 American Electric Power Co. Inc. 1,776,205 83,019,822 CMS Energy Corp. 974,734 26,093,629 Consolidated Edison Inc. 1,067,552 59,014,275 Dominion Resources Inc. 2,115,058 136,823,102 DTE Energy Co. 649,740 43,136,239 Duke Energy Corp. 2,572,305 177,514,768 Edison International 1,187,610 54,986,343 Entergy Corp. 654,107 41,385,350 Exelon Corp. 3,123,421 85,550,501 FirstEnergy Corp. 1,534,031 50,592,342 Integrys Energy Group Inc. 290,902 15,827,978 NextEra Energy Inc. 1,547,540 132,500,375 Northeast Utilities 1,148,482 48,684,152 NRG Energy Inc. 1,173,663 33,707,601 Pepco Holdings Inc. 907,837 17,366,922 PG&E Corp. 1,645,963 66,299,390 Pinnacle West Capital Corp. 401,165 21,229,652 PPL Corp. 2,297,250 69,124,253 Public Service Enterprise Group Inc. 1,843,838 59,076,570 SCANA Corp. 512,342 24,044,210 Southern Co. 3,211,926 132,042,278 TECO Energy Inc. 744,549 12,836,025 Wisconsin Energy Corp. 825,702 34,134,521
Xcel Energy Inc. 1,813,955 50,681,903
1,540,905,727
Electrical Components & Equipment - 0.4% AMETEK Inc. 892,130 46,988,487
Emerson Electric Co. 2,565,943 180,077,880
227,066,367
Electronics - 0.9% Agilent Technologies Inc. 1,208,440 69,110,684 Allegion PLC 328,744 14,527,183 Amphenol Corp. 576,935 51,451,063 FLIR Systems Inc. 516,361 15,542,466 Garmin Ltd. 446,869 20,654,285

State Street Bank and Trust Company
SSgA S&P 500® Index Securities Lending Series Fund
SSgA S&P 500® Index Non-Lending Series Fund
Combined Schedule of Investments (showing percentage of total value of investments)
December 31, 2013
The accompanying notes are an integral part of these combined financial statements. 37
Common Stock - 98.0% (unless otherwise noted) Shares
Value ($)
Jabil Circuit Inc. 689,747 12,029,188 PerkinElmer Inc. 421,112 17,362,448 TE Connectivity Ltd. 1,495,805 82,433,814 Thermo Fisher Scientific Inc. 1,317,152 146,664,875 Tyco International Ltd. 1,684,584 69,135,327
Waters Corp. 310,280 31,028,000
529,939,333
Energy-Alternate Sources - 0.0%
First Solar Inc. 251,771 13,756,767 Engineering & Construction - 0.1% Fluor Corp. 595,564 47,817,834
Jacobs Engineering Group Inc. 486,551 30,647,847
78,465,681
Entertainment - 0.0%
International Game Technology 910,941 16,542,689 Environmental Control - 0.2% Republic Services Inc. 995,947 33,065,440 Stericycle Inc. 315,023 36,596,222
Waste Management Inc. 1,599,139 71,753,367
141,415,029
Food - 1.7% Campbell Soup Co. 657,185 28,442,967 ConAgra Foods Inc. 1,537,772 51,822,916 General Mills Inc. 2,321,285 115,855,334 Hershey Co. 548,333 53,314,418 Hormel Foods Corp. 490,675 22,163,790 JM Smucker Co. 382,312 39,615,169 Kellogg Co. 937,309 57,241,461 Kraft Foods Group Inc. 2,170,194 117,016,860 Kroger Co. 1,896,983 74,987,738 McCormick & Co. Inc. 481,369 33,175,951 Mondelez International Inc. 6,395,102 225,747,101 Safeway Inc. 894,587 29,136,699

State Street Bank and Trust Company
SSgA S&P 500® Index Securities Lending Series Fund
SSgA S&P 500® Index Non-Lending Series Fund
Combined Schedule of Investments (showing percentage of total value of investments)
December 31, 2013
The accompanying notes are an integral part of these combined financial statements. 38
Common Stock - 98.0% (unless otherwise noted) Shares
Value ($)
Sysco Corp. 2,110,254 76,180,169 Tyson Foods Inc. 975,649 32,645,216
Whole Foods Market Inc. 1,366,310 79,013,707
1,036,359,496
Forest Products & Paper - 0.2% International Paper Co. 1,617,014 79,282,196
MeadWestvaco Corp. 651,234 24,050,072
103,332,268
Gas - 0.3% AGL Resources Inc. 433,007 20,450,921 CenterPoint Energy Inc. 1,562,390 36,216,200 NiSource Inc. 1,141,969 37,547,941
Sempra Energy 833,164 74,784,801
168,999,863
Hand/Machine Tools - 0.1% Snap-on Inc. 216,170 23,674,938
Stanley Black & Decker Inc. 560,209 45,203,264
68,878,202
Healthcare-Products - 3.3% Baxter International Inc. 1,978,183 137,582,628 Becton Dickinson and Co. 707,433 78,164,272 Boston Scientific Corp. 4,866,922 58,500,402 CareFusion Corp. 770,373 30,676,253 Covidien PLC 1,676,255 114,152,966 CR Bard Inc. 283,950 38,032,263 DENTSPLY International Inc. 521,579 25,286,150 Edwards Lifesciences Corp. 398,825 26,226,732 Hospira Inc. 601,829 24,843,501 Intuitive Surgical Inc. 137,508 52,814,073 Johnson & Johnson 10,284,232 941,932,809 Life Technologies Corp. 629,137 47,688,585 Medtronic Inc. 3,638,996 208,841,980 Patterson Cos Inc. 307,409 12,665,251 St Jude Medical Inc. 1,062,085 65,796,166
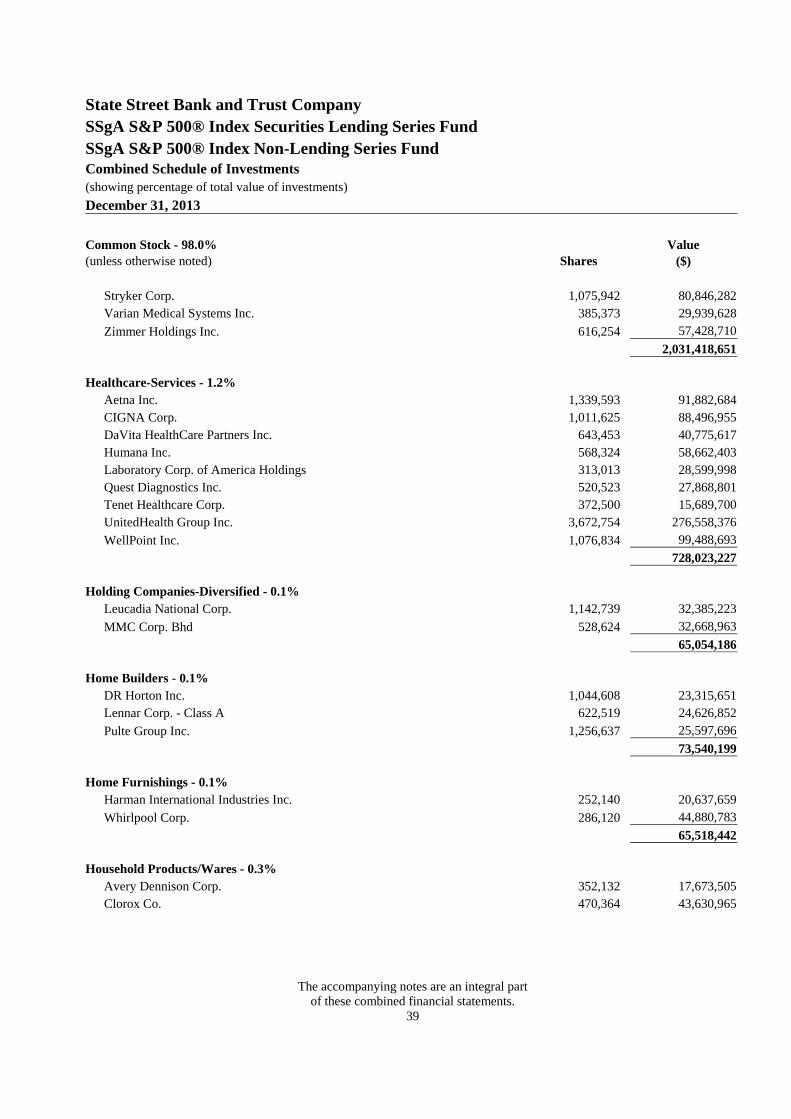
State Street Bank and Trust Company
SSgA S&P 500® Index Securities Lending Series Fund
SSgA S&P 500® Index Non-Lending Series Fund
Combined Schedule of Investments (showing percentage of total value of investments)
December 31, 2013
The accompanying notes are an integral part of these combined financial statements. 39
Common Stock - 98.0% (unless otherwise noted) Shares
Value ($)
Stryker Corp. 1,075,942 80,846,282 Varian Medical Systems Inc. 385,373 29,939,628
Zimmer Holdings Inc. 616,254 57,428,710
2,031,418,651
Healthcare-Services - 1.2% Aetna Inc. 1,339,593 91,882,684 CIGNA Corp. 1,011,625 88,496,955 DaVita HealthCare Partners Inc. 643,453 40,775,617 Humana Inc. 568,324 58,662,403 Laboratory Corp. of America Holdings 313,013 28,599,998 Quest Diagnostics Inc. 520,523 27,868,801 Tenet Healthcare Corp. 372,500 15,689,700 UnitedHealth Group Inc. 3,672,754 276,558,376
WellPoint Inc. 1,076,834 99,488,693
728,023,227
Holding Companies-Diversified - 0.1% Leucadia National Corp. 1,142,739 32,385,223
MMC Corp. Bhd 528,624 32,668,963
65,054,186
Home Builders - 0.1% DR Horton Inc. 1,044,608 23,315,651 Lennar Corp. - Class A 622,519 24,626,852
Pulte Group Inc. 1,256,637 25,597,696
73,540,199
Home Furnishings - 0.1% Harman International Industries Inc. 252,140 20,637,659
Whirlpool Corp. 286,120 44,880,783
65,518,442
Household Products/Wares - 0.3% Avery Dennison Corp. 352,132 17,673,505 Clorox Co. 470,364 43,630,965
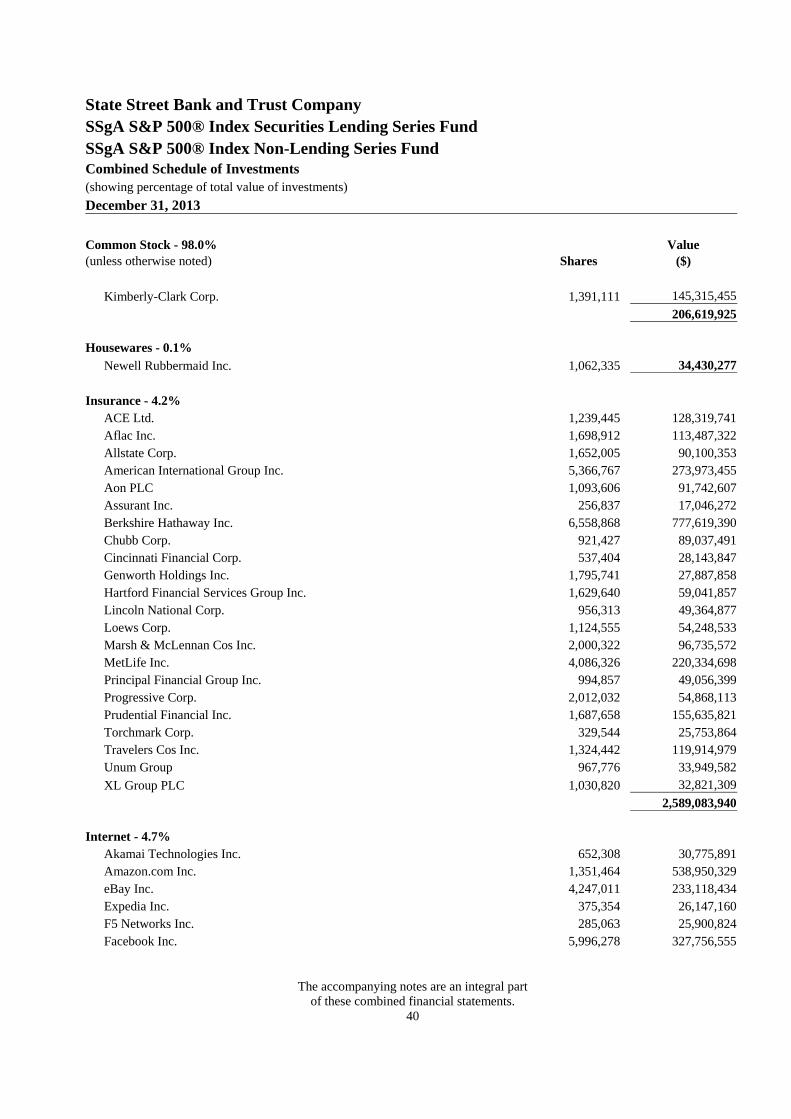
State Street Bank and Trust Company
SSgA S&P 500® Index Securities Lending Series Fund
SSgA S&P 500® Index Non-Lending Series Fund
Combined Schedule of Investments (showing percentage of total value of investments)
December 31, 2013
The accompanying notes are an integral part of these combined financial statements. 40
Common Stock - 98.0% (unless otherwise noted) Shares
Value ($)
Kimberly-Clark Corp. 1,391,111 145,315,455
206,619,925
Housewares - 0.1%
Newell Rubbermaid Inc. 1,062,335 34,430,277 Insurance - 4.2% ACE Ltd. 1,239,445 128,319,741 Aflac Inc. 1,698,912 113,487,322 Allstate Corp. 1,652,005 90,100,353 American International Group Inc. 5,366,767 273,973,455 Aon PLC 1,093,606 91,742,607 Assurant Inc. 256,837 17,046,272 Berkshire Hathaway Inc. 6,558,868 777,619,390 Chubb Corp. 921,427 89,037,491 Cincinnati Financial Corp. 537,404 28,143,847 Genworth Holdings Inc. 1,795,741 27,887,858 Hartford Financial Services Group Inc. 1,629,640 59,041,857 Lincoln National Corp. 956,313 49,364,877 Loews Corp. 1,124,555 54,248,533 Marsh & McLennan Cos Inc. 2,000,322 96,735,572 MetLife Inc. 4,086,326 220,334,698 Principal Financial Group Inc. 994,857 49,056,399 Progressive Corp. 2,012,032 54,868,113 Prudential Financial Inc. 1,687,658 155,635,821 Torchmark Corp. 329,544 25,753,864 Travelers Cos Inc. 1,324,442 119,914,979 Unum Group 967,776 33,949,582
XL Group PLC 1,030,820 32,821,309
2,589,083,940
Internet - 4.7% Akamai Technologies Inc. 652,308 30,775,891 Amazon.com Inc. 1,351,464 538,950,329 eBay Inc. 4,247,011 233,118,434 Expedia Inc. 375,354 26,147,160 F5 Networks Inc. 285,063 25,900,824 Facebook Inc. 5,996,278 327,756,555
State Street Bank and Trust Company
SSgA S&P 500® Index Securities Lending Series Fund
SSgA S&P 500® Index Non-Lending Series Fund
Combined Schedule of Investments (showing percentage of total value of investments)
December 31, 2013
The accompanying notes are an integral part of these combined financial statements. 41
Common Stock - 98.0% (unless otherwise noted) Shares
Value ($)
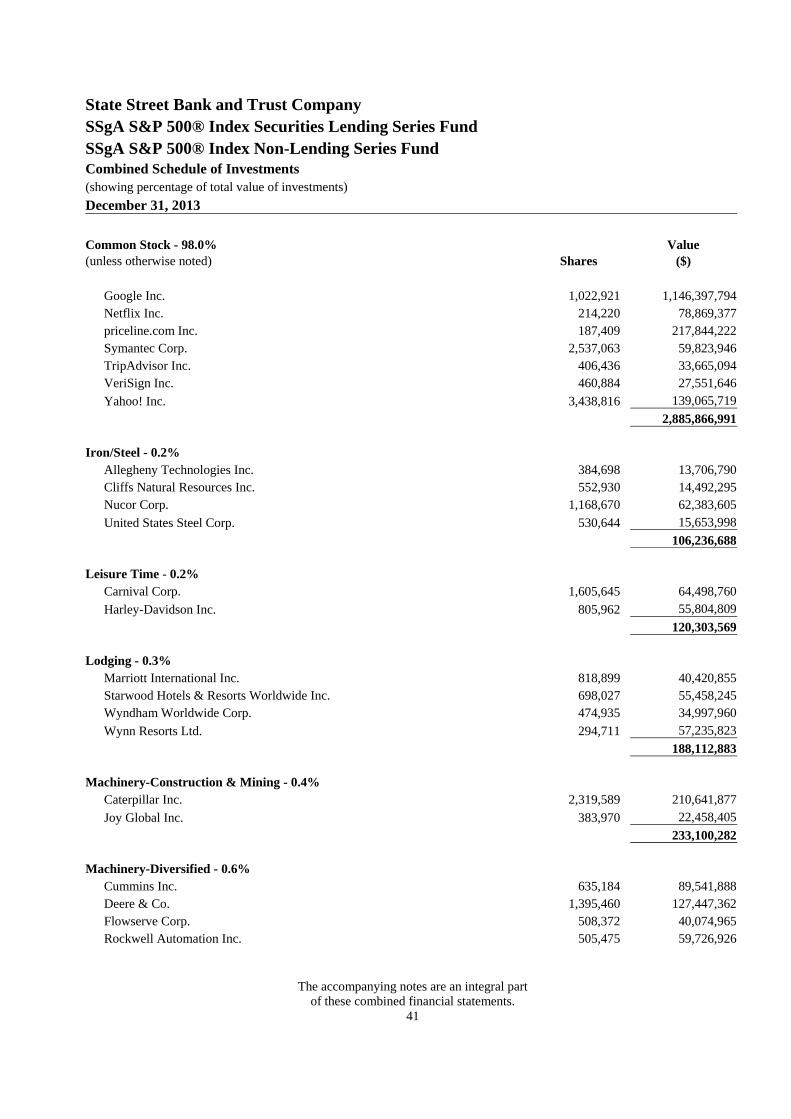
Google Inc. 1,022,921 1,146,397,794 Netflix Inc. 214,220 78,869,377 priceline.com Inc. 187,409 217,844,222 Symantec Corp. 2,537,063 59,823,946 TripAdvisor Inc. 406,436 33,665,094 VeriSign Inc. 460,884 27,551,646
Yahoo! Inc. 3,438,816 139,065,719
2,885,866,991
Iron/Steel - 0.2% Allegheny Technologies Inc. 384,698 13,706,790 Cliffs Natural Resources Inc. 552,930 14,492,295 Nucor Corp. 1,168,670 62,383,605
United States Steel Corp. 530,644 15,653,998
106,236,688
Leisure Time - 0.2% Carnival Corp. 1,605,645 64,498,760
Harley-Davidson Inc. 805,962 55,804,809
120,303,569
Lodging - 0.3% Marriott International Inc. 818,899 40,420,855 Starwood Hotels & Resorts Worldwide Inc. 698,027 55,458,245 Wyndham Worldwide Corp. 474,935 34,997,960
Wynn Resorts Ltd. 294,711 57,235,823
188,112,883
Machinery-Construction & Mining - 0.4% Caterpillar Inc. 2,319,589 210,641,877
Joy Global Inc. 383,970 22,458,405
233,100,282
Machinery-Diversified - 0.6% Cummins Inc. 635,184 89,541,888 Deere & Co. 1,395,460 127,447,362 Flowserve Corp. 508,372 40,074,965 Rockwell Automation Inc. 505,475 59,726,926

State Street Bank and Trust Company
SSgA S&P 500® Index Securities Lending Series Fund
SSgA S&P 500® Index Non-Lending Series Fund
Combined Schedule of Investments (showing percentage of total value of investments)
December 31, 2013
The accompanying notes are an integral part of these combined financial statements. 42
Common Stock - 98.0% (unless otherwise noted) Shares
Value ($)
Roper Industries Inc. 363,847 50,458,302
Xylem Inc. 667,034 23,079,376
390,328,819
Media - 3.6% Cablevision Systems Corp. 801,599 14,372,670 CBS Corp. 2,034,259 129,663,669 Comcast Corp. - Class A 9,498,875 493,609,039 DIRECTV 1,777,751 122,824,817 Discovery Communications Inc. - Class A 818,318 73,992,314 Gannett Co. Inc. 830,694 24,571,929 Graham Holdings Co. 15,922 10,561,381 News Corp. 1,814,563 32,698,425 Nielsen Holdings NV 912,103 41,856,407 Scripps Networks Interactive Inc. 396,953 34,300,709 Time Warner Cable Inc. 1,026,228 139,053,894 Time Warner Inc. 3,299,132 230,015,483 Twenty-First Century Fox Inc. 7,157,404 251,797,473 Viacom Inc. 1,476,812 128,984,760
Walt Disney Co. 5,957,004 455,115,106
2,183,418,076
Metal Fabricate/Hardware - 0.2%
Precision Castparts Corp. 529,506 142,595,966
Mining - 0.4% Alcoa Inc. 3,898,734 41,443,542 Freeport-McMoRan Copper & Gold Inc. 3,784,150 142,813,821 Lepanto Consolidated Mining Co. 497,376 12,250,371
Newmont Mining Corp. 1,828,770 42,116,573
238,624,307
Miscellaneous Manufacturing - 3.9% 3M Co. 2,331,408 326,979,972 Danaher Corp. 2,185,519 168,722,067 Dover Corp. 620,961 59,947,575 Eaton Corp. PLC 1,726,915 131,452,770 General Electric Co. 36,878,050 1,033,691,742
State Street Bank and Trust Company
SSgA S&P 500® Index Securities Lending Series Fund
SSgA S&P 500® Index Non-Lending Series Fund
Combined Schedule of Investments (showing percentage of total value of investments)
December 31, 2013
The accompanying notes are an integral part of these combined financial statements. 43
Common Stock - 98.0% (unless otherwise noted) Shares
Value ($)
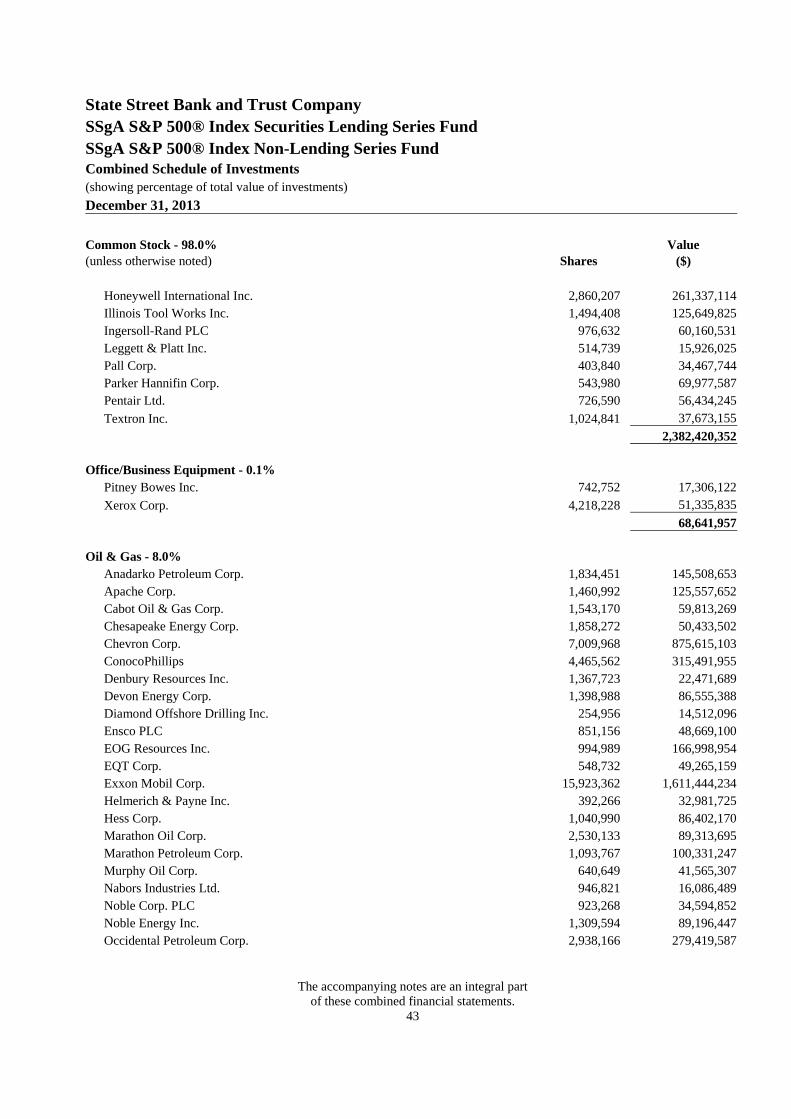
Honeywell International Inc. 2,860,207 261,337,114 Illinois Tool Works Inc. 1,494,408 125,649,825 Ingersoll-Rand PLC 976,632 60,160,531 Leggett & Platt Inc. 514,739 15,926,025 Pall Corp. 403,840 34,467,744 Parker Hannifin Corp. 543,980 69,977,587 Pentair Ltd. 726,590 56,434,245
Textron Inc. 1,024,841 37,673,155
2,382,420,352
Office/Business Equipment - 0.1% Pitney Bowes Inc. 742,752 17,306,122
Xerox Corp. 4,218,228 51,335,835
68,641,957
Oil & Gas - 8.0% Anadarko Petroleum Corp. 1,834,451 145,508,653 Apache Corp. 1,460,992 125,557,652 Cabot Oil & Gas Corp. 1,543,170 59,813,269 Chesapeake Energy Corp. 1,858,272 50,433,502 Chevron Corp. 7,009,968 875,615,103 ConocoPhillips 4,465,562 315,491,955 Denbury Resources Inc. 1,367,723 22,471,689 Devon Energy Corp. 1,398,988 86,555,388 Diamond Offshore Drilling Inc. 254,956 14,512,096 Ensco PLC 851,156 48,669,100 EOG Resources Inc. 994,989 166,998,954 EQT Corp. 548,732 49,265,159 Exxon Mobil Corp. 15,923,362 1,611,444,234 Helmerich & Payne Inc. 392,266 32,981,725 Hess Corp. 1,040,990 86,402,170 Marathon Oil Corp. 2,530,133 89,313,695 Marathon Petroleum Corp. 1,093,767 100,331,247 Murphy Oil Corp. 640,649 41,565,307 Nabors Industries Ltd. 946,821 16,086,489 Noble Corp. PLC 923,268 34,594,852 Noble Energy Inc. 1,309,594 89,196,447 Occidental Petroleum Corp. 2,938,166 279,419,587

State Street Bank and Trust Company
SSgA S&P 500® Index Securities Lending Series Fund
SSgA S&P 500® Index Non-Lending Series Fund
Combined Schedule of Investments (showing percentage of total value of investments)
December 31, 2013
The accompanying notes are an integral part of these combined financial statements. 44
Common Stock - 98.0% (unless otherwise noted) Shares
Value ($)
Phillips 66 2,183,908 168,444,824 Pioneer Natural Resources Co. 508,179 93,540,509 QEP Resources Inc. 648,338 19,871,560 Range Resources Corp. 600,436 50,622,759 Rowan Companies Inc. 452,615 16,004,466 Southwestern Energy Co. 1,289,300 50,708,169 Tesoro Corp. 484,176 28,324,296 Transocean Ltd. 1,234,550 61,011,461 Valero Energy Corp. 1,966,739 99,123,646
WPX Energy Inc. 728,333 14,843,427
4,944,723,390
Oil & Gas Services - 1.5% Baker Hughes Inc. 1,625,110 89,803,579 Cameron International Corp. 859,590 51,171,393 FMC Technologies Inc. 861,289 44,967,899 Halliburton Co. 3,091,808 156,909,256 National Oilwell Varco Inc. 1,560,426 124,100,680
Schlumberger Ltd. 4,800,370 432,561,341
899,514,148
Packaging & Containers - 0.1% Ball Corp. 527,223 27,236,340 Bemis Co. Inc. 387,353 15,865,979 Owens-Illinois Inc. 602,512 21,557,879
Sealed Air Corp. 718,558 24,466,900
89,127,098
Pharmaceuticals - 5.4% Abbott Laboratories 5,635,956 216,026,193 AbbVie Inc. 5,777,334 305,101,009 Actavis PLC 630,866 105,985,488 Allergan Inc. 1,083,121 120,313,081 AmerisourceBergen Corp. 838,507 58,955,427 Bristol-Myers Squibb Co. 6,001,762 318,993,650 Cardinal Health Inc. 1,252,685 83,691,885 Eli Lilly & Co. 3,613,850 184,306,350 Express Scripts Holding Co. 2,937,545 206,333,161
State Street Bank and Trust Company
SSgA S&P 500® Index Securities Lending Series Fund
SSgA S&P 500® Index Non-Lending Series Fund
Combined Schedule of Investments (showing percentage of total value of investments)
December 31, 2013
The accompanying notes are an integral part of these combined financial statements. 45
Common Stock - 98.0% (unless otherwise noted) Shares
Value ($)
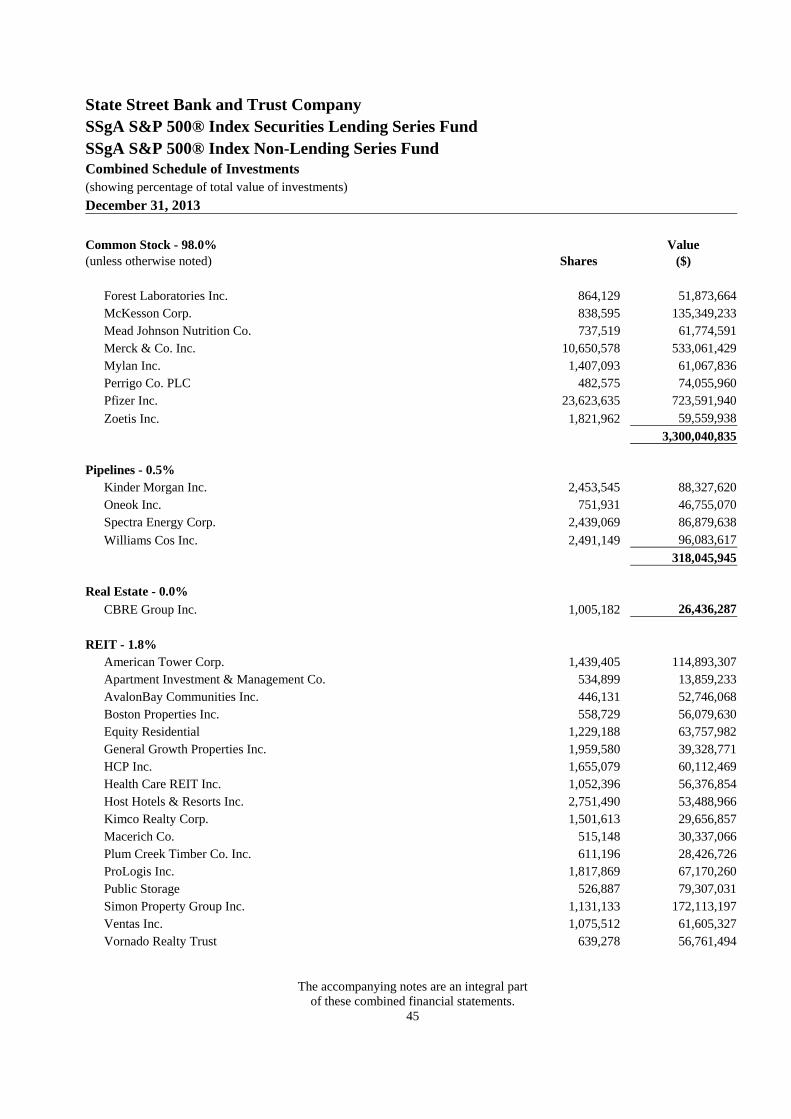
Forest Laboratories Inc. 864,129 51,873,664 McKesson Corp. 838,595 135,349,233 Mead Johnson Nutrition Co. 737,519 61,774,591 Merck & Co. Inc. 10,650,578 533,061,429 Mylan Inc. 1,407,093 61,067,836 Perrigo Co. PLC 482,575 74,055,960 Pfizer Inc. 23,623,635 723,591,940
Zoetis Inc. 1,821,962 59,559,938
3,300,040,835
Pipelines - 0.5% Kinder Morgan Inc. 2,453,545 88,327,620 Oneok Inc. 751,931 46,755,070 Spectra Energy Corp. 2,439,069 86,879,638
Williams Cos Inc. 2,491,149 96,083,617
318,045,945
Real Estate - 0.0%
CBRE Group Inc. 1,005,182 26,436,287
REIT - 1.8% American Tower Corp. 1,439,405 114,893,307 Apartment Investment & Management Co. 534,899 13,859,233 AvalonBay Communities Inc. 446,131 52,746,068 Boston Properties Inc. 558,729 56,079,630 Equity Residential 1,229,188 63,757,982 General Growth Properties Inc. 1,959,580 39,328,771 HCP Inc. 1,655,079 60,112,469 Health Care REIT Inc. 1,052,396 56,376,854 Host Hotels & Resorts Inc. 2,751,490 53,488,966 Kimco Realty Corp. 1,501,613 29,656,857 Macerich Co. 515,148 30,337,066 Plum Creek Timber Co. Inc. 611,196 28,426,726 ProLogis Inc. 1,817,869 67,170,260 Public Storage 526,887 79,307,031 Simon Property Group Inc. 1,131,133 172,113,197 Ventas Inc. 1,075,512 61,605,327 Vornado Realty Trust 639,278 56,761,494

State Street Bank and Trust Company
SSgA S&P 500® Index Securities Lending Series Fund
SSgA S&P 500® Index Non-Lending Series Fund
Combined Schedule of Investments (showing percentage of total value of investments)
December 31, 2013
The accompanying notes are an integral part of these combined financial statements. 46
Common Stock - 98.0% (unless otherwise noted) Shares
Value ($)
Weyerhaeuser Co. 2,137,166 67,470,331
1,103,491,569
Retail - 6.1% AutoNation Inc. 235,900 11,721,871 AutoZone Inc. 123,175 58,870,260 Bed Bath & Beyond Inc. 782,792 62,858,198 Best Buy Co. Inc. 989,609 39,465,607 CarMax Inc. 812,587 38,207,841 Chipotle Mexican Grill Inc. 112,482 59,928,160 Coach Inc. 1,026,401 57,611,888 Costco Wholesale Corp. 1,592,632 189,539,134 CVS Caremark Corp. 4,338,517 310,507,662 Darden Restaurants Inc. 477,955 25,986,413 Dollar General Corp. 1,073,950 64,780,664 Dollar Tree Inc. 750,154 42,323,689 Family Dollar Stores Inc. 352,467 22,899,781 GameStop Corp. 426,143 20,991,804 Gap Inc. 969,499 37,888,021 Home Depot Inc. 5,133,089 422,658,548 Kohl's Corp. 733,748 41,640,199 L Brands Inc. 884,957 54,734,590 Lowe's Companies Inc. 3,812,092 188,889,159 Macy's Inc. 1,335,967 71,340,638 McDonald's Corp. 3,626,949 351,922,861 O'Reilly Automotive Inc. 391,244 50,357,015 PetSmart Inc. 382,158 27,801,995 PVH Corp. 295,237 40,158,137 Ross Stores Inc. 794,749 59,550,543 Staples Inc. 2,422,700 38,496,703 Starbucks Corp. 2,746,919 215,330,980 Target Corp. 2,312,509 146,312,444 Tiffany & Co. 404,430 37,523,015 TJX Cos Inc. 2,590,917 165,119,140 Urban Outfitters Inc. 397,556 14,749,328 Wal-Mart Stores Inc. 5,897,298 464,058,380 Walgreen Co. 3,174,323 182,333,113

State Street Bank and Trust Company
SSgA S&P 500® Index Securities Lending Series Fund
SSgA S&P 500® Index Non-Lending Series Fund
Combined Schedule of Investments (showing percentage of total value of investments)
December 31, 2013
The accompanying notes are an integral part of these combined financial statements. 47
Common Stock - 98.0% (unless otherwise noted) Shares
Value ($)
Yum! Brands Inc. 1,623,238 122,733,025
3,739,290,806
Savings & Loans - 0.1% Hudson City Bancorp Inc. 1,733,496 16,346,867
People's United Financial Inc. 1,158,425 17,515,386
33,862,253
Semiconductors - 2.0% Altera Corp. 1,171,799 38,118,621 Analog Devices Inc. 1,133,813 57,745,096 Applied Materials Inc. 4,389,279 77,646,346 Broadcom Corp. 1,966,891 58,318,318 Intel Corp. 18,119,560 470,383,778 KLA-Tencor Corp. 615,560 39,678,998 Lam Research Corp. 591,975 32,233,039 Linear Technology Corp. 855,395 38,963,242 LSI Corp. 1,986,332 21,889,379 Microchip Technology Inc. 726,754 32,522,242 Micron Technology Inc. 3,839,291 83,542,972 NVIDIA Corp. 2,144,814 34,359,920 Texas Instruments Inc. 3,988,118 175,118,261
Xilinx Inc. 978,511 44,933,225
1,205,453,437
Software - 3.7% Adobe Systems Inc. 1,694,552 101,469,774 Autodesk Inc. 817,972 41,168,531 CA Inc. 1,184,295 39,851,527 Cerner Corp. 1,082,272 60,325,841 Citrix Systems Inc. 687,329 43,473,559 Dun & Bradstreet Corp. 139,056 17,069,124 Electronic Arts Inc. 1,144,092 26,245,470 Fidelity National Information Services Inc. 1,061,602 56,986,795 Fiserv Inc. 940,203 55,518,987 Intuit Inc. 1,033,697 78,891,755 Microsoft Corp. 27,689,961 1,036,435,240 Oracle Corp. 12,791,335 489,396,477

State Street Bank and Trust Company
SSgA S&P 500® Index Securities Lending Series Fund
SSgA S&P 500® Index Non-Lending Series Fund
Combined Schedule of Investments (showing percentage of total value of investments)
December 31, 2013
The accompanying notes are an integral part of these combined financial statements. 48
Common Stock - 98.0% (unless otherwise noted) Shares
Value ($)
Paychex Inc. 1,184,744 53,941,394 Red Hat Inc. 693,995 38,891,480
Salesforce.com Inc. 1,993,081 109,998,140
2,249,664,094
Telecommunications - 4.1% AT&T Inc. 19,201,952 675,140,632 CenturyLink Inc. 2,163,144 68,896,136 Cisco Systems Inc. 19,488,619 437,519,497 Corning Inc. 5,296,439 94,382,543 Crown Castle International Corp. 1,202,251 88,281,291 Frontier Communications Corp. 3,615,823 16,813,577 Harris Corp. 389,604 27,198,255 Juniper Networks Inc. 1,850,460 41,764,882 Motorola Solutions Inc. 839,247 56,649,173 QUALCOMM Inc. 6,158,075 457,237,069 Verizon Communications Inc. 10,431,203 512,589,315
Windstream Holdings Inc. 2,128,917 16,988,758
2,493,461,128
Textiles - 0.1%
Mohawk Industries Inc. 224,131 33,373,106 Toys/Games/Hobbies - 0.1% Hasbro Inc. 423,211 23,280,837
Mattel Inc. 1,233,600 58,694,688
81,975,525
Transportation - 1.7% CH Robinson Worldwide Inc. 543,974 31,735,443 CSX Corp. 3,694,912 106,302,618 Expeditors International of Washington Inc. 756,658 33,482,117 FedEx Corp. 1,084,900 155,976,073 Kansas City Southern 404,066 50,035,493 Norfolk Southern Corp. 1,130,525 104,946,636 Ryder System Inc. 198,696 14,659,791 Union Pacific Corp. 1,680,358 282,300,144

State Street Bank and Trust Company
SSgA S&P 500® Index Securities Lending Series Fund
SSgA S&P 500® Index Non-Lending Series Fund
Combined Schedule of Investments (showing percentage of total value of investments)
December 31, 2013
The accompanying notes are an integral part of these combined financial statements. 49
Common Stock - 98.0% (unless otherwise noted) Shares
Value ($)
United Parcel Service Inc. 2,607,883 274,036,326
1,053,474,641
Total Common Stock (Cost $35,231,065,482)
60,124,992,878
Government Issues - 0.1% Interest
Rate Maturity
Date Principal Value
($) Treasury Bill - 0.1% United States Treasury Bill2, 3 0.00% 02/20/2014 USD 58,445,000 58,444,188
Total Government Issues (Cost $58,444,188)
58,444,188
State Street Bank and Trust Company Collective Investment Funds - 1.9% Units Value
($)
SSgA Short Term Investment Fund4 1,153,361,553 1,153,361,553
Total State Street Bank and Trust Company Collective Investment Funds (Cost $1,153,361,553)
1,153,361,553
TOTAL INVESTMENTS - 100.0% (Cost $36,442,871,223)
61,336,798,619
1 Parent company of State Street Bank and Trust Company. 2 All or a portion of this security was pledged to cover margin requirements for open futures contracts. 3 Denotes a zero coupon bond. 4 Collective investment fund advised by State Street Global Advisors.

State Street Bank and Trust Company
SSgA S&P 500® Index Securities Lending Series Fund
SSgA S&P 500® Index Non-Lending Series Fund
Combined Schedule of Investments (showing percentage of total value of investments)
December 31, 2013
The accompanying notes are an integral part of these combined financial statements. 50
At December 31, 2013, a United States Treasury Bill totaling $58,444,188 was pledged to cover margin requirements for open futures contracts. The following futures contracts were open at December 31, 2013:
Futures Contracts
Number of Contracts
Long/(Short) Notional Cost Maturity
Date
Unrealized Gain/(Loss)
($) S&P 500 E-mini Index Futures 14,098 USD 1,257,953,871 March 2014 39,837,519
USD : United States Dollar

State Street Bank and Trust Company
SSgA S&P 500® Index Securities Lending Series Fund
SSgA S&P 500® Index Non-Lending Series Fund
Notes to Combined Financial Statements December 31, 2013
51
1. Fund Organization and Investment Objective State Street Bank and Trust Company ("State Street Bank") SSgA S&P 500® Index Securities Lending Series Fund and State Street Bank and Trust Company SSgA S&P 500® Index Non-Lending Series Fund (individually, the "Lending Fund" and "Non-Lending Fund," respectively, and collectively the "Fund") were formed by State Street Bank under the State Street Bank and Trust Company Investment Funds for Tax Exempt Retirement Plans Declaration of Trust (the "Trust"). The Fund is operated pursuant to the provisions of the Trust and other governing documents, which are available from the Trustee. State Street Bank is Trustee, Custodian, and Recordkeeper of the Fund and, as Trustee, has exclusive management and control of the Trust. State Street Global Advisors ("SSgA"), a division of State Street Bank, is the Fund's Investment Manager. The investment objective of the Fund is to approximate as closely as practicable, before expenses, the performance of the S&P 500® Index over the long term, while providing participants the ability to purchase and redeem units on an "as of" basis. The participants in the Lending Fund have authorized the Lending Fund to participate in the State Street Global Securities Lending Program maintained by State Street Bank. The investment objective, techniques and results of operations of the Lending Fund are identical to those of the Non-Lending Fund, except that the Lending Fund engages in securities lending activity. Accordingly, the financial statements of the Lending Fund and the Non-Lending Fund have been prepared on a combined basis, with separate disclosure of the participant transactions and financial highlights of the Lending Fund and the Non-Lending Fund. The Lending Fund and the Non-Lending Fund each maintain a divided pro-rata interest in the combined assets and liabilities (including each investment security position but excluding assets and liabilities related to securities lending activity) proportionate to the outstanding combined net assets of the Fund. All interfund transactions have been eliminated in the combined financial statements. Except as stated otherwise, use of the term "financial statements" herein shall refer to the combined financial statements of the Fund. The Trustee has the authority to establish unlimited classes of units of the Lending and Non-Lending Fund (each a "Class") and issue an unlimited number of units of any such Class of the Fund. The following Classes of units of the Lending Fund have been established and have commenced operations: Class I, Class II, Class III, Class IV, Class V, Class VI, Class VII, Class VIII, Class IX, Class XII, Class F, Class GM-A, Class GM-M, Class H and Class L. The following Classes of units of the Non-Lending Fund have been established and have commenced operations: Class A, Class C, Class D, Class E, Class K and Class N.
2. Summary of Significant Accounting Policies
The financial statements are prepared in accordance with accounting principles generally accepted in the United States of America ("GAAP") which require the use of management estimates. Actual results could differ from those estimates. The policies described below are followed consistently in the preparation of the financial statements.
A. Valuation Governance and Oversight The Trustee and the Investment Manager assign valuation oversight responsibility to SSgA's regional valuation committees for the assigned products managed within each specific region. These regional valuation committees are generally comprised of senior officers from the compliance, credit, information technology, investment operations, portfolio management, risk management, and trading areas. These committees, or employees tasked with assisting the committees, perform a variety of functions including, but not limited to:
Responding to circumstances that require fair valuation and determining the fair value of portfolio instruments for which market quotations are not readily available, including where available market quotations are deemed unreliable;
Maintaining a list of all pricing services and sources and any applicable changes;

State Street Bank and Trust Company
SSgA S&P 500® Index Securities Lending Series Fund
SSgA S&P 500® Index Non-Lending Series Fund
Notes to Combined Financial Statements December 31, 2013
52
Recommending and monitoring pricing services used, including evaluating the pricing methodologies these pricing services employ;
Reviewing valuation challenges; Reviewing results of fair value determinations; and Maintaining valuation records.
The regional valuation committees inquire of members of the investment team for input on an as-needed basis. SSgA’s North America Valuation Committee is responsible for valuation oversight of the Fund. SSgA regularly performs various controls and procedures to assess the appropriateness of the valuation of portfolio investments and other financial instruments. These controls and procedures include, but are not limited to, reviewing for occurrences where market quotations are not readily available, validating stale priced holdings, comparing executed trades to vendor prices, analyzing vendor-to-vendor valuation comparisons and reviewing market data and news to identify potential fair valuation considerations. These procedures and the results of these controls are reviewed periodically by SSgA’s North America Valuation Committee. B. Security Valuation The investment valuation policy of the Fund is to value investments at fair value, which is generally defined as the price that could reasonably be expected to be realized from an orderly transaction to sell an asset or paid to transfer a liability between market participants. By its nature, a fair value price is a good faith estimate of the valuation in a current sale and may not reflect an actual market price. Investments and other portfolio instruments are generally valued using a market approach. In accordance with valuation policies and procedures approved by the Trustee, equity investments for which market quotations are readily available (including registered investment companies that are exchange traded) are valued at the last reported sale price on their principal exchange, market or system on valuation date, or official close price for certain markets. If no sales are reported for that day, investments are valued at the last published sale price or at fair value as determined in good faith by the Trustee. To the extent equity investments are actively traded and valuation adjustments are not applied, these investments are classified within Level 1 of the fair value hierarchy. Equity investments traded on inactive markets or valued by reference to similar instruments are generally classified within Level 2 of the fair value hierarchy. Short-term investments (with a remaining maturity of 60 days or less at the time of purchase and not credit impaired), if any, are stated at amortized cost, which approximates fair value, and are classified within Level 2 of the fair value hierarchy. Investments in registered investment companies (other than those that are exchange traded) or collective investment funds, if any, are valued at their respective net asset value and are classified within Level 2 of the fair value hierarchy. Please refer to the Derivative Instruments note for further details on the valuation policy for derivatives. In the event current market prices or quotations are not readily available or are deemed unreliable by the Trustee, such as the occurrence of a significant event, the fair value will be determined in good faith by the Trustee using alternative fair valuation methods. A "significant event" is an event that the Trustee believes, with a reasonably high degree of certainty, has caused the closing market prices of a Fund's portfolio securities to no longer reflect their value at the time of the Fund's net asset value calculation. The use of alternative valuation methods would generally result in the investments being classified within Level 2 of the fair value hierarchy.

State Street Bank and Trust Company
SSgA S&P 500® Index Securities Lending Series Fund
SSgA S&P 500® Index Non-Lending Series Fund
Notes to Combined Financial Statements December 31, 2013
53
Fair Value Hierarchy The Fund values its assets and liabilities at fair value using a hierarchy that prioritizes the inputs to valuation techniques giving the highest priority to readily available unadjusted quoted prices in active markets for identical assets or liabilities (Level 1 measurements) and the lowest priority to unobservable inputs (Level 3 measurements) when market prices are not readily available or reliable. The three levels of the hierarchy are described below: Level 1 Unadjusted quoted prices in active markets for identical assets or liabilities. Level 2
Prices determined using other significant observable inputs. Observable inputs are inputs that other market participants would use in valuing a portfolio instrument. These may include quoted prices for similar investments, interest rates, foreign exchange rates, prepayment speeds, credit risk and others.
Level 3
Prices determined using significant unobservable inputs. In situations where quoted prices or observable inputs are unavailable (for example, when there is little or no market activity for an investment at the end of the period), unobservable inputs may be used. Unobservable inputs reflect the Trustee's own assumptions about the factors market participants would use in valuing a portfolio instrument, and would be based on the best information available.
Changes in valuation techniques may result in transfers in or out of an investment's assigned level within the hierarchy. Transfers between fair value hierarchy levels are recognized at the end of the period. The following is a summary of the inputs used, as of December 31, 2013, involving the Fund's assets and liabilities carried at fair value. The inputs or methodologies used for valuing investments and other financial instruments may not be an indication of the risk associated with investing in those securities.
Level 1 Level 2 Level 3 Total
Investments in securities, long - Assets Common Stock $ 60,124,992,878 $ - $ - $ 60,124,992,878Government Issues - 58,444,188 - 58,444,188
Collective Investment Funds - 1,421,986,348 - 1,421,986,348
$ 60,124,992,878 $ 1,480,430,536 $ - $ 61,605,423,414
Other financial instruments - Assets Futures Contracts $ 39,837,519 $ - $ - $ 39,837,519
Please refer to the Combined Schedule of Investments and Combined Statement of Assets and Liabilities for additional information regarding composition of amounts listed above. C. Security Transactions and Investment Income Security transactions are accounted for as of the trade date. Realized gains and losses from investment transactions are determined using the average cost method. Distributions received from underlying funds, if any, are recorded on the ex-dividend date and retain the character of income as earned by the underlying funds. Dividend income, if any, is recorded on the ex-dividend date. Non-cash dividends, if any, are recorded at the fair value of the securities received. Interest income earned on securities, if any, is recorded on the accrual basis. Interest income includes accretion of discounts and amortization of premiums, if any. Net investment income (other than securities lending income and Class specific expenses) and unrealized and realized gains or losses are allocated daily to each Class of the Fund based upon the relative proportion of net assets of each Class.

State Street Bank and Trust Company
SSgA S&P 500® Index Securities Lending Series Fund
SSgA S&P 500® Index Non-Lending Series Fund
Notes to Combined Financial Statements December 31, 2013
54
Securities lending income is allocated daily to each Lending Fund Class based upon the relative proportion of the Lending Fund's net assets. D. Taxes It is the Fund's policy to comply with the requirements of Section 501(a) of the Internal Revenue Code relating to collective investment of employee benefit funds. Accordingly, the Fund is exempt from federal and state taxes and no federal or state tax provision is required. The Trustee has reviewed the Fund's tax positions for all open tax years (current and prior tax years) and has determined that no provision for income taxes is required in the Fund's financial statements. E. Issuances and Redemptions of Units of Participation The per unit net asset value of each Class is determined each business day. Issuances and redemptions of Class units may be made on such days, based upon the net asset value per unit as of the Class' valuation date last preceding the date on which such order to contribute or redeem assets is received. The Trustee, in its sole discretion, reserves the right to value any contribution or redemption as of the next succeeding valuation date or another date as the Trustee deems appropriate. Additional terms of participation are detailed in the Trust and the Fund’s other governing documents. Such terms may be implemented pursuant to the Trustee's prudent determination. F. Market and Credit Risk In the normal course of business, the Fund trades financial instruments and enters into financial transactions where risk of potential loss exists due to changes in the market (market risk) or failure of the counterparty to the transaction to perform (credit risk). The Fund may be exposed to additional credit risk that an institution or other entity with which the Fund has unsettled or open transactions will default. Additionally, if a counterparty is in bankruptcy, reorganization proceedings, becomes insolvent or otherwise fails to perform its obligations, the Fund may experience significant delays in obtaining any recovery. G. Expenses Under the Trust, the Fund may pay certain expenses for services received. Each Class is charged its allocable share of the fees and expenses borne by the Fund that are not specifically allocated to one or more of the Classes. The Fund indirectly bears the expenses incurred by the underlying funds, if any.

State Street Bank and Trust Company
SSgA S&P 500® Index Securities Lending Series Fund
SSgA S&P 500® Index Non-Lending Series Fund
Notes to Combined Financial Statements December 31, 2013
55
The investment advisor charges a management fee to the Classes at the following rate of average daily net asset value:
Class Rate (%) Management Fees Class II 0.05 $ 442,561Class III 0.15 510,360Class IV 0.02 38,120Class V 0.02 5,487Class VI 0.03 18,093Class VII 0.03 10,883Class VIII 0.03 30,969Class IX 0.03 271,324Class XII 0.02 44,881Class F 0.25 1,250,431Class H 0.55 552,905Class L 0.20 149,866Class C 0.05 532,941Class D 0.02 51,769Class E 0.02 133,293Class K 0.01 217,762Class N 0.02 544,801
Total Management Fees $ 4,806,446
Class I is not charged a direct management fee. SSgA receives investment fees from the Class participants and therefore, the Class makes no payments for these services. Class GM-A is not charged a direct management fee. SSgA receives investment fees from the Class participants and therefore, the Class makes no payments for these services. Class GM-M is not charged a direct management fee. SSgA receives investment fees from the Class participants and therefore, the Class makes no payments for these services. Class A is not charged a direct management fee. SSgA receives investment fees from the Class participants and therefore, the Class makes no payments for these services. The Fund is charged by State Street Bank an annual administration fee equal to 0.0025% of the average daily net asset value of the Fund and $5 per Fund transaction of securities and portfolio instruments. This administration fee relates to the provision of custody, bookkeeping and accounting services, unitholder servicing, transfer agency and other services that the Trustee may from time to time consider necessary or appropriate.

State Street Bank and Trust Company
SSgA S&P 500® Index Securities Lending Series Fund
SSgA S&P 500® Index Non-Lending Series Fund
Notes to Combined Financial Statements December 31, 2013
56
The following Classes are charged an administrative service fee, as a percentage of average daily net assets, which compensates third parties or intermediaries for services including, but not limited to, record keeping, asset servicing, sub-accounting and communication services:
Class Rate (%) Administrative Service
Fees Class IV 0.10 $ 190,598Class V 0.50 137,174Class VI 0.09 54,278Class VII 0.18 65,299Class VIII 0.32 330,334Class IX 0.67 6,059,571Class D 0.25 647,113Class E 0.10 666,463
Total Administrative Service Fees $ 8,150,830
Please refer to the Additional Expense Information in the accompanying footnotes for further disclosures regarding expenses. H. Treatment of Net Investment Income and Net Realized Gains Net investment income (excluding securities lending fee income, if any) and net realized gains are retained by the Fund. Securities lending income is retained by the Lending Fund. I. Derivative Instruments The Fund's use of derivative instruments involves risks different from, and possibly greater than, the risks associated with investing directly in securities and other more traditional investments. Derivatives are instruments whose values are derived from underlying assets, indices, reference rates or a combination of these factors. Derivatives are subject to a number of risks, such as potential changes in value in response to interest rate changes, other market developments or as a result of changes in credit quality of the Fund's counterparty to the derivative transaction. Over the counter ("OTC") derivatives usually do not have publicly available price sources and therefore there may be differences between bespoke valuation offers by dealers. Furthermore, there is a risk that changes in the value of a derivative may not correlate as anticipated with respect to the change in the value of the asset, rate, or index underlying the derivative. Derivative transactions can create investment leverage and may be highly volatile. Use of derivatives other than for hedging purposes may be considered speculative. When the Fund invests in a derivative instrument, the future exposure is potentially unlimited. The value of a derivative instrument will depend on the ability and the willingness of the Fund’s derivative counterparty to perform its obligations under the transaction. A liquid secondary market may not always exist for the Fund’s derivative positions at any time and may impact the Fund’s ability to establish fair market value of a derivative transaction and close out derivative positions. Although the use of derivatives is intended to complement the Fund’s performance, it may instead reduce returns and increase volatility. The measurement of the risks associated with derivative instruments is meaningful only when all related and offsetting transactions are considered. The Fund must set aside liquid assets or engage in other appropriate measures to cover its obligations under these derivative instruments. Regulations recently adopted or proposed by regulators in the U.S. and other countries may substantially affect the markets in which derivatives are traded, including requiring central clearing and reporting of transactions that may not have been previously required to be reported or cleared. These regulations may require, among other things, that the Fund post greater amounts of collateral or margin than the amounts currently posted by the Fund on a bilateral basis with
State Street Bank and Trust Company
SSgA S&P 500® Index Securities Lending Series Fund
SSgA S&P 500® Index Non-Lending Series Fund
Notes to Combined Financial Statements December 31, 2013
57
its derivatives counterparties or with derivatives clearing organizations. In addition, the regulations may make certain types of derivatives uneconomical or unavailable to the Fund, and they may substantially reduce the liquidity for some derivatives. The full extent of the new regulations and their effects on the derivatives markets are not known at this time. Certain derivatives, including forward foreign currency contracts and some swap contracts, as applicable, are entered into OTC under the terms and conditions of International Swaps and Derivatives Association Master Agreements or similar agreements (“Master Agreements”), which are separately negotiated with each counterparty. Master Agreements may contain provisions allowing a counterparty to exercise rights to terminate derivative contracts, to the extent not otherwise waived, against the Fund in the event the Fund’s net assets decline over a period of time by a predetermined percentage or decrease below a predetermined floor amount. Master Agreements also contain certain provisions for the Fund to exercise rights to terminate derivative contracts, to the extent not otherwise waived, against counterparties, such as a decline in a counterparty’s credit rating below a specified level. Such rights for both the counterparty and the Fund to terminate open contracts may be transacted at prices that favor the counterparty, which could have an adverse effect to the Fund. Certain derivatives, including futures contracts and cleared swaps, as applicable, are transacted on an exchange. These exchange traded derivatives generally present less counterparty risk to the Fund because the exchange's clearinghouse, as counterparty to the exchange traded derivatives, guarantees the derivative against default. Clearinghouses have been established to act as central counterparties on eligible OTC transactions, including cleared swaps. Margin, collateral and settlement requirements are set by each clearinghouse and may vary from one exchange to another. While offset rights may exist under applicable law, the Fund does not have a contractual right of offset against a clearing broker or clearinghouse in the event of default by the clearing broker or clearinghouse. The Fund values derivatives at fair value as described below and recognizes changes in fair value currently in its results of operations. Accordingly, the Fund does not follow hedge accounting, even for derivatives employed as economic hedges. Derivative instruments outstanding at year end, if any, are disclosed in the Combined Schedule of Investments. Futures Contracts The Fund may use futures contracts to manage exposure to the market. Buying futures tends to increase a fund's exposure to the underlying instrument. Selling futures tends to decrease a fund's exposure to the underlying instrument or hedge the fair value of other fund investments. When entering into a futures contract, the Fund agrees to buy or sell a specified quantity of a security, currency, basket of securities or an index for an agreed-upon price on an agreed-upon date. Futures contracts are valued at the quoted daily settlement price at the end of each day on the board of trade or exchange upon which they are traded. Futures contracts are classified within Level 1 of the fair value hierarchy. Upon entering into a futures contract, the Fund is required to deposit either in cash, currency or securities, an amount ("initial margin") equal to a certain percentage of the nominal value of the contract. Subsequent payments are made or received by the Fund periodically, depending on the fluctuation in the value of the underlying instrument, and are recorded as variation margin receivable or payable with a corresponding offset in unrealized gains or losses. The Fund recognizes a realized gain or loss when a contract is closed or expires. Futures contracts involve, to varying degrees, credit and market risks. The Fund enters into futures contracts only on exchanges or boards of trade where the exchange or board of trade acts as the counterparty to the transaction. Thus, credit risk on such transactions is limited to the failure of the exchange or board of trade. Losses in value may arise from changes in the value of the underlying instruments or if there is an illiquid secondary market for the contracts. In addition, there is the risk that there may not be an exact correlation between movements in the price of a futures contract and movements in the price of the underlying instrument.

State Street Bank and Trust Company
SSgA S&P 500® Index Securities Lending Series Fund
SSgA S&P 500® Index Non-Lending Series Fund
Notes to Combined Financial Statements December 31, 2013
58
During the year, the Fund entered into certain derivative contract types. These instruments were used to meet the Fund's investment objectives and to obtain and/or manage exposure related to the risks below. The following table sets forth the fair value of the Fund's derivative contracts for trading activities by certain primary underlying risk types as of the end of the year. The values in the table below exclude the effects of cash collateral received or posted pursuant to derivative contracts, and therefore are not necessarily representative of the Fund's net exposure. Fair Values of Asset and Liability Derivative Contracts at December 31, 2013: Derivatives not accounted for as hedging instruments Credit Equity
Foreign Exchange Interest Rate Total
Asset Derivative Variation margin
receivable (payable)* $ - $ 39,837,519 $ - $ - $ 39,837,519
*Includes cumulative appreciation/(depreciation) of futures contracts as reported in the Combined Schedule of Investments. Only current day's variation margin is reported within the Combined Statement of Assets and Liabilities. The following tables set forth by certain primary underlying risk types the Fund's gains and (losses) related to derivative activities for the year ended December 31, 2013. Effect of Derivative Instruments on the Combined Statement of Operations - Net Realized Gain / (Loss): Derivatives not accounted for as hedging instruments Credit Equity
Foreign Exchange Interest Rate Total
Futures $ - $ 268,432,049 $ - $ - $ 268,432,049
Effect of Derivative Instruments on the Combined Statement of Operations - Net Change in Unrealized Appreciation / (Depreciation): Derivatives not accounted for as hedging instruments Credit Equity
Foreign Exchange Interest Rate Total
Futures $ - $ 36,610,104 $ - $ - $ 36,610,104
During the year ended December 31, 2013, the Fund had an average of 14,070 futures contracts outstanding. For financial reporting purposes, the Fund does not offset derivative assets or liabilities, including those that may be subject to an enforceable Master Agreement, on the Combined Statement of Assets and Liabilities. Futures that settle variation margin daily are presented at the variation margin receivable or payable. The following table sets forth the Fund's net exposure to derivative assets and liabilities available for offset and net of collateral at December 31, 2013:
Derivative Type Gross Assets Gross Liabilities Collateral Received
Collateral Pledged Net Exposure
Futures $ 4,512,525 $ - $ - $ - $ 4,512,525
The actual value of collateral may be more than the amount presented.

State Street Bank and Trust Company
SSgA S&P 500® Index Securities Lending Series Fund
SSgA S&P 500® Index Non-Lending Series Fund
Notes to Combined Financial Statements December 31, 2013
59
3. Concentration of Ownership The following information illustrates concentration of ownership of holders owning units in excess of 10% of total units outstanding as well as units owned by other State Street Bank Collective Investment Funds. 10% or Greater Unitholders % of Units Outstanding held by
# of Unitholders % of Units held State Street Bank Collective
Investment Funds
Lending Fund Class I 1 14% 25% Class II 2 42% - % Class III 2 48% - % Class IV 3 99% - % Class V 1 100% - % Class VI 2 100% - % Class VII 2 100% - % Class VIII 3 100% - % Class IX 1 99% - % Class XII 4 79% - % Class F 2 96% - % Class GM-A 1 100% - % Class GM-M 1 100% - % Class H 2 100% - % Class L 2 100% - % Non-Lending Fund Class A 2 33% 7% Class C 3 52% - % Class D 1 75% - % Class E 2 81% - % Class K 1 92% - % Class N 2 34% - %
4. State Street Global Securities Lending Program The Lending Fund is authorized to participate in the State Street Global Securities Lending Program under the terms and conditions of a Securities Lending Authorization Agreement (“SLAA”). Under the State Street Global Securities Lending Program, securities held by Lending Funds are loaned by State Street Bank, as agent, to certain brokers and other financial institutions (the "Borrowers"). The Borrowers provide cash, securities, or letters of credit as collateral against loans in an amount equal to at least 100% of the fair value of the loaned securities. The Borrowers are required to maintain the collateral at not less than 100% of the fair value of the loaned securities. Cash collateral provided by the Borrowers is invested in State Street Bank and Trust Company Series Quality Trust for SSgA Funds Trust (the "Cash Collateral Fund"). SSgA acts as manager for the Cash Collateral Fund and is compensated for these services. State Street Bank generally manages the Global Securities Lending Program as a global program, instead of a series of individual programs for each securities lending participant. Securities are loaned to Borrowers with an objective of maximizing return, while maintaining latent liquidity. Latent liquidity represents the ability to increase the amount of

State Street Bank and Trust Company
SSgA S&P 500® Index Securities Lending Series Fund
SSgA S&P 500® Index Non-Lending Series Fund
Notes to Combined Financial Statements December 31, 2013
60
securities on loan, which would increase cash collateral from Borrowers to be invested in securities lending collateral vehicles. Borrower loans of securities may be reassigned or transferred to other participants upon redemption of underlying lendable securities. Accordingly, Lending Fund contributions or redemptions may not necessarily result in a change in the amount of the Lending Fund's securities on loan or the Lending Fund's investment in securities lending collateral collective investment funds or other collateral. Risks and Indemnification State Street Bank, as lending agent, indemnifies the Lending Funds for replacement of any loaned securities (or, in certain circumstances, return of equivalent cash value) due to Borrower default on a security loan. Lending Fund participants, however, bear the risk of loss with respect to the investment of collateral. Financial Statement Presentation At December 31, 2013, the fair value of securities loaned by the Lending Fund is disclosed on the Combined Statement of Assets and Liabilities. The Lending Fund's investment in the Cash Collateral Fund is recorded on the Combined Statement of Assets and Liabilities at fair value. The Lending Fund also received U.S. Treasury and Agency securities valued at $422,130 as additional collateral. For financial reporting purposes, the Fund does not offset financial assets and liabilities related to securities lending, including those that may be subject to an enforceable SLAA, on the Combined Statement of Assets and Liabilities. The following table sets forth the Fund’s net exposure to financial assets and liabilities related to securities lending available for offset and net of collateral at December 31, 2013:
Gross Assets Gross Liabilities Collateral Received
Collateral Pledged Net Exposure
Securities on Loan $ 263,190,308 $ - $ (263,190,308) $ - $ -
The actual value of collateral may be more than the amount presented. Cash Collateral Fund Objectives The objectives of the Cash Collateral Fund are (i) to generate investment returns that exceed the rebate payable to the Borrowers on the cash collateral posted by the Borrowers, (ii) to avoid any undue risk of loss of principal, and (iii) to have sufficient liquidity to return any cash collateral to the Borrowers when the related securities loan terminates. The Cash Collateral Fund is managed in a manner designed to achieve these objectives, with a principal focus on asset-liability matching. During 2013, the Cash Collateral Fund issued and redeemed its units at a price of $1.00 per unit in accordance with its governing documents. Cash Collateral Funds Income Distribution A portion of the income generated upon investment of the cash collateral net of the Cash Collateral Funds' operating expenses is remitted to the Borrowers and the remainder is allocated between the Lending Fund and State Street Bank in its capacity as lending agent. Negotiated lenders' fees are received for those loans collateralized by securities or letters of credit, if any. Securities lending fee income, if any, is recorded on an accrual basis by the Lending Fund. Investment in Cash Collateral Funds Valuation Management of the Lending Funds regularly reviews the performance of the Cash Collateral Funds and the variation between their per unit fair values and the expected transaction price of $1.00. The Cash Collateral Funds primarily utilize

State Street Bank and Trust Company
SSgA S&P 500® Index Securities Lending Series Fund
SSgA S&P 500® Index Non-Lending Series Fund
Notes to Combined Financial Statements December 31, 2013
61
quotations from independent pricing services, quotations from bond dealers and information with respect to bond and note transactions ("pricing service information") to determine fair value of their investments. Such pricing service information may also consist of quotations derived from valuation models or matrix pricing. At December 31, 2013, the per unit fair value was $1.00 for the State Street Bank and Trust Company Series Quality Trust for SSgA Funds Trust. Investments in Cash Collateral Funds are classified within Level 2 of the fair value hierarchy.
5. Indemnifications
In the normal course of business, the Fund enters into contracts that contain a variety of representations which provide general indemnifications. The Fund's maximum exposure under these arrangements is unknown as this would involve future claims that may be made against the Fund that have not yet occurred. However, based on experience, the Trustee expects the risk of loss to be remote.
6. Recent Accounting Pronouncements
In June 2013, the Financial Accounting Standards Board (“FASB”) issued an amendment to GAAP which sets forth a new approach for determining whether an entity is an investment company. The amendment clarifies the characteristics and sets certain measurement and disclosure requirements for an investment company. The amendment is effective, for the Fund, on January 1, 2014. The Trustee does not anticipate that the adoption of the amendment will have a material impact on the Fund’s financial statements. In April 2013, the FASB issued an amendment to GAAP that requires financial statements to be prepared using the liquidation basis of accounting when liquidation is deemed imminent. The amendment is effective, for the Fund, on January 1, 2014. The Trustee does not anticipate that the adoption of the amendment will have a material impact on the Fund’s financial statements. In December 2011, the FASB issued an amendment to GAAP that requires additional information regarding financial instruments and derivative instruments that are offset or subject to an enforceable master netting arrangement or similar agreement. In January 2013, the FASB issued an additional amendment to GAAP that clarifies the scope of transactions that are subject to the disclosures about offsetting. The Fund's financial statements reflect the adoption of the amendments on January 1, 2013, as applicable.
7. Other
SSgA is involved in various industry-related and other regulatory, governmental and law enforcement inquiries and subpoenas. Additionally, SSgA is currently defending two related ERISA class actions by investors in certain common trust funds and ERISA collective investment funds managed by SSgA which challenges the division of securities lending-related revenue between the SSgA lending funds and State Street in its role as lending agent. In January 2014, State Street filed a motion to approve a $10 million class settlement of the ERISA collective investment fund litigation. The common trust fund litigation remains pending. The actions purport to be class actions and define the affected funds broadly. The actions do not name the Fund or any other funds as parties to the proceedings and do not seek damages from the Fund or the funds. The Trustee has reviewed these claims in connection with these financial statements. Based upon that review, the Trustee has determined that no accrual or loss contingency is required on the Fund's financial statements.
8. Subsequent Events
The Trustee has evaluated subsequent events after December 31, 2013 through April 11, 2014, the date the financial statements were available to be issued, and has concluded that there is no impact requiring adjustment or disclosure in the financial statements.
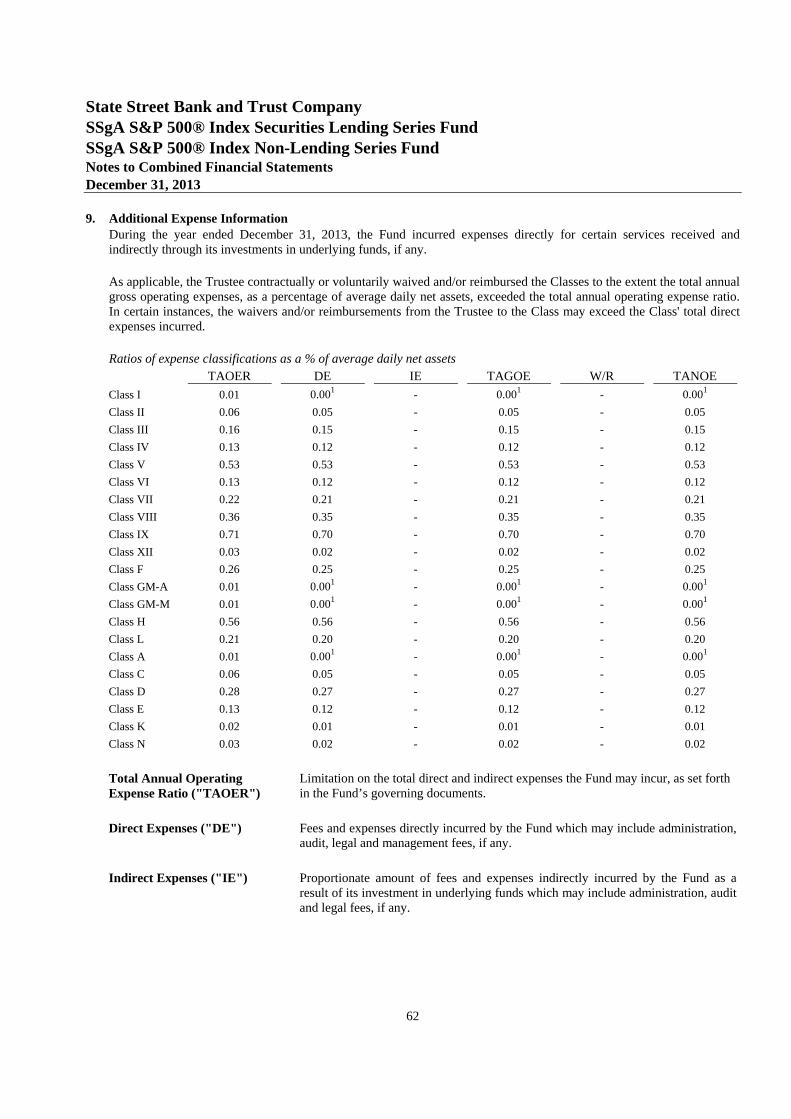
State Street Bank and Trust Company
SSgA S&P 500® Index Securities Lending Series Fund
SSgA S&P 500® Index Non-Lending Series Fund
Notes to Combined Financial Statements December 31, 2013
62
9. Additional Expense Information During the year ended December 31, 2013, the Fund incurred expenses directly for certain services received and indirectly through its investments in underlying funds, if any. As applicable, the Trustee contractually or voluntarily waived and/or reimbursed the Classes to the extent the total annual gross operating expenses, as a percentage of average daily net assets, exceeded the total annual operating expense ratio. In certain instances, the waivers and/or reimbursements from the Trustee to the Class may exceed the Class' total direct expenses incurred. Ratios of expense classifications as a % of average daily net assets
TAOER DE IE TAGOE W/R TANOE
Class I 0.01 0.001 - 0.001 - 0.001 Class II 0.06 0.05 - 0.05 - 0.05 Class III 0.16 0.15 - 0.15 - 0.15 Class IV 0.13 0.12 - 0.12 - 0.12 Class V 0.53 0.53 - 0.53 - 0.53 Class VI 0.13 0.12 - 0.12 - 0.12 Class VII 0.22 0.21 - 0.21 - 0.21 Class VIII 0.36 0.35 - 0.35 - 0.35 Class IX 0.71 0.70 - 0.70 - 0.70 Class XII 0.03 0.02 - 0.02 - 0.02 Class F 0.26 0.25 - 0.25 - 0.25 Class GM-A 0.01 0.001 - 0.001 - 0.001 Class GM-M 0.01 0.001 - 0.001 - 0.001 Class H 0.56 0.56 - 0.56 - 0.56 Class L 0.21 0.20 - 0.20 - 0.20 Class A 0.01 0.001 - 0.001 - 0.001 Class C 0.06 0.05 - 0.05 - 0.05 Class D 0.28 0.27 - 0.27 - 0.27 Class E 0.13 0.12 - 0.12 - 0.12 Class K 0.02 0.01 - 0.01 - 0.01 Class N 0.03 0.02 - 0.02 - 0.02 Total Annual Operating Expense Ratio ("TAOER")
Limitation on the total direct and indirect expenses the Fund may incur, as set forth in the Fund’s governing documents.
Direct Expenses ("DE")
Fees and expenses directly incurred by the Fund which may include administration, audit, legal and management fees, if any.
Indirect Expenses ("IE")
Proportionate amount of fees and expenses indirectly incurred by the Fund as a result of its investment in underlying funds which may include administration, audit and legal fees, if any.

State Street Bank and Trust Company
SSgA S&P 500® Index Securities Lending Series Fund
SSgA S&P 500® Index Non-Lending Series Fund
Notes to Combined Financial Statements December 31, 2013
63
Total Annual Gross Operating Expense ("TAGOE")
Total direct and indirect expenses incurred, prior to the application of any waivers and/or reimbursements, if any.
Waivers and/or Reimbursements ("W/R")
Amounts waived and/or reimbursed by the Trustee to the extent the total direct and indirect expenses of the Fund exceeded the total annual operating expense ratio, as described in the Fund’s governing documents.
Total Annual Net Operating Expense ("TANOE")
Total direct and indirect expenses incurred, net of waivers and/or reimbursements, if any.
The total annual net operating expense ratio presented above may not correlate to the Class' ratio of expenses to average daily net assets as presented in the Financial Highlights, which do not reflect indirect expenses.
1 Zero amounts represent those which are less than 0.005% or (0.005%) if negative.
State Street Bank and Trust Company
SSgA S&P 500® Index Securities Lending Series Fund
SSgA S&P 500® Index Non-Lending Series Fund
Brokerage Commissions (unaudited)
December 31, 2013
Brokerage Commissions 64
Brokerage Commissions Subject to its duty to seek best execution, SSgA employs a standard negotiated commission schedule for specific types of trades (generally equities) entered into on behalf of its client accounts. SSgA retains the right to use “soft” or commission dollars consistent with the parameters of Section 28(e) of the Securities Exchange Act of 1934, as amended (the “Exchange Act”). In addition, certain client accounts, including the Fund or underlying funds, as applicable, participate in arrangements or programs pursuant to which transactions entered into by SSgA for the client accounts generate “credits” used by SSgA to obtain third-party research or brokerage services (“Commission Sharing Agreements” or “CSAs”). Participants who invest in the Fund may not limit the ability of the Fund to directly or indirectly participate in CSAs. Research and brokerage services furnished to SSgA may be used in furnishing investment or other advice to all or some subset of SSgA’s (and/or its affiliates) clients. Services received from a broker-dealer that executed transactions for a particular client may not necessarily be used by SSgA specifically in servicing that particular account. SSgA may share some or all of the brokerage and research services received by it with affiliates. Transactions effected for clients of SSgA may be aggregated with transactions effected for clients of SSgA whose commission dollars do not generate credits used to obtain third-party research and brokerage services (“Restricted Accounts”). Restricted Accounts may benefit from any third-party research or brokerage services obtained using credits arising from transactions effected for other clients of SSgA. The Fund paid an aggregate dollar amount of brokerage commissions of $195,431 for 2013. None of the brokerage commissions paid were paid to affiliated brokers. Brokerage commissions paid by the Fund may be substantially different from year to year for multiple reasons, including market volatility and the demand for a particular Fund. The Fund generated $70,982 in CSA credits for 2013.