state summary
TRANSCRIPT

State Summary
October 2016
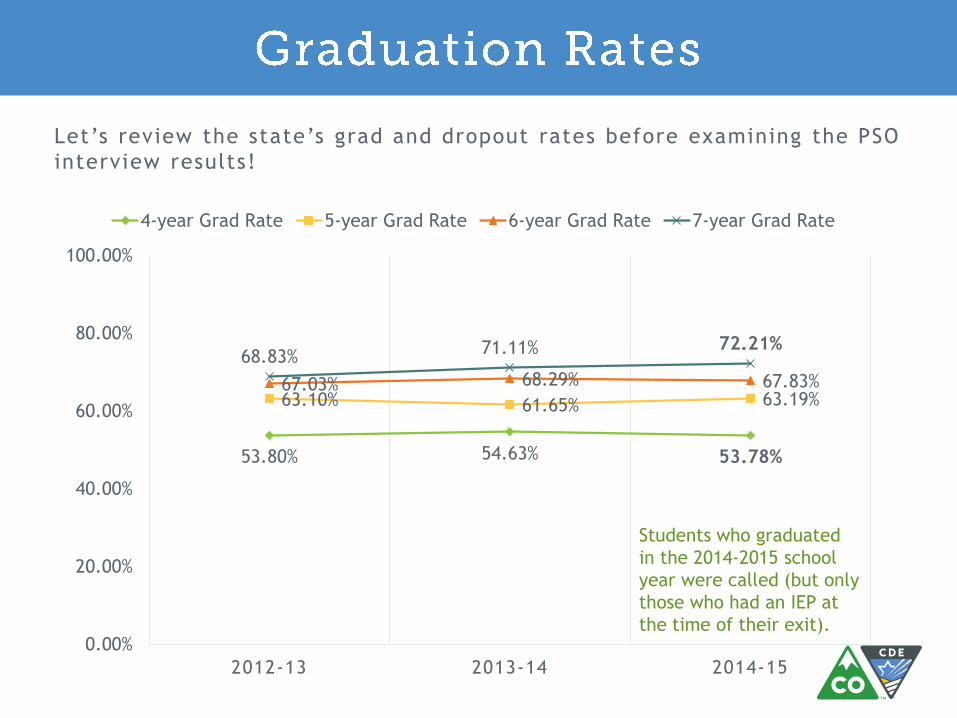
Let’s review the state’s grad and dropout rates before examining the PSO
interview results!
53.80% 54.63% 53.78%
63.10% 61.65% 63.19%67.03% 68.29% 67.83%
68.83%71.11% 72.21%
0.00%
20.00%
40.00%
60.00%
80.00%
100.00%
2012-13 2013-14 2014-15
4-year Grad Rate 5-year Grad Rate 6-year Grad Rate 7-year Grad Rate
Students who graduated
in the 2014-2015 school
year were called (but only
those who had an IEP at
the time of their exit).
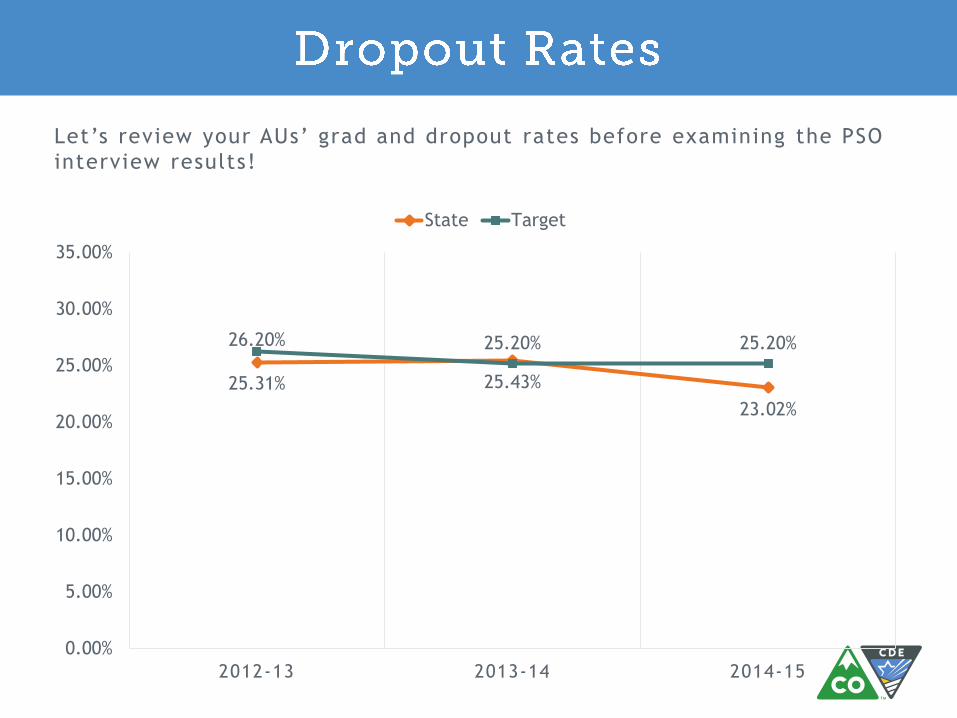
Let’s review your AUs’ grad and dropout rates before examining the PSO
interview results!
25.31% 25.43%
23.02%
26.20% 25.20% 25.20%
0.00%
5.00%
10.00%
15.00%
20.00%
25.00%
30.00%
35.00%
2012-13 2013-14 2014-15
State Target
What are we measuring?
What Colorado’s former students with IEPs are up to 1 year after they
exit from high school.
Why?
So that AUs and the state learn if their programs worked/didn’t work,
and to use the information for review and improvement of their
current programs.
Indicator 14 for OSEP.
How?
Between May and September 2016, AUs called their former students
who exited high schools during the 2014-2015 school year.
All interviews were recorded in the Data Management System.
Thank you AU directors, transition coordinators, social
workers, and people in any other position who made this
interview process happen!!
This report summarizes the results of the post-school outcome
interviews in the state.
Post-school Outcome Interview 2016
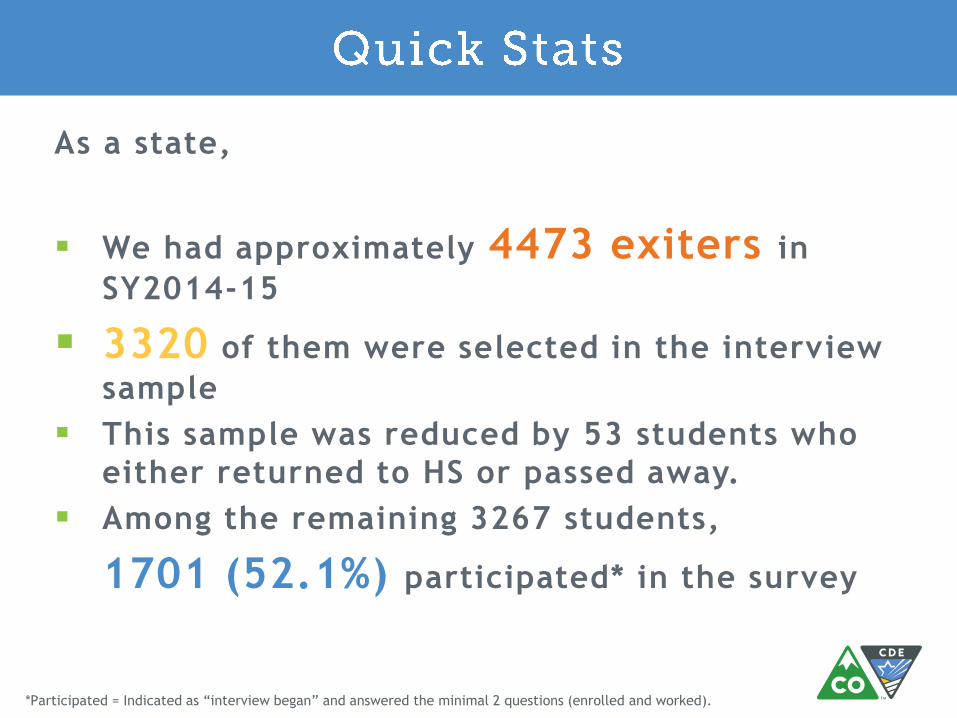
As a state,
We had approximately 4473 exiters in
SY2014-15
3320 of them were selected in the interview
sample
This sample was reduced by 53 students who
either returned to HS or passed away.
Among the remaining 3267 students,
1701 (52.1%) participated* in the survey
*Participated = Indicated as “interview began” and answered the minimal 2 questions (enrolled and worked).
0.00%
10.00%
20.00%
30.00%
40.00%
50.00%
60.00%
70.00%
80.00%
90.00%
100.00%
Sta
te
2015 %Part 2016 %Part
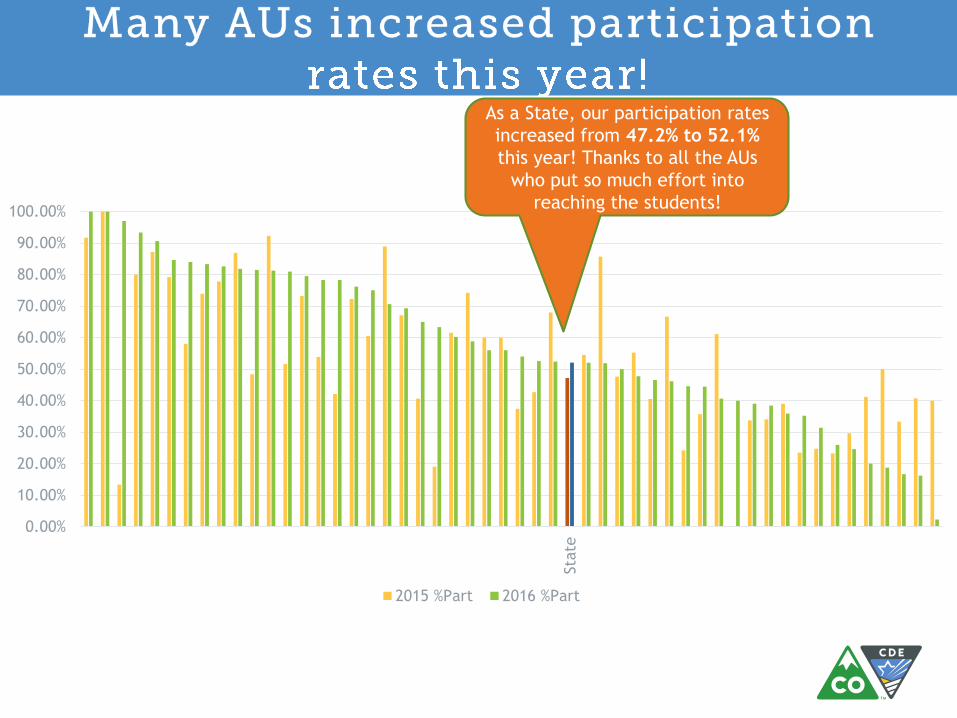
As a State, our participation rates
increased from 47.2% to 52.1%
this year! Thanks to all the AUs
who put so much effort into
reaching the students!
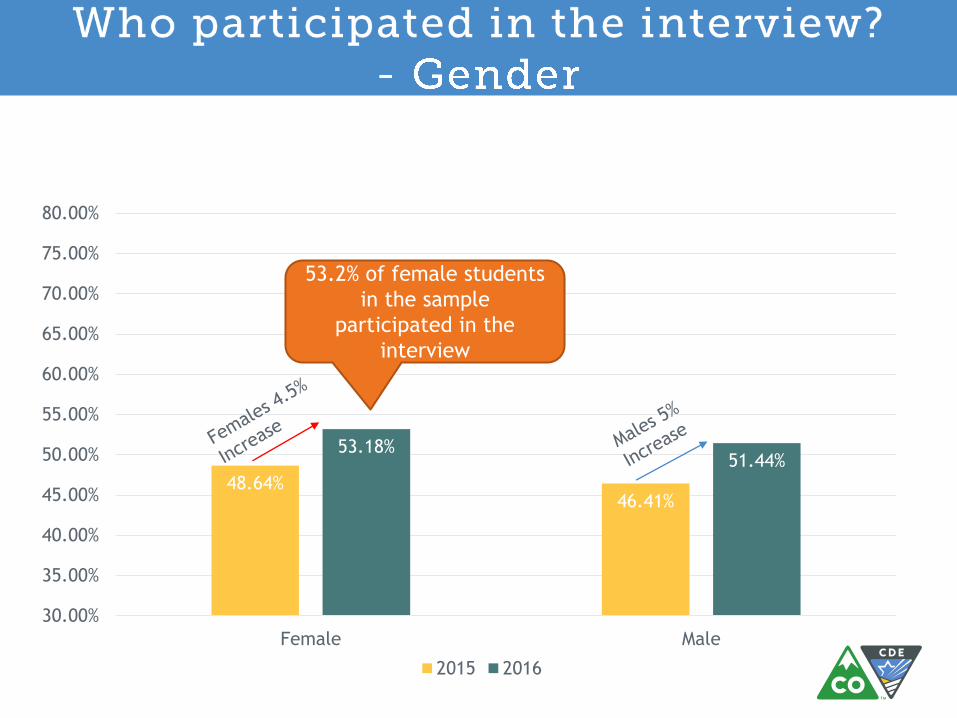
48.64%46.41%
53.18%51.44%
30.00%
35.00%
40.00%
45.00%
50.00%
55.00%
60.00%
65.00%
70.00%
75.00%
80.00%
Female Male
2015 2016
53.2% of female students
in the sample
participated in the
interview
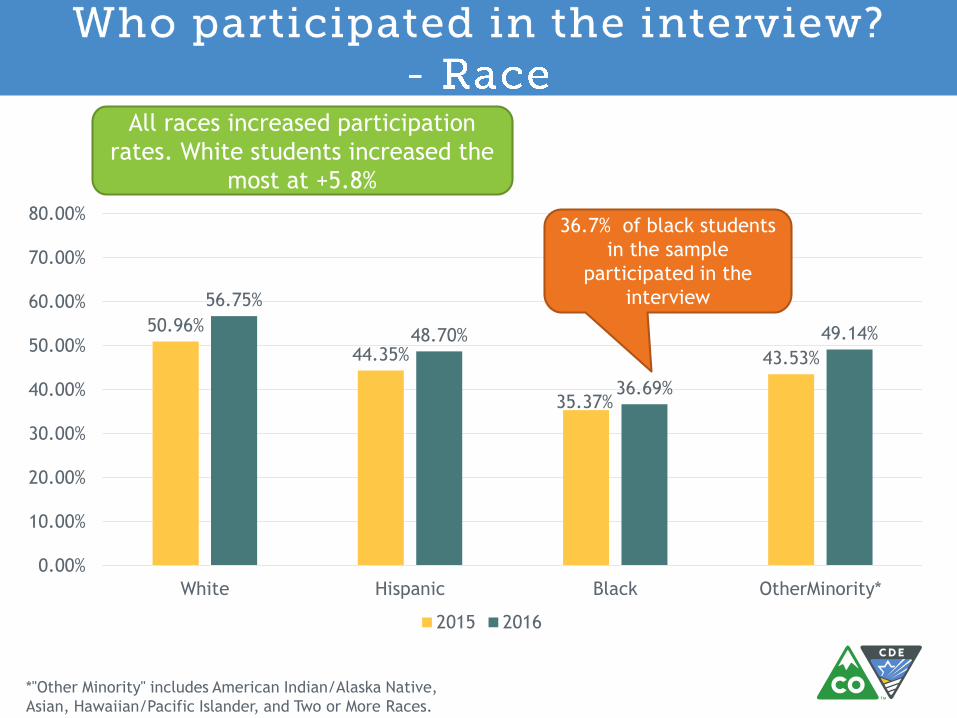
50.96%
44.35%
35.37%
43.53%
56.75%
48.70%
36.69%
49.14%
0.00%
10.00%
20.00%
30.00%
40.00%
50.00%
60.00%
70.00%
80.00%
White Hispanic Black OtherMinority*
2015 2016
All races increased participation
rates. White students increased the
most at +5.8%
36.7% of black students
in the sample
participated in the
interview
*"Other Minority" includes American Indian/Alaska Native,
Asian, Hawaiian/Pacific Islander, and Two or More Races.
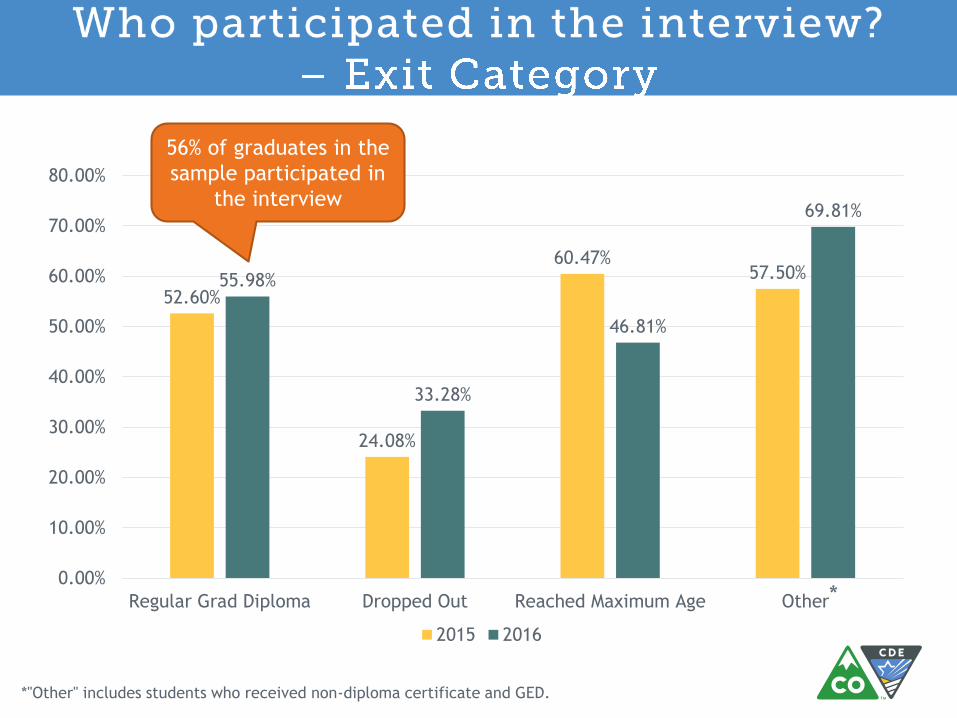
52.60%
24.08%
60.47%57.50%55.98%
33.28%
46.81%
69.81%
0.00%
10.00%
20.00%
30.00%
40.00%
50.00%
60.00%
70.00%
80.00%
Regular Grad Diploma Dropped Out Reached Maximum Age Other
2015 2016
56% of graduates in the
sample participated in
the interview
*
*"Other" includes students who received non-diploma certificate and GED.

0.00%
10.00%
20.00%
30.00%
40.00%
50.00%
60.00%
70.00%
80.00%
2015 2016
58.7% of Students with
physical disabilities in
the sample participated
in the interview
Yay!!
As a state, the participation rate increased from 47.2%
to 52.1%!
The participation rates increased across gender, race,
exit categories, and disabilities.
Things to ponder upon… Although 52.1% participation rate is great, we can’t be
satisfied yet. How can we increase participation rates?
We are not doing a good job reaching out to black
students…
We want to reach out to more students who have
dropped out. We increased the participation rates of
students who dropped out, but they are still under -
represented. How??
Post-school Outcome Interview 2016

Postsecondary School At any time since leaving high school, have you ever been
enrolled in any school, job training, or education program?
At any time since leaving high school, were you enrolled in a 2-
year or 4-year college or university?
Did you complete an entire term?
Employment At any time since leaving high school, have you ever worked?
How many hours do/did you work each week?
Agency Link Did you participate or are you currently participating in a
Division of Vocational Rehabilitation Service such as the School
to Work Alliance Program (SWAP)?
School-related Info Did you participate in services for students ages 18-21 in your
school district?
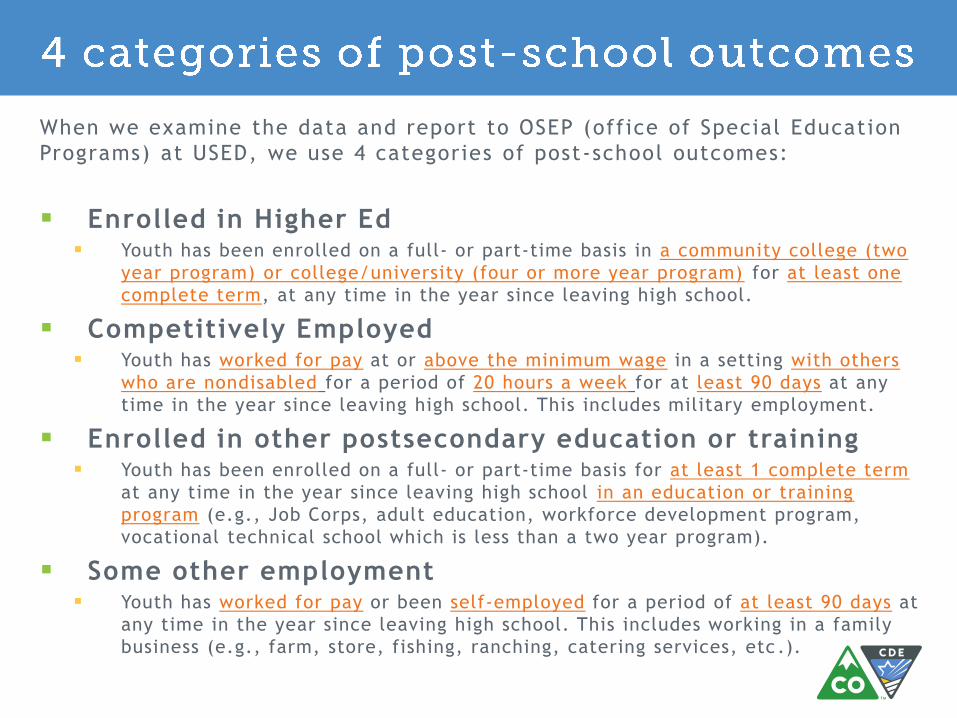
When we examine the data and report to OSEP (office of Special Education
Programs) at USED, we use 4 categories of post-school outcomes:
Enrolled in Higher Ed Youth has been enrolled on a full- or part-time basis in a community college (two
year program) or college/university (four or more year program) for at least one
complete term, at any time in the year since leaving high school.
Competitively Employed Youth has worked for pay at or above the minimum wage in a setting with others
who are nondisabled for a period of 20 hours a week for at least 90 days at any
time in the year since leaving high school. This includes military employment.
Enrolled in other postsecondary education or training Youth has been enrolled on a full- or part-time basis for at least 1 complete term
at any time in the year since leaving high school in an education or training
program (e.g., Job Corps, adult education, workforce development program,
vocational technical school which is less than a two year program).
Some other employment Youth has worked for pay or been self-employed for a period of at least 90 days at
any time in the year since leaving high school. This includes working in a family
business (e.g., farm, store, fishing, ranching, catering services, etc .).

The 4 PSO categories feed into measurement ABC under State Performance
Plan Indicator 14,upon which Colorado and AUs are evaluated.
Enrolled in Higher Ed
Competitively Employed
Enrolled in other
postsecondary education
or training
Some other employment
Higher Ed =
Measurement AHigher Ed +
Competitive
Employment =
Measurement B
All Categories =
Measurement C
When a student is not in any of the above categories, the
student is considered as “Not Engaged in the Community.”
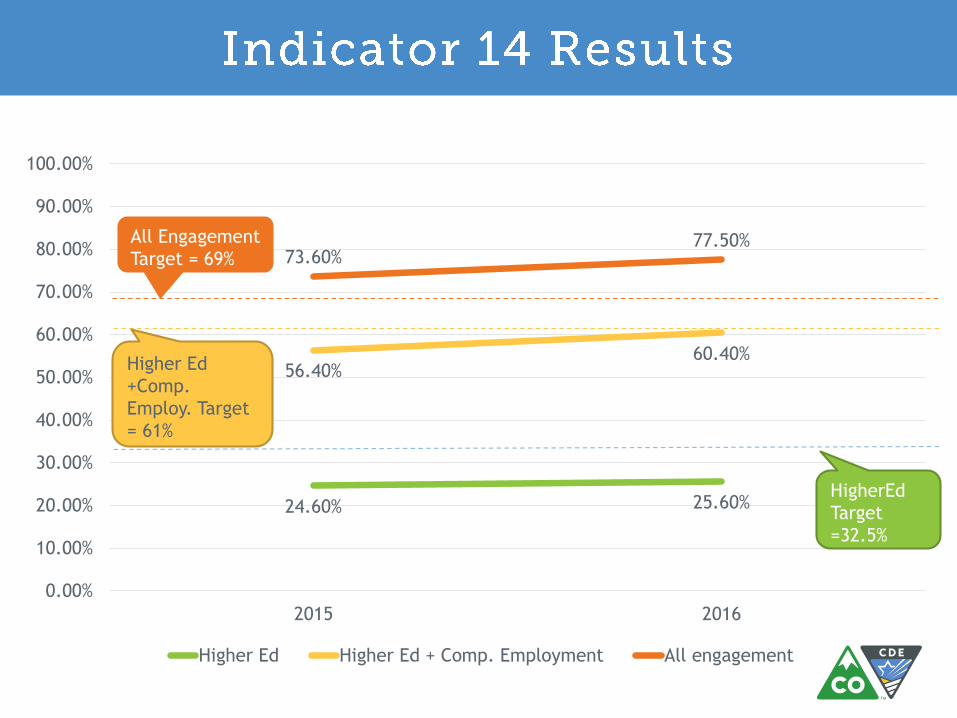
24.60% 25.60%
56.40%60.40%
73.60%77.50%
0.00%
10.00%
20.00%
30.00%
40.00%
50.00%
60.00%
70.00%
80.00%
90.00%
100.00%
2015 2016
Higher Ed Higher Ed + Comp. Employment All engagement
All Engagement
Target = 69%
Higher Ed
+Comp.
Employ. Target
= 61%
HigherEd
Target
=32.5%

Highed Ed25.6%
Competitive Employment
34.8%
Other Postsecondary Ed or
Training7.9%
Some Other Employment
9.2%
Not Engaged22.5%
Out of 1701
students who
participated in
the interview,
34.8% were
competitively
Employed!
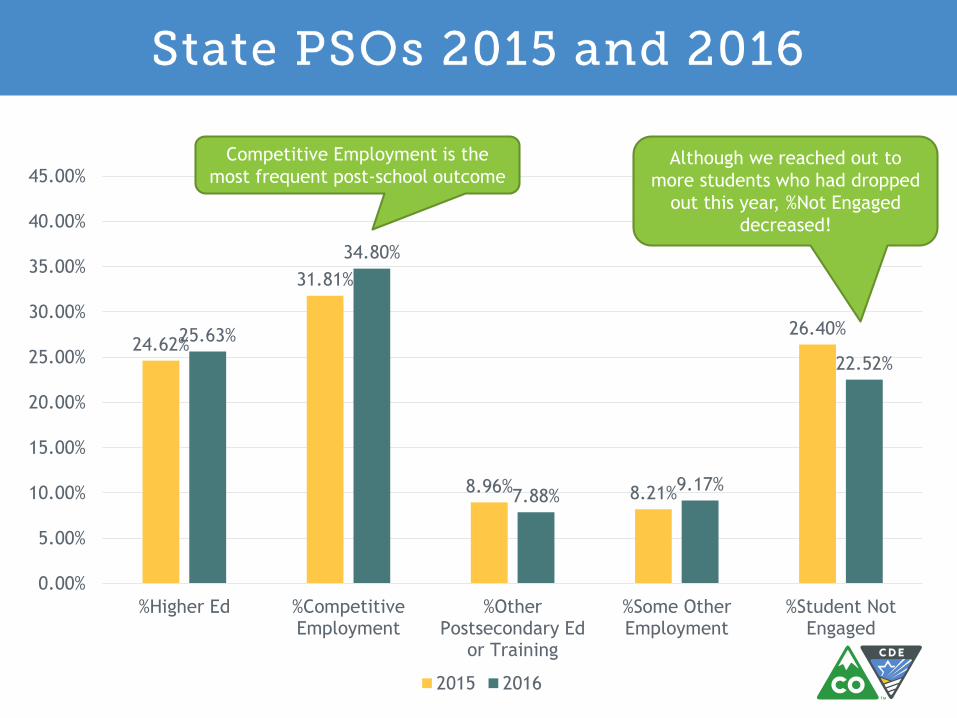
24.62%
31.81%
8.96% 8.21%
26.40%25.63%
34.80%
7.88%9.17%
22.52%
0.00%
5.00%
10.00%
15.00%
20.00%
25.00%
30.00%
35.00%
40.00%
45.00%
%Higher Ed %CompetitiveEmployment
%OtherPostsecondary Ed
or Training
%Some OtherEmployment
%Student NotEngaged
2015 2016
Competitive Employment is the
most frequent post-school outcomeAlthough we reached out to
more students who had dropped
out this year, %Not Engaged
decreased!

Higher Ed
Competitive
Employment
Some other
post-secondary
ed or training
Some other
employment
Not engaged
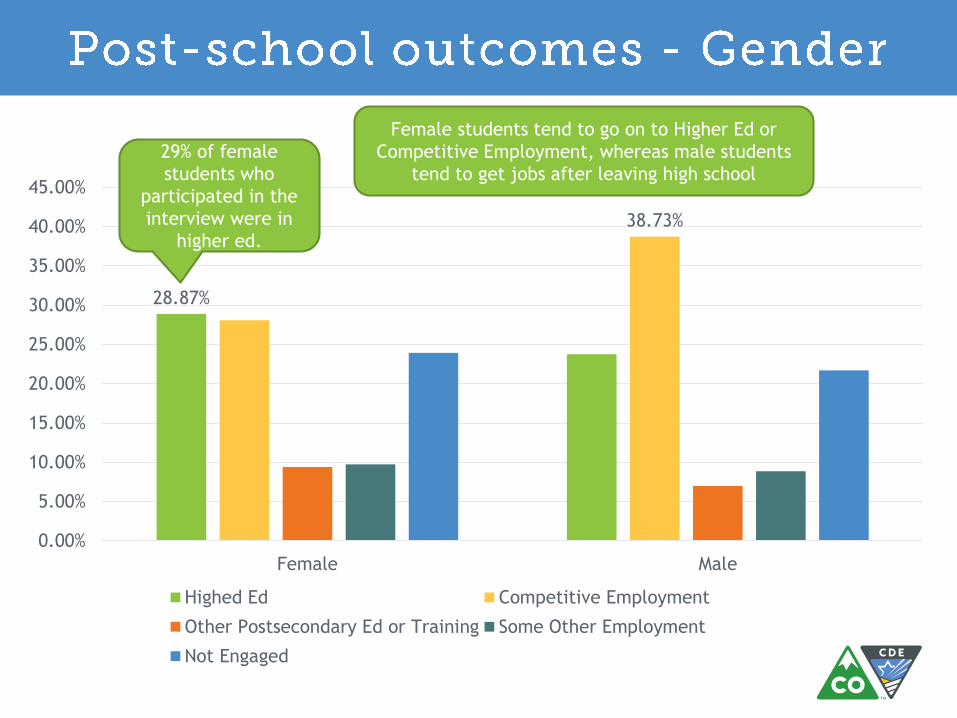
28.87%
38.73%
0.00%
5.00%
10.00%
15.00%
20.00%
25.00%
30.00%
35.00%
40.00%
45.00%
Female Male
Highed Ed Competitive Employment
Other Postsecondary Ed or Training Some Other Employment
Not Engaged
29% of female
students who
participated in the
interview were in
higher ed.
Female students tend to go on to Higher Ed or
Competitive Employment, whereas male students
tend to get jobs after leaving high school

38.30%
32.69%
40.18%
34.07%35.90%
0.00%
5.00%
10.00%
15.00%
20.00%
25.00%
30.00%
35.00%
40.00%
45.00%
White Hispanic Black Two or More OtherMinority
Highed Ed Competitive Employment
Other Postsecondary Ed or Training Some Other Employment
Not Engaged
Competitive Employment was the
most frequent outcome for White,
Hispanic, and black students
*"Other Minority" includes American Indian/Alaska Native, Asian, and Hawaiian/Pacific Islander
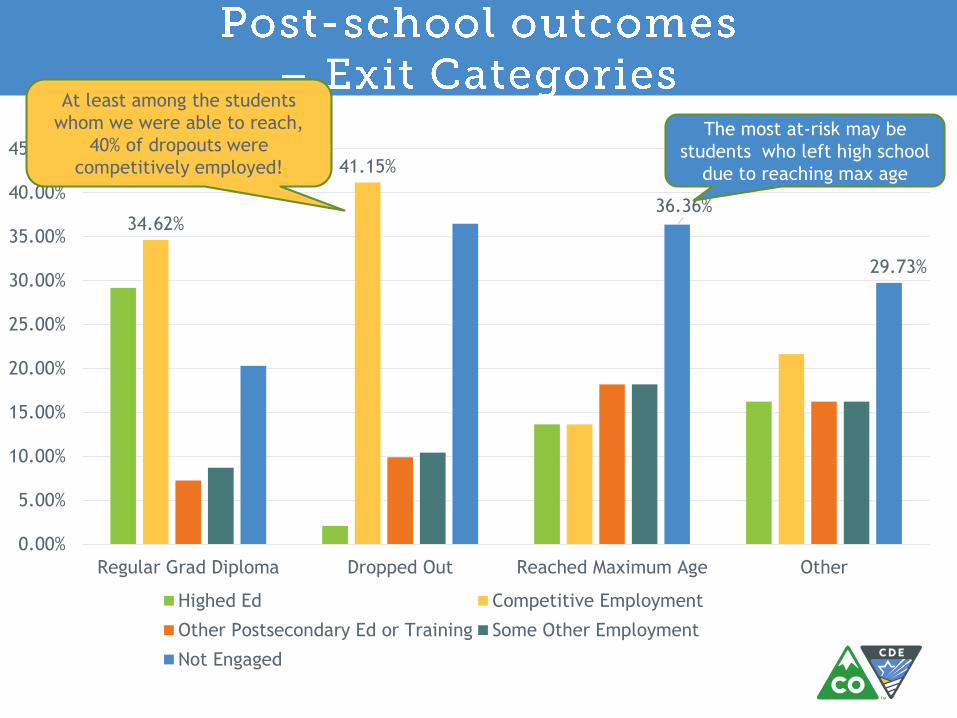
34.62%
41.15%
36.36%
29.73%
0.00%
5.00%
10.00%
15.00%
20.00%
25.00%
30.00%
35.00%
40.00%
45.00%
Regular Grad Diploma Dropped Out Reached Maximum Age Other
Highed Ed Competitive Employment
Other Postsecondary Ed or Training Some Other Employment
Not Engaged
At least among the students
whom we were able to reach,
40% of dropouts were
competitively employed!
The most at-risk may be
students who left high school
due to reaching max age

35.11%38.33%
32.26%
40.95% 40.61%
54.29%
40.79%
47.44%
0.00%
10.00%
20.00%
30.00%
40.00%
50.00%
60.00%
SeriousEmotionalDisability
SpecificLearningDisability
PhysicalDisability
Speech orLanguage
Impairment
AutismSpectrumDisorders
OtherHealth
Impairment
Other (HI,VI, DB, TBI,
OI)
ID or MD
Highed Ed Competitive Employment
Other Postsecondary Ed or Training Some Other Employment
Not Engaged
SED’s high non-
engagement rate might
be concerning
Most engaged among all disability
categories, with most exiters
going on to higher ed or
competitive employment

South Central BOCES
Southeastern BOCES
Montrose
Centennial BOCES
Lewis-Palmer
Cheyenne Mountain
Douglas
CSDB
Littleton
Elizabeth
Pueblo 70
Thompson
Fountain
Pikes Peak BOCES
Northeast Colorado BOCES
JeffCo
Widefield
Windsor
Cherry Creek
San Juan BOCES
Delta
Englewood
State
Aurora
Northglenn-Thornton
Pueblo 60
Poudre
Academy
Mountain BOCES
Boulder Valley
Mesa
Falcon
Eagle
Santa Fe Trail BOCES
Commerce City
Denver
Harrison
St. Vrain Valley
Greeley
Colorado SpringsWestminster
San Luis Valley BOCS
Fort Lupton/Keenesburg
Brighton
East Central BOCES
0.00%
10.00%
20.00%
30.00%
40.00%
50.00%
60.00%
70.00%
80.00%
0.00% 10.00% 20.00% 30.00% 40.00% 50.00% 60.00% 70.00% 80.00%
Em
plo
ym
ent
%
Enrollment %
Upper Triangle
Region of impossibility(Enrollment +Employment) <=
100%
Region of low
engagement(<40% of the participating
students are not engaged)
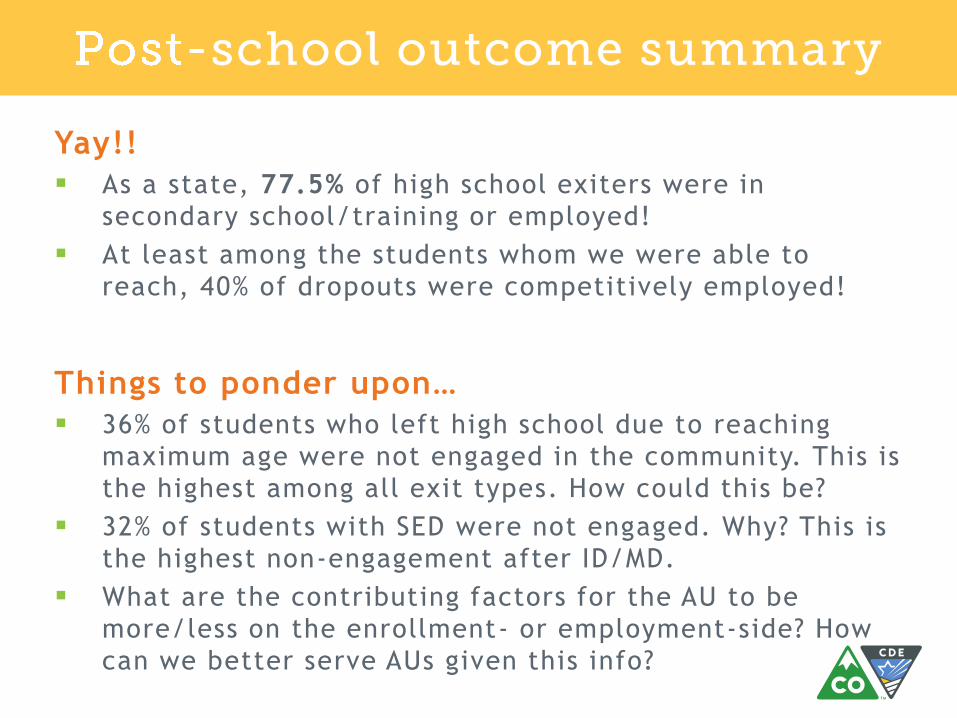
Yay!!
As a state, 77.5% of high school exiters were in
secondary school/training or employed!
At least among the students whom we were able to
reach, 40% of dropouts were competitively employed!
Things to ponder upon…
36% of students who left high school due to reaching
maximum age were not engaged in the community. This is
the highest among all exit types. How could this be?
32% of students with SED were not engaged. Why? This is
the highest non-engagement after ID/MD.
What are the contributing factors for the AU to be
more/less on the enrollment- or employment-side? How
can we better serve AUs given this info?
Post-school Outcome Interview 2016

N/A (The student did
not need these
agencies/services)
No
Yes
No: the student did not
participate in the
agencies/services,
even though he/she
needed them.
Yes: the student
participated in the
agencies/services.
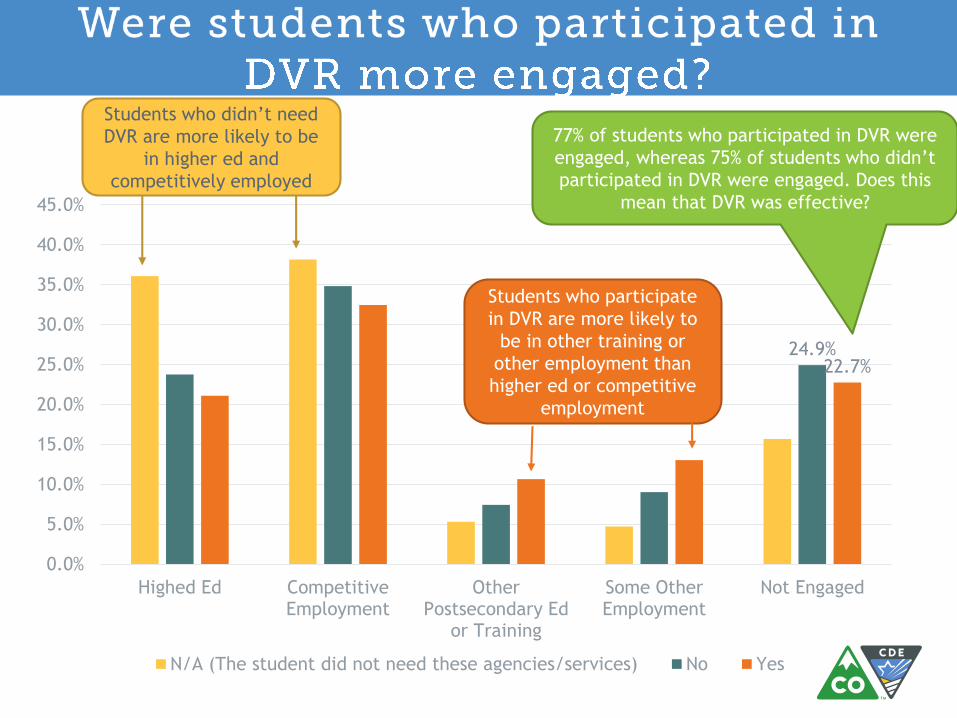
24.9%22.7%
0.0%
5.0%
10.0%
15.0%
20.0%
25.0%
30.0%
35.0%
40.0%
45.0%
Highed Ed CompetitiveEmployment
OtherPostsecondary Ed
or Training
Some OtherEmployment
Not Engaged
N/A (The student did not need these agencies/services) No Yes
Students who didn’t need
DVR are more likely to be
in higher ed and
competitively employed
Students who participate
in DVR are more likely to
be in other training or
other employment than
higher ed or competitive
employment
77% of students who participated in DVR were
engaged, whereas 75% of students who didn’t
participated in DVR were engaged. Does this
mean that DVR was effective?

0.0%
10.0%
20.0%
30.0%
40.0%
50.0%
60.0%
70.0%
SeriousEmotionalDisability
SpecificLearningDisability
PhysicalDisability
Speech orLanguage
Impairment
AutismSpectrumDisorders
OtherHealth
Impairment
Other (HI,VI, DB, TBI,
OI)
ID or MD
N/A (The student did not need these agencies/services) No Yes
Autism, ID/MD and “other” are
more likely to participate in
adult agencies.

0.0%
10.0%
20.0%
30.0%
40.0%
50.0%
60.0%
70.0%
80.0%
SeriousEmotionalDisability
SpecificLearningDisability
PhysicalDisability
Speech orLanguage
Impairment
AutismSpectrumDisorders
OtherHealth
Impairment
Other (HI,VI, DB, TBI,
OI)
ID or MD
N/A (The student did not need these agencies/service due to on-time graduation) No Yes
Students with SLI are
least likely to receive
the 18-21 services
Autism, ID/MD and “other” are
more likely to participate in
adult agencies.

If you’d like to chat about any of the following;
the PSO interview contents
Secondary transition
Increasing graduation and decreasing dropout
How to engaged students in the community after
they exit high school
Contact the ESSU Secondary Transition Team!!
Gail Lott [email protected]
Gloria Howell [email protected]
Katie Oliver [email protected]
If you’d like to chat about the PSO data, please
contact Miki Imura ([email protected])