status and outlook for shale gas and tight oil …. energy information administration independent...
TRANSCRIPT
www.eia.gov U.S. Energy Information Administration Independent Statistics & Analysis
Status and outlook for shale gas and tight oil development in the U.S.
for Energy Symposium, University of Oklahoma, Price College Energy Institute March 05, 2013 | Norman, OK by Adam Sieminski, Administrator

EIA’s mission and main functions
Adam Sieminski , Energy Symposium, March 05, 2013 2
Independent Statistical and Analytical agency within the U.S. Department of Energy
– EIA collects, analyzes, and disseminates independent and impartial energy information to promote sound policymaking, efficient markets, and public understanding of energy and its interaction with the economy and the environment.
– By law, its data, analyses, and forecasts are independent of approval by any other officer or employee of the U.S. Government
[EIA] …is the gold standard for energy data around the world, and the accessibility of it is so much greater than other places – Dan Yergin, Platts Inside Energy
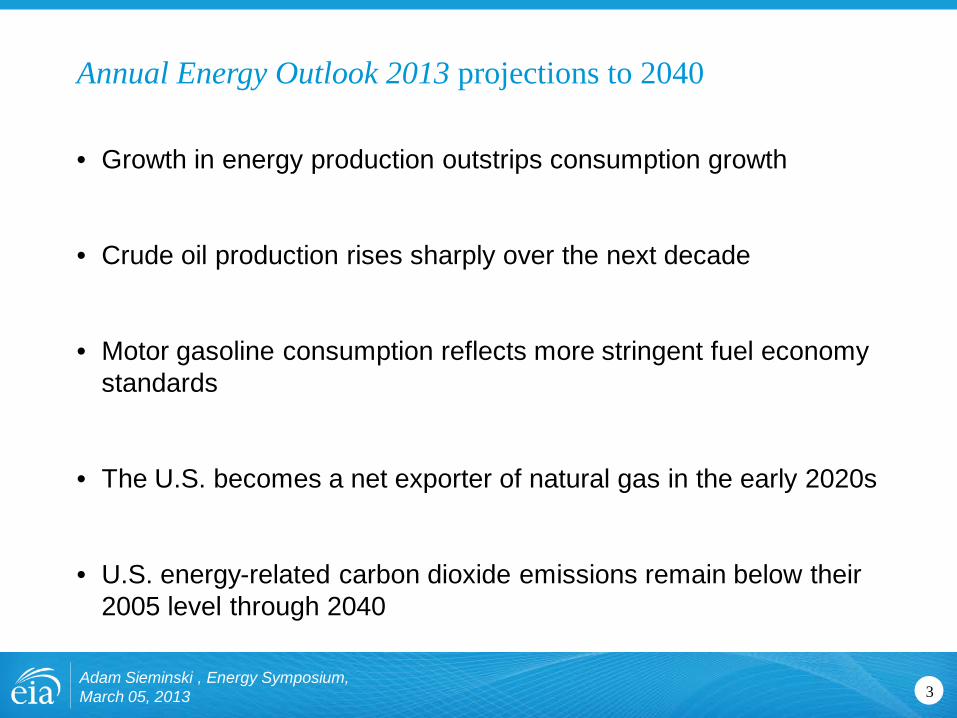
Annual Energy Outlook 2013 projections to 2040
Adam Sieminski , Energy Symposium, March 05, 2013 3
• Growth in energy production outstrips consumption growth
• Crude oil production rises sharply over the next decade
• Motor gasoline consumption reflects more stringent fuel economy standards
• The U.S. becomes a net exporter of natural gas in the early 2020s
• U.S. energy-related carbon dioxide emissions remain below their 2005 level through 2040

U.S. energy use grows slowly over the projection reflecting improving energy efficiency and slow, extended economic recovery
4
0
20
40
60
80
100
120
1980 1985 1990 1995 2000 2005 2010 2015 2020 2025 2030 2035 2040
U.S. primary energy consumption quadrillion Btu
Adam Sieminski , Energy Symposium, March 05, 2013
History Projections 2011
36%
20%
26%
8% 8%
1%
32%
28%
19%
11%
9% 2%
Shares of total U.S. energy
Nuclear
Oil and other liquids
Liquid biofuels
Natural gas
Coal
Renewables (excluding liquid biofuels)
2000
23%
39%
24%
6% 8%
Source: EIA, Annual Energy Outlook 2013 Early Release

U.S. Shale Gas
5 Adam Sieminski , Energy Symposium, March 05, 2013

Theory Experiment Practice
These three drivers impact resource estimation metrics differently over time in an iterative process
Adam Sieminski , Energy Symposium, March 05, 2013 6
Geology
Technology
Economics
Resources in Place
Technically Recoverable Resources (TRR)
Economically Recoverable Resources (ERR)
Well-level data, incl. estimated ultimate recovery (EUR)
Thermal maturity Pressure Formation depth
Drilling costs Recompletions
Price of gas
P
Q

Adam Sieminski , Energy Symposium, March 05, 2013 7
• average initial production (IP) rate per well
• average decline curve (can vary by region and vintage)
• IP & decline curve define the Estimated Ultimate Recovery (EUR) per well
Other parameters
• drilling and operating costs
• number of active rigs
• how many wells a rig can drill (rig efficiency)
• well spacing
EIA’s focus is on the timing of production; the modeling focuses on these parameters

Technically recoverable natural gas resources reflect new information, a combination of assessments and EIA updates
8
U.S. dry gas resources trillion cubic feet
Source: EIA, Annual Energy Outlook 2013 Early Release AEO Edition
0
500
1000
1500
2000
2500
3000
2000 2005 2006 2007 2008 2009 2010 2011 2012 2013
2,327
304
543
1,479
*Alaska resource estimates prior to AEO2009 reflect resources from the North Slope that were not included in previously published documentation.
Unproved shale gas Unproved other gas (including Alaska* and offshore) Proved reserves (all types and locations)
Benchmark to USGS
2011 Marcellus Assessment
Adam Sieminski , Energy Symposium, March 05, 2013

U.S. wet natural gas proved reserves, 1980-2010
Adam Sieminski , Energy Symposium, March 05, 2013 9
trillion cubic feet
Source: U.S. Energy Information Administration
0
50
100
150
200
250
300
350
1980 1983 1986 1989 1992 1995 1998 2001 2004 2007 2010
U.S. Total
Lower 48 Onshore
Federal Offshore
Alaska

Adam Sieminski , Energy Symposium, March 05, 2013 10
EIA fits well production data to hyperbolic decline curves to estimate EUR
1985 vertical well
EUR=1.41 bcf
2004 vertical well EUR=0.46 bcf
2011 horizontal well EUR=1.76 bcf
Classic hyperbolic decline curve (Arps 1945):
Source: HPDI data from horizontal wells in the Newark East field in the Barnett Shale; EIA analysis
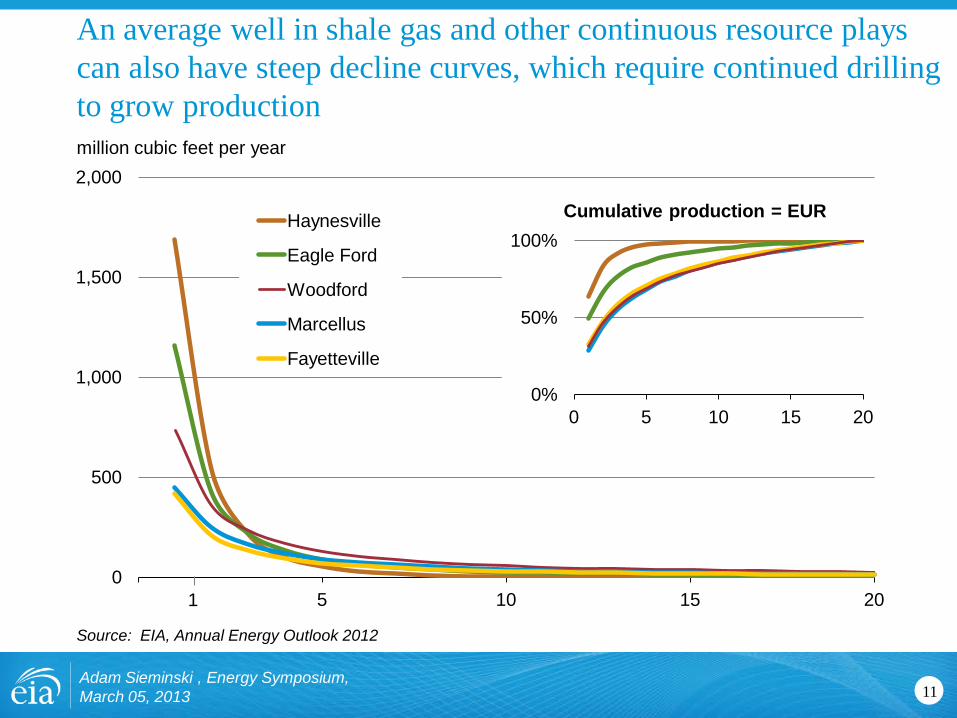
An average well in shale gas and other continuous resource plays can also have steep decline curves, which require continued drilling to grow production
11
0
500
1,000
1,500
2,000
0 5 10 15 20
Haynesville
Eagle Ford
Woodford
Marcellus
Fayetteville
million cubic feet per year
Source: EIA, Annual Energy Outlook 2012
1
0%
50%
100%
0 5 10 15 20
Cumulative production = EUR
Adam Sieminski , Energy Symposium, March 05, 2013

For example: Oil production by monthly vintage of wells in the Williston Basin
12
Source: DrillingInfo history through August 2012, EIA Short-Term Energy Outlook, February 2013 forecast
Adam Sieminski , Energy Symposium, March 05, 2013

Domestic production of shale gas has grown dramatically over the past few years
13
0
5
10
15
20
25
30
2000 2002 2004 2006 2008 2010 2012
Rest of US
Marcellus
Haynesville
Eagle Ford
Bakken
Woodford
Fayetteville
Barnett
Antrim
shale gas production (dry) billion cubic feet per day
Sources: LCI Energy Insight gross withdrawal estimates as of December 2012 and converted to dry production estimates with EIA-calculated average gross-to-dry shrinkage factors by state and/or shale play.
Adam Sieminski , Energy Symposium, March 05, 2013
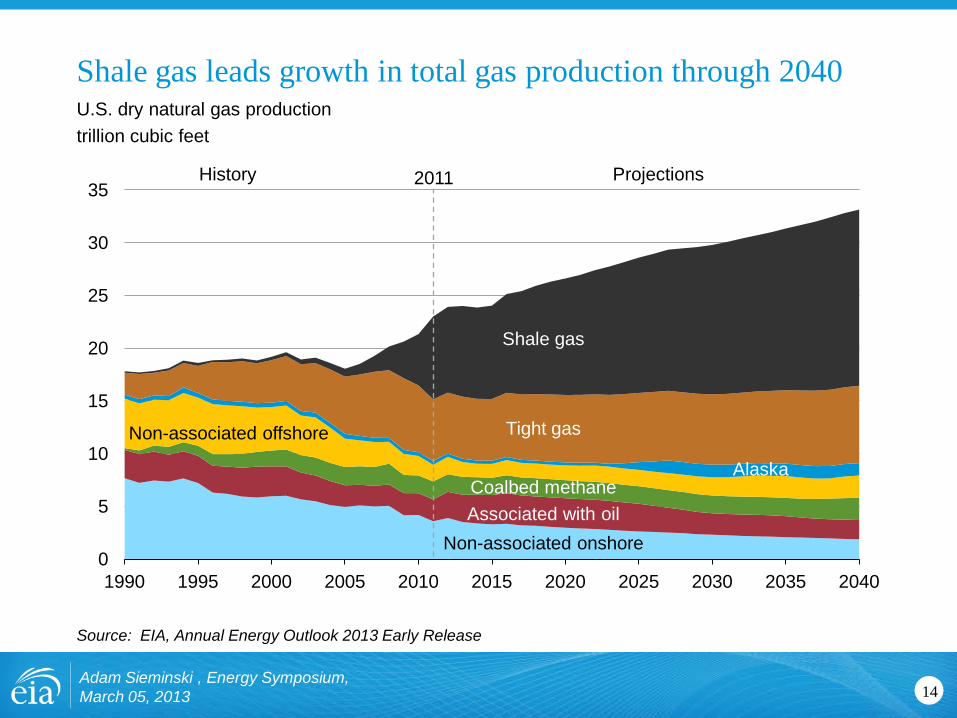
Shale gas leads growth in total gas production through 2040
14
U.S. dry natural gas production trillion cubic feet
Source: EIA, Annual Energy Outlook 2013 Early Release
0
5
10
15
20
25
30
35
1990 1995 2000 2005 2010 2015 2020 2025 2030 2035 2040
Associated with oil Coalbed methane
Tight gas
Shale gas
Alaska
Non-associated onshore
Non-associated offshore
Projections History 2011
Adam Sieminski , Energy Symposium, March 05, 2013

15
0
5
10
15
20
25
30
35
2005 2011 2020 2025 2030 2035 2040
U.S. dry gas consumption trillion cubic feet
Source: EIA, Annual Energy Outlook 2013 Early Release
Projections History
Industrial*
Electric power
Commercial
Residential
Transportation**
33%
14%
6%
32%
12%
33%
19%
3%
31%
13%
*Includes combined heat-and-power and lease and plant fuel. **Includes pipeline fuel.
Gas to liquids 2%
Natural gas consumption is quite dispersed with electric power, industrial, and transportation use driving future demand growth
Adam Sieminski , Energy Symposium, March 05, 2013

0.0
0.5
1.0
1.5
2.0
2.5
3.0
1995 2000 2005 2010 2015 2020 2025 2030 2035 2040
Growth of natural gas in transportation led by heavy duty trucks (LNG) and gas to liquids (diesel)… marine and rail to come?
16
U.S. natural gas consumption quadrillion Btu
Pipeline fuel
Light-duty vehicles
2011 History Projections
95%
3%
1%
1%
28%
38%
3%
31%
1% Buses
Freight trucks
Gas to liquids
Note: Gas to liquids includes heat, power, and losses. Source: EIA, Annual Energy Outlook 2013 Early Release
Adam Sieminski , Energy Symposium, March 05, 2013
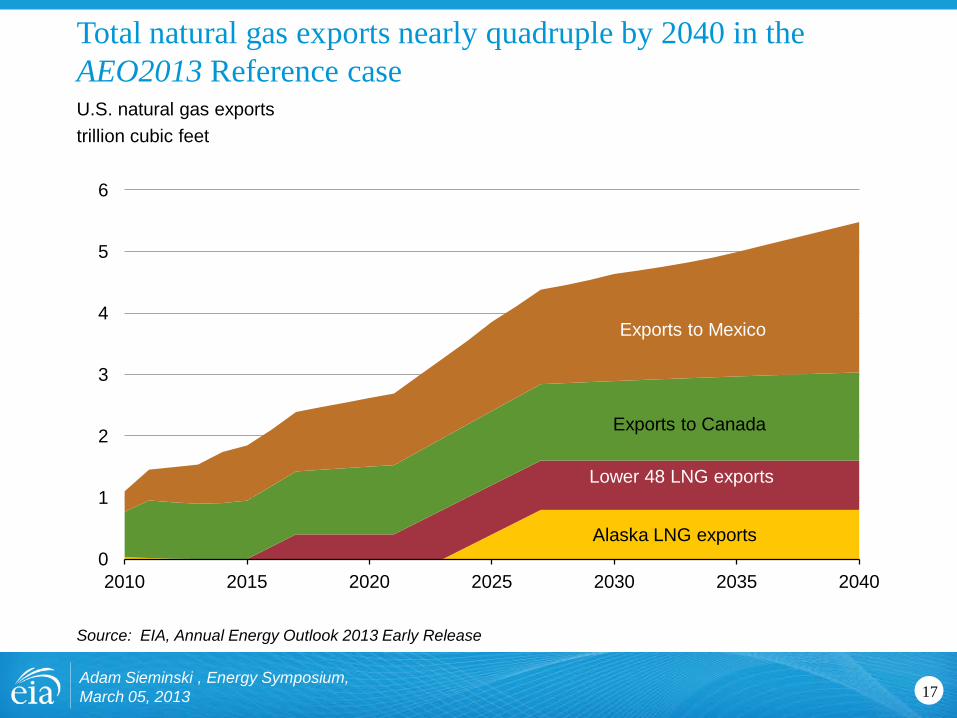
Total natural gas exports nearly quadruple by 2040 in the AEO2013 Reference case
17
U.S. natural gas exports trillion cubic feet
Source: EIA, Annual Energy Outlook 2013 Early Release
0
1
2
3
4
5
6
2010 2015 2020 2025 2030 2035 2040
Alaska LNG exports
Exports to Mexico
Exports to Canada
Lower 48 LNG exports
Adam Sieminski , Energy Symposium, March 05, 2013

Domestic natural gas production grows faster than consumption and the U.S. becomes a net exporter of natural gas around 2020
18
-5
0
5
10
15
20
25
30
35
1990 1995 2000 2005 2010 2015 2020 2025 2030 2035 2040
U.S. dry gas trillion cubic feet
Source: EIA, Annual Energy Outlook 2013 Early Release
Projections History 2011
Consumption
Domestic supply
Net imports
Adam Sieminski , Energy Symposium, March 05, 2013

U.S. Tight Oil
19 Adam Sieminski , Energy Symposium, March 05, 2013

20
U.S. crude oil and lease condensate resources in non-prohibited areas billion barrels
(1) The USGS reduced NPR-A resource estimates, which is responsible for the lower AEO2013 Alaska resources. (2) Prior to AEO2009, resources in Pacific, Atlantic, and Eastern GOM OCS were under moratoria and not included. (3) Includes shale oil. Prior to AEO2011, tight oil is included in unproved other lower-48 onshore category.
Multiple factors have contributed to U.S. crude oil resource estimate increases over the years, with tight oil contributing recently
Source: EIA, Annual Energy Outlook 2013 Early Release
0
50
100
150
200
250
2000 2001 2002 2003 2004 2005 2006 2007 2008 2009 2010 2011 2012 2013 Year of Annual Energy Outlook
Unproved Alaska (1) Unproved L48 Offshore (2) Unproved Tight Oil (3) Unproved Tight Oil (reclassified from onshore) Unproved Other L48 Onshore Proved Reserves
23.8
48.6
41.6
16.5
67.0
25.2
222.6
Adam Sieminski , Energy Symposium, March 05, 2013

U.S. crude oil plus condensate proved reserves, 1980-2010
Adam Sieminski , Energy Symposium, March 05, 2013 21
billion barrels
Source: U.S. Energy Information Administration
0
5
10
15
20
25
30
35
1980 1983 1986 1989 1992 1995 1998 2001 2004 2007 2010
U.S. Total
Lower 48 Onshore
Federal Offshore
Alaska

Domestic production of tight oil has grown dramatically over the past few years
22
tight oil production for select plays million barrels per day
0.0
0.2
0.4
0.6
0.8
1.0
1.2
1.4
1.6
1.8
2.0
2000 2002 2004 2006 2008 2010 2012
Eagle Ford
Bakken
Granite Wash
Bonespring
Monterey
Woodford
Niobrara-Codell
Spraberry
Austin Chalk
Source: Drilling Info (formerly HPDI), Texas RRC, North Dakota department of mineral resources, and EIA, through August 2012
Adam Sieminski , Energy Symposium, March 05, 2013

U.S. tight oil production leads a growth in domestic production of 2.6 million barrels per day between 2008 and 2019
23
U.S. crude oil production million barrels per day
Source: EIA, Annual Energy Outlook 2013 Early Release and Short-Term Energy Outlook, February 2013
0
2
4
6
8
1990 1995 2000 2005 2010 2015 2020 2025 2030 2035 2040
Projections History 2011
Alaska
Tight oil
Other lower 48 onshore
Lower 48 offshore
STEO Feb. 2013 U.S. crude oil projection
Adam Sieminski , Energy Symposium, March 05, 2013

U.S. petroleum product exports exceeded imports in 2011 for first time in over six decades
24
annual U.S. net exports of total petroleum products, 1949 – 2011 million barrels per day
Source: EIA, Petroleum Supply Monthly
-4
-3
-2
-1
0
1
2
3
4
1949 1955 1961 1967 1973 1979 1985 1991 1997 2003 2009
imports
exports
net exports
net product exporter
Adam Sieminski , Energy Symposium, March 05, 2013

U.S. dependence on imported liquids depends on both supply and demand
25
U.S. liquid fuel supply million barrels per day
Source: EIA, Annual Energy Outlook 2013 Early Release
0
5
10
15
20
25
1970 1975 1980 1985 1990 1995 2000 2005 2010 2015 2020 2025 2030 2035 2040
Consumption
Domestic supply
Net imports 45%
37%
Projections History 2011
60%
2005
Adam Sieminski , Energy Symposium, March 05, 2013

Light-duty vehicle liquids consumption is lower primarily due to more stringent CAFE standards
Adam Sieminski , Energy Symposium, March 05, 2013 26
0
2
4
6
8
10
2010 2015 2020 2025 2030 2035 2040
light-duty vehicle liquids consumption million barrels per day
Source: EIA, Annual Energy Outlook 2013 Early Release
AEO2012
AEO2013

Reference case oil price initially drops and then rises steadily, but there is uncertainty about the future trajectory
27
0
50
100
150
200
250
1980 1985 1990 1995 2000 2005 2010 2015 2020 2025 2030 2035 2040
Annual average spot price of Brent crude oil 2011 dollars per barrel
Projections History 2011
High Oil Price
Low Oil Price
Reference
Source: EIA, Annual Energy Outlook 2013 Early Release
Adam Sieminski , Energy Symposium, March 05, 2013

Global liquids supply increases 26 percent with regional market shares relatively stable
28
0
20
40
60
80
100
120
1990 1995 2000 2005 2010 2015 2020 2025 2030 2035 2040
Global liquids supply million barrels per day
Source: EIA, Annual Energy Outlook 2013 Early Release
Projections History 2011
OPEC
Other non-OECD
OECD
44%
25%
31%
40%
26%
34%
Adam Sieminski , Energy Symposium, March 05, 2013

Global tight oil production comparisons
29
Source: Preliminary International Energy Outlook 2013, BP Energy Outlook 2030
0
2
4
6
8
10
12
2000 2010 2020 2030
Australia China Russia Argentina Mexico Canada United States
million barrels per day
BP Energy Outlook 2030 IEO2013 DRAFT
Adam Sieminski , Energy Symposium, March 05, 2013

Uncertainties that could slow global growth of shale gas and tight oil
Adam Sieminski , Energy Symposium, March 05, 2013 30
• Resource quantities and distribution
• Surface vs. mineral rights
• Risk appetite of industry participants
• Infrastructure and technology
• Environmental constraints

Changing electricity generation mix in AEO2012 reference case and carbon fee allowance side cases
31
0
1
2
3
4
5
1990 2005 2020 2035 0
1
2
3
4
5
1990 2005 2020 2035 0
1
2
3
4
5
1990 2005 2020 2035
U.S. electricity net generation trillion kilowatthours
Source: EIA, Annual Energy Outlook 2012
Natural gas
2012 Reference Case $15 Carbon Fee $25 Carbon Fee
Renewables
Nuclear
Coal
Natural gas Natural gas
Renewables
Renewables Nuclear
Nuclear Coal
Coal
2010
24%
10%
20%
45%
28%
15%
18%
38%
34%
22%
27%
16%
34%
23%
38%
4%
Adam Sieminski , Energy Symposium, March 05, 2013

Coal and Electricity
32 Adam Sieminski , Energy Symposium, March 05, 2013

Growth in electricity use slows, but still increases by 28% from 2012 to 2040
33
U.S. electricity use percent growth (3-year rolling average)
Source: EIA, Annual Energy Outlook 2013 Early Release
0
2
4
6
8
10
12
14
1950 1960 1970 1980 1990 2000 2010 2020 2030 2040
Projections
History 2011
Period Annual Growth 1950s 9.8 1960s 7.3 1970s 4.7 1980s 2.9 1990s 2.4 2000-2011 0.9 2012-2040 0.9
Adam Sieminski , Energy Symposium, March 05, 2013
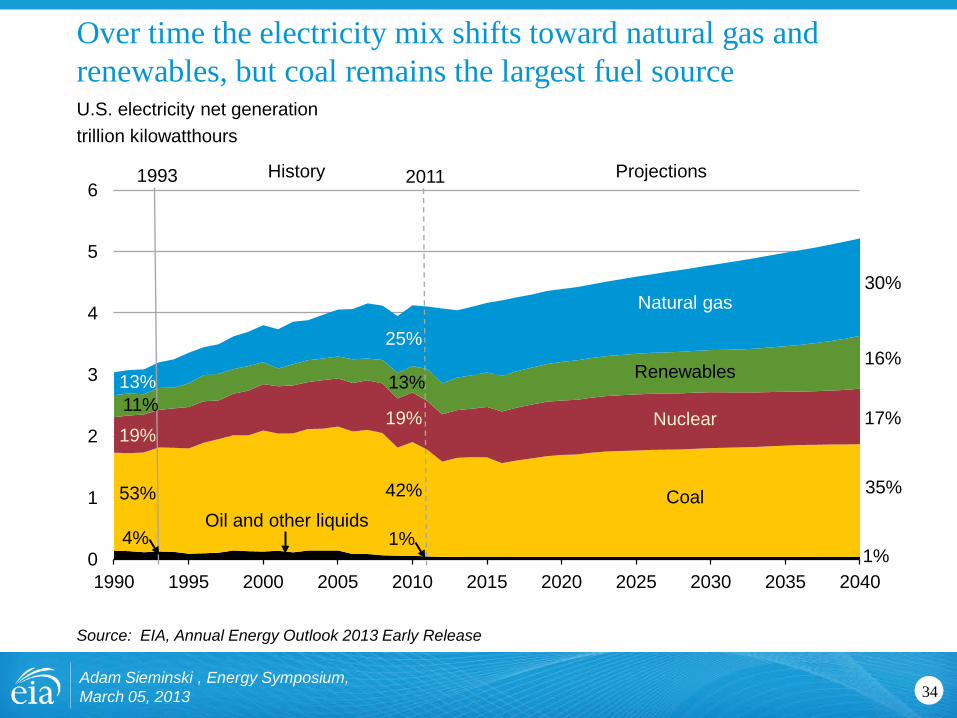
Over time the electricity mix shifts toward natural gas and renewables, but coal remains the largest fuel source
34
0
1
2
3
4
5
6
1990 1995 2000 2005 2010 2015 2020 2025 2030 2035 2040
U.S. electricity net generation trillion kilowatthours
25%
19%
42%
13%
1%
Nuclear
Oil and other liquids
Natural gas
Coal
Renewables
2011 Projections History
17%
16%
35%
30%
1%
1993
53%
13%
19% 11%
4%
Source: EIA, Annual Energy Outlook 2013 Early Release
Adam Sieminski , Energy Symposium, March 05, 2013
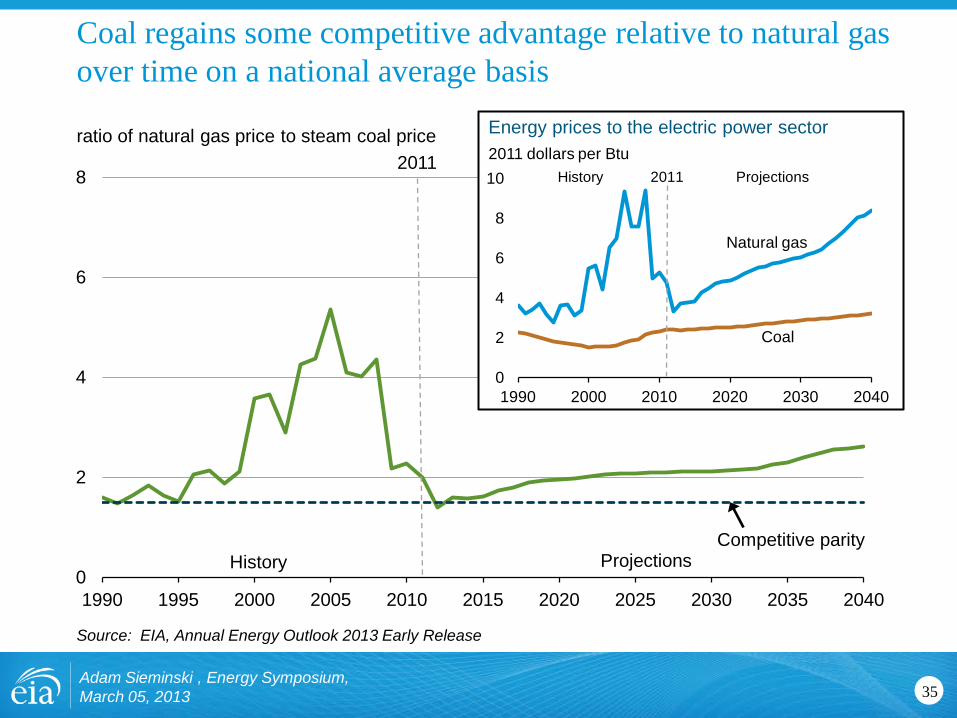
Coal regains some competitive advantage relative to natural gas over time on a national average basis
35
0
2
4
6
8
1990 1995 2000 2005 2010 2015 2020 2025 2030 2035 2040
ratio of natural gas price to steam coal price
Source: EIA, Annual Energy Outlook 2013 Early Release
0
2
4
6
8
10
1990 2000 2010 2020 2030 2040
History Projections
2011 2011 dollars per Btu
History Projections 2011
Competitive parity
Energy prices to the electric power sector
Coal
Natural gas
Adam Sieminski , Energy Symposium, March 05, 2013
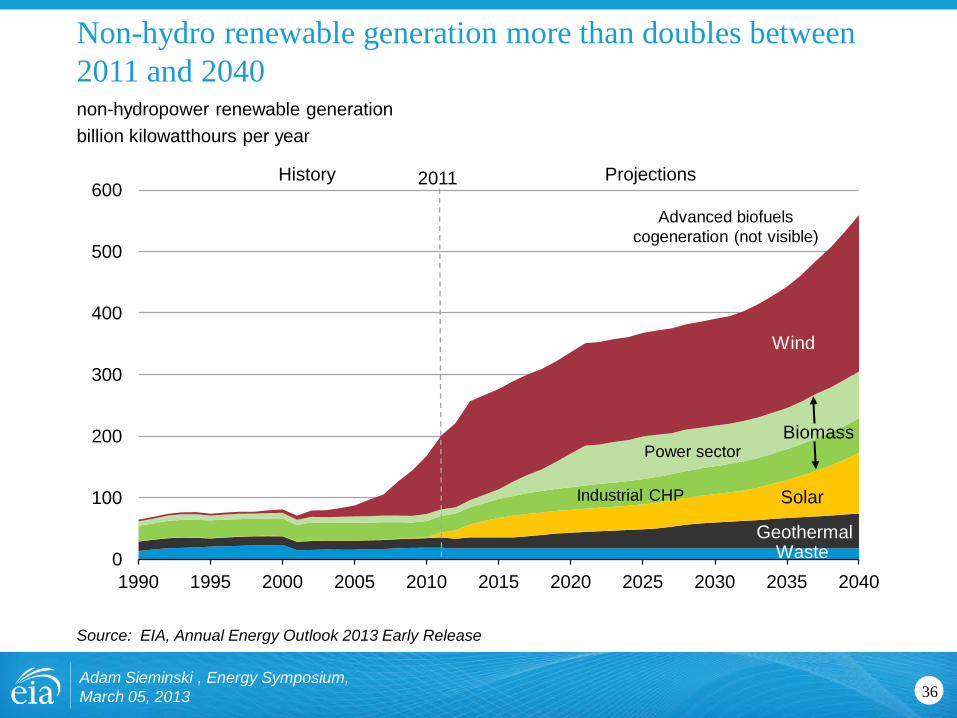
Non-hydro renewable generation more than doubles between 2011 and 2040
36
non-hydropower renewable generation billion kilowatthours per year
Source: EIA, Annual Energy Outlook 2013 Early Release
0
100
200
300
400
500
600
1990 1995 2000 2005 2010 2015 2020 2025 2030 2035 2040
Wind
Solar
Geothermal Waste
Biomass
Industrial CHP
Power sector
Advanced biofuels cogeneration (not visible)
2011 Projections History
Adam Sieminski , Energy Symposium, March 05, 2013
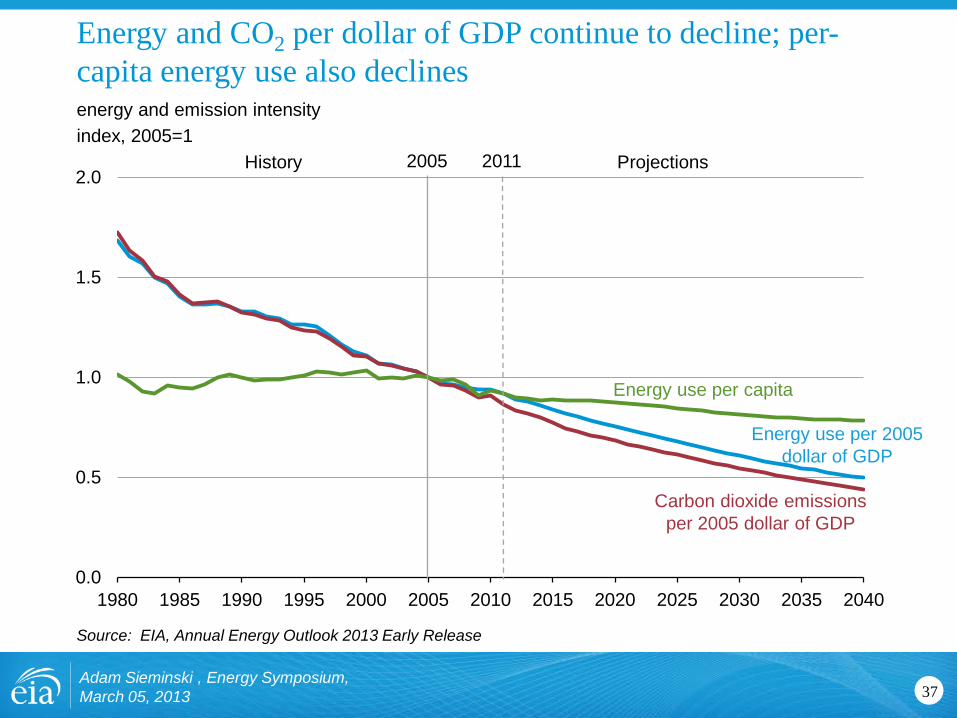
Energy and CO2 per dollar of GDP continue to decline; per-capita energy use also declines
Adam Sieminski , Energy Symposium, March 05, 2013 37
0.0
0.5
1.0
1.5
2.0
1980 1985 1990 1995 2000 2005 2010 2015 2020 2025 2030 2035 2040
energy and emission intensity index, 2005=1
Source: EIA, Annual Energy Outlook 2013 Early Release
History Projections 2011
Carbon dioxide emissions per 2005 dollar of GDP
Energy use per 2005 dollar of GDP
Energy use per capita
2005

In the AEO2013 Reference case, energy-related CO2 emissions never get back to their 2005 level
38
carbon dioxide emissions billion metric tons
Source: EIA, Annual Energy Outlook 2013 Early Release
0
1
2
3
4
5
6
7
1990 1995 2000 2005 2010 2015 2020 2025 2030 2035 2040
Projections History 2011 2005
2005 2020 2040 (billion metric tons)
6.00 5.45 5.69
- - -9.0% -5.1%
(percent change from 2005)
AEO2013
Adam Sieminski , Energy Symposium, March 05, 2013

For more information
39
U.S. Energy Information Administration home page | www.eia.gov
Annual Energy Outlook | www.eia.gov/forecasts/aeo
Short-Term Energy Outlook | www.eia.gov/forecasts/steo
International Energy Outlook | www.eia.gov/forecasts/ieo
Today In Energy | www.eia.gov/todayinenergy
Monthly Energy Review | www.eia.gov/totalenergy/data/monthly
Annual Energy Review | www.eia.gov/totalenergy/data/annual
Energy Kids | www.eia.gov/kids
Adam Sieminski , Energy Symposium, March 05, 2013