structure, conduct and performance of the rice market and...
TRANSCRIPT

Structure, Conduct and Performance
of the Rice Market and the Impact
of Technological Changes in Milling
The study conducted by:
Institute of Agribusiness and Development Studies (IADS)
Bangladesh Agricultural University, Mymensingh
Principal Investigator:
Professor Dr. Shankar Kumar Raha Department of Agribusiness and Marketing
Co-Investigators:
Md. Moniruzzaman
Department of Agribusiness and Marketing
Professor Dr. Md. Monjurul Alam Department of Farm Power and Machinery
Dr. M. A. Awal Bangladesh Agricultural Research Council
This study was carried out with the support of the
National Food Policy Capacity Strengthening Programme
June 2013 [Type
a
quote
from
the
docu
ment
or the

This study was financed under the Research Grants Scheme (RGS) of the
National Food Policy Capacity Strengthening Programme (NFPCSP) Phase
II. The purpose of the RGS is to support studies that directly address the
policy research needs identified by the Food Planning and Monitoring Unit
of the Ministry of Food. The NFPCSP is being implemented by the Food and
Agriculture Organization of the United Nations (FAO) and the Food
Planning and Monitoring Unit (FPMU), Ministry of Food with the financial
support of EU and USAID.
The designation and presentation of material in this publication do not imply
the expression of any opinion whatsoever on the part of FAO nor of the
NFPCSP, Government of Bangladesh, EU or USAID and reflects the sole
opinions and views of the authors who are fully responsible for the contents,
findings and recommendations of this report.

iii
Contents
Executive summary ix Table of content iii List of table vi List of figure vi List of map vii List of box vii Annex vii
Table of Contents
Page Section I Introduction 1 1.1 Focus of the study 1 1.2 Objectives 2 1.3 Key research questions 2
Section II Literature review 3 2.1 Introduction 3 2.2 Spatial market integration 3 2.3 Competitiveness of rice markets 6 2.4 Policy issues 7
Section III Methodology and data sources 10 3.1 Sample, sampling and data collection 10 3.2 Analysis of data sets 12 3.2.1 Measurement of market concentration 12 3.2.1.1 Concentration Ratio: 12 3.2.1.2 Entropy Index 13 3.2.1.3 Gini Coefficient 13 3.2.2 Assessment of financial viability 13 3.2.3 Calculation of marketing costs and margins 14 3.2.4 Market integration 14 3.2.4.1 Unit root tests for stationary 15 3.2.4.2 Test for market Cointegration 15 3.2.5 Construction of a map of rice surplus/deficit at Zila level 16 3.3 Stakeholder consultations 16
Section IV Overview of the rice marketing system 17 4.1 Introduction 17 4.2 Public sector 17
iv
4.3 Private sector 17 4.4 Marketing functions involved in rice marketing 18 4.5 Marketing channels 18 4.6 Classification of markets 19 4.7 Processing sector 19
4.8 Structure, conduct and performance of rice market/ industry 20 4.8.1 Market structure 21 4.8.2 Market conduct 21 4.8.3 Market performance 21 4.9 Summary of the lessons learned from overview of literature 22
Section V Structure, conduct and performance of rice market in Bangladesh
23
5.1 Paddy market 23 5.2 Paddy trader 23 5.3 Description of paddy traders 24 5.3.1 Faria and Bepari 24 5.3.2 Aratdar cum-wholesaler 24 5.3.3 Rice Miller 24 5.3.4 Paddy processor 25 5.4 Structure of paddy market 25
5.4.1 Concentration 25 5.4.2 Entry barriers 25 5.4.3 Degree of product differentiation 26 5.4.4 Distribution of market information 26 5.4.5 Conduct at paddy market 26 5.4.5.1 Price setting 26 5.4.5.2 Product policy 27 5.4.5.3 Sales promotion policy 27 5.5 Some basic information of rice mill 28 5.5.1 Mill area 28 5.5.2 Variety of paddy processed by mills 28 5.6 Rice traders 28 5.6.1 Variety of rice handled 28 5.6.2 Loyalty to sellers 29 5.7 Marketing channel 29 5.8 Market structure, conduct and performance of rice milling industry 30
5.8.1 Concentration 31 5.8.2 Product differentiation 31 5.8.3 Condition of entry 32 5.8.3.1 Possibility of new entry within 3 to 5 years 34 5.8.3.2 Upscale of the existing mills 34 5.8.4 Market conduct 35 5.8.4.1 Price Policies 35
v
5.8.4.2 Product Policy 35 5.8.4.3 Policies aimed at coercing rivals 35 5.8.4.4 Mode of rice sale 35 5.8.4.5 Access to credit 36 5.8.5 Performance 36 5.8.5.1 Capacity utilization of the mill 36 5.8.5.2 Size of selling costs 37 5.8.5.3 Product quality 37 5.8.5.4 Progressiveness of the industry 37 5.8.5.5 Employment position 38 5.8.5.6 Discrimination by sex 38 5.8.5.7 Use of by-products of rice milling 39 5.8.6 Lessons learned / Conclusion 39
Section VI Impact of Technological Changes in Rice Milling 41 6.1 Technological changes in rice milling 41 6.2 Impact of rice milling technologies on milling cost, financial performance,
quality of rice and employment
46 6.3 Estimation of cost and margins for the key agents 48 6.4 Financial viability of the rice mills 51
Section VII Map of rice surplus/deficit at zila level 52 7.1 Rice surplus/deficit at zila level 52 Section VIII Domestic and International Rice market integration 62 8.1 Rice market integration 62 8.2 Strong forms of market integration 63 8.3 Unit root and cointegration tests for coarse rice price of selected countries 64 8.4 Strong forms of market integration 65 8.5 Regression analysis of domestic rice markets 66 8.6 Regression analysis of importing and exporting countries markets: 67
Section IX Suggested policy options for improvement of structure, conduct and performance of rice market in Bangladesh
68
9.1 Market structure 68 9.2 Market conduct 68 9.3 Structure of rice mills 68 9.3.1 Market structure 68 9.3.2 Market conduct 68 9.3.3 Market performance 68
Acknowledgements 70 Bibliography 71 Annex 76

vi
List of tables
Page Table 3.1. Sample frame and size of the study 10 Table 5.25: Results of various indexes on computation of seller concentration in rice mill industry
30
Table 5.26: Seller concentration in sample rice mill 31 Table 5.26s: Concentration of rice mills in selected districts 31 Table 5.27: Major problems for potential entrant as perceived by established mills 32 Table 5.28: Major problems for potential entrants 33 Table 5.29: Problems faced by the mills at the time of entry 34 Table 5.30: Reasons for leaving the market 34
Table 5.34: Distribution of mills by number of employees 39 Table 6.1: Milling cost and profit by different types of rice mill 47 Table 6.2. Employment in different rice mills 48 Table 6.5: Marketing cost and margin of paddy and rice traders 49 Table 6.6: IRR, NPV and BCR for different rice mills 51 Table 7.3: Rice Surplus/deficit districts with amount (in 2005) 58 Table 7.4: Rice Surplus/deficit districts with amount (in 2000) 60 Table 8.1: Unit root test for wholesale real price of rice markets in Bangladesh, 62 Table 8.2: Co-integration regression test results for rice price in Bangladesh (Real Price) 63
Table 8.3: Testing strong form of integration ( )0,1 in rice markets in Bangladesh
( tttt ueXY 1 )
64
Table 8.4 : Unit root test for coarse rice of import and export markets 65 Table 8.5: Co-integration regression test results for import markets of coarse rice markets 65
Table 8.6: Testing strong form of integration ( )0,1 of selected rice market
( tttt ueXY 1 )
66
Table 8.7: Pair wise regression analysis in the selecting domestic rice markets 66 Table 8.8: Pair wise regression analysis in the selecting importing rice countries 67
List of figures
Figure 3.1: More complex relationship between structure, conduct and performance 10 Figure 4.1: Rice marketing channel in Bangladesh 18 Figure 5.1: Buyer concentration in paddy market 25 Figure 5.2: Typical Marketing Channels of Paddy/ Rice in Bangladesh 29 Figure 6.1. Flowchart of a husking rice mill (presently operating, 2012) 41 Figure 6.2. Flowchart of a semi-automatic rice mill (Before 2008) 42 Figure 6.3. Flowchart of a semi-automatic rice mill (Presently operating, 2012) 43

vii
Figure 6.4. Flowchart of an automatic rice mill (Before 2008) 44 Figure 6.5. Flowchart of an automatic rice mill (presently operating ,2012) 45 Figure 6.6: Share of different actors in gross marketing margin, marketing cost and net margin 50 Figure 6.7: Share of different actors in gross marketing margin, marketing cost and net margin 50 Figure 7.1 : Number of districts on the basis of the extent of surplus, 2010 54 Figure 7.2: Number of districts on the basis of the extent of deficit, 2010 54 Figure 7.4: Rank of rice surplus districts, 2010 55 Figure 7.5. Rank of rice deficit districts, 2010 55 Figure 7.6: Rank of rice surplus districts on the basis of its own consumption, 2010 56 Figure 7.7. Rice surplus district (former) in 2005 58 Figure 7.8. Rank of rice deficit districts (former) in 2005 58 Figure 7.11. Rank of rice surplus district(former) in 2000 60 Figure 7.12. Rank of rice deficit district (former) in 2000 61 Figure 7.13. Number of district (former) on the basis of extent of rice surplus in 2000 61 Figure 7.14. Number of district (former) on the basis of extent of rice deficit in 2000 61
List of Maps
Map 3.1: Study area 11 Map 7.2: Extent of Rice Surplus and deficit at District level in 2010. 53 Map 7.4: Extent of rice surplus and deficit at district level (former) in 2005 57 Map 7.6: Extent of rice surplus/deficit at district level (former) in 2000 59
List of Box
Box-1: Miniket- A Myth or Reality 38
Annex
Annex 1: Assumptions for estimating IRR, BCR and NPV of different rice mills: 76 Annex 2: Production of rice in different years in Bangladesh (‘000 metric ton) 79 Annex 3: Rice surplus and deficit districts in 2000 80 Annex 4: Production of rice in different years in Bangladesh (‘000 metric ton) 81 Annex 5: Rice surplus and deficit districts in 2005 82 Annex 6: District wise per capita consumption of rice and surplus/deficit districts in rice in Bangladesh in 2010
83
Annex 7: Real price of coarse rice in different years of Bangladesh (Taka/MT) 85 Annex 8: Real price of Eastern India in Different Years 86

viii
Table 5.1: Paddy markets by district with market day 87
Table 5.2: Distribution of paddy traders by district 87 Table 5.3: Distribution of paddy traders by age 88 Table 5.4: Distribution of paddy traders by year of schooling 88 Table 5.5: Distribution of paddy traders by occupation 88 Table 5.6: Year of starting business 89 Table 5.7: Paddy markets by district with buyer concentration 89 Table 5.8: Problems for the new entrant as perceived by established traders 90 Table 5.9: Problems faced by the established traders at the time of entry 90 Table 5.10: Price setting mechanisms during buying and selling paddy 90
Table 5.11 Reasons for difference in payment by the paddy traders 91 Table 5.12 Do you sell paddy to a single buyer? 91 Table 5.13: Reasons to sell to a single buyer 91 Table 5.14: Reasons for not to sell to a single buyer 91 Table 5.15: Do the buyers pay higher price than the cash payment? 92 Table 5.16: Service provided by buyers 92 Table 5.17: Distribution of sample mills by type 92 Table 5.18: Ownership pattern of rice mills 92 Table 5.19: Year of establishment of rice mills 92 Table 5.20: Distribution of mills by area 93 Table 5.21 Distribution of rice traders by age 93 Table 5.22: Distribution of rice traders by main occupation 93 Table 5.23: Distribution of rice traders by year of staring the business 93 Table 5.24: Ownership pattern of business 94 Table 5.31: Mode of selling rice by type of mills 94 Table 5.32 : Sources of credit for the rice miller 94 Table 5.33: Capacity utilization of rice mills in the study areas 95 Table 6.3: Marketing cost of paddy of various traders 95 Table 6.4: Marketing cost of various rice traders 95 Table 7.1: Rice Surplus/deficit districts with amount, 2010 96 Table 7.2: Top 10 surplus districts in rice production of Bangladesh,2010 97
Figure 7.3: Rank of rice production surplus districts on the basis of total surplus of surplus districts , 2010
97
Figure 7.9. Number of district (former) on the basis of extent of rice surplus in 2005 98 Figure 7.10. Number of district (former) on the basis of extent of rice deficit in 2005 98 Map 7.1: Rice surplus /deficit at zila level in 2010
99

ix
Executive Summary
Given the volatility of rice prices during the past few years of Bangladesh and on international markets, and the negative impacts on both the poor farmers and consumers, there has been much concern over the efficient functioning of the marketing system. In the past few years, however, there are indications of rapid technological change in the rice marketing chain, especially in terms of milling. New automatic rice mills, operating on a larger scale, have been expanding and generate some impacts on employment and market concentration that have been investigated in this study. However, given increased volatility of international grain markets, India’s recent export restrictions and the important role of private traders in securing rice imports, it is also important to assess the integration of domestic and international markets. Thus, this study was designed to provide an improved understanding of domestic rice marketing, including its relationship with international markets, in order to provide better information to policy markers.
The study was conducted by adopting the structure, conduct and performance approach. The study covered 12 districts, of which six are from rice surplus area (Dinajpur, Rangpur, Bogra, Naogaon, Sherpur, Comilla,) and six are from rice deficit area (Kushtia, Khulna, Dhaka, Noakhali, Sylhet and Chittagong). Based on rice processing mills the paddy markets were selected. The study selected a sample of 752, which includes faria (39), bepari (134), aratdar-cum-wholesaler (112), rice miller (110), aratdar (30), wholesaler (129), wholesaler-cum-aratdar (24), wholesaler-cum-retailer (66), retailer (103), and importer (5). Rice processing mills were categorised into three groups; husking, semi-automatic and automatic mill. Then four to five mills from each group were selected purposively for in-depth interview by the research team. Similarly, in-depth interview of different key agents at various levels was conducted by the research team. Rest of the mills and other key agents were selected by using convenience sampling. In some specific cases for accuracy of data, farmers and banks were also checked.
Different indexes namely concentration ratio, entropy index, and Gini coefficient were used to measure concentration ratio in rice milling and market. Financial viability of husking, semi-automatic and automatic mills was done through using NPV, IRR, and BCR. Market integration was examined by applying cointegration method developed by Engle and Granger.
The study revealed that the seller concentration of paddy market is very low on the other hand the buyer concentration varied from 30% to 85%. According to the respondents the three major problems which would create barriers for the potential traders were arrangement of sufficient capital, suitable site for the shop and business risk. Though there are differences in paddy in terms of variety and quality but no deliberate effort is made to make the paddy differentiated in the market. No effective formal system of dissemination of market information was existed. Price is set through bargaining both in buying and selling of paddy. The paddy traders had not undertaken any product policy and sales promotion policy.
Paddy market is operating smoothly throughout the country; millers are getting paddy as much they need, though farmers are not getting reasonable price for their paddy. So from farmers’ perspective, it can be concluded that paddy market is not running in favour of them.
The results of various methods indicate that the capacity of rice processing mills was distributed almost evenly among the mills across the country. The level of concentration of largest four mills was only 0.69%. This low concentration is also supported by the other two indexes. Product differentiation exists due to differences in quality and ignorance of consumers. Identification of rice

x
is almost unilaterally determined by the sellers at different stages of the market. However, product differentiation does not create any significant barriers for competition. Non-availability of huge capital, lack of utilities, and tough competition from established firms, suitable site for mills, shortage of skilled manpower and non-availability of processing plant would be problems for the potential entrant of this industry. All these problems would yield higher cost for the new entrant than the established firm.
Selling price of rice is set independently by the individual firms. Market price is determined through negotiation between selling firm and buyer. Both the parties check the prevailing price in the market. The automatic rice mill owners were in better position in negotiation. In the case of husking and semi-automatic mills, they set selling price after considering the neighbouring firm’s price.
The automatic and semi-automatic mills can process rice according to buyer’s choice (single boiled or double boiled). There is no effort on the part of the millers to promote sale of rice. There is no evidence of predatory and/or exclusionary tactics of the established firms in rice market.
Performance of the rice mill is assessed by using various dimensions. Capacity utilization was low as the highest one was only 56.24%. In term of size of selling cost the performance is satisfactory as the selling cost was almost zero. Apparently the rice of automatic mills is in super quality. Although most of the machines are imported and some are age-old but technological advancement has been increasing towards automatic rice mills over the years. Discrimination by sex in terms of wage rate is common in rice milling industry. Quality of rice milled through automatic mills in terms of food value needs to be investigated.
The estimated milling cost per ton of rice was found highest (Tk. 3452) in semi-automatic rice mill with modern equipment. Comparatively lower milling costs per ton of rice were found in automatic rice mills without and with modern equipment as Tk.2563 and Tk. 3070, respectively.
In terms of employment opportunity of labour (daily wage earner), an automatic rice mill with modern equipment utilized about 5925 man-days per year compared to other rice mills (ranges between 2232 to 3120 man-days per year), because of its higher capacity utilization. This higher capacity utilization is because of the higher demand for quality rice (in terms of physical size and shape, and glossy looking) in the market. However, labour requirement of automatic and automatic with modern equipment rice mills were found far less (3.20 and 3.95 man-hr per ton of paddy processing) compared to husking and semi-automatic rice mills which was in the range of 14.17-15.67 man-hr per ton of paddy processing.
The employment opportunities of staffs (monthly salaried person) was found highest in automatic rice mills with modern equipment (6205 man-days per year) followed by automatic rice mills without modern equipment (5840 man-days per year), semi-automatic rice mills with modern equipment (1460 man-days per year) and semi-automatic rice mills without modern equipment and husking mills (1095 man-days per year).
The miller shared highest cost (45.20 %) and captured highest percentage of total net profit (45.70%) among the traders. The second highest cost was incurred by wholesaler cum retailer (15.21%) and earned 12.70 % of the total net marketing margin. The rice retailer captured 17.92 % of total net marketing margin by incurring 3.55 % of the total marketing cost. The wholesaler earned 7.71 % of the net marketing margin by incurring 15.20 % of the total marketing cost.
IRR is greater in the case of automatic rice mill (32%) than that of semi automatic (25%) and husking mills (18%) and this is much higher than the interest rate (even for borrowed capital). So, it may be concluded that automatic rice mill is more financially viable than others. Investment to automatic rice mill, semiautomatic rice mill and husking rice mill is viable because NPV is positive for all cases. BCR is also greater than one for all cases, which indicates the project viability.

xi
The map of rice surplus/deficit at zila level is constructed by using the apparent consumption of rice instead of normative consumption. The average of three years (2008/09, 2009/10, 2010/11) rice production data and population of 2010 for 64 districts are used to identify the status of rice production. Thirty six districts are identified as rice surplus district while the rest of 28 districts are deficits (Map 6.1). Maps of rice surplus/deficit for the year of 2005 and 2000 have been constructed also for the former 23 districts as the data (production) are not available for 64 districts in the country.
According to the Engle-Granger (EG) and Augmented Engle and Granger (AEG) test, rice markets of Bangladesh are integrated which are statistically significant at 1% level. An important finding of the study is that Dhaka market is significantly integrated to all regional markets of rice markets in Bangladesh due to having the facility of information technology, which closely connected the markets to each other. This study strongly supports marketing efficiency in the selected rice markets. Price move in the unison in all the markets together. Central price policy making will be effective in these markets.
All possible pair wise combination among the selected rice countries (Bangladesh, Eastern India, Thailand and Vietnam) has been chosen. The test statistics obtained that all the pair wise markets are seen to greater than the critical value at 1 percent level of significance. The null hypothesis of no cointegration is rejected for all the pair wise combination. Therefore, pair wise combinations of all the selected countries are integrated.
On the basis of the findings of the study, some policy guide lines have been drawn in the report. Some of them are:
• Formation of farmers’ marketing cooperative/group may help to improve the bargaining position of the farmers in the market;
• Credit facility may be provided to paddy traders. The traders should have trading licenses;
• Display of buying prices of paddy on board by buyers Association/market committee on market;
• Considering the requirement of the market as well as the country the husking mills should be modernized to semi-automatic/automatic rice mills. Profitable cases should be financed by institutional sources;
• Investigation should be done to examine the nutritional aspect of milled rice after extracting bran from the rice;
• Vocational training programme may help to produce qualified personnel for operating the automatic rice mills;
• Promote optimum use of by-products such as husk, bran, broken rice, husk-ash;
• Wage discrimination by sex needs to be addressed. Wage should be determined according to contribution to final product;
• Arrangement of foreign visits particularly the rice exporting countries for the millers may help to change the attitudes to the business. FAO may sponsor such visits;
• The government should have a complete and accurate data base on rice mills and market intermediaries which will facilitate appropriate policy formulation and also monitoring business activities.
• Government policy in rice price stabilization will be effectively transmitted all over the domestic rice markets as markets are integrated.
1
I. Introduction
1.1 Focus of the study
Given the volatility of rice prices during the past few years of Bangladesh and on international markets, and the negative impacts on both the poor farmers and consumers, there has been much concern over the efficient functioning of the marketing system. The key structural aspects of the rice market involve the number and concentration of the agents, the ease of entry into the business and the functions performed by relatively small establishments at various levels of marketing chain. Several agents are involved in the rice market. Farias (small itinerant paddy traders, who normally buy from farmers and sell to beparis) and beparis (large itinerant paddy wholesalers) are primary level market participants, while paikers (rice wholesalers) and aratdars (rice commission agent) are terminal market operators. Millers are secondary market agents that operate between paddy beparis on one side and paikers and aratdars on the other. In 1986, the BBS enumerated the total number of agents involved in rice trading and processing at 107,657. Of this, 59,067 were paddy-processing establishments of various capacities and technologies. According to 1992 estimates there were 11,948 beparis and 2,200 aratdars who dominate the terminal markets (Chowdhury, 1992).
Even though the market structure is such that the number of traders and millers is relatively small compared to the number of farmers and consumers, entry requirements at different levels of the chain are relatively easy to meet, so that most evidence on Bangladesh’s rice market has shown no visible sign of any serious imperfection (Chowdhury, 1992). In the past few years, however, there are indications of rapid technological change in the rice marketing chain, especially in terms of milling. New automatic rice mills, operating on a larger scale, have been rapidly expanding. Automatic rice processing mills perform nearly all activities through mechanical methods, including sorting of stones and empty grains, grain soaking, boiling, drying, milling, polishing and bagging. These mills obtain finance primarily from private banks (which accept the paddy /rice as collateral), and sell much of their rice under brand names. While some market participants have indicated that the number of automatic mills has increased enormously, there are no good analyses available that indicate the quantitative extent of the change. These new mills may have impacts on employment and market concentration that have yet to be studied. For example, the question has emerged if the need of the automatic mills to buy larger quantities is putting upward pressure on paddy prices.
Moreover, many studies have investigated rice market integration in Bangladesh, but they have dealt mainly with integration of the markets within the country. Most of these studies have found that domestic rice markets are well integrated (Dawson and Dey, 2002, Hossain and Wim Verbeke, 2010, Goletti et. al 1995, Ahmed and Bernard, 1989). However, given increased volatility of international grain markets, India’s recent export restrictions and the important role of private traders in securing rice imports, it is also important to further assess the integration of domestic and international markets. Thus, this study was designed to provide an improved understanding of domestic rice marketing, including its relationship with international markets, in order to provide better information to policy markers.

2
1.2 Objectives a. Provide evidence and provide new evidence on rice market structure, conduct and performance in
Bangladesh and to analyze the impacts of technological change in the rice milling sector on employment, the financial viability of semi-automatic mills, market concentration, rice quality, and costs of milling.
b. To construct detailed estimates of costs and margins for key agents along the rice marketing chain in Bangladesh and to analyze market integration between domestic and international markets.
c. To suggest policy implications for improving market structure, conduct and performance.
1.3 Key research questions
1. What are the methodologies applied and key findings of the earlier research related to structure, conduct and performance of rice marketing in Bangladesh?
2. Is rice market operating competitively in Bangladesh? 3. What are the impacts of technological changes in rice milling? 4. How the marketing costs and margins are shared by key agents in rice marketing chain? 5. Are domestic and international rice markets integrated? 6. Are the rice mills (husking, semi-automatic and automatic) financially viable in the existing
environment of the country? 7. Is performance of rice market improving? 8. What are major flows of rice in Bangladesh by season?
3
II. Literature review
2.1 Introduction The collected literature are grouped into: (i) dealing with marketing system, (ii) market structure and conduct of rice market/ industry, (iii) spatial market integration, (iv) technological changes in rice milling and (v) policy issues. In some cases some literatures were not confined to a particular aspect of rice market, so overlapping of grouping is common. A brief review on group (iii), (iv) and (v) are presented below. And group ( i) and (ii) are investigated in section IV. 2.2 Spatial market integration Price correlation measures the co-movements that underlie the intuitive idea of market integration. The problems were that these co-movements sometimes could not be separated from long-run time trends and seasonality effects. Despite its limitations, price series correlation was the commonly used measure of market integration. Correlation analysis and regression models were used by different authors like, Lele, 1967; Petzel and Monke, 1979; Blyn, 1973.Pairwise correlation between price movements at different locations were evaluated. High correlation coefficients (above .85) were seen as indicating high degree of spatial connection between markets (Farruk, 1970; Lele, 1971), and representing efficient transformation of product in space. Blyn ( 1973) and Harriss (1979) pointed out that closely correlated movement of special price imply several other things too: (i) common income or population growth trends or production seasonality; (ii) equally binding implementation of government’s pricing policy pursuing the same or developed price targets in the paired regions, with little actual market connection; (iii) equally homogeneous monopoly; (iv) high correlation of prices in both regions with that of a related goods traded in a common third market. The point of the critique was that correlation and causality are not interchangeable (Papanek, 1972).
The popularity of pair wise correlation has not survived Harriss’ critique. The fact remains that high pair wise correlation coefficients indicate high degree of spatial arbitrage so long there are no extreme monopoly, or effective government control over all regional markets, or shared dynamic seasonal structure in market availability (Timmer et al., 1983).
However, Ardeni (1989) argued that these approaches ignore the time series properties of price data and the result obtained may be biased and inconsistent. More importantly, the results tend more often to reject the null hypothesis of market integration, indicating that the markets were not efficient although these markets in reality appear to operate competitively. Here is some review of literature on market integration which is presented in turn according to the year of study. Kumar and Singh (1979), conducted a study entitled, ‘Market integration and efficiency of paddy crop in India’ assuming following hypotheses, (i) the primary wholesale markets of paddy were closely interrelated, (ii) the seasonal variations in the prices of paddy were closely related to storage cost and (iii) the price differences in the village and primary wholesale markets were consistent with transportation cost. The study was conducted in Varanasi district of Uttar Pradesh. The analysis supported the first one and rejected the remaining two hypotheses, which indicated that the marketing channels were not reasonably efficient.
Ravallion (1986) developed an integration model which estimates the extent to which local price are influenced by prices in the reference market (e.g. Dhaka market for Bangladesh). He employed his model for rice price in Bangladesh just prior to and during the 1974 famine. His test rejected the hypothesis that rice markets are segmented. But the test on short run integration of markets was
4
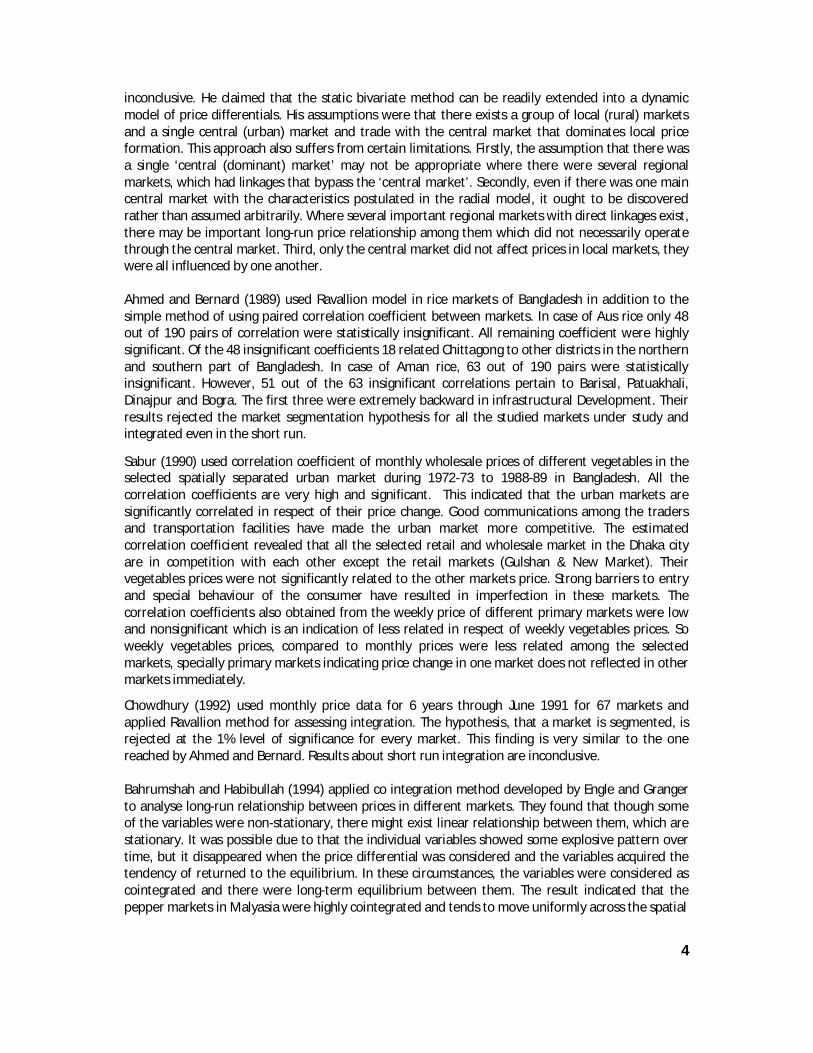
inconclusive. He claimed that the static bivariate method can be readily extended into a dynamic model of price differentials. His assumptions were that there exists a group of local (rural) markets and a single central (urban) market and trade with the central market that dominates local price formation. This approach also suffers from certain limitations. Firstly, the assumption that there was a single ‘central (dominant) market’ may not be appropriate where there were several regional markets, which had linkages that bypass the ‘central market’. Secondly, even if there was one main central market with the characteristics postulated in the radial model, it ought to be discovered rather than assumed arbitrarily. Where several important regional markets with direct linkages exist, there may be important long-run price relationship among them which did not necessarily operate through the central market. Third, only the central market did not affect prices in local markets, they were all influenced by one another. Ahmed and Bernard (1989) used Ravallion model in rice markets of Bangladesh in addition to the simple method of using paired correlation coefficient between markets. In case of Aus rice only 48 out of 190 pairs of correlation were statistically insignificant. All remaining coefficient were highly significant. Of the 48 insignificant coefficients 18 related Chittagong to other districts in the northern and southern part of Bangladesh. In case of Aman rice, 63 out of 190 pairs were statistically insignificant. However, 51 out of the 63 insignificant correlations pertain to Barisal, Patuakhali, Dinajpur and Bogra. The first three were extremely backward in infrastructural Development. Their results rejected the market segmentation hypothesis for all the studied markets under study and integrated even in the short run.
Sabur (1990) used correlation coefficient of monthly wholesale prices of different vegetables in the selected spatially separated urban market during 1972-73 to 1988-89 in Bangladesh. All the correlation coefficients are very high and significant. This indicated that the urban markets are significantly correlated in respect of their price change. Good communications among the traders and transportation facilities have made the urban market more competitive. The estimated correlation coefficient revealed that all the selected retail and wholesale market in the Dhaka city are in competition with each other except the retail markets (Gulshan & New Market). Their vegetables prices were not significantly related to the other markets price. Strong barriers to entry and special behaviour of the consumer have resulted in imperfection in these markets. The correlation coefficients also obtained from the weekly price of different primary markets were low and nonsignificant which is an indication of less related in respect of weekly vegetables prices. So weekly vegetables prices, compared to monthly prices were less related among the selected markets, specially primary markets indicating price change in one market does not reflected in other markets immediately.
Chowdhury (1992) used monthly price data for 6 years through June 1991 for 67 markets and applied Ravallion method for assessing integration. The hypothesis, that a market is segmented, is rejected at the 1% level of significance for every market. This finding is very similar to the one reached by Ahmed and Bernard. Results about short run integration are inconclusive.
Bahrumshah and Habibullah (1994) applied co integration method developed by Engle and Granger to analyse long-run relationship between prices in different markets. They found that though some of the variables were non-stationary, there might exist linear relationship between them, which are stationary. It was possible due to that the individual variables showed some explosive pattern over time, but it disappeared when the price differential was considered and the variables acquired the tendency of returned to the equilibrium. In these circumstances, the variables were considered as cointegrated and there were long-term equilibrium between them. The result indicated that the pepper markets in Malyasia were highly cointegrated and tends to move uniformly across the spatial

5
markets and there was no non-competitive pricing behaviour in the regional markets. The distance among the markets were not an impediment to the efficient adjustment of receiving the new price information and this price signals were fully and immediately transmitted to other markets.
Goletti et. al (1995), carried out a study on “ Structural Determinant of Market integration: The case of rice markets of Bangladesh” with the help of two- stage approach of market integration. The first stage used time series methods to construct four measure of market integration; the second stage introduced structural variables to explain market integration. The analysis was applied to rice markets in Bangladesh, and used a set of new and very comprehensive data that included weekly prices of rice over a period of three years for sixty-four districts and structural variable at the districts levels. The first stage found that the degree of market integration in Bangladesh is rather moderate. Segmented markets made up less than 10 percent of all conceivable links in the network of the sixty-four markets. They found that the rice market of Bangladesh was mostly integrated. The different measures of integration showed different results within the same structural environment, but there was some congruence that the distance between markets and the number of strikes affected market integration negatively.
Rahman and Talukder (1995) applied two market integration models and one nonparametric model to five times of rice prices representing five important markets (Dhaka, Metropolitan city-DMC as deficit market while Dinajpur, Bogra, Barisal and Mymensingh as surplus market) covering January, 1990 through June1993 in Bangladesh. This study proposes a nonparametric approach called ‘sign test; and applied to a set of five prices of coarse rice. The study applied a traditional test of the law of one price (LOP), Ravallion test and proposed the sign test, to weekly coarse rice price data were also estimated by using the same data set. The result shows that the law of one price did not hold for any pairs of price. Ravallion tests rejected short-run integration but long-run integration was supported for Dhaka and Dinajpur prices. By using monthly wholesale price of coarse rice from 1992 to 1997Dawson and Dey (2002) applied a dynamic vector autoregressive model and Johanson’s co- integration procedure to examine long–run spatial rice market integration in Bangladesh. They conclude that rice markets are perfectly integrated and that Dhaka dominates near markets but is dominated by more distant markets. The extent of market integration after rice market liberalization was investigated by Hossain and Wim Verbeke( 2010) by using weekly market price data for the period 2004-2006 from six regional markets in Bangladesh. The overall results of the market integration analysis in Bangladesh indicate that, although the six regional markets in Bangladesh are co-integrated—meaning that they have a stable long run relationship—these markets are only weakly integrated in the short run. The study also revealed that there are three co-integrating vectors and three common trends, which suggest that rice markets are stationary in three directions and nonstationary in three directions. Granger-causality results were unidirectional causality originating from Dhaka to Khulna and Barisal and from Sylhet to Dhaka, while Dhaka leads the price formation process only for Sylhet. There was also bi-directional causality between Dhaka and Chittagong, and Dhaka and Rajshahi. The short-run results indicate that these rice markets are not well integrated while long-run integration is evident, suggesting that the markets do eventually move together in the long term. The spread of adjustment appears to be the inverse of distance and directly related with ease of transport. They did not use ECM method for their study. Ismet et al. (1998), conducted a study to investigate the government intervention and spatial market integration of rice markets in Indonesia. The study evaluated the long-run price relationship of before and after self- sufficiency period as well as the whole period of Indonesian rice markets with the help of multivariate co-integration technique. It was shown from the study that the degree
6
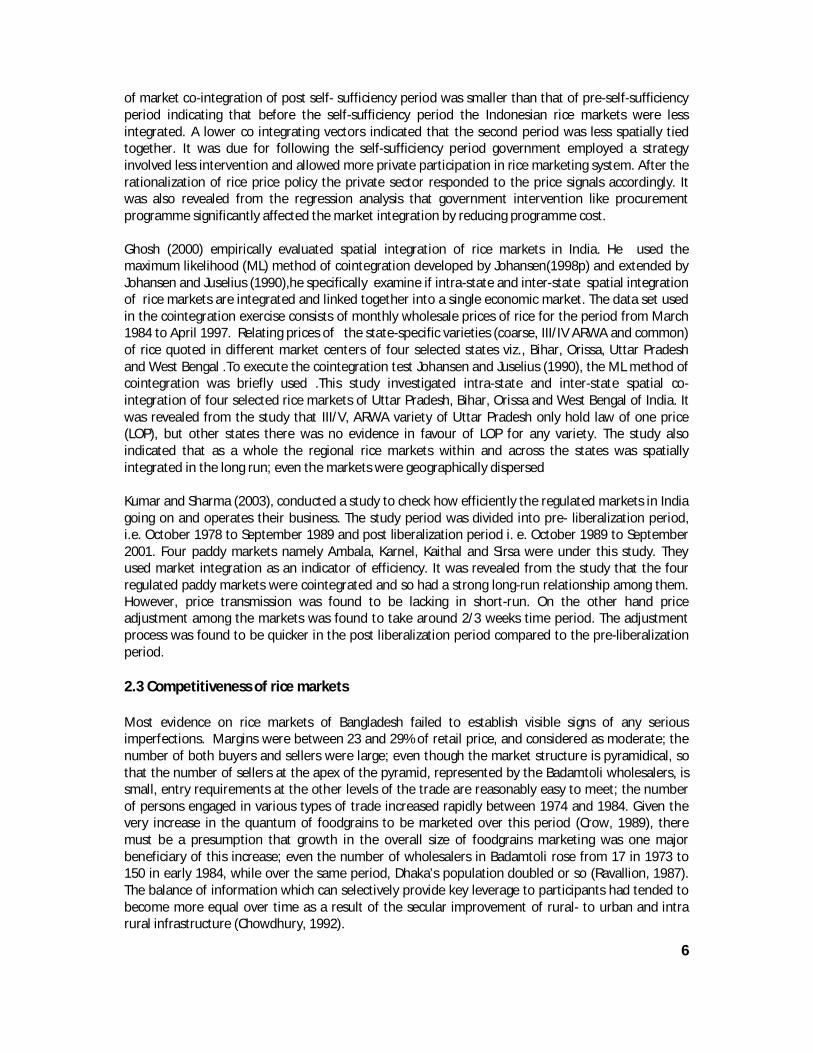
of market co-integration of post self- sufficiency period was smaller than that of pre-self-sufficiency period indicating that before the self-sufficiency period the Indonesian rice markets were less integrated. A lower co integrating vectors indicated that the second period was less spatially tied together. It was due for following the self-sufficiency period government employed a strategy involved less intervention and allowed more private participation in rice marketing system. After the rationalization of rice price policy the private sector responded to the price signals accordingly. It was also revealed from the regression analysis that government intervention like procurement programme significantly affected the market integration by reducing programme cost. Ghosh (2000) empirically evaluated spatial integration of rice markets in India. He used the maximum likelihood (ML) method of cointegration developed by Johansen(1998p) and extended by Johansen and Juselius (1990),he specifically examine if intra-state and inter-state spatial integration of rice markets are integrated and linked together into a single economic market. The data set used in the cointegration exercise consists of monthly wholesale prices of rice for the period from March 1984 to April 1997. Relating prices of the state-specific varieties (coarse, III/IV ARWA and common) of rice quoted in different market centers of four selected states viz., Bihar, Orissa, Uttar Pradesh and West Bengal .To execute the cointegration test Johansen and Juselius (1990), the ML method of cointegration was briefly used .This study investigated intra-state and inter-state spatial co-integration of four selected rice markets of Uttar Pradesh, Bihar, Orissa and West Bengal of India. It was revealed from the study that III/V, ARWA variety of Uttar Pradesh only hold law of one price (LOP), but other states there was no evidence in favour of LOP for any variety. The study also indicated that as a whole the regional rice markets within and across the states was spatially integrated in the long run; even the markets were geographically dispersed Kumar and Sharma (2003), conducted a study to check how efficiently the regulated markets in India going on and operates their business. The study period was divided into pre- liberalization period, i.e. October 1978 to September 1989 and post liberalization period i. e. October 1989 to September 2001. Four paddy markets namely Ambala, Karnel, Kaithal and Sirsa were under this study. They used market integration as an indicator of efficiency. It was revealed from the study that the four regulated paddy markets were cointegrated and so had a strong long-run relationship among them. However, price transmission was found to be lacking in short-run. On the other hand price adjustment among the markets was found to take around 2/3 weeks time period. The adjustment process was found to be quicker in the post liberalization period compared to the pre-liberalization period. 2.3 Competitiveness of rice markets Most evidence on rice markets of Bangladesh failed to establish visible signs of any serious imperfections. Margins were between 23 and 29% of retail price, and considered as moderate; the number of both buyers and sellers were large; even though the market structure is pyramidical, so that the number of sellers at the apex of the pyramid, represented by the Badamtoli wholesalers, is small, entry requirements at the other levels of the trade are reasonably easy to meet; the number of persons engaged in various types of trade increased rapidly between 1974 and 1984. Given the very increase in the quantum of foodgrains to be marketed over this period (Crow, 1989), there must be a presumption that growth in the overall size of foodgrains marketing was one major beneficiary of this increase; even the number of wholesalers in Badamtoli rose from 17 in 1973 to 150 in early 1984, while over the same period, Dhaka’s population doubled or so (Ravallion, 1987). The balance of information which can selectively provide key leverage to participants had tended to become more equal over time as a result of the secular improvement of rural- to urban and intra rural infrastructure (Chowdhury, 1992).

7
Almost all major studies argued that food grain market are competitive and not collusive, in which, especially in normal years, the absolute scarcity of capital resources at the disposal of general traders makes for a compulsion towards rapid turnover of stock. This tendency has been accentuated by the growing importance of boro harvest juxtaposed between the aman and aus harvests, which, thus implies a lowering of the mean inter harvest storage duration.
The rice processing systems of Bangladesh was studied by Harriss (1979). More than 90% of total production of rice in Bangladesh was processed by women in their homesteads and small custom mills located in the rural areas. He analyzed the relative economics and employment effects of the rural processing technologies and also presented their implications for choice of technology mix for rice processing in the country. 2.4 Policy issues Deb (2008) in his paper entitled, “Boro Procurement and Food Security Strategy - An Actionable Agenda” has addressed 3 issues: (i) Boro Production Possibility and Procurement Strategy, (ii) Achieving Food Security in FY2008-09 and beyond, (iii) Budgetary Allocations Required. Deb has shown the estimated area of Boro rice as made by Centre for Environment and Geographic Information Services (CEGIS) and used targeted Boro area data of DAE. Projection of Boro production in 2007- 08 was also done. Per acre production cost of Boro price along with cost of paddy per kg and rice per kg were also estimated.
The procurement target of 12 to 15 lakh metric tons of rice and paddy from the domestic market in 2008 was considered realistic on the basis of previous procurement from 1995 to 2007. The selected 42 districts for procurement of Rice and Boro paddy in 2007 may also be the major source of Boro procurement in 2008. Considering the average cost of production of Boro paddy (Tk. 12.77 per kg) and Boro rice (Tk. 20.26/kg), procurement price of Boro paddy (Tk. 18.00 per kg) and Boro rice (Tk. 28.00 per kg) was reasonable balance between the interest of producers and consumers.
An analysis of domestic prices (both for wholesale and retail) of coarse and medium rice revealed that price of rice has increased exponentially during the last one year. It was also revealed that domestic price of rice increased sharply with the announcement of minimum export price by India. It was true for both the retail and wholesale market. At the international level probably minimum export price announced by the government of India also had an effect.
Comparisons of domestic and import parity price during July 2005 to February 2008 revealed that wholesale domestic price of coarse rice was higher than the Import parity prices of both Delhi and Bangkok during October 2005 to February 2006. But the domestic price was lower than those of Import parity price up to December 2007. Then the domestic wholesale price increased more than the Import parity price of Delhi but lower than that of Bangkok price.
For increased production in the upcoming Aman and Boro season, Bangladesh must have to promote improved varieties, supply adequate amount of fertilizers, ensure availability as well as affordability of diesel for irrigation and ensure supply of electricity for irrigation. Adequate importance for increase in production in the Aman season would be required particularly for exploring expansion of area in coastal belt and low irrigation cost in the season. A long list of suitable varieties of both Boro and Aman paddy and approved hybrids for different districts are compiled for the country.
Misra (2012) traces the volatility in rice market in Bangladesh since 2007– 8 food crisis in terms of the country’s deregulation of agricultural sector and the gradual elimination of market regulatory mechanisms. The article is mainly based on critical review of literature and use of data collected
8
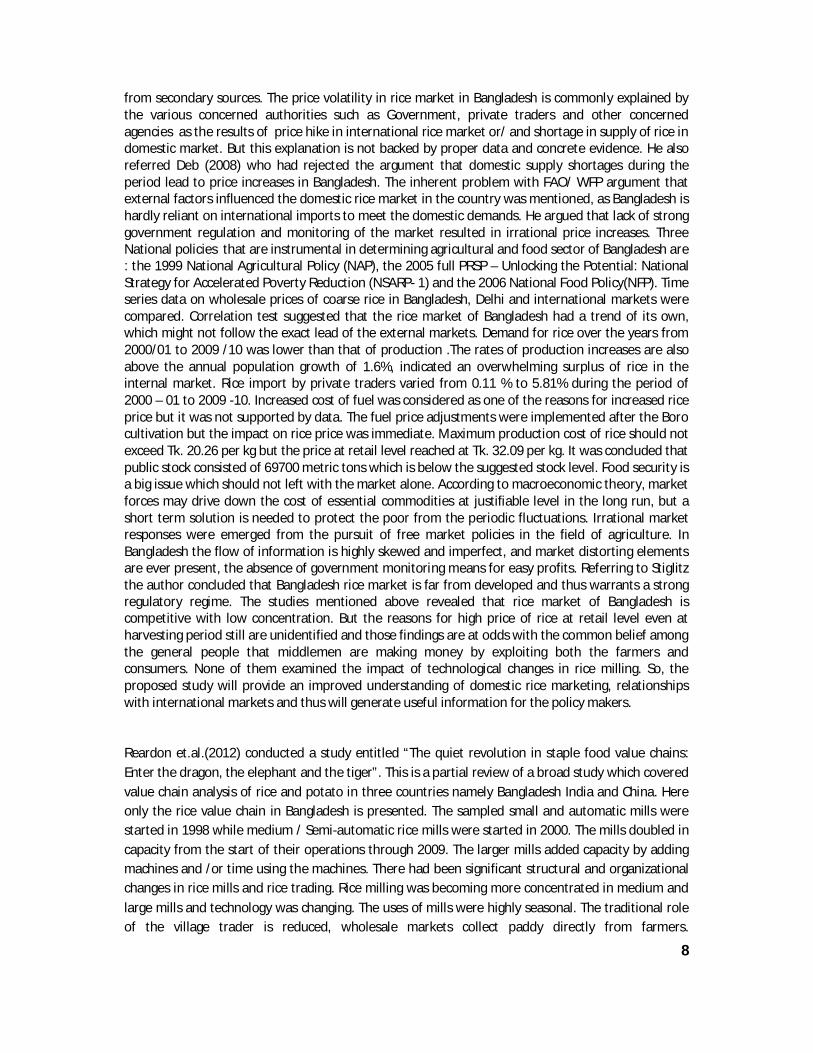
from secondary sources. The price volatility in rice market in Bangladesh is commonly explained by the various concerned authorities such as Government, private traders and other concerned agencies as the results of price hike in international rice market or/ and shortage in supply of rice in domestic market. But this explanation is not backed by proper data and concrete evidence. He also referred Deb (2008) who had rejected the argument that domestic supply shortages during the period lead to price increases in Bangladesh. The inherent problem with FAO/ WFP argument that external factors influenced the domestic rice market in the country was mentioned, as Bangladesh is hardly reliant on international imports to meet the domestic demands. He argued that lack of strong government regulation and monitoring of the market resulted in irrational price increases. Three National policies that are instrumental in determining agricultural and food sector of Bangladesh are : the 1999 National Agricultural Policy (NAP), the 2005 full PRSP – Unlocking the Potential: National Strategy for Accelerated Poverty Reduction (NSARP- 1) and the 2006 National Food Policy(NFP). Time series data on wholesale prices of coarse rice in Bangladesh, Delhi and international markets were compared. Correlation test suggested that the rice market of Bangladesh had a trend of its own, which might not follow the exact lead of the external markets. Demand for rice over the years from 2000/01 to 2009 /10 was lower than that of production .The rates of production increases are also above the annual population growth of 1.6%, indicated an overwhelming surplus of rice in the internal market. Rice import by private traders varied from 0.11 % to 5.81% during the period of 2000 – 01 to 2009 -10. Increased cost of fuel was considered as one of the reasons for increased rice price but it was not supported by data. The fuel price adjustments were implemented after the Boro cultivation but the impact on rice price was immediate. Maximum production cost of rice should not exceed Tk. 20.26 per kg but the price at retail level reached at Tk. 32.09 per kg. It was concluded that public stock consisted of 69700 metric tons which is below the suggested stock level. Food security is a big issue which should not left with the market alone. According to macroeconomic theory, market forces may drive down the cost of essential commodities at justifiable level in the long run, but a short term solution is needed to protect the poor from the periodic fluctuations. Irrational market responses were emerged from the pursuit of free market policies in the field of agriculture. In Bangladesh the flow of information is highly skewed and imperfect, and market distorting elements are ever present, the absence of government monitoring means for easy profits. Referring to Stiglitz the author concluded that Bangladesh rice market is far from developed and thus warrants a strong regulatory regime. The studies mentioned above revealed that rice market of Bangladesh is competitive with low concentration. But the reasons for high price of rice at retail level even at harvesting period still are unidentified and those findings are at odds with the common belief among the general people that middlemen are making money by exploiting both the farmers and consumers. None of them examined the impact of technological changes in rice milling. So, the proposed study will provide an improved understanding of domestic rice marketing, relationships with international markets and thus will generate useful information for the policy makers. Reardon et.al.(2012) conducted a study entitled “The quiet revolution in staple food value chains: Enter the dragon, the elephant and the tiger”. This is a partial review of a broad study which covered value chain analysis of rice and potato in three countries namely Bangladesh India and China. Here only the rice value chain in Bangladesh is presented. The sampled small and automatic mills were started in 1998 while medium / Semi-automatic rice mills were started in 2000. The mills doubled in capacity from the start of their operations through 2009. The larger mills added capacity by adding machines and /or time using the machines. There had been significant structural and organizational changes in rice mills and rice trading. Rice milling was becoming more concentrated in medium and
large mills and technology was changing. The uses of mills were highly seasonal. The traditional role of the village trader is reduced, wholesale markets collect paddy directly from farmers.

9
Disintermediation was evident downstream of rice value chain in the country. On an average the mills sold 7% of their rice to the government. Large mills sold to urban wholesale markets but small mills tended to sell to rural wholesale markets. A small share of the mill’s rice was sold directly to traditional retailers and none to super markets. Traders’ conduct was changing very rapidly. The millers and wholesalers were selling branded and labeled bags to traders. In 1999, only 5% of the total rice sale was bagged by mills but it increased to 36% in 2009. It would help traceability in value chain. Profits were found to be fairly high. The high profit rates can be a sign of the risky nature of the trading enterprise and possibly some local market power. The high profits in general may have been related to be in rice milling and trading. Rice farmers captured about two –thirds of final price. Farmer’s share for common rice was 79% and only 52% for fine rice.

10
III. Methodology and data sources
The study was conducted by adopting the structure, conduct and performance approach (SCP). This technique was first formalized by Mason (1939) and his detailed case study approach was modified by Bain (1951) who sought to draw more generalized conclusions from large sample and cross-section studies. The SCP approach can be adapted to incorporate more complex linkages but the essential causality still flows from structural criteria i.e. structure influence conduct and conduct influence performance. Performance affects both conduct and structure and conduct influences structure (Figure 3.1). Figure 3.1: More complex relationship between structure, conduct and performance The theory of industrial organization was developed to understand the conduct of firms in markets for manufactured products, but can also be applied to markets for services as well as agricultural products. Many researchers in developing countries applied structure conduct performance method in their study on agricultural marketing. Some of them include Tilburg (1988), Lutzand Tilburg (1992), Tollens (1992), Goossens (1994) and Dijkstra (1997).
3.1 Sample, sampling and data collection
For assessing the market structure, conduct and performance of rice, we have designed sample frame below for collecting necessary data:
Table 3.1. Sample frame and size of the study
Area District Faria Bepari Aratdar cum wholesaler
Miller Aratdar Aratdar cum wholesaler
wholesaler Wholesaler cum retailer
Retailer
Importer
Paddy Milled rice
Key agents
Surp
lus
Dinajpur 15 17 13 20 0 6 5 8 11 Rangpur 0 13 16 10 3 7 3 4 13
Naogaon 3 27 21 20 1 5 10 0 11
Bogra 2 15 6 8 0 2 15 0 7 Sherpur 0 1 32 15 4 0 8 2 8 Comilla 1 3 3 2 0 0 10 14 1
Def
icit
Kushtia 16 2 7 25 0 0 17 4 8
Sylhet 0 7 0 2 0 0 11 9 5 Khulna 0 2 7 2 6 4 8 9 3
Dhaka 0 10 1 2 16 0 10 5 11 2 Noakhali 2 4 5 2 0 0 12 6 10
Chittagong 0 5 2 2 0 0 20 5 15 3 Total 39 134 112 110 30 24 129 66 103 5
Market structure Market conduct Market performance

11
Map 3.1: Study area

12
Rice surplus districts refer to those where paddy production exceeds total consumption of the districts, and rice mills are established for processing paddy mainly for markets of other districts of the country. On the other hand, rice deficit districts are those where rice production is inadequate to meet the consumption requirement, hence rice flows from surplus areas to markets of deficit areas. However, 12 districts have been considered under the study, of which 6 are from rice surplus area (Dinajpur, Rangpur, Bogra, Naogaon, Sherpur, Comilla,) and 6 are from rice deficit areas (Kushtia, Khulna, Dhaka, Noakhali, Sylhet and Chittagong). Based on rice processing mills the paddy markets were selected. Similarly, based on flow of processed rice terminal/wholesale markets of different districts were selected. The study selected a sample of 752 (Table 3.1). Rice processing mills were categorised into three groups; husking, semi-automatic and automatic mill. Then four to five mills from each group were selected purposively for in-depth interview by the research team. Similar in-depth interview of different key agents at various levels was conducted by the research team. Rest of the mills and other key agents were selected by using convenience sampling. Public sector associated with paddy procurement, processing, distribution of rice, and the associations/ organizations of key actors were also consulted by the team members for this study. In some specific cases for accuracy of data, farmers and banks were also checked. Six persons were employed for collecting primary data from the rice millers and other market intermediaries. Among two of them were employed as research assistant in the project. The research team members have been supervising the field works.
A standard operating procedure should be adopted for how, where and by whom the survey schedule is administered, as any of the factors may influence the given responses. A one-day training programme was organized at BAU. And a group of post graduate students (6 persons) participated as trainees in that training programme as enumerators for the project.
Collected survey data were edited then if there are some inconsistencies; it was corrected through revisit/communication by using cell phone with the respondents. After checking the interview schedule, data entry was done on computer by using SPSS programme.
3.2 Analysis of data sets This study was based on primary data and secondary data. Primary data were collected through face to face interview with the respondents by using the prepared schedule. Secondary data sets of rice prices were collected mainly from DAM, BBS, and FAO website. The following analytical techniques were applied to analyze the data.
3.2.1 Measurement of market concentration To measure concentration ratio in rice milling and market different indexes are used which are explained below.
3.2.1.1 Concentration Ratio The most popular and simplest index for measurement of market concentration is the use of concentration ratio, i.e. the share of the market or industry held by a small number of largest firms. The market share of such firms may be taken either in production capacity, or production or sales or employment or any magnitude of the market. It depends on the objectives and availability of data. In symbolic form the concentration ratio is written as
퐶푅 = ∑ 푆 , 푚 = 4, 8, 10 … … … . . ,20
13
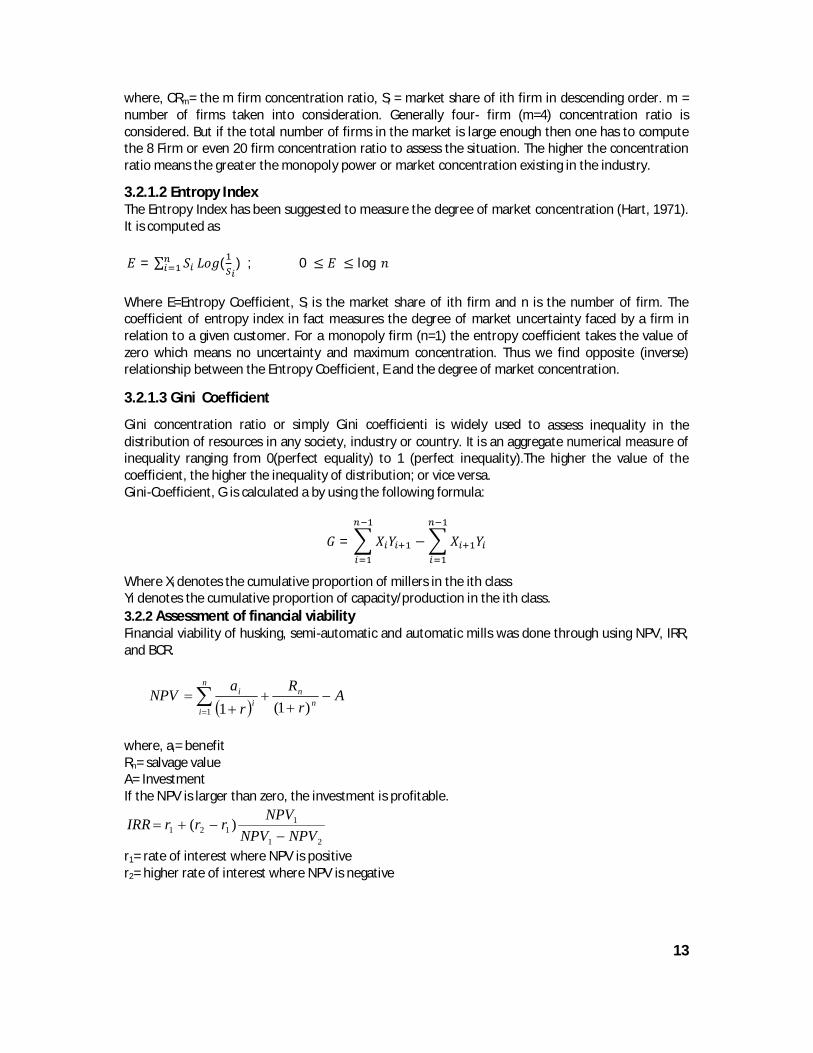
where, CRm= the m firm concentration ratio, Si = market share of ith firm in descending order. m = number of firms taken into consideration. Generally four- firm (m=4) concentration ratio is considered. But if the total number of firms in the market is large enough then one has to compute the 8 Firm or even 20 firm concentration ratio to assess the situation. The higher the concentration ratio means the greater the monopoly power or market concentration existing in the industry.
3.2.1.2 Entropy Index The Entropy Index has been suggested to measure the degree of market concentration (Hart, 1971). It is computed as
퐸 = ∑ 푆 퐿표푔( ) ; 0 ≤ 퐸 ≤ log 푛
Where E=Entropy Coefficient, Si is the market share of ith firm and n is the number of firm. The coefficient of entropy index in fact measures the degree of market uncertainty faced by a firm in relation to a given customer. For a monopoly firm (n=1) the entropy coefficient takes the value of zero which means no uncertainty and maximum concentration. Thus we find opposite (inverse) relationship between the Entropy Coefficient, E and the degree of market concentration.
3.2.1.3 Gini Coefficient
Gini concentration ratio or simply Gini coefficienti is widely used to assess inequality in the distribution of resources in any society, industry or country. It is an aggregate numerical measure of inequality ranging from 0(perfect equality) to 1 (perfect inequality).The higher the value of the coefficient, the higher the inequality of distribution; or vice versa. Gini-Coefficient, G is calculated a by using the following formula:
퐺 = 푋 푌 − 푋 푌
Where Xi denotes the cumulative proportion of millers in the ith class Yi denotes the cumulative proportion of capacity/production in the ith class. 3.2.2 Assessment of financial viability Financial viability of husking, semi-automatic and automatic mills was done through using NPV, IRR, and BCR.
where, ai= benefit Rn= salvage value A= Investment If the NPV is larger than zero, the investment is profitable.
21
1121 )(
NPVNPVNPVrrrIRR
r1= rate of interest where NPV is positive r2= higher rate of interest where NPV is negative
A
rR
raNPV n
nn
ii
i
)1(11

14
BCR= ∑ 풃풊
(ퟏ 풓)풊풏풊 ퟏ
푹풏(ퟏ 풓)풏
푨 ∑ 풄풊(ퟏ 풓)풊
풏풊 ퟏ
3.2.3 Calculation of marketing costs and margins (i) Cost accounting As par ToR costing was done by following the methods of Dawe et al (2008). ii) Gross margins and net margins of key agents in rice marketing chain were calculated by following the standard formula. Farm retail price spread measure (Kohls and Uhl, 2005) was used for miller.
3.2.4 Market integration
Market integration was examined by applying cointegration method developed by Engle and Granger (1987) and the maximum likelihood (ML) method of cointegration developed by Johansen (1998) and extended by Johansen and Juselius (1990). Eviews 6.0 and SPSS software were used for measuring the market integration. The domestic rice markets are Dinajpur, Rangpur, Naogaon, Bogra, Kushtia, Sherpur, Khulna, Dhaka, Noakhali, Comilla, Sylhet, and Chittagong for which market integration is assessed. Rice markets of Thailand, Vietnam and Eastern India have been selected for assessing integration between domestic and international rice markets. Monthly average wholesale price (real) of parboiled coarse rice during the period of 1990 to 2011 for domestic markets has been used for measuring domestic rice market integration. Market integration can also be assessed by dividing the whole period into decades. Monthly export price of parboiled rice from Thailand, Vietnam and Eastern India was converted into import parity price for the assessment of integration between domestic and international rice markets. For Bangladesh market monthly national average wholesale price of parboiled coarse rice was used.
The monthly wholesale real prices data of rice markets in Bangladesh during January, 1990 to December 2011 have been used in the analysis. A short description of the data is provided below:
tY Wholesale real prices of rice market in Dhaka (reference markets)
tY First difference of wholesale real prices of rice market in Dhaka (reference markets)
tY2 Second difference of wholesale real prices of rice market in Dhaka (reference markets)
1tY One period lagged value of wholesale real prices of rice market in Dhaka (reference
markets) 1tY First difference of one period lagged value of wholesale real prices of rice market in
Dhaka (reference markets) 1
2tY Second difference of one period lagged value of wholesale real prices of rice market in
Dhaka (reference markets) tX Wholesale real prices of rice market in selected markets
tX First difference of wholesale real prices of rice market in selected markets
1tX One period lagged value of wholesale real prices of rice market in selected markets
1tX First difference of one period lagged value of wholesale real prices of rice market in
selected markets
12
tX Second difference of one period lagged value of wholesale real prices of rice market in
selected markets t Residual term First difference residual term 2 Second difference residual term

15
1t = One period lagged of residual term
1 t = First difference of one period lagged of residual term
12
t = Second difference of one period lagged of residual term
n= Number of observation 264. 3.2.4.1 Unit root tests for stationary
To test whether the variables involved in the general model are stationary or not, unit root tests were also performed. The Augmented Dickey-Fuller (ADF) unit root test (Dickey and Fuller, 1979 and1981) was done on each variable to check for nonstationarity or order of integration. For empirical testing, the following regression equations were used.
ttt uYY 1 ttt uYY 11
ttt uYtY 121
m
ittitt YYY
1111
m
ittitt YYtY
11121
These equations have been used to conduct the tests for the variable in their level. The null hypothesis of the test is that tY is a non-stationary series. As indicated before that ADF is computed
as t-statistic. The rejection of the hypothesis requires a negative and significance t-statistics on . The tests for differences of the variable the following regression have been used.
ttt vZZ 1 ttt vZZ 10
tttt vZZZ 111 tttt vZZZ 1110
Where tt YZ Here the rejection of the null hypothesis of nonstationarity requires a negative and significance t-statistics on . If the null hypothesis tZ is nonstationarity is rejected at this stages, the series in
level i.e. tY is considered to be I (1) and first difference of the series i.e. tY is considered to be I (0).
3.2.4.2 Test for market Cointegration The definition of cointegration used here is that of Engle and Granger (1987) and is defined as follows; consider a pair of variables Yi and Yj, each of which is integrated of order d. Their linear combination, that is, εt = Yit - αYjt
were generally be I(d). However, if there is a constant , such that is I(d-b), where b0,Yj and Yi are said to be cointegrated of order d, b and the vector (1,-) is called the cointegration regression.The relation Yi = Yj might be considered as long run or equilibrium relation (Engle and Granger,1987a,b), and is the deviation from the long-run equilibrium. When Yi and Yj are cointegrated, the long-run relationship Yj - Yi = 0 will tend to be re-established after a stochastic shock. If 0 0 and 1 = 1, than the ‘weak-form’ test for market integration persists (Buongiomo and Uusivuori, 1992; Zanias, 1993; Palakas and Harriss 1993). However, in most applications, the ‘weak-form’ test for market
16
integration is usually employed in empirical analysis. Therefore, the role of the constant term 0, in equation (11) is to absorb the influence of these factors. The test involved regression the first-difference of the residual lagged level and lagged dependent variables (Engle-Granger and augmented Engle-Granger test) is as follows: For Engle-Granger (EG) test, 11 tt and
For Augmented Engle-Granger (AEG) test,
N
ktktktt
111
Again the test statistics is the t-statistics of 1. The critical values are tabulated in Fuller (1976). The null hypothesis is H0: Yi and Yj are not cointegrated. The null hypothesis is rejected if estimated 1 is negative and found to be significantly different from zero (Behura and Pradhan, 1998 and Baharumshah and Habibullah, 1994). 3.2.5 Construction of a map of rice surplus/deficit at Zila level Apparent per capita consumption is used instead of normative per capita consumption for constructing a map of rice surplus/ deficit districts. For comparing the situation of surplus/deficit over the period, we have constructed maps for three time periods i.e., (i) 1999-2001, (ii) 2004-2006, and (iii) 2009-2011. Three years moving average of rice production for three time period for each district is considered as the total production for correcting the fluctuation of production. Population for each district for the year of 2005 has been taken on the basis of the percentage of district wise population (average of two census-2001 and 2011) to the national population, because we do not have the district wise population for every year except the population census year. For calculating the national apparent per capita consumption (napcc), the following formula is used:
푛푎푝푐푐 =푡표푡푎푙 푟푖푐푒 푝푟표푑푢푐푡푖표푛 + (푖푚푝푟표푡 − 푒푥푝표푟푡) − amount of 푠푒푒푑, 푓푒푒푑 푎푛푑 푤푎푠푡푎푔푒
푡표푡푎푙 푝표푝푢푙푎푡푖표푛 표푓푎 푐표푢푛푡푟푦
Then apparent per capita consumption for a district (apccd) is calculated by using the following formula:
푎푝푐푐푑 = 푝푒푟 푐푎푝푖푡푎 푐표푛푠푢푚푝푡푖표푛 표푓푎 푑푖푠푡푟푖푐푡 푎푐푐표푟푑푖푛푔 푡표 퐻퐼퐸푆 ×푛푎푝푐푐
푛푎푡푖표푛푎푙 퐻퐼퐸푆푝푐푐
Seed, feed and wastage were accounted as 10 per cent of the total production of rice (BBS). Total amount of rice consumption for a district is calculated by multiplying the apparent per capita rice consumption with the population of that district. The surplus or deficit of rice for the particular district is obtained by subtracting total rice consumption of the district from the net availability of rice production for the specific time period. Then a map of rice surplus/deficit at zila level is constructed. The map of the extent of rice surplus/deficit at zila level is also constructed.
3.3 Stakeholder consultations
The research team consulted with the stakeholders (rice importers, personnel of public sector associated with paddy procurement, processing, distribution of rice, and the association/organizations of key actors) in rice marketing sector. For doing this we have collected the lists of the concerned stakeholders, and then communicated with a particular group of stakeholders for setting convenient time for consultations. A checklist was used to conduct the consultations and to synthesize the findings.
17
IV. Overview of the past studies of rice market
4.1 Introduction: The purpose of this section is to provide evidence on rice market structure, conduct and performance in Bangladesh on the basis of previous studies. Although there are a number of studies which are mostly devoted to rice production system (Hossain, 1980; 1984; 1986; 1987); IFDC, 1982; IFPRI/BIDS, 1985; Hossain, 1988) and a few on marketing particularly on market structure conduct and performance of rice market in the country. An attempt is made to review some of the related literatures on paddy / rice marketing. Rice is the staple food in Bangladesh which grows all over the country but its marketing system is not uniform in all areas. Marketing system of any product is composed of three essential elements such as: (i) alternative product flows (called marketing channels), (ii) variety of firms (middlemen) and (iii) numerous business activities (referred to as marketing functions) (Kohls and Uhl, 2005). For the overview of the rice marketing system very limited but relevant literatures are reviewed.
The rice marketing system has been operating both in public and private sector in Bangladesh which have been reviewed below:
4.2 Public sector Government intervention in rice marketing in the area which is now Bangladesh was occurred in 1938 and it has been continued in the form of price controls, embargo on inter district rice movement, rationing system/ shops, control on rice processing, procurement of rice/paddy etc. After partition of India, the then East Pakistan Government inherited the Bengal Food Department measures for assuring fair prices of rice to the consumers and producers. The rice marketing system was operated both in public and private sector. All imports and procurement of rice was done in the country by the Public sector. Government distributed rice/food grains through ration shops which were run by the employed agents. Ration cards were given to consumers and they received rice according to set quota for them. Government used to store paddy/rice in its 287 local storage depots, 10 big central depots and some other rented godowns. The marketing functions undertaken by the public sector were acquisition, storage and distribution. Government supplied rice was sold at uniform price all over the country. The procurement price was lower than the average free market price. During the period of 1955-56 to 1966-67 the average internal procurement in public sector was about 7% of total government held supplies of rice and import accounted for 56% of each year’s supply. The highest procurement was 0.197 million tons in 1958- 59 crop season and the highest quantity of import was 0.59 million tons in 1956-57. The distribution reached highest in the months of June and July while lowest in the months of December, January and February (Farruk, 1970). The public sector has significant influence on actions and reactions of private sector (Islam et al, 1987).
4.3 Private sector
The private sector of rice market is a decentralized conglomeration of a large number of institutions each performing a variety of functions in the marketing process. There are differences in findings regarding institutions of different authors due to use of different terminology, area of work and time of study. The common institutions are farmer, bepari, faria, traders or itinerant merchants who are the basic institution in the marketing system (Farruk, 1970).
18
Islam et al (1987) observed the different functionaries involved in food grain marketing system included farmer, faria, local full-time or part –time traders of food grains who operated in small village hat or primary market, bepari who work in primary and secondary markets, they are regular and full-time itinerant traders. The aratdar usually commission agents used to work in assembly market and larger urban central market. Sometimes they used to work as wholesalers. The other functionaries were wholesalers and retailers. The dalal operated as specialized brokers or commission agents in the market. Chowdhury (1992) identified faria, paiker, bepari, wholesaler/aratdar, and millers who were involved in paddy marketing; and millers, crusher, kutials, paikers, wholesaler/aratdar, and retailer were involved in rice marketing. Siddique (2010) found different types of intermediaries in the rice marketing system which included faria, bepari, paiker, aratdar, wholesaler and retailer. They were different by nature of business such as working place, functions performed, volume of transactions, and area coverage.
4.4 Marketing functions involved in rice marketing
Farruk’s study indicated the marketing functions such as transfer of title, processing, transportation, storage, grading and standardization, and financing. Siddique (2010) mentioned the marketing functions performed by functionaries are transportation, storage, processing, grading and standardization, financing, market information, pricing, risk bearing, buying and selling.
4.5 Marketing channels
The marketing channels of paddy /rice are not uniform in all over the country. The different channels were found in different studies in different time (Farruk 1970, Siddique 2010, Islam et al 1987). On an average 25% of marketed surplus of paddy was sold on farms to local bepari, faria or the kutial. There are dalal or brokers in the village markets also.
Islam et al 1987 presented that farmers sold 15% of paddy at farm, and 85% in local market. He has 3 alternatives to sell paddy in local markets such as to: (i) local bepari, (ii) faria, (iii) kutial. Or he can mill his paddy and then sell rice to a bepari, faria, local wholesaler, local retailer, or to consumer. This practice was followed by less than 10% of the farmers particularly small sized holders. From local market paddy was moved to secondary market from where millers and local kutial purchased paddy. The miller after processing sold rice to bepari, or aratdar. Retailers purchased rice from the aratdar and sold to consumers. Typical marketing channels are shown below (Figure 4.1):

19
The millers sold rice mainly to traders in consuming markets in different areas of the country and sometimes small quantities to local aratdar (Siddique, 2010). Chowdhury (1992) found 53 per cent of the marketed surplus of paddy was milled by small rice mills, and then 34 per cent paddy was milled by crusher and the share of major and automatic rice mills was about 10-15 per cent of marketed surplus of paddy. Mills bought most of the paddy from bepari (who buy from faria and farmers), wholesalers/aratdar (who buy from faria, bepari, and farmers), and faria (who buy from farmers). Wholesaler/aratdar was the key agents in rice marketing in that year. In the study year, approximately 13 million metric ton (MMT) of surplus paddy marketed was found and of which 69 per cent were sold at the farm gate, mostly to faria and paiker by the farmers.
4.6 Classification of markets There are also differences in classification of markets in paddy/rice marketing in the country. Markets were classified by Farruk as village /primary market, semi urban, wholesale market, and wholesale terminal market. Islam et al (1987) classified market as (a) village hat or primary market, (b) secondary market, and (c) assembly market which is generally located at riverbank, and/or major highway and rail centres, (d) Metropolitan market and the final step is the retail shop from where consumers purchased rice.
4.7 Processing sector
The processing sector was divided into commercial and non-commercial. Non-commercial sector referred to home pounding in dheki. The commercial sector covers large mills and the small husking machines. The large rice mills are characterized by equipment of several decades old. The industry was almost stagnant in respect of growth of new firms, modernization and expansion of existing firms. But the growth of husking machines was tremendous throughout the country. Almost all the mills owned steam engine which was fired by rice husks and most of them were old, purchased from processing plants in tea gardens (Farruk, 1970, p.49). Some rice mills were also powered by diesel

20
engines and electricity. In all establishments parboiling plants were powered by steam engines. The large mills did not provide custom milling services for the private traders. However, they processed paddy supplied by the government. On average the mills purchased larger share of paddy from the traders at mill premises and a small portion from farmers directly. Paddy was purchased in cash and sometimes short –term advances were made to traders to purchase paddy. The millers sold rice mainly to traders in consuming markets in different areas of the country and sometimes small quantities to local aratdar (Siddique, 2010). Islam et al (1987) in their study classified commercial rice mills into three groups (a) one-pass husking mill,(b) smaller mills uses two or more passes through huller and (c) large mills uses several passes, uses polishing and whitening machines and separation of broken and whole rice by hand or machine. Rice mills are categorized into two: (i) Engleberg type huller and (ii) Rubber roll sheller. The rubber roll shellers are either automatic or semi-automatic variety. When these shellers are accompanied by the following units are called fully automatic; (i) paddy pre-cleaning unit,(ii) conveying equipment like bucket elevators or screw conveyors; (iii) aeration equipment like blowers, aspirators, and (iv) various types of sieves and mechanical separators (Chowdhury,1992).
4.8 Structure, conduct and performance of rice market/ industry Farruk (1970) was the pioneer in applying structure, conduct, and performance approach in rice market in the then East Pakistan during October 1967 through November 1968. He examined the organizational, institutional, and functional features of rice marketing both in public and private sector. The system was analyzed in terms of efficiency and performance and thus provided a basis for public policies in marketing. Rice marketing system composed of a large number of processors, bepari, dalal, faria and aratdar. Aratdar were dominant market functionaries. He found that inter-market price differentials and inter-temporal price increase were higher than the cost of transfer and storage respectively. Theoretically this situation indicated the presence of excess profit for the market functionaries. But Farruk admitted that absence of more adequate data on business and transaction, a proper valuation of skill and time of the trader, profit computation method could be an imperfect method of measuring market imperfection. The real issue was not whether the trader earns any supernormal profits, rather the curse of the problem was whether the price differentials are large enough to weaken and distorts the proper role of prices as an allocator of resources and a distributor of income. Chowdhury (1992) noted that large price differentials per se may not be discretionary because of primitive infrastructure, or where great distances separate terminal from primary markets, or when storage cycles are long. Farruk examined market integration by using correlation coefficients between prices of different markets. Terminal and intermediate dispatch centres were characterized by a small number of aratdar with a high degree of concentration. He labeled the markets as oligopolistic as well as oligopsonistic but close observation of the functioning of this structure in the different markets did not support the prevalence of unethical market conduct. The static number of aratdar in the markets over time indicated the barriers to entry. The share of individual mills was influenced by the amount of rice milled rather than facilities or resources owned. However, lack of capital and managerial ability could restrict the purchase of raw materials and as such might result in disproportionate market shares in spite of equal plant capacity. The effect of public sector on the marketing system was much more significant. The presence of large number of paddy suppliers and large number of rice consumers supported the atomistic condition on both sides. But the picture is not same at different nodes of the paddy/ rice marketing system. The study revealed that rice markets increased rapidly due to increased marketed surplus of rice from 1970 to 1990. The paddy market was reported as thick, dense and broad. The

21
use of average price for coarse rice to study competitiveness is an indication of homogeneity of rice in the market. In rice market automatic and major rice mill handled about 15% of the marketed surplus of paddy, 53 per cent of the marketed surplus of paddy was milled by small rice mills, and then 34 per cent paddy was milled by crusher. The aratdar-cum wholesalers were powerful in the rice market as they handled about 80% -90% of all rice. No excessive concentration was found in rice milling industry. Wholesalers showed no significant higher degree of concentration than do the rice mills. Earnings at retail level were higher than those of wholesale level. The least profitable was the automatic mills followed by major rice mills and small rice mills. But profitability was not stable over the years. The large portion of rice supply and high demand for paddy was generated from the large number of small firms scattered all over the country.
In paddy market rice farmers were empowered in the study year compared to that of two decades ago. Paddy bepari sold paddy through aratdar to processors. Paddy marketing in 1989 -90 seemed to became more efficient than in 1982 -83. The study concluded that the rice agents behaved like competitive profit makers, not profiteers. 4.8.1 Market structure
In all markets aratdar were dominant player, about 80% of the total volume handled by one-third of the aratdar. Barriers exist to enter the aratdari business. The market share of mill was function of volume of paddy milled rather than capacity of the mills.
Chowdhury (1992) found that around 50 per cent of the total rice production was marketed in1990 while it was only about 15 per cent in 1970. He opined that it was the result of commercialization of rice sector and the technological change in this sector. Total number of market agents was estimated about 0.19 million and the number of consumer households were 20 million. Total number of farmers was 9 million. He found that rice market was atomistic (purely competitive market) in Bangladesh. No excessive concentration was found in rice milling industry.
Rahman (1998) conducted a study on market structure, conduct and performance of paddy processing industry in Naogaon district. He found 4-firm market share declined from 2.55% in 1993-94 to 2.40% in 1996-97. As buying market Dhaka captured about 62.27%, Narayangonj 11.11%, Chandpur 6.94% and Chittagong 9.72% of total supply. Product differentiation in rice milling industry was absent. Some barriers to entry were identified.
The findings of Siddique (2010) revealed that northern part of Bangladesh is highly concentrated as 19.13% of total mills are located in that area while only 4.35% mills are in greater Mymensingh area. But the concentration ratio of 4-Firm was higher in greater Mymensingh area than that of Northern part of Bangladesh. However, low concentration indicated presence of atomistic type of competition in the area. There was no evidence of product differentiation within a specific variety of paddy. It was evident that attempt was made to differentiate rice by manipulating the milling of paddy and assigning new name to the product such as ‘naizer shail’ and ‘minicate’. There was no barrier to entry of new firms in any levels of rice marketing system. But the entry of new firms requires lot of technical know-how, huge capital, site for business, family tradition, and reputation of the firm / entrepreneur. These could attribute as barriers to entry for new firms.
4.8 .2 Market conduct
Farruk (1970) concluded that the field observation did not support the presence of unethical market conduct with respect to price and other dimensions of market conduct. When efficient market conduct is an issue the real issue is whether the trader earns super normal profits as such profits introduce distortion. Whether wide positive margins adversely affected pricing efficiency was not

22
addressed (Farruk, 1972). No collusion among the sellers and buyers were observed but the millers complained about aratdars’ collusive activity (Rahman, 1998).
Price of paddy / rice was set through forces of demand and supply. At terminal markets high level of concentration in wholesalers / aratdar were observed. But no evidence of unethical practice in pricing and other aspects of conduct was found. Research findings supported that the millers were price taker and not price maker (Siddique, 2010).
4.8.3 Market performance
All types of rice mills were suffering from a low level of production as compared to their milling capacity. The husking mill was utilizing only 40% of its capacity at the peak and 20% in low volume month. The corresponding figures for the small commercial mills were 65% in peak volume month and about 48% in low volume month. Large commercial mills utilized 65% of its capacity in peak volume month followed by 30% in low volume month. They operated inefficiently and producing low quality rice because of lack of understanding and experience in equipment, adjustment and management. Capacity utilization of automatic rice mills was estimated at 48% by Chowdhury (1992). The net return to each of the functionaries in the channels was low due to intense competition. Excessive profit of the functionaries was not found. Farmer’s share in consumers’ expenditure on rice was 70% to 80% which was highest in the world. Inefficiency of the marketing system was observed though no excessive charges were claimed by the middlemen (Islam et al. 1987). The government procurement centres were operating below the target level and used by traders not by paddy producers. The study concluded with a good number of recommendations for the solutions of problems at different levels in the marketing chain.
Wholesalers showed no significant higher degree of concentration than do the rice mills. The least profitable was the automatic mills followed by major rice mills and small rice mills. But profitability was not stable over the years. The study concluded that the rice agents behaved like competitive profit makers, not profiteers. Capacity utilization of automatic rice mills was estimated at 48% by Chowdhury (1992). Performance of rice milling industry was examined in terms of efficiency, progressiveness and employment position (Rahman, 1998). In terms of capacity utilization of rice mills the performance of the rice milling industry was not good as most of the large and automatic mills could not utilize their processing capacity. Secondly, maximum mills were running with decades old machines (Siddique, 2010). Farruk (1970) found almost all the mills owned steam engine which was fired by rice husks and most of them were old, purchased from processing plants in tea gardens. However, this industry has employed a large number of people of which a significant portion is women (Siddique, 2010). The reasons for low capacity were identified as lack of paddy, frequent electricity disturbances and shortage of capital. Other reasons were transportation, government restriction, high cost of labour and lack of storage facility.
4.9 Summary of the lessons learned from overview of literature
The rice marketing system has been operated both in public and private sector from 1938.The influence of public sector on conduct of private sector was significant. In private sector the institutions varied in number and also in functions. The size of paddy market has been expanding

23
over the years. No uniform marketing channels are existed all over the country. Differences were found in classifying paddy/rice markets by different researchers. The differences emerged due to differences in study areas, time of study and non-use of uniform terminology. Drastic changes have been occurred in processing both in non-commercial and commercial sector in the country. Dheki has been replaced by machines and various improvements have been made in machines too. But most of the mills used age old machines.
It was pointed out that paddy market was dominated by aratdar, barriers exist for new entrant. Considering the large number of paddy farmers, market agents and huge number of ultimate consumers of rice, rice market is considered as purely competitive. No excessive concentration was found in rice milling industry in the respective study areas. In fact none of the study measured concentration in strict sense. The evidence of product differentiation within a specific variety of rice was not reported. None of the researchers’ findings revealed any unethical conduct of traders in rice market. The overall performance of rice mills in the country is not satisfactory as most of the mills of various categories were suffering from low level of capacity utilization. Net return to market functionaries was low due to intense competition. So no excessive profit was earned by them.

24
V. Structure, conduct and performance of rice market in Bangladesh
This section deals with the marketing system of paddy and rice in the perspective of structure, conduct and performance approach. First, it identifies the actors involved in the supply chain of rice and describes their functions, which are presented below. Secondly, the Structure, conduct and performance of rice milling industry in Bangladesh are examined.
The supply chain describes a longer channel stretching from raw materials to components to final products that are carried to final buyers. The supply chain represents a value delivery system. Each company captures only a certain percentage of the total value generated by the supply chain. When a company acquires competitors or moves upstream or downstream, its aim is to capture a higher percentage of supply chain value (Kotler, 2002).
The supply chains of paddy as found in the study areas are shown in Figure 5.2. The actors as observed in the paddy part of the supply chain are business traders such as faria, bepari and aratdar-cum-wholesaler, miller and processor.
Market structure refers to those organizational characteristics of a market which determine the relations (a) of sellers in the market to each other, (b) of buyers in the market to each other, (c) of the sellers to buyers, (d) of sellers established in the market to potential new firms which might enter it (Bain, 1698). Market structure means those characteristics of the organization of a market which seem to exercise a strategic influence on the nature of competition and pricing within the market.
The most salient aspects or dimensions of market structure are: (a) The degree of seller concentration- described by the number and size distribution of seller in the market.
(b) The degree of buyer concentration – described by the number and size distribution of buyers in the market.
(c) The degree of product differentiation as among the outputs of various sellers in the market- that is, the extent to which their outputs (though similar) are viewed as non-identical by buyers.
(d) The condition of entry to the market – referring to the relative ease or difficulty with which new sellers may enter the market.
5.1 Paddy market The infrastructural condition of the paddy markets is very poor in the country. There are both similarity and dissimilarity exist in paddy markets over the country. Most markets sit once or twice in a week. Generally it lasts 6.30 a.m. to 9.30 or 10.0 a.m. The paddy markets which were included in this study are shown (Annex Table 5.1) with some pertinent information.
5.2 Paddy trader During the field study three types of paddy traders were found whose distribution is presented in Annex Table 5.2. The sample of paddy traders included aratdar-cum-wholesaler (39%), bepari (47%) and faria (14%). It was also revealed from the field study that automatic mill owners employed agents to collect paddy directly from farmers’ house or from village paddy markets in distant areas.

25
The distribution of traders according to age reveals that about 41% respondents are in the age group of 31 – 40 years, followed by about 33% in the age group of 41 – 50 years and only 2% were above 60 years (Annex Table 5.3). 5.3 Description of paddy traders 5.3.1 Faria and bepari
They are petty traders. They are generally part-time and seasonal traders. In off-season they shifted to other business. They do not have permanent establishment for business. But they mostly work around their local area and market. They operated in 3 / 4 markets which covered about 8.22 km from their residence. The difference between faria and bepari is mainly the size of business. The bepari handled relatively larger size of business than that of faria. Financially the bepari is stronger than faria. Generally they are self- financed but sometimes borrowed from relatives or the paddy buyers. 5.3.2 Aratdar -cum-wholesaler
Aratdar is a trader who possesses permanent establishment in market place and holds license for business. He does not buy product in his own account i.e. he does not take title to the goods. But he takes the possession of the goods and makes arrangement to sell those, collects money from the buyers and sends remittances to suppliers (sellers) after deducting all costs incurred in completing the process of selling. The aratdar receives a fixed rate of commission on sales. In paddy market we found the aratdar who works for the millers. In many cases the Millers advanced funds for buying paddy to aratdar with guidelines about the quality of paddy, quantity and price range. The aratdar purchases paddy according to the direction of the millers along with his business experience. After building the sizeable lot paddy is transported to miller’s place. All tasks of bagging, weighing, sewing and loading is done by the aratdar’s people. Aratdar has one or two permanent labour and some contract labour who works more than one Arat. Most of the cases bags are supplied by the millers. Transportation cost is born by the millers. The rate of commission for the aratdar varies from area to area which ranged from Tk.20 to Tk.30 per quintal. Aratdar facilitates the transfer of paddy from paddy trader/ farmer to millers.
When the aratdar acts both as aratdar and wholesaler, then he may be called as aratdar-cum-wholesaler. Depending on the market situation aratdar may act as aratdar as well as wholesaler. About 57% traders completed 6- 10 years of schooling while 25% attended up to 5 years, followed by 10 % completed 12 years and another 8% were above 12 years (Annex Table 5.4). Paddy business was found as the main occupation for 95% of the sample traders (Annex Table 5.5). A larger portion of the business people (86%) started this business after 1990, of which 48% during 2001 -2010 (Annex Table 5.6). 5.3.3 Rice Miller A person who owns any type of rice mills is known as rice miller and purchases paddy from various sources such as paddy traders (bepari and aratdar) and also from large farmers. They collect paddy from different areas/ districts of the country. Small millers purchase paddy from the local market themselves mainly and through aratdar also. Large millers purchase paddy through aratdar mainly from distant markets (from other districts) and also from the local market.

26
5.3.4 Paddy processor
A group of traders involved in paddy processing without having mill of their own. They purchase paddy from the faria and bepari. They use to hire milling facility that is husking mill, chatal (drying yard) and labour for processing paddy. In some places they also go for sorting and polishing the milled rice for quality improvement. They sell milled rice to wholesaler-cum-retailer and retailer.
5.4 Structure of paddy market The structure of rice market is examined and analyzed based on four criteria: (1) degree of seller and buyer concentration, (2) entry barriers, (3) assortment of product quality and (4) distribution of market information. 5.4.1 Concentration At the farm level the paddy growers are numerous and individually produce a very small part of the total marketed surplus. Thus the individual producers had no power to influence the market. So seller concentration at farm level is very low. On the other hand paddy-buyer concentration in the study area was high (Figure 5.1 and Annex Table 5.7). In Birganj, Abadpukur, Naimile and Kalampur, Abbari and Nalitabari market, the 4-firm concentration ratios are 75 per cent and above. On the other hand, this ratio is comparatively lower (less than 50 per cent) in case of Ailchara, Haris Chowdhury, Dharabazer, Mirsharai, Kalirghat, and Halsa market
Figure 5.1: Buyer concentration in paddy market 5.4.2 Entry barriers To have an idea about the barriers for the new entrant the established traders were asked to comment on the problems for the new entrant to paddy markets. The responses of the established traders are presented in Annex Table 5.8. The table reveals that arrangement of sufficient capital was the highest problems for the three groups of traders followed by suitable site for the shop and business risk.
0
10
20
30
40
50
60
70
80
90
Birg
anj,
Din
ajpu
r
Aba
dpuk
ur, N
aoga
on
Nai
mile
Baz
ar, B
ogra
Kala
mpu
r, D
haka
Am
bari
, Din
ajpu
r
Nal
ita
Bari
, She
rpur
Chan
dina
, Com
illa
Shat
ibar
i Baz
ar, R
angp
ur
Dha
ntar
a, D
haka
Fult
ala,
Khul
na
Trim
ohin
i, N
aoga
on
Shar
ua-B
otta
la B
azar
,Bog
ra
Farm
hat,
Din
ajpu
r
Chou
dhur
ani,
Rang
pur
Ailc
hara
Baz
ar, K
usht
ia
Har
is C
houd
hury
Baz
ar, …
Dha
ra B
azar
, Mym
ensi
ngh
Mir
shar
ai, C
hitt
agon
g
Kalir
ghat
, Kaz
ir B
azar
, …
Hal
sa, K
usht
ia
Conc
entr
atio
n of
4-f
irm
(%)
Markets

27
The established firms /traders also faced problems at the time of entry to this business (Annex Table 5.9). The first three problems were insufficient capital, competition among traders and suitable site for shop. There is a slight change in problems over the time. Now, suitable site for shop is the 2nd most problem whereas it was in 3rd problem in earlier. Business risk is the 3rd problem for new entry now though it was 4th problem for most of the actors (details can be seen in Annex Tables). 5.4.3 Degree of product differentiation The assortment of paddy measures the extent to which buyers differentiate or distinguish their specific preferences among competing types of paddy. In the country different varieties of rice are grown in different seasons. The paddy available in the market can be grouped into according to production season i.e. Aus, Aman and Boro. The paddy can be divided into aromatic and non-aromatic paddy, fine paddy and coarse paddy. The types of paddy which were found during the field study are: Katari bhog, Pajam,mainly BRRI dhan-28 and BRRI dhan-29,Swarna, Hira, Ranjit, Chinigura, Najirshail, Guti Swarna and Miniket. The traders were not strictly confined in handling any particular variety of paddy but it depends on the area and availability of paddy in that area along with the order of the buyers. However, the number of varieties of paddy handled by faria was less as compared to bepari and aratdar-cum-wholesaler. Though there are difference in paddy in terms of variety and quality but no deliberate effort is made to make the paddy differentiated in the market. 5.4.4 Distribution of market information At the field level there is no formal system of dissemination of market information on paddy marketing to paddy traders. But it was observed that the paddy traders collect market information from various sources. Generally Faria and Bepari collect market information by their own observation and also from fellow traders. Telephone is also used by the bepari for collection of market information from the potential buyers in other markets. Aratdar-cum-wholesaler mainly collects market information by telephone. It may be noted that Department of Agricultural Marketing (DAM) disseminates market information especially on price of paddy in some selected markets of the country. 5.4.5 Conduct at paddy market 5.4.5.1 Price setting In buying paddy bargaining is the most common method of setting paddy price as mentioned by all the faria, 97% bepari and 97% aratdar-cum-wholesaler. But the picture is a bit different during selling paddy by the paddy traders. Faria reported that bargaining (60%) between faria and other paddy trader is the most common method followed by set by seller (17.78%), set by buyer (11.11) and predetermined (11.11). Bargaining was the process of setting selling price of paddy as mentioned by 62% bepari followed by setting by seller 18.63%, setting by buyer (8.70%) and predetermined (10.56%). Among the aratdar-cum-wholesalers 59.39% mentioned bargaining as the way of setting selling price followed by setting by seller(27.07%), setting by buyer (6.77 %) and predetermined ( 6.77%), shown in Annex Table 5.10. About 53% of faria, 47 % bepari and 70% aratdar-cum-wholesalers did not pay same price to all the paddy sellers for the same quality of paddy. The reasons for variation in prices as perceived by the
28
buyers are shown in Annex Table 5.11. About 31% of the paddy traders sold paddy to a single paddy buyers, while 69% traders used to sell to many buyers. It indicates that the paddy market is competitive as the existence of loyal customers is not high (Annex Table 5.12). The reasons for selling paddy to a single buyer by faria and bepari were almost similar in ranking. They are proximity of buyer, regular buyer, and reputation of the buyer, limited demand in the area, advanced funds and relatively lower price offered by other buyers (Annex Table 5.13). There is slight change in ranking of reasons by the aratdar-cum-wholesalers and the percentages of responses were lower than that of faria and bepari. In response to question about selling to more than one buyer the respondents opined that a single buyer offered lower price and it was mentioned by 100%, 98.90% and 79.41% of faria, bepari and aratdar-cum-wholesaler, respectively. The other reasons for selling paddy to many buyers were limited demand for individual firm and presence of reputed firms. The highest percentage of aratdar-cum-wholesaler (94) noted that not paying in advance was the reason for selling paddy to many buyers (Annex Table 5.14). In response to the question of whether the paddy buyers pay higher price in the case of credit sale, only 61% of them replied. None of the faria and bepari replied affirmatively, while only 18.31% of aratdar-cum-wholesaler mentioned that the buyers pay higher price in the case of credit purchase (Annex Table 5.15). 5.4.5.2 Product policy In paddy market the paddy traders had not undertaken any product policy but before buying paddy they try to check the quality of paddy through experience and eye estimation. Generally good quality paddy should include the following criteria:
Uniformly mature kernels Uniform size and shape Free of fissures Free of empty or half filled grains Free of contaminants such as stones, weed seeds etc.
None of the traders are involved in any activity except to store paddy for a very short time. It was found that faria did not store paddy except 33.33 % in Dinajpur district. But bepari (31.68%) used to store paddy in some districts such as Dinajpur, Naogaon, Bogra, Kushtia and Dhaka while 21.42% aratdar-cum-wholesalers retain some paddy in store. Generally paddy is stored in their own houses or stores. There is a common belief that traders store paddy at farmer’s house but such evidence was not found in the field study. 5.4.5.3 Sales promotion policy No sales promotion policy was undertaken by any of the sample respondents. However, reputation of the trader, quality of service, and pattern of behaviour acted as promotional means of the paddy traders. The benefits accrued from the paddy buyers varied from trader type to type (Annex Table 5.16). Cash purchase of paddy was considered as one of the benefits by the largest percentage of faria (92%) followed by supply of market information (82%), timely purchase of paddy (80%), advance

29
payment for purchase of paddy by trader (25%). In the case of bepari the order of benefits was similar to that of faria. In term of percentages of responses the benefits enjoyed by the aratdar-cum-wholesaler from paddy buyers i.e. millers are purchase of paddy in cash (75%), supply of market information (73%), timely purchase of paddy (60%), advance payment(12%) and price premium on quantity of paddy.
5.5 Some basic information of rice mill The sample of rice mills consists of 16 automatic, 24 semi-automatic and 70 husking mills (Annex Table 5.17). Only 18% of the mills are owned and operated through partnership basis while 76 % mills are run by single ownership (Annex Table 5.18)
All the sample rice mills were established after liberation of Bangladesh i.e. after 1971. During 1980s and 1990s mills of different categories were established. However, the larger number of mills of different categories was established in 1990-99 followed by 2000- 2009(Annex Table 5.19).
5.5.1 Mill area Thirty nine percent of the mills owned upto 50 decimals of land followed by 36% mills having 51 to 100 decimals, 13% mills 101 to 150 decimals. More than six percent of the mills have compound of more than 251 decimals of land (Annex Table 5.20).
5.5.2 Variety of paddy processed by mills Generally the rice mill is not involved in processing any single variety of paddy. The common practice is to process two to five varieties but on average three varieties are processed by 50% of all categories of rice mills. The three varieties of paddy are not same but they differ both within the category and between categories of rice mills.
5.6 Rice traders
The intermediaries involved in rice trading between rice millers and consumers as found in the field survey are presented in Annex Table 5.21. About 37% traders are in the age group of 41 -50 years followed by 36% in the group of 31 – 40 years, 16-% in 51 -60 years while 9% were in the age group of up to 30 years and 2 % were above 60 years ( Annex Table 5.21).
All the rice traders were very much professional as dealing in rice was the main occupation of the sample traders (Annex Table 5.22). Hundred percent of wholesaler cum aratdar, wholesaler cum retailer and retailer, and 97 per cent of aratdar and wholesaler were involved in rice trading.
The different categories of rice traders has a long period of experience in rice trading as evident from their starting time of rice business (Annex Table 5.23). Forty six per cent traders started their business during 1991-2000 followed by 32 per cent during 2001 -2011 and 18 per cent during 1981-1990. Rice trading is operated both in partnership and self-proprietorship. About 98% firms were run by single ownership (Annex Table 5.24). 5.6.1 Variety of rice handled The rice traders were also not confined in handling any single variety of rice but it depends on the market demand. However, the number of varieties of rice handled by retailer was more as compared to other traders.

30
5.6.2 Loyalty to sellers In wholesale market traders’ loyalty was not reported as only about 4% wholesalers used to buy regularly from the same rice suppliers followed by 18 % wholesaler-cum-retailers and only 15% retailers.
5.7 Marketing channel
To consider the link between actors of rice market who are involved in moving the product from producers to ultimate consumers, we have discussed the concept of marketing channels. Marketing channel links producers and final consumers. According to Kotler and Armstrong (1997) marketing channel is a set of interdependent organizations involved in the process of making a product or service available for use or consumption by the consumer or business user. The complexity of the channel depends on the distance between the producers and the ultimate consumers or users.
A typical marketing channel of paddy and rice which is observed during the field study is presented in Figure 5.2.
Figure 5.2: Typical Marketing Channels of Paddy/ Rice in Bangladesh Source: Field Survey, 2012 In the case of paddy and rice markets, attempts are made to identify all important intermediaries that operate at different points of the distribution channels and the functions performed by them. It is a conventional channel where actors are pre-occupied with cost, volume and investment relationships at a single stage of the marketing process. It is relatively easy to enter the channel, and coordination among channel members is primarily achieved through bargaining and negotiation (Lutz, 1994).
Procurement centre
Government procurement
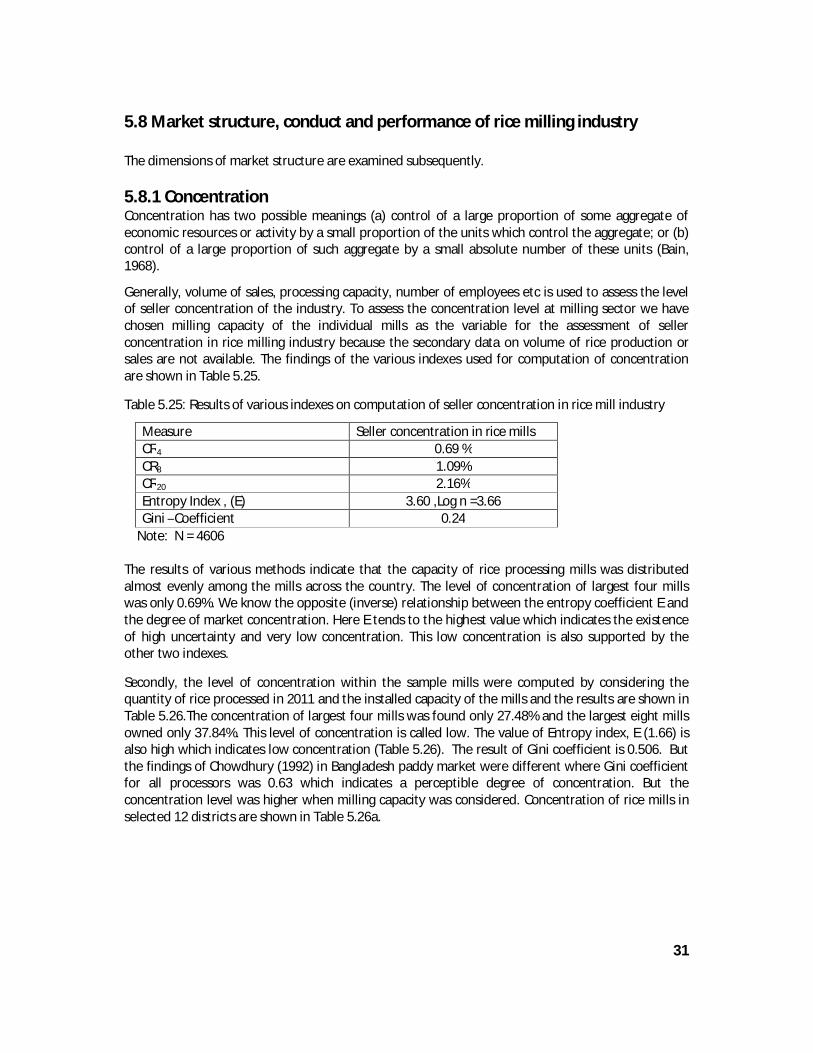
31
5.8 Market structure, conduct and performance of rice milling industry
The dimensions of market structure are examined subsequently.
5.8.1 Concentration Concentration has two possible meanings (a) control of a large proportion of some aggregate of economic resources or activity by a small proportion of the units which control the aggregate; or (b) control of a large proportion of such aggregate by a small absolute number of these units (Bain, 1968).
Generally, volume of sales, processing capacity, number of employees etc is used to assess the level of seller concentration of the industry. To assess the concentration level at milling sector we have chosen milling capacity of the individual mills as the variable for the assessment of seller concentration in rice milling industry because the secondary data on volume of rice production or sales are not available. The findings of the various indexes used for computation of concentration are shown in Table 5.25.
Table 5.25: Results of various indexes on computation of seller concentration in rice mill industry
Measure Seller concentration in rice mills CR4 0.69 % CR8 1.09% CR20 2.16% Entropy Index , (E) 3.60 ,Log n =3.66 Gini –Coefficient 0.24
Note: N = 4606 The results of various methods indicate that the capacity of rice processing mills was distributed almost evenly among the mills across the country. The level of concentration of largest four mills was only 0.69%. We know the opposite (inverse) relationship between the entropy coefficient E and the degree of market concentration. Here E tends to the highest value which indicates the existence of high uncertainty and very low concentration. This low concentration is also supported by the other two indexes.
Secondly, the level of concentration within the sample mills were computed by considering the quantity of rice processed in 2011 and the installed capacity of the mills and the results are shown in Table 5.26.The concentration of largest four mills was found only 27.48% and the largest eight mills owned only 37.84%. This level of concentration is called low. The value of Entropy index, E (1.66) is also high which indicates low concentration (Table 5.26). The result of Gini coefficient is 0.506. But the findings of Chowdhury (1992) in Bangladesh paddy market were different where Gini coefficient for all processors was 0.63 which indicates a perceptible degree of concentration. But the concentration level was higher when milling capacity was considered. Concentration of rice mills in selected 12 districts are shown in Table 5.26a.

32
Table 5.26: Seller concentration in sample rice mill
Seller concentration in sample mills Measure Rice processed in last year Installed capacity CR4 27.48 39.05 CR8 37.84 45.91 CR20 56.23 61.84 Entropy Index , (E) 1.76
Log n = 2.041 1.66
Log n = 2.041
Gini –Coefficient 0.506 0.549 Note: N= 110 However, our in-depth survey shows that in each of the study area 60 to 80% of paddy is processed by automatic rice mills while the rest 20 % by semi-auto and husking mills. In Sherpur district on an average 50% of the rice is processed by only two automatic mills and the rest of 50% are processed by more than 500 semi-auto and husking mills as reported by the millers during our field survey. But this respondent’s perception is not supported by the findings of four firm concentration ratio (Table 5.26a). Low four firm concentration ratio might be found due to inclusion of all mills of the area in calculation though a considerable number of mills are not in operation currently. Thus the automatic mills could process a larger portion of the total rice production. On the other hand, the degree of buyer concentration of milled rice was relatively low at wholesale level.
Table 5.26a: Concentration of rice mills in selected districts
Name of District Market Concentration
CR4 CR8 CR20 Gini-Coefficient Entropy Index
Dinajpur 1.77 3.03 6.81 0.204 3.023 Sylhet 16.15 27.15 47.71 0.286 1.793
Sherpur 6.02 10.91 25.21 0.065 1.94 Rangpur 4.92 6.97 11.04 0.235 2.768 Naogaon 2.17 4.23 9.35 0.199 2.758 Kushtia 8.57 12.09 16.09 0.19 2.424 Khulna 18.31 26.11 45.92 0.323 1.838 Dhaka 24.20 44.70 92.79 0.177 1.332 Comilla 10.58 21.16 52.91 0.321 1.691 Chittagong 15.29 29.29 71.28 0.192 1.497 Bogra 1.14 2.12 4.60 0.224 3.129 Noakhali 20.07 33.86 2.3 0.294 1.543
5.8.2 Product differentiation
The degree of product differentiation refers to the extent to which buyers differentiate, distinguish, or have specific preferences among the competing outputs of the various sellers established in an industry.
We know the source of product differentiation within an industry includes all considerations which may induce buyers to prefer one competing output to another. Those are differences in quality and design, ignorance of buyers, and persuasive sales promotion activities. In the case of processed rice the millers use their own name to sell their rice. Some of the symbols used on the rice bag are Rose, Dolphin, Double Green Coconut, Double pigeon, Dhanershish, tuberose etc. In some cases source of
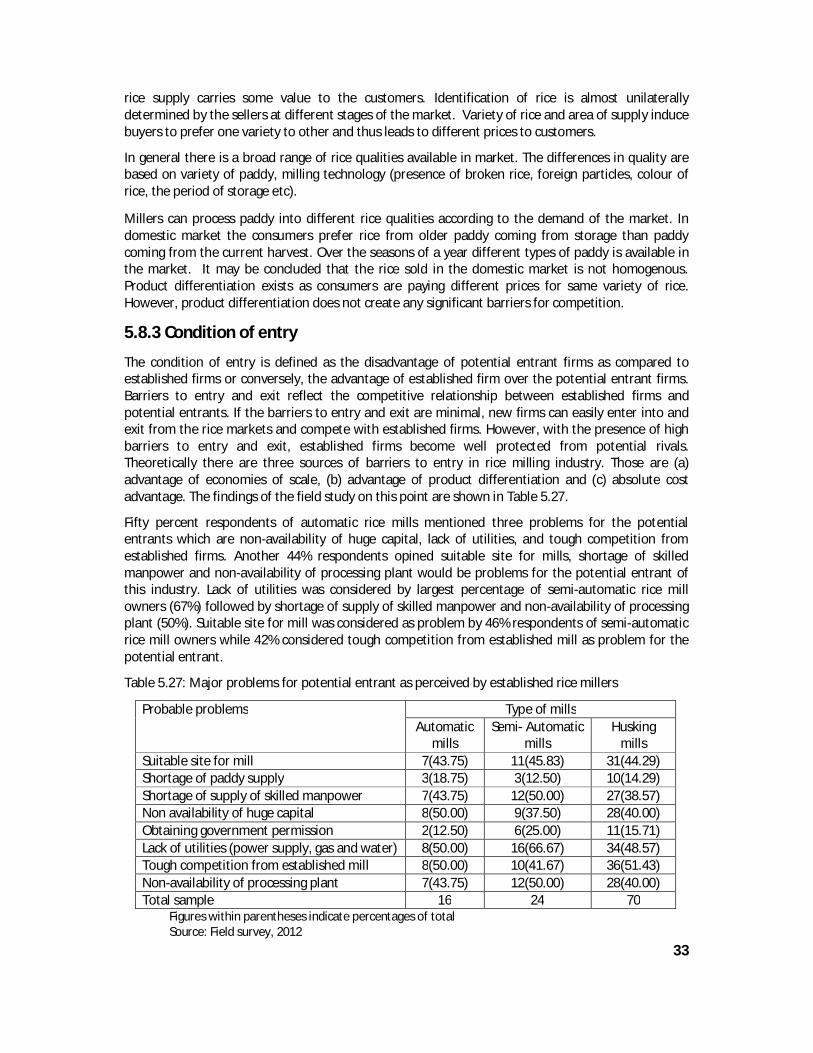
33
rice supply carries some value to the customers. Identification of rice is almost unilaterally determined by the sellers at different stages of the market. Variety of rice and area of supply induce buyers to prefer one variety to other and thus leads to different prices to customers.
In general there is a broad range of rice qualities available in market. The differences in quality are based on variety of paddy, milling technology (presence of broken rice, foreign particles, colour of rice, the period of storage etc).
Millers can process paddy into different rice qualities according to the demand of the market. In domestic market the consumers prefer rice from older paddy coming from storage than paddy coming from the current harvest. Over the seasons of a year different types of paddy is available in the market. It may be concluded that the rice sold in the domestic market is not homogenous. Product differentiation exists as consumers are paying different prices for same variety of rice. However, product differentiation does not create any significant barriers for competition.
5.8.3 Condition of entry
The condition of entry is defined as the disadvantage of potential entrant firms as compared to established firms or conversely, the advantage of established firm over the potential entrant firms. Barriers to entry and exit reflect the competitive relationship between established firms and potential entrants. If the barriers to entry and exit are minimal, new firms can easily enter into and exit from the rice markets and compete with established firms. However, with the presence of high barriers to entry and exit, established firms become well protected from potential rivals. Theoretically there are three sources of barriers to entry in rice milling industry. Those are (a) advantage of economies of scale, (b) advantage of product differentiation and (c) absolute cost advantage. The findings of the field study on this point are shown in Table 5.27.
Fifty percent respondents of automatic rice mills mentioned three problems for the potential entrants which are non-availability of huge capital, lack of utilities, and tough competition from established firms. Another 44% respondents opined suitable site for mills, shortage of skilled manpower and non-availability of processing plant would be problems for the potential entrant of this industry. Lack of utilities was considered by largest percentage of semi-automatic rice mill owners (67%) followed by shortage of supply of skilled manpower and non-availability of processing plant (50%). Suitable site for mill was considered as problem by 46% respondents of semi-automatic rice mill owners while 42% considered tough competition from established mill as problem for the potential entrant.
Table 5.27: Major problems for potential entrant as perceived by established rice millers
Probable problems Type of mills Automatic
mills Semi- Automatic
mills Husking
mills Suitable site for mill 7(43.75) 11(45.83) 31(44.29) Shortage of paddy supply 3(18.75) 3(12.50) 10(14.29) Shortage of supply of skilled manpower 7(43.75) 12(50.00) 27(38.57) Non availability of huge capital 8(50.00) 9(37.50) 28(40.00) Obtaining government permission 2(12.50) 6(25.00) 11(15.71) Lack of utilities (power supply, gas and water) 8(50.00) 16(66.67) 34(48.57) Tough competition from established mill 8(50.00) 10(41.67) 36(51.43) Non-availability of processing plant 7(43.75) 12(50.00) 28(40.00) Total sample 16 24 70
Figures within parentheses indicate percentages of total Source: Field survey, 2012
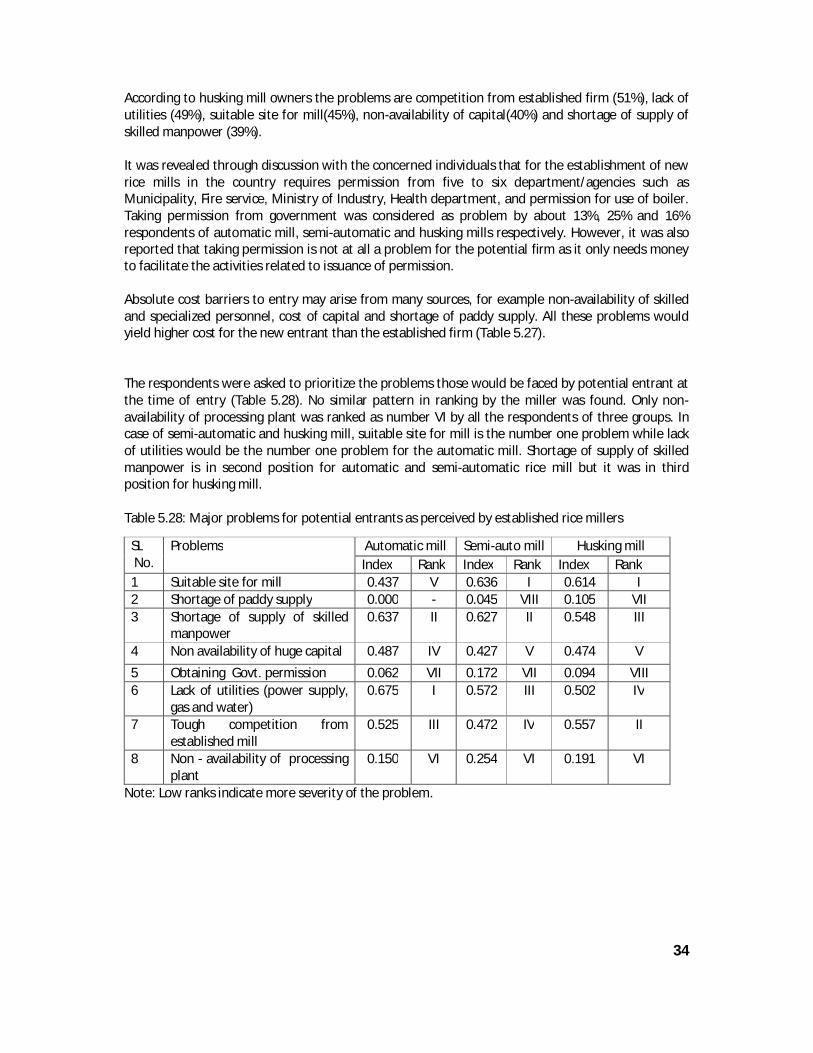
34
According to husking mill owners the problems are competition from established firm (51%), lack of utilities (49%), suitable site for mill(45%), non-availability of capital(40%) and shortage of supply of skilled manpower (39%). It was revealed through discussion with the concerned individuals that for the establishment of new rice mills in the country requires permission from five to six department/agencies such as Municipality, Fire service, Ministry of Industry, Health department, and permission for use of boiler. Taking permission from government was considered as problem by about 13%, 25% and 16% respondents of automatic mill, semi-automatic and husking mills respectively. However, it was also reported that taking permission is not at all a problem for the potential firm as it only needs money to facilitate the activities related to issuance of permission. Absolute cost barriers to entry may arise from many sources, for example non-availability of skilled and specialized personnel, cost of capital and shortage of paddy supply. All these problems would yield higher cost for the new entrant than the established firm (Table 5.27). The respondents were asked to prioritize the problems those would be faced by potential entrant at the time of entry (Table 5.28). No similar pattern in ranking by the miller was found. Only non- availability of processing plant was ranked as number VI by all the respondents of three groups. In case of semi-automatic and husking mill, suitable site for mill is the number one problem while lack of utilities would be the number one problem for the automatic mill. Shortage of supply of skilled manpower is in second position for automatic and semi-automatic rice mill but it was in third position for husking mill. Table 5.28: Major problems for potential entrants as perceived by established rice millers
SL No.
Problems Automatic mill Semi-auto mill Husking mill Index Rank Index Rank Index Rank
1 Suitable site for mill 0.437 V 0.636 I 0.614 I 2 Shortage of paddy supply 0.000 - 0.045 VIII 0.105 VII 3 Shortage of supply of skilled
manpower 0.637 II 0.627 II 0.548 III
4 Non availability of huge capital 0.487 IV 0.427 V 0.474 V
5 Obtaining Govt. permission 0.062 VII 0.172 VII 0.094 VIII 6 Lack of utilities (power supply,
gas and water) 0.675 I 0.572 III 0.502 IV
7 Tough competition from established mill
0.525 III 0.472 IV 0.557 II
8 Non - availability of processing plant
0.150 VI 0.254 VI 0.191 VI
Note: Low ranks indicate more severity of the problem.

35
Table 5.29: Problems faced by the established rice mills at the time of entry
SL no.
Problems Automatic mill Semi-auto mill Husking mill
Index Rank Index Rank Index Rank 1 Shortage of paddy supply 0.112 VI 0.390 V 0.317 V 2 Shortage of supply of skilled manpower 0.612 II 0.545 II 0.488 II 3 Non availability of huge capital 0.900 I 0.890 I 0.842 I 4 Obtaining government permission 0.050 VII 0.136 VII 0.134 VII 5 Lack of utilities (power supply, gas and water) 0.550 III 0.536 III 0.462 III 6 Tough competition from established mill 0.500 IV 0.509 IV 0.442 IV 7 Non - availability of processing plant 0.275 V 0.254 VI 0.254 VI
Note: Low ranks indicate more severity of the problem.
The respondents of different categories of mills ranked the problems in order to severity of the problems which they faced at the time of entry (Table 5.29). Five out of seven problems were ranked in similar order by the respondents of different groups of mill. These problems are non availability of huge capital, shortage of supply of skilled manpower, lack of utilities, tough competition from established mill, and obtaining government permission.
There was evidence of exit of rice mills from the market particularly the husking mill and the reasons for such exit as perceived by different group of mill owners are presented in Table 5.30. The major reason was loss in business as mentioned by 88%, 92% and 79% respondents of automatic, Semi-automatic and husking mills, respectively. The second important reason was inability to survive in the face of competition as mentioned by 80% automatic and 79% of semi-automatic mill owners. The third problem as identified by 25% of automatic mill owners was left for abroad while shift to other business was reported by 46% and 23% of semi-automatic and husking mill owners, respectively.
Table 5.30: Reasons for exit from the market
Reasons Automatic mills
Semi- Automatic mills
Husking mills
Frequency of responses Incurred a loss 14 (87.5) 22(91.67) 55(78.57) Shift the location 0 2(8.33) 4(5.71) Shift to other business 2(12.5) 11(45.83) 16(22.86) Conflict among the partners 0 2(8.33) 1 (1.43) Left for abroad 4(25.0) 3(12.50) 0 Could not survive in the face of competition 8 (50.0) 19(79.17) 49 (17.00)
Figures within parentheses indicate percentages. Source: Field survey, 2012
5.8.3.1 Possibility of new entry within 3 to 5 years The millers were requested to comment on the possibility of new entry in rice milling industry within next three to five years. Of the selected sample 56%, 67% and 54% of automatic mills, semi-automatic mills and husking mills, respectively responded, of which 89%, 88% and 87% opined that entry would be occurred in future.
5.8.3.2 Upscale of the existing mills Only 39% of sample mills answered and all of them opined that possibility of upscale of existing mills exists in the country.

36
5.8.4 Market conduct Market conduct refers to firm’s behaviour in changing prices, outputs, product characteristics, selling expenses, and research expenditures. A firm not only sets its own tactics but also reacts to those of its rivals until a consistent result (that is, equilibrium) prevails across the entire market (Caves, 1977). For simplicity, market conduct may be divided into three areas of business policy which includes (i) policies toward setting prices, (ii) policies toward setting the quality of the product and (iii) Policies aimed at coercing rivals. Those policies are discussed below. 5.8.4.1 Price Policies Selling price of rice is set independently by the individual firm. The common practice in setting selling price is to consider the cost of paddy plus processing and handling cost and a certain amount of profit per unit of product. Market price is determined through negotiation between selling firm and buyer. Both the parties check the prevailing price in the market. The automatic rice mill owners were in better position in negotiation. In the case of husking and semi-automatic mills, they set selling price after considering the neighbouring firm’s price, and in this case buyer’s are more powerful. 5.8.4.2 Product Policy Paddy processing technology has been changing very rapidly over the time. It is now possible to provide rice free from any sort of foreign particles, change in colour of rice, regulation of moisture content in rice, regulation of storage life of milled rice. It is also possible to increase keeping time of cooked rice. The automatic and semi-automatic mills can process rice according to buyer’s choice (single boiled or double boiled). Although there is differentiation in product by variety, quality and supply sources but there is no effort on the part of the millers to promote sale of rice. Product differentiation however created goodwill of the firm which serves as reservoir of buyer preference that sellers pursue avidly. It was also reported that sometimes the millers supply rice with labeling as per direction of trader- buyers. 5.8.4.3 Policies aimed at coercing rivals
It appears that there are some highly developed automatic mills located in different areas of the country along with large number of competitive fringe of small size husking mills. Yet the automatic mills do not feel any tough competition. But the competitive fringe of husking mills is facing problems both in procuring paddy and selling rice in markets. Automatic and semi-automatic mills can offer better terms of sale (credit sell, higher commission) for the buyers in the market than the husking mills. There is no evidence of predatory and/or exclusionary tactics adopted by the established firms in rice market. 5.8.4.4 Mode of rice sale
Mode of sale of rice is different at different levels at the marketing channels. The millers sell rice in three forms namely cash, credit and partly cash and partly credit (Annex Table 5.31). Mode of sale depends on many factors such as financial position, volume of business, profit rate, business relations, and market condition. Generally credit sale is extended for 1 to 7 weeks for the buyers. However, it rolls over the time. In the case of credit sale of rice only 10 % automatic mills reported to charge Tk. 100 more per quintal of rice. Out of 24 semi-automatic mills 25% of them answered of which only two millers reported to charge a price higher by Tk. 175 per quintal of rice. Fifty four percent husking mill did not answer on this question. One out of 32 husking mills reported to add Tk. 250 more to a quintal of rice sold on credit.

37
5.8.4.5 Access to credit
Theoretically, the sources of capital for an entrepreneur in Bangladesh are own fund, banks, NGOs, money lenders, friends/relatives and traders. The field survey reveals that all the sample rice mills borrowed from institutional source i.e. banks (Annex Table 5.32). There is variation in choice of banks among the three categories of mills. Only 2% of husking mill has borrowed from traders. The interest rate varies from bank to bank and even client to client of a specific bank. The automatic mill owners borrowed fund from bank at the interest rate which varied from 13 % to17.5 %, and 15% % to 18% for semi-automatic mill owners while the range of interest was 12.5% to 18% in the husking mill. The traders provided credit at the interest rate of 35%. In short, it depends on the bank and customer relations although there is some upper and lower limit of interest approved by Bangladesh Bank.
5.8.5 Performance
Market performance encompasses the strategic end results of the market conduct of sellers and buyers. Market performance refers to the composite of end results which firms in any market arrive at by pursuing whatever lines of conduct they adopt—end results in the dimensions of price, output, production, and selling cost, product design, and so forth (Bain, 1968). The full assessment of market performance, the strategic result of market structure and conduct of an industry is difficult, because performance is inherently multidimensional and correspondingly complicated. Considering the objectives and availability of data on processing industry, market performance was analysed on the basis of following dimensions.
Capacity utilization Marketing margins of milling rice Size of selling cost Product quality Progressiveness of the industry Employment generation Discrimination by sex
5.8.5.1 Capacity utilization of the mill
Capacity utilization of any industry is one of the important dimensions for assessment of market performance of any industry. An attempt is made to assess the performance by using the total processing capacity and the actual amount processed in last year by the selected mills. Capacity utilization of the selected mills of the paddy processing industry was computed by using the following formula:
∑ (푃퐶)푖∑ (퐴퐶)푖
Where, ( PC )i stands for actual amount of paddy processed and (AC)i stands for installed processing capacity of the mill n= number of rice mills of the industry
By using the above formula the processing capacity utilization of rice industry was computed by assuming 300 working days of a year and the results are shown in Table 5.33.
The capacity utilization of automatic semi-automatic and husking mills was 56%, 52% and 54%, respectively (Annex Table 5.33). The results are not supported by the findings of Siddique (2010). The capacity utilization of small mill in his study was higher than the present study. In that study, the small mill attained the highest capacity (65.72%) followed by major mill (64.69%) and automatic mill
38
(52.84). But the findings of Islam et al, 1987 showed that the large and small commercial mills attained 65% of the capacity while husking mills’ capacity utilization was only 40%.The higher capacity utilization by the husking mill as compared to semi-automatic mill may be attributed to ability to use machine with small quantity of paddy while the semi-automatic mills require a sizeable quantity of paddy at a time to operate the machine.
The reasons for under utilization of capacity were varied from area to area , however for all types of mills the reasons are lack of paddy (76%), disturbances in power supply (70%) , and shortage of capital (51%). The other factors retarding full utilization were difficulties in transportation, high cost of labour, and lack of storage facility. It appears during field study that there is no consistency about the asset position, machine capacity, managerial capability and marketing strategy of individual mills. 5.8.5.2 Size of selling costs
Selling cost is one of the indicators for assessment of market performance of rice milling industry. It refers to those costs incurred by firms to stimulate the sales volume of their products in two general ways: by informing potential buyers of the availability, characteristics, and prices of the products; and by inducing or persuading them to buy (Bain, 1968). It is very interesting to note that though rice is the staple food for the people of Bangladesh irrespective of income classes but the millers were not found to invest any amount on selling their rice except using a colourful synthetic bag of 50 Kg rice which contains some information on the product and the identity of the mill. In few cases the large retailers used to advertise for fine aromatic rice in their own name. In the present context, it is necessary that the rice mills should invest on informational purposes for effective working of the marketing system. It is essential and useful to inform potential customers of the availability of rice, of their specifications and qualities and of their prices. It is very hard for the customers to identify the rice according to variety and quality. So a modicum of selling activity and cost devoted to informational purposes are justified for the better performance of the industry. Absence of any significant amount of selling cost of this sector is a sign of good performance.
5.8.5.3 Product quality
Quality of rice depends on the variety of paddy and processing steps, skill of labour, weather condition etc. But in automatic and semi-automatic mill rice quality is largely depends on technology and expertise of the machine operator. Now the automatic rice miller is in a position to supply rice according to choice of the buyers. The technology adopted by the rice miller in Bangladesh are able to regulate the moisture content of rice, change the colour of rice (white, cream ), shelf life of milled rice, life of cooked rice, free from broken rice and foreign particles. Automatic rice mills produce more full grain rice by reducing the percentage of broken rice, which increase the overall quantity of rice production (Ali, 2011). It is possible to supply almost same type of rice to the target market. The external appearance of rice has been very powerful feature to attract the buyers in the market. In Kushtia in 2009 only 12% of the total milled rice was processed by automatic mills (Siddique, 2009) while it has increased to more than 60% in 2011 (Field survey 2012). A public concern about miniket rice is depicted in Box-1.

39
Box-1: Miniket- A Myth or Reality
Miniket rice is popular in Bangladesh, and commands a premium price. However there is divergence of opinion – and perhaps a degree of misinformation – about whether miniket is a distinct rice variety or rather a product of new rice milling technology (with the latter suggesting a significant step towards consumer market differentiation). This has led to confusion amongst not only consumers, but also agricultural graduates and government extension workers, as to what exactly is miniket.
By searching through different means we found out two areas where miniket paddy is grown mainly. The two upazilas are Jiban Nagar of Chuadanga and Moheshpur of Jhinaidah district. We visited the two upazilas, discussed with the agricultural officers at different levels and concerned farmers of those areas. A very brief note on miniket is presented below. Originally this variety was brought from India. Miniket is one of the prevalent rice varieties grown by the farmers of West Bengal of India (Directorate of Rice research, 2011). It was reported that miniket cultivation in this area was started in 1990. Our investigation suggests that there is a bona fide rice variety called miniket, but that it is grown in specific parts of the country. Importantly the amount of miniket rice supplied to the market exceeds its possible production in the country or imports. This suggests that a large proportion of the rice sold to consumers as miniket is milled to look like the miniket variety. The proportion is unknown and would require the retailed miniket to be sampled and tested for its rice variety. The miniket story underlines the need for better labeling of rice varieties and branding of milled rice to increase reliable information in the market.
The story of Mr. Md. Abdus Sattar – Miniket cultivator
Out of four brothers only Md. Abdus Sattar is migrated from India. He started Miniket paddy cultivation in 1990. He is a progressive farmer in the area. He retains seed according to scientific procedures. Since 1990 he has cultivated four varieties of Miniket such as Super mini, Jaldi Mini (Early mini), Lal Mini (Red mini) and currently used Panjab Mini. Miniket is one of the fine rice verities. It is grown in Boro season. The yield is about 7.46 to 8.20 quintal per 33 decimals of land.
Source of seed: The farmers used to collect seed unofficially from India. Some of them collected from open market and some from institutional sources (professional group, company or Govt. office). Now farmers use to retain seed of miniket rice at home at least for two years. Sometimes seeds are purchased from other farmers. To ensure quality of seed farmers use to purchase from India. There are few farmers who are involved in miniket seed production commercially in a limited scale as a subsidiary occupation. Quality is changed within 3 to 4 years due to pollination with other varieties.
Growing season:
This variety is being cultivated during the Boro season. The seeds are sown at the same time with other Boro varieties but miniket is harvested after 10 to 12 days of harvesting of other Boro varieties.
Characteristics BRRI Dhan 28 is very close to Miniket . Miniket is curved at the lower part of the rice. Miniket is slightly longer than BRRI Dhan28.
5.8.5.4 Progressiveness of the industry
Progressiveness is generally measured by the rate of technical changes in the industry and the amount of resources invested to R&D activities. An industry with frequent and important technological innovation has good performance in the matter of progressiveness. It is emerged from the field study that there was no evidence of expenditure on research in rice processing sector. But very sophisticated modern machines are using by a limited number of firms, called automatic rice mills. Secondly, there is evidence that semi-automatic mill owners are upscaling the mill according to their financial ability. The use of high level machine has been increased among a segment of the millers. The use of by-products (bran, husk and broken rice) is certainly an indication of progressiveness of the milling sector.

40
5.8.5.5 Employment position
The employment position in an industry is one of the indicators of market performance. The employment status varies with variation of type of rice mills. In the husking mill about 18 people was involved of which 90% were women labour upto 1997. The proportion of women and men was 3:2 (Siddique 2010). Generally, the mechanic (chatal mistree) and manger of the Chatal were male members. Table 5.34 shows that the largest numbers of people are absorbed in automatic mill followed by semi-automatic and lowest number in husking mill. The automatic mills use huge amount of paddy compared to husking and semi-automatic mills. It works longer period than other category of mill. Moreover, intensity of work increases along with use of by-product. Table 5.34: Distribution of mills by number of employees
Type of mills No. of employees Male Female Total
Automatic 49 11 60 Semi- automatic 16 12 38 Husking 17 9 26
5.8.5.6 Discrimination by sex
Discrimination by sex is very common in rice milling industry. The employer pays lower wage to female labour than that of male labour. This study found Tk. 170-Tk. 200 per day for male labour and Tk. 100-Tk. 120 per day for woman labour in Naogaon. However, the different wage system and wage rates were observed in different areas. Male worker gets more (Tk. 80 -100 per day) wage than female workers (Tk.60-80 per day) as reported by Siddique, 2010. This picture is common throughout the country in this industry. This might be due to abundant supply of female labour, highly unorganized and risk aversive in nature, and more submissive. It was argued that male workers are more efficient than the female workers, which is not validated in practice. Moreover, most of the cases labourers specially the women work on contract basis. They are not regular employees of the mills. The millers enjoy complete freedom in setting wages and other terms for the labourers.
5.8.5.7 Use of by-products of rice milling
The main by-products of rice milling are broken rice, bran, and husk. Broken rice has different uses such as feed for cattle (dairy cow and beef cattle), poultry and as raw material of feed manufacturing mills. It is also used as food by the labour class and in some areas the hotels offer cooked broken rice with pulse as breakfast meal. Bran is a part of rice kernel obtained from milling. Polish rice contains 0.3 % fat whereas brown rice contains 2.2% fat on a moisture free basis. Rice bran contains 20% extractible, but bran produced in commercial mills contains 13 to 18 % extractible. Rice bran is the main raw material of edible oil producing mills. There are two mills which are involved in producing oil from rice bran in Bangladesh. In addition a considerable portion of rice bran is also exported to other country and earning foreign currency.
Another by-product of rice milling is husk. It is the largest by-product of rice milling industry which amounts 22 to 24 % of total paddy. The heating value of husk has been reported to be 3000 to 3500 Kcl/kg. Thus husk can be used for generating steam for parboiling paddy and as heat source for mechanical dryers. Twenty kg of husk can generate 60,000 -70,000 Kcl which would be enough to reduce the moisture content of one tonne of paddy from 20 to 14 %. Briquettes are being produced from rice husk.

41
Potential use of husk can also be explored. It can be used as an abrasive material because of its high silica content. Rice husk can be used as a loose insulating material in building and cold storage facilities. Pure silicon which is used for making semiconductors is a very costly material that can be obtained from rice husk. Possibility of use of husk ash in glass industry for polishing may be explored. In India success has been achieved in the use of husk ash for manufacturing cement (Nayak, 1996). Boards can also be produced from rice husk.
5.8.6 Lessons learned / Conclusion
In paddy market buyer concentration is high. The concentration level of rice milling industry in Bangladesh is low according to the measures of different indexes. Product differentiation exists in rice markets. The different rice mills use their own mill name and logo on the rice bag. Consumers’ ignorance is one of the sources of product differentiation. There are evidences of entry and exit in the rice milling industry. The extension / expansion and diversification and up scaling of the existing mills are more than the entry of new firm. Absolute cost barriers are to be faced by new entrant in the milling industry. The buyer concentration at retail level of rice market is low.
Price is set through bargaining between buyers and sellers. Automatic rice mill owners are in better position to set the price. Trader-buyers are more powerful. Automatic rice mills are now so developed that these firms can supply rice according to choice of buyers. No evidence of coercive activities was reported. Rice is sold either in cash, credit or partly cash and partly credit. With little exception the millers had access to institutional sources for credit.
Performance of the rice mill is assessed by using various dimensions. Capacity utilization was low as the highest one was only 56.24%. In term of size of selling cost the performance is satisfactory as the selling cost was almost zero. The millers did not take any persuasive measure that is why the selling cost was near to zero. But some costs should be incurred to provide necessary information about product to consumers. Apparently the rice of automatic mills is in super quality. Although most of the machines are imported and some are age-old but technological advancement has been increasing towards automatic rice mills over the years. Discrimination by sex in terms of wage rate is common in rice milling industry. Quality of rice milled through automatic mills in terms of food value needs to be investigated.
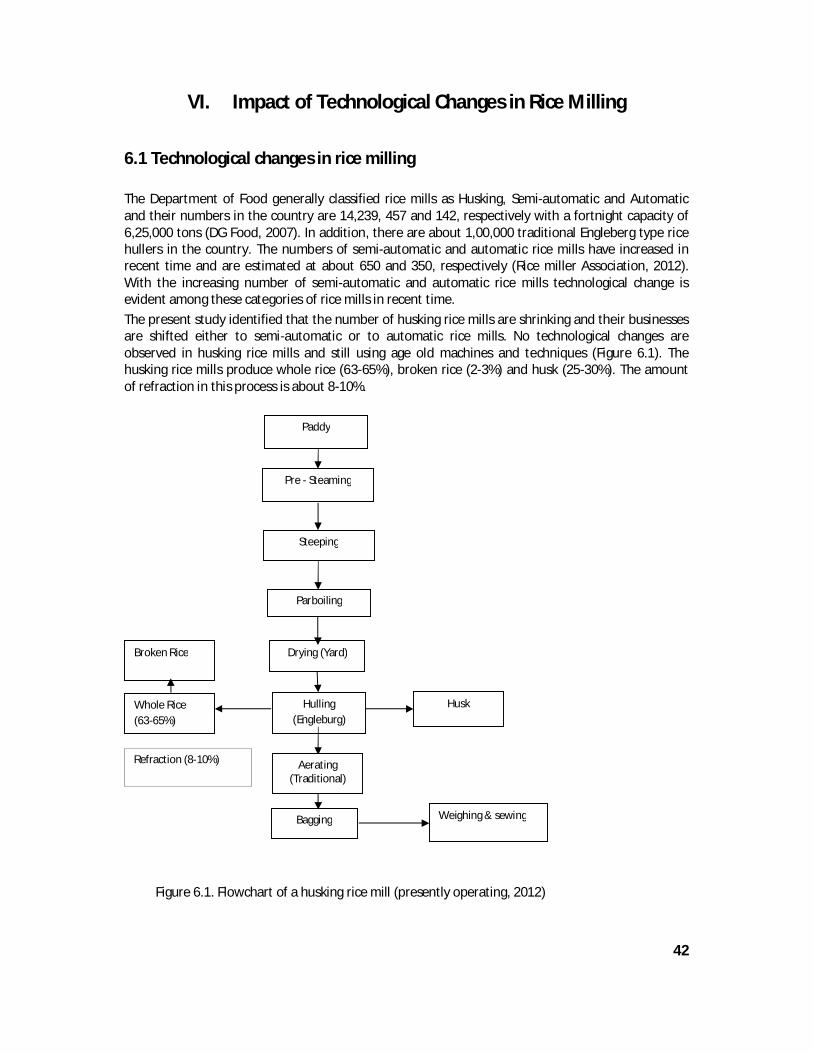
42
VI. Impact of Technological Changes in Rice Milling
6.1 Technological changes in rice milling The Department of Food generally classified rice mills as Husking, Semi-automatic and Automatic and their numbers in the country are 14,239, 457 and 142, respectively with a fortnight capacity of 6,25,000 tons (DG Food, 2007). In addition, there are about 1,00,000 traditional Engleberg type rice hullers in the country. The numbers of semi-automatic and automatic rice mills have increased in recent time and are estimated at about 650 and 350, respectively (Rice miller Association, 2012). With the increasing number of semi-automatic and automatic rice mills technological change is evident among these categories of rice mills in recent time.
The present study identified that the number of husking rice mills are shrinking and their businesses are shifted either to semi-automatic or to automatic rice mills. No technological changes are observed in husking rice mills and still using age old machines and techniques (Figure 6.1). The husking rice mills produce whole rice (63-65%), broken rice (2-3%) and husk (25-30%). The amount of refraction in this process is about 8-10%.
Steeping
Parboiling
Whole Rice (63-65%)
Hulling (Engleburg) (Engleburg)
Drying (Yard)
Bagging Weighing & sewing
Pre - Steaming
Husk
Aerating (Traditional)
Broken Rice
(2-3 %)
Paddy
Refraction (8-10%)
Figure 6.1. Flowchart of a husking rice mill (presently operating, 2012)

43
In recent past, semi-automatic rice mills in the country are changed both in number and use of milling technology. Before 2008, most semi-automatic rice mills were using mechanical technologies such as cleaning, parboiling, sun drying of paddy, rubber roll milling, polishing, aerating, bagging, weighing & sewing (Figure 6.2). Since 2008, mechanical technologies like de-stoning, silking and colour sorting are being used by most of the semi-automatic rice mills because of quality rice demand in the market (Figure 6.3). The demand for quality rice and higher price in the market encouraged semi-automatic rice mill owners to use of these new mechanical technologies. The semi-automatic rice mills produce whole rice (64-66%), broken rice (1-2%), husk (20-22%), bran (7-8%) along with refraction (8-10%) (Figure 6.3).
Cleaning Parboiling Drying in drying yard / Dryer
Aerating Polishing Milling in rubber Sheller
Bagging Weighing & sewing
Figure 6.2. Flowchart of a semi-automatic rice mill (Before 2008)
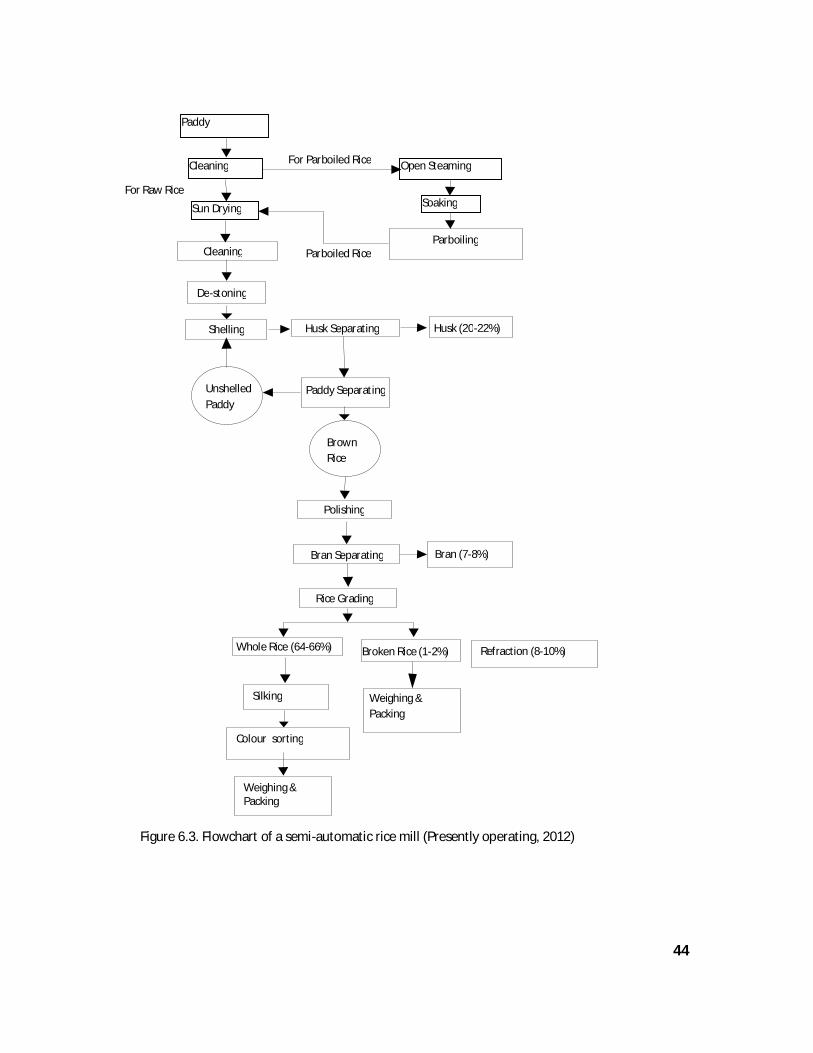
44
Paddy
Cleaning
Sun Drying
Open Steaming
Soaking
Parboiling Cleaning
Shelling Husk Separating
Paddy Separating Unshelled Paddy
Brown Rice
Polishing
Bran Separating Bran (7-8%)
Rice Grading
Whole Rice (64-66%) Broken Rice (1-2%)
Weighing & Packing
For Parboiled Rice
For Raw Rice
Parboiled Rice
Husk (20-22%)
Silking
De-stoning
Colour sorting
Weighing & Packing
Refraction (8-10%)
Figure 6.3. Flowchart of a semi-automatic rice mill (Presently operating, 2012)

45
Before 2008, most automatic rice mills in the country were using mechanical technologies such as pre-cleaning, parboiling, mechanical drying, milling by rubber roll sheller, paddy separating, polishing, aerating, bagging, weighing & sewing (Figure 6.4). At present, most automatic rice mills have started using few modern technologies like rice separating, silking, colour sorting and auto-bagging, weighing and sewing because of demand for high quality rice in the market and higher price (Figure 6.5). Automatic rice mills produce whole rice (65-67%), broken rice (1-2%), husk (20-22%), bran (5-7%) along with refraction (8-10%) (Figure 6.5).
Pre Cleaning Parboiling
Polishing (Polisher) Milling by rubber Sheller
Mechanical drying
Paddy Separating
Aerating Bagging Weighing & sewing
Fig.6.4. Flowchart of an automatic rice mill (Before 2008)
Un-hulled paddy

46
Paddy
Cleaning
Drying
Open Steaming
Soaking
Parboiling
(Pressure)
SunDrying
MechanicalDrying
Cleaning
Shelling Husk Separating
Paddy Separating Unshelled Paddy
Brown Rice
Polishing
Bran Separating Bran (5-7%)
Rice Grading
Whole Rice (65-67%) Broken Rice (1-2%)
Weighing & Packing
For Parboiled Rice
For Raw Rice
For Raw/Parboiled Rice
Husk (20-22%)
Silking
De-stoning
Colour sorting
Weighing & Packing
Refraction (8-10%)
Figure 6.5. Flowchart of an automatic rice mill (presently operating ,2012)

47
6.1 Impact of Rice Milling Technologies on Milling Cost, Financial Performance, Quality of Rice and Employment The estimated cost of milling of fine rice and profit margins of different rice mills are shown in Table 6.1. It is evident from the table that estimated milling costs per ton was highest (Tk. 3452) in semi-automatic rice mill with modern equipment while it was lower (Tk. 2601) in husking mill. Lowest milling cost (Tk. 2563) per ton of fine rice was found in automatic rice mills without modern equipment (Table 6.1). The profit margins per ton of milled rice were estimated highest in automatic rice mill with modern equipment and lowest in husking mill as Tk. 6281 and Tk. 2329, respectively (Table 6.1). Since the price of rice and by products of automatic mill is higher than the price of rice and by products from husking mill. Interestingly, byproducts such as husk, bran and broken rice contribute significantly in profit margin of all types of rice mills. The bran of semi-automatic and automatic rice mills have good demand in the edible oil mills and oil mill cakes are used as poultry and fish meal production. The husk is being used as fuel for boiler and dryer in the rice mills, making briquette as bio-fuel. There is a variation in rice recovery at all the rice mills which range from 64.75% to 67.5% (Table 6.1). This is due to technological variation in different categories of rice mills. The milled rice from semi-automatic and automatic rice mills are good in quality in terms of brightness and polishing and have good demand in local and in posh market. However, small amount of rice from husking mills are marketed locally and mostly meet the government procurement requirement. Rest of the rice is further polished and colour sorted at semi-automatic and automatic rice mills for marketing. The impact of new technologies in rice mills regarding quality of rice is noticeable as a portion of rice in the market which are free from any foreign particles (e.g., stone), black rice, unprocessed rice, and dust even that does not need to clean before cooking. So, the users are very happy with this milled rice. And, apparently it looks very attractive. Automatic rice mills preserve the quality of rice even in the rainy season as compared to others which depend mostly on sunshine for drying paddy. Auto rice millers claimed that their milled rice is better in hygienic point of view than others. New technology has also enhanced the shelf life of both the milled rice and cooked rice. There are rice quality standards specified by BSTI, however, the millers do not follow the standards. They only separate very small broken rice and market it as dairy and poultry feed and as well for human consumption. The price is almost half of the whole rice. The bran produced by semi-automatic rice mills has market value as it is being used for producing edible oil and the cake produced as by-product is used in poultry and fish feed mills. Husk is used as bio-fuel in furnace for parboiling of paddy in semi-automatic rice mills. In automatic rice mills husk is used in furnace for parboiling and drying of paddy. Husk has other use as bedding material in poultry house. The qualities of rice and bran produced by automatic rice mills having modern technologies are better compared to these products of automatic rice mills without modern technologies and have good demand in the market. The bran produced by a modern automatic rice mill is free from rice polish (finer rice particles) and has good demand in edible oil mills and has good market price. The labour requirement in husking and semi-automatic rice mills are almost similar as the capacity of the rice mills and drying of paddy are similar. The cost of labour per ton of milled rice for both husking and semi-automatic rice mill without modern equipment is estimated at Tk. 403. However, semi-automatic rice mill with modern equipment requires Tk. 483 as labour cost for milling a ton of

48
paddy (Table 6.2). Whereas, the cost of labour for automatic rice mills without and with modern equipment are Tk. 100 and Tk. 116, respectively. This difference in cost of labour per ton of milled rice is due to the higher capacity of the automatic rice mills and less number of labour requirement for automation in drying and milling sections. Lowest staff cost was found in case of modern automatic rice mills (Tk. 101 per ton of paddy processing) mainly because of its higher capacity and automation (Table 6.2). The staff costs of husking, semi-automatic without and with modern equipment, and automatic rice mills are found Tk. 147, Tk. 168, Tk. 216 and Tk. 173 per ton of paddy processing, respectively.
In terms of employment opportunity, an automatic rice mill with modern equipment utilized about 5925 man-days per year compared to other rice mills (ranges between 2232 to 3120 man-days per year), because of its higher capacity utilization. This higher capacity utilization is because of the higher demand for quality rice (in terms of physical size and shape, and glassy looking) in the market. However, labour requirement of automatic and automatic with modern equipment rice mills were found far less (3.20 and 3.95 man-hr per ton of paddy processing) compared to husking and semi-automatic rice mills which was in the range of 14.17-15.67 man-hr per ton of paddy processing (Table 6.2).
The employment opportunities of staffs was found highest in automatic rice mills with modern equipment (6205 man-days per year) followed by automatic rice mills without modern equipment (5840 man-days per year), semi-automatic rice mills with modern equipment (1460 man-days per year) and semi-automatic rice mills without modern equipment and husking mills (1095 man-days per year) (Table 6.2).However, staff requirement of automatic and semi-automatic rice mills with modern equipment were found lower (4.14 and 4.50 man-hr per ton of paddy processing) compared to automatic and semi-automatic rice mills without modern equipment (5.99 and 9.13 man-hr per ton of paddy processing), and husking mill (6.95 man-hr per ton of paddy processing).
The semi-automatic rice mills are facing problems with unavailability of labourers for sun drying of paddy and higher labour cost. Moreover, sun drying of paddy in Boro rice become problem as it harvested in monsoon. In main rice processing areas like Dinajpur, semi-automatic rice mills are being converted to automatic rice mills after ensuring capital for the change. The financial indicators also favour this change. Table 6.1: Milling cost and profit by different types of rice mill Type of rice mill
cost of paddy (Tk.)
Milling cost (Tk./ton of rice)
Total cost (Tk.)
Return (Tk.) Total return (Tk.)
Profit (Tk.)
Rice recovery %
Rice By-product
Husking 24300 2601 26901 27000 2230 29230 2329 65.00
Semi-Auto* 25427 2943 28370 28500 2414 30914 2544 66.25 Semi-Auto** 26016 3452 29468 30000 3448 33448 3980 64.75 Auto rice mill* 25177 2563 27740 30000 3478 33478 5738 67.50 Auto rice mill** 26361 3070 29431 32000 3712 35712 6281 66 .00
*Without modern equipment **With modern equipment

49
Table 6.2. Employment in different rice mills
Type of rice mill Employment Labour,
Tk./ton of paddy
Staff cost, Tk./ton of
paddy
Labour, man-hr/ ton of
paddy
Labour, man-
days/yr
Staff, man-hr/ton of
paddy
Staff, man-
days/yr Husking 403 147 14.17 2232 6.95 1095 Semi-Auto* 403 168 14.17 2274 9.13 1095 Semi-Auto** 483 216 15.67 3015 4.50 1460
Auto rice mill* 100 173 3.20 3120 5.99 5840
Auto rice mill ** 116 101 3.95 5925 4.14 6205
*Without modern equipment**With modern equipment
6.2 Estimation of cost and margins for the key agents
The cost of marketing rice represents the cost of performing the various agencies involved in the marketing process of rice. Rice, the commodity that is cooked before eating by the consumers is produced through various milling process from paddy, and this paddy is grown by the farmers. The marketing cost of paddy after leaving the farmer to the rice mills are shared by different intermediaries such as faria, bepari, and aratdar-cum-wholesaler. Then paddy is processed into rice in the rice mills. So processing cost is involved. After processing the processed rice is sold to consumers through a group of rice traders namely, aratdar, wholesaler and retailer.
So marketing cost of paddy per unit is computed as
TMP = CF + CB + CA
TMP = Total marketing cost of paddy CF = Marketing cost of faria
CB = Marketing cost of bepari CA = Marketing cost of aratdar-cum-wholesaler
Bepari incurred the highest cost (Tk.70.50) per 150 kg paddy followed by faria (Tk. 66.17) and aratdar-cum-wholesaler (Tk.56.17). Maximum cost of the marketing spent on the transportation of the paddy at Tk. 21.13, Tk. 21.15 and Tk. 28.63 by faria, bepari and aratdar-cum-wholesaler, respectively. After that faria and bepari spent most of the cost in the personal expenses (Annex Table 6.3). Of the 4 types of rice sellers the highest cost (Tk. 145.16) was spent by wholesaler followed by wholesaler-retailer (Tk. 144.91) and retailer (Tk. 31.90) and the lowest cost was shared by aratdar (Tk.7.81) shown in Annex Table 6.4.
Marketing margin in a sense is the price of all utility adding activities which are performed by the middlemen (Kohls and Uhl, 2005). In other words, it is the difference in the price received and paid by any marketing intermediaries. We have calculated the gross marketing margins as the difference between the selling price and purchase price of a unit of commodity for each of the intermediaries. To obtain the net marketing margin of an intermediary at a point, marketing cost is subtracted from the gross marketing margin of that intermediary/actor. Thus gross marketing margin will be the difference between the price of a unit of rice (say 1 kg) paid by the consumer and the price of equivalent amount of paddy received by the grower.

50
Marketing margins earned by different marketing intermediaries are shown in Table6.5.In calculating marketing margin for the miller the prices of by-products of the milling process is also included. Gross marketing margin of miller = V - PF, where V denotes the value of product when miller sells at wholesale level and the associated by products to other outlets, and Pf is the value of 150 kg paddy paid by miller.
푉 = (Pr)(MR) + p q
Pr is the price of 1 kg milled rice at mill gate price MR = milling ratio, i.e. the yield of milled rice as a fraction of one (of 150 kg paddy) pi is the price of by product i belonging to the set of by-product ; qi is the yield of by-product i during the milling process, as a fraction of one.
Net marketing margin of miller is calculated as NMMm = GMMm - (MCm + PCm) Where; NMMm = Net marketing margin of miller GMMm = Gross marketing margin of miller MCm = Marketing cost of miller and PCm= Processing cost of miller
In our study the gross marketing margin of 100 kg rice will be the price of 100 kg rice at retail market (Rp) minus the price of equivalent amount of paddy (150 kg) paid by the faria i.e., price received by the farmer(Fp). Gross marketing margin = Rp – Fp Rp is the retail price of a unit of rice i.e. paid by consumers.
Fp is the price of equivalent amount of paddy of one unit rice.
Table 6.5: Marketing cost and margin of paddy and rice traders (per 100 kg rice and its equivalent amount of paddy)
Actors Gross marketing margin Marketing cost Net marketing margin Amount (Tk.) % Amount(Tk.) % Amount(Tk.) %
Faria 114.91 6.14 66.17 6.94 48.74 5.30 Bepari 111.00 5.93 70.50 7.4 40.50 4.41 Aratdar-cum-wholesaler
93.67 5.01 56.17 5.89 37.50 4.08
Rice mill 849.98 (524.10)*
45.40 430.38 (417.46)*
45.20 419.60 (106.64)*
45.70
Aratdar(Rice) 27.81 1.49 7.81 0.82 20.00** 2.18 Wholesaler 216.02 11.50 145.16 15.19 70.86 7.71 Wholesaler cum retailer
261.53 14.00 144.91 15.21 116.62 12.70
Retailer 196.51 10.50 31.90 3.35 164.62 17.92 Total 1871.43 100 953 100 918.43 100
*only from rice ** Commission

51
Table 6.5 reveals that the miller shared highest cost (45.20 %) and captured highest percentage of total net profit (45.70%) amongst the traders. The second highest cost was incurred by wholesaler cum retailer (15.21%) and earned 12.70 % of the total net marketing margin. The rice retailer captured 17.92 % of total net marketing margin by incurring 3.55 % of the total marketing cost. The wholesaler earned 7.71 % of the net marketing margin by incurring 15.20 % of the total marketing cost. The same information is presented in Figure 6.6 and Figure 6.7. After excluding the share of net margin of farmers from the results obtained by Reardon et al. (2012), the share of net margin would be 44.44%, 22.22% and 33.34% for miller, wholesaler and retailer, respectively. Share of net profit earned by the faria/bepari, paddy aratdar/agent, miller, agent/aratdar-cum-wholesaler, wholesaler and retailer was estimated at 12.82%, 23.53%, 28.35%, 16.18%, 8.70% and 10.40%, respectively (Mujeri et al., 2013).
Figure 6.6: Share of different actors in gross marketing margin, marketing cost and net margin
Figure 6.7: Share of different actors in gross marketing margin, marketing cost and net margin
114.91 66.17 48.74
11170.5 40.5
93.6756.17
37.5
849.98
430.38419.6
27.81
7.8120
216.02
145.1670.86
261.53
144.91
116.62
196.51
31.9164.61
0
200
400
600
800
1000
1200
1400
1600
1800
2000
Gross marketing margin
Marketing cost Net margin
Retailer
Wholesaler cum retailer
Wholesaler
Aratdar(Rice)
Rice mill
Aratdar
Bepari
Faria
6.14 6.94 5.35.93 7.4
4.415.01 5.89
4.08
45.445.2
45.7
1.49 0.822.18
11.515.2
7.71
1415.2
12.7
10.53.35
17.92
0%
10%
20%
30%
40%
50%
60%
70%
80%
90%
100%
Gross marketing margin Marketing cost Net margin
Retailer
Wholesaler cum retailer
Wholesaler
Aratdar(Rice)
Rice mill
Aratdar
Bepari
Faria

52
6.3 Financial viability of the rice mills Internal rate of return (IRR), net present value (NPV), and benefit cost ratio (BCR) were applied to assess the financial viability of the rice mills in this section. An attempt has been made to examine viability of mill in terms of financial aspects, though these types of measures are more frequently used in project appraisal. Here, we have determined the investment amount, and annual costs and returns from different type of mills through the field survey. Then on the basis of the field survey, we have assumed that those costs and returns will remain same over the life time of the mills. However, it may change over the period. Price of rice and paddy may change; cost of other different items may be changed as a result the magnitude of the measures may also change. So, the results from this analysis only can give an indication of the viability. Table 6.6 shows that IRR is greater in case of auto rice mill than that of semi-automatic and husking mills and is much higher than the interest rate (even for borrowed capital). So, it may be concluded that auto rice mill is more financially viable than others. This type of mill (i.e., automatic) is establishing/converting more than others virtually. Shwetha (2009) estimated IRR for conventional and modern rice mill and found 23.11 % and 26.60%, respectively, Miah (2004) got IRR 22% for shallow tube well, Rashid (1993) estimated IRR for deep tube well with open channel and buried pipe and found 41% and 177% , respectively. NPV is positive for all cases that means the investment will be able to generate income to repay the amount of interest, i.e., if the cost and returns (that are assumed) remain same for the specified period then the project will be viable. BCR is also greater than one for all cases indicating the project viability. Table 6.6: IRR, NPV and BCR for different rice mills
Type of mill IRR NPV(Tk.’000) at 10 %
BCR at 10 %
Husking rice mill 18.45% 418 1.002
Semi-auto rice mill 25.23% 10325 1.046
Auto-rice mill 32.54% 117471 1.063

53
VII. Map of rice surplus/deficit at zila level
7.1 Rice surplus/deficit at zila level The map of rice surplus/deficit at zila level is constructed by using the apparent consumption of rice instead of normative consumption. The average of three years (2008/09, 2009/10, 2010/11) rice production data and population of 2010 for 64 districts are used to identify the status of rice production. Thirty six districts are identified as rice surplus district while the rest of 28 districts are deficits (Annex Map 7.1). Among the 64 districts, Mymensingh is the top most in rice production and its contribution to the total national rice production is 4.67 per cent but this district is in 16th position as a surplus on the basis of production (Annex Table 7.2). And this district occupies 5th position in terms of surplus production while Naogaon is in the first position (Annex Table 7.1). Joypurhat occupies first position on the basis of surplus production as a percentage of its own consumption (Annex Table 7.2).The extent of surplus and deficit has been estimated at zila level which is shown in Map 7.2 as well as in Figure 7.1 and Figure 7.2. Maps of rice surplus/deficit for the year of 2005 and 2000 have been constructed for the former 23 districts as the data (production) are not available for 64 districts in the country. The maps are
presented subsequently. It is clear from Map 7.2, 7.4, and 7.6 that Chittagong region is deficit in rice production during the period 2000, 2005 and 2010 and the extent of deficit has been increased. And Sylhet region became deficit in year 2010 while it was surplus in 2000 and 2005. In 2000, Comilla region (Comilla, Chandpur, Laksmipur, Feni, Noakhali) was surplus in rice production while it became deficit in 2005. Comilla and Feni became surplus again in 2010.
It is seen from the Figure 7.6 that Kurigram, Natore, Nilphamari, Barisal, Sathkhira, Bagerhat, Chuadanga, Tangail and Comilla were marginally rice surplus districts. There is a high possibility of these districts to become rice deficit in near future. Among them, Comilla is in the lowest position; it can be turned into deficit district shortly.
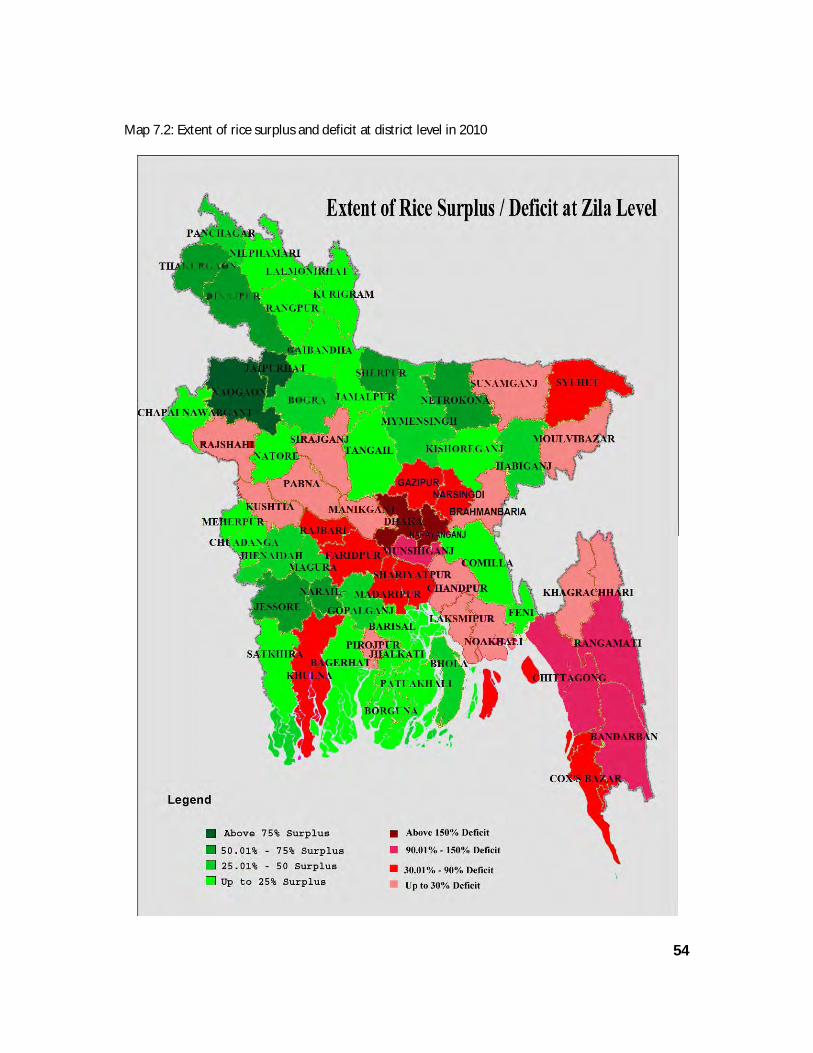
54
Map 7.2: Extent of rice surplus and deficit at district level in 2010

55
0
5
10
15
20
upto 20% surplus 20.01-30% surplus
30.01-40% surplus
Above 40% surplus
20
7 7
2
Num
ber
Figure 7.1 : Number of districts on the basis of the extent of surplus, 2010
0
2
4
6
8
10
12
14
up to 30% deficit 30.01- 90% deficit 90.01-150% deficit Above 150% deficit
14
7
4 3
Num
ber
Figure 7.2: Number of districts on the basis of the extent of deficit, 2010

56
0
100
200
300
400
500
600
NA
OG
AO
ND
INA
JPU
RJE
SSO
REBO
GRA
MYM
ENSI
NG
HN
ETRA
KON
AJO
YPU
RHA
TTH
AKU
RGA
ON
SHER
PUR
HA
BIG
AN
JJH
ENA
IDA
HBH
OLA
RAN
GPU
RJA
MA
LPU
RKI
SHO
REG
ON
JG
OPA
LGAN
JG
AIB
AND
HA
PAN
CHA
GAR
HN
ARA
ILM
AG
URA
PATU
AKH
ALI
LALM
ON
IRH
AT
KURI
GRA
MCH
APA
I NA
BABG
AN
JN
ILPH
AM
ARI
FEN
IBA
RISA
LTA
NG
AIL
NA
TORE
BARG
UN
ASA
TKH
IRA
COM
ILLA
MEH
ERPU
RBA
GER
HA
TJH
ALO
KATI
CHU
AD
AN
GA
Surp
lus
am
ount
('0
00m
etri
c to
n)
Figure 7.4: Rank of rice surplus districts, 2010
0
200
400
600
800
1000
1200
1400
1600
1800
RAJS
HA
HI
LAKS
HM
IPU
RSI
RAJG
AN
JKH
AGRA
CHH
…PI
ROJP
UR
MAU
LVIB
AZ…
BAN
DAR
BAN
CHAN
DPU
RM
AD
ARI
PUR
MA
NIK
GAN
JSU
NA
MG
ANJ
RAJB
ARI
BRA
HM
ANB…
SHA
RIAT
PUR
RAN
GA
MA
TIKU
SHTI
APA
BNA
NO
AKH
ALI
KHU
LNA
NA
RSIN
GD
IFA
RID
PUR
MU
NSH
IGA
NJ
COX'
S BA
ZAR
SYLH
ETG
AZI
PUR
NAR
AYA
NG
A…CH
ITTA
GO
NG
DH
AKA
Am
onut
('0
00m
etri
c to
n
Figure 7.5. Rank of rice deficit districts, 2010

57
0
20
40
60
80
100
120JO
YPU
RHA
TN
AO
GA
ON
DIN
AJP
UR
SHER
PUR
THA
KURG
AO
NJE
SSO
REN
ETRA
KON
AN
ARA
ILBO
GRA
GO
PALG
AN
JPA
NCH
AG
ARH
JHEN
AID
AH
BHO
LAH
ABI
GA
NJ
MA
GU
RAM
YMEN
SIN
GH
JAM
ALP
UR
FEN
IPA
TUA
KHAL
IG
AIB
AND
HA
LALM
ON
IRH
AT
BARG
UN
ARA
NG
PUR
JHAL
OKA
TICH
APA
I …M
EHER
PUR
KISH
ORE
GO
NJ
KURI
GRA
MN
ATO
REN
ILPH
AMA
RIBA
RISA
LSA
TKH
IRA
BAG
ERH
AT
CHU
AD
AN
GA
TAN
GA
ILCO
MIL
LA
% o
f sur
plus
Figure 7.6: Rank of rice surplus districts on the basis of its own
consumption, 2010

58
Map 7.4: Extent of rice surplus and deficit at district level (former) in 2005

59
Table 7.3: Rice Surplus/deficit districts with amount (in 2005) District (former)
Surplus of rice (‘000 metric ton)
% of surplus (basis of own consumption)
District (former)
Deficit of rice (‘000 metric ton)
% of deficit (basis of own consumption)
Jessore 628.98 60.53 Dhaka 2304.267 68.11205
Rajshahi 558.46 36.58 Chittagong 733.4236 43.43576
Bogra 493.49 63.68 Faridpur 299.599 24.03261
Dinajpur 418.17 40.18 Pabna 258.9307 23.76883
Rangpur 285.63 14.56 Comilla 174.9008 10.49861
Patuakhali 205.88 53.03 Barisal 109.3469 10.56882
Mymensingh 194.10 21.07 Kushtia 100.8988 15.51414
Kishoreganj 123.57 10.77 Khulna 63.98917 6.273464
Jamalpur 105.14 14.29 Noakhali 63.28799 7.359578
Sylhet 47.42 2.91 Rangamati 53.51479 51.8273
Tangail 43.72 6.49 Bandarban 37.22077 52.79154
Khagrachhari 31.58724 29.48621
0.00
100.00
200.00
300.00
400.00
500.00
600.00
700.00
Jess
ore
Rajs
hahi
Bogr
a
Din
ajpu
r
Rang
pur
Patu
akha
li
Mym
ensi
ngh
Kish
oreg
anj
Jam
alpu
r
Sylh
et
Tang
ail
Surp
lus (
'000
met
ric
ton)
Figure 7.7. Rice surplus district (former) in 2005
0
500
1000
1500
2000
2500
Dha
ka
Chitt
agon
g
Fari
dpur
Pabn
a
Com
illa
Bari
sal
Kush
tia
Khul
na
Noa
khal
i
Rang
amat
i
Band
arba
n
Khag
rach
hariD
efic
it('0
00m
etri
c to
n)
Figure 7.8. Rank of rice deficit districts (former) in 2005

60
Map 7.6: Extent of rice surplus and deficit at district level (former) in 2000
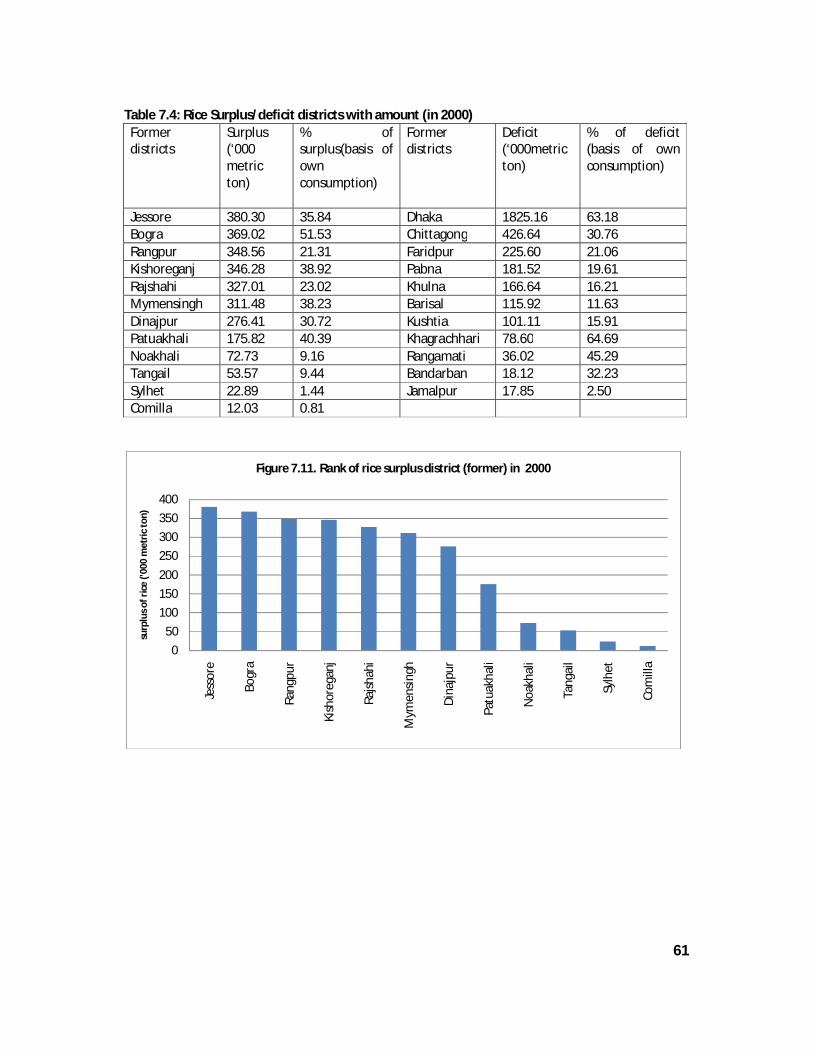
61
Table 7.4: Rice Surplus/deficit districts with amount (in 2000) Former districts
Surplus (‘000 metric ton)
% of surplus(basis of own consumption)
Former districts
Deficit (‘000metric ton)
% of deficit (basis of own consumption)
Jessore 380.30 35.84 Dhaka 1825.16 63.18 Bogra 369.02 51.53 Chittagong 426.64 30.76 Rangpur 348.56 21.31 Faridpur 225.60 21.06 Kishoreganj 346.28 38.92 Pabna 181.52 19.61 Rajshahi 327.01 23.02 Khulna 166.64 16.21 Mymensingh 311.48 38.23 Barisal 115.92 11.63 Dinajpur 276.41 30.72 Kushtia 101.11 15.91 Patuakhali 175.82 40.39 Khagrachhari 78.60 64.69 Noakhali 72.73 9.16 Rangamati 36.02 45.29 Tangail 53.57 9.44 Bandarban 18.12 32.23 Sylhet 22.89 1.44 Jamalpur 17.85 2.50 Comilla 12.03 0.81
0
50
100
150
200
250
300
350
400
Jess
ore
Bogr
a
Rang
pur
Kish
oreg
anj
Rajs
hahi
Mym
ensi
ngh
Din
ajpu
r
Patu
akha
li
Noa
khal
i
Tang
ail
Sylh
et
Com
illa
surp
lus
of r
ice
('000
met
ric
ton)
Figure 7.11. Rank of rice surplus district (former) in 2000
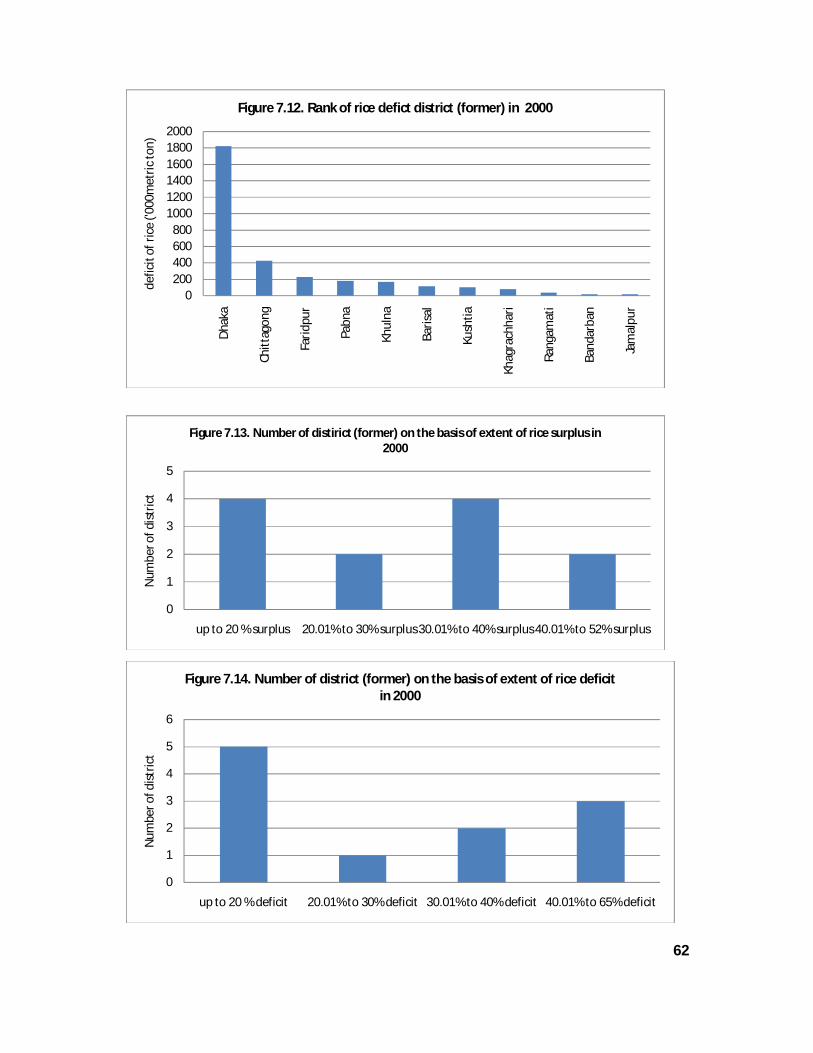
62
0200400600800
100012001400160018002000
Dha
ka
Chit
tago
ng
Fari
dpur
Pabn
a
Khul
na
Bari
sal
Kush
tia
Khag
rach
hari
Rang
amat
i
Band
arba
n
Jam
alpu
r
defic
it o
f ric
e ('0
00m
etri
c to
n)
Figure 7.12. Rank of rice defict district (former) in 2000
0
1
2
3
4
5
up to 20 % surplus 20.01% to 30% surplus 30.01% to 40% surplus 40.01% to 52% surplus
Num
ber o
f dis
tric
t
Figure 7.13. Number of distirict (former) on the basis of extent of rice surplus in 2000
0
1
2
3
4
5
6
up to 20 % deficit 20.01% to 30% deficit 30.01% to 40% deficit 40.01% to 65% deficit
Num
ber o
f dis
tric
t
Figure 7.14. Number of district (former) on the basis of extent of rice deficit in 2000

63
VIII. Domestic and International Rice market integration
8.1 Rice market integration To test the stationary of the data, the ADF (Augmented Dickey-Fuller) test with 13 lags of coarse rice prices for Dhaka, Chittagong, Khulna, Sherpur Comilla, Bogra, Rangpur Dinajpur, Kushtia, Sylhet, Noagaon and Noakhali were performed over 1990 to 2011 period and the estimated tau )( statistics and P values in their level and first difference are presented in Table 8.1. Real price data were used and data were transformed into natural log. Real price was calculated by multiplying nominal price with the corresponding consumer price index (CPI) and dividing by the last CPI of the series. The tau )( statistics which were compared with p values indicate that all the rice price series data were non-stationary at level. This set of regression was run once more after differencing all the markets. The tau )( statistics on the lagged first-difference terms are significantly negative indication that the series are stationary after first differencing. The study revealed that the rice prices are stationary after differencing once that is they are all (1) processes.
Table 8.1: Unit root test for wholesale real price of rice markets in Bangladesh
Level First difference
Markets details
ln 1tY Coefficient
ADF
)(
P values
Decision ln 1 tY Coefficient
ADF
)(
P values Decision
Dhaka -0.072 -1.89 0.12 Nonstationary -0.142 -4.64 0.00 Stationary Chittagong -0.013 -1.32 0.18 Nonstationary -0.032 -3.36 0.00 Stationary
Comilla -.007 -0.79 0.42 Nonstationary -0.44 -8.02 0.00 Stationary Khulna -0.08 -1.37 0.17 Nonstationary -0.19 -5.20 0.00 Stationary
Sherpur -0.04 -0.72 0.47 Nonstationary -0.23 -5.89 0.00 Stationary
Bogra -0.009 -0.94 0.34 Nonstationary -0.29 -5.39 0.00 Stationary Rangpur -0.08 -1.62 0.13 Nonstationary -0.20 -5.18 0.00 Stationary
Dinajpur -0.06 -2.32 0.02 Nonstationary -0.13 -4.06 0.00 Stationary
Kushtia -0.05 -1.56 0.11 Nonstationary -0.24 -6.67 0.00 Stationary
Noagaon -0.04 -1.42 0.15 Nonstationary -0.17 -5.59 0.00 Stationary
Sylhet -0.06 -2.40 0.01 Nonstationary -0.13 -3.94 0.00 Stationary
Noakhali -0.02 -0.13 0.02 Nonstationary -0.04 -2.92 0.00 Stationary
ADF= Augmented Dickey-Fuller,
Test critical values: 1% level -3.455096 5% level -2.872328 10% level -2.572592
To examine whether bivariate co-integration exists between different prices of rice market, Dhaka wholesale market was considered as reference market, Dhaka is a capital market and the largest city and it would appeared to be the dominant influences on inter districts rice markets in Bangladesh. The reference market is a dominant market serving as a hub in a sort of “radial market structure” where different feeder (local) markets are at the rim. The reference market dominates the price formation in the feeder markets. Every individual feeder market was affected by the reference market price, though it alone cannot affect the reference markets price. Normally, the reference

64
markets has a high turnover so that supply and demand shocks originating in the individual feeder markets are absorbed without creating much effect on the price prevailing in the reference markets (Ravallion, 1986). As there will be different combinations of the given 12 wholesale rice price markets, all combinations in a system of bivariate relationships. The Engle-Granger (EG) and Augmented Engle-Granger (AEG) tests of residual equation confirm the stationarity of the residual series. Thus ADF results of unit root equation indicate that the real rice price series are I (1), while Engle-Granger (EG) and Augmented Engle-Granger (AEG) results of residual equation indicate that the residual series (which are linear combination of above rice real price series) are I (0).Thus above fact that the price series being I (1) and their linear combination being I(0)point out that the series are cointegrated without any exception.
According to the Engle-Granger (EG) and Augmented Engle and Granger (AEG) test rice markets of Bangladesh are statistically significance at 1% level (Table 8.2). An important finding of the study is that Dhaka market is significantly integrated to all regional markets of rice markets in Bangladesh due to having the facility of information technology, which closely connected the markets to each other. This study strongly supports marketing efficiency in the selected rice markets. Price moves in the unison in all the markets together. Central price policy making will be effective in these markets. Table 8.2: Co-integration regression test results for rice price in Bangladesh (Real Price)
Markets details EG (lnUt-1) P values
AEG (dellnUt-1)
P values Decision
Dhaka-Chittagong -3.46 0.00 -3.41 0.00 Cointegrated Dhaka- Comilla -3.39 0.00 -3.29 0.00 Cointegrated Dhaka-Khulna -9.10 0.00 -7.24 0.00 Cointegrated Dhaka-Sherpur -3.88 0.00 -3.65 0.00 Cointegrated Dhaka-Bogra -3.31 0.00 -3.40 0.00 Cointegrated Dhaka- Rangpur -7.97 0.00 -6.02 0.00 Cointegrated Dhaka-Dinajpur -3.76 0.00 -3.62 0.00 Cointegrated Dhaka- Kushtia -3.32 0.00 -3.39 0.00 Cointegrated Dhaka- Sylhet -4.35 0.00 -4.18 0.00 Cointegrated Dhaka-Noagaon -3.45 0.00 -3.35 0.00 Cointegrated Dhaka-Noakhali -3.32 0.00 -3.39 0.00 Cointegrated
AEG = Augmented Engle-Granger test Test critical values: 1% level -3.455096 5% level -2.872328 10% level -2.572592 1 The applicability of the Ravallion model is not limited to radial market structures and it can be used to study other market structures as well.
8.2 Strong forms of market integration
For testing strong form of rice markets integration, the null hypotheses were applied to find rice market integration against alternate hypotheses where rice markets might not be integrated. The result of strong form of market integration in selected rice markets is given in Table 8.3. It is seen from Table 8.3 that strong form of market integration was observed all the rice markets in Bangladesh due to congenial atmosphere existed in these markets. This empirical finding strongly supports marketing efficiency in the markets. Price move in the unison in all the markets together.

65
Central price policy would be effective for these markets. For the estimation of strong form of
market Integration we used the following restriction ( )0,1 .
Table 8.3: Testing strong form of integration ( )0,1 in rice markets in Bangladesh
( tttt ueXY 1 ) Dependent variable ((lnδYt)
Bangladesh
Independent variable
)ln( tX
When If 1 ,Then : tttt ueXY 1 t-value for
0 Coefficient
1te
Standard Error
t-value for1
P values
Dhaka Chittagong
-0.08** 0.027 -3.44 0.00 -3.44**
Dhaka Comilla -0.07** 0.025 -3.24 0.00 -3.24
Dhaka aKhu ln -0.51** 0.053 -9.07 0.00 -9.09**
Dhaka Sherpur -0.13** 0.032 -3.73 0.00 -3.73**
Dhaka Bogra -0.07** 0.025 -3.31 0.00 -3.51**
Dhaka Rangpur -0.45** 0.052 -7.73 0.00 -7.75**
Dhaka Dinajpur -0.10** 0.022 -3.76 0.00 -1.40
Dhaka Kushtia -0.08** 0.023 -3.15 0.00 -3.16**
Dhaka Sylhet -0.14** 0.03 -4.18 0.00 -4.19**
Dhaka Noagaon -0.08** 0.025 -3.35 0.00 -3.22**
Dhaka Noakhali -0.08** .023 -3.31 0.00 -3.32**
** and* indicate 1% and 5% level of significance
8.3 Unit root and cointegration tests for coarse rice price of selected countries
Real import parity price1 was used for measuring cointegration of Bangladesh and selecting exporting countries. The monthly wholesales price data were used during the period of January 2000 to December 2011.
Then the nominal import parity price was converted into real import parity price. The real import parity price was also converted into natural log. Testing a null hypothesis of nonstationarity against an alternative hypothesis of stationarity, the results of the unit root tests relating to coarse rice exporting countries and Bangladesh rice markets both at level and first difference are presented in Table 8.4. The findings reveal that all prices are non-stationary at level but stationary in their first differences.
1 Import parity price = {(Export price + international transportation cost) × Exchange rate × 1.01 +internal transportation cost in Tk.}
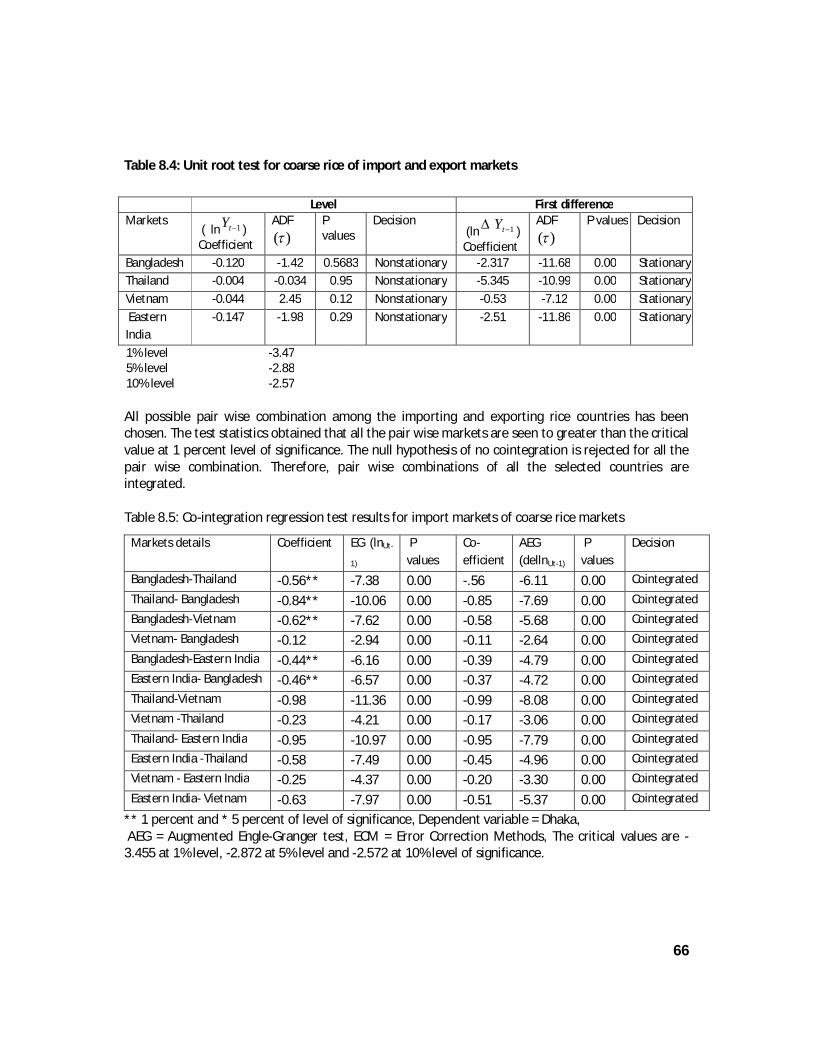
66
Table 8.4: Unit root test for coarse rice of import and export markets
Level First difference Markets
( ln 1tY ) Coefficient
ADF
)(
P values
Decision (ln 1 tY ) Coefficient
ADF
)(
P values Decision
Bangladesh -0.120 -1.42 0.5683 Nonstationary -2.317 -11.68 0.00 Stationary Thailand -0.004 -0.034 0.95 Nonstationary -5.345 -10.99 0.00 Stationary
Vietnam -0.044 2.45 0.12 Nonstationary -0.53 -7.12 0.00 Stationary
Eastern India
-0.147 -1.98 0.29 Nonstationary -2.51 -11.86 0.00 Stationary
1% level -3.47 5% level -2.88 10% level -2.57 All possible pair wise combination among the importing and exporting rice countries has been chosen. The test statistics obtained that all the pair wise markets are seen to greater than the critical value at 1 percent level of significance. The null hypothesis of no cointegration is rejected for all the pair wise combination. Therefore, pair wise combinations of all the selected countries are integrated. Table 8.5: Co-integration regression test results for import markets of coarse rice markets
Markets details Coefficient EG (lnUt-
1) P values
Co-efficient
AEG (dellnUt-1)
P values
Decision
Bangladesh-Thailand -0.56** -7.38 0.00 -.56 -6.11 0.00 Cointegrated
Thailand- Bangladesh -0.84** -10.06 0.00 -0.85 -7.69 0.00 Cointegrated
Bangladesh-Vietnam -0.62** -7.62 0.00 -0.58 -5.68 0.00 Cointegrated
Vietnam- Bangladesh -0.12 -2.94 0.00 -0.11 -2.64 0.00 Cointegrated
Bangladesh-Eastern India -0.44** -6.16 0.00 -0.39 -4.79 0.00 Cointegrated
Eastern India- Bangladesh -0.46** -6.57 0.00 -0.37 -4.72 0.00 Cointegrated
Thailand-Vietnam -0.98 -11.36 0.00 -0.99 -8.08 0.00 Cointegrated
Vietnam -Thailand -0.23 -4.21 0.00 -0.17 -3.06 0.00 Cointegrated
Thailand- Eastern India -0.95 -10.97 0.00 -0.95 -7.79 0.00 Cointegrated
Eastern India -Thailand -0.58 -7.49 0.00 -0.45 -4.96 0.00 Cointegrated
Vietnam - Eastern India -0.25 -4.37 0.00 -0.20 -3.30 0.00 Cointegrated
Eastern India- Vietnam -0.63 -7.97 0.00 -0.51 -5.37 0.00 Cointegrated
** 1 percent and * 5 percent of level of significance, Dependent variable = Dhaka, AEG = Augmented Engle-Granger test, ECM = Error Correction Methods, The critical values are -3.455 at 1% level, -2.872 at 5% level and -2.572 at 10% level of significance.

67
8.4 Strong forms of market integration
For testing strong form of rice markets integration, the null hypotheses were applied to find rice market integration against alternate hypotheses where rice markets might not be integrated. The result of strong form of market integration in selected rice markets is given in Table 8.6. It is seen from Table 8.6 that strong form of market integration do not support Eastern India-Thailand, Vietnam-Eastern India, Eastern India-Bangladesh and rest of markets support strong form market integration. Price changes are fully and immediately passed one market to the other markets.
Table 8.6: Testing strong form of integration ( )0,1 of selected rice markets
( tttt ueXY 1 )
Dependent variable ln tY
Independent variable ln )( tX
When If 1 ,Then :
tttt ueXY 1
t-value for 0
Coefficient
1te
Standard Error
t-value for
1
P values
Bangladesh Thailand -0.90** 0.11 -8.03 0.00 -8.06**
Thailand Bangladesh -0.09** 0.04 -2.09 0.03* 2.10*
Bangladesh Vietnam -1.31** 0.11 -11.00 0.00 -11.03**
Vietnam Bangladesh 0.20** 0.06 2.98 0.00 2.99**
Bangladesh IndiaEastern -0.85** 0.15 -5.67 0.00 -5.69**
IndiaEastern Bangladesh -0.10 0.21 -0.47 0.63 -0.47
Thailand Vietnam -1.95** 0.12 -15.92 0.00 -15.98**
Vietnam Thailand -0.59** 0.16 -3.58 0.00 -3.59**
Thailand IndiaEastern 0.82 0.10 7.77 0.00 7.80**
IndiaEastern Thailand -0.25 0.47 -0.54 0.58 -0.55
Vietnam IndiaEastern -0.07 0.04 1.67 0.09 1.68
IndiaEastern Vietnam -0.48** 0.10 -4.52 0.00 -4.53**
** and* indicate 1% and 5% level of significance
8.5 Regression analysis of Domestic rice markets To calculate pair wise regression of the selected 12 domestic rice markets prices, the time period was considered from January 1990 to December 2011 and the results are presented in Table 8.7. Weekly wholesale market price and Log linear model used for the study. The coefficient of Log linear model indicates the elasticity of prices. The entire coefficients are significant at 1 % level. If price of Chittagong market increases 1 per cent then the price of Dhaka market increase 0.66 per cent and vice versa. And if the price of Comilla market increases 1 per cent then the price of Dhaka market increases 0.51 per cent and vice versa. Interpretations of all other coefficients are similar.
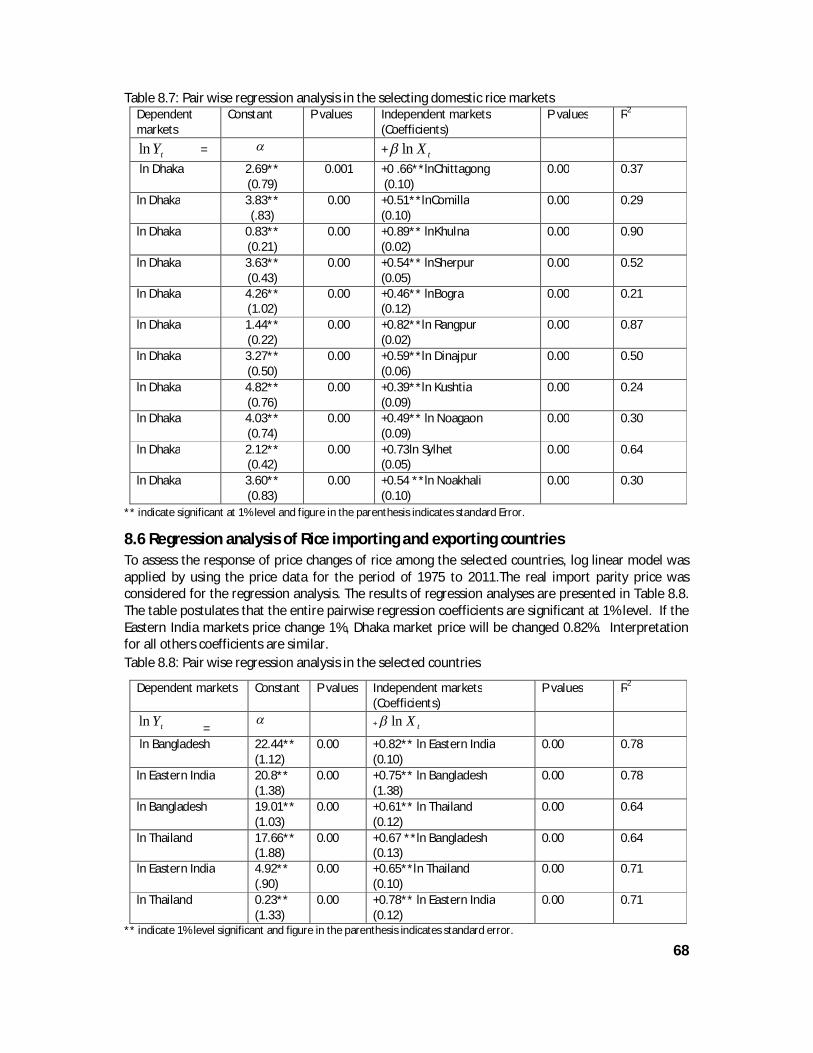
68
Table 8.7: Pair wise regression analysis in the selecting domestic rice markets Dependent markets
Constant P values Independent markets (Coefficients)
P values R2
tYln = + tXln
ln Dhaka 2.69** (0.79)
0.001 +0 .66**lnChittagong (0.10)
0.00 0.37
ln Dhaka 3.83** (.83)
0.00 +0.51**lnComilla (0.10)
0.00 0.29
ln Dhaka 0.83** (0.21)
0.00 +0.89** lnKhulna (0.02)
0.00 0.90
ln Dhaka 3.63** (0.43)
0.00 +0.54** lnSherpur (0.05)
0.00 0.52
ln Dhaka 4.26** (1.02)
0.00 +0.46** lnBogra (0.12)
0.00 0.21
ln Dhaka 1.44** (0.22)
0.00 +0.82**ln Rangpur (0.02)
0.00 0.87
ln Dhaka 3.27** (0.50)
0.00 +0.59**ln Dinajpur (0.06)
0.00 0.50
ln Dhaka 4.82** (0.76)
0.00 +0.39**ln Kushtia (0.09)
0.00 0.24
ln Dhaka 4.03** (0.74)
0.00 +0.49** ln Noagaon (0.09)
0.00 0.30
ln Dhaka 2.12** (0.42)
0.00 +0.73ln Sylhet (0.05)
0.00 0.64
ln Dhaka 3.60** (0.83)
0.00 +0.54 **ln Noakhali (0.10)
0.00 0.30
** indicate significant at 1% level and figure in the parenthesis indicates standard Error.
8.6 Regression analysis of Rice importing and exporting countries
To assess the response of price changes of rice among the selected countries, log linear model was applied by using the price data for the period of 1975 to 2011.The real import parity price was considered for the regression analysis. The results of regression analyses are presented in Table 8.8. The table postulates that the entire pairwise regression coefficients are significant at 1% level. If the Eastern India markets price change 1%, Dhaka market price will be changed 0.82%. Interpretation for all others coefficients are similar.
Table 8.8: Pair wise regression analysis in the selected countries
Dependent markets
Constant
P values Independent markets (Coefficients)
P values R2
tYln = + tXln
ln Bangladesh 22.44** (1.12)
0.00 +0.82** ln Eastern India (0.10)
0.00 0.78
ln Eastern India 20.8** (1.38)
0.00 +0.75** ln Bangladesh (1.38)
0.00 0.78
ln Bangladesh 19.01** (1.03)
0.00 +0.61** ln Thailand (0.12)
0.00 0.64
ln Thailand 17.66** (1.88)
0.00 +0.67 **ln Bangladesh (0.13)
0.00 0.64
ln Eastern India 4.92** (.90)
0.00 +0.65**ln Thailand (0.10)
0.00 0.71
ln Thailand 0.23** (1.33)
0.00 +0.78** ln Eastern India (0.12)
0.00 0.71
** indicate 1% level significant and figure in the parenthesis indicates standard error.

69
IX. Suggested policy options for improvement of structure, conduct and performance of rice market in Bangladesh
9.1 Market structure The existing structure of paddy market is characterized as oligopsonistic and atomistic from seller side at the market. This market condition can be more workable by adopting the following measures.
• Formation of farmers’ marketing cooperative/group may help to improve the bargaining position of the farmers in the market.
• Development of market yard for paddy market as most of the paddy markets sit along and/on the road and though places are leased out to Izaradar. The farmers have to pay market toll for selling paddy but without having services from the market.
• Credit facility may be provided to paddy traders. The traders should have trading licenses.
9.2 Market conduct To ensure regular supply of good quality paddy in the market, following steps may be considered.
• Cost of inputs involved in paddy production such as seed, fertilizers, irrigation charges, tilling, intercultural operations, harvesting, threshing, cleaning etc. can be reduced through adopting cost reducing technologies and optimum utilization of machines.
• Arrangement to be made to disseminate paddy prices of different important markets through mobile phones.
• Display of buying prices of paddy on board by buyers Association/market committee on market.
9.3 Rice mills 9.3.1 Market structure
Concentration of rice mills on the basis of installed capacity is low due to presence of large number of husking mills in the industry. Large number of mills is one of the factors for low capacity utilization of the mills.
• Considering the requirement of the market as well as the country the husking mills should be modernized to semi-automatic/automatic rice mills. Profitable cases should be financed by institutional sources.
9.3.2 Market conduct
• Development and introduction of quality standard for rice in the market. The rice bag should contain minimum information about the product (name of the mill, its location, date of processing, number of boiling, net weight and variety of rice, millgate price). Labeling of the bag should be mandatory.
• Quality of the rice should be ensured. Investigation should be done to examine the nutritional aspect of milled rice after extracting bran from the rice.

70
9.3.3 Market performance
Under utilization of mills might increase per unit cost of milling rice. So arrangement should be taken to ensure full utilization of mills. Following measures may be suggested for improving the market performance of rice mills:
• Ensure regular and undisrupted power supply to rice mills. • Make available of spare parts at reasonable prices in markets. Quality standard of the spare
parts may be introduced. • The introduction of contractual arrangements between rice growers and rice millers will
ensure regular supply of required amount of good quality paddy for the millers and it will also guarantee attractive price for the farmers.
• Quality of milled rice varied from one category of mill to another. So improvement in processing technology should be encouraged through providing various services (credit facility, technical knowledge and necessary permission). It may be noted that government will not procure rice from husking mills from 2015 (Convener, Bangladesh Auto Major and Husking Mill Owner Association).
• Installation of Engleberg rice huller in the country should be banned. As use of rubber roll milling technology instead of “Engleberg”hullers would save 4.5 % of foodgrain (Baqui, 2010).
• Vocational training programme may help to produce qualified personnel for operating the automatic rice mills.
• Ensure optimum use of by-products such as husk, bran, broken rice, and husk–ash.
• Wage discrimination by sex needs to be addressed. Wage should be determined according to contribution to final product.
• Arrangement of foreign visits particularly the rice exporting countries for the millers may help to change the attitudes to the business. FAO may sponsor such visits.
• The government should have a complete and accurate data base on rice mills and market intermediaries which will facilitate appropriate policy formulation and also monitoring business activities.
• Government policy in rice price stabilization will be effective rapidly all over the country as domestic rice markets are integrated. Even any intervention regarding the price policy in the central market will bring positive result in other distant rice markets in the country.

71
Acknowledgements
We are deeply appreciative of the financial support provided by the USAID, EU and FAO for undertaking this research works. Special thanks go to Dr. Ciro Fiorillo, Chief Technical Advisor NFPCSP for his constant advice and support to complete the work. We want to thanks Dr. S.A. Sabur, Availability Advisor and Dr. Shahin Yaqub, Economist both are TAT members of this project for their cooperation and advice throughout the project period and their on-going support and their willingness to provide feedback on the report. We are grateful to Dr. Rezaul Karim Talukder, National Social Access Advisor, FPMU for the valuable comment on the project during various workshops. We are also grateful to Dr. David Dawe, Senior Economist, FAO who helped us in revision of methodology, providing secondary data and also provided valuable comments during In-house workshops and also in preparing this report. We would like to acknowledge with thanks the help of Ms Nasrin Sultana, Assistant Director, Dept of Agricultural Marketing, Government of Bangladesh and other District Marketing Officers who extended their cooperation by providing information during field study.
We wish to acknowledge the cooperation of the rice millers, traders of rice and paddy. Unless their cooperation through providing data and information, it would be difficult to complete the study.
The support of the key informants like Mr. Shushantha Kumar Saha of Sherpur; Mr. Layek Ali, Convenor, Bangladesh Rice Mills Association and Abdur Rahman of Kushtia; Mr. Nirod Boron Saha, President, Paddy-Rice aratdar and Traders Association; Pranab Kumer Chowdhury (Muni), Naogaon, district are highly appreciated. We are benefited from consultation with the Key–agents. We are grateful to the respondents: miller, paddy traders, and rice traders for their cooperation in providing necessary data for the project. Thanks go to Mr. Haribula Sarker, DDE Chuadanga who helped us to visit farmers at border areas for collection of information about Miniket paddy from growers’ level. We acknowledge the cooperation of officials at Upazila level and the respondent-miniket growers.
We would like to express our gratitude to Mr. Md. Kawserul Islam Sikder, Deputy Director, MISM for providing list of millers of different districts in spite of his busy schedule. Many thanks leave for data enumerators and the Research Assistants of the project for their hard working in data collection & data management.
We are thankful to Dr. Nur Ahamed Khondaker, Research Grants Administrator, NFPCSP for his cooperation and advice which enable us to complete the tasks on time. Finally we express grateful appreciation to many people who have contributed to the completion of the project work and this report.

72
Bibliography Ahmed , Raisuddin and Bernard, Andrew. 1989. Rice price fluctuation and an approach to price
stabilization in Bangladesh. Research Report 72. Washington D.C.: International Food Policy Research Institute.
Alexander, C. and J. Wyeth 1994. Cointegration and market integration: An application to the Indonesian rice market. Journal of Development Studies, 30(2):303-328.
Ali, K.M.L. 2011. Rice mills going automatic. The Daily Star, October 13, Dhaka.
Ardeni, Pier Giorgio, 1989. Does the law of one price really hold for commodity price? American Journal of Agricultural Economics, 71 (3): 661-669.
Baharumshah, A. Z. and M. S. Habibullah 1994. Price efficiency in pepper markets in Malaysia: A co-integration Analysis. Indian Journal of Agricultural Economics, 49(2):205-216.
Bain, J. S. 1951. Relation of profit rate to industrial concentration: American manufacturing 1936-40. Quarterly Journal of Economics, 65: 293-324.
Bain, J.S. 1968. Industrial organization. University of California, John Wiley & Sons Inc. New York. Baulch, B., Das, J., Jaim, W.M.H., Farid, N. and Zahir, S. 1998. The spatial integration and pricing
efficiency of the private sector grain trade in Bangladesh: Phase II report. BIDS, BSERT, BAU, Institute of Development Studies at the University of Sussex.
Behura, D. and D.C. Pradhan 1998. Cointegration and market integration: An application to the marine fish markets in Orissa. Indian Journal of Agricultural Economics, 53(3): 344-350.
Blyn, G. 1973. Price series correction a measure of market integration. Indian Journal of Agricultural Economics, 28(3): 56-59.
Brennan, D. 1995. Policies for stabilizing rice prices in Bangladesh. Final report of the Bangladesh foodgrains management operations project. Chemonics International, Mimeo.
Chowdhury, N . 1992. Rice markets in Bangladesh: A study in structure, conduct and performance,
Dhaka: USAID, Bangladesh.
Crow, Ben. 1989, Plain tales from the rice trade: indications of vertical integration in foodgrain markets in Bangladesh, The Journal of Peasant Studies, 16 (2): 198-229.
Dawe D. and Slayton T. 2004. Changing structure, conduct and performance of world rice market. Presented at the FAO International year of rice conference, Rome February 2004.
Dawe, D.C., Piedad F. Moya, Cheryll B. Casiwan, Jesuca M. Cabling .2008. Rice marketing systems in Philippines and Thailand: Do large numbers of competitive traders ensure good performance? Food Policy, 33(5): 455 – 463.
Dawson, P.J. and Dey, P. K. 2002. Testing for the law of one price: rice market integration in Bangladesh. Journal of International Development, 14:473-484.
Deb, U. 2008. Boro procurement and food security strategy: An actionable agenda. Paper presented at CIRDAP auditorium on April 21. Retrieved from http://www.cpd.org.bd/downloads/boro-procurement_strategy.pdf.
Dickinson, R. 2009. Temples of steam: the rice mills of Burma. www.internationalsteam. co.uk/mills/burmamill00.htm.
Dickey, D.A. and W.A. Fuller 1979. Distribution of the estimators for autoregressive time series with a unit roots, Journal of the American Statistical Association, 74 (366): 427-431.
Dickey, D. A. and W. A. Fuller 1981. Likelihood ratio statistics for autoregressive time series with a unit root, Econometrica, 49 (4): 1057-1072.
73
Dijkstra, T. 1997. Horticultural marketing channels in Kenya: Structure and development”, Ph.D. Thesis, Wageningen University, The Netherlands. 253p.
Directorate of Rice Research 2011. Production Oriented Survey 2010 All India Coordinated Rice
Improvement Programme (ICAR), Directorate of Rice Research, Rajendranagar, Hyderabad-500 030, Andhra Pradesh, India
Dorosh, P.A. and Wailes, E. 2010. The international rice trade: structure, conduct, and performance. In: Pandey et.al.(ed.) Rice in the global economy : strategic research and policy issues for food security, IRRI.
Engle, R. F. and C.W.J. Granger 1987. Cointegration and error correction: Representation, Estimation and Testing. Econometrica, 55(2): 251-276.
Faminow, M.D. and B.L. Benson 1990. Integration of spatial markets. American Journal of Agricultural Economics, 72: 49-62.
Farouk,S.M. and Zaman,M.A.2002.Improved of skill and work environment of landless wage earners engaged in rice processing system of Bangladesh. A project report submitted to the Research and Extension in Farm Machinery Issues (REFPI), Department of Farm Power and Machinery, BAU, Mymensingh.
Farruk, M.O. 1970. The structure and performance of rice marketing system in East Pakistan, Cornel University. Occasional Paper No. 31. Department of Agricultural Economics, USAID, Prices Research Project.
Farruk, M.O. 1972. Structure and Performance of the Rice marketing System in East Pakistan, New York: Cornell University special publications.
Ghosh, M. 2000. Cointegration test and spatial integration of rice markets in India. Indian Journal of Agricultural Economics, 55(4): 617-626.
Goletti, F., R. Ahmed and N. Farid 1995. Structural determinants of market integration: The case of rice markets in Bangladesh, The Developing Economies, 33 (2): 185-202.
Goosens, F. (1994). Performance of cassava marketing in Zaire. Ph.D. Thesis, Leuven: catholic University of Leuven.
Hargreaves Colin P. 1994. Non-stationary time series analysis and cointegration. Oxford University Press.
Harriss, B.1979. There is method in my madness: or vice-versa? Measuring agricultural market performance. Food Research Institute Studies, 17(2): 11- 19.
Hossain, Mahbub 1980. Foodgrain production in Bangladesh: Performance, potential and constraints. The Bangladesh Development Studies, 8(1&2): 39-70.
Hossain, Mahbub 1984. Agricultural development in Bangladesh: A historical perspective. The Bangladesh Development Studies, 12 December.
Hossain, Mahbub 1986. Irrigation and agricultural performance in Bangladesh: Some further results. The Bangladesh Development Studies, 14 (4): 37-56.
Hossain, Mahbub 1987. Agricultural growth linkages: The Bangladesh case. The Bangladesh Development Studies, 15(1): 1-30.
Hossain, Mahbub 1988. Nature and impact of green revolution in Bangladesh, Washington D.C., International food Policy Research Institute, Research Report No.67.
Hossain, M.I. and Wim Verbeke 2010. Evaluation of rice markets integration in Bangladesh. `The Lahore Journal of Economics, 15(2): 77-96.
Hossain, M. and Deb, U. 2010. Volatility in rice prices and policy responses in Bangladesh. In: Dawe D.(ed.) The rice crisis: markets, policies and food security. FAO and Earthscan.
IFPRI/ BIDS, 1985. Fertilizer pricing policies in Bangladesh, Washington: IFPRI, 1987, a Joint IFPRI/BIDS Publication.
74
Islam, M.S., Ghani, M.A., Islam, A.K.M.S., Rahman, M.A. 2003. Effect of drying and tempering on the milling quality of long grain aromatic paddy processing in Bangladesh. Pakistan Journal of Biological science, 6 (19):1675-1680
Islam, M.A., Hossain, M, Islam, A.S.MN, Akhter, S., Haun, M. E. and Efferson, J.N. 1987. A benchmark study of rice marketing in Bangladesh, Bangladesh Rice Research Institute, Joydebpur, Gajpur, Bangladesh.
Ismet, M., A.P. Barkley and R.V. Liewelyn 1988. Government intervention and market integration in Indonesian rice markets. Agricultural Economics, 19: 283-195.
Jayasena, W.V. and Hangatilike, S.A. 1986. Losses of rice during milling in commercial rice mill of Srilanka. Agricultural Mechanization in Asia, Africa and Latin America.Vol.7, No.3.
Johansen, S. and K. Jusilius 1990. Maximum likelihood estimation and inference on cointegretion with application to the demand for money, Oxford Bulletin of Economics and Statistics, 52, (2): 169-210.
Kabir, S.N. 2008. Supply and value chain analysis of rice mill. A M.S. Thesis submitted to the Department of Farm Power and Machinery, Bangladesh Agricultural University, Mymensingh.
Kapur, B.N. 2003. A diagnostic study report of rice milling industry at Karnal (Haryana). India. Small Industries Service Institute, Karnal, Haryana
Khan, A. R 2005. Market structure, conduct and performance of dairy industry in Bangladesh. An Unpublished Ph. D. Thesis, Department of Cooperation and Marketing, Bangladesh Agricultural University, Mymensingh, Bangladesh.
Kohls, R. L. and J.N. Uhl 2005. Marketing of Agricultural Products, 9th edition, Prentice – Hall of India Private Limited, New Delhi.
Kotler, P. 2002. Marketing management, 11th edition, Pearson Education (Singapore) Pte. Ltd. Kotler, P. and Armstrong, G. 1997. Principles of marketing. 7th edition, Prentice Hall, Englewood
Cliffs, New Jersey, USA. Kumar, A and B. B. Singh 1979. Market integration and efficiency of paddy crops. Indian Journal of
Agricultural Economics, 34 (4): 217. Kumar, P. and R.K. Sharma 2000. Market integration and marketing efficiency of wheat in Haryana.
Indian Journal of Quantitative Economics, 15(1&2): 90. Kumar, P. and R.K. Sharma 2003. Spatial price integration and pricing efficiency at the farm level: A
study of paddy in Haryana. Indian Journal of Agricultural Economics, 58(2): 201-217. Le- Khiong-Ninh 2003. Investment of rice mill in Vietnam: The role of financial market imperfections
and uncertainty. Lele, U.J. 1965. Efficiency of jowar marketing: A study of regulated markets in western India.
Unpublished Ph.D. Dissertation, Cornell University. Lele, U.J. 1967. Market integration: A study of sorghum prices in Western India. Journal of Farm
Economics, 49(1): 147-159. Lutz, C. H. M. 1994. The functioning of the maize market in Benin: Spatial and temporal arbitrage on
the market of a staple food crop, Ph. D. Thesis, University of Amsterdam, The Netherlands, p. 255.
Lutz, C.H.M. and Tilburg, A. 1992. Methodology to evaluate the performance of markets in the food marketing channel: With an application to periodic markets in Benin. Paper presented at workshop on methods for agricultural marketing research, March 1993, CIP/IARI, New Delhi, India, 24p.
Makers and Development Bulletins 2004. Adding value to Vietnam rice industry and improving the incomes for the poor. Central Institute for Economic Management (CIEM), 68, Phan Dinh Phung, Hanoi
75
Miah, M.L. 2004. Profitability analysis of shallow tube well owners under crop sharing arrangement in some selected areas of Bogra district. Unpublished MS Thesis, submitted to the Department of Agricultural Economics, Bangladesh Agricultural University, Mymensingh.
Minot N. Goletti F. 2000. Rice market liberalization and poverty in Vietnam. Research Report 114. Washington, D.C. (USA): International Food Policy Research Institute.
Misra, Manoj 2012. Does government intervention matter? Revisiting recent rice price increases in Bangladesh, PGDT 11, 112 -130
Monke, E. and T. Petzel 1984. Market integration: An application to international trade in cotton. American Journal of Agricultural Economics, 66(4): 401-487.
Mujeri, M. K., N. Ahmed, and M. I. Hossain 2013. Managing rice value chain for improved food security in Bangladesh, Research Report prepared for IFPRI under Policy Research and Strategy Support Program (PRSSP), Bangladesh Institute of Development Studies (BIDS), Dhaka, Bangladesh.
Nayak, P. 1996. Problems and prospects of rice modernization – A case study, Journal of Assam University, 1(1): 22-28.
Palaskas, T. B. and B. Harriss-White 1993. Testing market integration: New approach with Case material from the West Bengal food economy. Journal of Development Studies, 30 (1): 1-57.
Papanek, 1972. Economic development and foreign aid, Economic Journal. Petzel, T.E. and Monke, E.A. 1979. The integration of the international rice market. Food Res. Inst.
Studies, 17(3): 307-326. Raha, S.K. 1989. Market structure, conduct and performance of tanning industry in Bangladesh. An
Unpublished Ph. D. Thesis, Panjab University, Chandigarh, India. Rajagopal, 1986. Economic efficiency of paddy marketing system in Madhya Pradesh: A Case study.
Indian Journal of Agricultural Economics, 41(4): 583 -589. Rahman, S. M. S. 1998. An analysis of market structure, conduct and performance of paddy
processing industries in some selected areas of Naogaon district. Unpublished M.S. Thesis, submitted to Department of Cooperation and Marketing, Bangladesh Agricultural University, Mymensingh.
Rashid, M. H. Ar. 1993. A comparative analysis of deep tube well with buried pipe and deep tubewell with open channel irrigation system in a selected area of Sakhipur Thana of Tangail district. Unpublished MS Thesis, submitted to the Department of Agricultural Economics, Bangladesh Agricultural University, Mymensingh.
Ravallion, M. 1986. Testing market Integration. American Journal of Agricultural Economics, 68(1): 102-109.
Reardon, Thomas., K. Chen ,. B. Minten and L. Adriano 2012. The quiet revolution in staple food value chains: Enter the dragon, the Elephant, and the Tiger. Mandaluyong City, Philippines: Asian Development Bank.
Sarker, N. N. and Farouk, S.M.1989.Some factors causing rice milling loss in Bangladesh. Agricultural Mechanization in Asia, Africa and Latin America, 20(2): 49-52.
Sekhon, M. K., Rangi, P. S, Kaur and Manjeet 2003. Rice processing industry in Punjab: Problems and their remedies. Indian Journal of Agricultural Economics, 58(3): 544-553.
Shwetha, M. K. 2009. Business efficiency in rice mills- A comparative analysis of conventional and modern rice mills in Davangere District, MBA Thesis, submitted to College of Agriculture, Dharwad, University of Agricultural Sciences.
Siamwalla, A. and Haykin, S. 1983. The world rice market: structure, conduct, and performance. International Food Policy Research Institute Research Report 39. Washington, D. C.
Siddique, M. A. B. 2010. A study on rice marketing system in Bangladesh: An empirical analysis. An Unpublished Ph. D. Thesis, Department of Agribusiness and Marketing, Bangladesh Agricultural University, Mymensingh, Bangladesh.
ingZ wQwÏKx 2009. LvRv bM‡i Aew¯’Z PvZvj I ivBm wgj: Kg©c×wZ, mgm¨v Ges mgvavb, Bangladesh Journal of Political Economy, 25 (1&2): 441-452.

76
Talukder, R.K. 1990. Food pricing policies and nutrition in Bangladesh-A welfare analysis. An Unpublished Ph. D. Thesis, School of Agriculture, La Trobe University, Australia.
Tilburg, A. Van. 1988. Performance measurement in respect of periodic markets and marketing agents operating at these markets in Southwest Benin, West Africa. Proceedings of the European marketing Academy Conference, Bradford (UK), pp. 625-646.
Timmer, CP. 2010. Did speculation affect world rice prices? In: Dawe, D.(ed.) The rice crisis: Markets, policies and food security. FAO and Earthscan.
Timmer, C. P., Falcon, W., and Pearson, S. 1983. Food policy analysis, Maryland: Jhons Hopkins University Press.
Truong Vinh, Tran Van- Khanh, Lam Tyan -Hung, Nguyen Van- Xuan. 2009. Milling data collection and experiments. In: Nong Lam University, editor. CARD Project 026/VIE05 final workshop report: Investigation of rice kernel cracking and its control in the field and during post – harvest processes in the Mekong Delta of Vietnam. Nong Lam University, Ho Chi Minh City. pp. 87-90.
Tollens, E. 1992. Cassava marketing in Zaire: An analysis of its structure, conduct and performance, In L. Commann (ed.), Traditional Marketing Systems. Feldafing: German Foundation for International Development (DSE), p. 113-127.
Zanias, G. P. 1993. Testing for integration in European community agricultural product markets. Journal of Agricultural Economics, 44(3): 418-427.

76
Annex Annex 1: Assumptions for estimating IRR, BCR and NPV of different rice mills:
A. Husking mill The processing capacity of the husking mill would be 1260 metric ton of paddy per year. Seventy decimal of land has been taken for the husking mill and the value of this amount of land was assumed as the lease value of land per year to know the exact profitability of paddy processing. Because it is very difficult to estimate the appreciation of land after 15 or 25 years and this valuation is so high that will affect the real picture of cost and return of paddy processing. Lease value of land was assumed as Tk.909 per decimal per year. This was estimated from the field survey. People are leasing their land for some years for a specific amount of money per year.
1.Investment Cost (Tk.) Housing :200000 Soaking :100000 Steaming and boiling :110000 Floor drying :325000 Milling machine :49000 Weighing and sewing machine :13500
Subtotal :797500 2. Repair and maintenance cost (per year) :72500 3. Operating cost (per year)
Staff Labour Electricity Lubricant Biomass Bag Tax and insurance Paddy (Tk.16.85/kg) Lease value of land (15 years) Others
:185220 :851640 :157500 :1008 :504000 :352800 :1875 :21231000 :63630 :30000
Sub total :23378673
Total cost (2+3)= :23451173
4. Benefit from the mill If we assume that 1000 kg of rice will be produced from 1538 kg of paddy, and the mill will process 1260 metric tons of paddy per year, then per year return will be Tk. 23618938 by using the price of rice and its by-products. Details are given below:
Particulars Price (Tk./kg) Return (TK.)
Rice (1000 kg@1538 kg paddy) 26.60 21791938 By- products: Husk (9 kg@40 kg of paddy) 4 1134000 Bran (2.5 kg@40 kg of paddy) 5.6 441000 Broken rice(0.5kg@40 kg of paddy) 16 252000
Total income 23618938 5. Salvage value: Tk. 79750
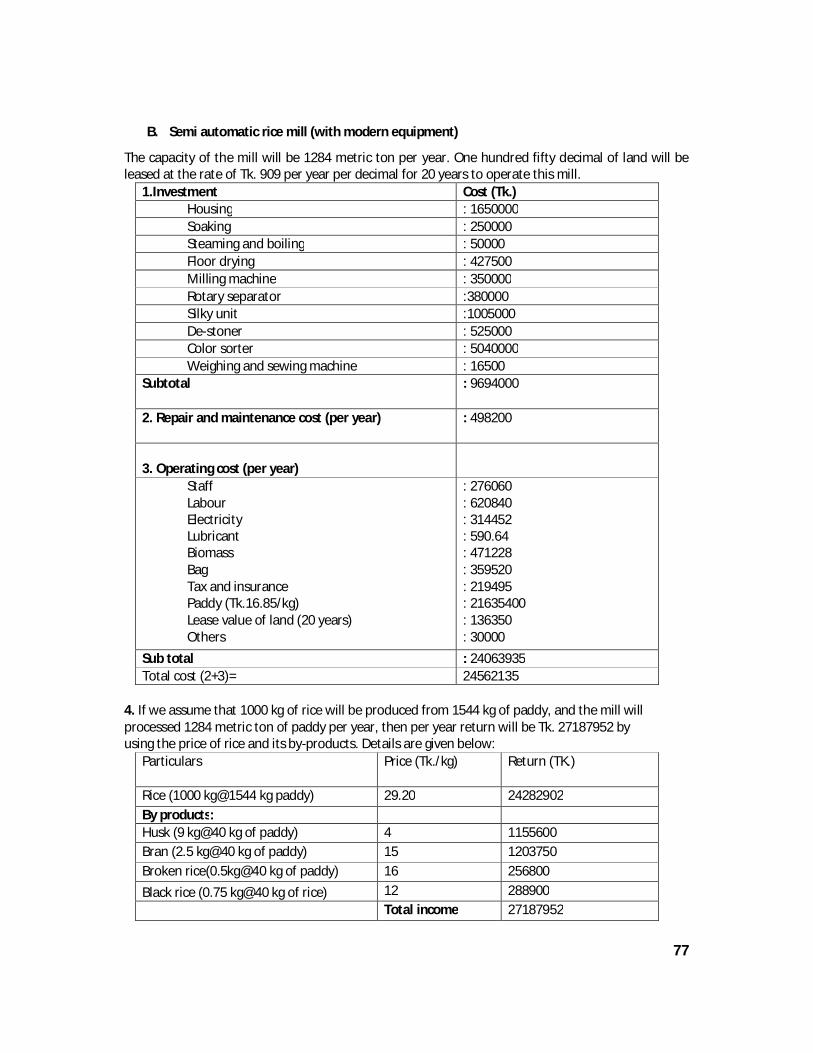
77
B. Semi automatic rice mill (with modern equipment)
The capacity of the mill will be 1284 metric ton per year. One hundred fifty decimal of land will be leased at the rate of Tk. 909 per year per decimal for 20 years to operate this mill.
1.Investment Cost (Tk.) Housing : 1650000 Soaking : 250000 Steaming and boiling : 50000 Floor drying : 427500 Milling machine : 350000 Rotary separator :380000 Silky unit :1005000 De-stoner : 525000 Color sorter : 5040000 Weighing and sewing machine : 16500
Subtotal : 9694000
2. Repair and maintenance cost (per year) : 498200
3. Operating cost (per year)
Staff Labour Electricity Lubricant Biomass Bag Tax and insurance Paddy (Tk.16.85/kg) Lease value of land (20 years) Others
: 276060 : 620840 : 314452 : 590.64 : 471228 : 359520 : 219495 : 21635400 : 136350 : 30000
Sub total : 24063935 Total cost (2+3)= 24562135
4. If we assume that 1000 kg of rice will be produced from 1544 kg of paddy, and the mill will processed 1284 metric ton of paddy per year, then per year return will be Tk. 27187952 by using the price of rice and its by-products. Details are given below:
Particulars Price (Tk./kg) Return (TK.)
Rice (1000 kg@1544 kg paddy) 29.20 24282902 By products: Husk (9 kg@40 kg of paddy) 4 1155600 Bran (2.5 kg@40 kg of paddy) 15 1203750 Broken rice(0.5kg@40 kg of paddy) 16 256800
Black rice (0.75 kg@40 kg of rice) 12 288900
Total income 27187952

78
5. Salvage value of the building and machinery: Tk. 1539200
C. Automatic rice mill with modern equipment: This is the super rice mill with the capacity of 10000 metric ton of paddy per year. The amount of land will be 200 decimal and this will be taken as lease for the 25 years at the rate of Tk.1000 per year per decimal.
1.Investment Cost (Tk.) Housing : 18000000 Pre-cleaning : 350000 Parboiling : 7000000 Boiler : 5500000 Dryer : 15000000 Milling machine : 3800000 Rotary separator : 250000 Silky unit : 5400000 De-stoner : 525000 Color sorter : 10500000 Weighing and sewing machine : 37000
Subtotal : 66362000 2. Repair and maintenance cost (per year) : 4580000 3. Operating cost (per year)
Staff Labour Electricity Lubricant Biomass Bag Tax and insurance Paddy (Tk.17.40/kg) Lease value of land (25 years) Others
: 2166280 : 1156280 : 4729180 :166600 :6000000 :3200000 :522810 :174000000 :200000 :120000
Sub total :192261150 Total cost (2+3)= :196841150
4. If we assume that 1000 kg of rice will be produced from 1515 kg of paddy, and the mill will processed 10000 metric ton of paddy per year, then per year return will be Tk. 219269802 by using the price of rice and its by-products. Details are given below:
Particulars Price (Tk./kg) Return (TK.) Rice (1000 kg@1515 kg paddy) 30 198019802 By products: Husk (9 kg@40 kg of paddy) 4 9000000
Bran (2.0 kg@40 kg of paddy) 16 8000000 Broken rice(0.5kg@40 kg of paddy) 16 2000000
Black rice (0.75 kg@40 kg of rice) 12 2250000
Total income 219269802 5. Salvage value of the building and machinery: Tk. 11748700

79
Annex 2: Production of rice in different years in Bangladesh (‘000 metric ton) Former districts
2001-02 2000-01 1999-00 Average production
Net production (average production minus 10% of the average production)
Bandarban 43 42 42 42.33 38.10 Chittagong 1074 1114 1013 1067.00 960.30 Comilla 1776 1720 1505 1667.00 1500.30 Khagrachhari 57 50 36 47.67 42.90 Noakhali 982 987 919 962.67 866.40 Rangamati 52 51 42 48.33 43.50 Sylhet 1843 1847 1673 1787.67 1608.90 Dhaka 1281 1245 1019 1181.67 1063.50 Faridpur 965 998 855 939.33 845.40 Jamalpur 791 795 743 776.33 698.70 Kishoreganj 1304 1393 1423 1373.33 1236.00 Mymensingh 1231 1353 1170 1251.33 1126.20 Tangail 704 721 644 689.67 620.70 Barisal 1007 1019 909 978.33 880.50 Jessore 1598 1568 1638 1601.33 1441.20 Khulna 932 932 1008 957.33 861.60 Kushtia 577 589 616 594.00 534.60 Patuakhali 664 739 634 679.00 611.10 Bogra 1245 1206 1166 1205.67 1085.10 Dinajpur 1266 1444 1211 1307.00 1176.30 Pabna 845 917 719 827.00 744.30 Rajshahi 1951 2014 1860 1941.67 1747.50 Rangpur 2057 2337 2219 2204.33 1983.90 Bangladesh 24245 25086 23067 24132.67 21717.00

80
Annex 3: Rice surplus and deficit districts in 2000 Former districts
Net production ('000 metric ton)
Population in the year of 2000
Per capita consumption of rice (gm/day -according to HIES)
Per capita apparent consumption ( gm/day)
Total requirement (‘000 metric ton/year)
Surplus (+) and deficit(-)
Bandarban 38.10 298120 473.68 516.67 56.22 -18.12
Chittagong 960.30 8385849 415.42 453.12 1386.94 -426.64
Comilla 1500.30 9265040 403.47 440.09 1488.27 12.03
Khagrachhari 42.90 525664 580.56 633.25 121.50 -78.60
Noakhali 866.40 5307529 375.6 409.69 793.67 72.73
Rangamati 43.50 508182 393.02 428.69 79.51 -36.02
Sylhet 1608.90 7939343 501.76 547.30 1586.00 22.89
Dhaka 1063.50 17192103 422.03 460.33 2888.66 -1825.16
Faridpur 845.40 6102298 440.83 480.84 1070.99 -225.60
Jamalpur 698.70 3386751 531.42 579.65 716.54 -17.85
Kishoreganj 1236.00 4583142 487.6 531.85 889.71 346.28
Mymensingh 1126.20 4489726 455.79 497.16 814.72 311.48
Tangail 620.70 3290696 432.88 472.17 567.12 53.57
Barisal 880.50 5864383 426.77 465.50 996.41 -115.92
Jessore 1441.20 5573802 478.08 521.47 1060.90 380.29
Khulna 861.60 5792706 445.85 486.31 1028.24 -166.64
Kushtia 534.60 3338721 478.25 521.65 635.71 -101.11
Patuakhali 611.10 2309335 473.43 516.40 435.27 175.82
Bogra 1085.10 3859752 465.99 508.28 716.07 369.02
Dinajpur 1176.30 4693422 481.59 525.30 899.89 276.41
Pabna 744.30 4870084 477.49 520.82 925.81 -181.52
Rajshahi 1747.50 7624887 467.93 510.40 1420.49 327.01
Rangpur 1983.90 9153728 448.73 489.45 1635.33 348.56
Bangladesh 21717.00 124,355,263
446.23 486.73 22157.86 -440.86

81
Annex 4: Production of rice in different years in Bangladesh (‘000 metric ton) Former districts
2004-05 2005-06 2006-07 Average production ('000 metric ton)
Net production ('000 metric ton)
Bandarban 41.03 31.91 38.00 36.98 33.28 Chittagong 1079.23 1060.43 1044.00 1061.22 955.10 Comilla 1627.87 1712.26 1630.00 1656.71 1491.04 Khagrachhari 76.10 84.68 91.00 83.93 75.53 Noakhali 822.00 916.50 917.00 885.16 796.65 Rangamati 59.48 54.31 52.00 55.26 49.74 Sylhet 1758.55 1950.75 1867.00 1858.76 1672.89 Dhaka 1252.02 1189.92 1154.00 1198.65 1078.78 Faridpur 1017.01 1086.77 1053.00 1052.26 947.03 Jamalpur 826.78 909.95 1065.00 933.91 840.52 Kishoreganj 1283.94 1470.30 1482.00 1412.08 1270.87 Mymensingh 1236.09 1233.23 1247.00 1238.77 1114.90 Tangail 758.37 790.84 841.00 796.73 717.06 Barisal 914.08 1100.15 1070.00 1028.07 925.27 Jessore 1740.74 1882.58 1937.00 1853.44 1668.09 Khulna 1009.43 1066.26 1111.00 1062.23 956.00 Kushtia 602.54 589.01 640.00 610.51 549.46 Patuakhali 711.35 685.97 583.00 660.10 594.09 Bogra 1378.35 1354.64 1495.00 1409.33 1268.39 Dinajpur 1502.36 1623.54 1737.00 1620.96 1458.87 Pabna 705.79 984.34 1078.00 922.71 830.43 Rajshahi 2206.31 2342.87 2401.00 2316.72 2085.05
Rangpur 2293.93 2409.15 2785.00 2496.03 2246.42 Bangladesh 24903.46 26530.45 27318.00 26250.64

82
Annex 5: Rice surplus and deficit districts in 2005 Former districts per capita
consumption of rice (gm/ day) according to HIES
Apparent per capita consumption (gm/day)
Estimated population for the year 2005
Requirement ('000 metric ton/year)
Net production ('000 metric ton)
Surplus (+) and Deficit (-)
Bandarban 497.16 540.03 357688.39 70.50 33.28 -37.22 Chittagong 444.89 483.25 9572748.16 1688.52 955.10 -733.42
Comilla 403.02 437.78 10425841.60 1665.94 1491.04 -174.90
Khagrachhari 452.24 491.25 597443.32 107.12 75.53 -31.58 Noakhali 357.68 388.52 6063951.16 859.94 796.65 -63.28 Rangamati 447.76 486.37 581634.29 103.25 49.74 -53.51 Sylhet 439.31 477.20 9332206.84 1625.47 1672.89 47.41 Dhaka 403.81 438.63 21130621.6 3383.05 1078.78 -2304.27 Faridpur 477.39 518.56 6586308.27 1246.63 947.03 -299.59 Jamalpur 502.37 545.69 3692033.59 735.37 840.52 105.14 Kishoreganj 568.52 617.55 5089929.71 1147.30 1270.87 123.56
Mymensingh 461.88 501.71 5028234.14 920.80 1114.90 194.09 Tangail 468.64 509.06 3623907.09 673.35 717.06 43.71 Barisal 424.03 460.60 6153989.72 1034.61 925.27 -109.34 Jessore 424.33 460.92 6176434.92 1039.11 1668.09 628.98 Khulna 421.49 457.84 6103594.66 1019.99 956.00 -63.98 Kushtia 441.10 479.15 3718720.91 650.36 549.46 -100.89 Patuakhali 393.19 427.10 2490302.93 388.21 594.09 205.87 Bogra 454.98 494.21 4295764.29 774.90 1268.39 493.48 Dinajpur 496.56 539.38 5286119.36 1040.70 1458.87 418.16 Pabna 499.24 542.30 5503533.29 1089.37 830.43 -258.93 Rajshahi 453.06 492.13 8498531.16 1526.59 2085.05 558.46 Rangpur 481.15 522.65 10278460.5 1960.79 2246.42 285.63 Bangladesh 140588000 24751.98

83
Annex 6: District wise per capita consumption of rice and surplus/deficit districts in rice in Bangladesh in 2010
District 2011 Population (thousand)
Per capita consumption (gm/day) according to HIES
Apparent per capita consumption (gm/day)
Requirement ('000metric ton/year)
Net production ('000metric ton/year)
Surplus (+) and deficit(-) (m.ton)
1 Barguna 882 436.77 601.27 193.56 226.73 33.16 2 Barisal 2291 374.86 516.05 431.52 470.47 38.94 3 Bhola 1,758 437.01 601.60 386.03 525.51 139.47 4 Jhalokati 596 393.22 541.32 117.76 135.66 17.90 5 Patuakhali 1,517 432.67 595.63 329.80 392.54 62.74 6 Pirojpur 1,103 428.43 589.79 237.44 209.78 -27.66 7 Bandarban 383 473.68 652.09 91.15 40.25 -50.90 8 B-baria 2,808 410.65 565.32 579.40 511.48 -67.92 9 Chandpur 2,393 315.79 434.73 379.71 327.11 -52.59 10 Chittagong 7,509 401.45 552.65 1514.71 726.11 -788.60 11 Comilla 5,304 358.63 493.70 955.79 980.73 24.93 12 Cox's bazar 2275 477.29 657.06 545.60 340.40 -205.20 13 Feni 1,420 303.85 418.29 216.80 259.38 42.58 14 Khagrachhari 608 440.94 607.02 134.70 107.69 -27.01 15 Lakshmipur 1,711 333.82 459.55 286.99 263.23 -23.75 16 Noakhali 3,072 362.22 498.65 559.12 440.77 -118.34 17 Rangamati 596 432.56 595.48 129.54 55.18 -74.35 18 Dhaka 11,875 324.79 447.12 1937.99 220.71 -1717.28 19 Faridpur 1,867 431.63 594.20 404.92 247.22 -157.70 20 Gazipur 3,333 364.55 501.85 610.53 316.58 -293.94 21 Gopalganj 1,149 420.98 579.54 243.05 343.84 100.79 22 Jamalpur 2265 462.69 636.96 526.59 630.86 104.27 23 Kishoregonj 2,853 469.54 646.39 673.11 773.99 100.87 24 Madaripur 1149 434.39 598.00 250.79 197.55 -53.23 25 Manikganj 1379 407.49 560.97 282.35 228.77 -53.58 26 Munshiganj 1,420 382.06 525.96 272.60 105.01 -167.59 27 Mymensingh 5,042 417.18 574.31 1056.92 1356.52 299.60 28 Narayanganj 2,897 409.85 564.21 596.60 121.66 -474.94 29 Narsingdi 2,202 389.22 535.81 430.65 291.15 -139.50 30 Netrakona 2,207 482.32 663.98 534.87 821.12 286.24 31 Rajbari 1,040 453.59 624.43 237.03 169.38 -67.64 32 Shariatpur 1,146 360.36 496.08 207.50 137.54 -69.96 33 Sherpur 1,334 429.7 591.54 288.02 476.95 188.92 34 Tangail 3,571 431.71 594.31 774.63 812.23 37.60 35 Bagerhat 1,461 390.94 538.18 286.99 306.00 19.00

84
36 Chuadanga 1,123 435.25 599.18 245.60 258.03 12.42 37 Jessore 2,742 426.84 587.60 588.09 941.61 353.51 38 Jhenaidah 1,756 444.02 611.26 391.78 543.69 151.91 39 Khulna 2,294 392.97 540.98 452.96 329.53 -123.43 40 Kushtia 1,933 462.16 636.23 448.89 357.76 -91.12 41 Magura 913 425.95 586.38 195.40 259.24 63.83 42 Meherpur 652 412.71 568.15 135.21 155.52 20.31 43 Narail 715 410.55 565.18 147.49 221.99 74.49 44 Satkhira 1,973 441.22 607.40 437.42 468.27 30.85 45 Bogra 3,371 416.3 573.09 705.15 1049.92 344.77 46 Joypurhat 909 407.1 560.43 185.94 406.35 220.41 47 Naogaon 2,576 493.34 679.15 638.57 1216.57 578.00 48 Natore 1,696 435.61 599.68 371.22 408.59 37.36 49 C. nababganj 1,635 371.86 511.92 305.50 351.70 46.20 50 Pabna 2,497 429.26 590.94 538.58 431.64 -106.93 51 Rajshahi 2,573 397.35 547.01 513.72 511.29 -2.43 52 Sirajganj 3072 424.44 584.30 655.16 630.21 -24.95 53 Dinajpur 2,970 466.59 642.33 696.31 1159.19 462.88 54 Gaibandha 2,349 451.71 621.84 533.16 628.45 95.29 55 Kurigram 2,050 456.77 628.81 470.50 522.43 51.92 56 Lalmonirhat 1,249 489.07 673.27 306.93 360.86 53.92 57 Nilphamari 1,820 508.41 699.90 464.94 510.26 45.32 58 Panchagarh 981 485.45 668.29 239.29 333.27 93.98 59 Rangpur 2,866 447.74 616.38 644.79 754.36 109.57 60 Thakurgaon 1380 476.59 656.09 330.47 539.91 209.44 61 Habiganj 2,059 436.16 600.43 451.25 609.77 158.52 62 Maulvibazar 1,902 445.64 613.49 425.90 379.01 -46.88 63 Sunamganj 2,443 520.32 716.29 638.71 572.44 -66.27 64 Sylhet 3,404 426.52 587.16 729.53 519.81 -209.71

85
Annex 7: Real price of coarse rice in different years of Bangladesh (Taka/MT)
year CPI Wholesale price Taka/MT
Real price
1975 20.50 3863.33 47939.21
1976 21.17 2845.00 34185.69
1977 22.29 3497.50 39914.49
1978 25.56 3638.33 36209.64
1979 28.98 5084.17 44627.71
1980 33.67 4748.33 35874.08
1981 37.88 4916.67 33017.49
1982 41.44 6536.67 40125.44
1983 45.80 6540.83 36328.74
1984 50.72 7742.50 38831.57
1985 56.29 7478.33 33795.3
1986 61.66 8193.33 33801.8
1987 65.24 9488.33 36996.34
1988 67.42 9427.50 35570.56
1989 74.20 9722.50 33331.67
1990 80.17 9953.33 31581.99
1991 85.97 10815.83 32003.38
1992 89.95 10431.67 29500.93
1993 89.62 8403.33 23852.25
1994 92.85 11020.00 30191.36
1995 98.26 12607.50 32638.87
1996 101.08 10715.83 26967.68
1997 106.43 9914.17 23696.01
1998 115.68 13400.83 29468.39
1999 123.10 13039.17 26944.79
2000 125.81 11753.33 23764.5
2001 128.02 11587.50 23024.75
2002 132.79 12734.17 24394.29
2003 139.90 13221.67 24040.95
2004 148.44 13630.83 23359
2005 158.89 15516.67 24841.91
2006 169.65 15997.50 23987.29
2007 185.16 19445.83 26715.44
2008 201.58 28720.83 36243.7
2009 212.51 20090.00 24048.25
2010 229.78 20100.00 22251.88
2011 254.38 20110.00 20110

86
Annex 8: Real price of Eastern India in Different Years
Year Eastern Indian Rice price (Rs/100kg)
Exchange rate (Rs/USD)
Eastern Indian Rice price (USD/100kg)
Eastern Indian Rice price (USD/MT)
Exchange rate (Tk./USD)
Eastern Indian Rice price (Tk./100kg)
General CPI 1995 base
real price (Tk./100kg)
1975 196.94 8.38 23.62 236.17 12.19 283.93 20.50 4134.64
1976 182.81 8.96 20.41 204.06 15.40 314.30 21.17 3953.33
1977 174.40 8.74 19.95 199.52 15.38 306.87 22.29 3670.94
1978 163.83 8.19 20.01 200.09 15.02 300.43 25.56 3138.34
1979 188.32 8.13 23.19 231.88 15.55 360.66 28.98 3310.21
1980 193.66 7.86 24.64 246.37 15.45 380.58 33.67 3017.58
1981 187.63 8.66 21.67 216.72 17.99 389.79 37.88 2739.09
1982 244.36 9.46 25.82 258.17 22.12 572.08 41.44 3669.38
1983 293.30 10.10 29.06 290.62 24.62 715.02 45.80 4163.34
1984 260.19 11.36 22.95 229.47 25.35 581.38 50.72 3057.80
1985 253.39 12.37 20.53 205.31 27.99 577.02 56.29 2720.11
1986 284.85 12.61 22.59 225.93 30.41 686.88 61.66 2975.56
1987 302.85 12.96 23.36 233.63 30.95 723.10 65.24 2953.28
1988 312.11 13.92 22.48 224.75 31.73 712.92 67.42 2820.10
1989 343.09 16.23 21.15 211.52 32.27 682.59 74.20 2454.02
1990 365.99 17.50 20.90 208.98 34.57 722.98 80.17 2400.45
1991 423.55 22.74 18.89 188.92 36.60 689.59 85.97 2138.69
1992 475.67 25.92 18.35 183.54 38.95 714.89 89.95 2117.38
1993 578.52 30.49 18.99 189.88 39.57 751.48 89.62 2233.05
1994 643.78 31.37 20.52 205.20 40.21 825.17 92.85 2366.64
1995 688.91 32.43 21.29 212.87 40.28 857.16 98.26 2323.94
1996 721.66 35.43 20.37 203.69 41.79 851.59 101.08 2243.12
1997 770.01 36.31 21.22 212.21 43.89 931.45 106.43 2329.86
1998 879.05 41.26 21.30 213.01 46.91 999.39 115.68 2301.27
1999 1029.40 43.06 23.90 239.03 49.09 1173.35 123.10 2538.27
2000 932.30 44.94 20.77 207.73 52.14 1081.86 125.81 2290.84
2001 882.31 47.19 18.70 186.98 55.81 1043.62 128.02 2170.84
2002 884.58 48.61 18.20 181.99 57.89 1053.49 132.79 2112.83
2003 953.14 46.58 20.48 204.77 58.15 1190.94 139.90 2266.43
2004 1011.20 45.32 22.32 223.19 59.51 1328.50 148.44 2383.32 2005 1002.20 44.10 22.73 227.34 64.33 1462.26 158.89 2451.91 2006 1027.58 45.31 22.68 226.76 68.93 1563.36 169.65 2453.67 2007 1172.94 41.35 28.47 284.70 68.88 1960.27 185.16 2815.74 2008 1337.74 43.51 30.93 309.33 68.60 2121.86 201.58 2811.88
2009 1394.58 48.41 28.87 288.74 69.04 1993.60 212.51 2494.59 2010 1776.50 45.73 38.85 388.53 69.65 2707.01 229.78 3134.18

87
2011 1757.69 46.63 37.87 378.69 74.27 2804.41 254.38 2945.04 Table 5.1: Paddy markets by district with market day
Name of the Market Market day
Birganj, Dinajpur Sunday, Wednesday Farmhat, Dinajpur Saturday, Tuesday Abadpukur, Naogaon Sunday, Wednesday Naimile Bazar, Bogra Sunday, Wednesday Kalampur, Dhaka Thursday Ambari, Dinajpur Friday, Monday Nalita Bari, Sherpur Saturday, Tuesday Chandina, Comilla Tuesday, Friday Shatibari Bazar, Rangpur Saturday, Wednesday Choudhurani, Rangpur Sunday, Thursday Dhantara, Dhaka Monday Fultala,Khulna Sunday, Wednesday Trimohini, Naogaon Saturday, Tuesday Sharua-Bottala Bazar ,Bogra Sunday, Wednesday Ailchara Bazar, Kushtia Wednesday, Sunday Halsa, Kushtia Saturday , Tuesday Haris Choudhury Bazar, Noakhali Monday, Friday Dhara Bazar, Mymensingh Monday, Friday Mirsharai, Chittagong Monday, Tuesday Kalirghat, Kazir Bazar, Sylhet No fixed day
Table 5.2: Distribution of paddy traders by district
District
Type of trader with numbers
Total Faria Bepari
Aratdar-cum-
wholesaler Dinajpur 15 17 13 45 Rangpur 0 13 16 29 Naogaon 3 27 21 51 Bogra 2 15 6 23 Kushtia 16 30 6 52 Khulna 0 2 7 9 Dhaka 0 10 1 11 Sherpur 0 1 32 33 Sylhet 0 7 0 7 Comilla 1 3 3 7 Noakhali 2 4 5 11 Chittagong 0 5 2 7 Total 39 (13.68) 134(47.02) 112(39.30) 285(100.00)
Figures within parentheses indicate percentages.

88
Table 5.3: Distribution of paddy traders by age
Age (year)
Type of trader with numbers Total
Faria Bepari Aratdar-cum-
wholesaler Up to 30 8(20.51) 20(14.93) 11(9.82) 39(13.68) 31-40 18(46.15) 50(37.31) 48(42.86) 116(40.70) 41-50 9(23.08) 43(32.09) 41(36.61) 93(32.63) 51-60 3(7.69) 17(12.69) 12(10.71) 32(11.23) Above 60 1(2.56) 4(2.98) 0 5(1.75) Total 39
(100.00) 134
(100.00) 112
(100.00) 285
(100.00) Figures within parentheses indicate percentages.
Table 5.4: Distribution of paddy traders by year of schooling
Year of schooling
Type of trader with numbers Total Faria Bepari Aratdar-
cum-wholesaler
Upto 5 years 14 48 10 72
6 -10 years 19 75 69 163
12 years 3 9 16 28
Above 12 years 3 2 17 22
Total 39 134 112 285 Table 5.5: Distribution of paddy traders by occupation
Occupation
Type of trader with numbers Total Faria Bepari Aratdar-cum-
wholesaler Farming
1 8 3 12
(4%) Paddy business
38 125 108 271
(95%) Rice processing
0 1 0 1
(0.5%) Service
0 0 1 1
(0.5%) Total 39 134 112 285
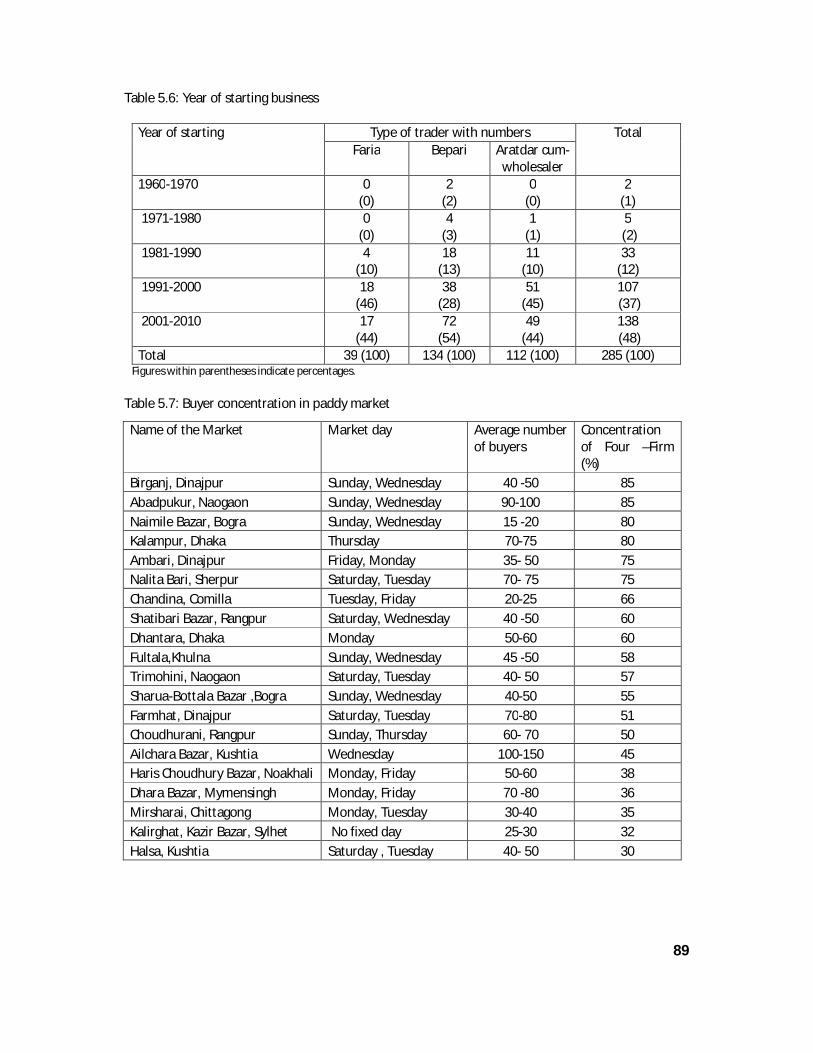
89
Table 5.6: Year of starting business
Year of starting
Type of trader with numbers Total Faria Bepari Aratdar cum-
wholesaler 1960-1970 0
(0) 2
(2) 0
(0) 2
(1) 1971-1980 0
(0) 4
(3) 1
(1) 5
(2) 1981-1990 4
(10) 18
(13) 11
(10) 33
(12) 1991-2000 18
(46) 38
(28) 51
(45) 107 (37)
2001-2010 17 (44)
72 (54)
49 (44)
138 (48)
Total 39 (100) 134 (100) 112 (100) 285 (100) Figures within parentheses indicate percentages.
Table 5.7: Buyer concentration in paddy market
Name of the Market Market day Average number of buyers
Concentration of Four –Firm (%)
Birganj, Dinajpur Sunday, Wednesday 40 -50 85 Abadpukur, Naogaon Sunday, Wednesday 90-100 85 Naimile Bazar, Bogra Sunday, Wednesday 15 -20 80 Kalampur, Dhaka Thursday 70-75 80 Ambari, Dinajpur Friday, Monday 35- 50 75 Nalita Bari, Sherpur Saturday, Tuesday 70- 75 75 Chandina, Comilla Tuesday, Friday 20-25 66 Shatibari Bazar, Rangpur Saturday, Wednesday 40 -50 60 Dhantara, Dhaka Monday 50-60 60 Fultala,Khulna Sunday, Wednesday 45 -50 58 Trimohini, Naogaon Saturday, Tuesday 40- 50 57 Sharua-Bottala Bazar ,Bogra Sunday, Wednesday 40-50 55 Farmhat, Dinajpur Saturday, Tuesday 70-80 51 Choudhurani, Rangpur Sunday, Thursday 60- 70 50 Ailchara Bazar, Kushtia Wednesday 100-150 45 Haris Choudhury Bazar, Noakhali Monday, Friday 50-60 38 Dhara Bazar, Mymensingh Monday, Friday 70 -80 36 Mirsharai, Chittagong Monday, Tuesday 30-40 35 Kalirghat, Kazir Bazar, Sylhet No fixed day 25-30 32 Halsa, Kushtia Saturday , Tuesday 40- 50 30

90
Table 5.8: Problems for the new entrant as perceived by established traders
Sl. No.
Problems Faria Bepari Aratdar-cum-wholesaler
Index Rank Index Rank Index Rank
1 Lack of suitable site for shop 0.709 II 0.752 II 0.779 II 2 Irregular supply of rice 0.628 IV 0.589 V 0.552 V 3 Insufficient capital 0.932 I 0.906 I 0.913 I 4 Government permission 0.189 VIII 0.188 VIII 0.177 VIII 5 Price fluctuation 0.432 VI 0.372 VII 0.375 VII 6 Competition among traders 0.588 V 0.670 IV 0.641 IV 7 Bribery/ unofficial payment/
threats 0.382 VII 0.378 VI 0.384 VI
8 Business risk 0.699 III 0.682 III 0.684 III Note: Low ranks indicate more severity of the problem.
Table 5.9: Problems faced by the established traders at the time of entry
SL No.
Problems Faria Bepari Aratdar-cum-wholesaler
Index Rank Index Rank Index Rank 1 Lack of suitable site for shop 0.564 III 0.684 III 0.651 III 2 Irregular supply of rice 0.514 V 0.551 IV 0.530 V 3 Insufficient capital 0.892 I 0.915 I 0.894 I 4 Government permission 0.321 VIII 0.288 VII 0.294 VIII 5 Price fluctuation 0.331 VII 0.286 VIII 0.295 VII 6 Competition among traders 0.831 II 0.797 II 0.800 II 7 Bribery/ unofficial payment/
threats 0.453 VI 0.431 VI 0.461 VI
8 Business risk 0.544 IV 0.545 V 0.575 IV Note: Low ranks indicate more severity of the problem.
Table 5.10:Price setting mechanisms during buying and selling paddy
Process/Mechanism Buying price Selling price
Faria Bepari Aratdar- cum-wholesaler
Faria Bepari Aratdar- cum-wholesaler
Bargaining between seller and buyer
37 (100.00)
136 (97.14)
111 (96.52)
27 (60.00)
100 (62.11)
79 (59.39)
Set by seller 0
4 (2.86)
3 (2.61
8 (17.78)
30 (18.63)
36 (27.07)
Set by buyer
0 5 (11.11)
14 (8.70)
9 (6.77
Predetermined 0 0
1 (0.87)
5 (11.11)
17 (10.56)
9 (6.77)
Figures within parentheses indicate percentages.

91
Table 5.11 Reasons for difference in payment by the paddy traders
Items Faria Bepari Aratdar- cum-wholesaler
(i) Mode of payment (cash vs credit) 2 (13.33)
20 (33.89)
30 (42.25)
(ii) Volume of paddy (large/small) 5 (33.33)
20 (33.89)
18 (25.35)
(iii) Regular supply/ Loyal supplier 1 (6.67)
1 (1.69)
7 (9.86)
(iv) Advance payment 0 0 1 (1.40)
V) Bargaining 7 (46.67)
18 (38.50)
14 (19.72)
vi) All system 0 0 1 (1.40)
Total 15 59 71 Figures within parentheses indicate percentages.
Table 5.12 Do you sell paddy to a single buyer?
Type of trader Yes No All Faria 7 (19.44) 29(80.56) 36 Bepari 41(31.06) 91(68.94) 132 Aratdar- cum-wholesaler 35(33.98) 68(66.02) 103 All 83 (30.63) 188(69.37) 271
Figures within parentheses indicate percentages.
Table 5.13: Reasons to sell to a single buyer
Reasons Faria Bepari
Aratdar- cum-
wholesaler Regular buyer 7 (100.00) 39 (95.12) 29 (82.86) Reputed businessman 6 (85.71) 36 (87.80) 21 (60.00) Paid in advance 5 (71.43) 19 (46.34) 11 (31.43) Limited demand 6 (85.71) 27 (65.85) 10 (28.57) Offer relatively lower price 4 (57.14) 6 (14.63) 9 (25.71) Short distance 7 (100.00) 34 (82.93) 22 (62.86)
Figures within parentheses indicate percentages.
Table 5.14: Reasons for not to sell to a single buyer
Reasons Faria Bepari
Aratdar- cum-wholesaler
No regular buyer 5 (17.24) 8 (8.79) 4 (5.88) Reputed businessman 6 (20.69) 16 (17.58) 18 (26.47) No binding contract 29 (100.00) 90 (98.90) 64 (94.12) Limited demand of individual firm 22 (75.86) 51 (56.04) 38 (55.88) Offer relatively lower price 29 (100.00) 90 (98.90) 54 (79.41) Short distance 4 (13.79) 12 (13.19) 19 (27.94)
Figures within parentheses indicate percentages.
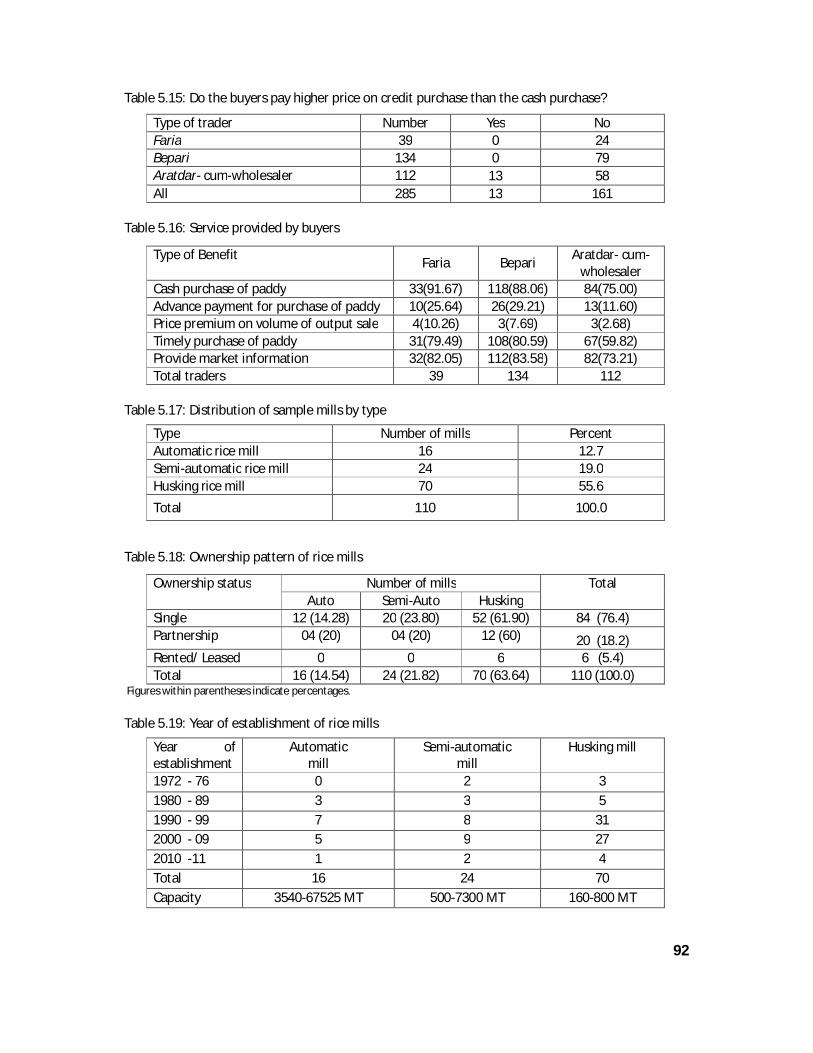
92
Table 5.15: Do the buyers pay higher price on credit purchase than the cash purchase?
Type of trader Number Yes No Faria 39 0 24 Bepari 134 0 79 Aratdar- cum-wholesaler 112 13 58 All 285 13 161
Table 5.16: Service provided by buyers
Type of Benefit Faria Bepari
Aratdar- cum-wholesaler
Cash purchase of paddy 33(91.67) 118(88.06) 84(75.00) Advance payment for purchase of paddy 10(25.64) 26(29.21) 13(11.60) Price premium on volume of output sale 4(10.26) 3(7.69) 3(2.68) Timely purchase of paddy 31(79.49) 108(80.59) 67(59.82) Provide market information 32(82.05) 112(83.58) 82(73.21) Total traders 39 134 112
Table 5.17: Distribution of sample mills by type
Type Number of mills Percent Automatic rice mill 16 12.7 Semi-automatic rice mill 24 19.0 Husking rice mill 70 55.6
Total 110 100.0
Table 5.18: Ownership pattern of rice mills
Ownership status Number of mills Total Auto Semi-Auto Husking
Single 12 (14.28) 20 (23.80) 52 (61.90) 84 (76.4) Partnership 04 (20) 04 (20) 12 (60) 20 (18.2) Rented/ Leased 0 0 6 6 (5.4) Total 16 (14.54) 24 (21.82) 70 (63.64) 110 (100.0)
Figures within parentheses indicate percentages.
Table 5.19: Year of establishment of rice mills
Year of establishment
Automatic mill
Semi-automatic mill
Husking mill
1972 - 76 0 2 3 1980 - 89 3 3 5 1990 - 99 7 8 31 2000 - 09 5 9 27 2010 -11 1 2 4 Total 16 24 70 Capacity 3540-67525 MT 500-7300 MT 160-800 MT

93
Table 5.20: Distribution of mills by area
Area (land in decimal) No. of mills Per cent of mills ≤50 43 39.1 51-100 40 36.4 101-150 14 12.7 151-200 5 4.5 201-250 1 0.9 ≥251 7 6.4 Total 110 100.0
Table 5.21 Distribution of rice traders by age
Age category Type of traders
Aratdar Wholesaler Wholesaler
cum aratdar Wholesaler cum- retailer Retailer
Total
Upto 30 years 1 8 2 5 16 32 31-40 years 8 52 12 14 42 128 41-50 years 16 44 8 31 31 130 51-60 years 5 23 1 14 12 55 Above 60 years 0 2 1 2 2 7 Total 30 129 24 66 103 352
Table 5.22: Distribution of rice traders by main occupation
Main occupation:
Type of traders Total Aratdar Wholesaler Wholesaler
cum aratdar wholesaler –cum- retailer
Retailer
Aratdari 29 - - - - 29 Dairy Firm 1 - - - - 1 Farming - 4 - - - 4 Rice business - 125 24 66 103 319 Total 30 129 24 66 103 352
Table 5.23: Distribution of rice traders by year of staring the business
Year of starting the business
Type of traders
Total
Aratdar Wholesaler Wholesaler –cum- aratdar
Wholesaler- cum- retailer Retailer
1960-1970 - 1 - - 1 2 1971-1980 - - 1 1 9 11 1981-1990 8 23 8 12 11 62 1991-2000 17 54 10 37 45 163 2001-2011 5 51 5 16 37 114 Total 30 129 24 66 103 352
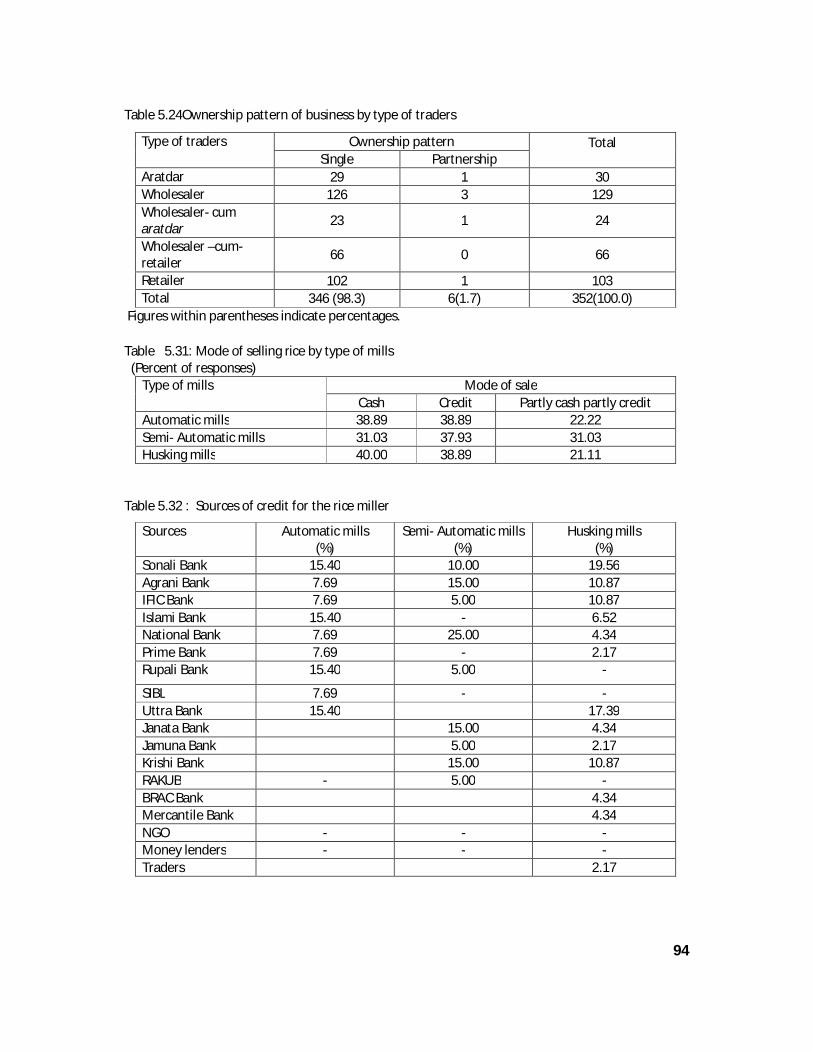
94
Table 5.24Ownership pattern of business by type of traders
Type of traders Ownership pattern Total Single Partnership
Aratdar 29 1 30 Wholesaler 126 3 129 Wholesaler- cum aratdar
23 1 24
Wholesaler –cum- retailer
66 0 66
Retailer 102 1 103 Total 346 (98.3) 6(1.7) 352(100.0)
Figures within parentheses indicate percentages. Table 5.31: Mode of selling rice by type of mills (Percent of responses)
Type of mills Mode of sale Cash Credit Partly cash partly credit
Automatic mills 38.89 38.89 22.22 Semi- Automatic mills 31.03 37.93 31.03 Husking mills 40.00 38.89 21.11
Table 5.32 : Sources of credit for the rice miller
Sources Automatic mills (%)
Semi- Automatic mills (%)
Husking mills (%)
Sonali Bank 15.40 10.00 19.56 Agrani Bank 7.69 15.00 10.87 IFIC Bank 7.69 5.00 10.87 Islami Bank 15.40 - 6.52 National Bank 7.69 25.00 4.34 Prime Bank 7.69 - 2.17 Rupali Bank 15.40 5.00 -
SIBL 7.69 - - Uttra Bank 15.40 17.39 Janata Bank 15.00 4.34 Jamuna Bank 5.00 2.17 Krishi Bank 15.00 10.87 RAKUB - 5.00 - BRAC Bank 4.34 Mercantile Bank 4.34 NGO - - - Money lenders - - - Traders 2.17
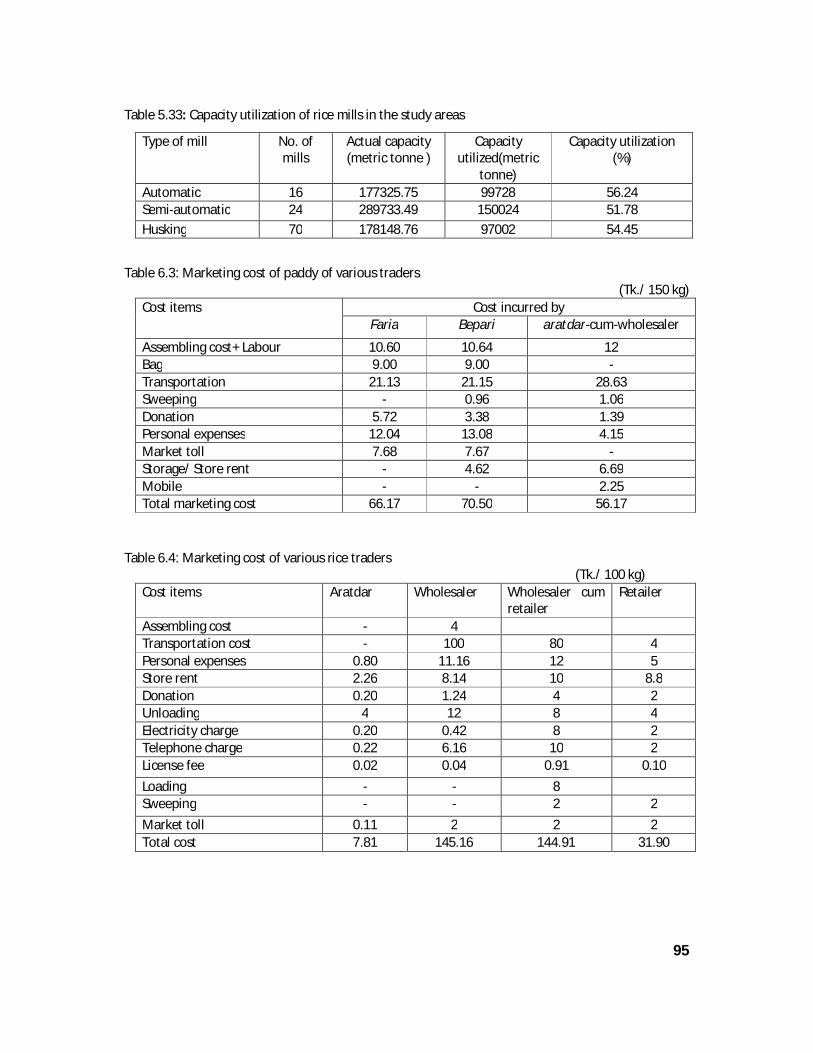
95
Table 5.33: Capacity utilization of rice mills in the study areas
Type of mill No. of mills
Actual capacity (metric tonne )
Capacity utilized(metric
tonne)
Capacity utilization (%)
Automatic 16 177325.75 99728 56.24 Semi-automatic 24 289733.49 150024 51.78
Husking 70 178148.76 97002 54.45
Table 6.3: Marketing cost of paddy of various traders
(Tk./ 150 kg) Cost items Cost incurred by
Faria Bepari aratdar-cum-wholesaler
Assembling cost+ Labour 10.60 10.64 12 Bag 9.00 9.00 - Transportation 21.13 21.15 28.63 Sweeping - 0.96 1.06 Donation 5.72 3.38 1.39 Personal expenses 12.04 13.08 4.15 Market toll 7.68 7.67 - Storage/ Store rent - 4.62 6.69 Mobile - - 2.25 Total marketing cost 66.17 70.50 56.17
Table 6.4: Marketing cost of various rice traders (Tk./ 100 kg)
Cost items Aratdar Wholesaler Wholesaler cum retailer
Retailer
Assembling cost - 4 Transportation cost - 100 80 4 Personal expenses 0.80 11.16 12 5 Store rent 2.26 8.14 10 8.8 Donation 0.20 1.24 4 2 Unloading 4 12 8 4 Electricity charge 0.20 0.42 8 2 Telephone charge 0.22 6.16 10 2 License fee 0.02 0.04 0.91 0.10
Loading - - 8 Sweeping - - 2 2
Market toll 0.11 2 2 2 Total cost 7.81 145.16 144.91 31.90
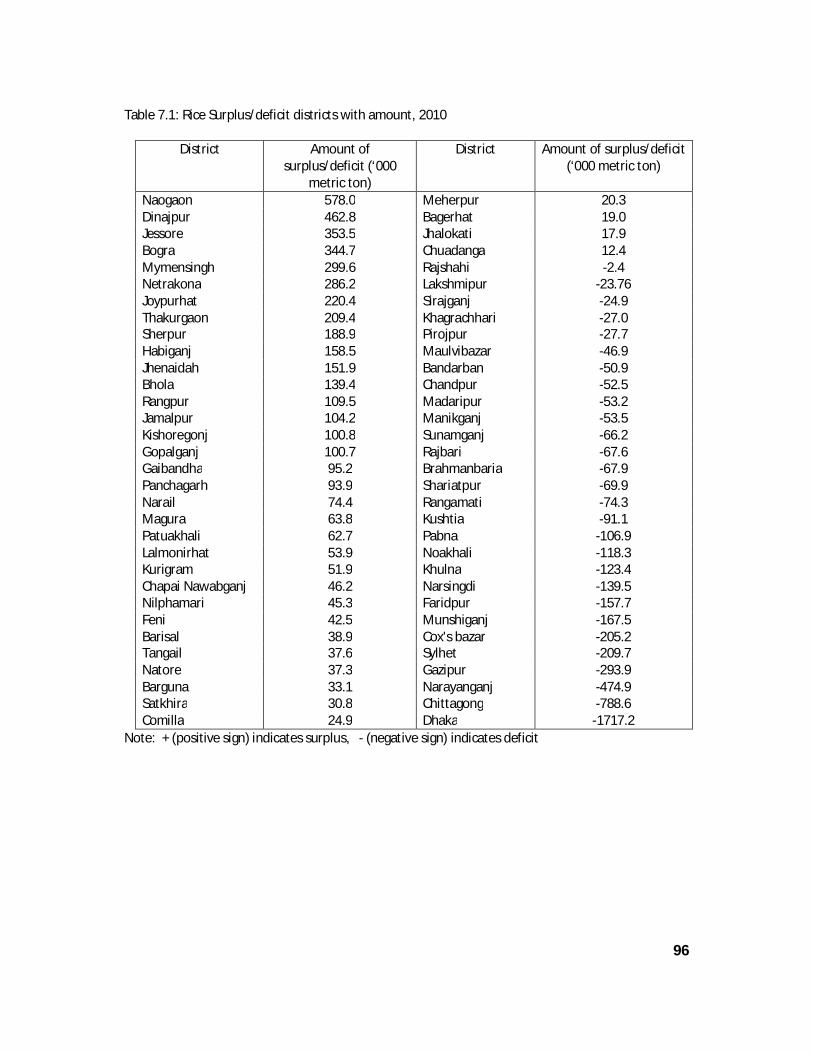
96
Table 7.1: Rice Surplus/deficit districts with amount, 2010
District Amount of surplus/deficit (‘000
metric ton)
District Amount of surplus/deficit (‘000 metric ton)
Naogaon 578.0 Meherpur 20.3 Dinajpur 462.8 Bagerhat 19.0 Jessore 353.5 Jhalokati 17.9 Bogra 344.7 Chuadanga 12.4 Mymensingh 299.6 Rajshahi -2.4 Netrakona 286.2 Lakshmipur -23.76 Joypurhat 220.4 Sirajganj -24.9 Thakurgaon 209.4 Khagrachhari -27.0 Sherpur 188.9 Pirojpur -27.7 Habiganj 158.5 Maulvibazar -46.9 Jhenaidah 151.9 Bandarban -50.9 Bhola 139.4 Chandpur -52.5 Rangpur 109.5 Madaripur -53.2 Jamalpur 104.2 Manikganj -53.5 Kishoregonj 100.8 Sunamganj -66.2 Gopalganj 100.7 Rajbari -67.6 Gaibandha 95.2 Brahmanbaria -67.9 Panchagarh 93.9 Shariatpur -69.9 Narail 74.4 Rangamati -74.3 Magura 63.8 Kushtia -91.1 Patuakhali 62.7 Pabna -106.9 Lalmonirhat 53.9 Noakhali -118.3 Kurigram 51.9 Khulna -123.4 Chapai Nawabganj 46.2 Narsingdi -139.5 Nilphamari 45.3 Faridpur -157.7 Feni 42.5 Munshiganj -167.5 Barisal 38.9 Cox's bazar -205.2 Tangail 37.6 Sylhet -209.7 Natore 37.3 Gazipur -293.9 Barguna 33.1 Narayanganj -474.9 Satkhira 30.8 Chittagong -788.6 Comilla 24.9 Dhaka -1717.2
Note: + (positive sign) indicates surplus, - (negative sign) indicates deficit

97
Table 7.2: Top 10 surplus districts in rice production of Bangladesh,2010
District
Share of total production of rice
(%)
Position Surplus as % of net production
Position
Mymensingh 4.67 1 22.08 16
Noagaon 4.19 2 47.51 2 Dinajpur 3.99 3 39.93 3 Bogra 3.62 4 32.83 9
Comilla 3.38 5 Jessore 3.24 6 37.54 6 Netrokona 2.83 7 34.86 7 Tangail 2.80 8 Kishoregonj 2.66 9 Rangpur 2.60 10
Joypurhat 1.40 31 54.24 1
Thakurgaon
38.79 5 Sherpur
39.61 4
Panchagarh Narail 33.56 8 Gopalganj
29.31 10
Source: Own calculation
0
2
4
6
8
10
12
14
NA
OG
AO
ND
INA
JPU
RJE
SSO
REB
OG
RA
MY
MEN
SIN
GH
NET
RA
KO
NA
JOY
PUR
HA
TTH
AK
UR
GA
ON
SHER
PUR
HA
BIG
AN
JJH
ENA
IDA
HB
HO
LAR
AN
GPU
RJA
MA
LPU
RK
ISH
OR
EGO
NJ
GO
PALG
AN
JG
AIB
AN
DH
APA
NCH
AG
ARH
NA
RA
ILM
AG
UR
APA
TUA
KH
ALI
LALM
ON
IRH
AT
KU
RIG
RA
MC
HA
PAI N
ABA
BG
AN
JN
ILPH
AM
AR
IFE
NI
BAR
ISA
LTA
NG
AIL
NA
TORE
BA
RG
UN
ASA
TKH
IRA
COM
ILLA
MEH
ERPU
RBA
GER
HA
TJH
ALO
KA
TIC
HU
AD
AN
GA
% o
f sur
plus
Figure 7.3: Rank of rice production surplus districts on the basis of total surplus of surplus districts , 2010
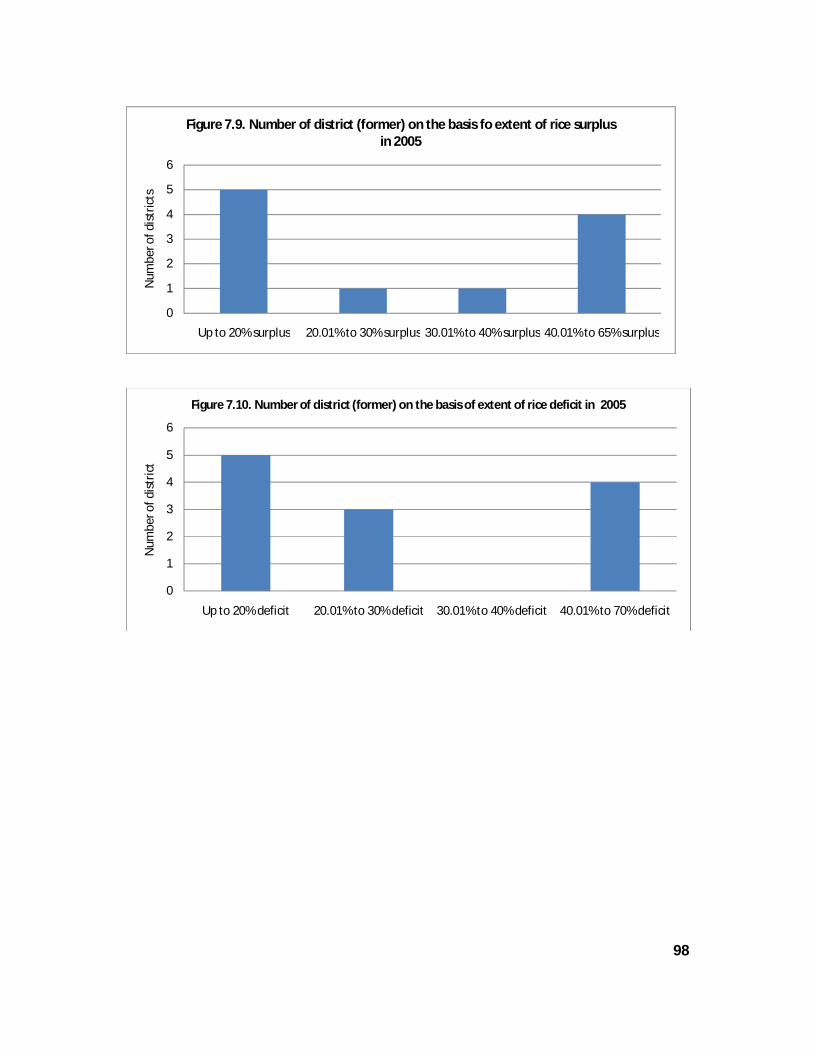
98
0
1
2
3
4
5
6
Up to 20% surplus 20.01% to 30% surplus 30.01% to 40% surplus 40.01% to 65% surplus
Num
ber o
f dis
tric
ts
Figure 7.9. Number of district (former) on the basis fo extent of rice surplus in 2005
0
1
2
3
4
5
6
Up to 20% deficit 20.01% to 30% deficit 30.01% to 40% deficit 40.01% to 70% deficit
Num
ber o
f dis
tric
t
Figure 7.10. Number of district (former) on the basis of extent of rice deficit in 2005

99
Map 7.1: Rice surplus /deficit at zila level in 2010
, Bart R,
Rice surplus districts
Rice deficit districts