sunlabob energy audit...sunlabob energy audit ... energy efficiency consultancy prior to...
TRANSCRIPT
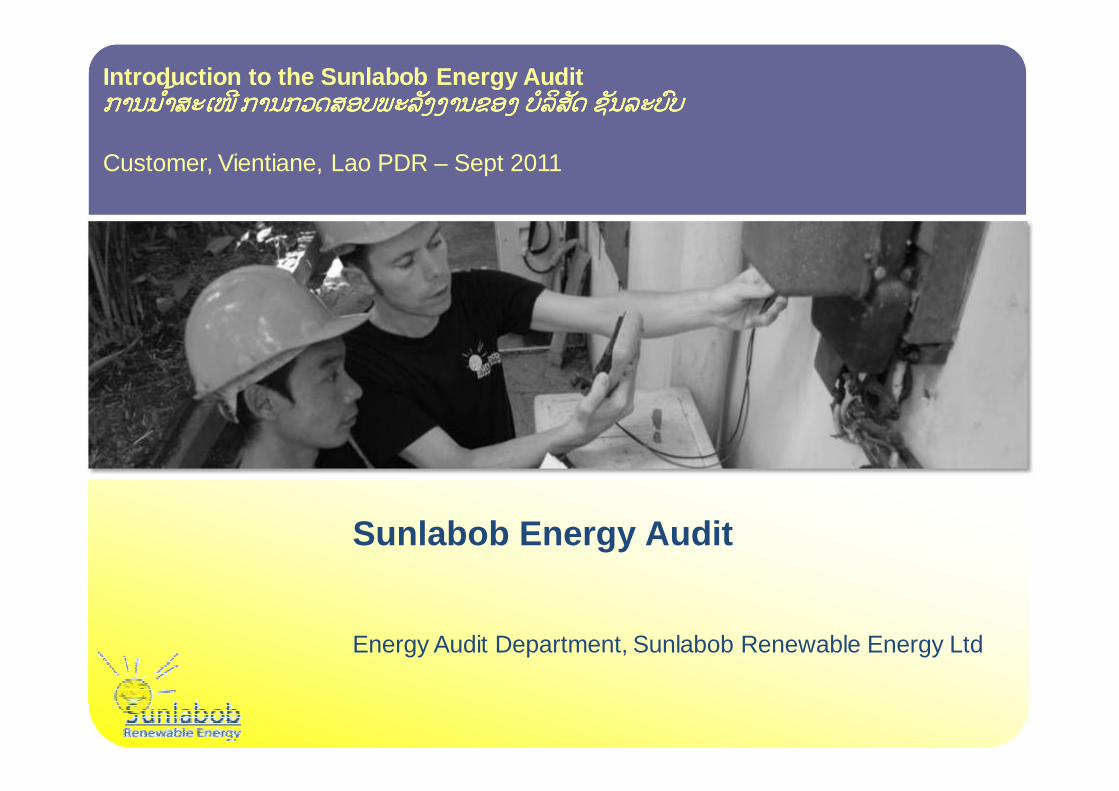
Sunlabob Energy Audit
Energy Audit Department, Sunlabob Renewable Energy Ltd
Introduction to the Sunlabob Energy Audit ການນ ໍາ້ສະເໜີການນ ໍາ້ສະເໜີການນ ໍາ້ສະເໜີການນ ໍາ້ສະເໜີ ການກວດສອບພະລງັງານຂອງການກວດສອບພະລງັງານຂອງການກວດສອບພະລງັງານຂອງການກວດສອບພະລງັງານຂອງ ບໍລສິດັບໍລສິດັບໍລສິດັບໍລສິດັ ຊນັລະບບົຊນັລະບບົຊນັລະບບົຊນັລະບບົ
Customer, Vientiane, Lao PDR – Sept 2011

Contents and Aims of the Presentation
Contents
I. Sunlabob company II. Energy efficiency III. Phase I: Auditing and consultingIV. Phase II: Implementation
AimsTo provide customer with an overview of our concepts and services and present the benefits of an energy audit towards energy efficiency.
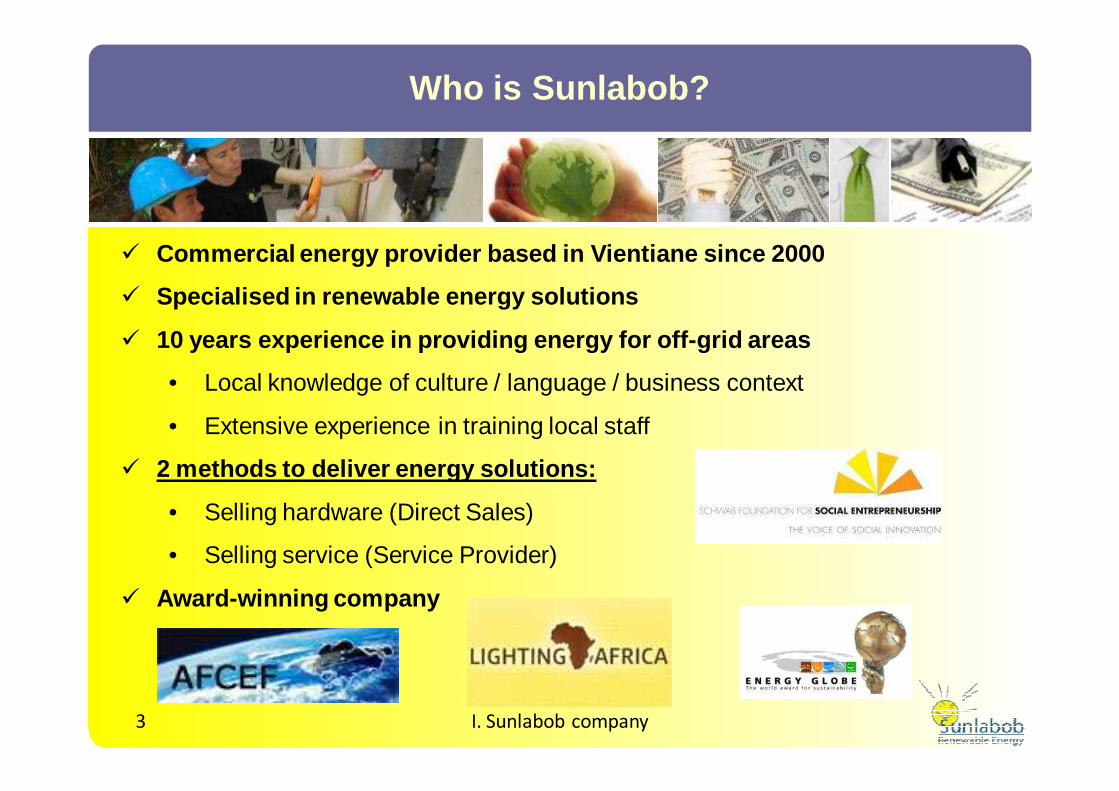
� Commercial energy provider based in Vientiane since 2000
� Specialised in renewable energy solutions
� 10 years experience in providing energy for off-gri d areas
• Local knowledge of culture / language / business context
• Extensive experience in training local staff
� 2 methods to deliver energy solutions:
• Selling hardware (Direct Sales)
• Selling service (Service Provider)
� Award-winning company
Who is Sunlabob?
3 I. Sunlabob company
Energy contributors in Laos
Ministry of Energy and Mines
� Official support in Lao P.D.R.
� Long term relationship with Sunlabob
I. Sunlabob company4

Energy efficiency department
Sunlabob energy efficiency department helps you to reduce the energy consumption in your buildings with the following solutions:
1. Energy Audit on existing buildings2. Energy Efficiency Consultancy prior to construction of
new buildings3. Supplying and installing Energy Efficient Equipment4. Behavioral training, work reorganization
5
WHAT do we offer to our customers?
I. Sunlabob company
� Energy efficiency activity started in April 2007� First and only company officially licensed by Ministry of Energy and Mines in Lao
PDR to conduct energy audit

Energy efficiency department
� EE department assets– Dynamic building performance simulation: Derob software
– Supported by Sunlabob’s 10 years of expertise in:• Solar water heater, solar photovoltaic
• Decentralized energy free waste water treatment systems: DEWATS
– Experienced in implementation of: efficient lighting, insulation, motion sensors, etc.
– Wide range of experiences: Offices, camp sites, houses, schools
6 I. Sunlabob company
� EE customers – successful start with several large contracts:
– Phu Bia Mining campsites (offices, workshops, accommodations, laundry) : 35.6% savings
– Swiss Development Cooperation agency: 45.9% savings
– Vientiane College: 51% savings
– Lao-German House: 34% savings
– Theun Hinboun Power Plant Company: 37 % savingsPhuBiaMining Ltd.
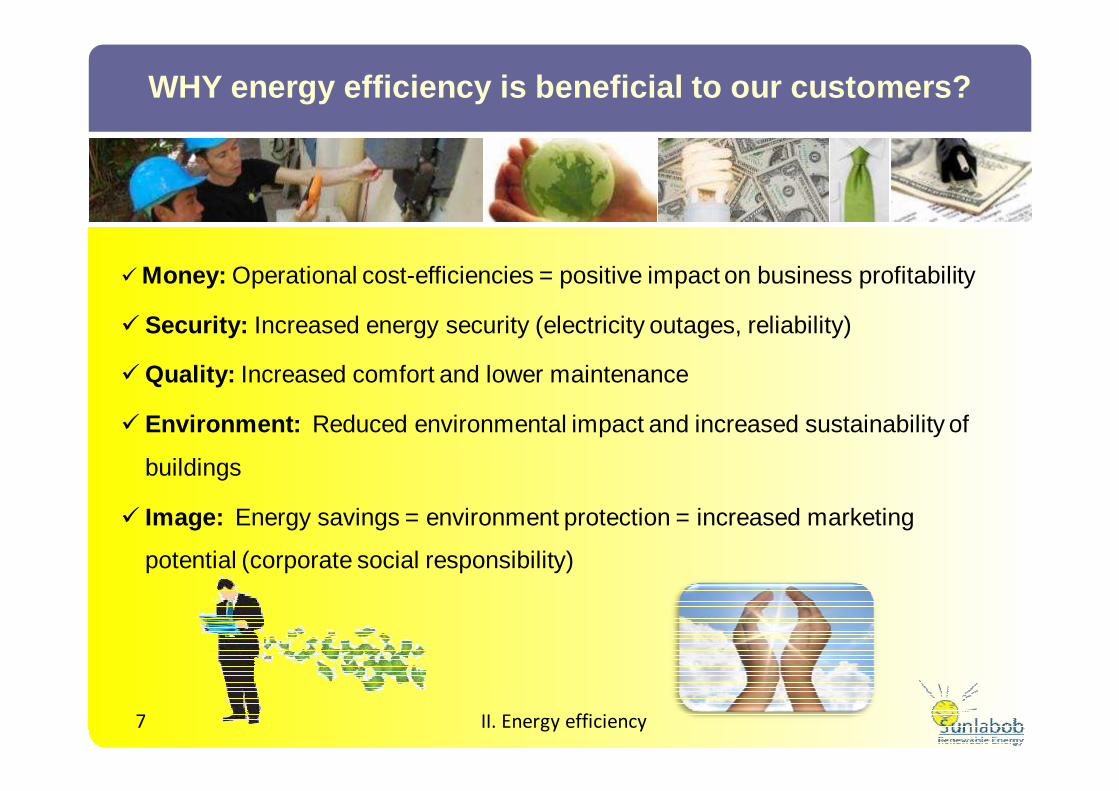
WHY energy efficiency is beneficial to our customer s?
� Money: Operational cost-efficiencies = positive impact on business profitability
� Security: Increased energy security (electricity outages, reliability)
� Quality: Increased comfort and lower maintenance
� Environment: Reduced environmental impact and increased sustainability of
buildings
� Image: Energy savings = environment protection = increased marketing
potential (corporate social responsibility)
7 II. Energy efficiency

10 Steps towards Energy Efficiency
Phase I : Auditing / ConsultingPhase I : Auditing / Consulting Phase II : ImplementationPhase II : Implementation
1 2 3 4 5 6 7 8 9 10
8 II. Energy efficiency

What is an Energy Audit?
9 III. Phase I: Auditing and consulting
WHAT� Study of the energy use and wastes of your facilities
� Energy efficient turnkey solution recommendations
OBJECTIVES� Give a better understanding of the energy consumption
� Identify and reduce energy wastage and inefficiencies
� Reduce the energy costs and environmental impact of the building
� Establish an energy management program
BENEFITSEnergy Audits can create savings up to 50% off theenergy consumption of buildings in use.

PHASE I – Step 1
Parts of the Energy Audit quotation1
10
Building Size
Energy Expenses
Density of Equipment Detailed Quotation
- Standard project: Quotation free of charge for phase I.
- Large and specific project: A pre-audit site survey will be necessary.Sunlabob Engineering team will review the site before providing an EA quotation.
III. Phase I: Auditing and consulting

PHASE I – Step 2
Agreement & Contract2
Should management decide to proceed, following a meeting and presentation of the quote, a contract will be drawn up to outline the costs and time frame of the project.
11 III. Phase I: Auditing and consulting
Customer

PHASE I – Step 3
On-site Data Collection3
Detailed analysis of the site to determine where, when and how energy is used:
� Evaluation of site, plant, building and equipment operation
� Survey of all the building and equipment energy specifications
� Behavioural questionnaire to staff
� Hourly consumption profile metering over a period of 7 days
Important to cooperate with staff during
interviews and measurements +
suggestions for improvements
12 III. Phase I: Auditing and consulting

PHASE I – Step 3
� The following physical values are measured and
recorded:
13
On-site Data Collection3
III. Phase I: Auditing and consulting
• Electrical energy (power, intensity, voltage,
energy, power factor, harmonics, etc.)
• Temperature (air, surfaces)
• Humidity
• Luminosity
• Flow rates (air, water)
• Heat flows
• Pressure (gas, liquids)
• Sun insulation

Nameplate Effective Total Effective
Office
10 Fluorescent Philips 5 46 50 252 0.43 0.54 11 5 52 721
100 CFL Downlight Generic 8 13 23 183 0.16 0.64 12 5 52 570
Ceiling exhaust fan Generic 1 60 60 0.43 0.65 12 7 52 260
CFL Downlight Generic 8 13 23 183 0.16 0.64 12 5 52 570
Air conditioner MITSUBISHI 1 2625 2625 11.33 0.99 6 5 30 2362
Fluorescent Philips 2 46 50 101 0.43 0.54 12 5 52 314
Air conditioner MITSUBISHI 2 3391 6781 5.9 0.84 6 5 30 6103
Fluorescent Philips 12 46 50 605 0.43 0.54 12 5 52 1887
Refrigerator TOSHIBA 1 67 93 93 0.57 0.75 24 7 52 810
Water cooler Seandara 1 116 102 102 0.71 0.67 12 7 52 445
Oven Berjaya 1 810 697 697 3.4 1 0.5 5 52 91
Bread griller Berjaya 1 2500 2498 2498 10.86 1 1 5 52 649
Water Boiler Zebrathakand 1 1800 2400 2400 10.3 1 1 5 52 624
Coffee machine Generic 1 1129 1129 4.89 0.999 1 5 52 294
Microwave oven Sharp 1 1220 1220 1220 5.28 1 0.5 5 52 159
Power factor
ApplianceConsumption per
year (kWh/yr)Area Brand
101
Days per week
Hrs /day
Intensity (A)Power (W)Qty
103
104
Weeks per year
Example of on-site data collection table
14 III. Phase I: Auditing and consulting
PHASE I – Step 4
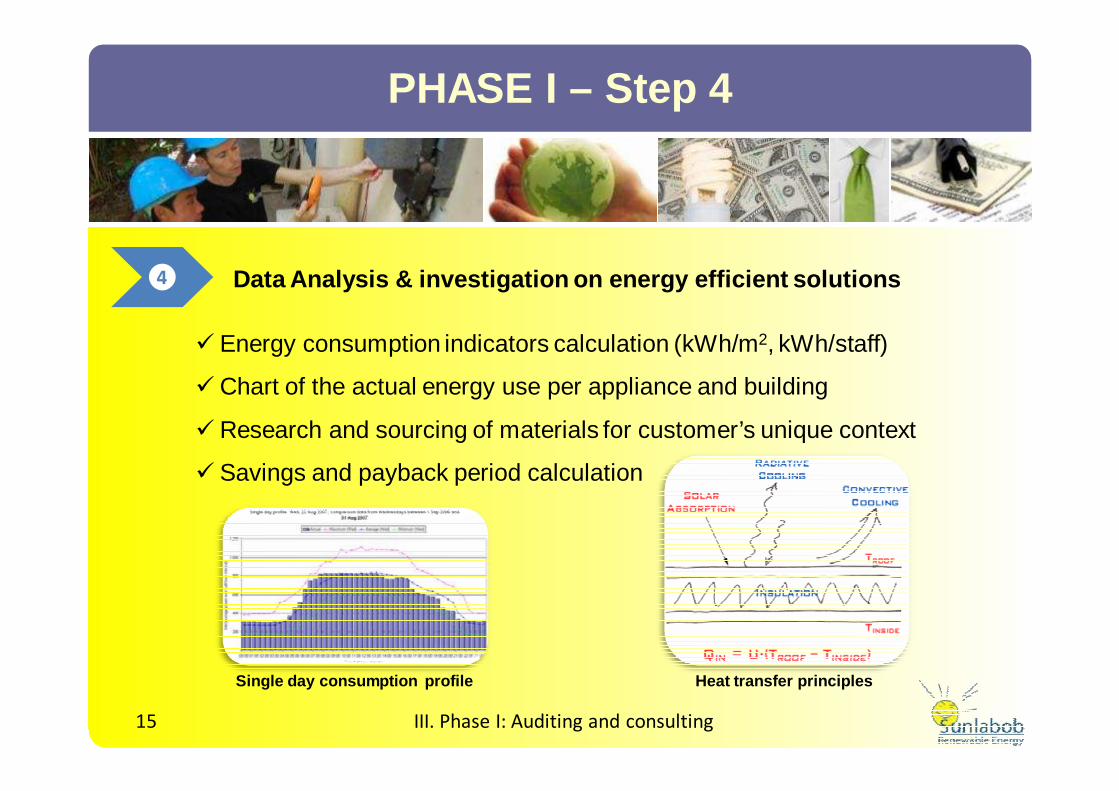
Data Analysis & investigation on energy efficient s olutions4
� Energy consumption indicators calculation (kWh/m2, kWh/staff)
� Chart of the actual energy use per appliance and building
� Research and sourcing of materials for customer’s unique context
� Savings and payback period calculation
15 III. Phase I: Auditing and consulting
Single day consumption profile Heat transfer principles

Evaporative air cooling
Global areas of improvements
– Behavioral training• Energy conservation: an energy saving potential not to forget
→Around 10-15% of savings of the total bill in most cases
– Air conditioning and insulation• Thermal insulation and shading of buildings
– Reduction of air conditioning load: more than 20% savings on AC• Air conditioning maintenance and controls
– Optimal operation reduces energy usage and increases systems lifetime
III. Phase I: Auditing and consulting
Solar protectionCellulose insulation

Global areas of improvements
17
– Lighting• Inefficient devices replaced by efficient ones – optimizing energy usage
→Halogen and T8 to efficient lighting offers 70% and 35% savings respectively
• Implementing control systems (timers, presence sensors) reduce device working time: more than 30% savings
• Better utilisation of natural lighting: natural light tube
– Office equipment improvement• Optimizing energy usage of computer systems, printers, photocopiers, etc.
III. Phase I: Auditing and consulting
N computingLaptopLEDTimer
Light tube
CFL

18
– Hot water• Solar water heaters or heat recovery from AC units can
provide ‘free’ hot water: up to 90% savings
– Kitchen appliance improvement• Optimizing energy usage of refrigerators, freezers,
cookers, dish washers, water coolers, water boilers: between 25%1 and 45%2 savings
– Laundry appliances• Optimizing energy usage of washing machines, dryers:
70% savings by implementing natural drying
Specific areas of improvements
III. Phase I: Auditing and consulting
1 adding control on appliances; 2 change of appliance type and size
Solar water heater
Natural drying
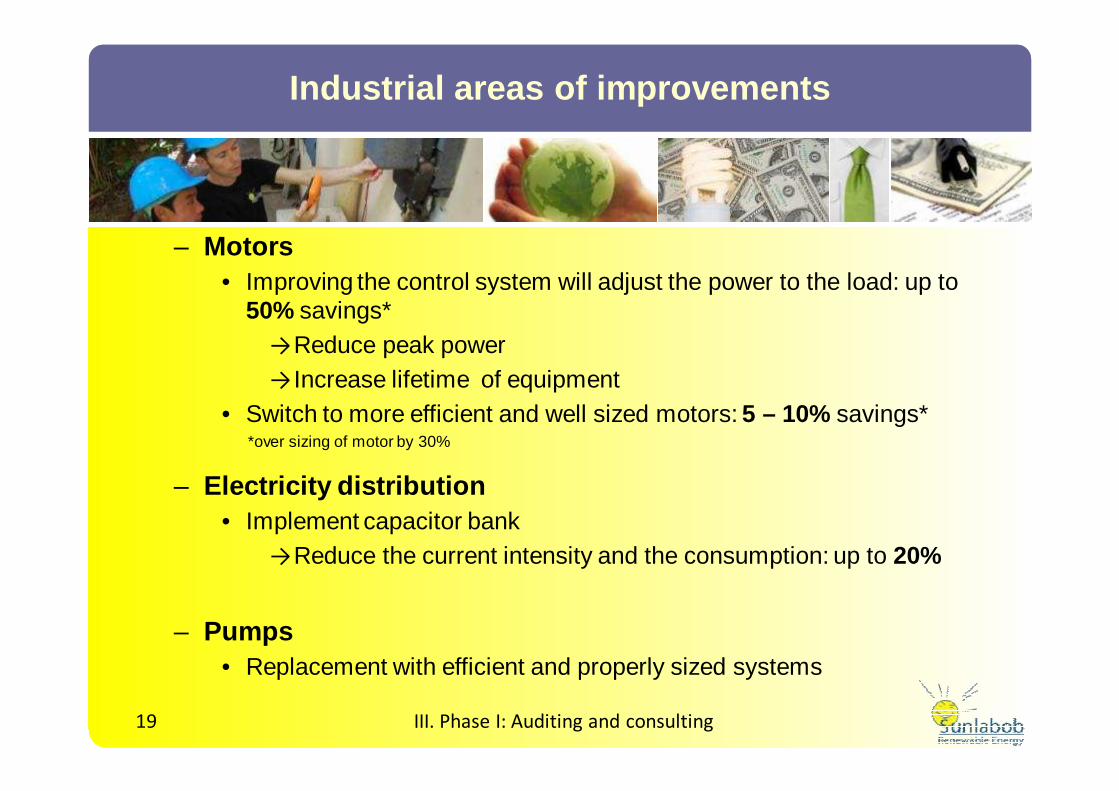
Industrial areas of improvements
19
– Motors• Improving the control system will adjust the power to the load: up to
50% savings*→Reduce peak power→ Increase lifetime of equipment
• Switch to more efficient and well sized motors: 5 – 10% savings*
– Electricity distribution• Implement capacitor bank
→Reduce the current intensity and the consumption: up to 20%
– Pumps• Replacement with efficient and properly sized systems
III. Phase I: Auditing and consulting
*over sizing of motor by 30%
20
� The recommendations can immediately reduce energy costs by 5% - 15% using zero or low cost solutions.
� Savings of 30% - 50% (or more) can be achieved by adopting more committed solutions.
Expected savings on total bills
III. Phase I: Auditing and consulting

Summary of findings from data analysis and recommendations:
� Description of the work involved in applying each implementation measure
� Cost of implementing each recommendation
� Annual energy and cost savings for each recommendation
� Cost/benefit analysis: payback period
Report Writing5
PHASE I – Step 5
21 III. Phase I: Auditing and consulting
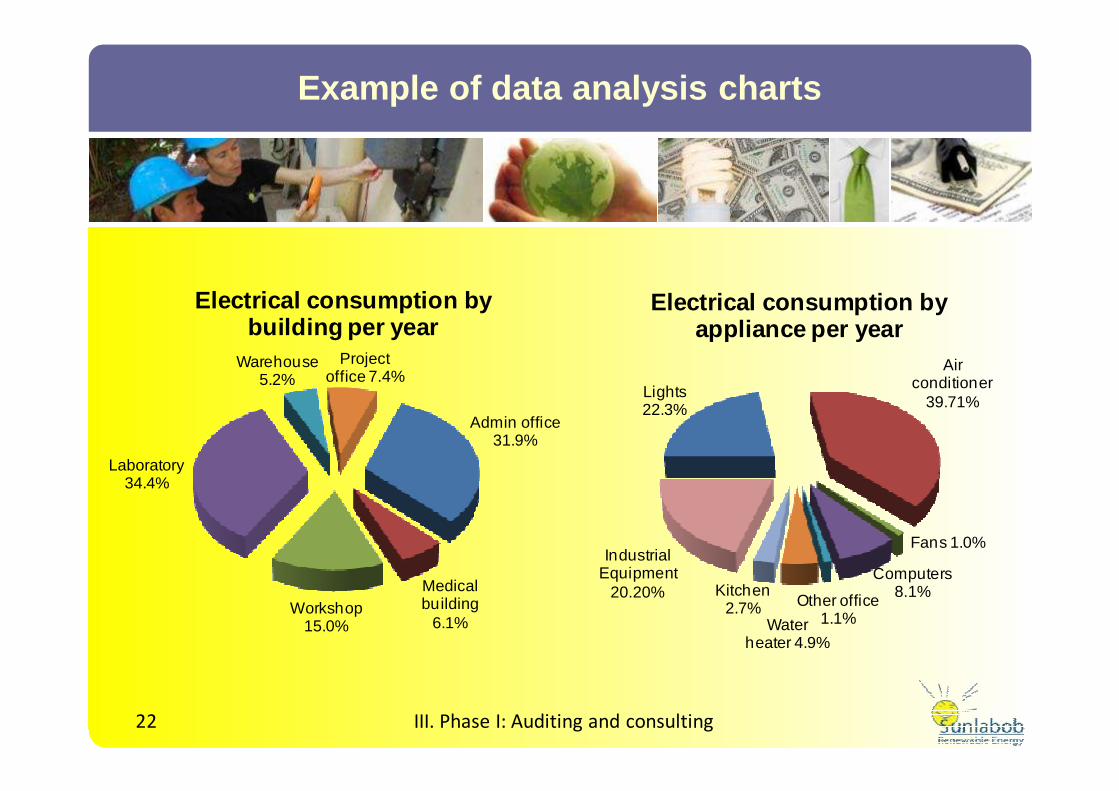
Example of data analysis charts
22 III. Phase I: Auditing and consulting
Lights 22.3%
Air conditioner
39.71%
Fans 1.0%
Computers 8.1%Other office
1.1%Water heater 4.9%
Kitchen 2.7%
Industrial Equipment
20.20%
Electrical consumption by appliance per year
Admin office 31.9%
Medical building
6.1%Workshop
15.0%
Laboratory 34.4%
Warehouse 5.2%
Project office 7.4%
Electrical consumption by building per year

Example of equipment inventory table
23 III. Phase I: Auditing and consulting
Device Units
Halogen bulbs 12V 20W 49
Halogen bulbs 12V 35W 3CFL bulb 11W 47
CFL bulb 5W 16
T8 Fluorescent 36W 5
Halogene bulb 40W 41
T8 fluorescent 18W 8
Incandescent bulb 10
Halogene standard lamp main
4
Halogene standard lamp secondary
3
Halogen desk lamp 1
Desk lamp 1
9
188
Single Phase 19
19
Ceiling fan 3
Standing fan 7
Extraction fan 11
21
CategoryL
ight
s
Ceiling fixtures
179
Lamps
TOTAL Fans
Aircon
Fans
TOTAL Aircon
TOTAL Lights
TOTAL Ceiling fixtures
TOTAL Lamps
Category Device Units
PU Laptop 1Mornitor for
Laptop1
CM+PU+UPS 13
15
Printer 4
Photocopier 1
Fax 1
6
Microwave 1
Fridge 3
Water cooler 2
Water boiler 3
Water pump 1
Coffee Machine 2
12
Dehumidifier 1
Server System 1
Computers
Kitchen appliances
TOTAL Other Office Equipment
TOTAL Computer
TOTAL Kitchen appliances
Other office equipment
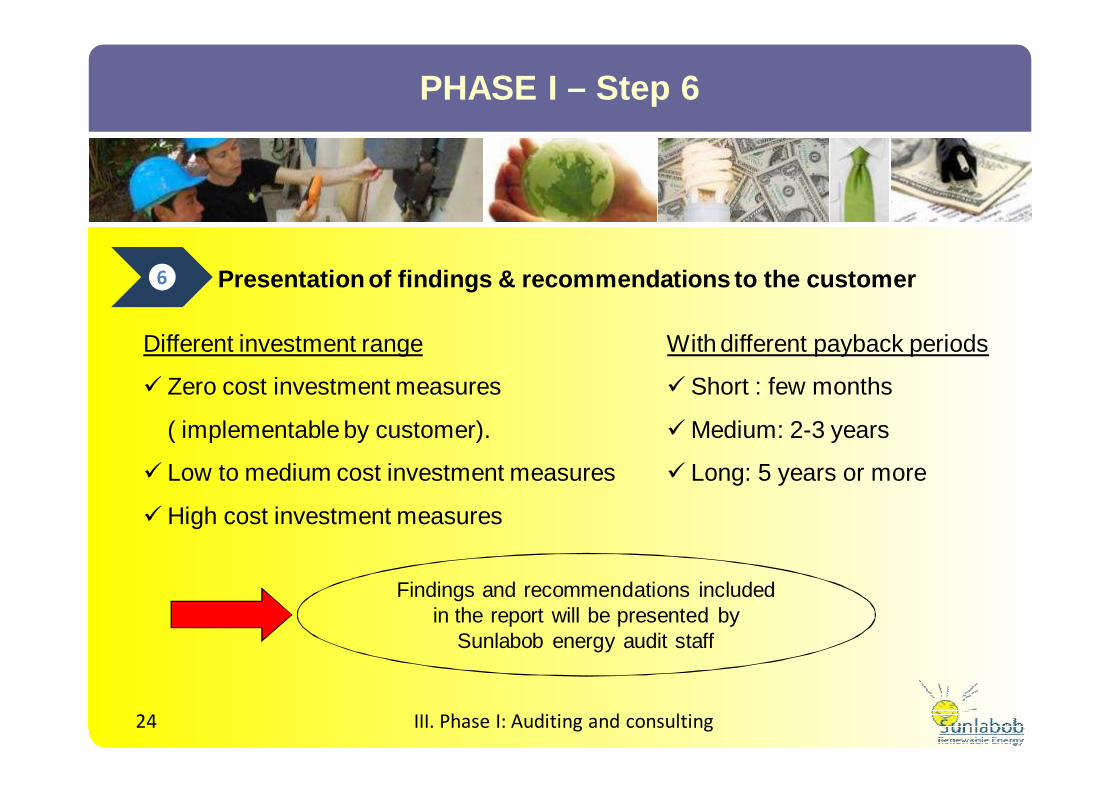
Different investment range
� Zero cost investment measures
( implementable by customer).
� Low to medium cost investment measures
� High cost investment measures
Findings and recommendations included in the report will be presented by
Sunlabob energy audit staff
Presentation of findings & recommendations to the c ustomer6
PHASE I – Step 6
24 III. Phase I: Auditing and consulting
With different payback periods
� Short : few months
� Medium: 2-3 years
� Long: 5 years or more
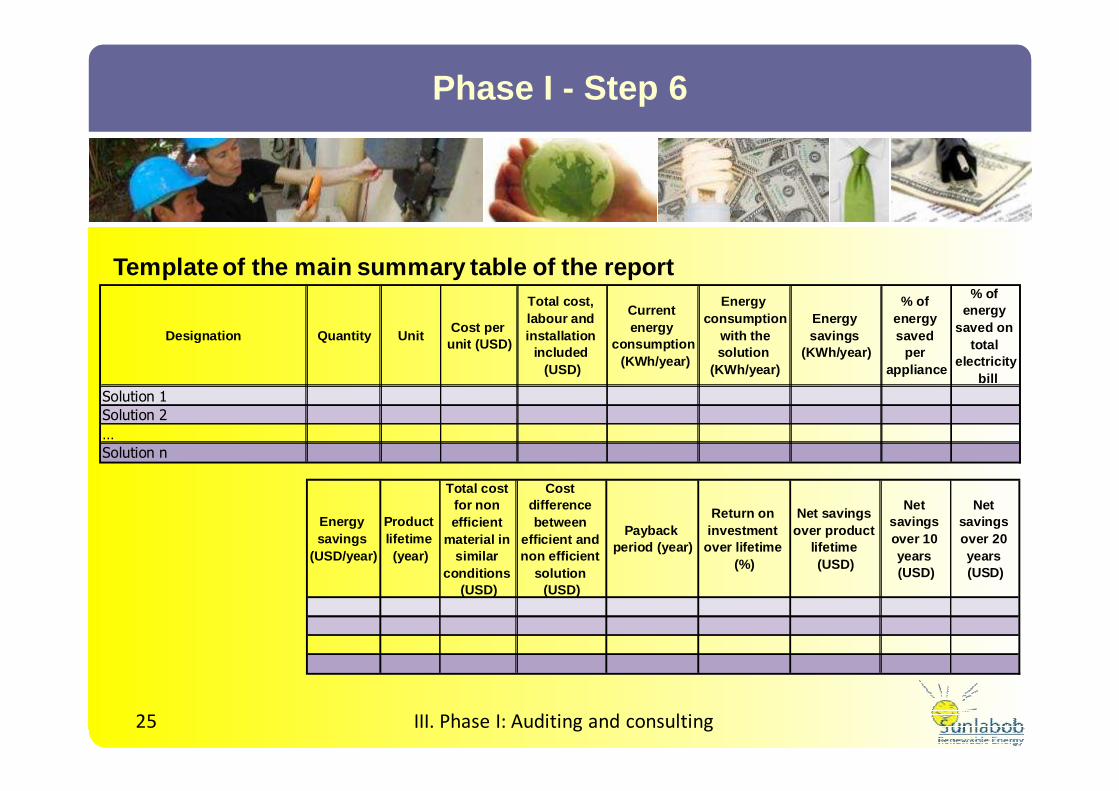
Phase I - Step 6
25
Template of the main summary table of the report
III. Phase I: Auditing and consulting
Designation Quantity UnitCost per
unit (USD)
Total cost, labour and installation
included (USD)
Current energy
consumption (KWh/year)
Energy consumption
with the solution
(KWh/year)
Energy savings
(KWh/year)
% of energy saved
per appliance
% of energy
saved on total
electricity bill
Solution 1
Solution 2
…
Solution n
Energy savings
(USD/year)
Product lifetime (year)
Total cost for non efficient
material in similar
conditions (USD)
Cost difference between
efficient and non efficient
solution (USD)
Payback period (year)
Return on investment
over lifetime (%)
Net savings over product
lifetime (USD)
Net savings over 10 years (USD)
Net savings over 20 years (USD)
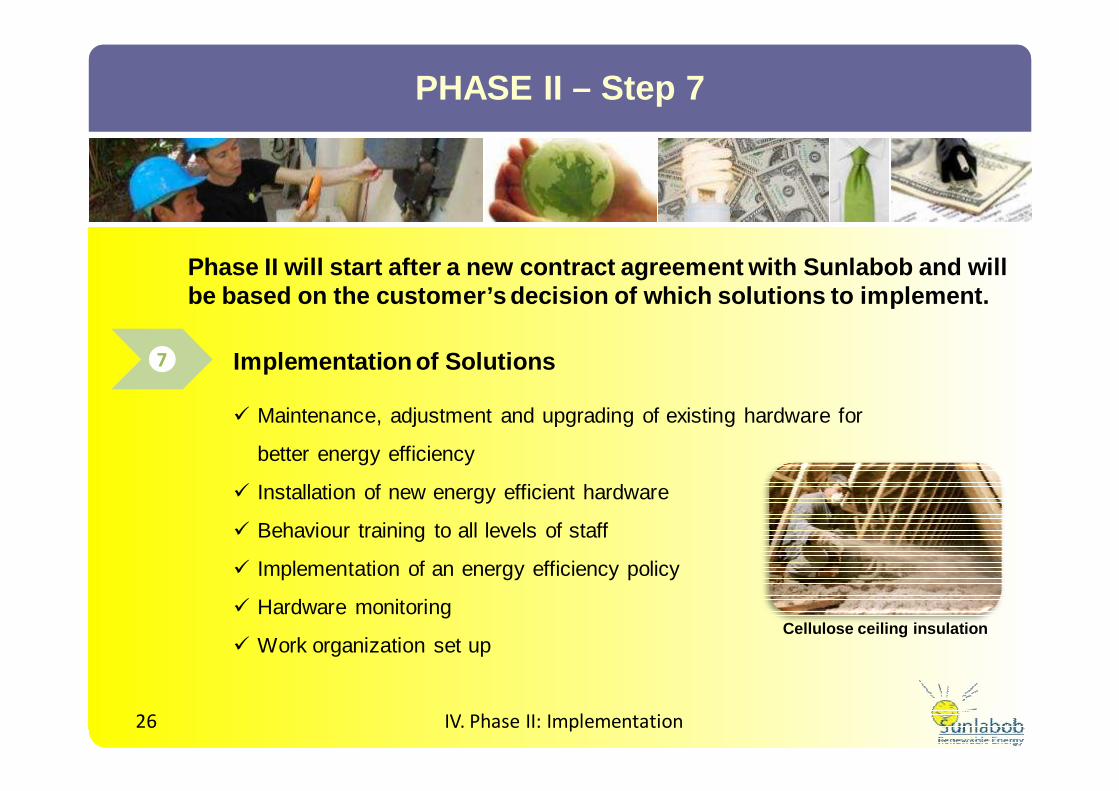
PHASE II – Step 7
Implementation of Solutions 7
� Maintenance, adjustment and upgrading of existing hardware for
better energy efficiency
� Installation of new energy efficient hardware
� Behaviour training to all levels of staff
� Implementation of an energy efficiency policy
� Hardware monitoring
� Work organization set up
26 IV. Phase II: Implementation
Phase II will start after a new contract agreement with Sunlabob and will be based on the customer’s decision of which soluti ons to implement.
Cellulose ceiling insulation
PHASE II – Step 8
User Training8
� Energy efficiency awareness sessions
� Technical use of new hardware implemented to all levels of staff
� Technical use of energy monitoring devices to monitoring staff
� Environmental impact awareness sessions
27 IV. Phase II: Implementation

PHASE II – Step 9
Certification9
• No existing standard in the Lao PDR – still to
be defined and approved.
• Use of international standards instead,
according to customer’s needs
• Certification process to be conducted by the
Lao Institute for Renewable Energy (LIRE) as
an independent body.
Examples of existing standards worldwide
Europe USA
ThailandAustralia
28 IV. Phase II: Implementation
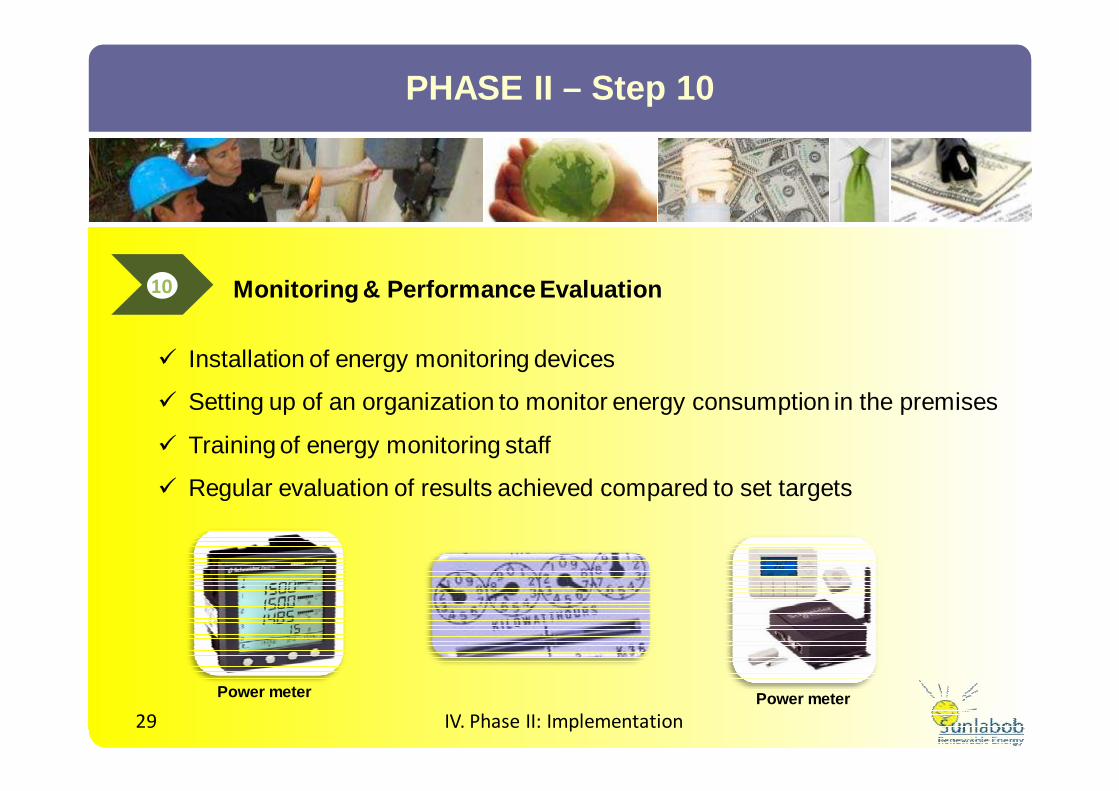
PHASE II – Step 10
Monitoring & Performance Evaluation10
� Installation of energy monitoring devices
� Setting up of an organization to monitor energy consumption in the premises
� Training of energy monitoring staff
� Regular evaluation of results achieved compared to set targets
29 IV. Phase II: Implementation
Power meter Power meter
Sunlabob Renewable Energy Ltd
PO Box 9077, Vientiane, Lao PDR - Tel: (+856 21) 313874 - Fax: (+856 21) 314045
[email protected] www.sunlabob.com
Thank you.
Feel free to contact us for more details or to arrange a meeting.
Introduction to the Sunlabob Energy Audit