swarm intelligence: novel tools for …oa.upm.es/7206/1/aleksandar_jevtic.pdf · departamento de...
TRANSCRIPT
Departamento de Senales, Sistemas y RadiocomunicacionesEscuela Tecnica Superior de Ingenieros de Telecomunicacion
Universidad Politecnica de Madrid
SWARM INTELLIGENCE:
NOVEL TOOLS FOR OPTIMIZATION,
FEATURE EXTRACTION, AND
MULTI-AGENT SYSTEM MODELING
TESIS DOCTORAL
Aleksandar JevticIngeniero en Electronica
2011

Departamento de Senales, Sistemas y RadiocomunicacionesEscuela Tecnica Superior de Ingenieros de Telecomunicacion
Universidad Politecnica de Madrid
SWARM INTELLIGENCE:
NOVEL TOOLS FOR OPTIMIZATION,
FEATURE EXTRACTION, AND
MULTI-AGENT SYSTEM MODELING
TESIS DOCTORAL
Autor:
Aleksandar JevticIngeniero en Electronica
Director:
Diego Andina de la FuenteDoctor Ingeniero de Telecomunicacion
Co-Director:
Mo JamshidiPh.D. in Electrical Engineering
2011


Tribunal nombrado por el Mgfco. y Excmo. Sr. Rector de la Universidad Politecnicade Madrid, el dıa de de 2011.
Presidente: Dr. D.
Secretario: Dr. D.
Vocal: Dr. D.
Vocal: Dr. D.
Vocal: Dr. D.
Suplente: Dr. D.
Suplente: Dr. D.
Realizando el acto de defensa y lectura de la Tesis el dıa dede 2011.
En la E.T.S. de Ingenieros de Telecomunicacion.
CALIFICACION:
EL PRESIDENTE LOS VOCALES
EL SECRETARIO

Abstract
Animal swarms in nature are able to adapt to dynamic changes in their envi-ronment, and through cooperation they can solve problems that are crucial for theirsurvival. Only by means of local interactions with other members of the swarmand with the environment, they can achieve a common goal more efficiently than itwould be done by a single individual. This problem-solving behavior that resultsfrom the multiplicity of such interactions is referred to as Swarm Intelligence. Themathematical models of swarming behavior in nature were initially proposed to solveoptimization problems. Nevertheless, this decentralized approach can be a valuabletool for a variety of applications, where emerging global patterns represent a solutionto the task at hand. Methods for the solution of difficult computational problemsbased on Swarm Intelligence have been experimentally demonstrated and reported inthe literature. However, a general framework that would facilitate their design doesnot exist yet.
In this dissertation, a new general design methodology for Swarm Intelligencetools is proposed. By defining a discrete space in which the members of the swarmcan move, and by modifying the rules of local interactions and setting the adequateobjective function for solutions evaluation, the proposed methodology is tested invarious domains. The dissertation presents a set of case studies, and focuses ontwo general approaches. One approach is to apply Swarm Intelligence as a tool foroptimization and feature extraction, and the other approach is to model multi-agentsystems such that they resemble swarms of animals in nature providing them withthe ability to autonomously perform a task at hand.
Artificial swarms are designed to be autonomous, scalable, robust, and adaptiveto the changes in their environment. In this work, the methods that exploit one ormore of these features are presented. First, the proposed methodology is validatedin a real-world scenario seen as a combinatorial optimization problem. Then a set ofnovel tools for feature extraction, more precisely the adaptive edge detection and thebroken-edge linking in digital images is proposed. A novel data clustering algorithmis also proposed and applied to image segmentation. Finally, a scalable algorithmbased on the proposed methodology is developed for distributed task allocation inmulti-agent systems, and applied to a swarm of robots. The newly proposed generalmethodology provides a guideline for future developers of the Swarm Intelligencetools.


Resumen
Los enjambres de animales en la naturaleza son capaces de adaptarse a cambiosdinamicos en su entorno y, por medio de la cooperacion, pueden resolver problemascruciales para su supervivencia. Unicamente por medio de interacciones locales conotros miembros del enjambre y con el entorno, pueden lograr un objetivo comun deforma mas eficiente que lo harıa un solo individuo. Este comportamiento problema-resolutivo que es resultado de la multiplicidad de interacciones se denomina Inteligen-cia de Enjambre. Los modelos matematicos de comportamiento de enjambres enentornos naturales fueron propuestos inicialmente para resolver problemas de opti-mizacion. Sin embargo, esta aproximacion descentralizada puede ser una herramientavaliosa en una variedad de aplicaciones donde patrones globales emergentes represen-tan una solucin de las tareas actuales.
Aunque en la literatura se muestra la utilidad de los metodos de Inteligencia deEnjambre, no existe un entorno de trabajo que facilite su diseno. En esta memoriade tesis proponemos una nueva metodologa general de diseno para herramientas deInteligencia de Enjambre. Desarrollamos herramientas noveles que representan ejem-plos ilustrativos de su implementacion. Probamos la metodologıa propuesta en variosdominios definiendo un espacio discreto en el que los miembros del enjambre puedenmoverse, modificando las reglas de las interacciones locales y fijando la funcion obje-tivo adecuada para evaluar las soluciones. La memoria de tesis presenta un conjuntode casos de estudio y se centra en dos aproximaciones generales. Una aproximacion esaplicar Inteligencia de Enjambre como herramienta de optimizacion y extraccion decaracterısticas mientras que la otra es modelar sistemas multi-agente de tal maneraque se asemejen a enjambres de animales en la naturaleza a los que se les confiere lahabilidad de ejecutar autonomamente la tarea.
Los enjambres artificiales estan disenados para ser autonomos, escalables, robus-tos y adaptables a los cambios en su entorno. En este trabajo, presentamos metodosque explotan una o mas de estas caracterısticas. Primero, validamos la metodologıapropuesta en un escenario del mundo real visto como un problema de optimizacioncombinatoria. Despues, proponemos un conjunto de herramientas noveles para ex-traccion de caracterısticas, en concreto la deteccion adaptativa de bordes y el enlazadode bordes rotos en imagenes digitales, y el agrupamiento de datos para segmentacionde imagenes. Finalmente, proponemos un algoritmo escalable para la asignacion dis-tribuida de tareas en sistemas multi-robots. La metodologıa general propuesta ofreceuna guıa para futuros desarrolladores de herramientas de Inteligencia de Enjambre.


To my family


Acknowledgments
During the years of my Ph.D. studies, many people have formed an importantpart of my life and to all of them I wish to express my sincerest gratitude for thesupport they have given me.
I thank my advisor Professor Diego Andina de la Fuente for the opportunity to bea part of the Group for Automation in Signal and Communications. I am grateful forhis guidance and his continuing support, and for allowing me to choose the researchtopic of my interest. In his words: ”It is important that you choose a topic thatinterests you, because you are the one that will have to dedicate years to work on it”.
I also thank my co-advisor Professor Mo Jamshidi for his support and professionaladvice in the final years of my studies. During my visit to the University of Texasat San Antonio, I had the opportunity to collaborate with the researchers from hisAutonomous Control Engineering center, to all of whom I would like to express mythanks for accepting me as an equal member of the ”ACE swarm”.
The collaboration with the colleagues from my research group has greatly con-tributed to this work, and unlimited thanks go to Fulgencio Buendia, Sofia Corvera,Alexis Marcano, Miguel Barron, Benjamın Ojeda, Joel Quintanilla, Guadalupe CortinaJanuchs, Juan Fombellida and Ignacio Melgar. I would also like to express my grati-tude to professors Joaquın Torres, Ana Tarquis, Juan Grau, Juan Seijas and AntonioVega, and Mr. Carlos Gonzalez Mateos for their support.
Numerous thanks to Dr. Alvaro Gutierrez for his unconditional help with myresearch work and for the fruitful research-related discussions that we had. Specialthanks to my friends and colleagues Nelson Dopico and Carlos R. del Blanco, forsharing the Ph.D. challenges with me from the very beginning, and to all the peoplefrom their research groups that I had a pleasure of meeting.
My sincerest gratitude goes to the professors from the Universidad Politecnicade Madrid that I had a pleasure of learning from. I would also like to thank to theadministration staff of the E.T.S.I. de Telecomunicacion, Maite, Mari Carmen andCristina, and of the Universidad Politecnica de Madrid, Silvia, Carolina, and Carmen,for making the administrative part of my work as easy as it can get.
During my visits to other universities, I had the opportunity of working with manygreat researchers. I would like to thank Professor Duc Truong Pham for inviting meto visit on several occasions the Manufacturing Engineering Centre at the CardiffUniversity. It is in the laboratories of this center that I got the first insight intoSwarm Intelligence, which triggered my interest in this field. I would also like to
xiv
thank Dr. Michael Packianather, Dr. Nikolay Zlatov, Dr. Ashraf Fahmy, Dr. MingYang, Dr. Ashraf Afify, and many others who I had a pleasure of collaborating withduring my stays in Cardiff.
Many thanks to Dr. Marco Castellani, with whom I share many research interestsand who had enough patience to answer my questions and with the same patienceto listen to my ideas and expose them to critical and creative thinking. Unlimitedthanks to Moises Sanchez for being a great friend and an admirable host during myvisits to Cardiff.
I would like to thank Professor Zeljko Djurovic for inviting me to work as a visitinglecturer at the University of Belgrade, and for his advice and support during the lastyear of my doctoral studies.
Many thanks to Professor Filip Kulic for giving me the opportunity to visit andwork at the Faculty of Technical Sciences in Novi Sad. I would especially like to thankMr. Milos Jovanovic who took care of all the administrative details of my visit, andfor being a great friend and an excellent host.
Deepest thanks to Professor Darko Marinov, my long-time friend and someoneI constantly learn from, for his support from the beginning of my undergraduatestudies. Many thanks to Professor Slobodan Bojanic for great discussions and forbeing a patient tennis instructor.
I would especially like to thank Milos and Marina Jakovljevic for the great friend-ship that we have had for so many years, and for supporting me to come to Madrid.Unlimited thanks to my dearest friends Vucko, Steva, Jelena Jovanovic, Miguel,Cristina Montero, Jose, Anne, Edu, Paloma, Filip, Cristina Cabrero, Marko, An-drijana, Goran, Dejana, Milena, Branko, Srdjan, Sara, Ruben, Ale, Nazario, Mladen,Tamara, Visnja, Milan, Paola, Jelena Novakovic, Rade, Jelena Lazarevic, Mateja,Luka, Lia, Bordallo, and others that shared this journey with me.
Finally, the ones whose unconditional love and support marks everything I do aremy parents Rade and Ljiljana, and my sister Natasa and her husband Sasa. Theyhave the best and the worst of me, and they have been the light of my life. Thisthesis is dedicated to them.
Contents
1 Introduction 11.1 Motivation . . . . . . . . . . . . . . . . . . . . . . . . . . . . . . . . . 11.2 Preview of Contributions . . . . . . . . . . . . . . . . . . . . . . . . . 21.3 Dissertation Outline . . . . . . . . . . . . . . . . . . . . . . . . . . . . 7
I Background 9
2 Biological Inspiration 112.1 Introduction . . . . . . . . . . . . . . . . . . . . . . . . . . . . . . . . . 112.2 Social Insects . . . . . . . . . . . . . . . . . . . . . . . . . . . . . . . . 12
2.2.1 Pheromone Laying in Ant Colonies . . . . . . . . . . . . . . . . 132.2.2 Recruitment by Dance in Honey Bee Swarms . . . . . . . . . . 15
2.3 Flocking, Schooling and Aggregation . . . . . . . . . . . . . . . . . . . 172.4 Summary . . . . . . . . . . . . . . . . . . . . . . . . . . . . . . . . . . 19
3 Computational Swarm Intelligence 213.1 Introduction . . . . . . . . . . . . . . . . . . . . . . . . . . . . . . . . . 213.2 Ant Colony Optimization . . . . . . . . . . . . . . . . . . . . . . . . . 22
3.2.1 Traveling Salesman Problem . . . . . . . . . . . . . . . . . . . 223.2.2 Ant System Algorithm . . . . . . . . . . . . . . . . . . . . . . . 233.2.3 Extensions of Ant System Algorithm . . . . . . . . . . . . . . . 25
3.3 Bee Colony-inspired Algorithms . . . . . . . . . . . . . . . . . . . . . . 273.4 Particle Swarm Optimization . . . . . . . . . . . . . . . . . . . . . . . 283.5 Advantages of Swarm Intelligence . . . . . . . . . . . . . . . . . . . . . 29
3.5.1 Scalability and Robustness . . . . . . . . . . . . . . . . . . . . 293.5.2 Adaptation and Learning . . . . . . . . . . . . . . . . . . . . . 30
3.6 Proposed Methodology . . . . . . . . . . . . . . . . . . . . . . . . . . . 30
xvi CONTENTS
3.7 Summary . . . . . . . . . . . . . . . . . . . . . . . . . . . . . . . . . . 30
II Tools for Optimization and Feature Extraction 33
4 Route Optimization of Unmanned Aerial Vehicles 354.1 Introduction . . . . . . . . . . . . . . . . . . . . . . . . . . . . . . . . . 354.2 Related Work . . . . . . . . . . . . . . . . . . . . . . . . . . . . . . . . 36
4.2.1 Soft-computing Methods for Traveling Salesman Problem . . . 364.2.2 Ant Colony Optimization for Unmanned Aerial Vehicle Appli-
cations . . . . . . . . . . . . . . . . . . . . . . . . . . . . . . . . 374.3 Ant System Algorithm . . . . . . . . . . . . . . . . . . . . . . . . . . . 374.4 Problem Statement and Proposed Method . . . . . . . . . . . . . . . . 39
4.4.1 Traveling Salesman Problem . . . . . . . . . . . . . . . . . . . 394.4.2 Proposed Method . . . . . . . . . . . . . . . . . . . . . . . . . . 40
4.5 Experimental Results . . . . . . . . . . . . . . . . . . . . . . . . . . . . 414.5.1 UAV Simulation . . . . . . . . . . . . . . . . . . . . . . . . . . 414.5.2 Communication Protocol . . . . . . . . . . . . . . . . . . . . . 414.5.3 Simulation of Waypoint Navigation . . . . . . . . . . . . . . . . 424.5.4 Results and Discussion . . . . . . . . . . . . . . . . . . . . . . . 42
4.6 Summary . . . . . . . . . . . . . . . . . . . . . . . . . . . . . . . . . . 48
5 Adaptive Edge Detection in Digital Images 495.1 Introduction . . . . . . . . . . . . . . . . . . . . . . . . . . . . . . . . . 495.2 Related Work . . . . . . . . . . . . . . . . . . . . . . . . . . . . . . . . 505.3 Ant System-based Edge Detector . . . . . . . . . . . . . . . . . . . . . 51
5.3.1 Multiscale Adaptive Gain . . . . . . . . . . . . . . . . . . . . . 515.3.2 Ant System Algorithm for Edge Detection . . . . . . . . . . . . 535.3.3 Simulation Results and Discussion . . . . . . . . . . . . . . . . 56
5.4 Ant System-based Broken-edge Linking Algorithm . . . . . . . . . . . 585.4.1 Simulation Results and Discussion . . . . . . . . . . . . . . . . 63
5.5 Adaptability of the Artificial Ant Colony . . . . . . . . . . . . . . . . . 665.6 Summary . . . . . . . . . . . . . . . . . . . . . . . . . . . . . . . . . . 69
6 Cluster Analysis for Image Segmentation 736.1 Introduction . . . . . . . . . . . . . . . . . . . . . . . . . . . . . . . . . 736.2 Related Work . . . . . . . . . . . . . . . . . . . . . . . . . . . . . . . . 74
CONTENTS xvii
6.2.1 Ant Clustering Algorithms . . . . . . . . . . . . . . . . . . . . 766.3 Ant System-based Clustering Algorithm (ASCA) . . . . . . . . . . . . 78
6.3.1 Pheromone Accumulation . . . . . . . . . . . . . . . . . . . . . 786.3.2 Local Pheromone Summing . . . . . . . . . . . . . . . . . . . . 806.3.3 Data Labeling . . . . . . . . . . . . . . . . . . . . . . . . . . . 81
6.4 Experimental Results and Discussion . . . . . . . . . . . . . . . . . . . 826.5 Summary . . . . . . . . . . . . . . . . . . . . . . . . . . . . . . . . . . 86
III Multi-Agent System Modeling 87
7 Distributed Task Allocation in Swarm of Robots 897.1 Introduction . . . . . . . . . . . . . . . . . . . . . . . . . . . . . . . . . 897.2 Related Work . . . . . . . . . . . . . . . . . . . . . . . . . . . . . . . . 91
7.2.1 Bio-inspired Coordination of Multirobot Systems . . . . . . . . 937.2.2 Scalability . . . . . . . . . . . . . . . . . . . . . . . . . . . . . . 94
7.3 Distributed Task Allocation . . . . . . . . . . . . . . . . . . . . . . . . 957.3.1 Problem Definition . . . . . . . . . . . . . . . . . . . . . . . . . 957.3.2 Distributed Bees Algorithm (DBA) . . . . . . . . . . . . . . . . 96
7.3.2.1 Costs . . . . . . . . . . . . . . . . . . . . . . . . . . . 977.3.2.2 Qualities . . . . . . . . . . . . . . . . . . . . . . . . . 977.3.2.3 Utilities . . . . . . . . . . . . . . . . . . . . . . . . . . 977.3.2.4 Decision-making mechanism . . . . . . . . . . . . . . 98
7.4 Experimental Evaluation . . . . . . . . . . . . . . . . . . . . . . . . . . 987.4.1 Robot hardware . . . . . . . . . . . . . . . . . . . . . . . . . . 987.4.2 Coordinator and communication . . . . . . . . . . . . . . . . . 997.4.3 Experimental Results . . . . . . . . . . . . . . . . . . . . . . . 100
7.5 Evaluation Through Simulations . . . . . . . . . . . . . . . . . . . . . 1027.5.1 Simulator . . . . . . . . . . . . . . . . . . . . . . . . . . . . . . 1027.5.2 Simulation Setup . . . . . . . . . . . . . . . . . . . . . . . . . . 1037.5.3 Simulation Results and Discussion . . . . . . . . . . . . . . . . 104
7.6 Summary . . . . . . . . . . . . . . . . . . . . . . . . . . . . . . . . . . 110
IV Conclusions and Future Work 113
8 Conclusions 115

xviii CONTENTS
8.1 Summary of Contributions . . . . . . . . . . . . . . . . . . . . . . . . . 1168.2 Future Work . . . . . . . . . . . . . . . . . . . . . . . . . . . . . . . . 119
Bibliography 121
List of Figures
2.1 Examples of swarming behavior in nature. . . . . . . . . . . . . . . . . 122.2 The binary bridge experiment: A higher concentration of accumulated
pheromone on the shorter branch attracts more ants to follow this routefrom the nest to the food source. . . . . . . . . . . . . . . . . . . . . . 14
2.3 Dance patterns of the bees. (Image extracted from ”Bees: Their Vi-sion, Chemical Senses, and Language”, K. Frisch, 1976) . . . . . . . . 16
2.4 The relationship of distance to waggle dance straight-run duration.(Image extracted from ”The honey bee dance language”, D. Tarpy) . . 16
2.5 The orientation of the waggle dance compared to the resource sitelocation. (Image extracted from ”Insects and Flowers: The Biology ofa Partnership”, F.G. Barth, 1982) . . . . . . . . . . . . . . . . . . . . 17
2.6 The aggregation of the slime-mold cells. (Image extracted from ThomasSchmickl’s website, University of Graz, Austria) . . . . . . . . . . . . 18
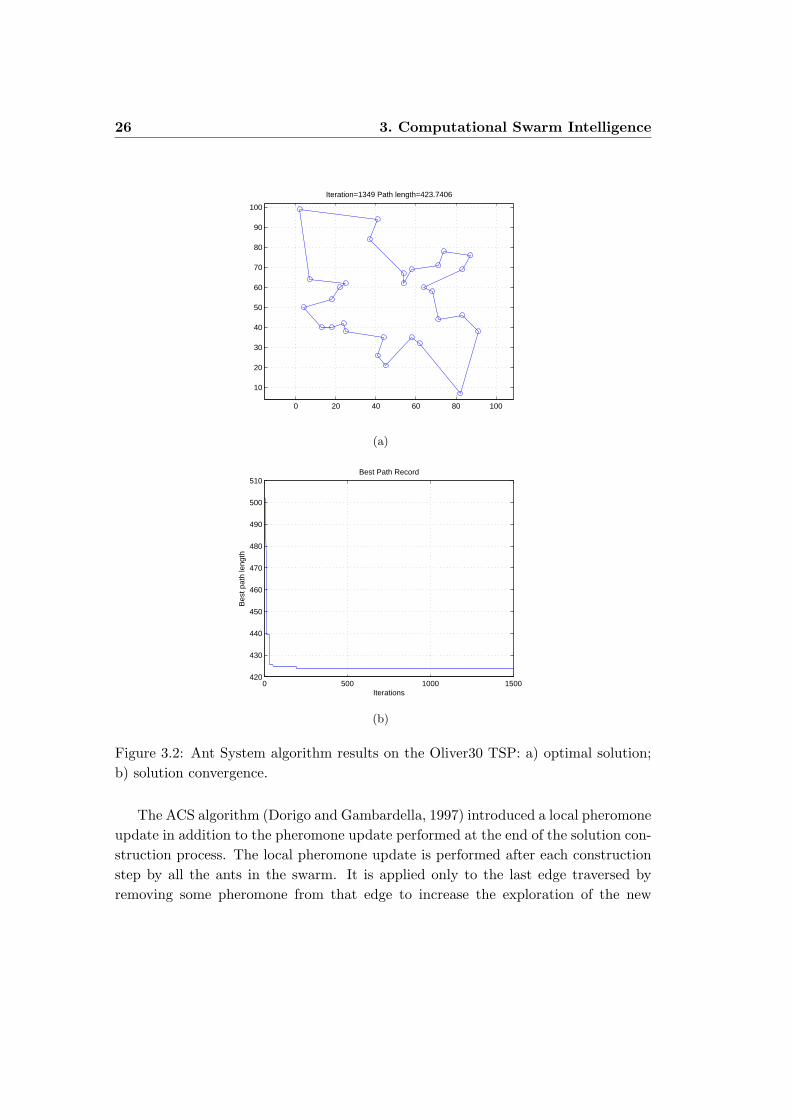
3.1 Ant displacement based on the nodes’ associated probabilities. . . . . 243.2 Ant System algorithm results on the Oliver30 TSP: a) optimal solution;
b) solution convergence. . . . . . . . . . . . . . . . . . . . . . . . . . . 26
4.1 Aerosonde UAV: length 5 ft 8 in (1.7 m), height 2 ft 0 in (0.6 m),wingspan 9 ft 8 in (2.9 m), wing area 6.1 ft2 (0.57 m2). . . . . . . . . . 41
4.2 Modbus ASCII serial frame. . . . . . . . . . . . . . . . . . . . . . . . . 424.3 Ground station user interface for the waypoint navigation. . . . . . . . 424.4 The block diagrams of the communication algorithm for monitoring
the UAVs location. . . . . . . . . . . . . . . . . . . . . . . . . . . . . . 434.5 The block diagram of the communication algorithm for assigning the
new waypoints to the UAVs. . . . . . . . . . . . . . . . . . . . . . . . . 444.6 Solution comparison of the optimal route for a 4-city Traveling Sales-
man Problem obtained by the NNS and the AS algorithms. . . . . . . 45
xx LIST OF FIGURES
4.7 UAV flight simulation for four waypoints. . . . . . . . . . . . . . . . . 47
5.1 Block diagram of the proposed edge-detection method . . . . . . . . . 52
5.2 Transformation function G(I) in respect to the original image pixelvalues: (a) B = 0.45; k = 10, 20 and 40; (b) B = 0.2, 0.45 and 0.7; k
= 20. . . . . . . . . . . . . . . . . . . . . . . . . . . . . . . . . . . . . . 54
5.3 Proposed pixel transition model. (Image extracted from (Nezamabadi-pour et al., 2006)) . . . . . . . . . . . . . . . . . . . . . . . . . . . . . 55
5.4 Effects of the transformation function G(I); ”Cameraman”, 256× 256pixels: (a) original image; (b) B = 0.2, k = 10; (c) B = 0.45, k = 20;(d) B = 0.7, k = 40. . . . . . . . . . . . . . . . . . . . . . . . . . . . . 57
5.5 Qualitative results of the proposed method, with 256 × 256 pixel im-ages: (a) ”Cameraman” original image; (b) ”House” original image;(c) ”Lena” original image; (d) ”Peppers” original image; (e) ”Cam-eraman” pheromone trail image; (f) ”Cameraman” edge image; (g)”House” pheromone trail image; (h) ”Lena” pheromone trail image; (i)”Peppers” pheromone trail image; (j) ”House” edge image; (k) ”Lena”edge image; (l) ”Peppers” edge image. . . . . . . . . . . . . . . . . . . 58
5.6 Comparative results with other ant-based edge detectors, ”Lena” 256×256 pixels: (a) original image; (b) Tian et al.; (c) Nezamabadi-pour etal.; (d) the proposed method. . . . . . . . . . . . . . . . . . . . . . . . 59
5.7 Block diagram of the proposed edge linking method . . . . . . . . . . 61
5.8 Qualitative results of the proposed edge-linking method, ”Peppers”256×256 pixels: (a) original image; (b) Sobel edge image; (c) resultingimage of the proposed method; (d) improved edge image. . . . . . . . 63
5.9 Effect of the control parameters on correct connection of the endpoints:Peppers, 256 × 256 image: (a) original image with marked region ofinterest (ROI); (b) Sobel edge image with marked ROI; (c) enlargedROI: Sobel edge image; (d) enlarged ROI: pheromone trails image;(e) enlarged ROI: improved edge image; (f) improved edge image withmarked ROI. . . . . . . . . . . . . . . . . . . . . . . . . . . . . . . . . 65
LIST OF FIGURES xxi
5.10 Qualitative results of the proposed method, 256×256-pixel images: (a)”House” original image; (b) ”House”: Sobel edge image; (c) ”House”:result of the proposed method; (d) ”House” improved edge image; (e)”Lena” original image; (f) ”Lena”: Sobel edge image; (g) ”Lena”: re-sult of the proposed method; (h) ”Lena” improved edge image; (i)”Cameraman” original image; (j) ”Cameraman”: Sobel edge image;(k) ”Cameraman”: result of the proposed method; (l) ”Cameraman”improved edge image. . . . . . . . . . . . . . . . . . . . . . . . . . . . 67
5.11 Adaptive edge detection on enhanced ”Cameraman” images, 256×256pixels: (a) enhanced image 1; (b) t=5 iterations; (c) t=10 iterations;(d) t=50 iterations; (e) t=100 iterations; (f) enhanced image 2; (g)t=105 iterations; (h) t=110 iterations; (i) t=150 iterations; (j) t=200iterations; (k) enhanced image 3; (l) t=205 iterations; (m) t=210 iter-ations; (n) t=250 iterations; (o) t=300 iterations. . . . . . . . . . . . . 69
5.12 Adaptive edge detection on four test images, 256 × 256 pixels: (a)”Cameraman”; (b) t=5 iterations; (c) t=10 iterations; (d) t=50 itera-tions; (e) t=100 iterations; (f) ”Lena”; (g) t=105 iterations; (h) t=110iterations; (i) t=150 iterations; (j) t=200 iterations; (k) ”House”; (l)t=205 iterations; (m) t=210 iterations; (n) t=250 iterations; (o) t=300iterations; (p) ”Peppers”; (q) t=305 iterations; (r) t=310 iterations;(s) t=350 iterations; (t) t=400 iterations. . . . . . . . . . . . . . . . . 70
6.1 Clustering result after applying the proposed ASCA algorithm to aSquares data set, which consists of four groups of 250 data patternswith normal Gaussian distribution. . . . . . . . . . . . . . . . . . . . . 81
6.2 Comparison of the segmentation results for the ”Splash” image, 320×400 pixels. The ASCA extracted six clusters; for the purpose of com-parison, other algorithms were set to partition the data set in six clus-ters as well, only in case of PFCM (Ojeda-Magana et al., 2009) becauseof the limitation of the algorithm to have 2n partitions the results areshown for four clusters. . . . . . . . . . . . . . . . . . . . . . . . . . . 83
6.3 Comparison of the segmentation results for a ROI mammogram, 256×256 pixels. The ASCA extracted three clusters; for the purpose ofcomparison, other algorithms were set to partition the data set in threeclusters as well, only in case of PFCM (Ojeda-Magana et al., 2009)because of the limitation of the algorithm to have 2n partitions theresults are shown for four clusters. . . . . . . . . . . . . . . . . . . . . 84

xxii LIST OF FIGURES
6.4 Comparison of the segmentation results for a ROI mammogram, 256×256 pixels. The ASCA extracted five clusters; for the purpose of com-parison, other algorithms were set to partition the data set in fiveclusters as well, only in case of PFCM (Ojeda-Magana et al., 2009)because of the limitation of the algorithm to have 2n partitions theresults are shown for four clusters. . . . . . . . . . . . . . . . . . . . . 85
7.1 Sumo robot used in the experiments. . . . . . . . . . . . . . . . . . . . 99
7.2 Results of the first experimental setup: Average odometry error vs.initial random search time. . . . . . . . . . . . . . . . . . . . . . . . . 101
7.3 Simulator screenshot. Simulation setup included 40 robots engaged insearch for 4 targets of different qualities represented by different grey-level intensity. Robots are programmed for obstacle avoidance; whenrobot detects an obstacle its color changes from black to blue to markhis new state. Once the robot has taken a new direction, its color goesback to black. . . . . . . . . . . . . . . . . . . . . . . . . . . . . . . . . 103
7.4 Box-plot comparison shows the robots’ distribution mean absolute er-ror (MAE) with respect to the swarm size: a) simulation setup 1; b)simulation setup 2; and c) simulation setup 3. Each box-plot comprisesobservations ranging from the first to the third quartile. The medianis indicated by a horizontal bar, dividing the box into the upper andlower part. The whiskers extend to the farthest data points that arewithin 1.5 times the interquartile range. Outliers are shown with aplus symbol. The values were obtained from 50 simulations performedfor each swarm size within each simulation setup. . . . . . . . . . . . . 106
7.5 Bar-plot comparison of the expected (red) vs the obtained (blue) robots’distribution on two targets of same quality values, q1 = q2 = 0.5. Fiftysimulations were performed for each of the following swarm sizes: a)10 robots; b) 40 robots; and d) 100 robots. . . . . . . . . . . . . . . . 107
7.6 Bar-plot comparison of the expected (red) vs the obtained (blue) robots’distribution on four targets of same quality values, q1 = q2 = q3 = q4 =0.25. Fifty simulations were performed for each of the following swarmsizes: a) 20 robots; b) 60 robots; and d) 100 robots. . . . . . . . . . . 108
LIST OF FIGURES xxiii
7.7 Bar-plot comparison of the expected (red) vs the obtained (blue) robots’distribution on four targets of different quality values, q1 = 0.1, q2 =0.2, q3 = 0.3, and q4 = 0.4. Fifty simulations were performed for eachof the following swarm sizes: a) 20 robots; b) 60 robots; and d) 100robots. . . . . . . . . . . . . . . . . . . . . . . . . . . . . . . . . . . . . 109
7.8 Effects of the control parameters, α and β, on the final robots’ distri-bution. Target allocation was performed with 60 robots as describedin the simulation setup 3 consisting of 4 targets with different qualityvalues: q1 = 0.1, q2 = 0.2, q3 = 0.3, and q4 = 0.4. The results ofthe robots’ distribution per target are shown for the following valuesof α/β ratio: a) α/β = 1; b) α/β = 2; c) α/β = 5. The values wereobtained from 50 simulations for each scenario. . . . . . . . . . . . . . 111

xxiv LIST OF FIGURES
List of Tables
4.1 Comparison of the Results for the NNS and AS algorithms . . . . . . 46
7.1 Robots’ distribution vs. targets’ quality values . . . . . . . . . . . . . 1027.2 Parameters describing three arenas used in simulations . . . . . . . . . 1047.3 Mean absolute error (MAE) of the robots’ distribution . . . . . . . . 1057.4 Effects of control parameters on robots’ distribution . . . . . . . . . . 110

xxvi LIST OF TABLES
Chapter 1
Introduction
1.1 Motivation
The world around us is becoming increasingly complex every day and changes dy-namically. The problems that we face require adaptive and scalable systems thatcan offer solutions with ever-rising level of autonomy. Traditional approaches arebecoming obsolete because they were designed for a simpler world. Therefore, anyadvancement in understanding and solving of complex problems can have an impacton the entire set of disciplines in engineering, biology, sociology, etc.
Swarm Intelligence is a problem-solving behavior that occurs as a result of amultiplicity of interactions between independent components that make up the entiresystem, i.e. the swarm. The algorithms inspired by the cooperative behavior innature, as in colonies of social insects, rely on artificial swarms of agents and wereinitially applied to solve the combinatorial optimization problems. These algorithmsare iterative computational methods and offer better solutions at the expense of longercomputation time. The individual agents in the swarm are not aware of the globalobjective, thus by modifying the rules of local interactions the algorithm can becustomized to solve different problems.
Many mathematical models of Swarm Intelligence have been proposed in litera-ture, and in most cases they offer a solution to a specific problem or a group of similarproblems without an attempt to create a general framework for their design. In thisdissertation, various methods are proposed that are based on the same rules of in-teraction between the members of the swarm, within a specific discrete environment,where the resulting swarming behavior is used as a tool for optimization and featureextraction, or as a model for multi-agent systems that resemble the real swarms in
2 1. Introduction
nature. It is demonstrated how the multiplicity of interactions on the local level pro-duces the global patterns that in different environments represent solutions to theabove-mentioned problems.
1.2 Preview of Contributions
The algorithms proposed in this dissertation exploit the self-organizing behavior of alarge group of autonomous agents to efficiently solve the above-mentioned problemsby providing scalability, robustness, and/or adaptability. The main objective was topropose a general design methodology for Swarm Intelligence-based methods. Thefocus was made on two main approaches. One approach was to apply Swarm Intelli-gence as a tool, i.e. the underlying mechanism of a system, which based on the inputvalues produces the output that represents a solution to a given problem. The secondapproach was to apply Swarm Intelligence to model the behavior of the system madeup of a large number of autonomous subsystems (agents) in order to achieve someexpected problem-solving behavior.
This dissertation presents the research work on the novel methods of Swarm Intelli-gence for various application domains. It demonstrates the advantages of a decentral-ized, bottom-up approach in optimization, feature extraction, and multi-agent systemmodeling. The original contributions are made in the areas of design methodology andapplication of the Swarm Intelligence methods. More specifically, the contributionsof this dissertation are as follows:
• Definition of the general methodology for the design of the SwarmIntelligence tools (Chapter 3): The general design methodology consists indefining the discrete data space in which the members of the swarm move, therules of local interactions, and the objective function for solutions evaluation.It provides a unified probabilistic rule for transition between the neighboringnodes in the data space.
• Validation of the proposed swarm-based methodology (Chapter 4):The proposed swarm-based methodology was validated in the real-world sce-nario, as a tool for the path optimization of Unmanned Aerial Vehicles (UAVs).The solution produced by the Ant System algorithm was combined with thedynamical model of the UAV in order to find the most cost-effective path forUAVs in the scenario of area coverage with a predefined set of waypoints.
Published in:
1.2. Preview of Contributions 3
Jevtic, A., Andina, D., Jaimes, A., Gomez, J., and Jamshidi, M. (2010). Un-manned aerial vehicle route optimization using Ant System algorithm. In Pro-ceedings of the 5th IEEE International Conference on System of Systems Engi-neering, SoSE 2010, pages 1-6.
• Novel edge-detection method (Chapter 5): An edge detection methodwas proposed that combines a nonlinear contrast enhancement technique, calledMultiscale Adaptive Gain, and the Ant System algorithm, which is based onthe ant foraging behavior. The set of enhanced images obtained after apply-ing the Multiscale Adaptive Gain and the Ant System algorithm is used tocreate pheromone patterns where the true edges are found. The sum of theobtained pheromone matrices, after applying threshold and morphological thin-ning, produces the output edge image. The proposed method was more efficientin finding well-connected edges, in which it outperformed other state-of-the-artant colony-based edge detectors.
Published in:
Jevtic, A., Quintanilla-Domınguez, J., Cortina-Januchs, M. G., and Andina, D.(2009). Edge detection using ant colony search algorithm and multiscale con-trast enhancement. In Proceedings of the 2009 IEEE International Conferenceon Systems, Man, & Cybernetics, SMC 2009, pages 2193-2198.
• Adaptive edge detection (Chapter 5): The adaptability of the above-mentioned edge detector was demonstrated in a dynamically changing envi-ronment made of a set of digital grayscale images. The algorithm responds tothe changes by creating different pheromone patterns according to the distribu-tion of the newly-created edges. It also shows to be robust, because any smallerartificial ant colony manages to detect the edges even though the total numberof the detected edges is reduced.
Published in:
Jevtic, A. and Andina, D. (2010). Adaptive artificial ant colonies for edgedetection in digital images. In Proceedings of the 36th Annual Conference onIEEE Industrial Electronics Society, IECON 2010, pages 2813-2816.
• Novel broken-edge linking method (Chapter 5): Broken edge linkingis an image improvement technique that is complementary to edge detection,where the broken edges are connected to form closed contours in order to sep-arate the regions in the image. A method based on the Ant System algorithm
4 1. Introduction
was developed in which the artificial ants search for the edge segments thatconnect different endpoints. A novel fitness function for solution evaluation wasintroduced, which is dependent on two variables: the grayscale visibility of thepixels, and the length of the connecting edge segment. The fitness functionmade more favorable the segments that consisted of smaller number of pixels,which had grayscale visibility of a higher mean value and a lower variance.Another introduced novelty was to apply the grayscale visibility matrix as theinitial pheromone trails matrix so that the pixels belonging to true edges have ahigher probability of being chosen by ants on their initial routes, which reducedcomputational load. The proposed broken-edge linking method was tested as acomplementary tool for the Sobel edge detector, and it significantly improvedthe output edge image.
Published in:
Jevtic, A., Melgar, I., and Andina, D. (2009). Ant based edge linking algorithm.In Proceedings of the 35th Annual Conference of the IEEE Industrial ElectronicsSociety, IECON 2009, pages 3353-3358.
• Novel data-clustering algorithm (Chapter 6): The Ant System-basedClustering Algorithm (ASCA), a data-clustering algorithm that models thepheromone-laying, pheromone-following behavior of natural ant colonies wasproposed in order to extract the number of clusters and subsequently classifydata patterns by assigning them to these clusters. It showed high sensitivity indetection of small clusters, i.e. the atypical data, that are in the proximity oflarger clusters. The algorithm was applied to image segmentation, for detectionof microcalcifications in digital mammograms, and it outperformed other state-of-the-art algorithms that it was compared to, such as 1D-SOM, k-Means, Fuzzyc-Means and Possibilistic Fuzzy c-Means. The important feature of the ASCAalgorithm to extract the number of clusters is extremely useful for applicationswhere the groups of patterns within a data set are not well-defined and need tobe detected.
Published in:
Jevtic, A., Quintanilla-Domınguez, J., Barron-Adame, J. M., and Andina, D.(2011). Image segmentation using Ant System-based Clustering Algorithm. InInternational Conference on Soft Computing Models in Industrial & Environ-mental Applications, SOCO 2011. Accepted for publication.
1.2. Preview of Contributions 5
• Novel algorithm for distributed task allocation (Chapter 7): The Dis-tributed Bees Algorithm (DBA) was proposed for a distributed task allocation ina swarm of autonomous mobile robots engaged in multi-foraging scenario. Thealgorithm was inspired by the foraging behavior of bees in nature, and it appliesa bottom-up approach that provides the multi-robot system with autonomousdecision-making. The algorithm achieves the objective of assigning the robotsto the found targets in a way that the final distribution is proportional to thetargets’ quality (fitness) values. The algorithm was validated through experi-ments with real robots in the laboratory environment. The performance of therobot swarm was tested with respect to the odometry error and the random tar-get search time. The scenario success criterium was established, and the timethreshold value for its achievement was obtained.
Published in:
Jevtic, A., Gazi, P., Andina, D., and Jamshidi, M. (2010b). Building a swarmof robotic bees. In 2010 World Automation Congress, WAC 2010, pages 1-6.Best Paper Award.
• Scalable multi-agent system (Chapter 7): The scalability of the above-mentioned DBA algorithm was tested in a simulator, with respect to the numberof robots and the number of tasks (targets) at hand. It was shown that theproposed multi-robot system is scalable, as its performance improved when morerobots were engaged in the target search. The experiments were repeated fordifferent sets of targets, having different total number of targets and by changingthe targets’ quality values. Although the experiments involve a multi-robotsystem, the DBA algorithm can be applied to a general problem of distributedtask allocation by defining the qualities and the costs of all the tasks.
In preparation to be published in:
Jevtic, A., Gutierrez-Martın, A., Andina, D., and Jamshidi, M. (2011). Dis-tributed Bees Algorithm for task allocation in swarm of robots. IEEE SystemsJournal. In preparation.
During the course of this work, significant contributions have also been madewithin the following projects:
• The Ant Colony Optimization metaheuristic for edge detection in digital images.
6 1. Introduction
Jevtic, A., and Andina, D. (2011). Ant-based algorithms for digital imageprocessing. Chapter in the book Search Algorithms, InTech Publisher. ISBN:978-953-307-483-2. Accepted for publication.
• A framework for a distributed coordination of a swarm of robots using networkedcontrol algorithms.
Gazi, P., Jevtic, A., Andina, D., and Jamshidi, M. (2010). A mechatronicsystem design case study: Control of a robotic swarm using networked controlalgorithms. In Proceedings of the 4th Annual IEEE Systems Conference, pages169–173. Best Paper Award.
• Artificial Metaplasticity as a novel learning method for artificial neural net-works.
Andina, D, Alvarez-Vellisco, A., Jevtic, A., and Fombellida, J. (2009). Artificialmetaplasticity can improve neural network learning. Intelligent Automation andSoft Computing, Special Issue in Signal Processing and Soft Computing, TSIPress, USA, 15(4):681–694. JCR impact factor: 0.349.
• Image segmentation using artificial neural networks and nonlinear filters.
Quintanilla-Domınguez, J., Cortina-Januchs, M. G., Jevtic, A., Barron-Adame,J. M., Vega-Corona, A., and Andina, D. (2009). Combination of nonlinear fil-ters and ANN for detection of microcalcifications in digitized mammography.In Proceedings of the IEEE International Conference on Systems, Man, & Cy-bernetics, SMC 2009, pages 1516–1520.
• Review of the Swarm Intelligence algorithms and applications.
Jevtic, A., and Andina, D. (2007). Swarm intelligence and its applications inswarm robotics. In Proceedings of the 6th WSEAS International Conferenceon Computational Intelligence, Man-Machine Systems & Cybernetics, CIM-MACS’07, pages 41–46.
The study of the state-of-the-art Soft Computing methods applied to variousdomains was performed, which resulted in contribution in the following publishedwork (Marcano-Cedeno et al., 2009; Andina et al., 2007; Quintanilla-Domınguez et al.,2010; Grau et al., 2009; Melgar et al., 2009; Alarcon-Mondejar et al., 2008; Cortina-Januchs et al., 2008; Andina and Jevtic, 2007a,b).
1.3. Dissertation Outline 7
1.3 Dissertation Outline
The rest of the dissertation is organized in four parts.Part I presents an introduction to the field of Swarm Intelligence. Chapter 2 de-
scribes the biological inspiration from which the field of Swarm Intelligence originated.Chapter 3 gives an overview of the state-of-the-art algorithmic models of Swarm In-telligence, referred to as Computational Swarm Intelligence. In this chapter, a generaldesign methodology for Swarm Intelligence tools is defined, and the probabilistic nodetransition rule is described as the underlying decision-making mechanism.
Part II describes the proposed Swarm Intelligence methods that are applied astools for optimization and feature extraction. Three case studies are presented toillustrate the methodology and an overview of the related work for each applicationdomain is given. Chapter 4 validates the general rule of local interaction on theproblem of Unmanned Aerial Vehicle path optimization. Chapter 5 describes novelmethods for edge detection and broken edge linking in digital grayscale images andperforms the analysis of the adaptability of the proposed edge detector. Chapter 6introduces a novel data clustering algorithm that is applied to image segmentationfor the extraction of regions of the atypical pixels.
Part III discusses the application of Swarm Intelligence as a model for multi-agentsystems and gives an overview of the related work in the field. Chapter 7 presents acase study of a distributed task allocation in a swarm of large number of autonomousmobile robots. The novel method exploits the foraging behavior of bees to model therecruitment of new robots for the most favorable targets. The proposed method wasvalidated through experiments on the real robots. The analysis of the scalability ofthe proposed method is performed through experiments in a simulated environmentby changing the size of the robot swarm and the number of targets.
Part IV summarizes the contributions of the thesis. Chapter 8 gives conclusionswith an overview of the thesis’ contributions and describes the possible lines of futurework.

8 1. Introduction

Part I
Background

Chapter 2
Biological Inspiration
2.1 Introduction
Swarm-based systems are typically made of a population of simple agents interactinglocally with one another and with their environment to achieve a common goal. Thebenefits of cooperation can be significant in situations where global knowledge of theenvironment does not exist. Agents within the group interact by exchanging locallyavailable information such that the global objective is obtained more efficiently thanit would be done by a single agent. The group of agents acting in such a mannercan be referred to as a swarm. The problem-solving behavior that emerges from theinteractions of such agents is called Swarm Intelligence. Algorithmic models of suchbehavior are referred to as Computational Swarm Intelligence (Engelbrecht, 2005).
Examples of collective behavior in nature are numerous. They are based on director indirect exchange of information about the environment between the members ofthe swarm. Although the rules governing the interactions at the local level are usuallyeasy to describe, the result of such a behavior is difficult to predict. However, throughcollaboration the swarms in nature are able to solve complex problems that are crucialfor survival in a dynamically changing environment.
The process of formation of the complex patterns out of the multiplicity of inter-actions is referred to as emergence. The understanding and study of emergence innature has itself been an emergent process, where a large number of researchers fromvarious natural and social science disciplines have contributed to it. This processpassed through several phases. It began with a few inquiring minds trying to under-stand the forces behind the emergent behavior without having solid scientific modelsto associate it with. In the second phase, scientists began to notice and compare the
12 2. Biological Inspiration
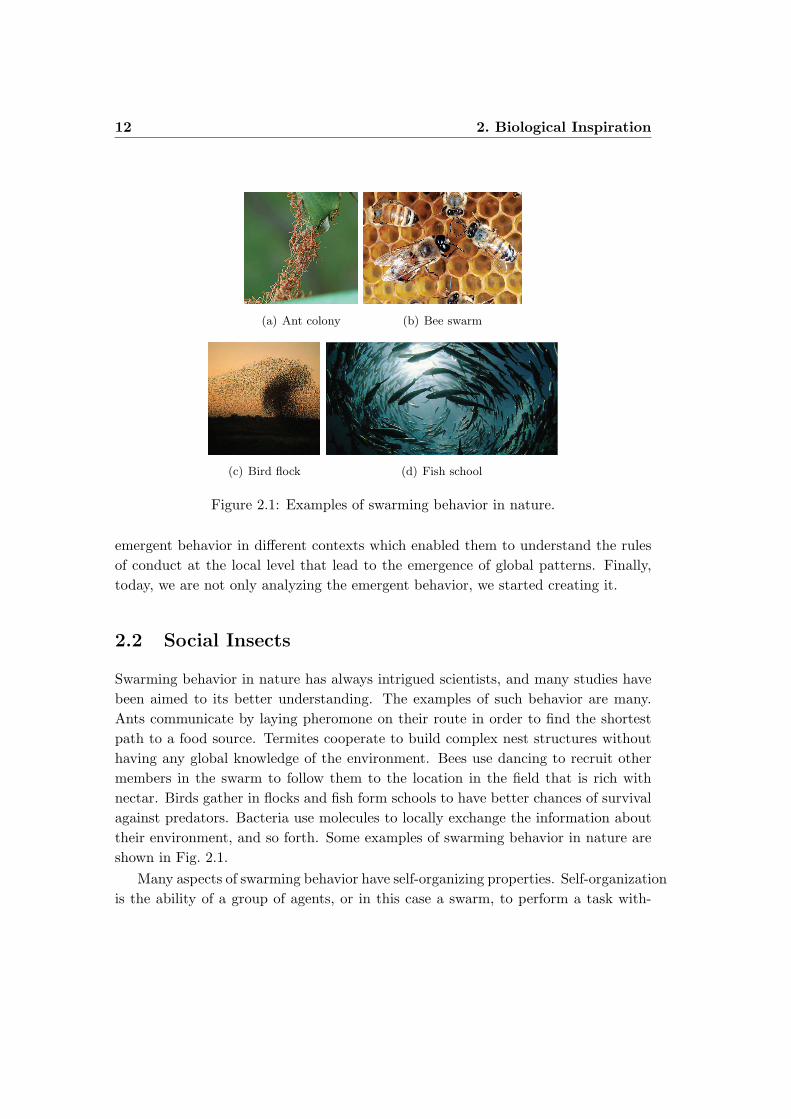
(a) Ant colony (b) Bee swarm
(c) Bird flock (d) Fish school
Figure 2.1: Examples of swarming behavior in nature.
emergent behavior in different contexts which enabled them to understand the rulesof conduct at the local level that lead to the emergence of global patterns. Finally,today, we are not only analyzing the emergent behavior, we started creating it.
2.2 Social Insects
Swarming behavior in nature has always intrigued scientists, and many studies havebeen aimed to its better understanding. The examples of such behavior are many.Ants communicate by laying pheromone on their route in order to find the shortestpath to a food source. Termites cooperate to build complex nest structures withouthaving any global knowledge of the environment. Bees use dancing to recruit othermembers in the swarm to follow them to the location in the field that is rich withnectar. Birds gather in flocks and fish form schools to have better chances of survivalagainst predators. Bacteria use molecules to locally exchange the information abouttheir environment, and so forth. Some examples of swarming behavior in nature areshown in Fig. 2.1.
Many aspects of swarming behavior have self-organizing properties. Self-organizationis the ability of a group of agents, or in this case a swarm, to perform a task with-

2.2. Social Insects 13
out the need for central control. The rules specifying the interactions between themembers of a swarm are executed on the basis of purely local information, withoutreference to the global pattern, which is an emergent property of the swarming be-havior rather than a property imposed by an external ordering influence. Bonabeauet al. (1999) define four basic components of self-organization:
• Positive feedback: Examples are recruitment and reinforcement. For in-stance, recruitment to a food source is a positive feedback that relies on trail-laying and trail-following in some ant species, or dances in bees.
• Negative feedback: Counterbalances positive feedback and helps to stabilizethe collective pattern in the form of saturation, exhaustion or competition. Inthe example of foraging, negative feedback stems from the limited number ofavailable foragers, satiation, food resource exhaustion, crowding at the foodsource, or competition between food sources.
• Randomness: Examples are random walks, errors, random task-switching, andso on. Randomness is often crucial since it enables discovery of new solutions.For example, a lost ant can find a new source of food.
• Multiple interactions: A single individual can generate a self-organized struc-ture (in ants, trail-following and trail-laying of pheromone can complement eachother), but self-organization generally requires a minimal density of mutuallytolerant individuals.
2.2.1 Pheromone Laying in Ant Colonies
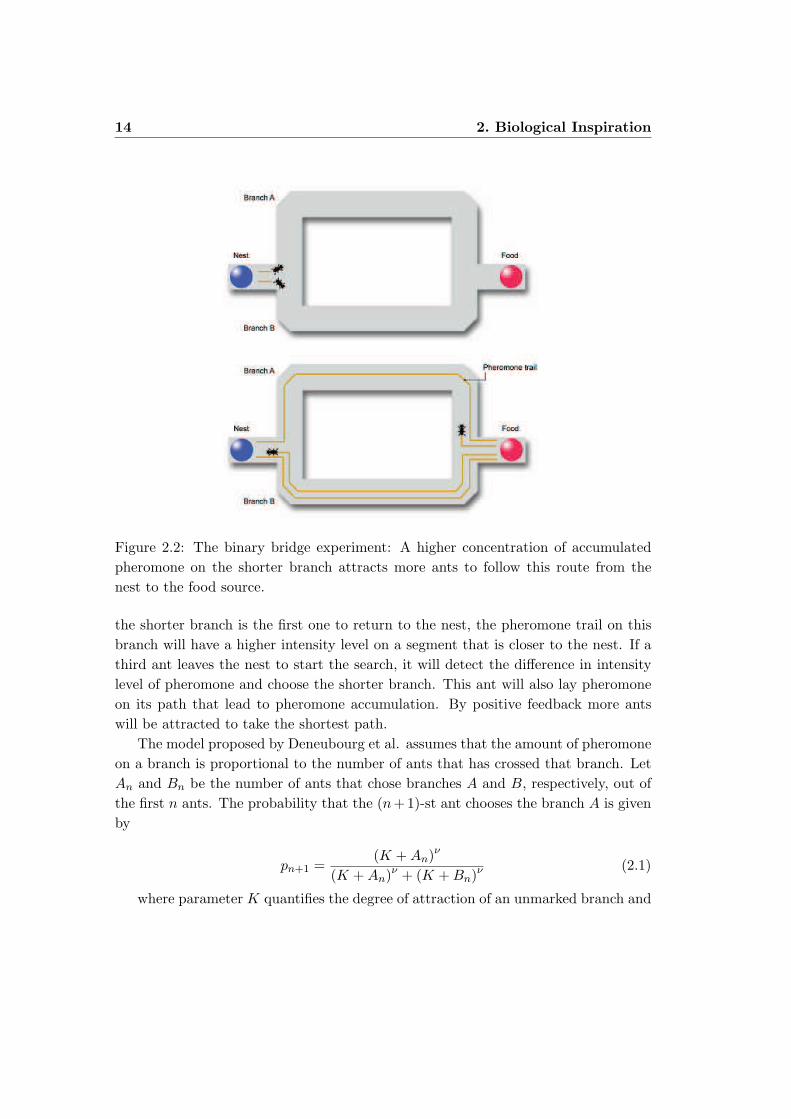
Self-organizing properties of ant colonies were studied by Deneubourg et al. (1990).The authors showed how the ants mark their route with pheromone in order to attractother ants to follow them. Pheromone-following behavior helps the ants to find theshortest path to a food source, but it also helps them perform division of labor,allocation of resources or gathering of corpses. The distributed coordination of theant colony was demonstrated in the binary bridge experiment depicted in Fig. 2.2.The experiment shows how over time the major part of the ant population choosesto take the shorter path from the nest to the food source.
In the experimental setup, the ants nest and the food source are connected bytwo branches of different length. Lets consider a simplified scenario where two antsleave the nest at the same time but take different branches to unknowingly reach thefood source. Both ants lay pheromone on their path, but since the ant that took
14 2. Biological Inspiration
Figure 2.2: The binary bridge experiment: A higher concentration of accumulatedpheromone on the shorter branch attracts more ants to follow this route from thenest to the food source.
the shorter branch is the first one to return to the nest, the pheromone trail on thisbranch will have a higher intensity level on a segment that is closer to the nest. If athird ant leaves the nest to start the search, it will detect the difference in intensitylevel of pheromone and choose the shorter branch. This ant will also lay pheromoneon its path that lead to pheromone accumulation. By positive feedback more antswill be attracted to take the shortest path.
The model proposed by Deneubourg et al. assumes that the amount of pheromoneon a branch is proportional to the number of ants that has crossed that branch. LetAn and Bn be the number of ants that chose branches A and B, respectively, out ofthe first n ants. The probability that the (n+1)-st ant chooses the branch A is givenby
pn+1 =(K + An)ν
(K + An)ν + (K + Bn)ν (2.1)
where parameter K quantifies the degree of attraction of an unmarked branch and
2.2. Social Insects 15
the value of ν determines the degree of nonlinearity of the choice function. (K, ν ≥ 0;K, ν ∈ <.) For larger values of K, a greater amount of pheromone is needed to makethe choice non-random. Also, when ν is large, one branch needs to have accumulatedonly slightly more pheromone than the other for the next ant to select it. The modelby Deneubourg et al. was used as a basis for the group of algorithms called AntColony Optimization described in Section 3.2. An analysis of convergence of theproposed model is given in (Makowski, 2008).
2.2.2 Recruitment by Dance in Honey Bee Swarms
Honey bee dancing is one of the most intriguing behaviors in social insects. It is aform of direct communication that worker bees use to recruit other bees in the swarmto follow them to the resource site. The concept of dance in bees was described byVon Frisch (1967). The author demonstrated how the bees exchange the informationabout the distance and the direction of the food sources by using different movementpatterns. Wenner and Wells (1990) suggest that bees communicate through floralodor present on their bodies upon return from a food source. Many experimentsdemonstrated the importance of floral odors in food location, yet the most commonlyaccepted view is that recruited bees go to the area depicted in the dance, but thenhome in on the flower patch using odor cues.
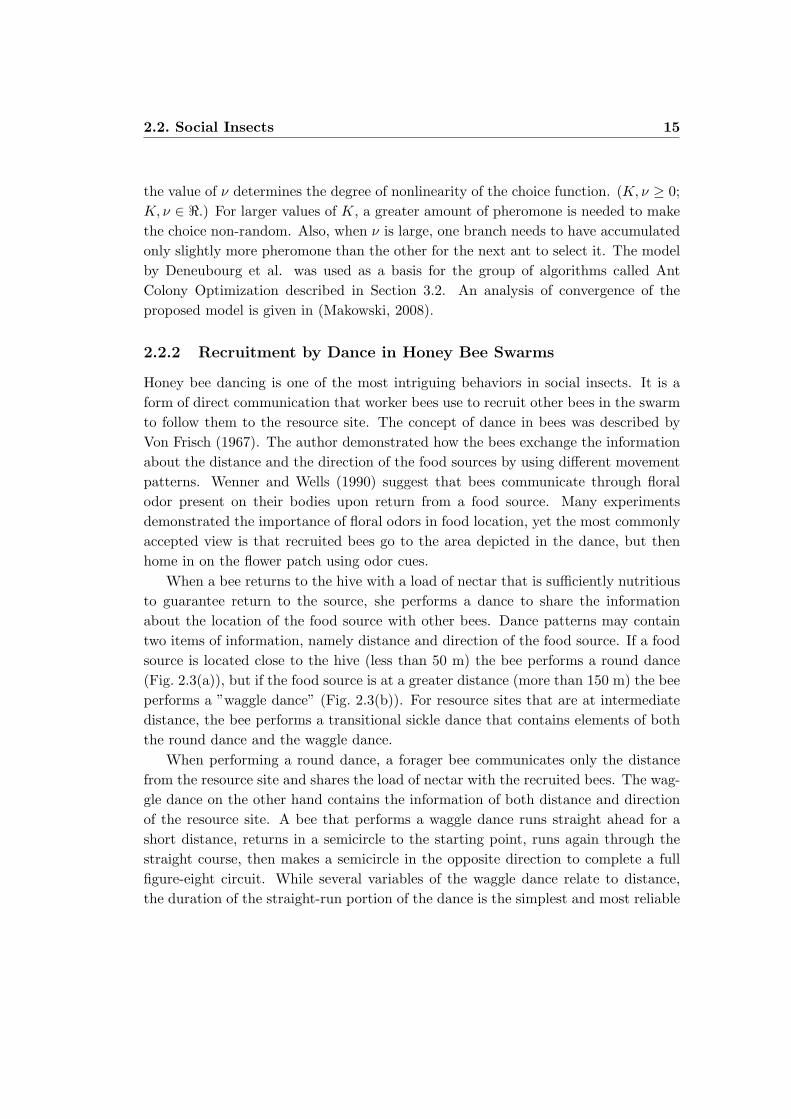
When a bee returns to the hive with a load of nectar that is sufficiently nutritiousto guarantee return to the source, she performs a dance to share the informationabout the location of the food source with other bees. Dance patterns may containtwo items of information, namely distance and direction of the food source. If a foodsource is located close to the hive (less than 50 m) the bee performs a round dance(Fig. 2.3(a)), but if the food source is at a greater distance (more than 150 m) the beeperforms a ”waggle dance” (Fig. 2.3(b)). For resource sites that are at intermediatedistance, the bee performs a transitional sickle dance that contains elements of boththe round dance and the waggle dance.
When performing a round dance, a forager bee communicates only the distancefrom the resource site and shares the load of nectar with the recruited bees. The wag-gle dance on the other hand contains the information of both distance and directionof the resource site. A bee that performs a waggle dance runs straight ahead for ashort distance, returns in a semicircle to the starting point, runs again through thestraight course, then makes a semicircle in the opposite direction to complete a fullfigure-eight circuit. While several variables of the waggle dance relate to distance,the duration of the straight-run portion of the dance is the simplest and most reliable
16 2. Biological Inspiration
(a) Round dance (b) Waggle dance
Figure 2.3: Dance patterns of the bees. (Image extracted from ”Bees: Their Vision,Chemical Senses, and Language”, K. Frisch, 1976)
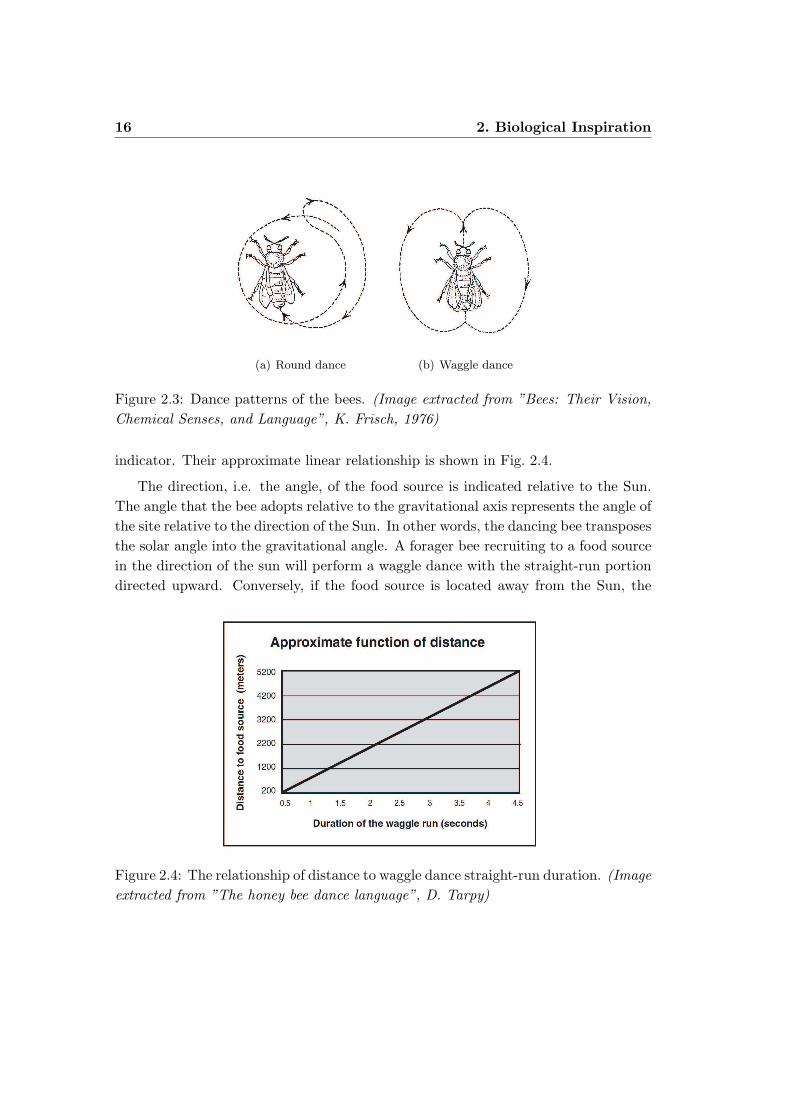
indicator. Their approximate linear relationship is shown in Fig. 2.4.
The direction, i.e. the angle, of the food source is indicated relative to the Sun.The angle that the bee adopts relative to the gravitational axis represents the angle ofthe site relative to the direction of the Sun. In other words, the dancing bee transposesthe solar angle into the gravitational angle. A forager bee recruiting to a food sourcein the direction of the sun will perform a waggle dance with the straight-run portiondirected upward. Conversely, if the food source is located away from the Sun, the
Figure 2.4: The relationship of distance to waggle dance straight-run duration. (Imageextracted from ”The honey bee dance language”, D. Tarpy)
2.3. Flocking, Schooling and Aggregation 17
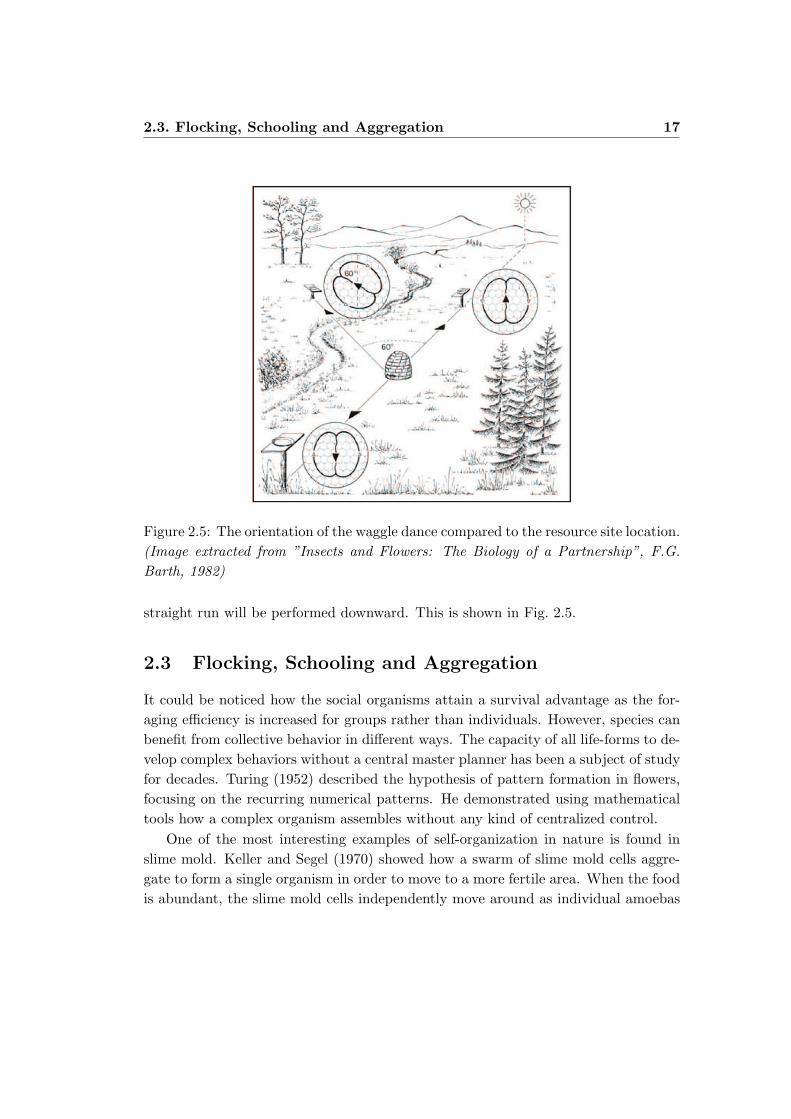
Figure 2.5: The orientation of the waggle dance compared to the resource site location.(Image extracted from ”Insects and Flowers: The Biology of a Partnership”, F.G.Barth, 1982)
straight run will be performed downward. This is shown in Fig. 2.5.
2.3 Flocking, Schooling and Aggregation
It could be noticed how the social organisms attain a survival advantage as the for-aging efficiency is increased for groups rather than individuals. However, species canbenefit from collective behavior in different ways. The capacity of all life-forms to de-velop complex behaviors without a central master planner has been a subject of studyfor decades. Turing (1952) described the hypothesis of pattern formation in flowers,focusing on the recurring numerical patterns. He demonstrated using mathematicaltools how a complex organism assembles without any kind of centralized control.
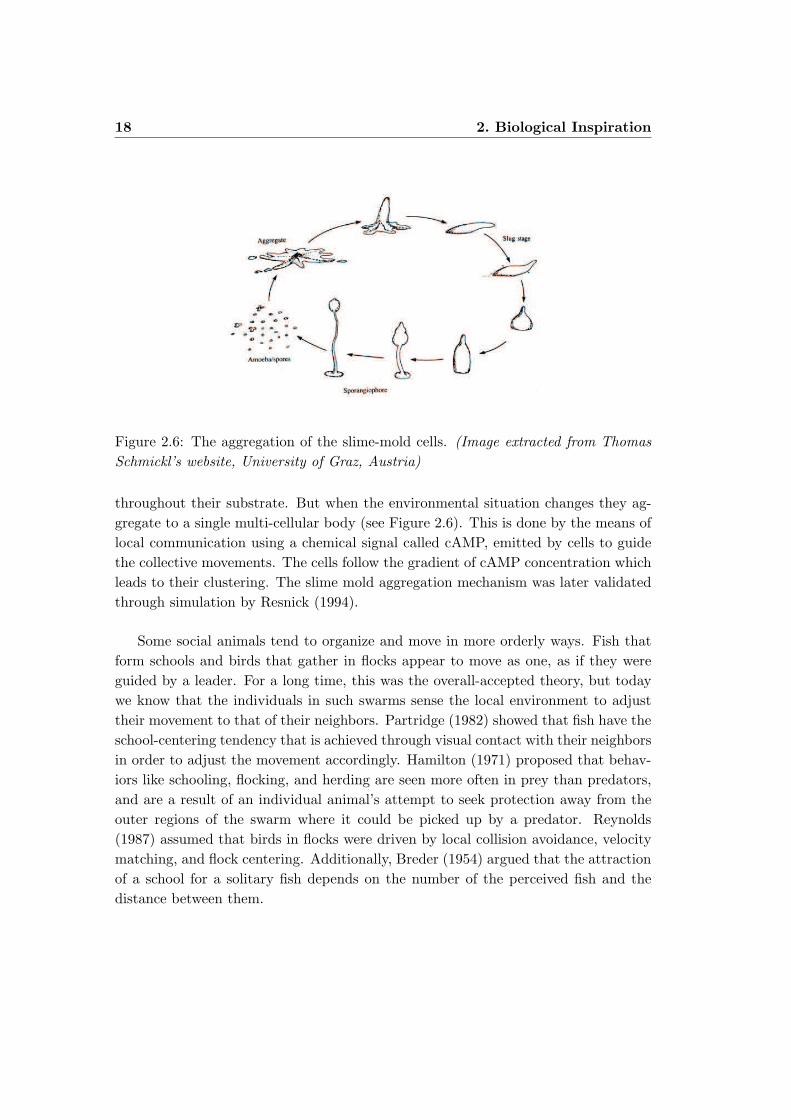
One of the most interesting examples of self-organization in nature is found inslime mold. Keller and Segel (1970) showed how a swarm of slime mold cells aggre-gate to form a single organism in order to move to a more fertile area. When the foodis abundant, the slime mold cells independently move around as individual amoebas
18 2. Biological Inspiration
Figure 2.6: The aggregation of the slime-mold cells. (Image extracted from ThomasSchmickl’s website, University of Graz, Austria)
throughout their substrate. But when the environmental situation changes they ag-gregate to a single multi-cellular body (see Figure 2.6). This is done by the means oflocal communication using a chemical signal called cAMP, emitted by cells to guidethe collective movements. The cells follow the gradient of cAMP concentration whichleads to their clustering. The slime mold aggregation mechanism was later validatedthrough simulation by Resnick (1994).
Some social animals tend to organize and move in more orderly ways. Fish thatform schools and birds that gather in flocks appear to move as one, as if they wereguided by a leader. For a long time, this was the overall-accepted theory, but todaywe know that the individuals in such swarms sense the local environment to adjusttheir movement to that of their neighbors. Partridge (1982) showed that fish have theschool-centering tendency that is achieved through visual contact with their neighborsin order to adjust the movement accordingly. Hamilton (1971) proposed that behav-iors like schooling, flocking, and herding are seen more often in prey than predators,and are a result of an individual animal’s attempt to seek protection away from theouter regions of the swarm where it could be picked up by a predator. Reynolds(1987) assumed that birds in flocks were driven by local collision avoidance, velocitymatching, and flock centering. Additionally, Breder (1954) argued that the attractionof a school for a solitary fish depends on the number of the perceived fish and thedistance between them.
2.4. Summary 19
2.4 Summary
This chapter introduced the concept of Swarm Intelligence and self-organized behaviorin nature. Some animal societies, such as swarms of insects, are able to adapt todynamically changing environment, which has been crucial for their survival. Inparticular, the examples of ant and bee colonies are pointed out, which served asinspiration for the algorithmic models presented in the following chapters.

20 2. Biological Inspiration
Chapter 3
Computational Swarm
Intelligence
3.1 Introduction
Computational Intelligence belongs to the broader field of Artificial Intelligence, andcomprises of the paradigms that relate to some kind of biological or naturally occurringsystem (Andina and Pham, 2007). Computational Swarm Intelligence represents thegroup of Computational Intelligence algorithms that model swarming behaviors innature. These algorithms are generally applied to optimization problems and otherproblems that can be converted to optimization problems.
Artificial swarms are usually designed using the bottom-up approach. The de-signer of this kind of systems needs to set the rules governing the mutual local inter-actions between the agents in the swarm with one another and between the agentsand the environment. The indirect communication via environment is referred to asstigmergy. Although various definitions of the term stigmergy have been proposed(Shell and Mataric, 2003), in the context of swarm intelligence it is used to describethe exchange of information through modifications of the environment (Bonabeauet al., 1999). That is, an agent modifies the environment that in return modifies thebehavior of other agents, i.e. they respond to it.
The initial purpose of the swarm-based algorithms was to solve optimization prob-lems. However, in recent years, these algorithms have shown their full potential interms of flexibility and autonomy when it comes to design and control of complexsystems that consist of a large number of autonomous agents. In more general terms,these can be referred to as System of Systems (Jamshidi, 2009). What distinguishes
22 3. Computational Swarm Intelligence
them is that they exploit the decentralization property of natural swarms in order tocreate autonomous, scalable, and adaptive multi-agent systems.
In this chapter, the state-of-the-art Computational Swarm Intelligence algorithmsare introduced. First, the Ant Colony Optimization metaheuristic is described thatserved as basis for the algorithms proposed in Part II. Following, an overview ofthe algorithms that model the foraging behavior of bee colonies, which served asinspiration for the distributed task allocation algorithm proposed in Part III.
3.2 Ant Colony Optimization
Ant Colony Optimization (ACO) is a swarm-based metaheuristic which models theforaging behavior of ant colonies in nature (Dorigo and Stutzle, 2004). As describedin Chapter 2.2.1, the ants through collaboration can solve complex problems suchas finding the shortest path to a food source. This feature can be used to solve theengineering problems that require this kind of optimization.
Artificial ants, unlike their biological counterparts, move through a discrete en-vironment defined by nodes, and they have memory. When traversing from onenode to another, ants leave pheromone trails on the edges connecting the nodes.The pheromone trails attract other ants that lay more pheromone, which conse-quently leads to pheromone trail accumulation. Negative feedback is applied throughpheromone evaporation that, importantly, restrains the ants from taking the sameroute and allows continuous search for better solutions. Ant System (AS) is the firstACO algorithm proposed in literature and it was initially applied to the TravelingSalesman Problem (TSP) (Dorigo et al., 1996).
3.2.1 Traveling Salesman Problem
A general definition of the TSP is the following. For a given set of cities with knowndistances between them, the goal is to find the shortest tour that allows each city to bevisited once and only once. In more formal terms, the goal is to find the Hamiltoniantour of minimal length on a fully connected graph.
Consider a set N of nodes, representing cities, and a set E of arcs (or edges) fullyconnecting the nodes N . Let dij be the length of the arc (i, j) ∈ E, that is, thedistance between cities i and j, with i, j ∈ N . The TSP requires to find a minimallength Hamiltonian circuit on the graph G = (N, E), where a Hamiltonian circuit ofgraph G is a closed tour visiting once and only once all the n = |N | nodes of G, and itslength is given by the sum of the lengths of all the arcs of which it is composed. Thus,
3.2. Ant Colony Optimization 23
the optimal solution to the TSP is a permutation π of the node indices 1, 2, . . . N suchthat the length f(π) is minimal, and it is given by
f(π) =N∑
i=1
dπ(i)π(i+1) + dπ(n)π(1) (3.1)
The TSP is one of the most studied combinatorial optimization problems. A largenumber of different algorithmic techniques have been either applied to the TSP ordeveloped to solve it. Early approaches include construction heuristics, iterative im-provement algorithms, and exact methods like branch&bound or branch&cut (Lawleret al., 1985). Since the beginning of the 1980s, various metaheuristics have beentested on the TSP such as simulated annealing, tabu search, evolutionary algorithm,and iterated local search (Johnson and McGeoch, 1997). The TSP has served as abenchmark test for newly proposed combinatorial optimization algorithms and a col-lection of well-known solved problems can be found in the TSPLIB benchmark librarywhich is accessible on the Web (Reinelt, 1991).
3.2.2 Ant System Algorithm
The AS algorithm generates a colony of artificial ants that move between the nodes(cities) in search for the optimal tour. The two main phases of the algorithm con-stitute the ants’ solution construction and the pheromone update. The general ACOmetaheuristic is shown in Algorithm 1. The optional local search phase was notconsidered for the AS algorithm, but it was applied in some extensions of the ASintroduced in Subsection 3.2.3.
Algorithm 1 The Ant Colony Optimization MetaheuristicSet parameters, initialize pheromone trailswhile termination condition not met do
ConstructAntSolutions
ApplyLocalSearch (optional)UpdatePheromoneTrails
end while
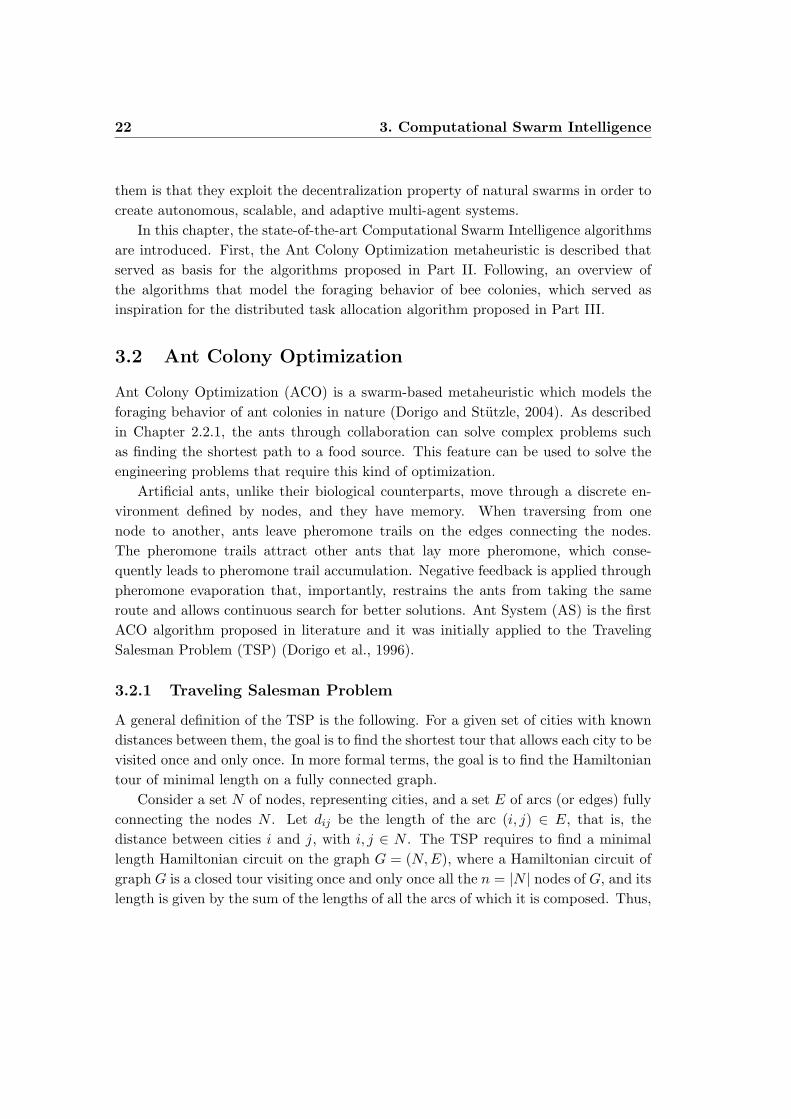
At each construction step, ant k applies a probabilistic action choice rule, calledroulette rule (or wheel-selection rule). That is, every node is associated to a probability
24 3. Computational Swarm Intelligence
Figure 3.1: Ant displacement based on the nodes’ associated probabilities.
of being chosen from a set of non-visited nodes, as graphically shown in Figure 3.1.The probability of displacing ant k from node i to node j is given by:
pkij =
(τij)α(ηij)
β∑
h/∈tabuk, (τih)α(ηih)β if j /∈ tabuk
0 otherwise
(3.2)
where τij and ηij are the intensity of the pheromone trail on edge (i, j) and thevisibility of the node j from node i, respectively, and α and β are the control param-eters (α, β > 0; α, β ∈ <). The tabuk list contains the nodes that have already beenvisited by the kth ant. The node’s visibility is defined as inversely proportional tothe node’s distance:
ηij =1
dij(3.3)
It can be concluded from the equations (3.2) and (3.3) that the ants favor theedges that are shorter and contain a higher concentration of pheromone.
AS is performed in iterations. At the end of each iteration the pheromone valuesare updated by all the ants that have built a solution in the iteration itself. The
3.2. Ant Colony Optimization 25
pheromone update rule is described with the following equation:
τij(new) = (1− ρ)τij(old) +m∑
k=1
∆τkij (3.4)
where ρ is the pheromone evaporation rate (0 < ρ < 1, ρ ∈ <), m is the number ofants in the colony, and ∆τk
ij is the amount of pheromone laid on the edge (i, j) by thekth ant, and is given by:
∆τkij =
QLk
if edge (i, j) is traversed by the kth ant
0 otherwise
(3.5)
where Lk is the length of the tour found by the kth ant, and Q is a constant.The algorithm stops when the satisfactory solution is found or when the maximum
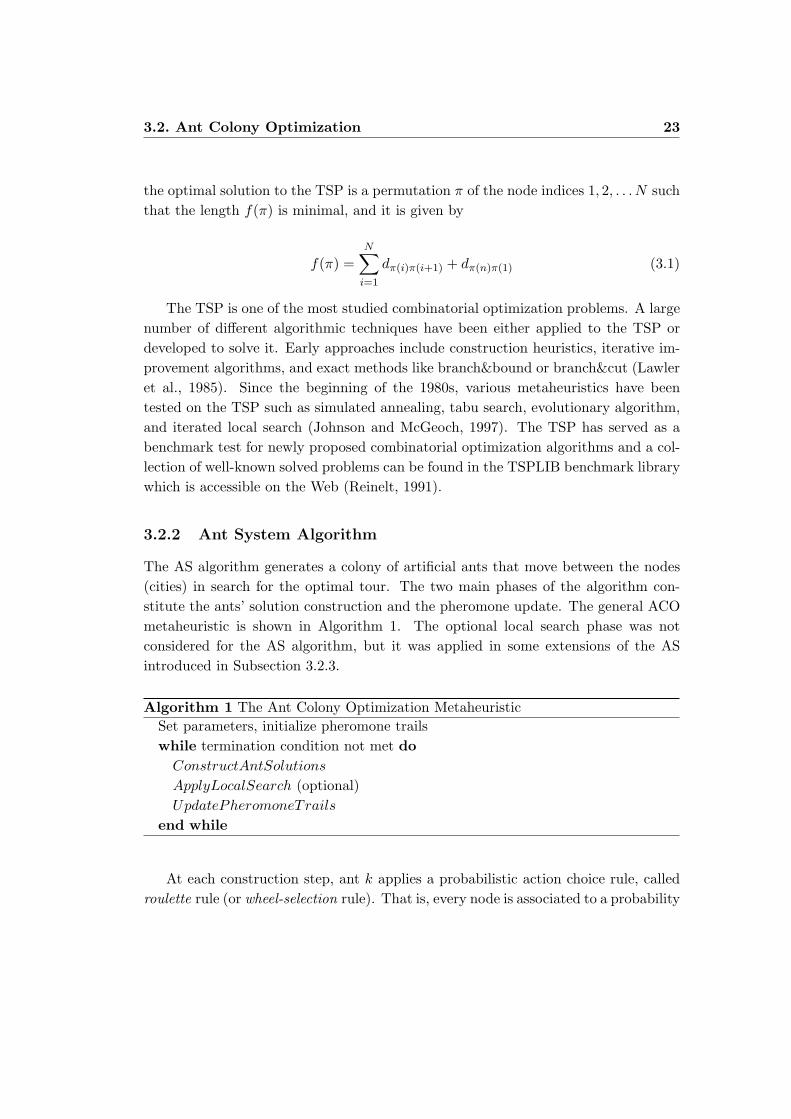
number of iterations is reached.One configuration of the TSP is a 30-city problem ”Oliver30-TSP” with the op-
timal tour length of 423.7406. The solution found after applying the AS algorithm isshown in Figure 3.2(a). It was obtained after 1349 iterations, which is shown on thesolution convergence graph in Figure 3.2(b).
3.2.3 Extensions of Ant System Algorithm
Several ACO algorithms have been proposed in literature as extensions of the ASalgorithm. They were introduced with certain modifications in order to achieve abetter performance. The two most successful variants are the MAX −MIN AntSystem (MMAS) and the Ant Colony System (ACS).
The MMAS algorithm (Stutzle and Hoos, 2000) introduced several modifica-tions to the original AS. First, it exploits the best solutions found by depositing thepheromone only on the best tour in the current iteration or the global best tour. Inorder to prevent the algorithm stagnation that may come as a result of the pheromoneaccumulation on the preferred tours, the pheromone deposits are limited to a certainrange defined by the lower and the upper limit values. This allows the constantexploration of new tours. The pheromone trails are initialized to the upper limitand the pheromone evaporation rate is set to a low value in order to increase theexploration of tours when the algorithm starts the search. Finally, if the algorithmapproaches stagnation with no improvement of the best tour, the pheromone trailsare re-initialized.
26 3. Computational Swarm Intelligence
0 20 40 60 80 100
10
20
30
40
50
60
70
80
90
100
Iteration=1349 Path length=423.7406
(a)
0 500 1000 1500420
430
440
450
460
470
480
490
500
510
Iterations
Bes
t pat
h le
ngth
Best Path Record
(b)
Figure 3.2: Ant System algorithm results on the Oliver30 TSP: a) optimal solution;b) solution convergence.
The ACS algorithm (Dorigo and Gambardella, 1997) introduced a local pheromoneupdate in addition to the pheromone update performed at the end of the solution con-struction process. The local pheromone update is performed after each constructionstep by all the ants in the swarm. It is applied only to the last edge traversed byremoving some pheromone from that edge to increase the exploration of the new
3.3. Bee Colony-inspired Algorithms 27
paths by subsequent ants in the same iteration. This encourages the ants to pro-duce a number of different solutions during one iteration. Another modification tothe AS algorithm is that, at the end of each iteration, the ACS performs pheromoneevaporation and pheromone depositing only on the edges belonging to the best-so-fartour.
Some successors of the AS algorithm include Elitist AS (Dorigo et al., 1996),Ant-Q (Gambardella and Dorigo, 1995), Rank-based AS (Bullnheimer et al., 1999),ANTS (Maniezzo, 1999), BWAS (Cordon et al., 2000), and Hyper-cube AS (Blumand Dorigo, 2004), among others. One feature of the AS extensions is that theydirect the search in a more aggressive way by giving emphasis to the best tour in eachiteration (e.g., in MMAS) or the best-so-far tour (e.g., in ACS). These produce abetter solution quality for a faster computation time in the applications of the TSP.But for the applications described in Part II, such as the edge detection in imagesor the cluster analysis, the objective is not to find the best solution but to recordthe movement of all ants, which is reflected in the distribution of pheromone trails.For example, in case of image processing, we do not search for the strongest edge inthe image, but for all the true edges that make the objects’ boundaries. This is therationale for using the AS algorithm as the basis for the proposed methods.
3.3 Bee Colony-inspired Algorithms
The foraging behavior of the bees described in Section 2.2.2 can be applied to opti-mization (find the best source of food), distributed task allocation (recruitment of thebees based on the quality of the food sources), etc. When a forager bee finds a foodsource, she returns to the hive and performs a ”dance” in order to recruit other bees.The information about the richness and the location of the site is passed throughdirect communication on the central dance floor. Some models of the cooperativebehavior of bee colonies with centralized communication or no communication havealready been proposed in the literature.
Pham et al. (2006) developed the Bees Algorithm (BA), which in its basic versionperforms a random search combined with a neighborhood search and can be used foroptimization. The algorithm exploits the concept of the central dance floor in orderto select the fittest sites, but no direct communication between the swarm membersexist. The recruitment of the bees can be done in a deterministic way according tothe fitness values associated with the sites, or these fitness values can be used todetermine the probability of the bees being selected. Together with scouting, this
28 3. Computational Swarm Intelligence
differential recruitment is a key operation of the BA. The algorithm is performed initerations, and it is stopped when the solution is found within the provided errormargin or when the maximal number of iterations is reached.
Bailis et al. (2010) proposed a model of the bee colony foraging to investigatethe value of sharing food source position information in different environments. Theauthors show through simulations that in environments of highly-scattered food, re-lying solely on private information about previously encountered food sources is moreefficient than sharing information. However, in the nectar-rich environments it leadsto decreased foraging efficiency.
Another bee colony-based optimization algorithm called Artificial Bee Colony(ABC) was proposed by Karaboga and Akay (2009). The concept of the centraldance floor is applied through different roles that bees have in the swarm, namelyscout, onlooker and employed bees. The algorithm uses recruitment based on thefitness values of the food sources and applies neighborhood search for solution im-provements. A scout bee is randomly sent to search for a new food source when apreviously found source is abandoned.
Few other algorithms inspired by bees’ behavior appeared in literature, such asBeeHive (Wedde et al., 2004), BCO (Teodorovic and Dell’Orco, 2005), Virtual BeeAlgorithm (Yang, 2005), HBMO (Afshar et al., 2007), etc., and they have mostlybeen applied to solving combinatorial optimization problems.
3.4 Particle Swarm Optimization
The problem-solving behavior that emerges from the multiplicity of interactions be-tween the individual agents is not common only to social insects. Particle SwarmOptimization (PSO) (Kennedy and Eberhart, 1995) is a metaheuristic inspired bythe flocking behavior of birds. In terms of this bird flocking analogy, a particle swarmoptimizer consists of a number of particles, or birds, that fly around the space, or thesky, in search of the best location.
Each of these particles corresponds to a simple agent that moves through a multi-dimensional search space sampling an objective function at various positions. Themotion of a given particle is dictated by its velocity which is continuously updatedin order to pull it towards its own best position and the best positions experiencedby the neighbors in the swarm. The performance of each particle is measured usinga predefined fitness function which encapsulates the characteristics of the optimiza-tion problem. Kennedy et al. (2001) describe particle swarms as closely related to
3.5. Advantages of Swarm Intelligence 29
cellular automata, which have three main attributes: (1) update of individual cells isperformed in parallel, (2) each cell’s new value depends only on its old value and theold value of the neighboring cells, and (3) all cells are updated using the same rules.
Many variants of the PSO algorithm have been proposed. Some of these intendto incorporate the capabilities of the evolutionary computation techniques, such ashybrid PSO (HPSO) (Naka et al., 2003), evolutionary PSO (EPSO) (Miranda andFonseca, 2002), and differential evolution PSO (DEPSO) (Zhang and Xie, 2003).Different authors have suggested various adjustments to the parameters of the PSOalgorithm by applying Fuzzy logic (Shi and Eberhart, 2001), inertia weight and con-striction factors (Eberhart and Shi, 2000), or a secondary PSO algorithm (Doctoret al., 2004), among others. Most PSO algorithms, unlike ACO, are designed forsearch in continuous domains.
3.5 Advantages of Swarm Intelligence
The self-organizing properties of animal swarms have been studied for better un-derstanding of the underlying concept of decentralized decision-making in nature.Disadvantages of decentralized control appear as conflicts between the members ofswarms, redundant activities, and slow global response to a change in the environ-ment. However, distributing the control of a swarm widely among its members almostcertainly enhances its ability to make a rapid, local response to a change because iteliminates the need for time-consuming communication between its central and pe-ripheral parts. More importantly, the bottom-up design topology applied to SwarmIntelligence algorithms provides them with higher autonomy, scalability, robustnessand adaptability to the changes in their environment.
3.5.1 Scalability and Robustness
Scalability and robustness define the ability of a multi-agent system to scale-up orscale-down its performance with respect to the number of agents or number of tasksat hand. For a system comprised of a very large number of agents, a scalable designcan significantly improve the performance of the overall system. On the other hand,a robust design insures that losing some agents will not cause a catastrophic failure.

30 3. Computational Swarm Intelligence
3.5.2 Adaptation and Learning
The terms ”adaptation” and ”learning” are differently defined from perspective ofdifferent scientific studies. Psychologists define learning as a ”modification of a behav-ioral tendency by experience”. From the perspective of computer science, especiallyin robotics, learning is usually associated with Reinforcement Learning, or ”how tomap situations to actions so as to maximize a numerical reward signal”. In our work,the term ”adaptation” is used, which seems more appropriate and avoids confusion.It is used to describe the modifications in behavior of the system as whole, where theperformance of a single agent on a specific task does not change over time.
The adaptation of animals swarms throughout the evolution allowed them tosurvive despite the dynamically changing environment. This feature is used to modelthe autonomous multi-agent systems or to create the adaptive tools for knowledgeextraction and combinatorial optimization. For autonomous multi-agent systems,such as robot swarms, the ability to adapt to a dynamically changing environmentis of utmost importance. The systems that are not adaptive are most likely to failfaced with unknown working conditions. On the other hand, the adaptive algorithmscan be applied to any kind of dynamically changing digital habitat, such as real-timeimage processing or clustering of a variable data set.
3.6 Proposed Methodology
The proposed methodology consists of a set of simple rules that serve as guidelinesfor the design of the Swarm Intelligence tools, and they are as follows:
• Define the nodes that constitute the discrete data space in which the agentsmove.
• Define the set of application-specific variables and apply Equation 3.2 to calcu-late the probabilities of the displacement to the neighboring nodes.
• Apply the roulette rule as the underlying decision-making mechanism.
• Define the objective function for solutions evaluation.
3.7 Summary
This chapter gives an overview of the state-of-the-art Computational Swarm Intelli-gence algorithms. Scalability, robustness and adaptation are described as their dis-

3.7. Summary 31
tinct features. The artificial swarms are used to simulate natural swarms, to modelswarms of physical agents (e.g. robots), or their problem-solving behavior can beapplied to optimization problems, which was their initial purpose. This cooperativebehavior shows emergent properties and produces unpredictable global patterns. Oneway of dealing with the unpredictability issue is statistical analysis.
In order to facilitate the design of the methods based on Swarm Intelligence, ageneral methodology is proposed that consists of a set of simple rules. In the followingchapters, the main contributions of this thesis are presented as case studies. In Part II,the general design methodology is validated in a real-world scenario and novel SwarmIntelligence methods are proposed as tools for optimization and feature extraction.In Part III a swarm-based model of a multi-agent system is presented for distributedtask allocation in a swarm of robots.
32 3. Computational Swarm Intelligence
Part II
Tools for Optimization and
Feature Extraction

Chapter 4
Route Optimization of
Unmanned Aerial Vehicles
4.1 Introduction
Ant Colony Optimization (ACO) is a metaheuristic method initially proposed to solvecombinatorial optimization problems. Ant System (AS) is the first ACO algorithmproposed in literature and it was initially applied to the Traveling Salesman Problem(TSP) (Dorigo et al., 1996), a well-known NP-hard optimization problem alreadydescribed in Subsection 3.2.1. The concept of the TSP has many applications. Indigital communications, when one deals with the large networks of communicatingagents such as the servers on the Internet, the objective of finding the shortest possiblecommunication route has become even more critical. Nevertheless, future applicationswill include a wide range of software and hardware agents that need to communicateor displace in an optimal manner. One of such examples is Unmanned Aerial Vehicles(UAVs).
UAV is an aircraft without the onboard presence of pilots. It was initially used formilitary operations, but the interest for its involvement in commercial applicationsis on the rise. These include telecommunications, ground traffic control, search andrescue operations, and crop monitoring among others. In September 2002, NASA’ssolar-powered Pathfinder-Plus UAV was used to conduct a proof-of-concept missionin U.S. national airspace above a 3500 acre commercial coffee plantation in Hawaii.UAVs assist with frost protection, irrigation and crop management in agriculture.Together with Mobile Ground Station systems, UAVs offer persistent surveillance,enhanced situational awareness, and actionable intelligence to law enforcement and
36 4. Route Optimization of Unmanned Aerial Vehicles
security personnel on the move.UK law enforcement have studied the use of small VTOL UAVs with a stills
camera, daylight TV sensor and a live video downlink, for urban surveillance andcrowds. California-based AeroVironment’s UAV can stay aloft for a week at 65.000ft, providing low-cost communications relays and aerial mapping. The KB4 is used totrack icebergs. The plane is able to fly in swarms of three, collaborating autonomouslyon some in-flight decisions. An inverted-V tail helps keep Aerosonde stable in highwinds making it ideal for hurricane monitoring. The 5-pound SkySeer can be usedfor police search-and-rescue missions, as well as scouting forest fires and countingmigratory animals.
UAVs have several basic advantages over manned systems including increased ma-neuverability, reduced cost, reduced radar signatures, longer endurance, and less riskto crews. One of the challenges in the control of UAVs is to make them autonomousor semi-autonomous in order to relieve the operator from the constant monitoring.One application is the area coverage, where the task is to find the minimal routethat connects a defined set of waypoints. This can be treated as a TSP, and varioussoft-computing methods have been successfully applied in order to solve it.
In this chapter, the application of the AS algorithm to the UAVs’ route optimiza-tion is described. The UAVs are engaged in a simulated area coverage scenario witha defined set of waypoints. The objective is to find the shortest route that connectsall the waypoints in order to optimize the time and the cost of the UAV’s flight. Theeffectiveness of the AS algorithm is shown in comparison with the Nearest Neigh-bor Search (NNS) algorithm which was initially used in the UAV scenario simulation(Jaimes and Jamshidi, 2010).
The chapter is organized as follows. Section 4.2 gives an overview of the relatedwork. A detailed description of the AS algorithm is given in Section 4.3. The problemstatement and the proposed method are described in Section 4.4. In Section 4.5the experimental setup and the discussion of the results are presented. Finally, inSection 4.6 the conclusions are made.
4.2 Related Work
4.2.1 Soft-computing Methods for Traveling Salesman Problem
The TSP has been studied intensively and it is often used as a benchmark for thenew optimization algorithms. Many exact and metaheuristic algorithms have beenapplied to the TSP. The exact algorithms include tour construction algorithms such
4.3. Ant System Algorithm 37
as the well-known Nearest Neighbor Search (NNS) (Arya et al., 1998; Rosenkrantzet al., 2009). The NNS algorithm is fast and easy to implement but often producesnear-optimal solutions that are not satisfactory, especially for a large number of cities.
The metaheuristic algorithms use imprecision and approximation to find the opti-mal solution. These algorithms have been applied successfully to the TSP by a num-ber of researchers. Some widely applied algorithms are Simulated Annealing (SA)(Bonomi and Lutton, 1984; Golden and Skiscim, 1986), Tabu Search (TS) (Knox,1994) and Genetic Algorithms (GA) (Grefenstette et al., 1985; Whitley et al., 1989;Nguyen et al., 2007).
The ant colony metaphor is easily adapted to the TSP because of the inherentfeature of the ants foraging behavior to search for the shortest path to the foodsource. The AS algorithm was first proposed by (Dorigo et al., 1996) as a multi-agentapproach to solving the TSP. Other variants of the AS algorithm have been proposedsince, most successful being the Ant Colony System (ACS) (Dorigo and Gambardella,1997) and the MAX-MIN Ant System (MMAS) (Stutzle and Hoos, 2000).
4.2.2 Ant Colony Optimization for Unmanned Aerial Vehicle Appli-
cations
The ACO-based algorithms have been used for the UAV applications. Ma et al. (2007)proposed an ant colony-based method for the UAV global optimal trajectory planning.The obtained optimal route was not a feasible UAV trajectory, so the authors applieda trajectory smoothing method. Another method was proposed by Zhenhua et al.(2008) who used Voronoi diagrams to create a set of possible trajectories and thenapplied the Multiobjective Ant Colony System algorithm to find the optimal route.Duan et al. (2009) applied the pheromone-laying pheromone-following behavior tothe team of UAVs for collision avoidance and simultaneous arrival to the target indynamic and uncertain environments.
4.3 Ant System Algorithm
Artificial ants, unlike their biological counterparts, move through a discrete environ-ment defined with nodes, and they have memory. When moving from one node to an-other, ants leave pheromone trails on the edges connecting the nodes. The pheromoneattracts other ants, which creates a positive feedback that leads to a pheromone trailaccumulation. A negative feedback is applied through pheromone evaporation that,
38 4. Route Optimization of Unmanned Aerial Vehicles
importantly, restrains the ants from taking the same route, therefore prevents thealgorithm stagnation.
After defining the discrete environment in which the artificial ants can move,the AS algorithm starts with an initialization step which is followed by iterativeconstruction of new solutions and pheromone update. The AS algorithm involves thefollowing steps:
1. Initialization: The population of ants is created by placing one ant on everynode. The edges are assigned with an initial pheromone trail, τ0.
2. Node transition rule: Ants are allowed to displace to any node they have notalready visited. The list tabuk contains all the nodes visited by the kth ant.Every node has an associated probability with which it is chosen from the setof available nodes. This decision-making mechanism is known as the rouletterule. The probability of displacing the kth ant from the node i to the node j isgiven by:
pkij =
ταijηβ
ij∑h/∈tabuk
ταihηβ
ih
, if j /∈ tabuk
0, otherwise
(4.1)
where τij and ηij are the intensity of the pheromone trail on the edge (i, j) andthe visibility of the node j from the node i, respectively. (τij , ηij > 0; τij , ηij ∈ <;for ∀i, j.) The parameters, α and β, are used respectively to bias the search infavor of the exploitation of the accumulated pheromone or exploration of newsolutions, respectively. (α, β > 0; α, β ∈ <.) Tabuk list contains the nodesvisited by the kth ant. The visibility of the node j from the node i is definedas the reciprocal value of their Euclidean distance, dij ,
ηij =1
dij. (4.2)
Once all the probabilities are calculated as in (4.1), ant will choose a node by”spinning the roulette wheel”. This step is repeated until all the nodes arevisited by all the ants. The best solution (the shortest path found) from thisiteration is compared with the overall best and the minimum of the two is savedas the new overall best.

4.4. Problem Statement and Proposed Method 39
3. Pheromone update rule: When all the ants have finished their route, the pheromoneupdate is applied. The edges that form a part of some ant’s route accumulatemore pheromone, and those that don’t lose pheromone trails through evapora-tion. This is given by:
τij(new) = (1− ρ)τij(old) + ∆τij (4.3)
where ρ is the pheromone evaporation rate (0 < ρ < 1; ρ ∈ <), and ∆τkij is the
amount of pheromone laid on the edge (i, j) by the kth ant, and is given by:
∆τij =m∑
k=1
∆τkij (4.4)
where
∆τkij =
QLk
, if edge (i, j) belongs to the route
0, otherwise.
(4.5)
where Lk is the kth ant’s route length and Q is a constant.
4. Stopping criterion: The steps 2 and 3 are repeated in the loop and the algorithmstops executing when the maximum number of iterations is reached.
4.4 Problem Statement and Proposed Method
4.4.1 Traveling Salesman Problem
In the proposed scenario, the team of UAVs is sent to fly over a certain numberof locations on the ground. This problem can be interpreted as a well-known NP-hard optimization problem called the Traveling Salesman Problem (TSP). A generaldefinition of the TSP is the following. Consider a set N of nodes, representing cities,and a set E of arcs fully connecting the nodes N . Let dij be the length of the arc(i, j) ∈ E, that is, the distance between nodes i and j, with i, j ∈ N . The TSP is theproblem of finding a minimal length Hamiltonian circuit on the graph G = (N,E),where a Hamiltonian circuit of the graph G is a closed tour visiting once and onlyonce all the n = |N | nodes of G, and its length is given by the sum of the lengths ofall the arcs of which it is composed.

40 4. Route Optimization of Unmanned Aerial Vehicles
Finding the shortest tour means saving time for task execution, as well as savingenergy needed for the UAVs’ flight. The UAVs start their tour from a base whichthey constantly communicate with by sending the information of their position anddirection of flight (roll, pitch, and yaw). The calculation of the optimal tour isperformed in the base and sent to the UAVs as a list of coordinates that need tobe visited. Each tour starts from the location in the list that is closest to the base.By taking into account the starting position of the UAVs, maximum savings in timeand energy are obtained for the task at hand.
4.4.2 Proposed Method
The proposed method (Jevtic et al., 2010a) is based on the foraging behavior of antcolonies where, in search for food, ants leave pheromone trails in order to attract otherants to follow their routes. For the UAV route optimization problem, the waypoints,i.e. their coordinates, represent the nodes. The edges between the nodes are theaerial paths UAVs take to move from one location to another not taking into accountthe dynamics of the flight. More precise optimization results would be obtained ifthe angle of turns the UAVs make would be calculated. Still, considering that thedistance between the nodes is large enough, the best calculated route remains thesame.
The input for the proposed method is the list of the waypoints’ coordinates thatneed to be visited by the UAV. The AS algorithm is an iterative process and includesthe steps mentioned in Section 4.3. The number of ants equals the number of nodes,and each node is a starting point of a different ant. Each edge is initiated with thesame value of the pheromone trail, τ0, so that the initial probabilities that edgeswould be chosen depend on their length only. This helps the ants find satisfactorygood solutions in the first iteration.
The ants move from node to node based on the node transition rule in (4.1) untilthey visit all the nodes exactly once. The distance from the last node to the startingnode is added to the total tour length. Each iteration ants produce solutions and thebest tour is saved as the iteration’s best. This is compared with the best solutionfrom the previous iterations in order to find the global best.
The pheromone trails on the edges visited by ants are updated as in (4.2) and(4.3), which leads to pheromone accumulation. Unvisited edges lose pheromone byevaporation and become less attractive to the ants in the subsequent iterations. Thealgorithm stops executing when the maximum number of iterations is reached. Theglobal best is the optimal tour found for the given list of waypoints.
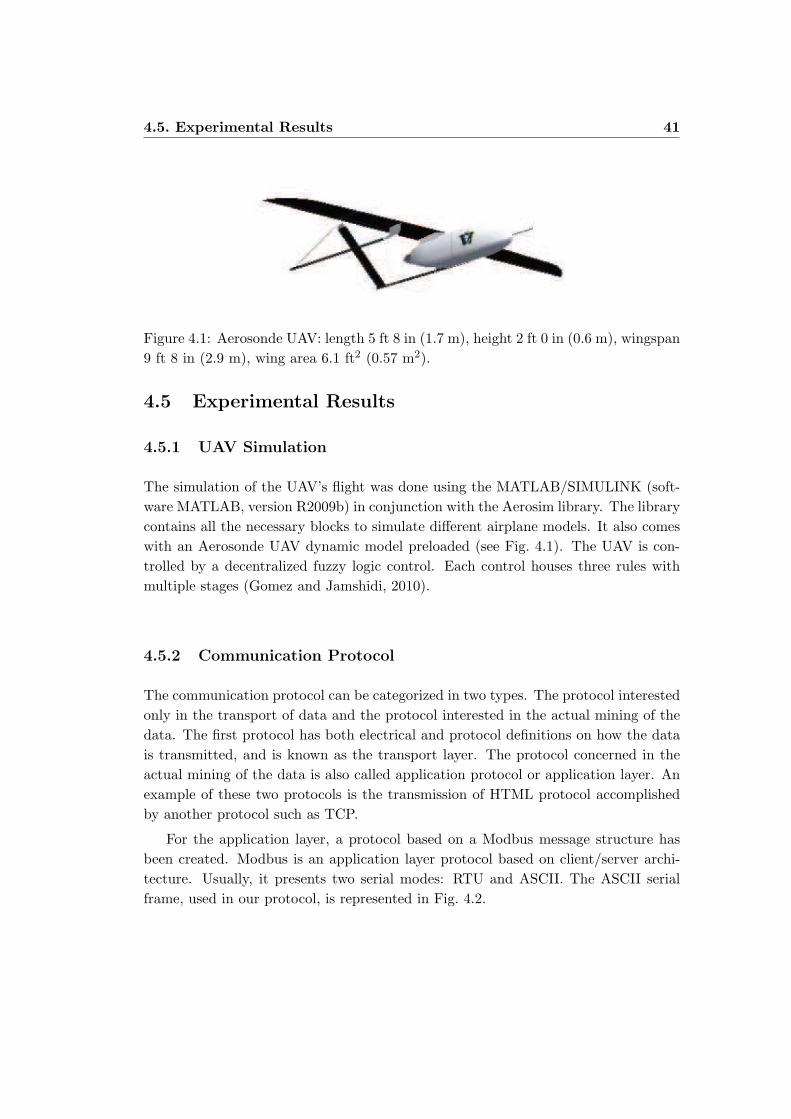
4.5. Experimental Results 41
Figure 4.1: Aerosonde UAV: length 5 ft 8 in (1.7 m), height 2 ft 0 in (0.6 m), wingspan9 ft 8 in (2.9 m), wing area 6.1 ft2 (0.57 m2).
4.5 Experimental Results
4.5.1 UAV Simulation
The simulation of the UAV’s flight was done using the MATLAB/SIMULINK (soft-ware MATLAB, version R2009b) in conjunction with the Aerosim library. The librarycontains all the necessary blocks to simulate different airplane models. It also comeswith an Aerosonde UAV dynamic model preloaded (see Fig. 4.1). The UAV is con-trolled by a decentralized fuzzy logic control. Each control houses three rules withmultiple stages (Gomez and Jamshidi, 2010).
4.5.2 Communication Protocol
The communication protocol can be categorized in two types. The protocol interestedonly in the transport of data and the protocol interested in the actual mining of thedata. The first protocol has both electrical and protocol definitions on how the datais transmitted, and is known as the transport layer. The protocol concerned in theactual mining of the data is also called application protocol or application layer. Anexample of these two protocols is the transmission of HTML protocol accomplishedby another protocol such as TCP.
For the application layer, a protocol based on a Modbus message structure hasbeen created. Modbus is an application layer protocol based on client/server archi-tecture. Usually, it presents two serial modes: RTU and ASCII. The ASCII serialframe, used in our protocol, is represented in Fig. 4.2.
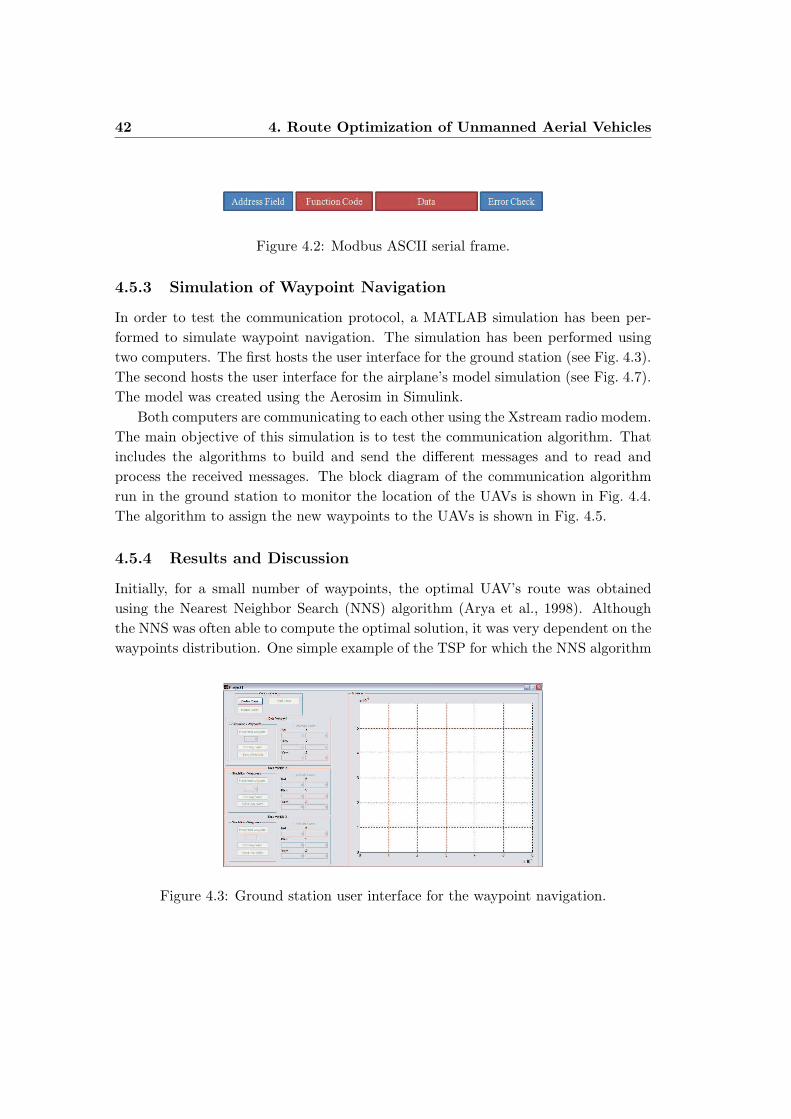
42 4. Route Optimization of Unmanned Aerial Vehicles
Figure 4.2: Modbus ASCII serial frame.
4.5.3 Simulation of Waypoint Navigation
In order to test the communication protocol, a MATLAB simulation has been per-formed to simulate waypoint navigation. The simulation has been performed usingtwo computers. The first hosts the user interface for the ground station (see Fig. 4.3).The second hosts the user interface for the airplane’s model simulation (see Fig. 4.7).The model was created using the Aerosim in Simulink.
Both computers are communicating to each other using the Xstream radio modem.The main objective of this simulation is to test the communication algorithm. Thatincludes the algorithms to build and send the different messages and to read andprocess the received messages. The block diagram of the communication algorithmrun in the ground station to monitor the location of the UAVs is shown in Fig. 4.4.The algorithm to assign the new waypoints to the UAVs is shown in Fig. 4.5.
4.5.4 Results and Discussion
Initially, for a small number of waypoints, the optimal UAV’s route was obtainedusing the Nearest Neighbor Search (NNS) algorithm (Arya et al., 1998). Althoughthe NNS was often able to compute the optimal solution, it was very dependent on thewaypoints distribution. One simple example of the TSP for which the NNS algorithm
Figure 4.3: Ground station user interface for the waypoint navigation.
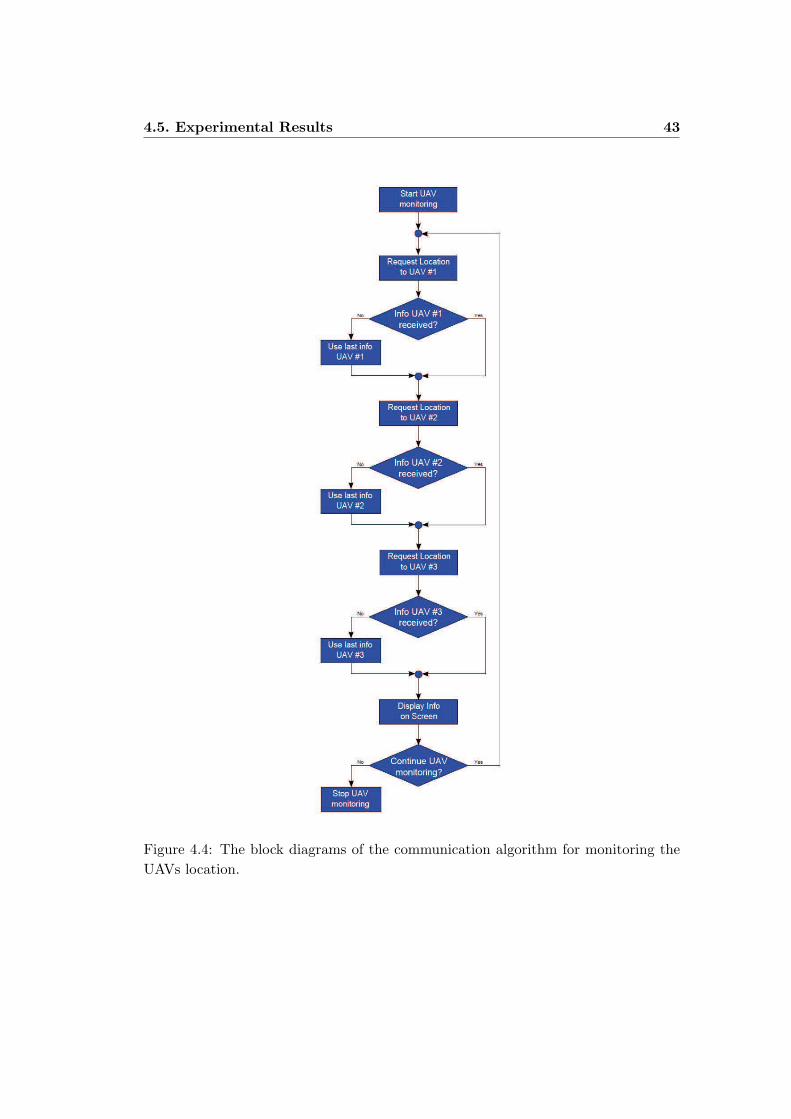
4.5. Experimental Results 43
Figure 4.4: The block diagrams of the communication algorithm for monitoring theUAVs location.

44 4. Route Optimization of Unmanned Aerial Vehicles
Figure 4.5: The block diagram of the communication algorithm for assigning the newwaypoints to the UAVs.
is not able to compute the optimal solution is shown in Fig. 4.6.
In our experiments, the Ant System (AS) algorithm was used to calculate theoptimal route in the base and send the arranged list of waypoints to UAVs to performthe flight. The comparison of the results of NNS and AS algorithms is shown in Ta-ble 4.1. The number of waypoints shown in the first column was randomly distributed
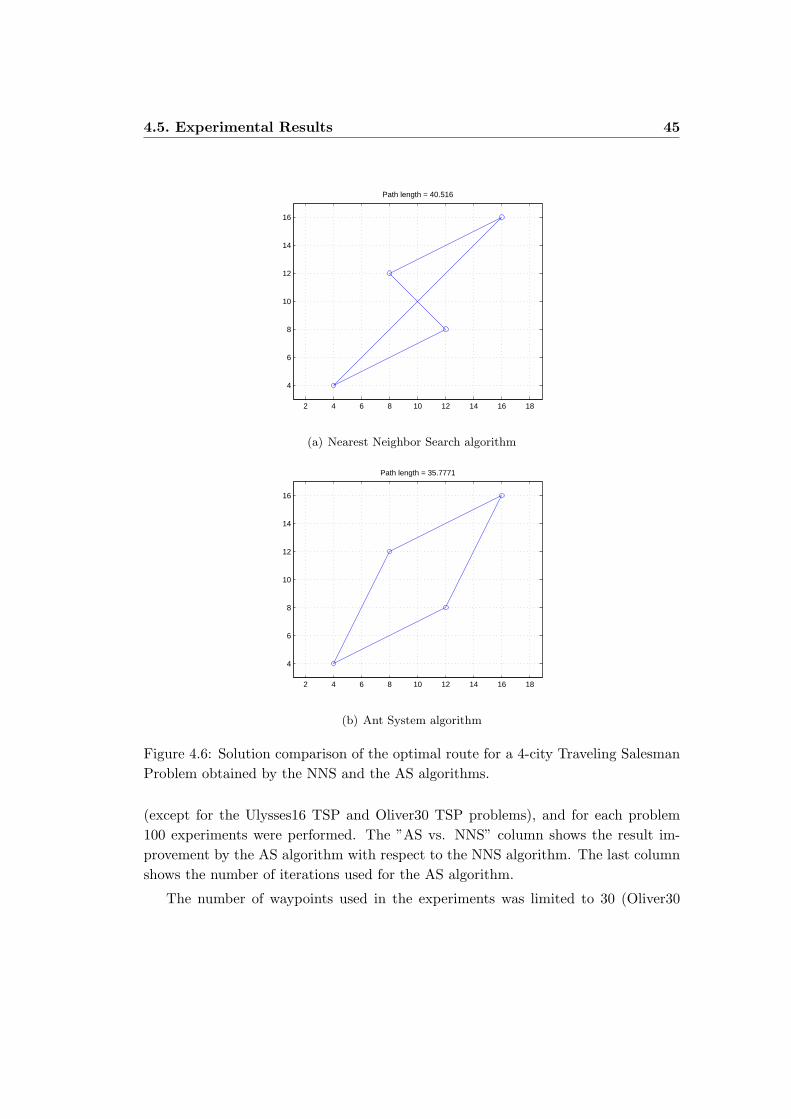
4.5. Experimental Results 45
2 4 6 8 10 12 14 16 18
4
6
8
10
12
14
16
Path length = 40.516
(a) Nearest Neighbor Search algorithm
2 4 6 8 10 12 14 16 18
4
6
8
10
12
14
16
Path length = 35.7771
(b) Ant System algorithm
Figure 4.6: Solution comparison of the optimal route for a 4-city Traveling SalesmanProblem obtained by the NNS and the AS algorithms.
(except for the Ulysses16 TSP and Oliver30 TSP problems), and for each problem100 experiments were performed. The ”AS vs. NNS” column shows the result im-provement by the AS algorithm with respect to the NNS algorithm. The last columnshows the number of iterations used for the AS algorithm.
The number of waypoints used in the experiments was limited to 30 (Oliver30

46 4. Route Optimization of Unmanned Aerial Vehicles
Table 4.1: Comparison of the Results for the NNS and AS algorithmsNo. of Distance NNS AS AS Improvement No. of
waypoints type best best average by AS [%] iter.4 euclid 99.89 99.89 99.89 0.00 4005 euclid 158.88 158.88 158.88 0.00 5006 euclid 181.41 181.41 181.41 0.00 6007 euclid 295.36 280.83 280.83 4.92 7008 euclid 271.98 262.03 262.03 3.66 8009 euclid 244.77 239.63 239.63 2.10 90010 euclid 349.32 325.85 325.85 6.72 100011 euclid 308.87 294.49 294.49 4.66 110012 euclid 325.19 323.41 323.41 0.55 120013 euclid 339.33 315.84 315.84 6.92 130014 euclid 385.24 378.92 378.92 1.64 140015 euclid 397.75 357.22 357.22 10.19 1500
16 (Ulysses16) geo 7835.00 6747.00 6747.00 13.89 300030 (Oliver30) euclid 473.33 423.74 423.76 10.48 3000
TSP) due to limited hardware resources for the UAV’s simulation, and also in practicalterms of UAV’s applications. The results in Table 4.1 show that AS outperforms NNS,especially for larger sets of waypoints. Since the solution obtained by NNS dependson the waypoints’ distribution that was random in the experiments, the solutionimprovement by the AS is not constant (in percentage) but it is notable and is risingfor the scenarios with larger numbers of waypoints.
The parameters α, β, ρ and Q directly or indirectly affect the probability definedin (4.1). The parameters α and β represent the relative importance of the pheromonetrail on the edge and the visibility of the node, respectively. By changing their valueswe bias the ants to exploit the knowledge contained in the accumulated pheromonetrails or explore new solutions. The parameter ρ is the pheromone evaporation ratethat prevents the algorithm stagnation, which would be a result of the amplificationof the initial solution. The constant Q is related to the pheromone trail laid by theants after constructing a solution. The set of values used in the experiments is basedon the experimental setup described in (Dorigo et al., 1996): α = 1, β = 5, ρ = 0.5and Q = 100.

4.5. Experimental Results 47
(a) Simulation start
(b) Simulation end
Figure 4.7: UAV flight simulation for four waypoints.
The number of iterations for AS was proportional to the number of waypoints(multiplied by 100). This value was empirically obtained, and it can be seen from theresults in Table 4.1 that the average AS results are equal to the best AS results, whichmeans that the ant colony was able to find the optimal solution in every experiment(except for the Oliver30 TSP).
In Fig. 4.7 the user interface frames from the start and the end of the UAV’s flightsimulation are shown. The 4-waypoint set was used for which the NNS algorithm doesnot give the optimal solution. It can be noticed that the UAV’s route is not a straightline connecting the waypoints, which comes as a result of the dynamic model of thevehicle.
48 4. Route Optimization of Unmanned Aerial Vehicles
4.6 Summary
In this chapter, the Ant System algorithm was applied to the route optimization ofthe UAVs in the simulated area coverage scenario. The experimental results showthat the algorithm outperformed the Nearest Neighbor Search algorithm that wasinitially used to find the optimal route. The interest for the usage of the UAVs incommercial applications is on the rise and the method proposed in this chapter is animprovement in terms of time and energy consumption for the UAV’s flight. Thiscan be of great importance in applications where a large number of UAVs is used, orwhen a prompt action is needed and the resources are scarce.
The problem of the UAV’s route optimization served as a testbed for the SwarmIntelligence-based optimization tool and the proposed design methodology. It is alsoan illustrative example that will help understand the underlying principles of thenovel tools for feature extraction and multi-agent system modeling proposed in thefollowing chapters.
Chapter 5
Adaptive Edge Detection in
Digital Images
5.1 Introduction
Edge detection is a pre-processing step in applications of image segmentation andcomputer vision. It transforms the input image to a binary image that indicateseither the presence or the absence of an edge. Therefore, the edge detectors representa special group of search algorithms with the objective of finding the pixels belongingto true edges. The search is performed following certain criteria, as the edge pixels arefound in regions of an image where the distinct intensity changes or discontinuitiesoccur (e.g. in color, gray-intensity level, texture, etc.).
The purpose of edge detection is to segment the image in order to extract thefeatures or the regions of interest. No matter what method is applied, the objectiveremains the same, to change the representation of the original image into somethingeasier to analyze. But digital images can be obtained under different lighting condi-tions and by applying different techniques, which may produce noise and deterioratethe segmentation results. Various edge detectors apply different approaches to addressthese issues.
In recent years, the algorithms based on the swarming behavior of animal coloniesin nature have been applied to edge detection. Swarm-based algorithms use thebottom-up approach where the patterns that appear at the system level are the resultof the local interactions between its lower-level components. Although the initialpurpose of these algorithms was to solve optimization problems, they proved to bea useful image processing tool. The inherent emerging properties of the, so called,
50 5. Adaptive Edge Detection in Digital Images
Swarm Intelligence approach make these algorithms adaptive to changes in digitalimage habitat. This can serve as a useful feature when it comes to real-time imageprocessing.
In this chapter, two edge-detection algorithms inspired by the foraging behaviorof natural ant colonies are presented. The ants use pheromone trails to mark thepath to the food source. In case of digital images, pixels define the discrete space inwhich the artificial ants move, and the pixels belonging to true edges represent thefood. The edge detection operation is performed on a set of grayscale images. Thefirst proposed algorithm extracts the edges from the original grayscale image, whilethe other is applied to finding the missing parts of the broken edges and can be usedas a complementary tool to any of the existing edge detectors. Finally, the study onthe adaptability of the ant-based edge detector is performed where a set of grayscaleimages is used to create a variable environment.
The chapter is organized as follows. Section 5.2 provides an overview of the state-of-the-art edge detectors. In Section 5.3 the proposed Ant System-based edge detectoris described. The discussion of the simulation results is also given in this section.Follows the description of the proposed broken-edge linking algorithm in Section 5.4.The simulation results are also presented in this section. The study on the adaptabilityof the proposed Ant System-based edge detector is given in Section 5.5. Finally, inSection 5.6 the conclusions are made.
5.2 Related Work
Edges represent important contour features in the image since they are the boundarieswhere distinct intensity changes or discontinuities occur. In practice, it is difficult todesign an edge detector capable of finding all the true edges in image. The edgedetectors give ambiguous information about the location of object boundaries forwhich they are usually subjectively evaluated by the observers (Shin et al., 2001).
Various edge detection methods have been proposed in literature. The Prewittoperator (Prewitt, 1970) was proposed to extract contour features by fitting a LeastSquares Error (LSE) quadratic surface over a 3×3 image window and differentiate thefitted surface. The edge detectors proposed by Sobel and Feldman (1968) or Canny(1986) use local gradient operators, sometimes with additional smoothing for noiseremoval. The Laplacian operator (Gonzalez and Woods, 2008) uses a second orderdifferential operator to find edge points based on the zero crossing properties of theprocessed edge points.
5.3. Ant System-based Edge Detector 51
Although conventional edge detectors usually perform linear filtering operations,there are various nonlinear methods proposed. Panetta et al. (2008) proposed an edgedetection method based on the Parameterized Logarithmic Image Processing (PLIP)and a four directional Sobel detector, achieving a higher level of independence fromscene illumination. He et al. (2006) presented an edge detector based on bilateralfiltering which achieves better performance than single Gaussian filtering. Mertziosand Tsirikolias (2001) proposed using the Coordinate Logic Filters (CLF) in orderto extract the edges from images. CLF constitute a class of nonlinear digital filtersthat are based on the execution of Coordinate Logic Operations (CLO). Danahy et al.(2007) introduced an alternative method for calculating CLF using Coordinate LogicTransforms (CLT) and presented a new measure and thresholding technique for thedetection of edges in grayscale images.
ACO algorithms have also been applied to image processing. Some of the pro-posed applications include image retrieval (Ramos et al., 2002) and image segmenta-tion (Huang et al., 2008; Khajehpour et al., 2005). Several ACO-based edge detectionmethods have also been proposed in literature. Among others, these include modifi-cations to Ant System (AS) (Nezamabadi-pour et al., 2006) or Ant Colony Systems(ACS) algorithms (Tian et al., 2008) for a digital image habitat, combined with localgray-intensity comparison for different pixel’s neighborhood matrices.
5.3 Ant System-based Edge Detector
In this section, the AS-based edge detector proposed in (Jevtic et al., 2009b) is pre-sented. The method requires that a set of images is extracted from the originalgrayscale image using a nonlinear image enhancement technique called MultiscaleAdaptive Gain (Laine et al., 1994), and then the modified AS algorithm is applied todetect the edges on each of the extracted images. The result is a set of pheromone-trail matrices which are summed to produce the output image. Threshold and edgethinning are finally applied to obtain a binary edge image. The block diagram of theproposed method is shown in Fig. 5.1.
5.3.1 Multiscale Adaptive Gain
Image enhancement techniques emphasize important features in the image while re-ducing the noise. Multiscale Adaptive Gain is applied to obtain contrast enhancementby suppressing the pixels with the gray-intensity values of very small amplitude and
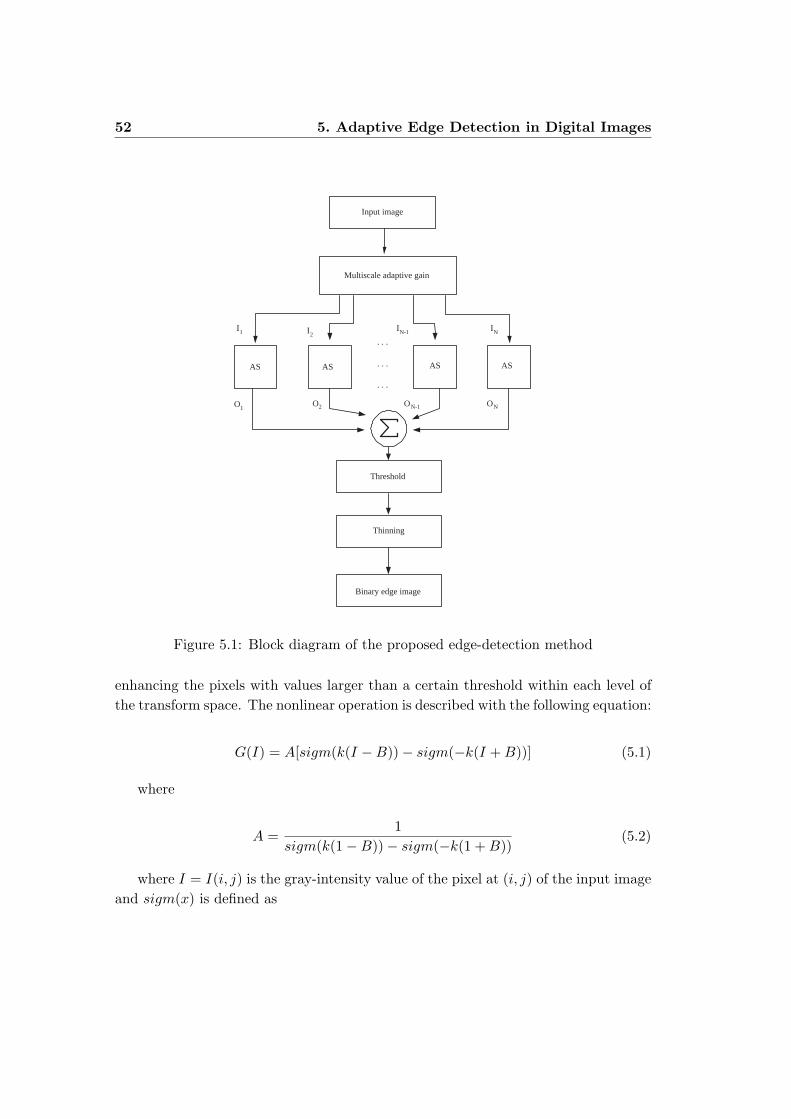
52 5. Adaptive Edge Detection in Digital Images
Input image
Multiscale adaptive gain
AS AS AS AS
Threshold
Thinning
Binary edge image
I 1 I 2 I N-1 I N
. . .
. . .
. . .
O 1 O 2 O N-1 O N
Figure 5.1: Block diagram of the proposed edge-detection method
enhancing the pixels with values larger than a certain threshold within each level ofthe transform space. The nonlinear operation is described with the following equation:
G(I) = A[sigm(k(I −B))− sigm(−k(I + B))] (5.1)
where
A =1
sigm(k(1−B))− sigm(−k(1 + B))(5.2)
where I = I(i, j) is the gray-intensity value of the pixel at (i, j) of the input imageand sigm(x) is defined as
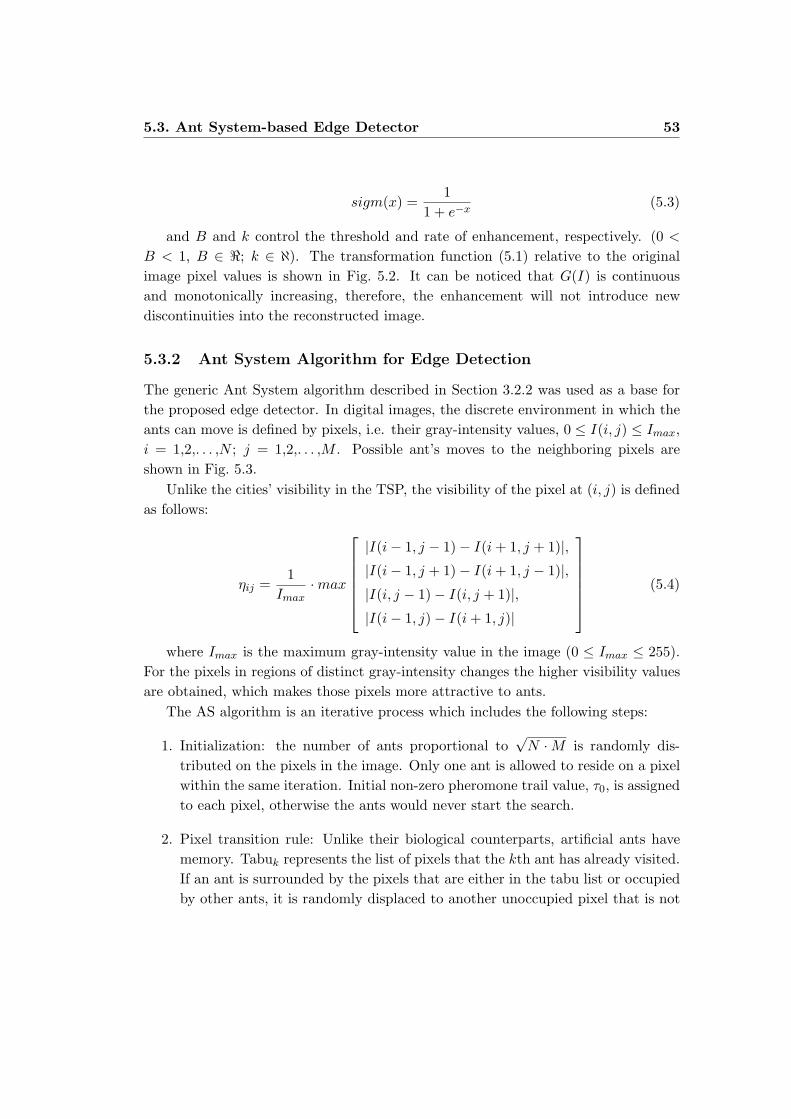
5.3. Ant System-based Edge Detector 53
sigm(x) =1
1 + e−x(5.3)
and B and k control the threshold and rate of enhancement, respectively. (0 <
B < 1, B ∈ <; k ∈ ℵ). The transformation function (5.1) relative to the originalimage pixel values is shown in Fig. 5.2. It can be noticed that G(I) is continuousand monotonically increasing, therefore, the enhancement will not introduce newdiscontinuities into the reconstructed image.
5.3.2 Ant System Algorithm for Edge Detection
The generic Ant System algorithm described in Section 3.2.2 was used as a base forthe proposed edge detector. In digital images, the discrete environment in which theants can move is defined by pixels, i.e. their gray-intensity values, 0 ≤ I(i, j) ≤ Imax,i = 1,2,. . . ,N ; j = 1,2,. . . ,M . Possible ant’s moves to the neighboring pixels areshown in Fig. 5.3.
Unlike the cities’ visibility in the TSP, the visibility of the pixel at (i, j) is definedas follows:
ηij =1
Imax·max
|I(i− 1, j − 1)− I(i + 1, j + 1)|,|I(i− 1, j + 1)− I(i + 1, j − 1)|,|I(i, j − 1)− I(i, j + 1)|,|I(i− 1, j)− I(i + 1, j)|
(5.4)
where Imax is the maximum gray-intensity value in the image (0 ≤ Imax ≤ 255).For the pixels in regions of distinct gray-intensity changes the higher visibility valuesare obtained, which makes those pixels more attractive to ants.
The AS algorithm is an iterative process which includes the following steps:
1. Initialization: the number of ants proportional to√
N ·M is randomly dis-tributed on the pixels in the image. Only one ant is allowed to reside on a pixelwithin the same iteration. Initial non-zero pheromone trail value, τ0, is assignedto each pixel, otherwise the ants would never start the search.
2. Pixel transition rule: Unlike their biological counterparts, artificial ants havememory. Tabuk represents the list of pixels that the kth ant has already visited.If an ant is surrounded by the pixels that are either in the tabu list or occupiedby other ants, it is randomly displaced to another unoccupied pixel that is not

54 5. Adaptive Edge Detection in Digital Images
−1 −0.8 −0.6 −0.4 −0.2 0 0.2 0.4 0.6 0.8 1−1
−0.8
−0.6
−0.4
−0.2
0
0.2
0.4
0.6
0.8
1
Input image
Out
put i
mag
e
G(I) = IB = 0.45 k = 10B = 0.45 k = 20B = 0.45 k = 40
(a)
−1 −0.8 −0.6 −0.4 −0.2 0 0.2 0.4 0.6 0.8 1−1
−0.8
−0.6
−0.4
−0.2
0
0.2
0.4
0.6
0.8
1
Input image
Out
put i
mag
e
G(I) = IB = 0.2 k = 20B = 0.45 k = 20B = 0.7 k = 20
(b)
Figure 5.2: Transformation function G(I) in respect to the original image pixel values:(a) B = 0.45; k = 10, 20 and 40; (b) B = 0.2, 0.45 and 0.7; k = 20.
found in the tabu list. Otherwise, the probability for the kth ant to move to a
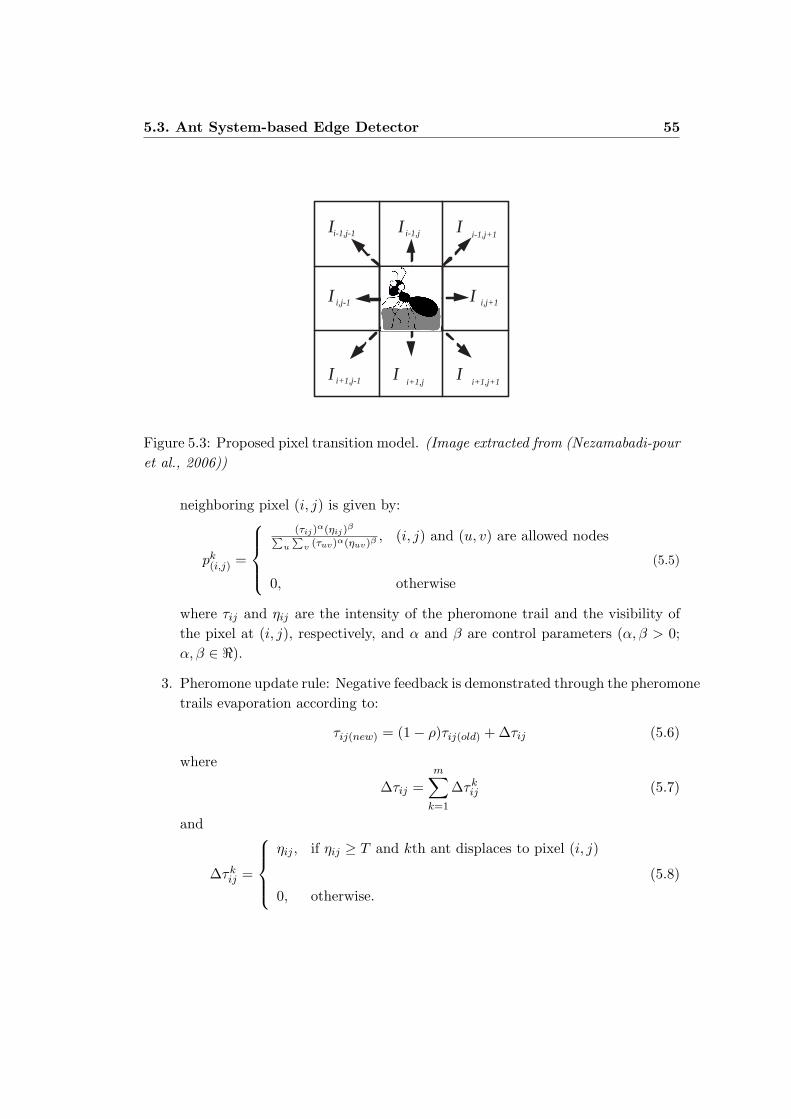
5.3. Ant System-based Edge Detector 55
I I I
I I
I I I
i-1,j-1 i-1,j i-1,j+1
i,j-1
i+1,j-1 i+1,j
i,j+1
i+1,j+1
Figure 5.3: Proposed pixel transition model. (Image extracted from (Nezamabadi-pouret al., 2006))
neighboring pixel (i, j) is given by:
pk(i,j) =
(τij)α(ηij)
β∑
u
∑v (τuv)α(ηuv)β , (i, j) and (u, v) are allowed nodes
0, otherwise
(5.5)
where τij and ηij are the intensity of the pheromone trail and the visibility ofthe pixel at (i, j), respectively, and α and β are control parameters (α, β > 0;α, β ∈ <).
3. Pheromone update rule: Negative feedback is demonstrated through the pheromonetrails evaporation according to:
τij(new) = (1− ρ)τij(old) + ∆τij (5.6)
where
∆τij =m∑
k=1
∆τkij (5.7)
and
∆τkij =
ηij , if ηij ≥ T and kth ant displaces to pixel (i, j)
0, otherwise.
(5.8)
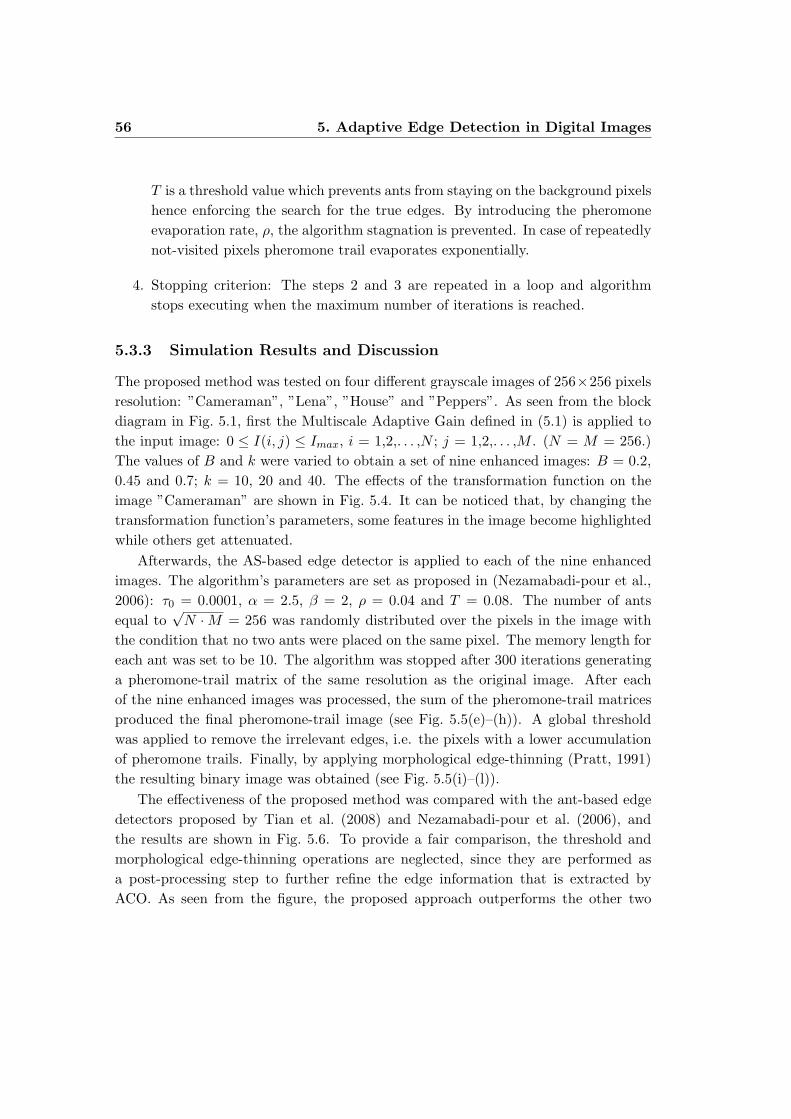
56 5. Adaptive Edge Detection in Digital Images
T is a threshold value which prevents ants from staying on the background pixelshence enforcing the search for the true edges. By introducing the pheromoneevaporation rate, ρ, the algorithm stagnation is prevented. In case of repeatedlynot-visited pixels pheromone trail evaporates exponentially.
4. Stopping criterion: The steps 2 and 3 are repeated in a loop and algorithmstops executing when the maximum number of iterations is reached.
5.3.3 Simulation Results and Discussion
The proposed method was tested on four different grayscale images of 256×256 pixelsresolution: ”Cameraman”, ”Lena”, ”House” and ”Peppers”. As seen from the blockdiagram in Fig. 5.1, first the Multiscale Adaptive Gain defined in (5.1) is applied tothe input image: 0 ≤ I(i, j) ≤ Imax, i = 1,2,. . . ,N ; j = 1,2,. . . ,M . (N = M = 256.)The values of B and k were varied to obtain a set of nine enhanced images: B = 0.2,0.45 and 0.7; k = 10, 20 and 40. The effects of the transformation function on theimage ”Cameraman” are shown in Fig. 5.4. It can be noticed that, by changing thetransformation function’s parameters, some features in the image become highlightedwhile others get attenuated.
Afterwards, the AS-based edge detector is applied to each of the nine enhancedimages. The algorithm’s parameters are set as proposed in (Nezamabadi-pour et al.,2006): τ0 = 0.0001, α = 2.5, β = 2, ρ = 0.04 and T = 0.08. The number of antsequal to
√N ·M = 256 was randomly distributed over the pixels in the image with
the condition that no two ants were placed on the same pixel. The memory length foreach ant was set to be 10. The algorithm was stopped after 300 iterations generatinga pheromone-trail matrix of the same resolution as the original image. After eachof the nine enhanced images was processed, the sum of the pheromone-trail matricesproduced the final pheromone-trail image (see Fig. 5.5(e)–(h)). A global thresholdwas applied to remove the irrelevant edges, i.e. the pixels with a lower accumulationof pheromone trails. Finally, by applying morphological edge-thinning (Pratt, 1991)the resulting binary image was obtained (see Fig. 5.5(i)–(l)).
The effectiveness of the proposed method was compared with the ant-based edgedetectors proposed by Tian et al. (2008) and Nezamabadi-pour et al. (2006), andthe results are shown in Fig. 5.6. To provide a fair comparison, the threshold andmorphological edge-thinning operations are neglected, since they are performed asa post-processing step to further refine the edge information that is extracted byACO. As seen from the figure, the proposed approach outperforms the other two
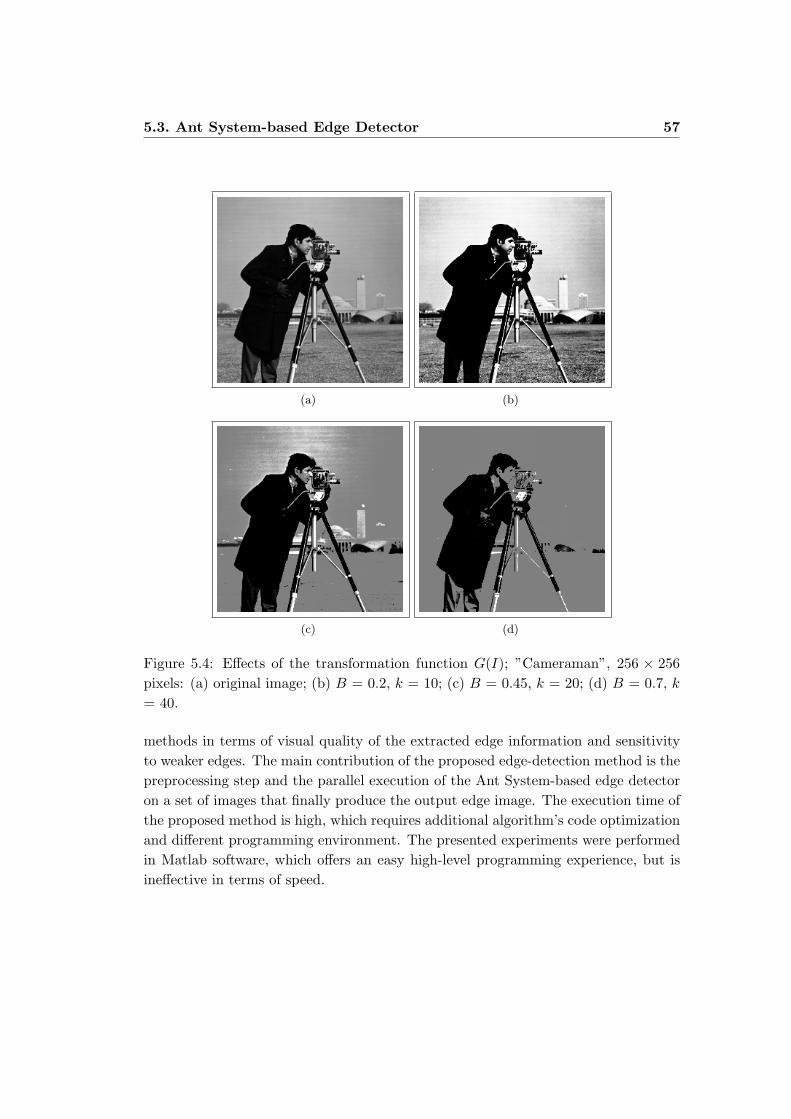
5.3. Ant System-based Edge Detector 57
(a) (b)
(c) (d)
Figure 5.4: Effects of the transformation function G(I); ”Cameraman”, 256 × 256pixels: (a) original image; (b) B = 0.2, k = 10; (c) B = 0.45, k = 20; (d) B = 0.7, k
= 40.
methods in terms of visual quality of the extracted edge information and sensitivityto weaker edges. The main contribution of the proposed edge-detection method is thepreprocessing step and the parallel execution of the Ant System-based edge detectoron a set of images that finally produce the output edge image. The execution time ofthe proposed method is high, which requires additional algorithm’s code optimizationand different programming environment. The presented experiments were performedin Matlab software, which offers an easy high-level programming experience, but isineffective in terms of speed.
58 5. Adaptive Edge Detection in Digital Images
(a) (b) (c) (d)
(e) (f) (g) (h)
(i) (j) (k) (l)
Figure 5.5: Qualitative results of the proposed method, with 256 × 256 pixel im-ages: (a) ”Cameraman” original image; (b) ”House” original image; (c) ”Lena” orig-inal image; (d) ”Peppers” original image; (e) ”Cameraman” pheromone trail im-age; (f) ”Cameraman” edge image; (g) ”House” pheromone trail image; (h) ”Lena”pheromone trail image; (i) ”Peppers” pheromone trail image; (j) ”House” edge image;(k) ”Lena” edge image; (l) ”Peppers” edge image.
5.4 Ant System-based Broken-edge Linking Algorithm
Conventional image edge detection always results in missing edge segments. Broken-edge linking is an improvement technique that is complementary to edge detection. Itis used to connect the broken edges in order to form the closed contours that separate
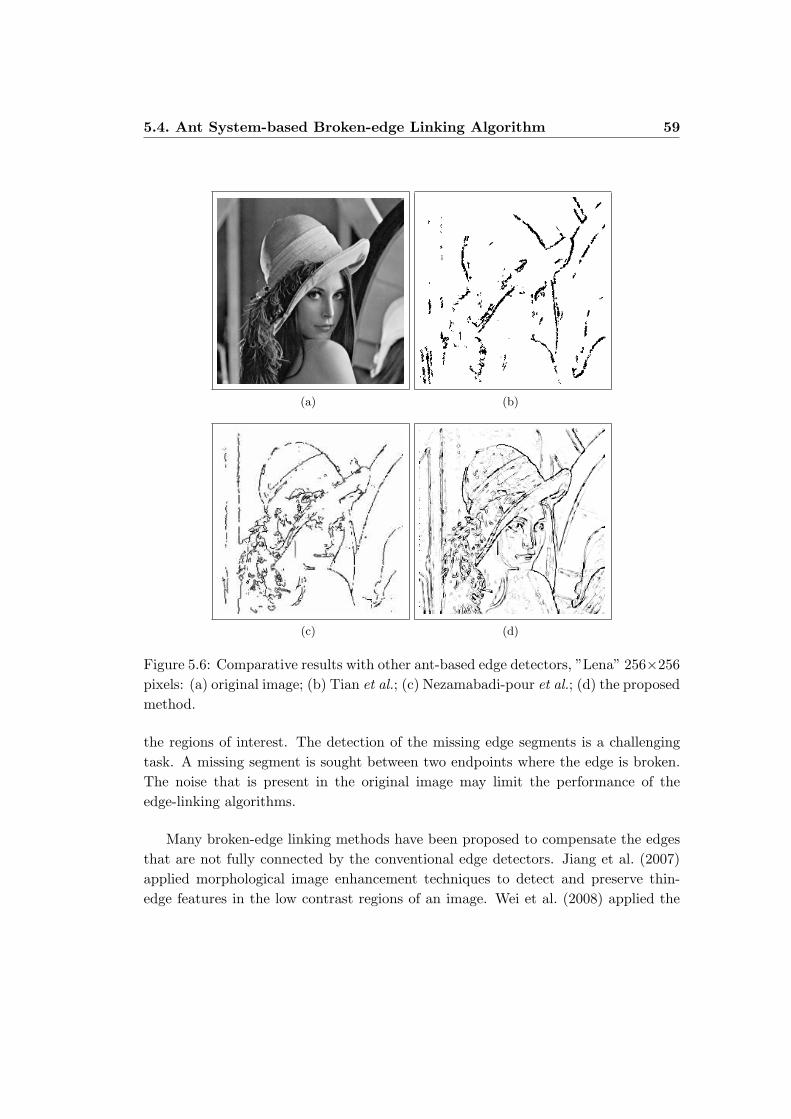
5.4. Ant System-based Broken-edge Linking Algorithm 59
(a) (b)
(c) (d)
Figure 5.6: Comparative results with other ant-based edge detectors, ”Lena” 256×256pixels: (a) original image; (b) Tian et al.; (c) Nezamabadi-pour et al.; (d) the proposedmethod.
the regions of interest. The detection of the missing edge segments is a challengingtask. A missing segment is sought between two endpoints where the edge is broken.The noise that is present in the original image may limit the performance of theedge-linking algorithms.
Many broken-edge linking methods have been proposed to compensate the edgesthat are not fully connected by the conventional edge detectors. Jiang et al. (2007)applied morphological image enhancement techniques to detect and preserve thin-edge features in the low contrast regions of an image. Wei et al. (2008) applied the
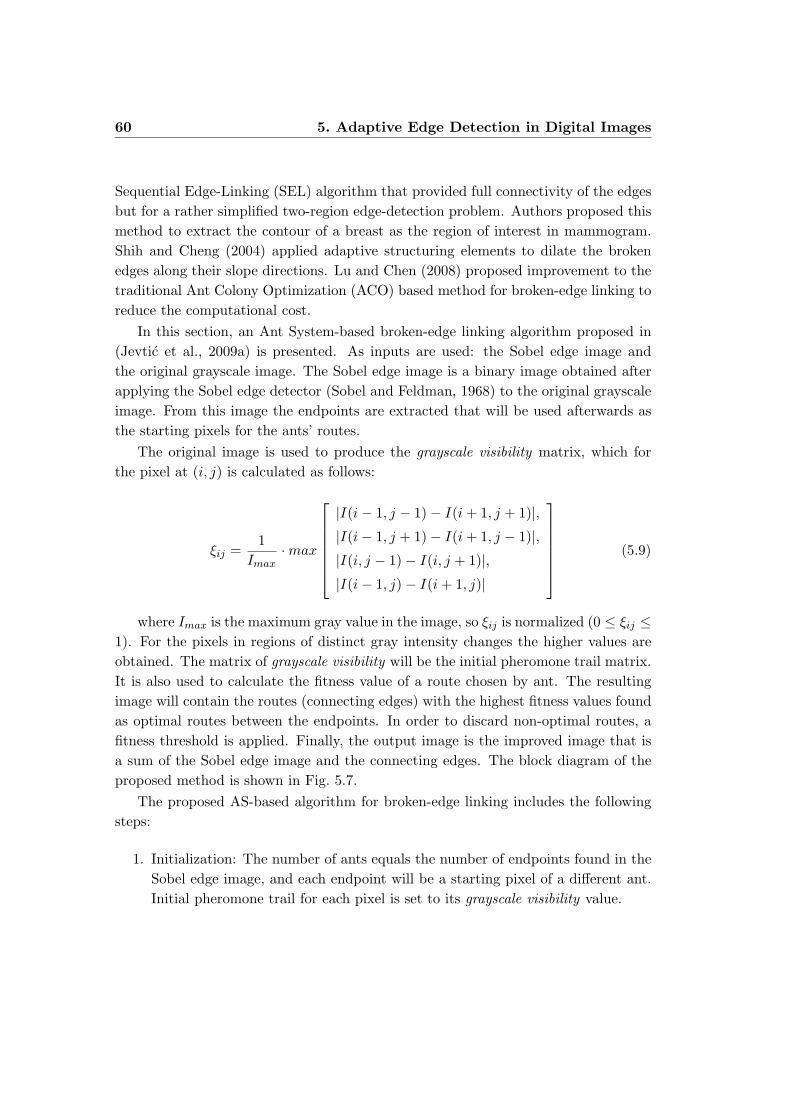
60 5. Adaptive Edge Detection in Digital Images
Sequential Edge-Linking (SEL) algorithm that provided full connectivity of the edgesbut for a rather simplified two-region edge-detection problem. Authors proposed thismethod to extract the contour of a breast as the region of interest in mammogram.Shih and Cheng (2004) applied adaptive structuring elements to dilate the brokenedges along their slope directions. Lu and Chen (2008) proposed improvement to thetraditional Ant Colony Optimization (ACO) based method for broken-edge linking toreduce the computational cost.
In this section, an Ant System-based broken-edge linking algorithm proposed in(Jevtic et al., 2009a) is presented. As inputs are used: the Sobel edge image andthe original grayscale image. The Sobel edge image is a binary image obtained afterapplying the Sobel edge detector (Sobel and Feldman, 1968) to the original grayscaleimage. From this image the endpoints are extracted that will be used afterwards asthe starting pixels for the ants’ routes.
The original image is used to produce the grayscale visibility matrix, which forthe pixel at (i, j) is calculated as follows:
ξij =1
Imax·max
|I(i− 1, j − 1)− I(i + 1, j + 1)|,|I(i− 1, j + 1)− I(i + 1, j − 1)|,|I(i, j − 1)− I(i, j + 1)|,|I(i− 1, j)− I(i + 1, j)|
(5.9)
where Imax is the maximum gray value in the image, so ξij is normalized (0 ≤ ξij ≤1). For the pixels in regions of distinct gray intensity changes the higher values areobtained. The matrix of grayscale visibility will be the initial pheromone trail matrix.It is also used to calculate the fitness value of a route chosen by ant. The resultingimage will contain the routes (connecting edges) with the highest fitness values foundas optimal routes between the endpoints. In order to discard non-optimal routes, afitness threshold is applied. Finally, the output image is the improved image that isa sum of the Sobel edge image and the connecting edges. The block diagram of theproposed method is shown in Fig. 5.7.
The proposed AS-based algorithm for broken-edge linking includes the followingsteps:
1. Initialization: The number of ants equals the number of endpoints found in theSobel edge image, and each endpoint will be a starting pixel of a different ant.Initial pheromone trail for each pixel is set to its grayscale visibility value.
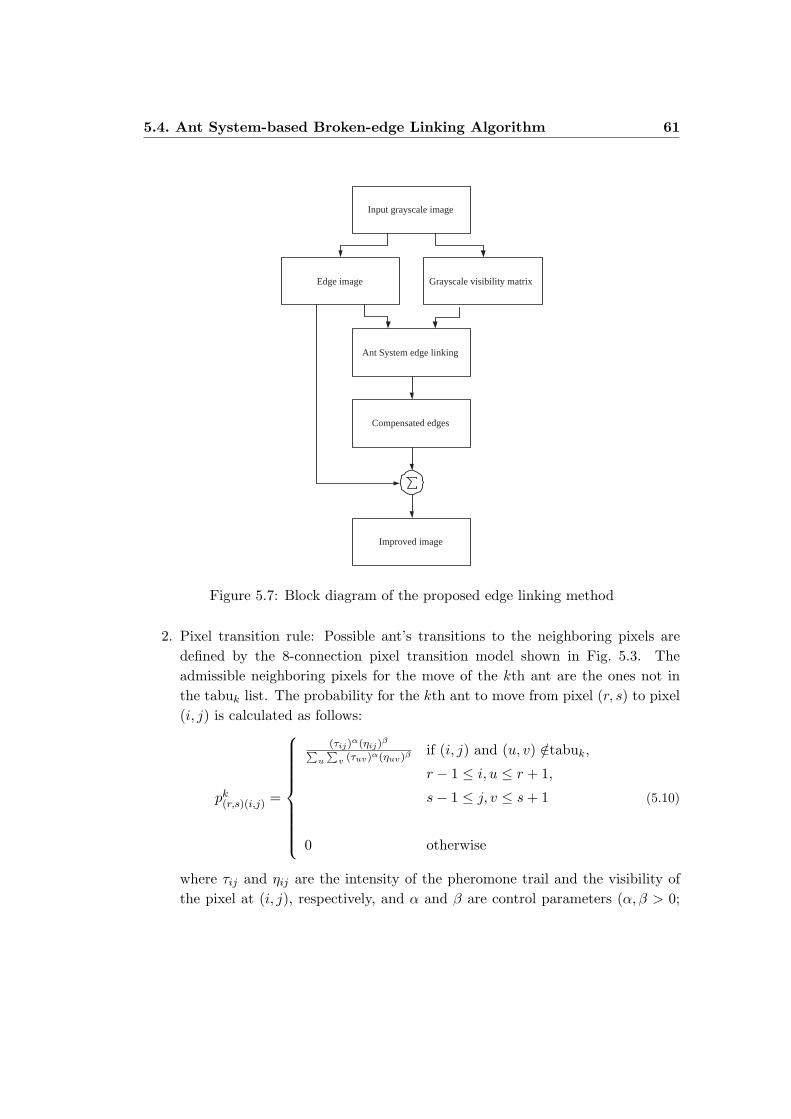
5.4. Ant System-based Broken-edge Linking Algorithm 61
Input grayscale image
Ant System edge linking
Edge image
Compensated edges
Improved image
Grayscale visibility matrix
Figure 5.7: Block diagram of the proposed edge linking method
2. Pixel transition rule: Possible ant’s transitions to the neighboring pixels aredefined by the 8-connection pixel transition model shown in Fig. 5.3. Theadmissible neighboring pixels for the move of the kth ant are the ones not inthe tabuk list. The probability for the kth ant to move from pixel (r, s) to pixel(i, j) is calculated as follows:
pk(r,s)(i,j) =
(τij)α(ηij)
β∑
u
∑v (τuv)α(ηuv)β if (i, j) and (u, v) /∈tabuk,
r − 1 ≤ i, u ≤ r + 1,
s− 1 ≤ j, v ≤ s + 1
0 otherwise
(5.10)
where τij and ηij are the intensity of the pheromone trail and the visibility ofthe pixel at (i, j), respectively, and α and β are control parameters (α, β > 0;

62 5. Adaptive Edge Detection in Digital Images
α, β ∈ <). The visibility of a pixel should not be misinterpreted as its grayscalevisibility, and for the pixel at (i, j) it is defined as:
ηij =1
dij(5.11)
where dij is the Euclidean distance of the pixel at (i, j) from the closest endpoint.
3. Pheromone update rule: Negative feedback is created through the pheromonetrails evaporation according to:
τij(new) = (1− ρ)τij(old) + ∆τij (5.12)
where ρ is the pheromone evaporation rate (0 < ρ < 1; ρ ∈ <), and
∆τij =m∑
k=1
∆τkij (5.13)
where
∆τkij =
fkQ if kth ant displaces to pixel (i, j)
0 otherwise.
(5.14)
The fitness value of a pixel, fk, is equal to the fitness value of the route itbelongs to, and it is defined by the following equation:
fk =ξ
σξ ·Np(5.15)
where ξ and σξ are the mean value and the standard deviation of the grayscalevisibility of the pixels in the route, and Np is the total number of pixels belongingto that route. Pheromone evaporation prevents algorithm stagnation. From therepeatedly not-visited pixels the pheromone trail evaporates exponentially.
4. Stopping criterion: The steps 2 and 3 are repeated in a loop and algorithm stopsexecuting when the maximum number of iterations is reached. An iteration endswhen all the ants finish the search for the endpoints, by either finding one orgetting stuck and being unable to advance to any adjacent pixel.
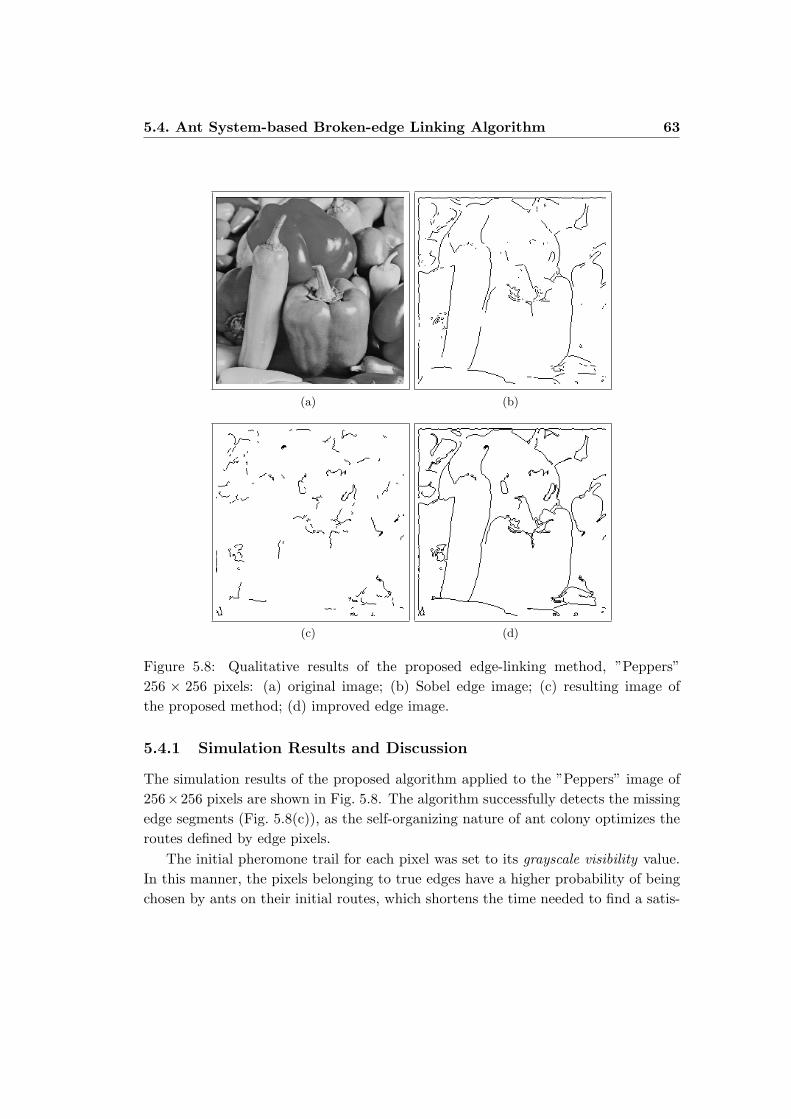
5.4. Ant System-based Broken-edge Linking Algorithm 63
(a) (b)
(c) (d)
Figure 5.8: Qualitative results of the proposed edge-linking method, ”Peppers”256 × 256 pixels: (a) original image; (b) Sobel edge image; (c) resulting image ofthe proposed method; (d) improved edge image.
5.4.1 Simulation Results and Discussion
The simulation results of the proposed algorithm applied to the ”Peppers” image of256×256 pixels are shown in Fig. 5.8. The algorithm successfully detects the missingedge segments (Fig. 5.8(c)), as the self-organizing nature of ant colony optimizes theroutes defined by edge pixels.
The initial pheromone trail for each pixel was set to its grayscale visibility value.In this manner, the pixels belonging to true edges have a higher probability of beingchosen by ants on their initial routes, which shortens the time needed to find a satis-
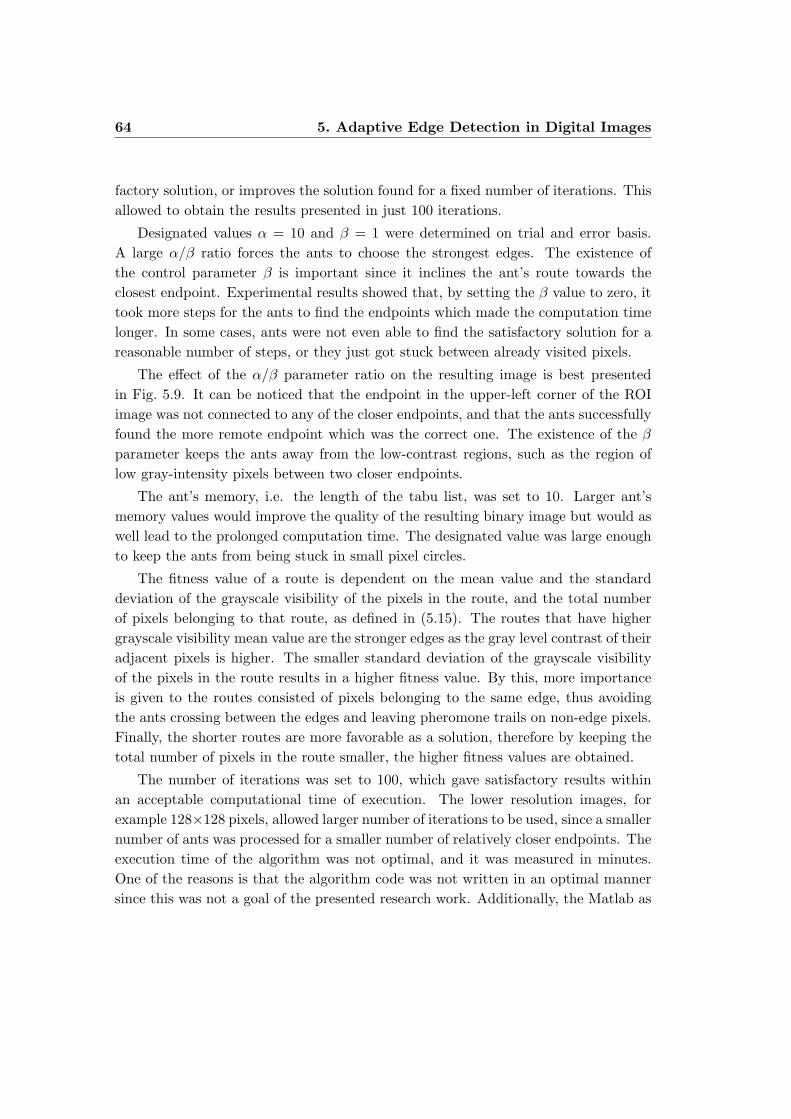
64 5. Adaptive Edge Detection in Digital Images
factory solution, or improves the solution found for a fixed number of iterations. Thisallowed to obtain the results presented in just 100 iterations.
Designated values α = 10 and β = 1 were determined on trial and error basis.A large α/β ratio forces the ants to choose the strongest edges. The existence ofthe control parameter β is important since it inclines the ant’s route towards theclosest endpoint. Experimental results showed that, by setting the β value to zero, ittook more steps for the ants to find the endpoints which made the computation timelonger. In some cases, ants were not even able to find the satisfactory solution for areasonable number of steps, or they just got stuck between already visited pixels.
The effect of the α/β parameter ratio on the resulting image is best presentedin Fig. 5.9. It can be noticed that the endpoint in the upper-left corner of the ROIimage was not connected to any of the closer endpoints, and that the ants successfullyfound the more remote endpoint which was the correct one. The existence of the β
parameter keeps the ants away from the low-contrast regions, such as the region oflow gray-intensity pixels between two closer endpoints.
The ant’s memory, i.e. the length of the tabu list, was set to 10. Larger ant’smemory values would improve the quality of the resulting binary image but would aswell lead to the prolonged computation time. The designated value was large enoughto keep the ants from being stuck in small pixel circles.
The fitness value of a route is dependent on the mean value and the standarddeviation of the grayscale visibility of the pixels in the route, and the total numberof pixels belonging to that route, as defined in (5.15). The routes that have highergrayscale visibility mean value are the stronger edges as the gray level contrast of theiradjacent pixels is higher. The smaller standard deviation of the grayscale visibilityof the pixels in the route results in a higher fitness value. By this, more importanceis given to the routes consisted of pixels belonging to the same edge, thus avoidingthe ants crossing between the edges and leaving pheromone trails on non-edge pixels.Finally, the shorter routes are more favorable as a solution, therefore by keeping thetotal number of pixels in the route smaller, the higher fitness values are obtained.
The number of iterations was set to 100, which gave satisfactory results withinan acceptable computational time of execution. The lower resolution images, forexample 128×128 pixels, allowed larger number of iterations to be used, since a smallernumber of ants was processed for a smaller number of relatively closer endpoints. Theexecution time of the algorithm was not optimal, and it was measured in minutes.One of the reasons is that the algorithm code was not written in an optimal mannersince this was not a goal of the presented research work. Additionally, the Matlab as
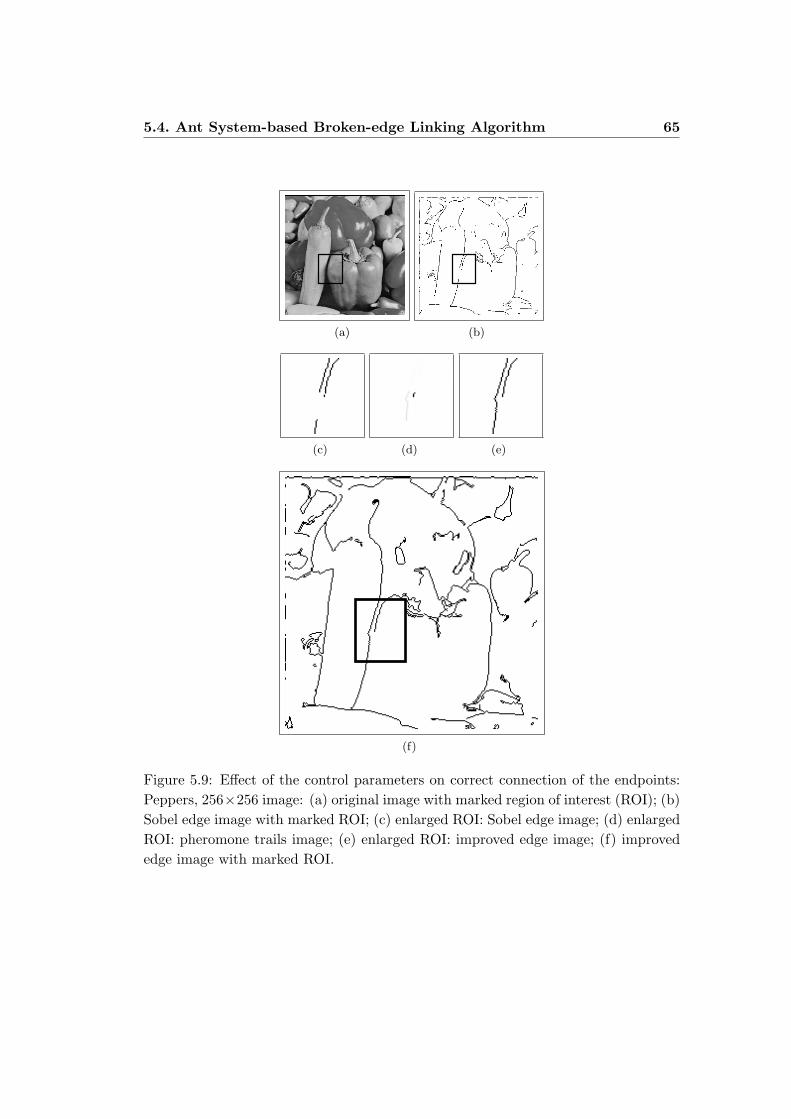
5.4. Ant System-based Broken-edge Linking Algorithm 65
(a) (b)
(c) (d) (e)
(f)
Figure 5.9: Effect of the control parameters on correct connection of the endpoints:Peppers, 256×256 image: (a) original image with marked region of interest (ROI); (b)Sobel edge image with marked ROI; (c) enlarged ROI: Sobel edge image; (d) enlargedROI: pheromone trails image; (e) enlarged ROI: improved edge image; (f) improvededge image with marked ROI.
66 5. Adaptive Edge Detection in Digital Images
a programming environment is not intended for a fast code execution, rather for aneasy high-level programming experience.
In order to test the proposed method on different input images, simulations wereperformed on ”House”, ”Lena” and ”Cameraman” images of size 256 × 256 pixels.The results confirm the effectiveness of the method, as shown in Fig. 5.10. It can benoticed that the found edge segments are often not unidirectional, which indicatesthat the fitness function was adequately defined and the ants found the true edges.
The main contribution of the proposed broken-edge-linking method is that it offersa different approach to solving this problem, which is based on the emergent behaviorof the artificial ant colony. The comparison with the state-of-the-art methods wasnot presented, since the edge detection solutions are in most of the cases subjectivelyevaluated by the observer.
5.5 Adaptability of the Artificial Ant Colony
In recent years, Swarm Intelligence algorithms have shown their full potential in termsof flexibility and autonomy, especially concerning the design and control of complexsystems that consist of a large number of agents. These algorithms demonstrate emer-gent behavior that results from the interactions of their lower-level components. Theytend to be decentralized, self-organized, autonomous and adaptive to the changes intheir environment. The adaptability and the ability to learn are very important forsystems that are designed to be autonomous.
The learning ability, as in natural as in artificial ant colonies, consists in pheromonetrails that ants lay while searching for food. The structures that emerge from the ac-cumulated pheromone trails serve as a sort of colony’s external memory that can beused by any of its members. Even though a single ant has no knowledge of the globalpatterns, the designer of such a swarm-based system is a privileged observer of theemergence that comes as a result of the cooperative behavior.
The resulting mass behavior in swarms is hard to predict. Although the adaptabil-ity can be demonstrated on a variety of applications such as in image segmentation(Ramos and Almeida, 2000), a general theoretical framework on design and controlof swarms does not exist. Artificial swarms use the bottom-up approach, meaningthat the designer of such a system needs to set the rules for local interactions betweenthe agents themselves and, if required, between the agents and the environment. Theindirect communication via environment is referred to as stigmergy, and in case of antcolonies, it consists in pheromone-laying and pheromone-following. For each specific
5.5. Adaptability of the Artificial Ant Colony 67
(a) (b) (c) (d)
(e) (f) (g) (h)
(i) (j) (k) (l)
Figure 5.10: Qualitative results of the proposed method, 256× 256-pixel images: (a)”House” original image; (b) ”House”: Sobel edge image; (c) ”House”: result of theproposed method; (d) ”House” improved edge image; (e) ”Lena” original image; (f)”Lena”: Sobel edge image; (g) ”Lena”: result of the proposed method; (h) ”Lena”improved edge image; (i) ”Cameraman” original image; (j) ”Cameraman”: Sobel edgeimage; (k) ”Cameraman”: result of the proposed method; (l) ”Cameraman” improvededge image.
application, the food that ants search for also needs to be defined.
This section presents a study on the adaptability of the algorithm proposed in Sec-tion 5.3 (Jevtic and Andina, 2010). Experiments with two different sets of grayscaleimages were performed. In the first experimental setup, a set of three different
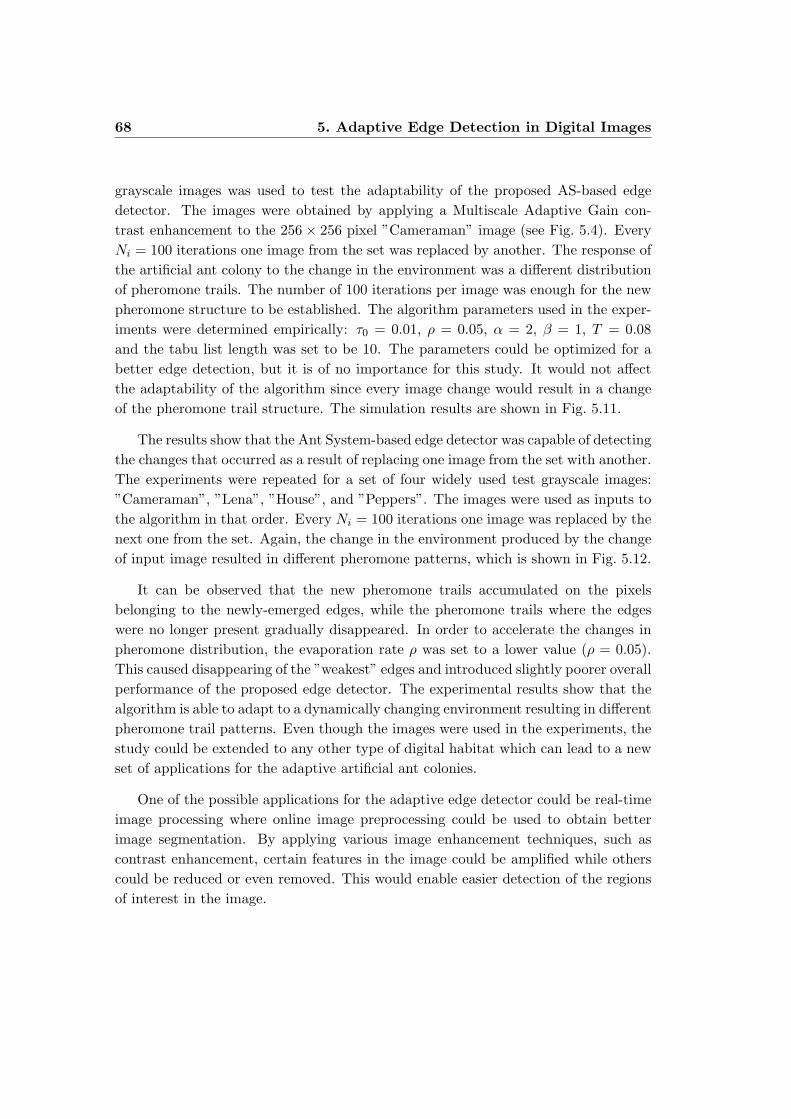
68 5. Adaptive Edge Detection in Digital Images
grayscale images was used to test the adaptability of the proposed AS-based edgedetector. The images were obtained by applying a Multiscale Adaptive Gain con-trast enhancement to the 256× 256 pixel ”Cameraman” image (see Fig. 5.4). EveryNi = 100 iterations one image from the set was replaced by another. The response ofthe artificial ant colony to the change in the environment was a different distributionof pheromone trails. The number of 100 iterations per image was enough for the newpheromone structure to be established. The algorithm parameters used in the exper-iments were determined empirically: τ0 = 0.01, ρ = 0.05, α = 2, β = 1, T = 0.08and the tabu list length was set to be 10. The parameters could be optimized for abetter edge detection, but it is of no importance for this study. It would not affectthe adaptability of the algorithm since every image change would result in a changeof the pheromone trail structure. The simulation results are shown in Fig. 5.11.
The results show that the Ant System-based edge detector was capable of detectingthe changes that occurred as a result of replacing one image from the set with another.The experiments were repeated for a set of four widely used test grayscale images:”Cameraman”, ”Lena”, ”House”, and ”Peppers”. The images were used as inputs tothe algorithm in that order. Every Ni = 100 iterations one image was replaced by thenext one from the set. Again, the change in the environment produced by the changeof input image resulted in different pheromone patterns, which is shown in Fig. 5.12.
It can be observed that the new pheromone trails accumulated on the pixelsbelonging to the newly-emerged edges, while the pheromone trails where the edgeswere no longer present gradually disappeared. In order to accelerate the changes inpheromone distribution, the evaporation rate ρ was set to a lower value (ρ = 0.05).This caused disappearing of the ”weakest” edges and introduced slightly poorer overallperformance of the proposed edge detector. The experimental results show that thealgorithm is able to adapt to a dynamically changing environment resulting in differentpheromone trail patterns. Even though the images were used in the experiments, thestudy could be extended to any other type of digital habitat which can lead to a newset of applications for the adaptive artificial ant colonies.
One of the possible applications for the adaptive edge detector could be real-timeimage processing where online image preprocessing could be used to obtain betterimage segmentation. By applying various image enhancement techniques, such ascontrast enhancement, certain features in the image could be amplified while otherscould be reduced or even removed. This would enable easier detection of the regionsof interest in the image.
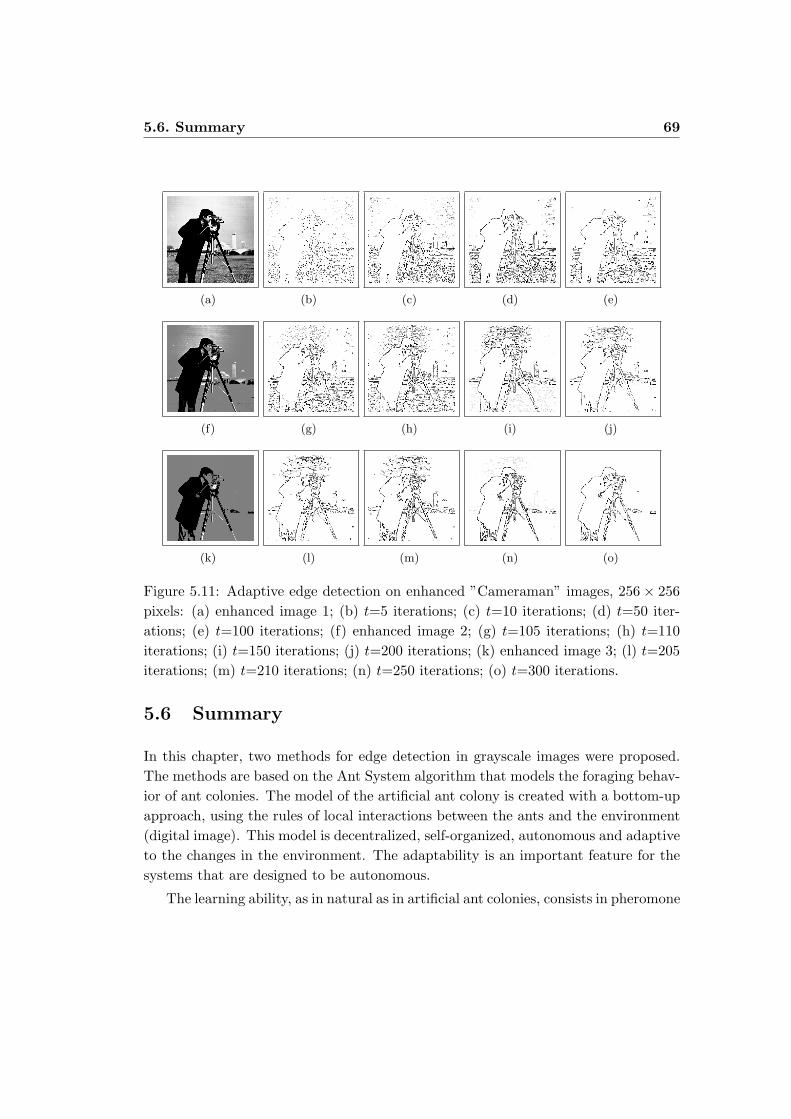
5.6. Summary 69
(a) (b) (c) (d) (e)
(f) (g) (h) (i) (j)
(k) (l) (m) (n) (o)
Figure 5.11: Adaptive edge detection on enhanced ”Cameraman” images, 256× 256pixels: (a) enhanced image 1; (b) t=5 iterations; (c) t=10 iterations; (d) t=50 iter-ations; (e) t=100 iterations; (f) enhanced image 2; (g) t=105 iterations; (h) t=110iterations; (i) t=150 iterations; (j) t=200 iterations; (k) enhanced image 3; (l) t=205iterations; (m) t=210 iterations; (n) t=250 iterations; (o) t=300 iterations.
5.6 Summary
In this chapter, two methods for edge detection in grayscale images were proposed.The methods are based on the Ant System algorithm that models the foraging behav-ior of ant colonies. The model of the artificial ant colony is created with a bottom-upapproach, using the rules of local interactions between the ants and the environment(digital image). This model is decentralized, self-organized, autonomous and adaptiveto the changes in the environment. The adaptability is an important feature for thesystems that are designed to be autonomous.
The learning ability, as in natural as in artificial ant colonies, consists in pheromone
70 5. Adaptive Edge Detection in Digital Images
(a) (b) (c) (d) (e)
(f) (g) (h) (i) (j)
(k) (l) (m) (n) (o)
(p) (q) (r) (s) (t)
Figure 5.12: Adaptive edge detection on four test images, 256 × 256 pixels: (a)”Cameraman”; (b) t=5 iterations; (c) t=10 iterations; (d) t=50 iterations; (e) t=100iterations; (f) ”Lena”; (g) t=105 iterations; (h) t=110 iterations; (i) t=150 iterations;(j) t=200 iterations; (k) ”House”; (l) t=205 iterations; (m) t=210 iterations; (n)t=250 iterations; (o) t=300 iterations; (p) ”Peppers”; (q) t=305 iterations; (r) t=310iterations; (s) t=350 iterations; (t) t=400 iterations.
trails that ants lay while searching for food. The structures that emerge from the ac-cumulated pheromone trails serve as the colony’s external memory that can be used
5.6. Summary 71
by any of its members. Even though a single ant has no knowledge of the globalpatterns, the designer of such a swarm-based system is a privileged observer of theemergence that comes as a result of the cooperative behavior. The edge detection indigital images makes an ideal application to visualize these patterns.
72 5. Adaptive Edge Detection in Digital Images
Chapter 6
Cluster Analysis for Image
Segmentation
6.1 Introduction
Image segmentation is an important preprocessing step in applications of computervision. The objective is to partition the image into homogeneous regions that sharecertain visual characteristics. Various image segmentation methods have been pro-posed which can be grouped in different classes such as clustering, edge detection,region growth, histogram-based, etc. (Gonzalez and Woods, 2008). No matter whatmethod is applied, the objective remains the same, to change the representation ofthe original image into something easier to analyze.
The result of image segmentation are pixels grouped in clusters based on theirsimilarities. There is therefore a natural tendency to apply data clustering algorithmsto image segmentation. Clustering is a method of unsupervised learning becauseunlike classification, no prior labeling of data is available (Jain et al., 1999). Theobjective of the clustering process is to find groups of pixels that are similar in termsof a predefined characteristic, such as gray level intensity. A cluster of pixels isusually associated with a prototype, the most representative pixel, which is consideredthe center of the cluster. The similarity of a pixel with the prototype is evaluatedaccording to their mutual distance and each pixel is assigned to the nearest prototype.
In some computer vision applications such as mammography for the cancer riskanalysis, the less representative pixels are precisely the most interesting because theyrepresent a variation with respect to healthy tissue. The pixels of high gray-levelintensity could indicate the presence of microcalcifications which may be an early
74 6. Cluster Analysis for Image Segmentation
sign of breast cancer. These pixels are difficult to detect because they can appear ingroups of just a few pixels, for which are often merged with larger clusters. Variousclustering methods proposed in literature differ in sensitivity to detect small regionsof interest. A different approach, as proposed in this chapter, is to use pheromoneaccumulation inherent to ant colonies in nature to map the data space in order tomake it easier to isolate these regions.
For the image segmentation the Ant System-based Clustering Algorithm (ASCA)is proposed, which extracts the clusters of pixels with a similar intensity level ofgray. The ASCA is used to automatically determine the number of different clus-ters. Our algorithm, as its name suggests, is based on the Ant System algorithm(Dorigo et al., 1996) initially proposed to solve combinatorial optimization problemssuch as Traveling Salesman Problem. The Ant System models the pheromone-layingpheromone-following behavior of ants when they move in a discrete data space, whichin our case is a set of digital images. For the experiments, two types of images wereused in which the imperfections can be a result of light reflection over the image orthe real imperfections that can be used as an aid in medical diagnosis. The imagesare represented in gray levels and, particularly, only one characteristic correspondingto the intensity level of each pixel is used.
The chapter is organized as follows. Section 6.2 provides a summary of the relatedwork. In Section 6.3 the proposed ASCA algorithm is described. The image segmen-tation based on the proposed algorithm and the experimental results are presentedin Section 6.4. Discussion on the obtained results and comparison with state-of-the-art clustering algorithms are also given in this section. Finally, in Section 6.5 thesummary of this chapter is given.
6.2 Related Work
In this section, an overview of the state-of-the-art clustering algorithms is given. Forimage segmentation, clustering can be considered a preprocessing step that does notinclude the spatial information of the pixels. Therefore, the goal of the clusteringprocess is to group the pixels based on their similarities in order to facilitate furtherknowledge extraction. Kotsiantis and Pintelas (Kotsiantis and Pintelas, 2004) definethe following five categories of clustering algorithms: partitioning methods, hierarchi-cal methods, density-based methods, grid-based methods and model-based methods.The swarm-based algorithms do not explicitly belong to any of the named categories(Handl and Meyer, 2007).
6.2. Related Work 75
The Self-Organizing Maps (SOM) (Kohonen, 1990), an Artificial Neural Network(ANN) with unsupervised learning, is a widely used clustering algorithm. SOM isuseful for data classification because of its visualization property. For example, theSOM was used for pattern recognition in satellite images (Richardson et al., 2003),or segmentation of color images (Jiang and Zhou, 2004), but also many others.
A cluster of pixels is usually associated with the prototype as the most repre-sentative pixel also considered the cluster center. The partitioning methods use thiscentric property to divide N -dimensional data space, where the partitions are eitherstrict, fuzzy or possibilistic. The most well-known strict partitioning algorithm isthe k-Means (MacQueen, 1967) which divides a data set into k subsets such that allpoints in a given subset are closest to the same center. The drawback of the k-Meansalgorithm is that it did not provide any information on how close to each prototype adata point was. Therefore, Bezdek (Bezdek, 1981) proposed the Fuzzy c-Means algo-rithm (FCM) that calculates a membership degree for each data point in relation todifferent clusters, where the sum of the membership degrees of a point must be equalto one. The FCM was insensitive to noise since several equidistant data with thesame membership values are not equally representative of the clusters. The solutionwas offered with the Possibilistic c-Means algorithm (PCM) algorithm (Krishnapu-ram and Keller, 1993) that identifies the similarity of data with a given number ofprototypes using typicality values ranging from (0, 1). The main drawback of thisalgorithm is that the clustering results are dependent on the manually-set typicalitythreshold. Pal et al. proposed to use both membership degrees and typicality valuesand implemented it in the Fuzzy Possibilistic c-Means (FPCM) algorithm (Pal et al.,1997). Another improvement was proposed by the same author as the PossibilisticFuzzy c-Means (PFCM) algorithm (Pal et al., 2005) where he introduced control pa-rameters which define the relative importance of the membership degrees and thetypicality values.
The clustering performance of the partitioning-based algorithms is greatly depen-dent on the initial guess of cluster centers and it is time consuming. Various methodswere proposed to address these issues. One simple implementation of the Lloyd’sk-Means algorithm to color quantization, data compression and image segmentationwas proposed in (Kanungo et al., 2002). The algorithm stores the multidimensionaldata points in a kd -tree that is computed only once, which results in faster compu-tation. Laia and Liaw (Lai and Liaw, 2008) proposed a modified k-Means algorithmto speed up the clustering process for larger data sets with higher dimension. Manyother partitioning-based methods were proposed to achieve a faster execution (Wang
76 6. Cluster Analysis for Image Segmentation
and Rau, 2001; Junwei and Yongxuan, 2007), but also for a more robust and lessnoise-sensitive clustering (Liew et al., 2000; Chang and Yeh, 2005; Li et al., 2007;Awad et al., 2009).
The sensitivity in detection of the atypical data remains an issue for the state-of-the-art clustering algorithms. Ojeda et al. (Ojeda-Magana et al., 2009) proposean image sub-segmentation method based on the PFCM algorithm in order to detectsmall homogeneous regions in mammograms. The authors applied a typicality valuethreshold to delimit a sub-group containing atypical pixels within the initially detectedclusters. The threshold value was set manually which is the main drawback of theproposed PFCM-based method. Another drawback, common to partitioning-basedmethods, is that the number of clusters has to be a priori known.
Various methods proposed in literature suggested the use of pixel spatial infor-mation to improve the image segmentation results. Although it is beyond the scopeof the here-proposed work, some of these methods are mentioned. Chuang et al.(Chuang et al., 2006) proposed an image segmentation method based on the FCMalgorithm. The authors incorporated the spatial information into the membershipfunction of each pixel with regards to the neighboring pixels in order to detect morehomogeneous regions and make the algorithm less sensitive to noise. Cai et al. (Caiet al., 2007) proposed the Fast Generalized Fuzzy c-Means (FGFCM) algorithm formore robust and faster image segmentation. Their method is based on improvementof other FCM-based algorithms to include the local spatial and grey information inthe membership function.
6.2.1 Ant Clustering Algorithms
The group of data clustering algorithms inspired by the swarming behavior of nat-ural ant colonies is usually referred to as ant clustering algorithms. Although thesealgorithms are based on the idea of the cooperative behavior in nature, in many casestheir biological plausibility is sacrificed in order to obtain better clustering results.Handl and Meyer (2007) roughly classify the ant clustering algorithms in two maingroups. The first group mimics the corpse gathering and brood sorting in naturalant colonies, where the clustering solution emerges as a result of interactions of theants with the environment. The second group of algorithms uses general-purpose ant-based optimization methods in order to obtain optimal clustering of the given dataset. There are also algorithms that do not explicitly belong to any of these groups,but fall somewhere in between.
A basic algorithm which mimics the clustering behavior of an ant colony was
6.2. Related Work 77
proposed by Lumer and Faieta (1994) and it was based on the model by Deneubourget al. (1991) who studied the way the ant colonies group the corpse inside their nest.The authors proposed that the N -dimensional data set be randomly distributed ona two-dimensional grid. The virtual ants move around the grid randomly pickingand dropping the data items. The decision of either picking or dropping the item atthe specified position on the grid depends on the similarity of the other neighboringitems.
Several authors have built their algorithms on the model proposed by Deneubourget al. Some introduced modifications to Lumer and Faieta algorithm in order to im-prove its performance and runtime (Handl and Meyer, 2002; Vizine et al., 2005).Another version of the algorithm called ATTA-C (Handl et al., 2006), although im-proved, failed to perform effectively on the designated application, as it was provenby the authors.
Interestingly, Martin et al. (2002) observed that there was no collective effect in theclustering model proposed by Deneubourg et al., which implies that the algorithmsderived from this model do not demonstrate the collective intelligence. Tan et al.(2006) removed the collective element from the mentioned clustering model to provethat the speed and the quality of solution did not depend on the number of ants usedin experiments.
The ant clustering algorithms can be used to automatically identify the number ofclusters inherent to a data collection. This feature is of utmost importance when theglobal knowledge of the data set does not exist. In (Handl et al., 2006), the authorsshowed that the ATTA-C algorithm outperforms Gap statistic algorithm (Tibshiraniet al., 2000) in terms of extraction of the number of clusters when the distance betweenthe cluster centers decreased.
Another type of ant clustering algorithms is based on the general-purpose ACO(Dorigo and Blum, 2005). These algorithms require post-processing to extract theexplicit clusters from the pheromone matrix. One of the early algorithms that appliedACO to find a cost-minimizing path between the nodes defined by data points wereproposed by Tsai et al. (2002) and Chu et al. (2004). The ants were used to connectthe nodes on their path with the pheromone trails. A threshold was used to removethe week node connections and the remaining ones formed the clusters.
Some authors proposed combining the ACO algorithms with other clusteringmethods such as the standard K-means (Saatchi and Hung, 2005) or the Fuzzy C-Means (Runkler, 2005) to make them less dependent on initial conditions such as thenumber and the position of the cluster centers. Yu et al. (2009) proposed an image
78 6. Cluster Analysis for Image Segmentation
segmentation method using an ant clustering algorithm that applies fuzzy rules todetermine the membership function of a pixel. The drawback of this method is thatit requires the number of clusters to be a priori known and its high computationalcost.
The ASCA algorithm proposed in this chapter belongs to the group of ant clus-tering algorithms that use general-purpose ant-based optimization methods, in thiscase to find the optimal routes from nodes to their closest cluster centers. A detaileddescription of the algorithm is given in the following section.
6.3 Ant System-based Clustering Algorithm (ASCA)
In this section, the Ant System-based Clustering Algorithm (ASCA) is described(Jevtic et al., 2011b). As its name suggests, it is based on the AS algorithm, whichwas inspired by the foraging behavior of ant colonies in nature. When ants find afood source, they leave pheromone trails that attract other ants to follow their path.Pheromone trails evaporate over time, so a path that leads to a closer food sourceaccumulates more pheromone as it is crossed by ants more frequently. The Ant Systemalgorithm exploits this cooperative behavior of ant colonies that features indirectcommunication through the environment. Unlike their biological counterparts, theartificial ants move through a discrete space defined with nodes and they have memoryof the taken path.
Pheromone trails in the ASCA algorithm are accumulated in nodes in order torepresent the density of the surrounding data. This differs from what was proposed inbasic Ant System algorithm where pheromone trails marked the edges that connectedthe nodes in order to represent the favorite path. The process of pheromone accumu-lation is iterative and creates a pheromone map of the data set to be clustered. Higherdata-density areas accumulate more pheromone and they represent cluster centers.This is used to extract the number of clusters. Gradient of the pheromone trail isused to assign every node to a cluster by applying local Hill climbing search (Russelland Norvig, 2003). The ASCA algorithm consists of three consecutive parts, namely:a) pheromone accumulation, b) local pheromone summing, and c) data labeling.
6.3.1 Pheromone Accumulation
In the pheromone accumulation stage, the artificial ants move in N -dimensional dataspace looking for the high data-density regions. The algorithm starts with an ini-tialization step which is followed by the iterative construction of new solutions and
6.3. Ant System-based Clustering Algorithm (ASCA) 79
pheromone update. It involves the following steps:
1. Initialization: All nodes are initialized with an equal small amount of pheromone,τ0. The population of M ants is created and placed on randomly chosen nodes.
2. Node transition rule: Ant chooses the next node to move to by applying theroulette rule. That is, every node has associated probability with which it ischosen from a set of available nodes. The probability of displacing kth ant fromnode i to node j depends on the Euclidean distance between the nodes and theamount of pheromone trail accumulated in node j, and it is given by:
pkij =
(τj)α(ηij)
β∑
h/∈tabuk, (τh)α(ηih)β , if j /∈ tabuk
0, otherwise
(6.1)
where τj and ηij are the intensity of the pheromone trail on the node j and thevisibility of the node j with respect to the node i, respectively. The visibility isgiven as the reciprocal value of the Eucludean distance, dij , between the nodesi and j:
ηij =1
dij. (6.2)
Ant is not allowed to displace to the nodes it has already visited. Tabuk list con-tains the nodes visited by the kth ant. The control parameters α and β allow usto bias the decision-making mechanism towards the exploitation of the generatedknowledge about the environment or exploration of new solutions, respectively.(α, β > 0; α, β ∈ <.) It can be noticed that the accumulated pheromone trailsserve as a colony’s external memory where the extracted knowledge about theenvironment is stored.
3. Pheromone update rule: Once all the ants carry out the transition to othernodes, the pheromone update is applied to each node as follows:
τj,new = (1− ρ)τj,old +M∑
k=1
∆τkj (6.3)
where ρ is the pheromone evaporation rate (0 < ρ < 1; ρ ∈ <), and ∆τkj is the
amount of pheromone laid on the node j by the kth ant, and is given by:
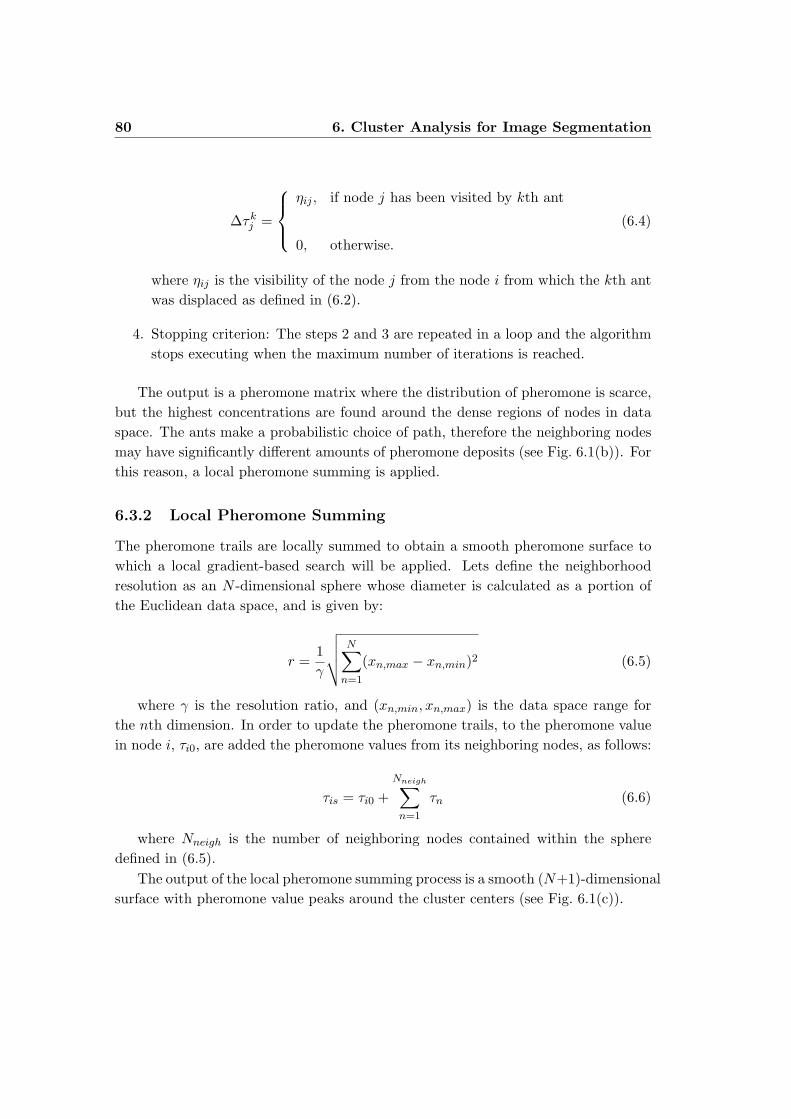
80 6. Cluster Analysis for Image Segmentation
∆τkj =
ηij , if node j has been visited by kth ant
0, otherwise.
(6.4)
where ηij is the visibility of the node j from the node i from which the kth antwas displaced as defined in (6.2).
4. Stopping criterion: The steps 2 and 3 are repeated in a loop and the algorithmstops executing when the maximum number of iterations is reached.
The output is a pheromone matrix where the distribution of pheromone is scarce,but the highest concentrations are found around the dense regions of nodes in dataspace. The ants make a probabilistic choice of path, therefore the neighboring nodesmay have significantly different amounts of pheromone deposits (see Fig. 6.1(b)). Forthis reason, a local pheromone summing is applied.
6.3.2 Local Pheromone Summing
The pheromone trails are locally summed to obtain a smooth pheromone surface towhich a local gradient-based search will be applied. Lets define the neighborhoodresolution as an N -dimensional sphere whose diameter is calculated as a portion ofthe Euclidean data space, and is given by:
r =1γ
√√√√N∑
n=1
(xn,max − xn,min)2 (6.5)
where γ is the resolution ratio, and (xn,min, xn,max) is the data space range forthe nth dimension. In order to update the pheromone trails, to the pheromone valuein node i, τi0, are added the pheromone values from its neighboring nodes, as follows:
τis = τi0 +Nneigh∑
n=1
τn (6.6)
where Nneigh is the number of neighboring nodes contained within the spheredefined in (6.5).
The output of the local pheromone summing process is a smooth (N+1)-dimensionalsurface with pheromone value peaks around the cluster centers (see Fig. 6.1(c)).
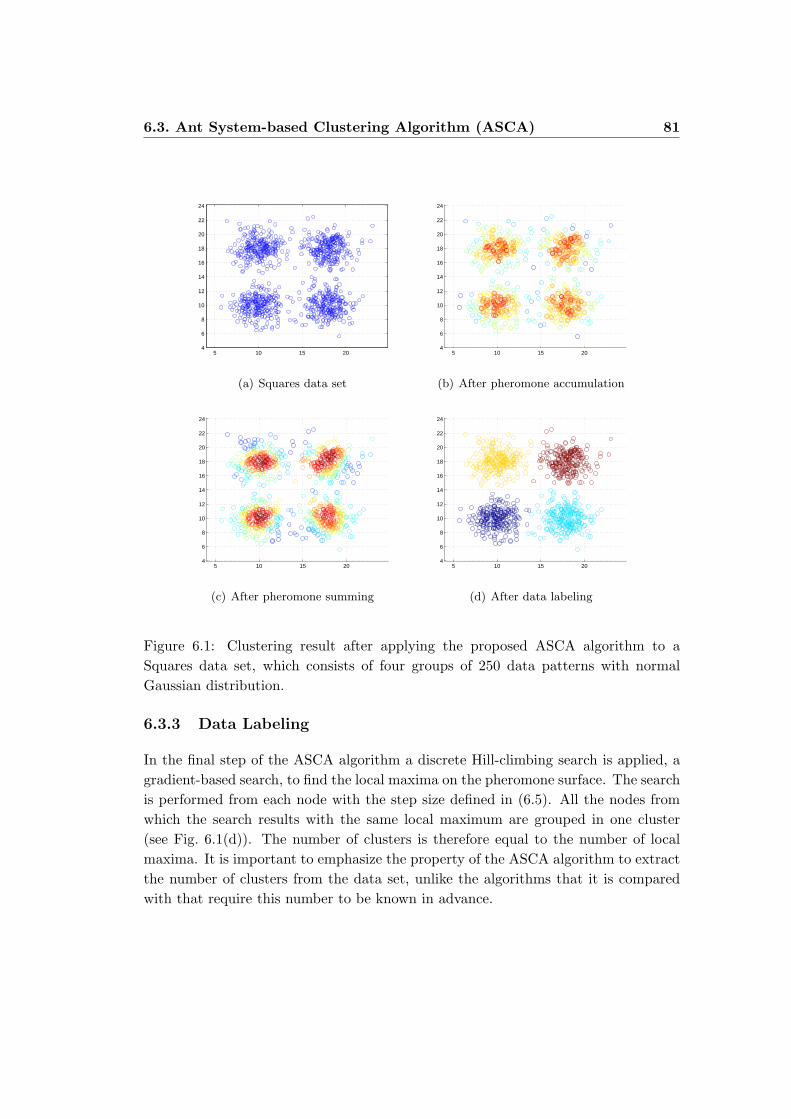
6.3. Ant System-based Clustering Algorithm (ASCA) 81
5 10 15 204
6
8
10
12
14
16
18
20
22
24
(a) Squares data set
5 10 15 204
6
8
10
12
14
16
18
20
22
24
(b) After pheromone accumulation
5 10 15 204
6
8
10
12
14
16
18
20
22
24
(c) After pheromone summing
5 10 15 204
6
8
10
12
14
16
18
20
22
24
(d) After data labeling
Figure 6.1: Clustering result after applying the proposed ASCA algorithm to aSquares data set, which consists of four groups of 250 data patterns with normalGaussian distribution.
6.3.3 Data Labeling
In the final step of the ASCA algorithm a discrete Hill-climbing search is applied, agradient-based search, to find the local maxima on the pheromone surface. The searchis performed from each node with the step size defined in (6.5). All the nodes fromwhich the search results with the same local maximum are grouped in one cluster(see Fig. 6.1(d)). The number of clusters is therefore equal to the number of localmaxima. It is important to emphasize the property of the ASCA algorithm to extractthe number of clusters from the data set, unlike the algorithms that it is comparedwith that require this number to be known in advance.
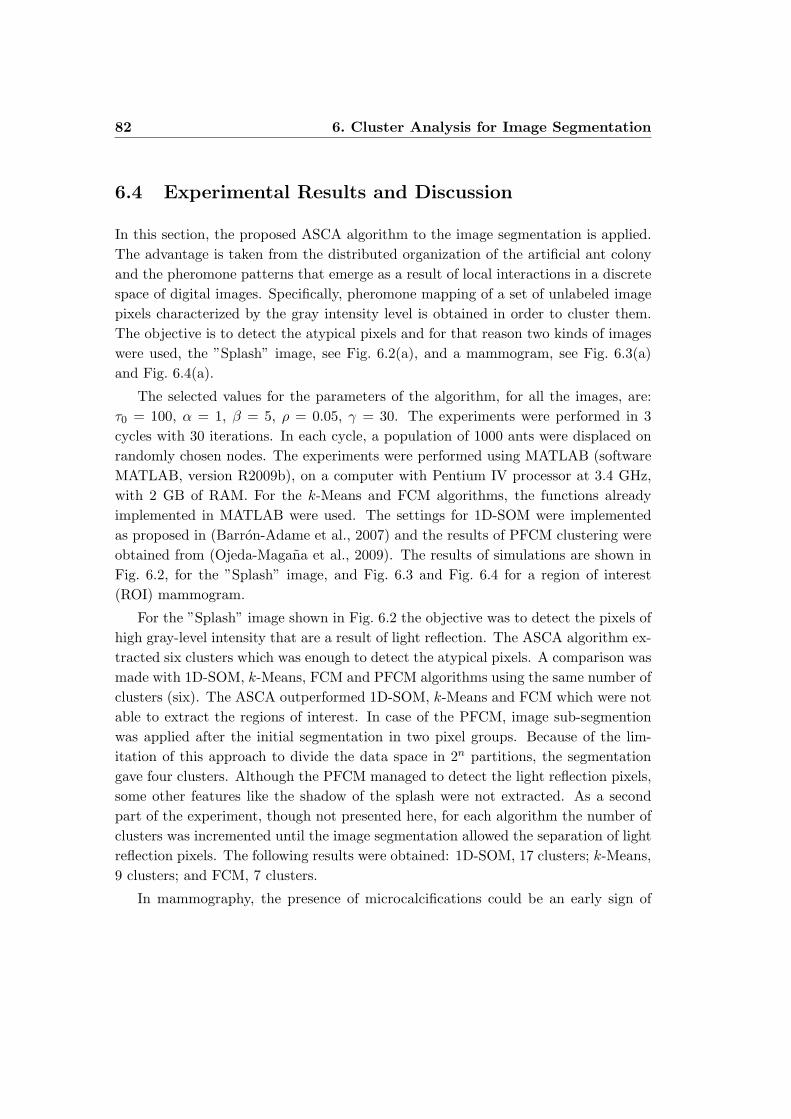
82 6. Cluster Analysis for Image Segmentation
6.4 Experimental Results and Discussion
In this section, the proposed ASCA algorithm to the image segmentation is applied.The advantage is taken from the distributed organization of the artificial ant colonyand the pheromone patterns that emerge as a result of local interactions in a discretespace of digital images. Specifically, pheromone mapping of a set of unlabeled imagepixels characterized by the gray intensity level is obtained in order to cluster them.The objective is to detect the atypical pixels and for that reason two kinds of imageswere used, the ”Splash” image, see Fig. 6.2(a), and a mammogram, see Fig. 6.3(a)and Fig. 6.4(a).
The selected values for the parameters of the algorithm, for all the images, are:τ0 = 100, α = 1, β = 5, ρ = 0.05, γ = 30. The experiments were performed in 3cycles with 30 iterations. In each cycle, a population of 1000 ants were displaced onrandomly chosen nodes. The experiments were performed using MATLAB (softwareMATLAB, version R2009b), on a computer with Pentium IV processor at 3.4 GHz,with 2 GB of RAM. For the k-Means and FCM algorithms, the functions alreadyimplemented in MATLAB were used. The settings for 1D-SOM were implementedas proposed in (Barron-Adame et al., 2007) and the results of PFCM clustering wereobtained from (Ojeda-Magana et al., 2009). The results of simulations are shown inFig. 6.2, for the ”Splash” image, and Fig. 6.3 and Fig. 6.4 for a region of interest(ROI) mammogram.
For the ”Splash” image shown in Fig. 6.2 the objective was to detect the pixels ofhigh gray-level intensity that are a result of light reflection. The ASCA algorithm ex-tracted six clusters which was enough to detect the atypical pixels. A comparison wasmade with 1D-SOM, k-Means, FCM and PFCM algorithms using the same number ofclusters (six). The ASCA outperformed 1D-SOM, k-Means and FCM which were notable to extract the regions of interest. In case of the PFCM, image sub-segmentionwas applied after the initial segmentation in two pixel groups. Because of the lim-itation of this approach to divide the data space in 2n partitions, the segmentationgave four clusters. Although the PFCM managed to detect the light reflection pixels,some other features like the shadow of the splash were not extracted. As a secondpart of the experiment, though not presented here, for each algorithm the number ofclusters was incremented until the image segmentation allowed the separation of lightreflection pixels. The following results were obtained: 1D-SOM, 17 clusters; k-Means,9 clusters; and FCM, 7 clusters.
In mammography, the presence of microcalcifications could be an early sign of
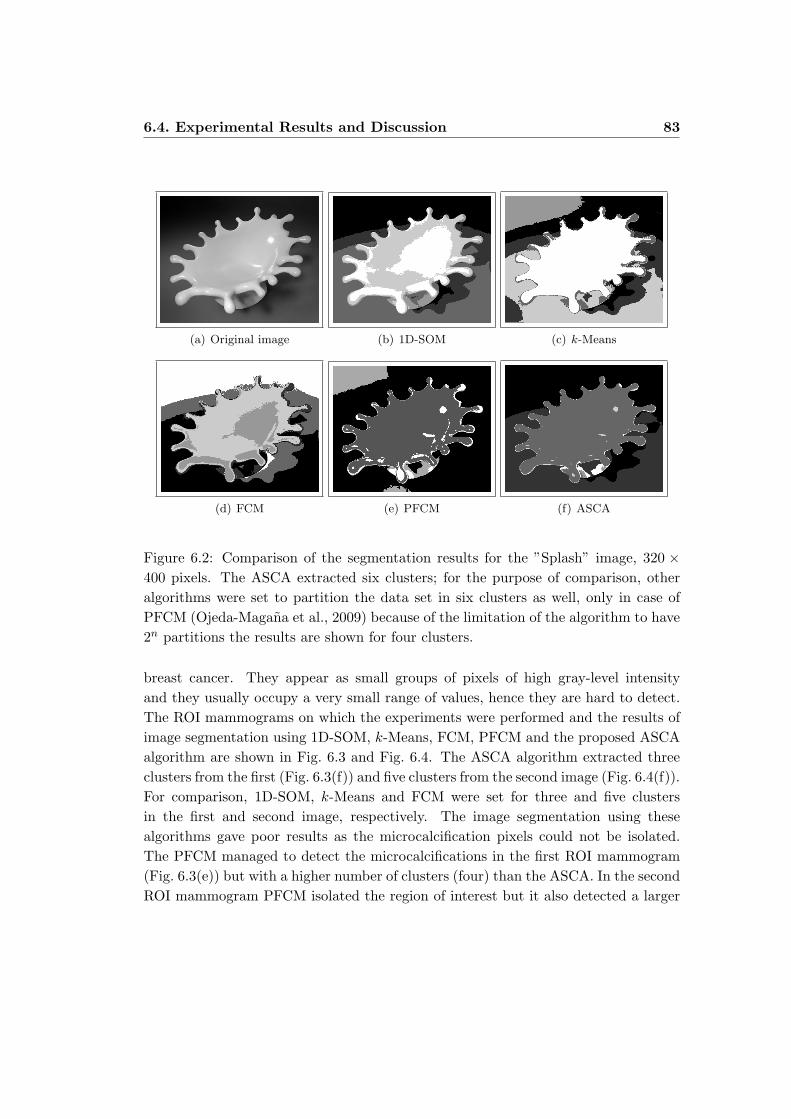
6.4. Experimental Results and Discussion 83
(a) Original image (b) 1D-SOM (c) k-Means
(d) FCM (e) PFCM (f) ASCA
Figure 6.2: Comparison of the segmentation results for the ”Splash” image, 320 ×400 pixels. The ASCA extracted six clusters; for the purpose of comparison, otheralgorithms were set to partition the data set in six clusters as well, only in case ofPFCM (Ojeda-Magana et al., 2009) because of the limitation of the algorithm to have2n partitions the results are shown for four clusters.
breast cancer. They appear as small groups of pixels of high gray-level intensityand they usually occupy a very small range of values, hence they are hard to detect.The ROI mammograms on which the experiments were performed and the results ofimage segmentation using 1D-SOM, k-Means, FCM, PFCM and the proposed ASCAalgorithm are shown in Fig. 6.3 and Fig. 6.4. The ASCA algorithm extracted threeclusters from the first (Fig. 6.3(f)) and five clusters from the second image (Fig. 6.4(f)).For comparison, 1D-SOM, k-Means and FCM were set for three and five clustersin the first and second image, respectively. The image segmentation using thesealgorithms gave poor results as the microcalcification pixels could not be isolated.The PFCM managed to detect the microcalcifications in the first ROI mammogram(Fig. 6.3(e)) but with a higher number of clusters (four) than the ASCA. In the secondROI mammogram PFCM isolated the region of interest but it also detected a larger
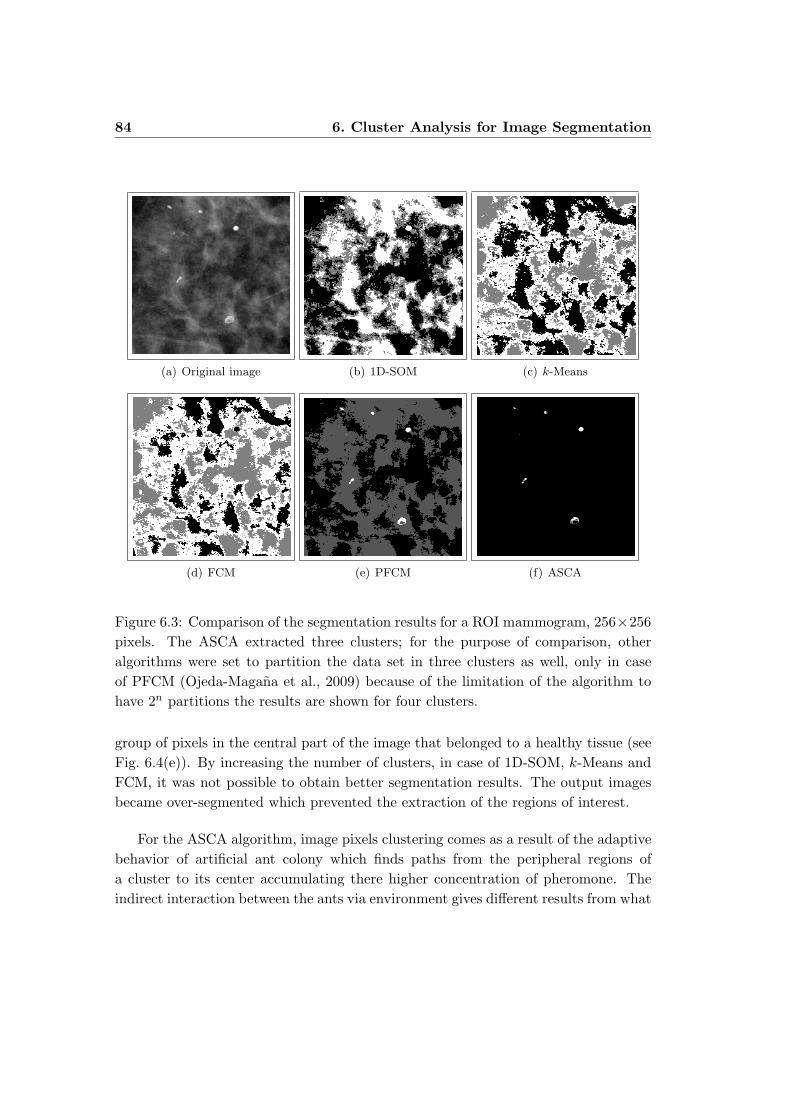
84 6. Cluster Analysis for Image Segmentation
(a) Original image (b) 1D-SOM (c) k-Means
(d) FCM (e) PFCM (f) ASCA
Figure 6.3: Comparison of the segmentation results for a ROI mammogram, 256×256pixels. The ASCA extracted three clusters; for the purpose of comparison, otheralgorithms were set to partition the data set in three clusters as well, only in caseof PFCM (Ojeda-Magana et al., 2009) because of the limitation of the algorithm tohave 2n partitions the results are shown for four clusters.
group of pixels in the central part of the image that belonged to a healthy tissue (seeFig. 6.4(e)). By increasing the number of clusters, in case of 1D-SOM, k-Means andFCM, it was not possible to obtain better segmentation results. The output imagesbecame over-segmented which prevented the extraction of the regions of interest.
For the ASCA algorithm, image pixels clustering comes as a result of the adaptivebehavior of artificial ant colony which finds paths from the peripheral regions ofa cluster to its center accumulating there higher concentration of pheromone. Theindirect interaction between the ants via environment gives different results from what
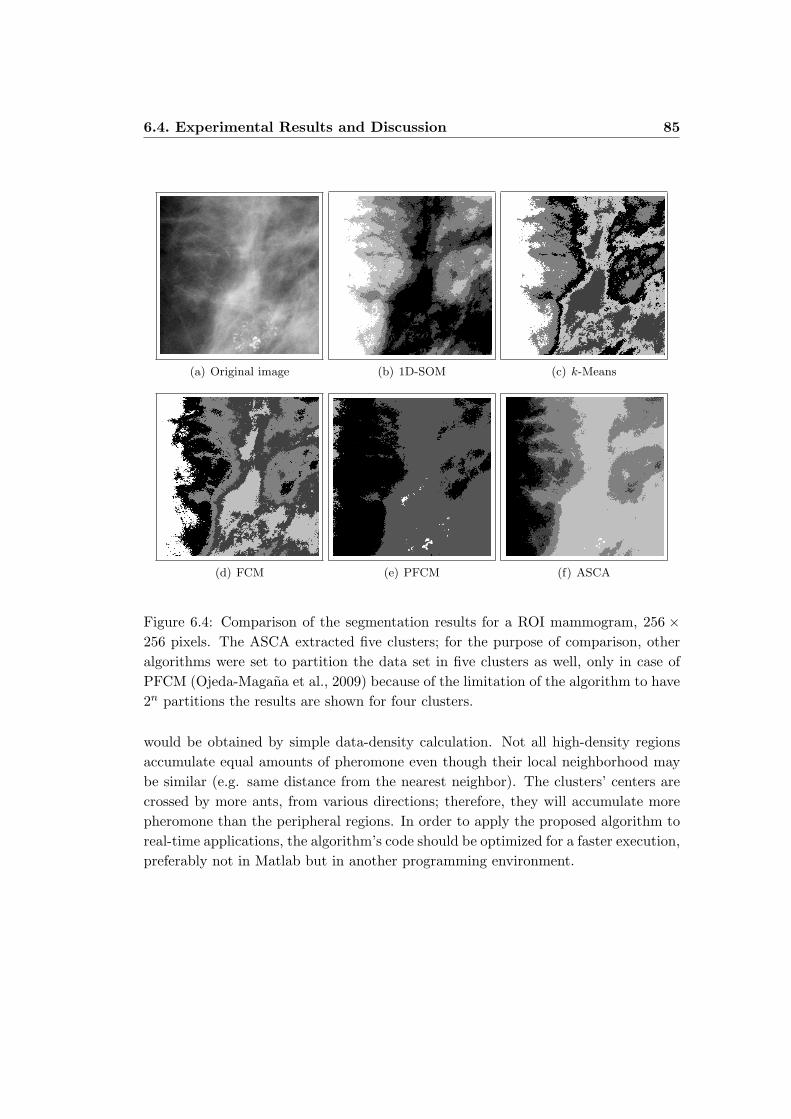
6.4. Experimental Results and Discussion 85
(a) Original image (b) 1D-SOM (c) k-Means
(d) FCM (e) PFCM (f) ASCA
Figure 6.4: Comparison of the segmentation results for a ROI mammogram, 256 ×256 pixels. The ASCA extracted five clusters; for the purpose of comparison, otheralgorithms were set to partition the data set in five clusters as well, only in case ofPFCM (Ojeda-Magana et al., 2009) because of the limitation of the algorithm to have2n partitions the results are shown for four clusters.
would be obtained by simple data-density calculation. Not all high-density regionsaccumulate equal amounts of pheromone even though their local neighborhood maybe similar (e.g. same distance from the nearest neighbor). The clusters’ centers arecrossed by more ants, from various directions; therefore, they will accumulate morepheromone than the peripheral regions. In order to apply the proposed algorithm toreal-time applications, the algorithm’s code should be optimized for a faster execution,preferably not in Matlab but in another programming environment.
86 6. Cluster Analysis for Image Segmentation
6.5 Summary
The important feature of the proposed ASCA algorithm is automatic extraction ofnumber of clusters. This is useful for applications where the groups of patterns withina data set are not well-defined and need to be detected. The performance of the ASCAalgorithm was evaluated through experiments on two types of images. Our algorithmoutperformed 1D-SOM, k-Means, FCM and PFCM algorithms in detection of small,atypical regions of the image, either in the overall quality of segmented images or thetotal number of clusters used.
The resolution ratio γ is used to set the sensitivity of the algorithm to the densityof the data. Future work will include the optimization of the algorithm’s parameters,namely the resolution ratio γ and control parameters α and β, in order to improve theadaptability of the algorithm to different data sets. For the case of image processing,more features such as spatial information or texture will be used to obtain bettersegmentation results. Also, testing the algorithm on the color images may open awide range of new applications.
Part III
Multi-Agent System Modeling

Chapter 7
Distributed Task Allocation in
Swarm of Robots
7.1 Introduction
In applications that are too risky or too demanding for humans, or where a fastresponse is crucial, multirobot systems can play an important role thanks to theircapability to cover the area. Possible applications are planetary exploration, urbansearch and rescue, monitoring, surveillance, cleaning, maintenance, among others. Inorder to successfully perform the tasks, robots require a high degree of autonomy anda good level of cooperation. The set of robots should behave like a team and notmerely as a set of entities.
In scenarios that require area coverage, dozens, hundreds or even thousands ofrobots can be used. Such a large group of robots, if organized in a centralized manner,could experience information overflow that can lead to the overall system failure. Forthis reason, the communication between the robots can be realized through localinteractions, either directly with one another or indirectly via environment. Thelarge group of robots acting in such a manner is referred to as swarm (Beni andWang, 1989).
As a result of the growing interest in coordination of multirobot systems, mul-tirobot task allocation (MRTA) has become an important research topic. The goalis to assign the tasks to the robots in a way that, through cooperation, the globalobjective is achieved more efficiently. In the scenario proposed in this work, tasksare represented by targets defined by their qualities and their location in the robotarena. A simulator was developed that implements a multi-foraging scenario, and the
90 7. Distributed Task Allocation in Swarm of Robots
experimental setup addresses the issue on how to, in a distributed way, assign therobots to the found targets with a expected distribution determined from the targetsqualities.
Scalability in its most general form is defined as how well a solution to someproblem will work when the size of the problem increases. In the context of mobilemultirobot systems, scalability refers to the overall system’s performance if the num-ber of robots increases in relation to the number of tasks at hand (Rana and Stout,2000). The resulting effect on the system’s performance can be determined in termsof metrics associated with a particular platform or an operating environment, whichin our work refers to dispatching a robot to a remote site marked as a target.
For a swarm of robots engaged in a multi-foraging scenario the Distributed BeesAlgorithm (DBA) was proposed (Jevtic et al., 2010b), which was inspired by theforaging behavior of colonies of bees in nature. When they find a food source, thescout bees return to the hive and perform a famous ”waggle dance” in order to recruitother bees. The information about the richness and location of the source is passedusing direct communication. Some models of the cooperative behavior of bee colonieswith centralized communication or no communication have already been proposed(Pham et al., 2006; Bailis et al., 2010). In order to avoid the centralized concept ofthe beehive dance floor, our robots were designed to use broadcast communication toinform other robots in the range about the estimated location and the quality of thefound target.
The objective of the proposed algorithm is to assign the robots in a swarm to thefound targets in such a way that the final distribution is proportional to the targets’qualities. The targets with associated qualities represent a distributed ”food” thatrequires a usually non-uniform distribution of robots in the area. The algorithmhas been previously validated through experiments with real robots (Jevtic et al.,2010b). This chapter presents the analysis of the proposed algorithm’s scalabilityin a simulated environment. The simulations were performed for various sets ofparameters, including number of robots, number of targets and targets’ quality values.Control parameters inherent to the DBA were tuned to test how they affect the finalrobot distribution.
The rest of the chapter is organized as follows. Section 7.2 provides a summaryof the related work. In Section 7.3, a problem statement is given and a generalmechanism for distributed task allocation in multi-foraging domain is described. Inthis section, a mathematical model of the proposed DBA algorithm is presented. InSection 7.4 the experimental setup with real robots and simulator are described. The
7.2. Related Work 91
results from experiments are presented and discussed. The simulation environmentis defined and the experimental evaluation for the multi-robot system’s scalabilityis proposed. The statistical analysis of the simulation results is presented, and adiscussion of the approach and the results is given. Finally, the Section 7.6 gives asummary of contributions.
7.2 Related Work
Multirobot systems offer the possibility of enhanced task performance, increased taskreliability and decreased cost over more traditional single-robot systems. However,multirobot systems must be designed having these issues in mind. Research field ofmultirobot systems is not new and various architectures that differ in size and com-plexity have been proposed. Dudek et al. (2002) provided a taxonomy that categorizesthe existing multirobot systems along various axes, including size (number of robots),team organization (e.g., centralized vs. distributed), communication topology (e.g.,broadcast vs. unicast), and team composition (e.g., homogeneous vs. heterogeneous).
Rather than characterize architectures, Gerkey and Mataric (2004) categorized in-stead the underlying coordination problems with a focus on multirobot task allocation(MRTA). They distinguish: single-task (ST) and multi-task (MT) robots, single-robot(SR) and multirobot (MR) tasks, and instantaneous (IA) and time-extended (TA) as-signment. The authors showed that many MRTA problems can be viewed as instancesof well-studied optimization problems in order to analyze the existing approaches, butalso to use the same theory in the synthesis of new approaches. In order to estimatea robot’s performance, they defined utility that depends on two factors, namely ex-pected quality of task execution and expected resource cost. Given a robot R and atask T one can define QRT and CRT as the quality and cost, respectively, expectedto result from the execution of T by R. The resulting nonnegative utility measure is:
URT =
QRT − CRT if R is capable of executing
Tand QRT > CRT ,
0 otherwise.
(7.1)
This however is not a strict definition of utility which is a flexible measure ofperformance and can entail arbitrary computation. The only constraint on utilityestimators is that they must each produce a single scalar value that can be comparedfor the purpose of assigning robots for tasks. The problem addressed in this chapteris categorized as a ”single-task robots, multirobot tasks, instantaneous assignment
92 7. Distributed Task Allocation in Swarm of Robots
(ST-MR-IA)”, which Gerkey and Mataric proposed to be solved as a set partitioningproblem. However, this requires the combined utilities of all the robots to be knownin advance, which is not the case. The proposed method is described in detail inSection 7.3.
What follows is a survey of various multirobot system architectures that havebeen proposed for solving different problems. We tend to use the above mentionedtaxonomies to categorize them.
One of the common approaches for solving the ST-SR and ST-MR problems is amarket-based approach which uses auctioning mechanism for task allocation. Mataricet al. (2003) proposed four different strategies for dynamical task allocation in twodifferent emergency-handling scenarios. The robots bid for tasks and decisions aremade by auctioning. Authors concluded that there is no overall best strategy and thatthe success of a strategy is task-related. Michael et al. (2008) proposed a market-basedapproach for robots formation control. They associate multiple tasks with predefinedspatial locations that define a formation.
A thorough overview of market-based approaches for MRTA is given by Diaset al. (2006). A common drawback of these approaches is the underlying auction-ing mechanism which requires all the bids from the robots to be gathered at oneauctioning point. Sometimes, when resources permit, markets can even behave in acentralized fashion over larger portions of the robot team to improve solution qual-ity. The authors gave a summary of communication costs for various market-basedapproaches. The main advantage of the method we propose is that, although it im-poses certain communication cost for sending the information of the found targets,the robots make decisions autonomously and in a distributed manner. This is not thecase with market-based approaches that feature a partial distribution, where robotsare divided into sub-teams that take decisions in a centralized manner. For this rea-son, scalability in market-based approaches is often limited by the computation andcommunication needs that arise from increasing auction frequency, bid complexity,and planning demands.
Environment exploration and mapping are common applications for multirobotsystems. Franchi et al. (2009) proposed a Sensor-based Random Graph (SRG) methodfor cooperative robot exploration. They addressed the issue of system’s performancewith respect to exploration time and traveled distance. The authors showed that byadding more robots the system could scale-up, but its performance was highly depen-dent on the initial team deployment, giving better results when the robots startedgrouped in a cluster than if scattered in the environment. The robots used broadcast

7.2. Related Work 93
communication with a limited range but the concept of decentralized cooperationwas in question since the robots were programmed to gather in sub-teams that had tosynchronize for local path-planning and collision-avoidance. This required intensiveinterchange of information including robot’s ID and displacement plan.
Another approach proposed by Burgard et al. (2005) treats the unknown environ-ment exploration as a ST-SR problem, where individual robots select a new targetlocation based on its distance and utility. The map was divided in cells whose sizewas determined by the robot’s visual range. The utility of each target location, i.e.cell, would decrease if more of its neighboring cells were assigned to other robots.To determine appropriate target locations for all the robots, the authors proposedan iterative algorithm. The drawback of this algorithm is its complexity and highcomputational cost. Although the experimental results show the advantages of col-laboration, the proposed centralized approach cannot be applied if not all robots cancommunicate with each other.
Decentralized coordination of robots has various advantages over more traditionalcentralized approaches. It can be applied to reduce the communication burden onmultirobot system (Ray et al., 2009), especially for large teams of robots. In someapplications communication can be difficult to implement or no communication ex-ists at all. Joordens and Jamshidi (2010) proposed a decentralized coordination fora swarm of underwater robots which is based on consensus control. Another decen-tralized strategy for dynamical allocation of tasks that requires no communicationamong robots was proposed by Berman et al. (2009). But often, as in case of multi-robot area coverage (Schwager et al., 2009), the decentralized coordination and dis-tributed decision-making is applied having one goal in mind, that the global objectiveis achieved more efficiently.
7.2.1 Bio-inspired Coordination of Multirobot Systems
Robot swarms are multirobot systems that typically consist of a large populationof simple robots interacting locally with one another and with their environment(Bonabeau et al., 1999). These systems draw inspiration from animal swarms innature but their design is not constrained by biological plausibility. Their main featureis decentralized coordination which results in a desired behavior that emerges fromthe rules of local interactions.
The self-organizing properties of animal swarms such as insects have been studiedfor better understanding of the underlying concept of decentralized decision-making innature (Camazine et al., 2001) but it also gave new approach in applications to multi-

94 7. Distributed Task Allocation in Swarm of Robots
agent system engineering and robotics. Bio-inspired approaches have been proposedfor multirobot division of labor in applications such as exploration and path forma-tion (Groß et al., 2008), multi-site deployment (Berman et al., 2007), or cooperativetransport and prey retrieval (Labella et al., 2006; Campo and Dorigo, 2007).
The bottom-up design topology inherent to bio-inspired multirobot systems pro-vides them with one or more of the following features, such as being autonomous,scalable, robust and adaptive to changes in their environment. On the other hand,the collective behavior has emergent properties that give them the ability to pro-duce unpredictable patterns. One way of dealing with the unpredictability issue isstatistical analysis through experiments, as proposed in this chapter.
7.2.2 Scalability
Task allocation scenarios include a set of tasks that may have different prioritiesand require one or more robots to be assigned to their execution. A very importantproperty of multirobot systems is the ability to scale-up with respect to the number ofrobots or the number of tasks at hand. However, scalability of multirobot systems andmulti-agent systems in general has been analyzed from various perspectives includingthe total number of agents involved, the size of the communication data, the numberof rules the agents operate with, or the agents’ diversity (Rana and Stout, 2000).
In order to evaluate the scalability of a given multirobot system one needs toidentify a performance metrics. Various MRTA methods exist but, to the best ofour knowledge, a comprehensive analysis tool for the scalability of such methods hasnot been given. Some mathematical models that have been proposed could serve asguidelines in multirobot system design, but different scenarios to which these systemsare applied usually do not permit us to maintain within the proposed framework.
Lerman et al. (2006) proposed a mathematical model for MRTA in dynamicalenvironments. The authors assumed that robots were able to observe tasks in orderto discriminate their types, but also to discriminate the tasks that other robots wereassigned to. Robots had limited sensing capabilities and could not directly commu-nicate. The lack of communication made the system more robust to failures, but alsomore susceptible to noise from the sensors, and requires more time for exploration ofavailable tasks.
Top-down design methodologies apply the classical control theory for performanceestimation of distributed agent-based systems. While it is possible to establish boundson the system behavior and provide performance guarantees, they heavily rely on theavailable bandwidth for robot communication and they are more sensitive to noise.
7.3. Distributed Task Allocation 95
The need for resources becomes even a bigger issue as the number of robots increase.There is therefore a very natural tendency to apply bottom-up methodologies whichproduce autonomous, scalable and adaptable systems requiring minimal communica-tion (Crespi et al., 2008).
Broadcast communication provides quick propagation of tasks’ information withinthe multirobot system but extensive use of communication channel can affect thesystem’s scalability. Previously described market-based approaches suffer from a largerequirement in terms of communication bandwidth as they use broadcast messagesto auction for the tasks. Farinelli et al. (2006) proposed a mechanism based ontoken passing for cooperative object retrieval, which scales up for reliable sending ofbroadcast messages. The authors made a comparison of their method with market-based approaches and the ones based on iterative broadcast communication. Theirresults show that the ability of the system to adjust to the available communicationbandwidth provides guarantees for better performance.
7.3 Distributed Task Allocation
7.3.1 Problem Definition
Based on the described taxonomy, our multirobot system can be categorized as homo-geneous and distributed, using broadcast communication. We address a problem ofsingle-task robots, multirobot tasks and instantaneous assignment (ST-MR-IA). Thetask allocation scenario studied here considers the environment that contains a num-ber of tasks that could be of same or different importance and robots that are equallycapable of performing each task but can only be assigned to one at any given time.More specifically, the tasks are targets with their associated qualities. The quality ofa target is an application-specific scalar value that may represent target’s priority orcomplexity, where a higher value requires more robots to be allocated. For example,it could represent the richness of the mineral or water source on a planet needed tobe harnessed, the amount of garbage to be collected in a public space, or the numberof injured people in a need for assistance in urban search and rescue scenario. In thiswork, it is not consider how these values were obtained.
The proposed scenario is presented under the following assumptions:
1. All the targets are made available to all the robots. This is done by setting thebroadcast communication range of the robots to cover the entire arena.
2. Robots take decisions once all the targets in the arena are found, unless they

96 7. Distributed Task Allocation in Swarm of Robots
were the ones that found a target in which case they are automatically allocatedto that target. The total number of targets is preset in robots’ internal memoryand it depends on the experimental setup.
3. Reallocation to another task is not allowed.
These assumptions are taken for simplicity; otherwise, it would be difficult to analyzethe performance of the system due to the unpredictability of the robots’ distributionprior to task allocation.
Consider a population of N robots to be allocated among M targets. Let Q ∈{q1, . . . , qM} denote the set of normalized qualities of all available targets. We denotethe number of robots on the target i ∈ {1, . . . , M} by ni, a nonnegative integer.The population fraction allocated to target i is fi = ni/N , which represents thetarget’s relative frequency, and the vector of population fraction is f = [f1, . . . , fM ]T .The expected distribution is the set of desired population fractions for each task,fd = [fd
1 , . . . , fdM ]T , where fd
i = qi. The usage of fractions rather than integers ispractical for scaling, but it also introduces a distribution error as the fractions cantake only certain values that are defined by the swarm size.
A relevant concept from set theory could be used to observe this as a set parti-tioning problem. A family X is a partition of a set E if and only if the elements ofX are mutually disjoint and their union is E:
⋂
x∈X
= ∅
⋃
x∈X
= E.
(7.2)
However, for the proposed scenario the system optimization based on the maxi-mum utility cannot be applied because the combined utilities of the robots are un-known as robots have no knowledge of the decisions taken by other robots. Therefore,the DBA is proposed.
7.3.2 Distributed Bees Algorithm (DBA)
When a robot receives information about the targets it calculates the utilities withrespect to those targets. The utility depends on the target’s quality value and therelated cost, i.e. the robot’s distance from the target.
7.3. Distributed Task Allocation 97
7.3.2.1 Costs
The cost of a target i for robot k is calculated as the Euclidean distance between therobot and the target in a two-dimensional arena:
dki =
√(xi − xk)2 + (yi − yk)2. (7.3)
where (xi, yi) and (xk, yk) represent target’s and robot’s coordinates in the arena,respectively.
However, to calculate the utility the target’s visibility is used defined as the re-ciprocal value of the distance:
ηki =
1dk
i
. (7.4)
7.3.2.2 Qualities
The quality is a scalar value that represents priority, or the complexity of the target.Normalized qualities are calculated as fractions of the sum of qualities of all availabletargets:
qi =Qi∑M
j=1 Qj
. (7.5)
where Qi is a quality of the target i. In real-world scenarios, the quality of a regionof interest is an estimated value that is as a result of sensor-readings or a previouslyacquired knowledge.
7.3.2.3 Utilities
The utility of a robot as proposed in (7.1) depends on both, cost and quality of thechosen target. The utility is defined as a probability that the robot k is allocated tothe target i, and it is calculated as follows:
pki =
qαi ηβ
i∑Mj=1 qα
j ηβj
(7.6)
where α and β are control parameters that allow us to bias the decision-makingmechanism towards the quality of the solution or its cost, respectively. (α, β > 0;α, β ∈ <.) From (7.6) it is easy to show that
98 7. Distributed Task Allocation in Swarm of Robots
M∑
i=1
pki = 1. (7.7)
7.3.2.4 Decision-making mechanism
The underlying decision-making mechanism of the DBA algorithm adopts the rouletterule, also known as the wheel-selection rule. That is, every target has an associatedprobability with which it is chosen from a set of available targets. Once all theprobabilities are calculated as in (7.6), the robot will choose a target by ”spinningthe wheel”.
It should be noticed that the resulting robots’ distribution depends on their initialdistribution in the arena, i.e. their distances from each target prior to target allo-cation. Therefore, robots’ utilities will differ with respect to the same target if theirdistances from that target are not equal. Since a combined robots utility cannot becomputed due to a distributed nature of the proposed algorithm, the quality of thetargets is used as the only measure for the expected robots’ distribution. Althoughthe overall cost efficiency of the swarm is not analyzed here, target’s visibility as usedin (7.6) makes closer targets more attractive to robots.
7.4 Experimental Evaluation
In this section, the results from the experiments with real robots are presented tovalidate the performance of the proposed DBA. The overview of robots’ hardware andthe communication protocol used in experiments is given, followed by the descriptionof the experimental setup. The experiments results are presented and discussed.
7.4.1 Robot hardware
The robots were assembled to have the same selection of hardware components (seeFig. 7.1). The Lynxmotion Terminator Sumo Robot Kit with four Spur Gear HeadMotors was used as a base to build the robots, although any platform that couldsupport the listed hardware components would be suitable. The DC motors werepowered with 12 VDC, with 200 RPM, torque of 63.89 oz.in (4.6 Kg-cm), 30:1 reduc-tion and 6 mm shaft diameter, and they were paired as left-hand and right-hand, inorder to be able to perform rotation on-the-spot. Devantech MD22 Motor Driver wasused to control the motors’ rotation speed and direction. It averaged the PWM signalreceived from the Arduino microcontroller board to provide a proportional value of
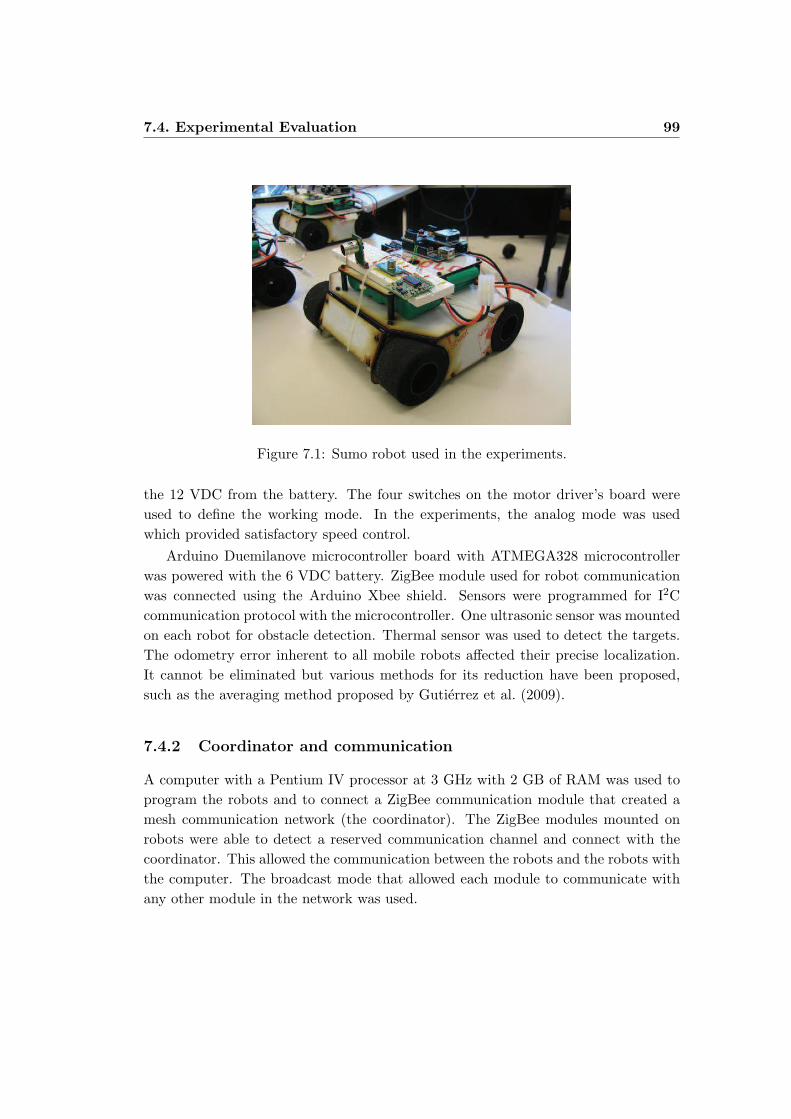
7.4. Experimental Evaluation 99
Figure 7.1: Sumo robot used in the experiments.
the 12 VDC from the battery. The four switches on the motor driver’s board wereused to define the working mode. In the experiments, the analog mode was usedwhich provided satisfactory speed control.
Arduino Duemilanove microcontroller board with ATMEGA328 microcontrollerwas powered with the 6 VDC battery. ZigBee module used for robot communicationwas connected using the Arduino Xbee shield. Sensors were programmed for I2Ccommunication protocol with the microcontroller. One ultrasonic sensor was mountedon each robot for obstacle detection. Thermal sensor was used to detect the targets.The odometry error inherent to all mobile robots affected their precise localization.It cannot be eliminated but various methods for its reduction have been proposed,such as the averaging method proposed by Gutierrez et al. (2009).
7.4.2 Coordinator and communication
A computer with a Pentium IV processor at 3 GHz with 2 GB of RAM was used toprogram the robots and to connect a ZigBee communication module that created amesh communication network (the coordinator). The ZigBee modules mounted onrobots were able to detect a reserved communication channel and connect with thecoordinator. This allowed the communication between the robots and the robots withthe computer. The broadcast mode that allowed each module to communicate withany other module in the network was used.

100 7. Distributed Task Allocation in Swarm of Robots
7.4.3 Experimental Results
The main objective of the experimental setup was to test the performance of theproposed algorithm and not the sensing and pattern recognition capabilities of therobots. Although the robots performed well in detecting the heat source and sendingthe estimated location and measured temperature, which was tested in initial exper-iments, in order to test the performance of the DBA algorithm a simplified scenariowas arranged. A small swarm of three real and two simulated robots was used insearch of two targets. The experiments were performed in 12× 12 sq ft (3.65× 3.65m2) arena, with randomly distributed obstacles. Robots were placed at the prepro-grammed initial locations. When the command was sent from the coordinator therobots started the random search. After a certain period of time t0, the informationof two targets was sequentially sent from the coordinator. The information includedthe targets’ estimated locations and their temperature (quality) values. The robotscalculated the probabilities to move to each target as in 7.6. The real robots were notable to recognize the message sender; therefore, the coordinator was able to simulatetwo robots that found two different targets.
Two types of experiments were performed. In the first one, the random searchtime t0 was changed to test its effect on the odometry error. Single robot was used inorder to avoid the collision with other robots, and only one robot was simulated fromthe coordinator. With each of three robots 30 experiments were conducted in order toobtain the average odometry error value. The results of the first experimental setupare shown in Fig. 7.2. The search was considered successful if the robot was able toget as close as 30,48 cm (1 ft) from the target. It can be noticed from the Fig. 7.2that while increasing the initial random search time of the robot, the odometry errorincreased as well. This happened due to the imperfect calibration of the DC motors,non-constant battery voltage, friction of the ground, etc. It can also be noticed thatfor the t0 < 90 s the experiment success rate was 100 %.
The results from the first experimental setup were used to set the parametersfor the second experimental setup. The random search initial time value was set tot0 = 30 s, which guaranteed that the odometry error would be below the successthreshold. The scenario involved all three robots in search for two targets whoseinformation was sent form the coordinator. The choice of having two targets in thescenario was based on the number of real robots that were at our disposal. By havingthree robots and two targets we could test how the robots distributed in the arenabased on the targets’ quality values. Four possible events could occur: 1) all robotsgo for the first target (T1); 2) all robots go for the second target (T2); 3) two robots
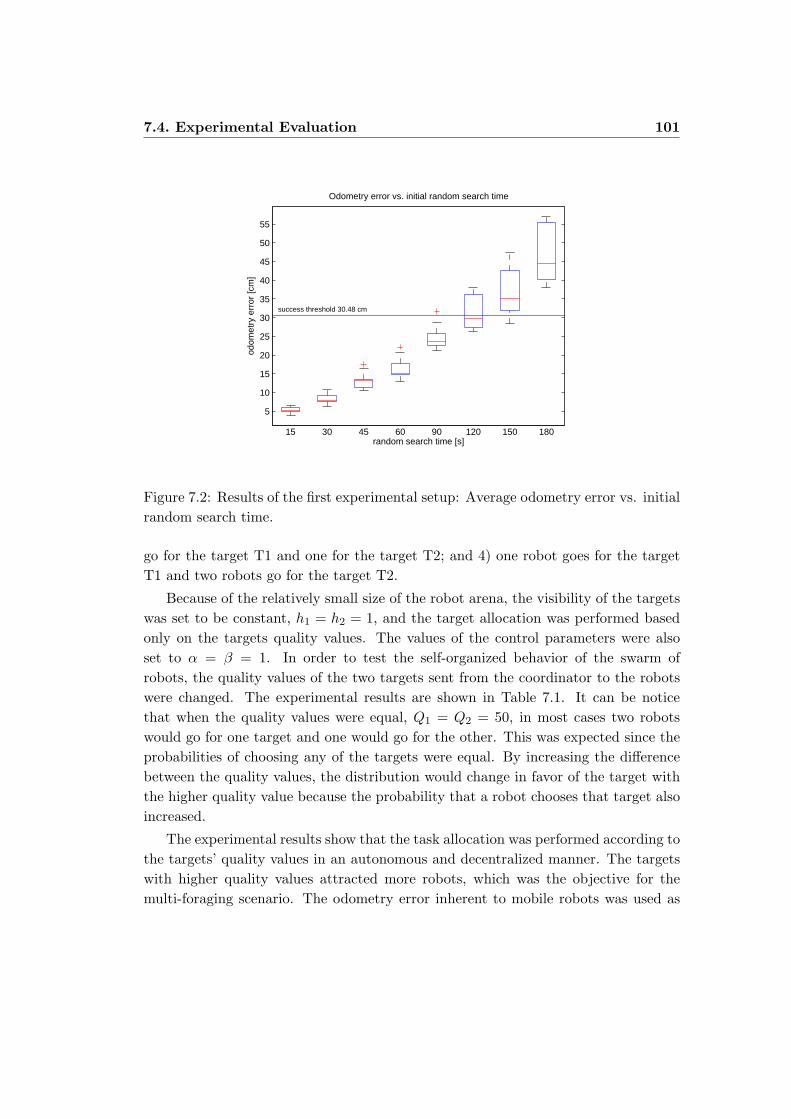
7.4. Experimental Evaluation 101
5
10
15
20
25
30
35
40
45
50
55
15 30 45 60 90 120 150 180random search time [s]
odom
etry
err
or [c
m]
Odometry error vs. initial random search time
success threshold 30.48 cm
Figure 7.2: Results of the first experimental setup: Average odometry error vs. initialrandom search time.
go for the target T1 and one for the target T2; and 4) one robot goes for the targetT1 and two robots go for the target T2.
Because of the relatively small size of the robot arena, the visibility of the targetswas set to be constant, h1 = h2 = 1, and the target allocation was performed basedonly on the targets quality values. The values of the control parameters were alsoset to α = β = 1. In order to test the self-organized behavior of the swarm ofrobots, the quality values of the two targets sent from the coordinator to the robotswere changed. The experimental results are shown in Table 7.1. It can be noticethat when the quality values were equal, Q1 = Q2 = 50, in most cases two robotswould go for one target and one would go for the other. This was expected since theprobabilities of choosing any of the targets were equal. By increasing the differencebetween the quality values, the distribution would change in favor of the target withthe higher quality value because the probability that a robot chooses that target alsoincreased.
The experimental results show that the task allocation was performed according tothe targets’ quality values in an autonomous and decentralized manner. The targetswith higher quality values attracted more robots, which was the objective for themulti-foraging scenario. The odometry error inherent to mobile robots was used as
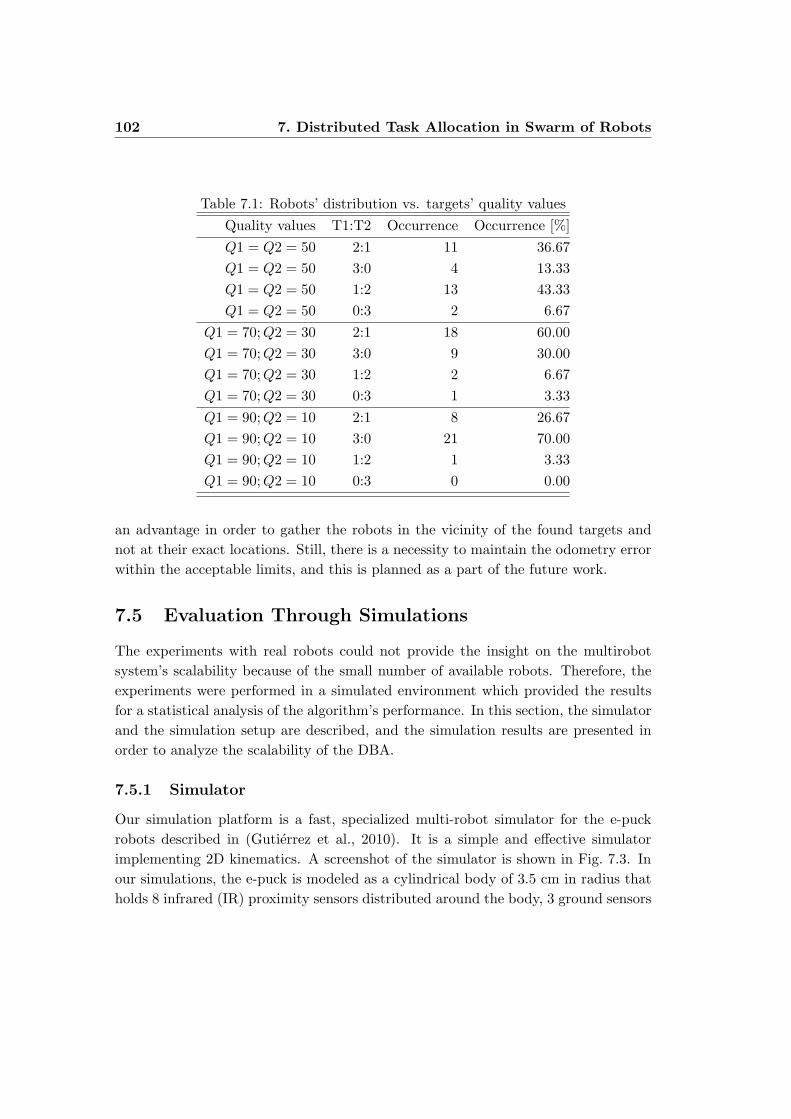
102 7. Distributed Task Allocation in Swarm of Robots
Table 7.1: Robots’ distribution vs. targets’ quality valuesQuality values T1:T2 Occurrence Occurrence [%]Q1 = Q2 = 50 2:1 11 36.67Q1 = Q2 = 50 3:0 4 13.33Q1 = Q2 = 50 1:2 13 43.33Q1 = Q2 = 50 0:3 2 6.67
Q1 = 70;Q2 = 30 2:1 18 60.00Q1 = 70;Q2 = 30 3:0 9 30.00Q1 = 70;Q2 = 30 1:2 2 6.67Q1 = 70;Q2 = 30 0:3 1 3.33Q1 = 90;Q2 = 10 2:1 8 26.67Q1 = 90;Q2 = 10 3:0 21 70.00Q1 = 90;Q2 = 10 1:2 1 3.33Q1 = 90;Q2 = 10 0:3 0 0.00
an advantage in order to gather the robots in the vicinity of the found targets andnot at their exact locations. Still, there is a necessity to maintain the odometry errorwithin the acceptable limits, and this is planned as a part of the future work.
7.5 Evaluation Through Simulations
The experiments with real robots could not provide the insight on the multirobotsystem’s scalability because of the small number of available robots. Therefore, theexperiments were performed in a simulated environment which provided the resultsfor a statistical analysis of the algorithm’s performance. In this section, the simulatorand the simulation setup are described, and the simulation results are presented inorder to analyze the scalability of the DBA.
7.5.1 Simulator
Our simulation platform is a fast, specialized multi-robot simulator for the e-puckrobots described in (Gutierrez et al., 2010). It is a simple and effective simulatorimplementing 2D kinematics. A screenshot of the simulator is shown in Fig. 7.3. Inour simulations, the e-puck is modeled as a cylindrical body of 3.5 cm in radius thatholds 8 infrared (IR) proximity sensors distributed around the body, 3 ground sensors
7.5. Evaluation Through Simulations 103
Figure 7.3: Simulator screenshot. Simulation setup included 40 robots engaged insearch for 4 targets of different qualities represented by different grey-level intensity.Robots are programmed for obstacle avoidance; when robot detects an obstacle itscolor changes from black to blue to mark his new state. Once the robot has taken anew direction, its color goes back to black.
on the lower-front part of the body and a range and bearing communication sensor.IR proximity sensors have a range of 5 cm, while the communication range of the E-puck Range & Bearing module was set to cover the whole arena. For the three typesof sensors, real robot measurements were sampled and the data was mapped intothe simulator. Furthermore, uniformly distributed noise was added to the samples inorder to effectively simulate different sensors; ±20% noise is added to the IR sensorsand ±30% to the ground sensors. In the range and bearing sensor, noise is added tothe range (±2.5 cm) and bearing (±20◦) values. A differential drive system made upof two wheels is fixed to the body of the simulated robot. At each time step (100 ms),the robot senses the environment and actuates. The robot speed has been limited to6 cm/s when moving straight and 3 cm/s when turning.
7.5.2 Simulation Setup
Three different simulation setups have been chosen to compare and study performanceand scalability of the proposed DBA algorithm. The setups were carried out in thesame arena where the number of robots, number of targets and targets’ quality valueswere changed as shown in Table 7.2. Additional simulation setup was created in order
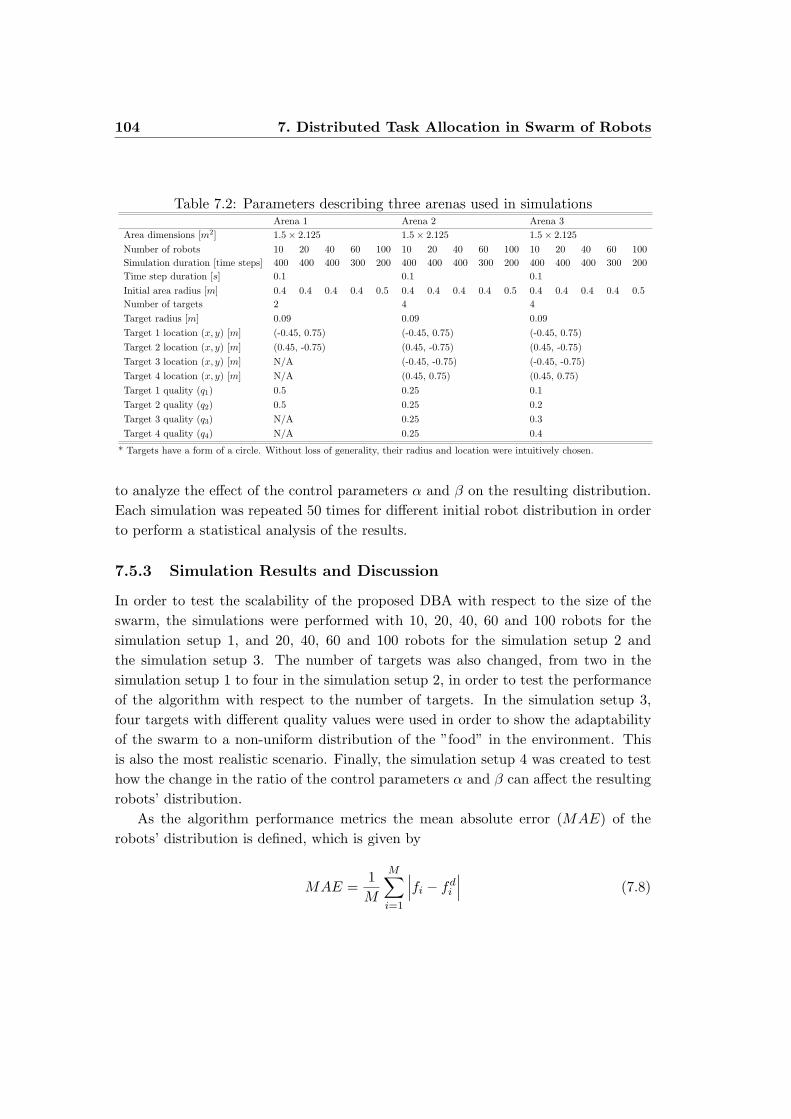
104 7. Distributed Task Allocation in Swarm of Robots
Table 7.2: Parameters describing three arenas used in simulationsArena 1 Arena 2 Arena 3
Area dimensions [m2] 1.5× 2.125 1.5× 2.125 1.5× 2.125Number of robots 10 20 40 60 100 10 20 40 60 100 10 20 40 60 100Simulation duration [time steps] 400 400 400 300 200 400 400 400 300 200 400 400 400 300 200Time step duration [s] 0.1 0.1 0.1Initial area radius [m] 0.4 0.4 0.4 0.4 0.5 0.4 0.4 0.4 0.4 0.5 0.4 0.4 0.4 0.4 0.5Number of targets 2 4 4Target radius [m] 0.09 0.09 0.09Target 1 location (x, y) [m] (-0.45, 0.75) (-0.45, 0.75) (-0.45, 0.75)Target 2 location (x, y) [m] (0.45, -0.75) (0.45, -0.75) (0.45, -0.75)Target 3 location (x, y) [m] N/A (-0.45, -0.75) (-0.45, -0.75)Target 4 location (x, y) [m] N/A (0.45, 0.75) (0.45, 0.75)Target 1 quality (q1) 0.5 0.25 0.1Target 2 quality (q2) 0.5 0.25 0.2Target 3 quality (q3) N/A 0.25 0.3Target 4 quality (q4) N/A 0.25 0.4
* Targets have a form of a circle. Without loss of generality, their radius and location were intuitively chosen.
to analyze the effect of the control parameters α and β on the resulting distribution.Each simulation was repeated 50 times for different initial robot distribution in orderto perform a statistical analysis of the results.
7.5.3 Simulation Results and Discussion
In order to test the scalability of the proposed DBA with respect to the size of theswarm, the simulations were performed with 10, 20, 40, 60 and 100 robots for thesimulation setup 1, and 20, 40, 60 and 100 robots for the simulation setup 2 andthe simulation setup 3. The number of targets was also changed, from two in thesimulation setup 1 to four in the simulation setup 2, in order to test the performanceof the algorithm with respect to the number of targets. In the simulation setup 3,four targets with different quality values were used in order to show the adaptabilityof the swarm to a non-uniform distribution of the ”food” in the environment. Thisis also the most realistic scenario. Finally, the simulation setup 4 was created to testhow the change in the ratio of the control parameters α and β can affect the resultingrobots’ distribution.
As the algorithm performance metrics the mean absolute error (MAE) of therobots’ distribution is defined, which is given by
MAE =1M
M∑
i=1
∣∣∣fi − fdi
∣∣∣ (7.8)
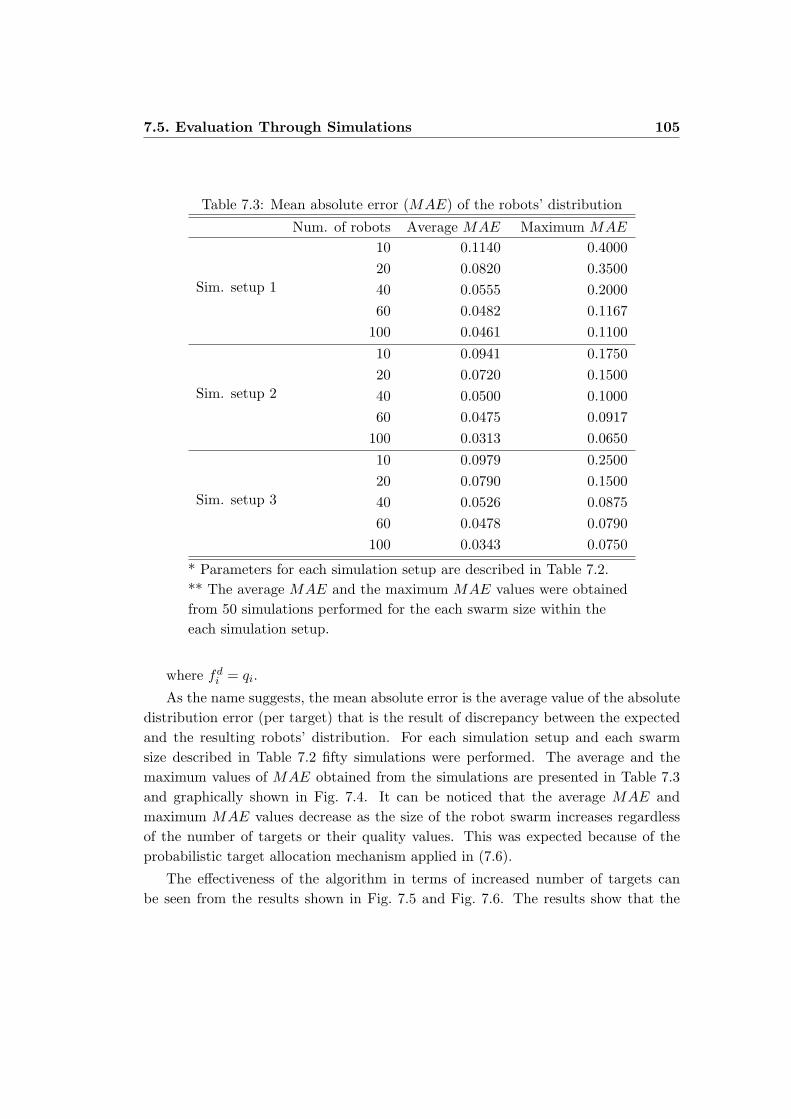
7.5. Evaluation Through Simulations 105
Table 7.3: Mean absolute error (MAE) of the robots’ distribution
Num. of robots Average MAE Maximum MAE
Sim. setup 1
10 0.1140 0.400020 0.0820 0.350040 0.0555 0.200060 0.0482 0.1167
100 0.0461 0.1100
Sim. setup 2
10 0.0941 0.175020 0.0720 0.150040 0.0500 0.100060 0.0475 0.0917
100 0.0313 0.0650
Sim. setup 3
10 0.0979 0.250020 0.0790 0.150040 0.0526 0.087560 0.0478 0.0790
100 0.0343 0.0750
* Parameters for each simulation setup are described in Table 7.2.** The average MAE and the maximum MAE values were obtainedfrom 50 simulations performed for the each swarm size within theeach simulation setup.
where fdi = qi.
As the name suggests, the mean absolute error is the average value of the absolutedistribution error (per target) that is the result of discrepancy between the expectedand the resulting robots’ distribution. For each simulation setup and each swarmsize described in Table 7.2 fifty simulations were performed. The average and themaximum values of MAE obtained from the simulations are presented in Table 7.3and graphically shown in Fig. 7.4. It can be noticed that the average MAE andmaximum MAE values decrease as the size of the robot swarm increases regardlessof the number of targets or their quality values. This was expected because of theprobabilistic target allocation mechanism applied in (7.6).
The effectiveness of the algorithm in terms of increased number of targets canbe seen from the results shown in Fig. 7.5 and Fig. 7.6. The results show that the
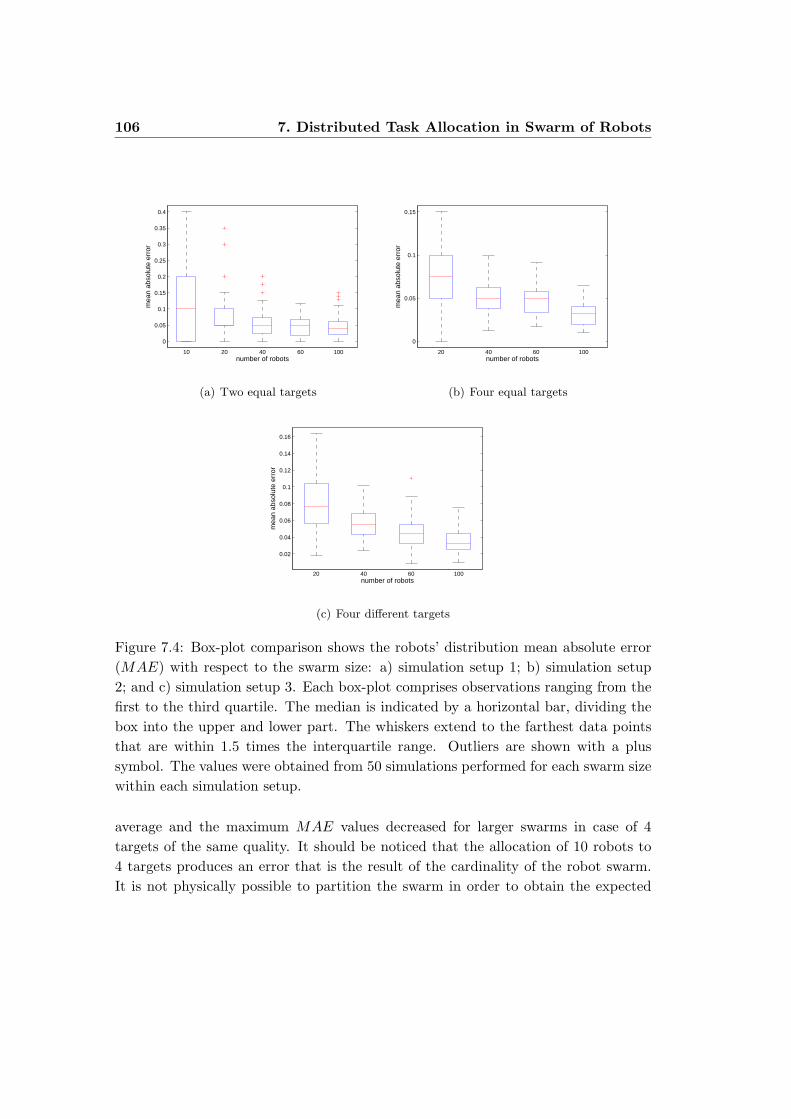
106 7. Distributed Task Allocation in Swarm of Robots
0
0.05
0.1
0.15
0.2
0.25
0.3
0.35
0.4
10 20 40 60 100number of robots
mea
n ab
solu
te e
rror
(a) Two equal targets
0
0.05
0.1
0.15
20 40 60 100number of robots
mea
n ab
solu
te e
rror
(b) Four equal targets
0.02
0.04
0.06
0.08
0.1
0.12
0.14
0.16
20 40 60 100number of robots
mea
n ab
solu
te e
rror
(c) Four different targets
Figure 7.4: Box-plot comparison shows the robots’ distribution mean absolute error(MAE) with respect to the swarm size: a) simulation setup 1; b) simulation setup2; and c) simulation setup 3. Each box-plot comprises observations ranging from thefirst to the third quartile. The median is indicated by a horizontal bar, dividing thebox into the upper and lower part. The whiskers extend to the farthest data pointsthat are within 1.5 times the interquartile range. Outliers are shown with a plussymbol. The values were obtained from 50 simulations performed for each swarm sizewithin each simulation setup.
average and the maximum MAE values decreased for larger swarms in case of 4targets of the same quality. It should be noticed that the allocation of 10 robots to4 targets produces an error that is the result of the cardinality of the robot swarm.It is not physically possible to partition the swarm in order to obtain the expected

7.5. Evaluation Through Simulations 107
1 20
0.1
0.2
0.3
0.4
0.5
0.6
0.7
targets
num
ber
of r
obot
s [%
]
obtainedexpected
(a) 10 robots
1 20
0.1
0.2
0.3
0.4
0.5
0.6
0.7
targets
num
ber
of r
obot
s [%
]
obtainedexpected
(b) 40 robots
1 20
0.1
0.2
0.3
0.4
0.5
0.6
0.7
targets
num
ber
of r
obot
s [%
]
obtainedexpected
(c) 100 robots
Figure 7.5: Bar-plot comparison of the expected (red) vs the obtained (blue) robots’distribution on two targets of same quality values, q1 = q2 = 0.5. Fifty simulationswere performed for each of the following swarm sizes: a) 10 robots; b) 40 robots; andd) 100 robots.
target allocation (2.5 robots per target).
Another inherent source of error results from the assumption that the robots thathad found a target are not allowed to reallocate to another target, therefore they arenot involved in the decision-making process. Also, it is assumed that the robots waitfor a predetermined number of targets to be found before they make a decision, whichcan result in the same target being found by more than one robot. This fraction ofthe robot swarm also produces an error in the final distribution because they cannotreallocate to another target. The algorithm’s performance is analyzed having these
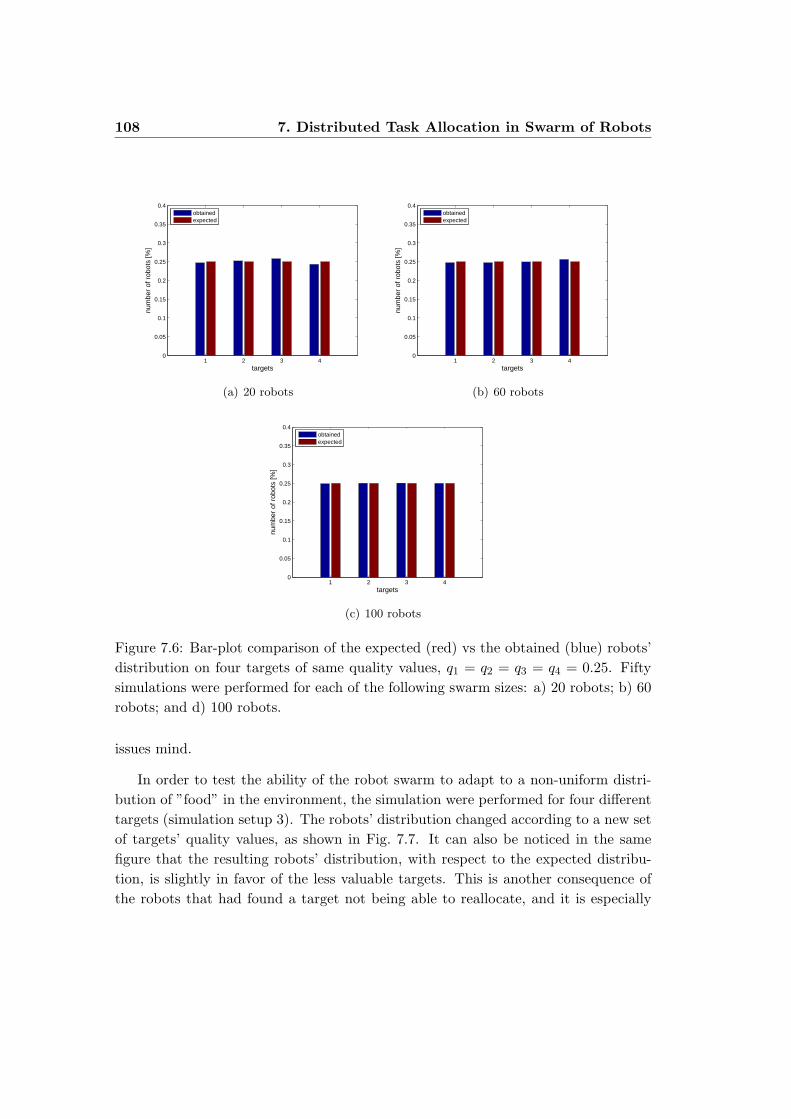
108 7. Distributed Task Allocation in Swarm of Robots
1 2 3 40
0.05
0.1
0.15
0.2
0.25
0.3
0.35
0.4
targets
num
ber
of r
obot
s [%
]
obtainedexpected
(a) 20 robots
1 2 3 40
0.05
0.1
0.15
0.2
0.25
0.3
0.35
0.4
targets
num
ber
of r
obot
s [%
]
obtainedexpected
(b) 60 robots
1 2 3 40
0.05
0.1
0.15
0.2
0.25
0.3
0.35
0.4
targets
num
ber
of r
obot
s [%
]
obtainedexpected
(c) 100 robots
Figure 7.6: Bar-plot comparison of the expected (red) vs the obtained (blue) robots’distribution on four targets of same quality values, q1 = q2 = q3 = q4 = 0.25. Fiftysimulations were performed for each of the following swarm sizes: a) 20 robots; b) 60robots; and d) 100 robots.
issues mind.
In order to test the ability of the robot swarm to adapt to a non-uniform distri-bution of ”food” in the environment, the simulation were performed for four differenttargets (simulation setup 3). The robots’ distribution changed according to a new setof targets’ quality values, as shown in Fig. 7.7. It can also be noticed in the samefigure that the resulting robots’ distribution, with respect to the expected distribu-tion, is slightly in favor of the less valuable targets. This is another consequence ofthe robots that had found a target not being able to reallocate, and it is especially
7.5. Evaluation Through Simulations 109
1 2 3 40
0.05
0.1
0.15
0.2
0.25
0.3
0.35
0.4
0.45
0.5
targets
num
ber
of r
obot
s [%
]
obtainedexpected
(a) 20 robots
1 2 3 40
0.05
0.1
0.15
0.2
0.25
0.3
0.35
0.4
0.45
0.5
targets
num
ber
of r
obot
s [%
]
obtainedexpected
(b) 60 robots
1 2 3 40
0.05
0.1
0.15
0.2
0.25
0.3
0.35
0.4
0.45
0.5
targets
num
ber
of r
obot
s [%
]
obtainedexpected
(c) 100 robots
Figure 7.7: Bar-plot comparison of the expected (red) vs the obtained (blue) robots’distribution on four targets of different quality values, q1 = 0.1, q2 = 0.2, q3 = 0.3,and q4 = 0.4. Fifty simulations were performed for each of the following swarm sizes:a) 20 robots; b) 60 robots; and d) 100 robots.
evident for smaller robot swarms. For example, let’s consider a swarm of 10 robots insearch of 4 different targets, as shown in Fig. 7.7(a). If in the random target searchprocess two robots find the target with the associated quality value of 0.1, then thefinal relative frequency for this target cannot be less than 0.2 (2 out of 10 robots)which is already above the expected value of 0.1. Although for the larger swarms theeffect of the initial robot distribution becomes less relevant, it is always present.
The control parameters, α and β, were introduced in (7.6) to compensate for thebiased distribution, but also to allow us to give more relevance to either the quality
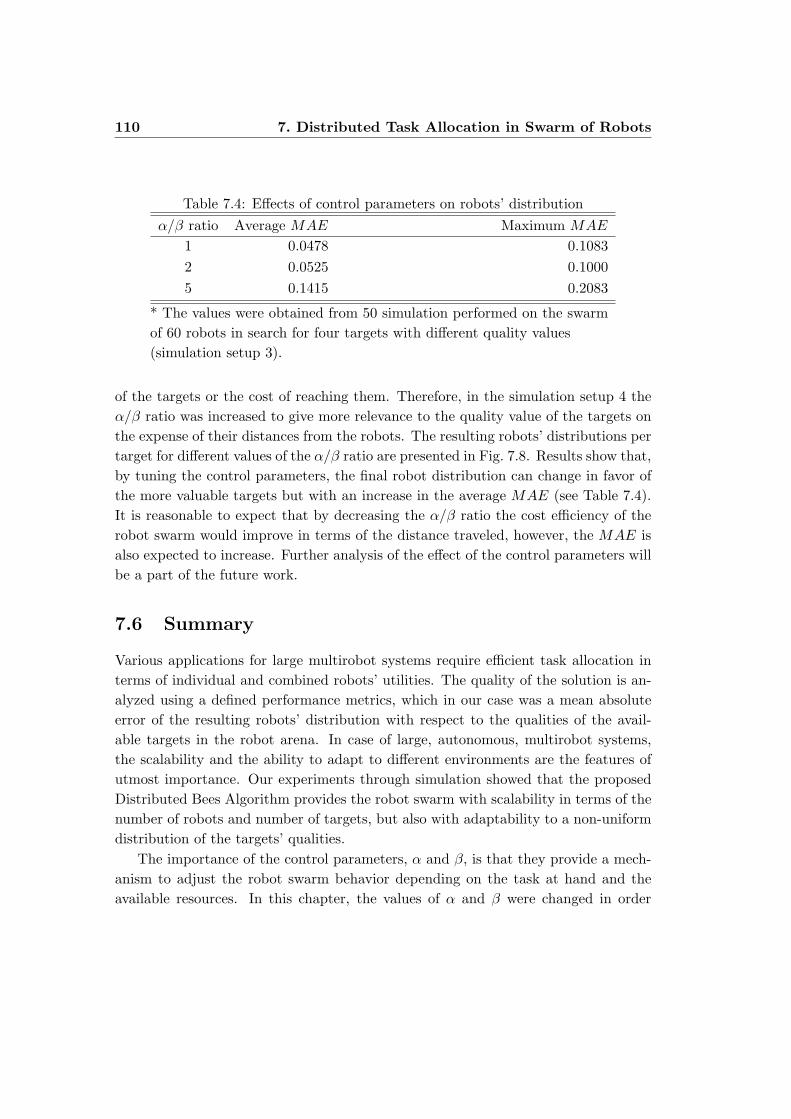
110 7. Distributed Task Allocation in Swarm of Robots
Table 7.4: Effects of control parameters on robots’ distributionα/β ratio Average MAE Maximum MAE
1 0.0478 0.10832 0.0525 0.10005 0.1415 0.2083
* The values were obtained from 50 simulation performed on the swarmof 60 robots in search for four targets with different quality values(simulation setup 3).
of the targets or the cost of reaching them. Therefore, in the simulation setup 4 theα/β ratio was increased to give more relevance to the quality value of the targets onthe expense of their distances from the robots. The resulting robots’ distributions pertarget for different values of the α/β ratio are presented in Fig. 7.8. Results show that,by tuning the control parameters, the final robot distribution can change in favor ofthe more valuable targets but with an increase in the average MAE (see Table 7.4).It is reasonable to expect that by decreasing the α/β ratio the cost efficiency of therobot swarm would improve in terms of the distance traveled, however, the MAE isalso expected to increase. Further analysis of the effect of the control parameters willbe a part of the future work.
7.6 Summary
Various applications for large multirobot systems require efficient task allocation interms of individual and combined robots’ utilities. The quality of the solution is an-alyzed using a defined performance metrics, which in our case was a mean absoluteerror of the resulting robots’ distribution with respect to the qualities of the avail-able targets in the robot arena. In case of large, autonomous, multirobot systems,the scalability and the ability to adapt to different environments are the features ofutmost importance. Our experiments through simulation showed that the proposedDistributed Bees Algorithm provides the robot swarm with scalability in terms of thenumber of robots and number of targets, but also with adaptability to a non-uniformdistribution of the targets’ qualities.
The importance of the control parameters, α and β, is that they provide a mech-anism to adjust the robot swarm behavior depending on the task at hand and theavailable resources. In this chapter, the values of α and β were changed in order

7.6. Summary 111
1 2 3 40
0.05
0.1
0.15
0.2
0.25
0.3
0.35
0.4
0.45
0.5
targets
num
ber
of r
obot
s [%
]
obtainedexpected
(a) α/β = 1
1 2 3 40
0.1
0.2
0.3
0.4
0.5
0.6
0.7
targets
num
ber
of r
obot
s [%
]
obtainedexpected
(b) α/β = 2
1 2 3 40
0.1
0.2
0.3
0.4
0.5
0.6
0.7
targets
num
ber
of r
obot
s [%
]
obtainedexpected
(c) α/β = 5
Figure 7.8: Effects of the control parameters, α and β, on the final robots’ distribution.Target allocation was performed with 60 robots as described in the simulation setup3 consisting of 4 targets with different quality values: q1 = 0.1, q2 = 0.2, q3 = 0.3,and q4 = 0.4. The results of the robots’ distribution per target are shown for thefollowing values of α/β ratio: a) α/β = 1; b) α/β = 2; c) α/β = 5. The values wereobtained from 50 simulations for each scenario.
to bias the resulting robots’ distribution towards the more favorable targets. Fu-ture work will include the analysis of the effect of these parameters in terms of thetask-allocation cost with respect to the distance traveled by the robots.

112 7. Distributed Task Allocation in Swarm of Robots

Part IV
Conclusions and Future Work

Chapter 8
Conclusions
Swarm Intelligence is a useful tool for solving a number of real-world problems. Thedecentralized approach in the design of multi-agent systems offers many advantagessuch as greater autonomy, scalability, robustness, and adaptability to a dynamicallychanging environment. In addition, this approach allows the development of SwarmIntelligence tools that can be used for optimization and feature extraction.
Swarming behavior in nature is a result of the evolution process, and providesus with an important advantage in solving complex problems, because through thisbehavior animal swarms have been able to withstand the challenges of nature, whichwas crucial for their survival. The foraging of ant and bee colonies inspired many algo-rithms whose initial purpose was to solve combinatorial optimization problems. Theemergent properties of the swarming behavior were later used for a new problem-solving approach in applications of function minimization, network routing, imageprocessing, data clustering, etc. Although the biological plausibility of Swarm In-telligence algorithms can be a matter of study from the biologists’ point of view, incomputer science and engineering, the researchers are guided by efficiency, flexibility,robustness and cost as possible criteria.
In this dissertation, we proposed a general design methodology for Swarm In-telligence tools. The proposed methodology was implemented in several applicationdomains, which serve as illustrative examples. The methodology assumes a discretedata space defined by nodes on which the agents in the swarm move. The underlyingdecision-making mechanism adopts the roulette-wheel selection rule. That is, everynode has an associated probability with which it is chosen from a set of availablenodes. The probability values are calculated from the application-specific variables.Each agent autonomously calculates the probabilities of displacement to each node
116 8. Conclusions
in its neighborhood and chooses the next node by ”spinning the wheel”. By movingfrom node to node, the agents alter the environment that surrounds them, and theglobal patterns that emerge as the result of this behavior represent solutions to thegiven problem.
In this dissertation, the research in Swarm Intelligence focused on two generalapproaches. One approach was to solve the optimization-like problems using theswarm-based algorithms as tools, and the other approach was to model the multi-agent systems such that they resemble swarms of animals in nature providing themwith the ability to autonomously perform a task at hand. This line of research hasexplored various applications for Swarm Intelligence principles, such as combinatorialoptimization, image processing, data clustering, and distributed task allocation formulti-agent systems.
8.1 Summary of Contributions
The original contributions are made in the areas of design methodology and applica-tion of Swarm Intelligence tools. More specifically, the contributions of this disserta-tion are the following:
• To propose a general design methodology for Swarm Intelligencetools.
We proposed a unified probabilistic decision-making rule for local interaction asa general design methodology for Swarm Intelligence tools in various applicationdomains. The methodology requires the definition of a discrete data space inwhich the agents move, the set of application-specific variables, and the objectivefunction for solutions evaluation.
• To validate the proposed methodology in a real-world scenario.
The methodology was validated on the scenario of Unmanned Aerial Vehiclepath optimization, treated as a combinatorial optimization problem. A colonyof artificial ants was used to successfully find the optimal path for a set of thegiven waypoints, and the proposed method improved the system’s performancein terms of time and resources needed for the UAV’s flight. (Jevtic et al., 2010a).
Further, based on the proposed general methodology, we developed a set of noveltools that can be seen as illustrative examples of its implementation. These tools arethe following:
8.1. Summary of Contributions 117
• Novel Swarm Intelligence method for adaptive edge detection in dig-ital images.
The proposed edge detector was inspired by the foraging behavior of ant colonies,where the discrete space in which the ants move is defined by pixels in digitalimage. The pixels are featured by the gray-level intensity value. The artifi-cial ants search for the pixels where distinct intensity changes occur, and theamount of the pheromone deposit that they lay on their path reflects the de-tected change in contrast. The accumulated pheromone trails attract other antsin the swarm to follow the marked route, and the emerging pheromone struc-ture is a result of the cooperative behavior and indirect communication viaenvironment. The accumulated pheromone represents the found true edges inthe image. The images were preprocessed using the Multiscale Adaptive Gainfor nonlinear contrast enhancement. (Jevtic et al., 2009b).
The proposed method includes several parameters that are selected for efficientedge detection, and their further optimization could improve the overall perfor-mance. It was demonstrated through experiments that the proposed methodoutperforms other state-of-the-art ant colony-based edge detectors. In compar-ison to the conventional edge detectors that were not based on Swarm Intelli-gence, the proposed method has a higher computational cost. The analysis ofthe algorithm’s adaptability was performed on a dynamically changing set ofimages. The algorithm successfully adapts to these changes, which is reflectedin emergence of different global pheromone patterns. The adaptive behavior ofartificial ants colonies can be applied to any type of digital habitat, which canlead to a new set of applications. (Jevtic and Andina, 2010).
• Novel Swarm Intelligence method for broken-edge linking in digitalimages.
The proposed method applies the path optimization concept inherent to antcolonies in finding the optimal solutions for missing edge segments. This methodcan serve as a complementary tool to any edge detector. One of novelties ofthe proposed method was the introduction of the grayscale visibility matrixto define the fitness function for the evaluation of the found edge segments.The favorable solutions were the edge segments that contained less pixels andhad higher mean and lower standard deviation of the pixels’ grayscale visibility.The advantage of the proposed method was in applying the grayscale visibilitymatrix as the initial pheromone trail matrix which increased the probability
118 8. Conclusions
that the pixels belonging to the true edges are being chosen by the ants on theirinitial routes, which reduced the computational load. The effectiveness of theproposed method was demonstrated on a set of different test images and theexperimental results confirmed its excellent performance. (Jevtic et al., 2009a).
• Novel Swarm Intelligence method for cluster analysis.
The proposed Ant System-based Clustering Algorithm (ASCA) applies thepheromone-laying and pheromone-following concept of ant colonies to createa pheromone map in the data space. The highest concentration of pheromonedeposits are found around clusters centers. Therefore, the proposed methodcan be applied to extract the number of clusters from a data set, and is alsoan efficient tool for detecting groups of atypical data patterns. The methodwas applied as an image-segmentation tool, specifically for detection of small,atypical groups of pixels. This represents a very useful feature for a varietyof computer vision applications such as digital mammography, detection of in-dustrial design imperfections, etc. In the experiments, the proposed methodoutperformed the state-of-the-art algorithms such as 1D-SOM, k-Means, FCMand PFCM. (Jevtic et al., 2011b).
• Novel Swarm Intelligence method for distributed task allocation inmulti-agent systems.
The proposed Distributed Bees Algorithm (DBA) was applied to the problem oftarget allocation in a swarm of robots. The expected distribution of the robotsis obtained from the targets’ quality values, which represent how rewardingthe given targets are. The solution was evaluated using a defined performancemetrics, which in our case was the mean absolute error of the resulting robots’distribution with respect to their expected distribution. The algorithm was val-idated through experiments with real robots. The odometry error of the mobilerobots was used as an advantage to group the robots around the found targets.The experimental results were used to obtain the time threshold for scenarioexecution, in order to maintain the odometry error within the predefined limit.(Jevtic et al., 2010b).
The simulator was developed to test the scalability of the proposed method. Ourexperiments showed that the proposed DBA provides the robot swarm withscalability in terms of the number of robots and number of targets, but alsowith adaptability to a non-uniform distribution of the targets’ qualities. Two
8.2. Future Work 119
parameters were used to control the importance level of the targets’ distancesand qualities. They provide a mechanism to adjust the robot swarm behaviordepending on the task at hand and the available resources. (Jevtic et al., 2011a).
8.2 Future Work
With the experience gained from the work on various applications of Swarm Intelli-gence, the following lines of future research work are proposed:
• Optimization and automatic detection of the parameters of the proposed edgedetection method for improved image segmentation results. Until now theseparameters were experimentally obtained.
• Extension of the work on the edge detection algorithm’s adaptability in orderto apply it to other digital habitats. The algorithm optimization for fasterexecution would make it suitable for real-time image processing.
• The parameters of the proposed broken-edge linking method were experimen-tally obtained. The parameters’ optimization, and the evaluation of the foundedge segments with a novel fitness function, could be applied for improved edgedetection.
• Combination of the edge detector with the broken-edge linking algorithm in or-der to develop a more exhaustive edge-detection method. Further optimizationof the hybrid algorithm’s parameters should also provide a better performancein terms of speed and edges’ quality. Modification of the two methods, and thehybrid method, for edge detection in color images can open a wide range of newapplications.
• The proposed data-clustering algorithm is an initial variant and leaves spacefor improvements. Future work will include the optimization of the algorithm’sparameters in order to improve the adaptability of the algorithm to differentdata sets. For the task of image processing, more features such as spatial in-formation or texture can be used to obtain better segmentation results. Also,testing the algorithm on the color images may open a wide range of computervision applications.
• Testing of the proposed Distributed Bees Algorithm on a large number of robotsin a real-world scenario such as exploration, search and rescue, etc. Modifica-
120 8. Conclusions
tions of the algorithm would be required to adjust to different types of commu-nication between the robots, such as ZigBee, Infrared, field markers, etc.
• Extension of the work on the adaptability of large and complex multi-agentsystems, and predictability of their behavior, in order to develop a paradigm forcollaborative robotic swarms. The following objectives should be accomplished:i) to create a theoretical framework for the emergent systems that are based onthe rules of local interactions which are associated as instances from swarms’level goals and tasks of interaction and collaboration; ii) to provide verificationtools and methodology to formally specify and verify robustness, dependability,adaptability, manageability, and safety of the swarms; iii) to create a virtualprototype to test the framework, tools and methodology, and manageabilityand other activities of cognitive systems in virtual environment; iv) to develop,implement and test an integrated, adaptive robotic system, a cognitive systemwhich is made of multiple heterogeneous agents of different capabilities andgrouped in swarms.
So far, this line of research was carried out in the domain of computer scienceand engineering, but it supports applications that go beyond that as the modeling ofmulti-agent systems can be carried over to the domains of biology, medicine, sociol-ogy, economy, business, etc. The processes in nature and many processes in humansociety show emergent properties that are the result of multiple interactions betweenlarge numbers of individuals. Many scientific disciplines try different approaches inorder to describe this phenomenon. By determining the relation between the stochas-tic processes on a lower level and the organized complexity on the system’s globallevel, the predictability of such systems could be improved. This would have a highimpact in the above-mentioned application domains, naming for example the econ-omy and the predictability of the market. But also, the research on the models ofComputational Swarm Intelligence can provide important feedback for the study ofthe natural swarms from which they were inspired.
Bibliography
Afshar, A., Bozorg Haddad, O., Marino, M. A., and Adams, B. J. (2007). Honey-beemating optimization (HBMO) algorithm for optimal reservoir operation. Journalof the Franklin Institute, 344(5):452–462.
Alarcon-Mondejar, M. J., Zorzano-Mier, F. J., Jevtic, A., and Andina, D. (2008).Telecommunications network planning and maintenance. In Proceedings of the 12thWorld Multi-Conference on Systemics, Cybernetics and Informatics, WMSCI 2008,volume 8, pages 64–68.
Andina, D. and Jevtic, A. (2007a). Comparison results between usual backpropa-gation and modified backpropagation with weighting. In Proceedings of the 11thWSEAS CSCC 2007: Systems Theory and Applications, volume 2, pages 243–247.
Andina, D. and Jevtic, A. (2007b). Improved multilayer perceptron design byweighted learning. In Proceedings of the IEEE International Symposium on In-dustrial Electronics, ISIE 2007, pages 3424–3429.
Andina, D., Jevtic, A., Marcano-Cedeno, A., and Barron-Adame, J. M. (2007). Er-ror weighting in artificial neural networks learning interpreted as a metaplasticitymodel. In Mira, J. and Alvarez, J., editors, Bio-inspired Modeling of CognitiveTasks, volume 4527 of Lecture Notes in Computer Science, pages 244–252. SpringerBerlin / Heidelberg.
Andina, D. and Pham, D. T. (2007). Computational Intelligence: For Engineeringand Manufacturing. Springer-Verlag New York, Inc., Secaucus, NJ, USA.
Arya, S., Mount, D. M., Netanyahu, N. S., Silverman, R., and Wu, A. Y. (1998). Anoptimal algorithm for approximate nearest neighbor searching fixed dimensions.Journal of the ACM, 45(6):891–923.

122 BIBLIOGRAPHY
Awad, M., Chehdi, K., and Nasri, A. (2009). Multi-component image segmentationusing a hybrid dynamic genetic algorithm and fuzzy c-means. IET Image Process-ing, 3(2):52–62.
Bailis, P., Nagpal, R., and Werfel, J. (2010). Positional communication and privateinformation in honeybee foraging models. In Dorigo, M., Birattari, M., Di Caro, G.,Doursat, R., Engelbrecht, A., Floreano, D., Gambardella, L., Groß, R., Sahin, E.,Sayama, H., and Stutzle, T., editors, Swarm Intelligence, volume 6234 of LectureNotes in Computer Science, pages 263–274. Springer Berlin / Heidelberg.
Barron-Adame, J. M., Herrera-Delgado, J. A., Cortina-Januchs, M. G., Andina,D., and Vega-Corona, A. (2007). Air pollutant level estimation applying a self-organizing neural network. In Mira, J. and Alvarez, J., editors, Nature InspiredProblem-Solving Methods in Knowledge Engineering, volume 4528 of Lecture Notesin Computer Science, pages 599–607. Springer Berlin / Heidelberg.
Beni, G. and Wang, J. (1989). Swarm intelligence in cellular robotic systems. InProceedings of the NATO Advanced Workshop on Robotics and Biological Systems,Il Ciocco, Tuscany, Italy.
Berman, S., Halasz, A., Hsieh, M. A., and Kumar, V. (2009). Optimized stochasticpolicies for task allocation in swarms of robots. IEEE Transactions on Robotics,25(4):927–937.
Berman, S., Halasz, A., Kumar, V., and Pratt, S. (2007). Bio-inspired group behaviorsfor the deployment of a swarm of robots to multiple destinations. In Proceedingsof the 2007 IEEE International Conference on Robotics and Automation, pages2318–2323.
Bezdek, J. C. (1981). Pattern Recognition with Fuzzy Objective Function Algorithms.Kluwer Academic Publishers, Norwell, MA, USA.
Blum, C. and Dorigo, M. (2004). The hyper-cube framework for ant colonyoptimization. IEEE Transactions on Systems, Man & Cybernetics, Part B: Cyber-netics, 34(2):1161–1172.
Bonabeau, E., Dorigo, M., and Theraulaz, G. (1999). Swarm intelligence: Fromnatural to artificial systems. Oxford University Press, Inc., New York, NY, USA.
Bonomi, E. and Lutton, J.-L. (1984). The n-city travelling salesman problem: Sta-tistical mechanics and the metropolis algorithm. SIAM Review, 26(4):551–568.
BIBLIOGRAPHY 123
Breder, C. M. (1954). Equations descriptive of fish schools and other animal aggre-gations. Ecology, 35(3):361–370.
Bullnheimer, B., Hartl, R. F., and Strauß, C. (1999). A new rank based version ofthe Ant System: A computational study. Central European Journal for OperationsResearch & Economics, 7(1):25–38.
Burgard, W., Moors, M., Stachniss, C., and Schneider, F. E. (2005). Coordinatedmulti-robot exploration. IEEE Transactions on Robotics, 21(3):376–386.
Cai, W., Chen, S., and Zhang, D. (2007). Fast and robust fuzzy c-means cluster-ing algorithms incorporating local information for image segmentation. PatternRecognition, 40(3):825–838.
Camazine, S., Franks, N. R., Sneyd, J., Bonabeau, E., Deneubourg, J.-L., and Ther-aulaz, G. (2001). Self-Organization in Biological Systems. Princeton UniversityPress, Princeton, NJ, USA.
Campo, A. and Dorigo, M. (2007). Efficient multi-foraging in swarm robotics. In Pro-ceedings of the 9th European Conference on Advances in Artificial Life. ECAL’07,pages 696–705, Berlin, Heidelberg. Springer-Verlag.
Canny, J. (1986). A computational approach to edge detection. IEEE Transactionson Pattern Analysis & Machine Intelligence, 8:679–714.
Chang, K.-C. and Yeh, M.-F. (2005). Grey relational analysis based approach for dataclustering. IEE Proceedings - Vision, Image & Signal Processing, 152(2):165–172.
Chu, S.-C., Roddick, J. F., Su, C.-J., and Pan, J.-S. (2004). Constrained ant colonyoptimization for data clustering. In Zhang, C., Guesgen, H. W., and Yeap, W. K.,editors, PRICAI 2004: Trends in Artificial Intelligence, volume 3157 of LectureNotes in Computer Science, pages 534–543. Springer Berlin / Heidelberg.
Chuang, K. S., Tzeng, H. L., Chen, S., Wu, J., and Chen, T. J. (2006). Fuzzy c-meansclustering with spatial information for image segmentation. Computerized MedicalImaging & Graphics, 30(1):9–15.
Cordon, O., Fernandez de Viana, I., Herrera, F., and Moreno, L. (2000). A new ACO
model integrating evolutionary computation concepts: The best-worst Ant System.In Dorigo, M., Middendorf, M., and Sttzle, T., editors, Abstract Proceedings of
124 BIBLIOGRAPHY
ANTS’2000–From Ant Colonies to Artificial Ants, International Workshops on AntAlgorithms, pages 22–29. Universite Libre de Bruxelles, Belgium.
Cortina-Januchs, M. G., Quintanilla-Domınguez, J., Jevtic, A., and Andina, D.(2008). Telecommunications network planning and maintenance. In Proceedingsof the 12th World Multi-Conference on Systemics, Cybernetics and Informatics,WMSCI 2008, volume 8, pages 74–79.
Crespi, V., Galstyan, A., and Lerman, K. (2008). Top-down vs bottom-up method-ologies in multi-agent system design. Autonomous Robots, 24(3):303–313.
Danahy, E. E., Panetta, K. A., and Agaian, S. S. (2007). Coordinate logic transformsand their use in the detection of edges within binary and grayscale images. In IEEEInternational Conference on Image Processing, 2007. ICIP 2007., volume 3, pagesIII–53–III–56.
Deneubourg, J. L., Aron, S., Goss, S., and Pasteels, J. M. (1990). The self-organizingexploratory pattern of the argentine ant. Journal of Insect Behavior, 3(2):159–168.
Deneubourg, J. L., Goss, S., Franks, N., Sendova-Franks, A., Detrain, C., andChretien, L. (1991). The dynamics of collective sorting robot-like ants and ant-like robots. In Proceedings of the 1st International Conference on Simulation ofAdaptive Behavior on From Animals to Animats, pages 356–363, Cambridge, MA,USA. MIT Press.
Dias, M. B., Zlot, R., Kalra, N., and Stentz, A. (2006). Market-based multirobotcoordination: A survey and analysis. Proceedings of the IEEE, 94(7):1257–1270.
Doctor, S., Venayagamoorthy, G. K., and Gudise, V. G. (2004). Optimal PSO forcollective robotic search applications. In Proceedings of the 2004 Congress on Evo-lutionary Computation, CEC2004, volume 2, pages 1390–1395.
Dorigo, M. and Blum, C. (2005). Ant Colony Optimization theory: A survey. Theo-retical Computer Science, 344:243–278.
Dorigo, M. and Gambardella, L. M. (1997). Ant Colony System: A cooperatinglearning approach to the traveling salesman problem. IEEE Transactions on Evo-lutionary Computing, 1(1):53–66.
BIBLIOGRAPHY 125
Dorigo, M., Maniezzo, V., and Colorni, A. (1996). Ant System: Optimization by acolony of cooperating agents. IEEE Transactions on Systems, Man & Cybernetics,Part B: Cybernetics, 26(1):29–41.
Dorigo, M. and Stutzle, T. (2004). Ant Colony Optimization. MIT Press, Cambridge,MA, USA.
Duan, H.-b., Zhang, X.-y., Wu, J., and Ma, G.-j. (2009). Max-min adaptive antcolony optimization approach to multi-UAVs coordinated trajectory replanning indynamic and uncertain environments. Journal of Bionic Engineering, 6(2):161–173.
Dudek, G., Jenkin, M., and Milios, E. (2002). A taxonomy of multirobot systems. InBalch, T. and Parker, L., editors, Robot Teams: From Diversity to Polymorphism,pages 3–22. A.K. Peters, Natick, Massachusetts.
Eberhart, R. C. and Shi, Y. (2000). Comparing inertia weights and constrictionfactors in Particle Swarm Optimization. In Proceedings of the 2000 Congress onEvolutionary Computation, volume 1, pages 84–88.
Engelbrecht, A. P. (2005). Fundamentals of Computational Swarm Intelligence. JohnWiley & Sons, Ltd, Chichester, UK.
Farinelli, A., Iocchi, L., Nardi, D., and Ziparo, V. A. (2006). Assignment of dynam-ically perceived tasks by token passing in multirobot systems. Proceedings of theIEEE, 94(7):1271–1288.
Franchi, A., Freda, L., Oriolo, G., and Vendittelli, M. (2009). The sensor-based ran-dom graph method for cooperative robot exploration. IEEE/ASME Transactionson Mechatronics, 14(2):163–175.
Gambardella, L. M. and Dorigo, M. (1995). Ant-Q: A reinforcement learning ap-proach to the traveling salesman problem. In Prieditis, A. and Russell, S., editors,Proceedings of the 12th International Conference on Machine Learning, pages 252–260. Morgan Kaufmann Publishers.
Gerkey, B. P. and Mataric, M. J. (2004). A Formal Analysis and Taxonomy ofTask Allocation in Multi-Robot Systems. The International Journal of RoboticsResearch, 23(9):939–954.
Golden, B. L. and Skiscim, C. C. (1986). Using simulated annealing to solve routingand location problems. Naval Research Logistics Quarterly, 33(2):261–279.
126 BIBLIOGRAPHY
Gomez, J. and Jamshidi, M. (2010). Fuzzy adaptive control for a UAV. Journal ofIntelligent & Robotic Systems, pages 1–23.
Gonzalez, R. C. and Woods, R. E. (2008). Digital Image Processing. Prentice Hall,New Jersey, USA, 3rd edition.
Grau, J. B., Anton, J. M., Packianather, M. S., Ermolov, I., Aphanasiev, R., Cisneros,J. M., Cortina-Januchs, M. G., Jevtic, A., and Andina, D. (2009). Sustainableagriculture using an intelligent mechatronic system. In Proceedings of the 35thAnnual Conference of IEEE Industrial Electronics, IECON ’09, pages 3416–3421.
Grefenstette, J. J., Gopal, R., Rosmaita, B. J., and Gucht, D. V. (1985). Geneticalgorithms for the traveling salesman problem. In Proceedings of the 1st Interna-tional Conference on Genetic Algorithms, pages 160–168, Hillsdale, NJ, USA. L.Erlbaum Associates Inc.
Groß, R., Nouyan, S., Bonani, M., Mondada, F., and Dorigo, M. (2008). Division oflabour in self-organised groups. In Proceedings of the 10th international conferenceon Simulation of Adaptive Behavior: From Animals to Animats, SAB ’08, pages426–436, Berlin, Heidelberg. Springer-Verlag.
Gutierrez, A., Campo, A., Monasterio-Huelin, F., Magdalena, L., and Dorigo, M.(2010). Collective decision-making based on social odometry. Neural Computing &Applications, 19(6):807–823.
Gutierrez, A., Campo, A., Santos, F. C., Monasterio-Huelin, F., and Dorigo, M.(2009). Social odometry: Imitation based odometry in collective robotics. Interna-tional Journal of Advanced Robotic Systems, 26(2):129–136.
Hamilton, W. D. (1971). Geometry for the selfish herd. Journal of Theoretical Biology,31(2):295–311.
Handl, J., Knowles, J., and Dorigo, M. (2006). Ant-based clustering and topographicmapping. Artificial Life, 12(1):35–61.
Handl, J. and Meyer, B. (2002). Improved ant-based clustering and sorting in adocument retrieval interface. In Guervos, J., Adamidis, P., Beyer, H.-G., Schwe-fel, H.-P., and Fernandez-Villaca˜as, J.-L., editors, Parallel Problem Solving fromNature – PPSN VII, volume 2439 of Lecture Notes in Computer Science, pages913–923. Springer Berlin / Heidelberg.
BIBLIOGRAPHY 127
Handl, J. and Meyer, B. (2007). Ant-based and swarm-based clustering. SwarmIntelligence, 1(2):95–113.
He, X., Jia, W., Hur, N., Wu, Q., Kim, J., and Hintz, T. (2006). Bilateral edgedetection on a virtual hexagonal structure. In Bebis, G., Boyle, R., Parvin, B.,Koracin, D., Remagnino, P., Nefian, A., Meenakshisundaram, G., Pascucci, V.,Zara, J., Molineros, J., Theisel, H., and Malzbender, T., editors, Advances in VisualComputing, volume 4292 of Lecture Notes in Computer Science, pages 176–185.Springer Berlin / Heidelberg.
Huang, P., Cao, H., and Luo, S. (2008). An artificial ant colonies approach to medicalimage segmentation. Computer Methods & Programs in Biomedicine, 92:267–273.
Jaimes, A. and Jamshidi, M. (2010). Consensus-based and network control of UAVs.In Proceedings of the 5th IEEE International Conference on System of SystemsEngineering (SoSE 2010), pages 1–6.
Jain, A. K., Murty, M. N., and Flynn, P. J. (1999). Data clustering: A review. ACMComputing Surveys, 31(3):264–323.
Jamshidi, M. (2009). System of Systems Engineering - Innovations for the 21st Cen-tury. John Wiley & Sons, New York, NY, USA.
Jevtic, A. and Andina, D. (2010). Adaptive artificial ant colonies for edge detectionin digital images. In Proceedings of the 36th Annual Conference on IEEE IndustrialElectronics Society, IECON 2010, pages 2813–2816.
Jevtic, A., Andina, D., Jaimes, A., Gomez, J., and Jamshidi, M. (2010a). Unmannedaerial vehicle route optimization using Ant System algorithm. In Proceedings ofthe 5th IEEE International Conference on System of Systems Engineering, SoSE2010, pages 1–6.
Jevtic, A., Gazi, P., Andina, D., and Jamshidi, M. (2010b). Building a swarm ofrobotic bees. In 2010 World Automation Congress, WAC 2010, pages 1–6.
Jevtic, A., Gutierrez-Martın, A., Andina, D., and Jamshidi, M. (2011a). DistributedBees Algorithm for task allocation in swarm of robots. IEEE Systems Journal, Inpreparation.
128 BIBLIOGRAPHY
Jevtic, A., Melgar, I., and Andina, D. (2009a). Ant based edge linking algorithm.In Proceedings of the 35th Annual Conference of the IEEE Industrial ElectronicsSociety, IECON 2009, pages 3353–3358.
Jevtic, A., Quintanilla-Domınguez, J., Barron-Adame, J. M., and Andina, D. (2011b).Image segmentation using Ant System-based Clustering Algorithm. In Interna-tional Conference on Soft Computing Models in Industrial & Environmental Appli-cations, SOCO 2011. Accepted for publication.
Jevtic, A., Quintanilla-Domınguez, J., Cortina-Januchs, M. G., and Andina, D.(2009b). Edge detection using ant colony search algorithm and multiscale con-trast enhancement. In Proceedings of the 2009 IEEE International Conference onSystems, Man & Cybernetics, SMC 2009, pages 2193–2198.
Jiang, J. A., Chuang, C. L., Lu, Y. L., and Fahn, C. S. (2007). Mathematical-morphology-based edge detectors for detection of thin edges in low-contrast regions.IET Image Processing, 1(3):269–277.
Jiang, Y. and Zhou, Z.-H. (2004). SOM ensemble-based image segmentation. NeuralProcessing Letters, 20:171–178.
Johnson, D. S. and McGeoch, L. A. (1997). The traveling salesman problem: A casestudy in local optimization. In Aarts, E. H. L. and Lenstra, J. K., editors, LocalSearch in Combinatorial Optimization, pages 215–310. John Wiley and Sons Ltd.,Chichester, UK.
Joordens, M. A. and Jamshidi, M. (2010). Consensus control for a system of under-water swarm robots. IEEE Systems Journal, 4(1):65–73.
Junwei, T. and Yongxuan, H. (2007). Histogram constraint based fast FCM clus-ter image segmentation. In Proceedings of the IEEE International Symposium onIndustrial Electronics, 2007. ISIE 2007., pages 1623–1627.
Kanungo, T., Mount, D. M., Netanyahu, N. S., Piatko, C. D., Silverman, R., andWu, A. Y. (2002). An efficient k-means clustering algorithm: Analysis and im-plementation. IEEE Transactions on Pattern Analysis & Machine Intelligence,24(7):881–892.
Karaboga, D. and Akay, B. (2009). A comparative study of artificial bee colonyalgorithm. Applied Mathematics and Computation, 214(1):108–132.
BIBLIOGRAPHY 129
Keller, E. F. and Segel, L. A. (1970). Initiation of slime mold aggregation viewed asan instability. Journal of Theoretical Biology, 26(3):399–415.
Kennedy, J. and Eberhart, R. C. (1995). Particle Swarm Optimisation. In Proceedingsof the IEEE International Conference on Neural Networks, volume 4, pages 1942–1948, Piscataway, NJ, USA. IEEE service center.
Kennedy, J., Eberhart, R. C., and Shi, Y. (2001). Swarm Intelligence. MorganKaufmann, San Francisco, CA, USA.
Khajehpour, P., Lucas, C., and Araabi, B. N. (2005). Hierarchical image segmentationusing ant colony and chemical computing approach. In Wang, L., Chen, K., andS. Ong, Y., editors, Advances in Natural Computation, volume 3611 of LectureNotes in Computer Science, pages 1250–1258. Springer Berlin / Heidelberg.
Knox, J. (1994). Tabu search performance on the symmetric traveling salesmanproblem. Computers & Operations Research, 21(8):867–876.
Kohonen, T. (1990). The self-organizing map. Proceedings of the IEEE, 78(9):1464–1480.
Kotsiantis, S. B. and Pintelas, P. E. (2004). Recent advances in clustering: A briefsurvey. WSEAS Transactions on Information Science & Applications, 1(1):73–81.
Krishnapuram, R. and Keller, J. M. (1993). A possibilistic approach to clustering.IEEE Transactions on Fuzzy Systems, 1(2):98–110.
Labella, T. H., Dorigo, M., and Deneubourg, J.-L. (2006). Division of labor in a groupof robots inspired by ants’ foraging behavior. ACM Transactions on Autonomous& Adaptive Systems, 1(1):4–25.
Lai, J. Z. C. and Liaw, Y.-C. (2008). Improvement of the k-means clustering filteringalgorithm. Pattern Recognition, 41(12):3677–3681.
Laine, A. F., Schuler, S., Fan, J., and Huda, W. (1994). Mammographic featureenhancement by multiscale analysis. IEEE Transactions on Medical Imaging,13(4):725–740.
Lawler, E. L., Lenstra, J. K., Rinnooy-Kan, A. H. G., and Shmoys, D. B. (1985). Thetraveling salesman problem. John Wiley & Sons, Chichester, UK.

130 BIBLIOGRAPHY
Lerman, K., Jones, C., Galstyan, A., and Mataric, M. J. (2006). Analysis of dynamictask allocation in multi-robot systems. International Journal of Robotics Research,25(3):225–241.
Li, Q., Mitianoudis, N., and Stathaki, T. (2007). Spatial kernel k-harmonic meansclustering for multi-spectral image segmentation. IET Image Processing, 1(2):156–167.
Liew, A. W. C., Leung, S. H., and Lau, W. H. (2000). Fuzzy image clustering incor-porating spatial continuity. IEE Proceedings - Vision, Image & Signal Processing,147(2):185–192.
Lu, D. S. and Chen, C. C. (2008). Edge detection improvement by ant colony opti-mization. Pattern Recognition Letters, 29(4):416–425.
Lumer, E. D. and Faieta, B. (1994). Diversity and adaptation in populations ofclustering ants. In Proceedings of the 3rd International Conference on Simulationof Adaptive Behavior: From Animals to Animats 3, pages 501–508, Cambridge,MA, USA. MIT Press.
Ma, G. J., Duan, H. B., and Liu, S. Q. (2007). Improved ant colony algorithm forglobal optimal trajectory planning of UAV under complex environment. Interna-tional Journal of Computer Science & Applications, 4(3):57–68.
MacQueen, J. B. (1967). Some methods for classification and analysis of multivariateobservations. In Le Cam, L. M. and Neyman, J., editors, Proceedings of the 5thBerkeley Symposium on Mathematical Statistics and Probability - Vol. 1, pages281–297. University of California Press, Berkeley, CA, USA.
Makowski, A. M. (2008). The binary bridge selection problem: Stochastic approxi-mations and the convergence of a learning algorithm. In Proceedings of the 6th in-ternational conference on Ant Colony Optimization and Swarm Intelligence, ANTS’08, pages 167–178, Berlin, Heidelberg. Springer-Verlag.
Maniezzo, V. (1999). Exact and approximate nondeterministic tree-search proceduresfor the quadratic assignment problem. INFORMS Journal on Computing, 11:358–369.
Marcano-Cedeno, A., Jevtic, A., Alvarez Vellisco, A., and Andina, D. (2009). Newartificial metaplasticity mlp results on standard data base. In Cabestany, J., San-
BIBLIOGRAPHY 131
doval, F., Prieto, A., and Corchado, J., editors, Bio-Inspired Systems: Computa-tional and Ambient Intelligence, volume 5517 of Lecture Notes in Computer Science,pages 174–179. Springer Berlin / Heidelberg.
Martin, M., Chopard, B., and Albuquerque, P. (2002). Formation of an ant cemetery:Swarm intelligence or statistical accident? Future Generation Computer Systems,18(7):951–959.
Mataric, M. J., Sukhatme, G. S., and Østergaard, E. H. (2003). Multi-robot taskallocation in uncertain environments. Autonomous Robots, 14(2-3):255–263.
Melgar, I., Fombellida, J., Jevtic, A., and Seijas, J. (2009). Swarm architecturesfor ground-based air defense systems of systems. In Proceedings of the 7th IEEEInternational Conference on Industrial Informatics, INDIN 2009, pages 783–788.
Mertzios, B. G. and Tsirikolias, K. (2001). Applications of coordinate logic filtersin image analysis and pattern recognition. In Proceedings of the 2nd InternationalSymposium on Image and Signal Processing and Analysis, 2001. ISPA 2001., pages125–130.
Michael, N., Zavlanos, M. M., Kumar, V., and Pappas, G. J. (2008). Distributedmulti-robot task assignment and formation control. In Proceedings of the IEEEInternational Conference on Robotics and Automation, 2008. ICRA 2008., pages128–133.
Miranda, V. and Fonseca, N. (2002). EPSO - evolutionary Particle SwarmOptimization, a new algorithm with applications in power systems. In IEEE/PESTransmission and Distribution Conference and Exhibition 2002: Asia Pacific, vol-ume 2, pages 745–750.
Naka, S., Genji, T., Yura, T., and Fukuyama, Y. (2003). A hybrid Particle SwarmOptimization for distribution state estimation. IEEE Transactions on Power Sys-tems, 18(1):60–68.
Nezamabadi-pour, H., Saryazdi, S., and Rashedi, E. (2006). Edge detection using antalgorithms. Soft Computing, 10(7):623–628.
Nguyen, H. D., Yoshihara, I., Yamamori, K., and Yasunaga, M. (2007). Implementa-tion of an effective hybrid GA for large-scale traveling salesman problems. IEEETransactions on Systems, Man & Cybernetics, Part B: Cybernetics, 37(1):92–99.
132 BIBLIOGRAPHY
Ojeda-Magana, B., Quintanilla-Domınguez, J., Ruelas, R., and Andina, D. (2009).Images sub-segmentation with the PFCM clustering algorithm. In Proceedings ofthe 7th IEEE International Conference on Industrial Informatics, 2009. INDIN2009., pages 499–503.
Pal, N. R., Pal, K., and Bezdek, J. C. (1997). A mixed c-means clustering model.In Proceedings of the 6th IEEE International Conference on Fuzzy Systems, pages11–21.
Pal, N. R., Pal, K., Keller, J. M., and Bezdek, J. C. (2005). A possibilistic fuzzy c-means clustering algorithm. IEEE Transactions on Fuzzy Systems, 13(4):517–530.
Panetta, K. A., Wharton, E. J., and Agaian, S. S. (2008). Logarithmic edge detectionwith applications. Journal of Computers, 3(9):11–19.
Partridge, B. L. (1982). The structure and function of fish schools. Scientific Ameri-can, 246(6):114–123.
Pham, D. T., Ghanbarzadeh, A., Koc, E., Otri, S., Rahim, S., and Zaidi, M. (2006).The bees algorithm – a novel tool for complex optimisation problems. In Proceedingsof the 2nd Virtual International Conference on Intelligent Production Machines andSystems, IPROMS 2006, pages 454–461.
Pratt, W. K. (1991). Digital Image Processing. John Wiley & Sons, Inc., New York,NY, USA.
Prewitt, J. M. S. (1970). Object Enhancement and Extraction in Picture Processingand Psychopictorics. Academic Press, New York.
Quintanilla-Domınguez, J., Cortina-Januchs, M. G., Ojeda-Magana, B., Jevtic, A.,Vega-Corona, A., and Andina, D. (2010). Microcalcification detection applyingartificial neural networks and mathematical morphology in digital mammograms.In World Automation Congress, WAC2010, pages 1–6.
Ramos, V. and Almeida, F. (2000). Artificial ant colonies in digital image habi-tats - a mass behavior effect study on pattern recognition. In Proceedings of theANTS’2000 - 2nd International Workshop on Ant Algorithms (From Ant Coloniesto Artificial Ants), M. Dorigo, M. Middendorf, T. Stzle (Eds.), pages 113–116,Brussels, Belgium.
BIBLIOGRAPHY 133
Ramos, V., Muge, F., and Pina, P. (2002). Self-organized data and image retrieval asa consequence of inter-dynamic synergistic relationships in artificial ant colonies.In Ruiz-del Solar, J., Abraham, A., and M., K., editors, Frontiers in Artificial In-telligence and Applications, Soft Computing Systems - Design, Management andApplications, volume 87 of 2nd International Conference on Hybrid Intelligent Sys-tems, pages 500–509. Springer Berlin / Heidelberg, Santiago, Chile.
Rana, O. F. and Stout, K. (2000). What is scalability in multi-agent systems? InProceedings of the 4th International Conference on Autonomous Agents, AGENTS’00, pages 56–63, New York, NY, USA. ACM.
Ray, A. K., Benavidez, P., Behera, L., and Jamshidi, M. (2009). Decentralized motioncoordination for a formation of rovers. IEEE Systems Journal, 3(3):369–381.
Reinelt, G. (1991). TSPLIB–a traveling salesman problem library. ORSA Journalon Computing, 3(4):376–384.
Resnick, M. (1994). Turtles, termites, and traffic jams: Explorations in massivelyparallel microworlds. MIT Press, Cambridge, MA, USA.
Reynolds, C. W. (1987). Flocks, herds and schools: A distributed behavioral model.SIGGRAPH Computer Graphics, 21:25–34.
Richardson, A. J., Risien, C., and Shillington, F. A. (2003). Using self-organizingmaps to identify patterns in satellite imagery. Progress in Oceanography, 59:223–239.
Rosenkrantz, D. J., Stearns, R. E., and Lewis, P. M. (2009). An analysis of severalheuristics for the traveling salesman problem. In Ravi, S. S. and Shukla, S. K.,editors, Fundamental Problems in Computing, pages 45–69. Springer Netherlands.
Runkler, T. A. (2005). Ant colony optimization of clustering models: Research arti-cles. International Journal of Intelligent Systems, 20:1233–1251.
Russell, S. J. and Norvig, P. (2003). Artificial Intelligence: A modern approach.Prentice Hall, New Jersey, USA, 2nd edition.
Saatchi, S. and Hung, C. C. (2005). Hybridization of the ant colony optimizationwith the k-means algorithm for clustering. In Kalviainen, H., Parkkinen, J., andKaarna, A., editors, Image Analysis, volume 3540 of Lecture Notes in ComputerScience, pages 511–520. Springer Berlin / Heidelberg.
134 BIBLIOGRAPHY
Schwager, M., McLurkin, J., Slotine, J.-J., and Rus, D. (2009). From theory to prac-tice: Distributed coverage control experiments with groups of robots. In Khatib, O.,Kumar, V., and Pappas, G., editors, Experimental Robotics, volume 54 of SpringerTracts in Advanced Robotics, pages 127–136. Springer Berlin / Heidelberg.
Shell, D. A. and Mataric, M. J. (2003). On the use of term ”stigmergy”. In PosterPaper in Proceedings of the 2nd International Workshop on the Mathematics &Algorithms of Social Insects, page 193.
Shi, Y. and Eberhart, R. C. (2001). Fuzzy adaptive Particle Swarm Optimization. InProceedings of the 2001 Congress on Evolutionary Computation, volume 1, pages101–106.
Shih, F. Y. and Cheng, S. (2004). Adaptive mathematical morphology for edge linking.Information Sciences–Informatics & Computer Science: An International Journal,167(1-4):9–21.
Shin, M. C., Goldgof, D. B., and Bowyer, K. W. (2001). Comparison of edge detectorperformance through use in an object recognition task. Computer Vision & ImageUnderstanding, 84(1):160–178.
Sobel, I. and Feldman, G. (1968). A 3 × 3 isotropic gradient operator for imageprocessing. presented at a talk at the Stanford Artificial Project, unpublished butoften cited.
Stutzle, T. and Hoos, H. H. (2000). MAX −MIN Ant System. Future GenerationComputer Systems, 16(9):889–914.
Tan, S. C., Ting, K. M., and Teng, S. W. (2006). Reproducing the results of ant-basedclustering without using ants. In IEEE Congress on Evolutionary Computation,2006. CEC 2006., pages 1760–1767.
Teodorovic, D. and Dell’Orco, M. (2005). Bee colony optimization - a cooperativelearning approach to complex transportation problems. In Advanced OR & AIMethods in Transportation, Proceedings of 10th Meeting of the EURO WorkingGroup on Transportation, page 5160.
Tian, J., Yu, W., and Xie, S. (2008). An Ant Colony Optimization algorithm forimage edge detection. In Proceedings of the IEEE Congress on Evolutionary Com-putation, 2008. CEC 2008. (IEEE World Congress on Computational Intelligence),pages 751–756, Hong Kong, China.
BIBLIOGRAPHY 135
Tibshirani, R., Walther, G., and Hastie, T. (2000). Estimating the number of clustersin a dataset via the gap statistic. Journal of the Royal Statistical Society, SeriesB, 63:411–423.
Tsai, C.-F., Wu, H.-C., and Tsai, C.-W. (2002). A new data clustering approach fordata mining in large databases. In Proceedings of the International Symposium onParallel Architectures, Algorithms & Networks, 2002. I-SPAN ’02., pages 278–283.
Turing, A. M. (1952). The chemical basis of morphogenesis. Philosophical Transac-tions of the Royal Society of London. Series B, Biological Sciences, 237(641):37–72.
Vizine, A. L., De Castro, R. N., Hruschka, E. R., and Gudwin, R. R. (2005). Towardsimproving clustering ants: An adaptive ant clustering algorithm. Informatica,29:143–154.
Von Frisch, K. (1967). The Dance Language and Orientation of Bees. HarvardUniversity Press, Cambridge, MA.
Wang, J.-H. and Rau, J.-D. (2001). Vq-agglomeration: A novel approach to clustering.IEE Proceedings - Vision, Image & Signal Processing, 148(1):36–44.
Wedde, H. F., Farooq, M., and Zhang, Y. (2004). Beehive: An efficient fault-tolerantrouting algorithm inspired by honey bee behavior. In Ant Colony, Optimizationand Swarm Intelligence, volume 3172 of Lecture Notes in Computer Science, pages83–94. Springer-Verlag.
Wei, L., Sheng, L., Yi, R. X., and Peng, D. (2008). A new contour detection inmammogram using sequential edge linking. In Proceedings of the 2008 SecondInternational Symposium on Intelligent Information Technology Application (IITA’08), volume 1, pages 197–200, Hong Kong, China.
Wenner, A. M. and Wells, P. H. (1990). Anatomy of a controversy: The question ofa ”language” among bees. Columbia University Press, New York.
Whitley, L. D., Starkweather, T., and Fuquay, D. (1989). Scheduling problems andtraveling salesmen: The genetic edge recombination operator. In Proceedings of the3rd International Conference on Genetic Algorithms, pages 133–140, San Francisco,CA, USA. Morgan Kaufmann Publishers Inc.
Yang, X.-S. (2005). Engineering optimizations via nature-inspired virtual bee al-gorithms. In Artificial Intelligence and Knowledge Engineering Applications: A

136 BIBLIOGRAPHY
Bioinspired Approach, volume 3562 of Lecture Notes in Computer Science, pages317–323.
Yu, Z., Yu, W., Zou, R., and Yu, S. (2009). On ACO-based fuzzy clustering forimage segmentation. In Proceedings of the 6th International Symposium on NeuralNetworks: Advances in Neural Networks - Part II, ISNN 2009, pages 717–726,Berlin, Heidelberg. Springer-Verlag.
Zhang, W.-J. and Xie, X.-F. (2003). DEPSO: Hybrid particle swarm with differen-tial evolution operator. In Proceedings of the IEEE International Conference onSystems, Man & Cybernetics, volume 4, pages 3816–3821.
Zhenhua, W., Weiguo, Z., Jingping, S., and Ying, H. (2008). UAV route planningusing multiobjective Ant Colony System. In 2008 IEEE Conference on Cyberneticsand Intelligent Systems, pages 797–800.