table of contents - kubatanaarchive.kubatana.net/docs/econ/min_fin_budget_2010_091202.pdf ·...
TRANSCRIPT

1
TABLE OF CONTENTS
MOTION ........................................................................................11
INTRODUCTION...........................................................................11
The Three Year Macro-Economic Policy & Budget Framework:
2010-2012 (STERP II) .................................................................. 15
Vision........................................................................................... 16
The 2010 Budget Theme ............................................................ 23
GLOBAL ECONOMIC DEVELOPMENTS................................... 24
Outlook ...................................................................................... 25
Commodity Prices .................................................................. 27
Oil........................................................................................... 27
Metals .................................................................................... 28
Global Inflation ....................................................................... 29
DOMESTIC ECONOMIC DEVELOPMENTS: 2009 .................... 30
Real Sector Developments.................................................. 30
Agriculture .............................................................................. 31
Manufacturing ........................................................................ 32
Mining .................................................................................... 34
Tourism .................................................................................. 39
Prices ..................................................................................... 40
Financial Sector ..................................................................... 41
Central Bank Reforms ........................................................... 41
2
Bank Capitalisation ............................................................ 42
Deposits ............................................................................. 42
Lending .............................................................................. 43
National Payments System ............................................... 45
Zimbabwe Stock Exchange ............................................... 45
External Sector ........................................................................... 46
External Debt and Arrears ......................................................... 47
Fiscal Developments: 2009 ....................................................... 48
Revenue Performance: January – October 2009 .............. 48
Value Added Tax (VAT) ...................................................... 49
Customs Duty .................................................................... 49
Pay As You Earn (PAYE) ................................................... 50
Corporate Tax .................................................................... 50
Excise Duty ........................................................................ 51
Other Taxes ....................................................................... 51
Non-Tax Revenue .............................................................. 52
Expenditure Performance: January – October 2009............... 52
Current Expenditures .......................................................... 53
Employment costs ............................................................. 54
Operations and Maintenance ............................................ 55
Grants and Transfers ......................................................... 57
Membership Contributions ................................................. 57
Zimbabwe Revenue Authority (ZIMRA) ............................. 57
Arrears on Services ........................................................... 58
3
Capital Expenditures ................................................................. 59
Vote of Credit .............................................................................. 61
THE 2010 BUDGET THRUST ..................................................... 61
The 2010 Budget Objectives and Priorities ........................... 62
2010 Budget Framework........................................................ 65
Assumptions ...................................................................... 66
Policy Implications ............................................................. 68
THE 2010 BUDGET ..................................................................... 69
THE 2010 EXPENDITURE BIDS........................................... 69
THE 2010 EXPENDITURE PROPOSALS............................. 71
ACCELERATING RECONSTRUCTION................................ 73
Public Sector Investment Programmes.................................. 73
Prioritisation of Projects ..................................................... 74
Energy and Power Projects ................................................... 75
Rural Electrification ............................................................ 77
Transport .............................................................................. 78
Roads ................................................................................ 78
Railways ............................................................................ 80
Aviation .............................................................................. 81
Information Communication Technology ........................... 82
E-Government ................................................................... 83
Water and Sanitation ........................................................... 84
Rural Water and Sanitation................................................ 85
Housing ............................................................................. 86

4
Upliftment of Youths and Women ...................................... 87
Women Empowerment ...................................................... 88
Constituency Development Fund ...................................... 89
Capitalisation of the Reserve Bank ................................... 91
STRIVING FOR EQUITABLE GROWTH..................................... 91
Social Services Delivery...................................................... 92
Health Services ...................................................................... 92
Drugs and medical supplies ................................................... 92
Medical equipment ................................................................. 93
Health infrastructure............................................................... 93
Education Services .............................................................. 94
Teaching and Learning Materials and Equipment ............. 95
Infrastructure...................................................................... 96
National Examinations ....................................................... 96
Social Protection Programmes........................................... 97
Agriculture .............................................................................. 98
Extension services ............................................................. 99
2010/11 Agricultural season .............................................. 99
Employment Costs ............................................................ 100
Remuneration of Public Servants .................................... 100
Civil Service Audit ............................................................ 101
Pension ............................................................................ 102
Public Service Pension Reform ....................................... 102
5
Public Service Pension Fund ........................................... 103
Medical Aid ...................................................................... 104
De-linking the Legislature, Judiciary and the Executive 105
Operations and Maintenance ............................................ 106
Outstanding Debts to Service Providers ......................... 107
Foreign Missions ............................................................... 108
Accountability over Public Resources ............................ 109
PFMS................................................................................110
Foreign Travel ................................................................... 111
Vehicle Hire Service .........................................................112
Vehicle Inventory ..............................................................112
CONSOLIDATING STABILISATION & GROWTH .....................113
Macro-Economic Stabilisation...........................................113
Multiple Currency Regime ................................................113
External Debt & Arrears Clearance Strategy ....................115
Financial Sector ................................................................116
Zimbabwe Stock Exchange Fees & Levies ..................116
Insurance Capitalisation Requirements ........................117
Prescribed Asset Status ...............................................118
Co-Existence of NSSA and Private Occupational
Schemes ......................................................................119
REVENUE MEASURES ............................................................ 121
Redrafting of the New Income Tax Act ................................... 122

6
Revenue Enhancing Measures ............................................... 123
Income Tax .......................................................................... 123
Residence Basis for Taxation .......................................... 123
Corporates ....................................................................... 124
Transfer Pricing ........................................................... 124
Tax Expenditures ............................................................. 125
Deductions .................................................................. 126
Special Initial Allowance (SIA) ..................................... 126
Export Market Development Expenditure .................... 127
Contribution to Scientific and Educational Society or
Institution ..................................................................... 128
Doubtful Debts ............................................................. 128
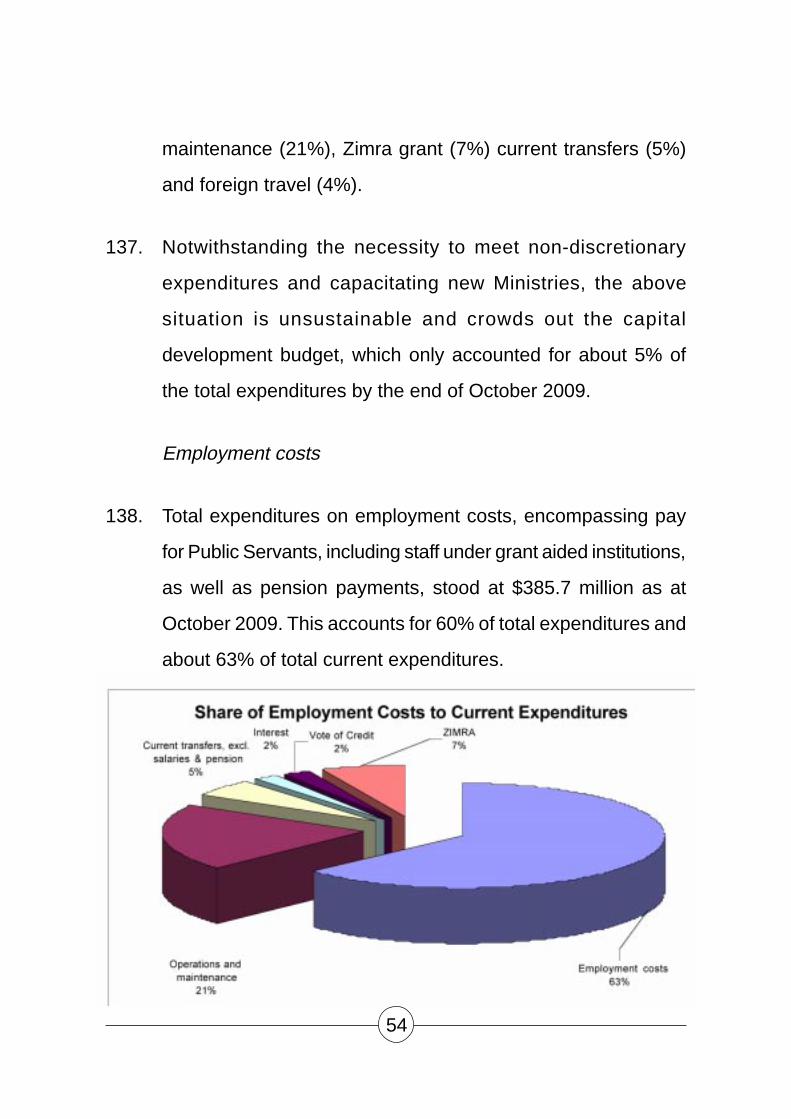
Rate of Interest ................................................................ 129
Outdated Exemptions ...................................................... 130
Mining Taxation Reform ................................................... 130
Mining Claims .............................................................. 131
Application for Exclusive Prospecting Order and Special
Grants .......................................................................... 131
Unutilised Mining Claims ............................................. 132
Royalties .......................................................................... 133
Royalty Rates .............................................................. 133
Collection of Royalties ................................................. 133
Exploitation of Diamonds at Chiadzwa ............................ 134
Value Addition of Diamonds ........................................ 136

7
Tax Rate .......................................................................... 136
Individuals ........................................................................ 138
Fringe Benefits—Motor Vehicles ................................. 138
Export Tax........................................................................ 139
Chrome Ore and Chrome Fines .................................. 139
Customs Duty ...................................................................... 140
Suspension of Customs Duty on Basic Commodities ..... 140
Transit Fraud—Electronic Cargo Tracking System .......... 141
Travellers Rebate............................................................. 143
Post Clearance Audits ..................................................... 143
Informal Cross Border Traders ........................................ 144
Period for which Goods are held pending clearance ....... 145
Train Manifest .................................................................. 146
Review of Specific Rates of Customs Duty ..................... 146
Excise duty........................................................................... 147
Excise Duty on Spirits ...................................................... 147
Value Added Tax .................................................................. 147
VAT Cash Register .......................................................... 147
Valuation Base for Import VAT......................................... 148
Rationalisation of VAT Zero Rated and Exempt Products 149
Tax Payment Dates ......................................................... 150
Presumptive Taxes—Informal Sector Taxation .................... 151
Tax Relief Measures ........................................................ 151
Individuals ........................................................................ 151

8
Pay As You Earn (PAYE) ................................................. 151
Bonus Tax Exempt Threshold.......................................... 152
Retrenchment Packages ................................................. 153
Contribution to Occupational Pension Schemes ............. 153
Corporates ........................................................................... 154
Withholding Taxes ........................................................... 154
Customs Duty ...................................................................... 155
Reduction of Customs Duty on Raw Materials ................ 155
Light Commercial Vehicles .............................................. 155
Customs Duty on Small Passenger Motor Vehicles ........ 156
Farming ........................................................................... 157
Livestock Development ................................................... 157
Presumptive Tax .................................................................. 158
Commuter Omnibuses ..................................................... 158
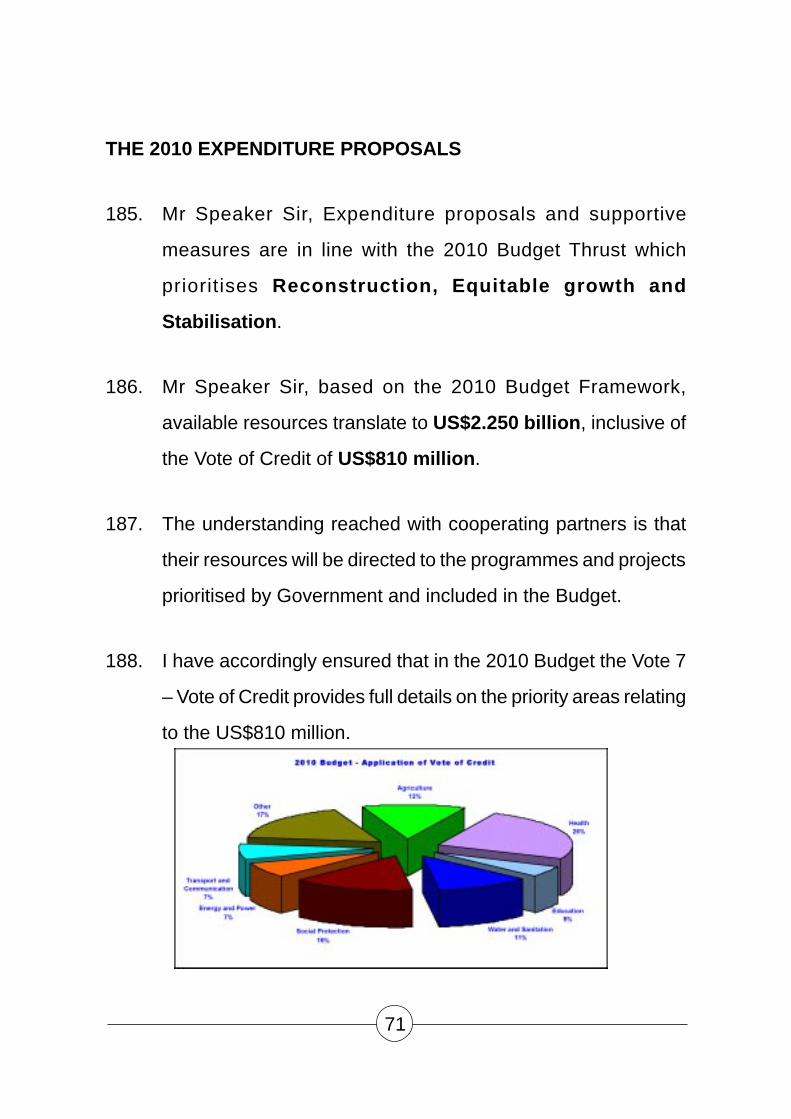
Management of Ports of Entry ............................................. 159
Proliferation of Government Agencies Operating at Border
Posts ................................................................................ 159
Scheduling of Bus Arrivals ............................................... 160
Inspection of Health and Hazardous Substances ................ 160
Payment of Fees and Charges at Border Posts .............. 161
Separation of Commercial and Passenger Cargo ........... 162
Corruption at Ports of Entry ............................................. 162
Customs Clearing Procedures ......................................... 163
Penalty for Corrupt Practice ............................................ 163

9
Licencing of Clearing Agencies ....................................... 164
Green Routes .................................................................. 164
Fees, Charges and Levies ................................................... 165
Road Toll Fees................................................................. 165
Toll Fees .......................................................................... 166
Review of Penalties, Fees and Minimum Value for Customs
Duty Purposes ................................................................. 167
CONCLUSION ........................................................................... 168
Annexure 1: Schedule-Due dates for Payment of Tax ........ 169
Annexure 2: Specific rates of Customs and Excise Duty ..... 171

10

11
“There hath no temptation taken you but
such as is common to man; but God is
faithful who will not suffer you to be
tempted above that ye are able but will with
the temptation also make a way to escape,
that ye may be able to bear it.”
(1 Corinthians 10 Vs 13)
MOTION
1. Mr Speaker Sir, in terms of Section 103(1) of the Constitution
of Zimbabwe, I move that leave be granted to bring in a Bill to
make Provisions in connection with Revenues and Expenditures
of the Republic of Zimbabwe for the Financial Year January to
December 2010 and to make Provisions for matters ancillary
and incidental to this purpose.
INTRODUCTION
2. Mr Speaker Sir, Honourable Members will recall that the main
objective of the 2009 Budget presented on 17 March 2009 was
to implement the Short Term Emergency Recovery Programme
(STERP), whose main thrust was to restore macro-economic
stability and growth as provided for in the Global Political
Agreement (GPA).

12
3. Accordingly, the 2009 Budget proffered a number of policy
measures complemented by resource allocations in support of
strengthening the capacity of public institutions, restoring
delivery of public services, rehabilitating infrastructure as well
as cushioning vulnerable groups.
4. In my presentation of the 2009 Mid-Term Fiscal Review on 16
July 2009, I updated this August House on strides the Inclusive
Government had made in implementing both the 2009 Budget
and STERP.
5. These positive strides were particularly in the following areas,
among others:
• Macro-economic stabilisation particularly inflation
containment;
• Improved capacity utilisation in productive sectors of
agriculture, mining and manufacturing, from below 10% to
around 30% to 50%;
• Removal of price distortions in both foreign exchange and
goods markets;
• Resuscitation of financial sector services;

13
• Some improvement in public service delivery, particularly in
the areas of water and sanitation, transport, health and
education sectors;
• Improvement in social protection programmes for vulnerable
groups;
• Overall business confidence building;
• Policy consistency and predictability on key policy
fundamentals;
• The enactment of key legislation dealing with credibility of
public accounts; and
• Re-engagement with the international community.
6. Then, I particularly alluded to the reality that the economy
remained fragile, notwithstanding significant positive gains
realised in areas of inflation reduction and improvement in the
supply of goods and services.
7. I further pointed out that the major challenge constraining
speedy recovery was the unfinished business of political
integration and harmony. I highlighted the fact that the
uncertainty and the inconsistency of message and the
continuous attrition inside the Inclusive Government remain
major eye sores in the country’s anatomy.

14
8. I further underlined the total absence of fiscal space, the
restricted domestic financial capacity, lack of foreign direct
investment and the absence of tangible external support, as
major emasculating factors in our recovery efforts.
9. Furthermore, during the second Ministerial Retreat on the review
of the implementation of STERP’s 100—Day Plan in Nyanga
in August 2009, there was consensus in the major deficit areas
associated with the implementation of STERP.
10. These areas ranged from political and governance issues to
high debt overhang, resource constraints, institutional capacity
limitations as well as slow adaptation by various public and
private institutions to the new dispensation and its demands
and opportunities.
11. In short, what was clear in Nyanga, as it is clear now, is the
massive unfinished agenda than what has so far been
accomplished in the implementation of STERP, which
programme incidentally is coming to an end on 31st December
2009.

15
12. It was on the realisation of the huge task that the Government
Work Programme instructed and directed that Macro-Economic
Framework be developed.
The Three Year Macro-Economic Policy & Budget Framework:
2010-2012 (STERP II)
13. In order to attend to a number of outstanding issues, targets,
and commitments made under STERP, whilst embracing other
necessary growth-oriented stabilisation measures, Government
has come up with a successor to STERP – The Three Year
Macro-Economic Policy and Budget Framework: 2010-2012
(STERP II).
14. This, therefore, anchors the 2010 National Budget and the
subsequent 2011 and 2012 National Budgets.
15. In that regard, the 2010 Budget should be read together with
the Framework 2010 – 2012, which contains detailed policy
measures, programmes and projects planned to be
implemented during the Framework period.
16
Vision
16. The Vision of STERP and its successor - The Three Year Macro-
Economic Policy and Budget Framework: 2010-2012 (STERP II),
is creating a functioning, democratic and viable economy.
17. In this regard, both STERP Programmes prioritise and pursue
democratisation as well as socio-economic strategies that
guarantee the integratability of the poor in the economic growth
policy framework.
18. Such a broad based and inclusive strategy, particularly focusing
on women and the youth, guarantees democratisation of the
economy.
19. In short, both STERP and its successor, STERP II recognise
the inextricable link between democratisation, Constitutional
adherence to the rule of law.
Structural Challenges in the formulation of the 2010 Budget
20. The Inclusive Government began work on the 16th of February
2009, in the face of huge demands, high expectations and
limited capacity to deliver.

17
21. At the epicentre of the challenges facing the nascent
Government were the legacy issues associated with years of
economic attrition which continued to pose challenges for any
recovery and stabilisation efforts.
22. These drawbacks included shrinkage of the economy by over
40%, a decade-long high inflation which spiralled out of control
to unprecedented levels of over 231 million percent by July
2008, severe capacity underutilisation of below 10%, and
subsequent shortage of basic commodities in the formal market.
23. As a result, Zimbabwe lagged behind most SADC countries in
terms of GDP and GDP per capita growth as indicated below:

18
24. This was against a background of price distortions and
misalignments that were counterproductive and promoting
speculative activities in both foreign exchange and goods
markets.
25. The erosion of the Central Government Budget also led to an
almost complete collapse in the provision of public services,
particularly in health, education, water and sanitation. Added
to these challenges, was the huge corrosion of the capital base
of the financial services sector.
26. Contributing to the above challenges were structural
development traps , that arrested the economic liberation of
this country and these included:

19
The Conflict Trap
27. For a long time this country has been caught up in vicious traps
of conflict which manifested themselves in cataclysmic conflicts
since 1980.
28. As a matter of fact, since 1890, this country has not enjoyed
the peace it deserves as a result of conflicts associated with
colonialism. Post independent Zimbabwe as well has had its
own share of these conflicts particularly between the periods
1981 to 1987 and 2000 to 2008.
29. Since 2000, the country also experienced various areas of
conflicts associated with political confrontations which led to
the loss of value in the economy and subsequently gave rise to
the Global Political Agreement and the Inclusive Government.
The Resource Trap
30. This demonstrates the typical African story of limited financial
resources against huge natural resource endowments and yet
the failure to articulate an alternative progressive development
model less dependent on raw commodities and agriculture.

20
The Debt Trap
31. The debt trap is represented by an unsustainable debt and
external arrears status quo that have eroded the country’s credit
worthiness.
The Leakage Trap
32. This has resulted in millions of dollars lost through corruption,
arbitrage, and rent seeking activities, including the “burning of
money”. As a result, the country is ranked 122nd out of 128
countries covered by the 2007 Global Competitiveness Index.
The Human Resources Trap
33. Massive brain drain has resulted in more than 4 million
Zimbabweans now residing in the diaspora.
The Integration Trap
34. This is arising out of the absence of a common regional market
and the synergies and economies of scale that come with
horizontal and vertical integration of small economies. As a
result, the country has lost out from regional and international
groupings and initiatives.

21
Gender Trap
35. The gender trap manifests itself in the relatively small numbers
of women taking up influential positions in political and economic
institutional set up such as Parliament, Ministerial posts and
managerial posts in both the public and private sectors. This is
notwithstanding that women constitute 52% of the population.
Savings Trap
36. In the context of Zimbabwe, this manifests itself through low
savings that have remained very low at below 10% of GDP
against the desired 20% - 30% necessary for sustainable
growth.

22
37. Uncertainties in the country, and the country’s
uncompetitiveness also constrained foreign direct investment
inflows.
38. The overall effect of the above has been the reclassification of
the country’s population into three distinct classes – the
submerged and drowning-poor representing 85% of the
population, the 13% floating or dog-paddling “middle class” ,
and the 2% prawn-eating free-stylers .
39. The challenge of economic transformation in Zimbabwe is,
therefore, a developmental challenge seeking to improve the
lives of the 85% drowning poor and their cousins the dog-
paddlers, that way giving them equal say and access to the
wealth of the country.
40. This means transforming the lives of thousands of women and
youths who form the bulk of this class.
41. This, in short, was the structural challenge in crafting the 2010
Budget.

23
The 2010 Budget Theme
42. Mr. Speaker Sir, self evidently the strategic focus of the 2010
Budget is, therefore, to save the drowning vulnerable and poor
groups by developing and creating a functional economy
capable of consolidating STERP objectives, generating
adequate investment in our productive sectors as well as
infrastructure and guaranteeing improved delivery of public
services.
43. Mr. Speaker Sir, the 2010 Budget will, therefore, deal with the
above challenges through the vehicle of Reconstruction with
Equitable Growth and Stability . In short a “pro-poor, broad
based and inclusive development framework”.
44. It intends to confront head-on Africa’s developmental paradox
by focusing on a growth target of 7% in 2010 largely driven by
increased investment and production in agriculture, mining, and
capital development programmes. A strong emphasis will be
on the key issues of education, health and social services
and the continuation of a strict and disciplined macro-economic
stabilisation programme.
45. The 2010 Budget will, therefore, be consolidating what I called
in my recent 2009 Medium Term Review - the ‘little green shoots’
evident in our economy and provide further support in nurturing

24
them to ensure that a broad based macro-economic recovery
and growth is achieved.
46. Furthermore, the designing of specific interventions in the
Budget also benefited from a comprehensive evaluation of the
2009 Global and Domestic Economic Developments and
experiences from other countries.
47. Various stakeholders encompassing Government Departments,
Business sector, Labour and Civic Organisations also provided
valuable inputs which enriched the formulation of this Budget.
48. Mr Speaker Sir, allow me at this juncture to thank Honourable
Members in this August House together with all other
stakeholders for their continued active contribution and support
to this and other processes aimed at transforming Zimbabwe
into a prosperous, democratic and vibrant Nation.
49. Mr. Speaker Sir, allow me now to give a brief on the global
economic developments.
GLOBAL ECONOMIC DEVELOPMENTS
50. The global financial crisis, which emerged in 2007 and spiralled
into an economic crisis, threatened to erode the remarkable
economic achievements for many low income countries.

25
51. As a result, the world economic growth is now estimated to fall
to 0.5% in 2009 from 3.4% recorded in 2008.
52. However, growth in emerging and developing economies is also
expected to slowdown to only 3.5% in 2009 from 6.3% achieved
in 2008.
53. The impact of the crisis has also severely affected African
economies through sharp contraction of exports, falling prices
for primary commodities, declining remittances, unpredictable
aid flows and withdrawal or delayed private capital flows.
54. As a result, the continent is faced with shrinking growth now
estimated at 3.4% in 2009 from a 5.2% recorded in 2008.
Outlook
55. Although the downturn in global growth has not yet been fully
reversed, there is evidence that the anti-crisis policy efforts
undertaken through international cooperation will produce
substantial progress from 2010.
56. These policy efforts include strengthening regulation and
supervision of the financial sector and substantial
recapitalisation support to the financial and other key sectors

26
of the economy through easing of credit conditions as well as
fiscal stimulus packages where there is fiscal space.
57. As a result, world economic growth is now projected to gradually
recover, peaking up to 3% in 2010 with that of emerging and
developing economies expected to improve to 5% in 2010.
58. For developing countries in Africa, growth is projected at about
5% in 2010, taking advantage of the continent’s sound track
record of macro-economic policy implementation,
complemented by external assistance.
Graph 3. Projected Growth Rates: 2010

27
Commodity Prices
59. Commodity prices which had collapsed during the crisis period
beginning 2007, have began stabilising during the beginning
of 2009, responding to global economic recovery expectations
and the improvement in global demand.
Oil
60. Oil prices, which had peaked to over US$147 per barrel in July
2008, declined to as low as US$36 per barrel in February 2009
and have now firmed up to around US$80 per barrel.
Graph 4: Average Oil Prices 2007 - 2010

28
Metals
61. Metal producers responded to the global crisis by scaling down
production and in some instances temporarily halting operations
in order to save costs.
62. The rebound in industrial production associated with stimulus
packages and the rising demand for metals, particularly in
China, saw most metal prices strengthening in the second
quarter of 2009.
63. As a result, the international prices of the country’s major exports
such as gold, platinum, nickel have started firming up, allowing
most of our mining houses to resume and scale up production.
Graph 5: Metal Prices 2007 - 2009

29
64. In the medium term, international metal prices are projected to
strengthen along with the pace of global economic recovery.
Global Inflation
65. The decline in economic activity and subsequent aggregate
demand dampened inflationary pressures in 2009.
Consequently, inflation in developed economies is expected to
decline from 3.5% in 2008 to a record low of 0.3% in 2009,
before slightly peaking to around 0.8% in 2010.
66. Similarly, in emerging and developing economies, inflation is
expected to fall from 9.5% in 2008 to 5.8% in 2009 and is
projected to further decline to 5% in 2010.
Graph 7: Inflation Developments: 2007 - 2010
30
67. Mr Speaker Sir, I now turn to domestic economic developments
during 2009. Details on this are contained in the finalised Three
Year Macro-Economic Policy and Budget Framework to be
launched in the next few days.
DOMESTIC ECONOMIC DEVELOPMENTS: 2009
Real Sector Developments
68. The relative macro-economic stability achieved under STERP
translated into unexpectedly significant improvement in capacity
utilisation in almost all sectors of the economy and hence
marked the beginning of economic recovery and growth in the
country.
69. Consequently, the economy which was initially projected to grow
for the first time in ten years by 3.7 % in 2009, is now expected
to register a higher growth rate of 4.7% compared to a decline
of more than -10% registered in 2008.
70. This positive growth is largely underpinned by improved
performance in sectors of agriculture (10%), mining (2%),
manufacturing (8%) and tourism (6.5%), which previously
recorded persistent decline in growth rates during 2000 – 2008.

31
Table 1: Real Sector GDP: 2008 - 2010
Sector 2008 2009 2010
Agriculture -36% 10% 10%
Mining -30% 2% 40%
Manufacturing -12% 8% 10%
Tourism 9% 6.5% 10%
Agriculture
71. The estimated 10% growth in the agricultural sector follows
registered sustained cumulative declines of 85.7% since 2002.
Graph 7: Agriculture Output: 2008 vs 2009

32
72. This is underpinned by improved performance of tobacco,
maize, groundnuts, soyabeans, sorghum and tea. The improved
yields are on account of a normal rainfall season and financial
support from Government, contract farming arrangements as
well as that of cooperating partners including SADC.
73. However, production for cotton, wheat, sugar, dairy and
horticulture decreased slightly as a result of financial constraints.
74. In 2010, agriculture is projected to grow by a further 10%,
benefiting from improved financing and the current marketing
arrangements which are enhancing viability of farming and,
hence, incentivising farmers.
Manufacturing
75. The manufacturing sector, which recorded a cumulative decline
of -91.1% between 2000 and 2008, is now on a recovery path
and is estimated to register a positive growth of 8% in 2009.
76. This successful turnaround is a result of the implementation of
market friendly and stabilisation policies provided for under
STERP.

33
77. These policies include the adoption of stable multiple currencies,
liberalisation of the current account and the removal of price
controls and distortions, as well as surrender requirements on
exporters’ foreign exchange earnings.
78. Furthermore, the increase in bank deposits from US$475 million
by April to US$1 billion in October 2009, allowed banks to begin
lending, also targeting the manufacturing sector, whose share
of loans and advances constituted about 22.3% of total loans
by 31st October 2009.
79. Additional external lines of credit amounting to US$753 million,
of which US$72 million was for the manufacturing sector
complemented the above lending.
80. Accordingly, capacity utilisation in different sub-sectors of the
manufacturing sector has increased from below 10% in 2008
to current levels of between 30% and 50% and in some few
cases above 50% in 2009.

34
Graph 17: Capacity Utilisation by October 2009
81. The manufacturing sector is projected to record a further 10%
growth rate in 2010.
Mining
82. The mining sector which had most mines either closed or
operating well below capacity at the beginning of 2009, is
showing signs of recovery after having taken advantage of
positive policy measures under STERP, such as removal of
forced foreign exchange surrender requirements and full
retention of marketing proceeds.

35
83. The sector is, therefore, expected to grow by 2% in 2009
compared to a decline of -22.1% in 2008. This turnaround is
attributed to positive performance in gold (14.6%), platinum
(0.1%) and production of coal (1%) as indicated below:
Mining Sector Growth Rates
Mineral 2009 2010
Gold 14.6% 24.6%
Nickel -4% 5.7%
Coal 1% 3.9%
Asbestos -5% 0%
Chrome -2% 6%
Platinum 0.1% 1.2%
Palladium 0.01% 0.2%
Black Granite -1.4% 1.6%
All Minerals 2% 40%
84. Performance for the rest of other minerals, which include
asbestos, chrome and nickel, were subdued owing to working
capital constraints and depressed demand on the global market.

36
85. Performances of mineral production are indicated below:
Graph 18: Monthly Gold Output and Prices: January – October
2009
Graph 19: Platinum

37
Graph 20: Coal
Graph 21: Asbestos

38
Graph 22: Chrome
Graph 23: Nickel
86. In 2010, mining is projected to grow by 40%, reflecting a drastic
output increase for platinum and gold, with moderate
performance for the other minerals.

39
Tourism
87. While the global recession has led to a general decline in global
tourist arrivals by about -6% in 2009, tourist arrivals to Zimbabwe
are expected to ride on the positive effects of the formation of
the Inclusive Government.
88. As a result, countries such as the USA, Sweden and German,
among others, have lifted travel warnings against visiting
Zimbabwe.
89. Therefore, tourism is expected to grow by 6.5% in 2009
compared to -9% in 2008.
Monthly Arrival Statistics January – June 2009 vs 2008
40
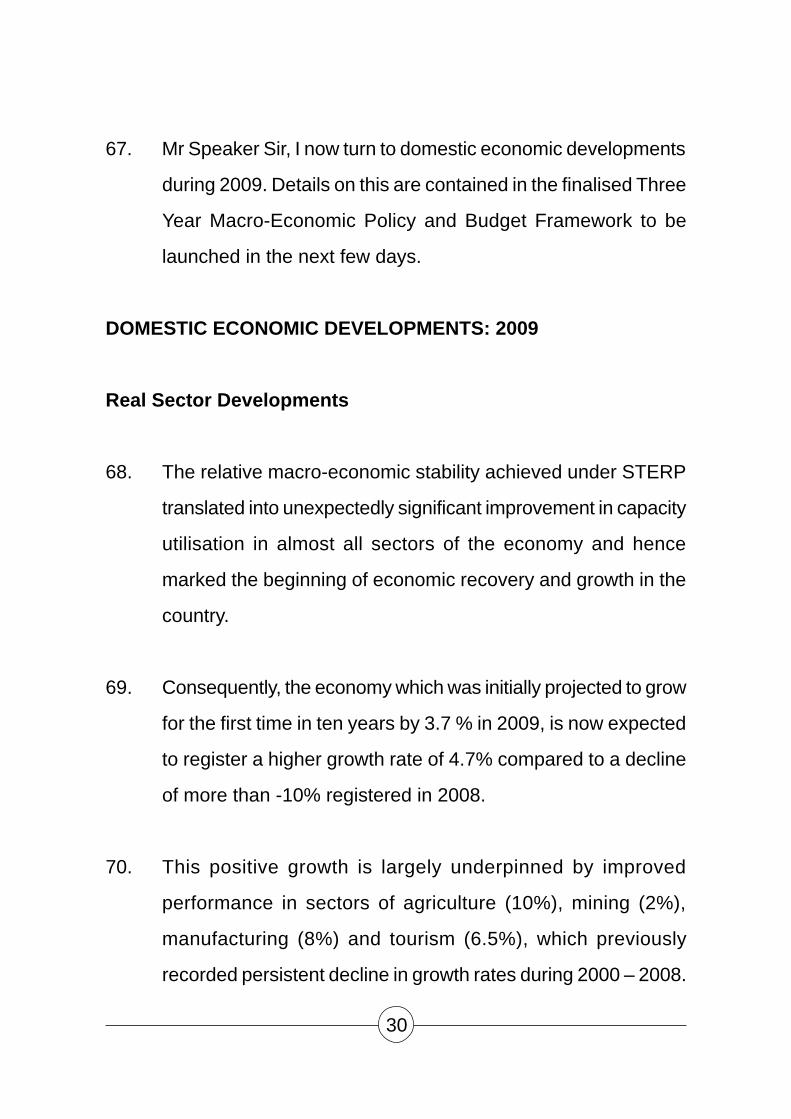
Foreign Tourist Arrivals by Region 2009 vs 2008
90. In line with increased tourist arrivals, tourist expenditures rose
from US$38.7 million in January to US$56.3 million in June
this year.
91. Overally, the tourism sector is projected to further grow by 10%
in 2010.
Prices
92. Since the introduction of stable multiple currencies and
supportive measures such as Cash Budgeting, prices of goods
and services have relatively stabilised.

41
93. From January to October 2009, month-on-month inflation have
been oscillating between -3.1% and 1%, with annual average
for the year projected at -5.5%.
94. Inflation for 2010 is projected to remain stable within single
digit levels, subject to resolute adherence to sound macro-
economic management measures.
Financial Sector
Central Bank Reforms
95. Government initiated reforms targeted at refocusing the Reserve
Bank of Zimbabwe’s institutional framework to its core business
of financial sector supervision, monetary policy and ensuring
efficient payment system.
42
96. The Bill which seeks to give effect to these proposed reforms is
currently undergoing Parliamentary approval processes and is
expected to be enacted before the end of the year.
Bank Capitalisation
97. The recapitalisation process by the country’s financial
institutions continues in order to guarantee safe and sound
conditions for the sector and also to ensure sustainable
participation of banks in the mobilisation of savings.
98. Under the first phase of recapitalisation, 23 out of 26 banking
institutions had complied with the prescribed minimum capital
requirements.
99. Those that failed submitted recapitalisation plans, which
included identification of strategic partnerships and the Reserve
Bank will monitor and work closely with these institutions.
Deposits
100. Banks’ deposit base has been gradually increasing from
US$475.4 million in April 2009 to over US$1 billion as of October

43
2009. Out of these total deposits, long term deposits accounted
for about US$15.8 million, with the balance in short term
deposits.
101. This coupled with the low interest rates on savings deposits
ranging between 0.25% - 1% per annum is militating against
preferred long term savings deposits, which are crucial for
investment.
Lending
102. In line with the increase in banks’ deposit base, loan advances
have risen from US$157.9 million in April to US$501 million as
of 31 October 2009, giving an increase in the loan - deposit
ratio from 30% to 50% over the same period.

44
103. However, given the short term nature of deposits, financial
institutions were forced to structure their lending in short term
credit financing largely comprising of 90 days at effective
annualised lending rates ranging from 8% to 16%, which
remains too expensive compared to the regional average
lending rate of 7%.
104. Of the total lending, the distribution, manufacturing and
agriculture sectors collectively received about 70.6% of total
loans and advances as at 30 October 2009.
45
National Payments System
105. The national payment system which was resuscitated in March
2009 under the new dispensation of multiple currencies is
gradually being modernised and diversified through
collaborative efforts of the banking industry and other relevant
partners.
106. To date the Real Time Gross Settlement System (RTGS),
Automated Teller Machines (ATMs), Cheque Payment Systems
and Points of Sale have been operationalised.
107. These are being complemented by the use of plastic money
such as the use of debit cards, credit cards and other transfer
methods as a way of facilitating transactions without necessarily
resorting to cash, which is imported from outside countries.
108. This is considerably easing the huge appetite for cash from the
market as well as providing much relief on the need for small
change.
Zimbabwe Stock Exchange
109. The Zimbabwe Stock Exchange (ZSE) which is a vehicle for

46
attracting investment resources to the productive sectors
resumed operating on 19 February 2009.
110. Performance has been encouraging, with market capitalisation
rising from US$1.6 billion in March to US$3.7 billion in October
2009.
External Sector
111. The country’s exports shipments over the period January to
October 2009 are expected to decline by 17.7% from US$1.2
billion to US$1 billion, primarily reflecting a decline in agricultural
exports.

47
112. Imports are expected to decline by 15% from US$1.5 billion to
US$1.3 billion over the same period.
113. Major imports are food, electricity and fuels, chemicals,
manufactured goods and machinery.
External Debt and Arrears
114. The country’s total debt including arrears as at 31 October 2009
was US$5.417 billion. Of this amount external payment arrears
were US$3.839 billion. Government arrears alone are US$2.340
billion whilst parastatals, Reserve Bank and private sector
arrears accounted for US$895.7 million, US$568.8 million and
US$34.4 million, respectively as indicated below:
External Debt Including Arrears as at October 2009 (US$ millions)
DOD Arrears Principal InterestArrears Arrears
Total External Debt 5,417.0 3,838.8 3,115.7 723.1
Government Long Term 3,604.4 2,339.9 1,773.9 566
Parastatal Long Term 1,001.9 895.7 740 155.7
Private Sector Long Term 56 34.4 33 1.4
Short Term Debt 754.8 568.8 568.8 0

48
Fiscal Developments: 2009
115. Implementation of the Budget continues to be guided by the
Cash Budgeting principle as enunciated in STERP.
116. Budget performance to October 2009 has remained on course
with cumulative revenues of US$685.0 million against total
expenditures and net lending of US$640.7 million.
Revenue Performance: January – October 2009
117. Cumulative tax revenue collections for the period January to
October 2009 amounted to US$685.0 million, against a target
of US$789.8 million.
118. Value Added Tax (VAT), Customs duty and Pay As You Earn
(PAYE) contributed significantly to total revenue.

49
Value Added Tax (VAT)
119. VAT contributed US$268.9 million or 39% of total revenue
against a target of US$270.9 million. VAT on domestic and
imported goods and services accounted for US$121.9 million
and US$147.0 million, respectively.
120. Collections under this revenue head have been on the upward
trend since the adoption of the use of multicurrency in February
2009.
Customs Duty
121. Cumulative revenue collections from customs duty for the period
under review amounted to US$179.2 million or 26% of total
revenue, against a target of US$211.4 million.
122. Customs duties on raw materials, intermediate and capital
goods were progressively reduced during the 2009 Budget and
the Mid Term Fiscal Policy Review, hence this contributed to
low performance on this revenue head.

50
Pay As You Earn (PAYE)
123 . PAYE collections for the period January to October 2009
amounted to US$ 104.4 million or 15% of total revenue against
a target of US$117.8 million.
124. PAYE performance has been improving at a modest pace due
to the low reviews of remuneration packages in both the public
and private sectors. This trend is reflective of the limited
improvements in capacity utilisation of companies that are re-
engaging employees.
Corporate Tax
125. Corporate tax contributed US$25.6 million or 4% to total
revenue, against a target of US$61.1 million. The sluggish
performance of this revenue head is mainly on account of low
industry capacity utilisation of about 10% during the first quarter
of the year.
126. Capacity utilisation had, however, gradually improved to about
30% by September 2009, hence collections from this head are
expected to improve.
51
Excise Duty
127. Excise duty collections amounted to US$44.6 million against a
target of US$42.6 million. Major contributors to this revenue
head include fuel, beer, wines and spirits which accounted for
US$37.5 million.
128. The bulk of excise duty collection was contributed from fuel
and growth in volumes of beer, as a result of increased capacity
utilisation from 25% in January to about 75% by September
2009 for these sub-sectors.
Other Taxes
129. Revenue collections from other taxes for the period under review
amounted to US$23.5 million or 3% of total revenue, against a
cumulative target of US$30.2 million.
130. Collections from carbon tax and indirect taxes contributed the
bulk of revenue amounting to US$8.7 million and US$8.5 million,
respectively.

52
Non-Tax Revenue
131. Non-Tax revenue is comprised of fees, charges and fines,
pension contributions and revenue from investment and
property.
132. Collections from Non-Tax Revenue during the period January
to October 2009 amounted to US$38.9 million or 6% of total
revenue against a target of US$55.9 million.
133. The negative variance is attributed to low collections from fees
and charges which amounted to US$8.8 million against a target
of US$36.8 million.
Expenditure Performance: January – October 2009
134. Cumulative expenditure to October amounted to $640.8 million,
representing 46.1% of the 2009 Revised Budget of $1.391
billion.
135. The breakdown of the cumulative expenditure to October 2009
by economic classification is given in the table below.

53
Breakdown of Expenditure to October 2009
Item Cumulative
expenditureUS$ million
Employment costs 385.7
Civil service wage bill 276.9
Staff in grant aided institutions 29.1
Pension 74.5
Other 5.1
Operations and maintenance 126.4
Current transfers, excl. salaries & pension 31.5
Interest 13.6
Capital expenditure 28.4
Vote of Credit 14.2
ZIMRA 41.0
Total 640.8
Current Expenditures
136. Up to October 2009, current expenditures were US$608.7
million or 95% of the total expenditures. Current expenditures
were on account of employment costs (63%), operations and
54
maintenance (21%), Zimra grant (7%) current transfers (5%)
and foreign travel (4%).
137. Notwithstanding the necessity to meet non-discretionary
expenditures and capacitating new Ministries, the above
situation is unsustainable and crowds out the capital
development budget, which only accounted for about 5% of
the total expenditures by the end of October 2009.
Employment costs
138. Total expenditures on employment costs, encompassing pay
for Public Servants, including staff under grant aided institutions,
as well as pension payments, stood at $385.7 million as at
October 2009. This accounts for 60% of total expenditures and
about 63% of total current expenditures.

55
139. However, there is still pressure for higher wages notwithstanding
prevailing resource constraints. Mindful of the difficult challenges
facing public servants, all Government workers are being paid
bonuses staggered over the months of November and
December 2009.
Operations and Maintenance
140. Cumulative expenditure to October for operations and
maintenance amounted to $126.4 million.
141. The constraint being faced on the revenue front continues to
restrict expenditures, particularly operations and maintenance.
142. Major expenditures under operations and maintenance
include rental and hire expenses ($39 million), foreign travel
($28.4 million), domestic travel ($3.7 million), Ministries’
programmes and institutional expenses ($19.9 million),
maintenance ($13 million) and other operational expenses
($5.3 million).

56
143. The above levels of funding for operations and maintenance
are skewed towards foreign travel and, hence, crowding out
other essential public services.

57
144. Teaching materials only accounted for US$0.7 million, while
social protection programmes got only US$1 million. Similarly,
agriculture support had US$2.4 million, while infrastructure
maintenance had only US$0.9 million.
Grants and Transfers
145. A total amount of $31.5 million was expended under this item.
Of this amount, $26.1 million relates to operational expenses
for grant aided institutions. The support to grant aided institutions
was mainly targeted at Universities and local and foreign based
students ($7.1 million) and ZIMSEC ($3.8 million) to cater for
their examination requirements.
Membership Contributions
146. Contributions to regional and international organisations such
as SADC, COMESA and others accounted for the balance of
$5.4 million.
Zimbabwe Revenue Authority (ZIMRA)
147. The amount of $41 million under ZIMRA relates to expenditures
of US$32 million for its operations and US$9 million for capital
related expenses.
58
148. The relatively high expenditure was reflective of Government
efforts to strengthen revenue collection. This should decline
relatively, especially as the necessary revenue collection
capacity is restored.
Arrears on Services
149. An unhealthy development has been the accumulation of
outstanding payments to suppliers and service providers. This
is true of areas such as vehicle hire, office rentals, water and
other utilities, including telecommunications where upfront cash
payment is not often demanded.
150 . As at October 2009, Government Ministries’ arrears on
payments for services stood at US$31 million .
151. Accumulation of arrears for services provided to Government
by our public enterprises and local authorities compromise
operations of the service providers.
152. It is, therefore, imperative that measures are put in place to
clear the arrears and prevent their further accumulation.

59
Capital Expenditures
153. Support for capital development has been very limited on
account of the constrained revenues. Capital expenditure for
the period to October 2009 amounted to US$28.4 million against
an overall Budget provision of US$178.1 million.
154. However, notwithstanding the necessity for essential items such
as furniture and vehicles for facilitating Ministries operations, a
significant proportion of capital expenditure ended up meeting
the above items, with very little left for other developmental
programmes.

60
155. Out of a total of US$28.4 million, developmental programmes
only got US$9.3 million against US$18.2 million for vehicles
and furniture.
156. The relatively lower level of developmental expenditures is also
against the background of low implementation capacities across
expenditure line Ministries. Often, availed resources have
remained idle as projects took longer to be implemented.
157. In the coming year 2010, it will be necessary to gradually
increase the share of public sector investment programmes,
whilst containing non-essential current expenditures. This will

61
have to be complemented by enhancement of project
implementation capacity.
Vote of Credit
158. From the total budgeted Vote of Credit amounting to US$391
million from co-operating partners, only US$35 million as at
30 October 2009 supported the health sector and water and
sanitation programmes. The balance was disbursed directly to
programmes and projects outside of Government budget
expenditure frameworks.
THE 2010 BUDGET THRUST
159. Mr Speaker Sir, as restated above, our Vision is that of
transforming Zimbabwe into a vibrant, democratic, prosperous
and functional Nation underpinned by the values of social justice
and equality.
160. Further, given our humongous problems and the structural
development traps outlined above, the 2010 National Budget
intends to oversee the mutation of the country’s economy
through the vehicle of Reconstruction with Equitable Growth
and Stability.
62
161. Executing the above agenda will also entail implementing and
completing the unfinished business of STERP during the
Framework period 2010 - 2012. The detailed programme for
this period is set out in the Three Year Macro-Economic Policy
and Budget Framework 2010 – 2012 (STERP II).
162. This Framework also incorporates a Three Year Rolling Budget
for the same period. The rolling Budget 2010 – 2012, has
become possible and necessary given the stability obtaining in
the market and the need to foster medium-term planning and
budgeting, thus enabling Government to focus beyond short
term deliverables.
The 2010 Budget Objectives and Priorities
163. In line with the above 2010 Budget Thrust, specific objectives
and priorities are:
Reconstruction
• Infrastructure rehabilitation and development in areas of
power, roads, rail, aviation, water and sanitation, and
Information Communication Technology (ICT). This is to
ensure that these utilities underpin overall economic
performance across the entirety of the productive sectors;

63
Equitable Growth
• Improving delivery of public services in sectors of water and
sanitation, transport, health and education;
• Enhancing social protection programmes to cushion
vulnerable groups;
• Ensuring that women are an equal and legitimate player
and shareholder in the development processes of the country
and therefore providing a framework for gender affirmative
programmes as permitted by Section 23 of the Constitution
of Zimbabwe.
Stabilisation
• Consolidating macroeconomic stability focusing on
containing inflation within single digit levels consistent with
the SADC macro-economic convergence criteria achieved
under STERP;
• Intensive and extensive investment promotion drive,
necessary for supporting productive sectors particularly in
64
agriculture, mining and manufacturing as well as
infrastructure development;
• Supporting implementation and completion of STERP and
the GPA unfinished programmes such as the legislative
reforms including the Constitution making process, land
audit, National Healing, freeing of the media and removal of
sanctions. Finalisation of these programmes will open up
opportunities and enhance peace and confidence in the
country;
• Strengthening the accountability over the use of public
resources;
• Strengthening of public institutions through capacity building,
adequately resourcing and incentivising workers and
enforcement of accountability.
164. In this regard, the 2010 Budget is designed based on the
following macro-economic targets:

65
2010 Budget Framework
2009 (March 2009 (OCT. 2010 (Proj.)
Orig. Est.) Rev. Est.)
Real GDP (% Growth) 3.7% 4.7% 7.0%
Annual Average Inflation (%) 6.4% -5.5% 5.1%
Nominal GDP US$3.462 billion US$5.179 billion US$5.561 billion
Revenues US$970 million US$1.040 billion US$1.440 billion
Revenues (% of GDP) 28% 20% 26%
Expenditures US$1.361 billion US$1.431 billion US$2.250 billion
Expenditures (% of GDP) 38.9% 28% 40.5%
Overall Balance (US$391 million) (US$391 million) (US$810 million)
Vote of Credit US$391 billion US$391 million US$810 million
Vote of Credit (% of GDP) 11.2% 7.5% 14.6%
Investment & Savings
Total Investment 4 10.3 14.3
Total Savings 4 10.3 14.3
External Sector
Exports of goods and services 1.519 billion 1.813 billion 2.018 billion % of GDP 43.8 35.0 36.3
Imports of goods and services 2.510 billion 3.313 billion 3.498 billion
% of GDP 72.5 64.0 62.9

66
Assumptions
165. The above projections and targets have taken cognisance of
downside risks and are informed by the following assumptions:
166. The 2010 projected positive real GDP growth rate of 7% is highly
dependent on a sustained accelerated recovery of agriculture
and mining sectors. Less favourable weather conditions for
agriculture will consequentially affect the performance of
manufacturing, and exports of agriculture manufactured
products, and hence revenues in support of the Budget.
Real Sector Growth Rates
Sector 2008 2009 2010
Agriculture -36% 10% 10%
Mining -30% 2% 40%
Manufacturing -12% 8% 10%
Tourism 9% 6.5% 10%
167. Projected economic growth rate is also dependent on higher
investment to GDP ratios. These, in turn, are a function of
recovery of public investment, financing from FDI and project

67
grants from cooperating partners, imports of capital goods and
a conducive business environment for private investors.
168 . The Framework projection for the average annual inflation of
about 3% to 5.1% takes account of the reality that, in the multiple
currency environment, domestic price developments are mainly
determined exogenously.
169. Growth in the ratio of Tax Revenue to GDP from 19.1% in 2009
to about 29.3% in 2010 will determine growth in Government
expenditure and public investment, given the vulnerable
availability of compensatory external financing inflows that would
help provide for the more conservative projected growth of tax
revenue and grants.
170. The projected higher levels of imports and hence the current
account deficit during 2010 and beyond imply growing needs
for external resources to finance the fast growth of total
investment necessary to sustain the projected GDP growth,
given the low levels of domestic national savings.
171. Exports growth is dependent on the projected fast growth of
agriculture and mining. Factors reducing the output growth in

68
these sectors would also affect negatively the projected growth
rates of exports during 2010 and beyond.
172. Rapid substitution of domestically produced goods and services
for imports will be necessary for decline in the overall ratio of
imports to GDP.
173. The projections are also based on a gradual improvement in
the political stability of the country as this is a major factor
affecting investor sentiment and external financing.
174. Finally, central to realising the projected macro-economic
fundamentals will be the consistent and timely implementation
of agreed measures.
Policy Implications
175. The above mentioned assumptions on the 2010 Budget
Framework poses a number of key policy implications which
include the following:
176. Scope for reducing expenditure is limited given the low levels
of wages and salaries and the need to improve the provision of
Government services.

69
177. Similarly, failure to support the capital expenditure budget would
undermine the scope for recovery and sustainable economic
growth.
178. Hence efforts will be required to raise additional revenues
through either increasing some specific taxes and/or improving
tax administration, whose estimated potential is an additional
2% per year.
179. This would, however, not be adequate to meet the various
Budget pressure areas and hence additional measures will be
necessary to improve tax revenue collections, especially against
the background of the large informalisation of the economy.
180. In order to complement domestic revenue mobilisation efforts,
pursuing external budgetary assistance will also be beneficial
to the Government’s economic recovery efforts.
THE 2010 BUDGET
THE 2010 EXPENDITURE BIDS
181. Line Ministries, departments and parastatals bids amounted to
US$12 billion . Clearly, there is limited capacity to finance such
high magnitudes of expenditure demands.

70
182 . As can be deduced from the Macro-economic Policy
Framework, the maximum tax revenue collections will be around
US$1.4 billion . This figure is therefore 733% less than the bid
of US$12 billion. This illustrates the huge gap between demand,
expectations and the inelastic fiscal space .
183. I therefore, had no choice but to scale the requirements down
to within manageable levels whilst ensuring that resources are
directed to those areas of immediate priority, in some cases
consistent with SADC, UNDP and other international standards
which stipulate sectoral expenditure targets expressed against
total expenditures as follows:
• Education allocation of 22%,
• Wage bill of below 30%,
• Health allocation of 15%,
• Agriculture allocation of 10%,
• Capital development allocation of 30%,
• Research, Science and Development 1% of GDP,
184. However, given Zimbabwe’s challenges and a fragile economy,
the proposals in the 2010 Budget may not meet the above
targets.
71
THE 2010 EXPENDITURE PROPOSALS
185. Mr Speaker Sir, Expenditure proposals and supportive
measures are in line with the 2010 Budget Thrust which
prioritises Reconstruction, Equitable growth and
Stabilisation .
186. Mr Speaker Sir, based on the 2010 Budget Framework,
available resources translate to US$2.250 billion , inclusive of
the Vote of Credit of US$810 million .
187. The understanding reached with cooperating partners is that
their resources will be directed to the programmes and projects
prioritised by Government and included in the Budget.
188. I have accordingly ensured that in the 2010 Budget the Vote 7
– Vote of Credit provides full details on the priority areas relating
to the US$810 million.

72
189. In this regard, I propose to allocate US$1 678.2 million for
recurrent expenditure and US$571.8 million for capital
expenditure made up of Government revenue and Vote of
Credit.
190. Mr Speaker Sir, allow me to now highlight components of the
2010 Expenditure Proposals, as illustrated in the following
graph: