taubman centers, inc. -...
TRANSCRIPT

0
Taubman Centers, Inc. Annual Meeting Investor Presentation Spring 2017

1
Development and Capital Allocation
Corporate Governance
Taubman is a Best-in-Class REIT
> Corporate Strategy, Portfolio & Performance
Strong and experienced Board of Directors aligned with shareholders
Addressing additional misleading statements and baseless claims made by Land & Buildings
Unparalleled value creation from development through market cycles
Commitment to disciplined balance sheet and capital allocation
Top 10 performing REIT over the last 20 years
Trophy quality, market dominant retail assets

2
Taubman Centers, Inc. (NYSE: TCO)
Founded in 1950 – 67 years in operation
First publicly traded UPREIT – IPO in 1992
Total market capitalization over $10 billion
Joined the S&P 400 MidCap Index in January 2011
We own, operate and develop the best retail assets
Our portfolio of malls is the most productive in the U.S. publicly held mall sector
Currently own and/or operate 27 retail assets

3
Beverly Center, Calif. Cherry Creek Shopping Center, Colo. City Creek Center, Utah Dolphin Mall, Fla.
Fair Oaks, Va. The Mall at Millenia, Fla. The Mall at Short Hills, N.J. Country Club Plaza, MO.
The Gardens on El Paseo, Calif. Great Lakes Crossing Outlets, Mich. Starfield Hanam, South Korea The Mall of San Juan, Puerto Rico
International Plaza, Fla. The Mall at University Town Center, Fla. Waterside Shops, Fla. Westfarms, Conn.
We Own, Operate and Develop the Best Retail Assets

4
The Taubman Strategic Vision Our long-standing vision of owning, operating and developing best-in-class, dynamic destination shopping centers
has kept us ahead of the curve in an ever-evolving retail environment
Long-standing dedication to creating high productivity experiential destination centers
Focused on high density, affluent markets Best-in-class anchors and in-line tenants
Focus on unique-to-market and emerging retailers
Long-standing focus on high-end consumer to drive mall productivity and growth
Well-positioned to attract premium, omnichannel retailers into high-end, productive centers in the best markets
Long-term strategy and vision has created ~$5bn of value
Cross-pollination of tenants across markets strengthens portfolio
Demonstrated ability to create value through capital and asset recycling
Tenant Quality
Asset Quality
High-End Focus
Omnichannel Complementary
Capital Allocation /
Recycling
Development Execution
Financial Discipline
Strong Leadership
Strong balance sheet Dividend growth through cycles
Strong and experienced Board Tested management team that has
created significant shareholder value

5
Owned Properties
1 Beverly Center Los Angeles, Calif.
2 Cherry Creek Shopping Center Denver, Colo.
3 CityOn.Xi’an Xi’an, China
4 CityOn.Zhengzhou Zhengzhou, China
5 City Creek Center Salt Lake City, Utah
6 Country Club Plaza Kansas City, Mo.
7 Dolphin Mall Miami, Fla.
8 Fair Oaks Fairfax, Va.
9 The Gardens on El Paseo Palm Desert, Calif.
10 Great Lakes Crossing Outlets Auburn Hills, Mich.
11 The Mall at Green Hills Nashville, Tenn.
12 International Market Place Waikiki, Honolulu, Hawaii
13 International Plaza Tampa, Fla.
14 The Mall at Millenia Orlando, Fla.
15 The Mall of San Juan San Juan, Puerto Rico
16 The Mall at Short Hills Short Hills, N.J.
17 Stamford Town Center Stamford, Conn.
18 Starfield Hanam Hanam, South Korea
19 Sunvalley Shopping Center Concord, Calif.
20 Taubman Prestige Outlets Chesterfield Chesterfield, Mo.
21 Twelve Oaks Mall Novi, Mich.
22 The Mall at University Town Center Sarasota, Fla.
23 Waterside Shops Naples, Fla.
24 Westfarms West Hartford, Conn.
12
25 The Boulevard at Studio City Macau, China 26 Miami Worldcenter Miami, Fla. 27 The Shops at Belmond Charleston Place Charleston, S.C.
Managed/Leased Centers – No Ownership
19
1 9
5
2 20
21 10
11
8
14 13
7 23 22
16 17
24
15
6
27
26
Asia Properties
South Korea China
Macau
3 18
25
4
We Operate the Best Collection of Retail Assets

6
Taubman’s portfolio(1) of malls averages between A+ and A quality
Long-Standing Focus on Highest End of Mall Quality Spectrum
Note: (1) Grades are based on sales per square foot. Mall value is based on sales productivity, size, quality and other factors. Taubman excludes The Mall of San Juan, CityOn.Xi’an, CityOn.Zhengzhou, International Market Place and Starfield Hanam, as the Green Street study included only stabilized assets in their analysis.
Source: Green Street Advisors, (2016) Upscale Shopping Centers Nudge Out Down-Market Malls, The Wall Street Journal
22% 22% 19% 12% 9% 7% 3% 2%
1% <1%
1%
A A++ quality malls, which represent less than 3.5% of all malls, account for 22% of all value
B CD B quality malls, which represent 37% of all malls, account for 19% of value
C quality malls, which represent 28% of all malls, account for 4% of value
D quality malls, which represent 7% of all malls, account for 0.2% of value
Percent of Industry Value
3767
94 104133
156
100 108 92 89 72
A++ A+ A A- B+ B B- C+ C C- D
U.S. Mall Distribution by Quality
A-quality malls represent <30% of all U.S. malls, but 75% of all value

7
Anchors are a critical factor in assessing mall quality
Strong anchors attract both retailers and customers
Taubman’s portfolio is well-positioned; containing the largest concentration of high quality anchors
Better Fashion Anchors
Total Traditional Dept. Stores
Greatest Exposure to Superior-Drawing Fashion Anchors TCO CBL GGP MAC PEI SPG WPG Total
15 41 101 41 22 111 34 365
9 2 25 13 3 28 4 84
4 0 10 2 0 10 0 26
5 3 4 1 0 6 1 20
3 0 4 2 1 11 0 21
3 0 9 3 1 9 0 25
0 0 1 0 0 2 0 3
39 46 154 62 27 177 39 544
49 259 386 138 83 387 176 1478
79.6% 17.8% 39.9% 44.9% 32.5% 45.7% 22.2% 36.8%
Unparalleled Anchor Quality Drives Mall Visitation
Note: Analysis includes Macy’s Men’s Store and Macy’s Furniture Gallery. Source: BofA Merrill Lynch Global Research, “Assessing the Mall Industry VI”, May 19, 2016

8
Over the last 10 years, we have proactively increased the footprint of new retailers throughout our portfolio, replacing formerly prominent tenants
The information below highlights a sample of tenants indicative of change within our tenant base over the last 10 years
The evolution of Taubman’s tenant mix has contributed to our sales growth over the last decade
Proactive Management of Retailer Mix Leads to Sales Growth
Select Tenants Change in GLA (Sqft.) Between 2016 vs. 2006
+75,000
+301,000
+46,000
+86,000
+79,000
400
500
600
700
800
2006 2007 2008 2009 2010 2011 2012 2013 2014 2015 2016
Tenant Sales per Square Foot (2006 through 2016)
Tena
nt S
ales
per
Squ
are
Foot
($)
Select Tenants Change in GLA (Sqft.) Between 2016 vs. 2006
-87,000
-50,000
-59,000
-93,000
-48,000
4.1% CAGR

9
We Target and Attract Cutting-Edge Brands
Brands that have chosen a Taubman center as their first U.S. Mall location
“Online” retailers that are now tenants in Taubman Centers

10
Average Rent per Square Foot(2) Sales per Square Foot(1)
Our Focus on Owning, Operating and Developing the Best Malls Has Yielded Industry-Leading Results
Note: (1) As of 31-Dec-2016. Typically excludes all non-comparable centers, anchors, temporary tenants and 10,000+ sf tenants. (2) As of 31-Dec-2016. GGP, Inc. is excluded as it does not report Avg. Rent Per Square Foot on a comparable basis. Source: Company filings and Supplementals, Company Quarterly Earnings, Conference Calls, Taubman Analysis
Our portfolio of malls is the most productive among our peers
$ 368
$ 376
$ 464
$ 581
$ 614
$ 630
$ 792
$ 0 $ 200 $ 400 $ 600 $ 800 $ 1,000
WPG
CBL
PEI
GGP
SPG
MAC
TCO
$ 27.69
$ 32.82
$ 51.59
$ 54.87
$ 56.99
$ 61.07
$0 $20 $40 $60 $80
WPG
CBL
SPG
MAC
PEI
TCO

11
$437
$581
2005 2016
$417
$630
2005 2016
$450
$614
2005 2016
$508
$792
2005 2016
Our Portfolio Has Consistently Delivered Industry-Leading Sales Productivity and Strong NOI Growth
Note: (1) Indexed from base year of 2005 as 100%, and grown each year by GSA same-Property NOI growth rates to achieve 2016 end points. CAGRs are calculated based on end point year in 2016 over base of 100% in 2005. Source: Green Street Advisors
Sales per Square Foot Growth
Indexed Comparable Center NOI Growth(1)
2005 2016
100 %
143 %
2005 2016
147 %
100 %
2005 2016
136 %
100 %
2005 2016
135 %
100 %
12
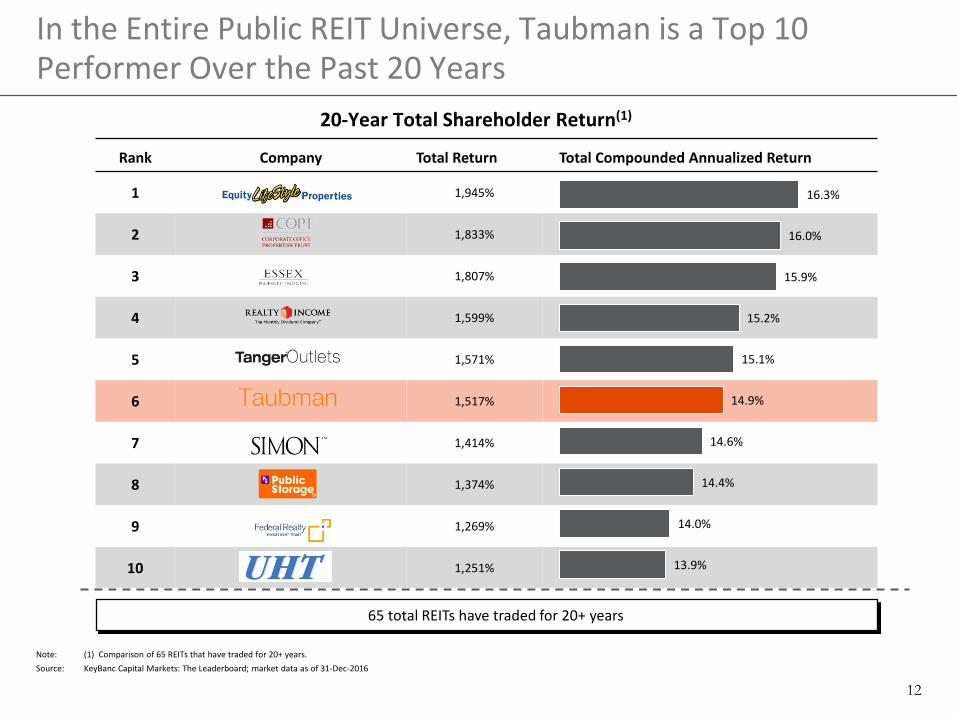
Rank Company Total Return Total Compounded Annualized Return
1 1,945%
2 1,833%
3 1,807%
4 1,599%
5 1,571%
6 1,517%
7 1,414%
8 1,374%
9 1,269%
10 1,251%
In the Entire Public REIT Universe, Taubman is a Top 10 Performer Over the Past 20 Years
Source: KeyBanc Capital Markets: The Leaderboard; market data as of 31-Dec-2016
20-Year Total Shareholder Return(1)
Note: (1) Comparison of 65 REITs that have traded for 20+ years.
65 total REITs have traded for 20+ years
13.9%
14.0%
14.4%
14.6%
14.9%
15.1%
15.2%
15.9%
16.0%
16.3%

13
20-Year Total Shareholder Return(1)
Rank Company CEO (Tenure Yrs) Total Return Total Compounded Annualized Return
1 Robert Taubman (~27) 1,517 %
2 David Simon (~22) 1,414 %
3 Alan Miller (~31) 1,251 %
4 B. Francis Saul II (~24) 1,159 %
5 Arthur Coppola (~24) 887 %
6 Gary Shiffman (~23) 854 %
7 Richard Campo (~24) 830 %
8 George Zoley (~23) 821 %
9 Martin Stein Jr. (~24) 664 %
10 Terry Considine (~23) 568 %
The Company, Led by Robert Taubman, Has Created More Value for Shareholders Than Any Other REITs With Similarly Tenured CEOs
Source: KeyBanc Capital Markets: The Leaderboard; market data as of 31-Dec-2016 Note: (1) Comparison of 65 REITs that have traded for 20+ years.
10.0 %
10.7 %
11.7 %
11.8 %
11.9 %
12.1 %
13.5 %
13.9 %
14.6 %
14.9 %
14
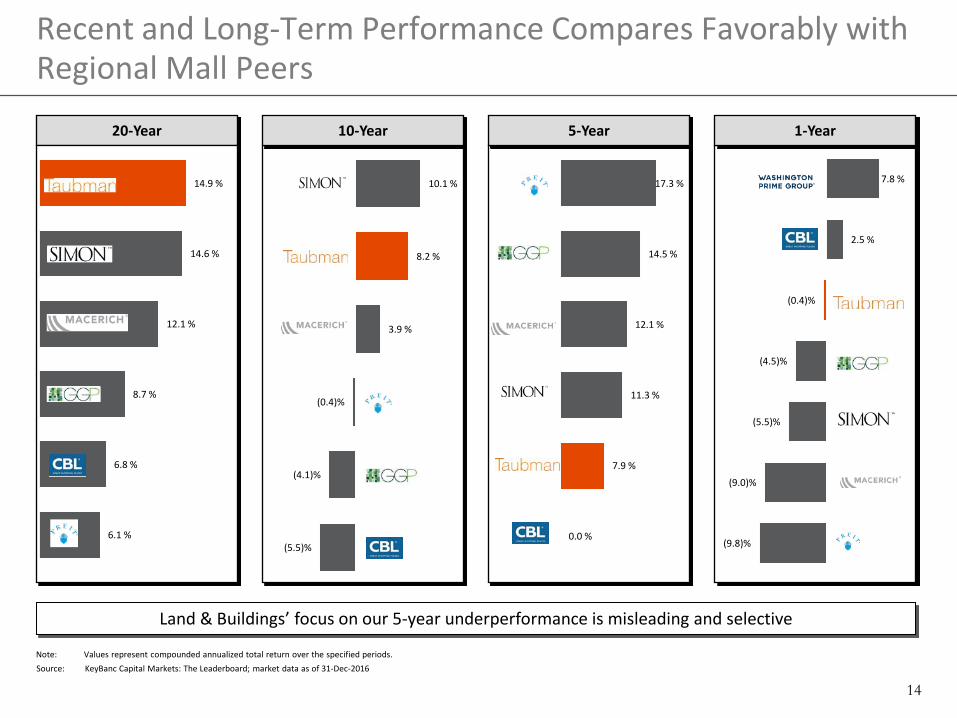
0.0 %
7.9 %
11.3 %
12.1 %
14.5 %
17.3 %
20-Year 10-Year 5-Year
Recent and Long-Term Performance Compares Favorably with Regional Mall Peers
Land & Buildings’ focus on our 5-year underperformance is misleading and selective
Source: KeyBanc Capital Markets: The Leaderboard; market data as of 31-Dec-2016
1-Year
6.1 %
6.8 %
8.7 %
12.1 %
14.6 %
14.9 %
Note: Values represent compounded annualized total return over the specified periods.
(5.5)%
(4.1)%
(0.4)%
3.9 %
8.2 %
10.1 %
(9.8)%
(9.0)%
(5.5)%
(4.5)%
(0.4)%
2.5 %
7.8 %
15
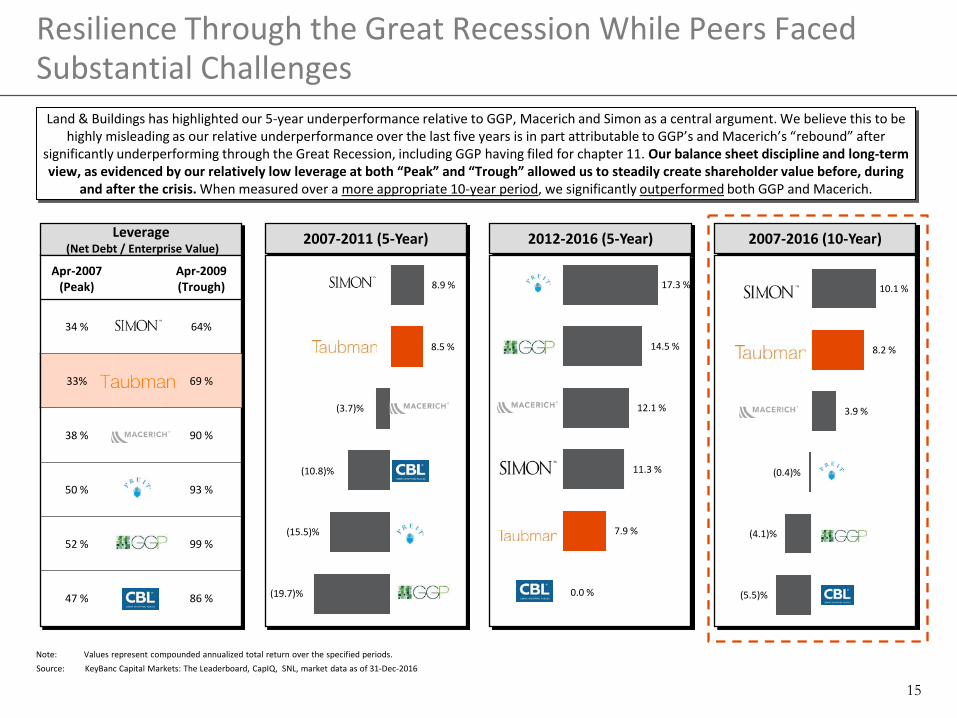
2007-2011 (5-Year) Leverage (Net Debt / Enterprise Value) 2012-2016 (5-Year) 2007-2016 (10-Year)
Resilience Through the Great Recession While Peers Faced Substantial Challenges
Source: KeyBanc Capital Markets: The Leaderboard, CapIQ, SNL, market data as of 31-Dec-2016
Land & Buildings has highlighted our 5-year underperformance relative to GGP, Macerich and Simon as a central argument. We believe this to be highly misleading as our relative underperformance over the last five years is in part attributable to GGP’s and Macerich’s “rebound” after
significantly underperforming through the Great Recession, including GGP having filed for chapter 11. Our balance sheet discipline and long-term view, as evidenced by our relatively low leverage at both “Peak” and “Trough” allowed us to steadily create shareholder value before, during
and after the crisis. When measured over a more appropriate 10-year period, we significantly outperformed both GGP and Macerich.
0.0 %
7.9 %
11.3 %
12.1 %
14.5 %
17.3 %
8.5 %
8.9 %
(19.7)%
(15.5)%
(10.8)%
(3.7)%
Apr-2007 (Peak)
Apr-2009 (Trough)
34 % 64%
33% 69 %
38 % 90 %
50 % 93 %
52 % 99 %
47 % 86 %
Note: Values represent compounded annualized total return over the specified periods.
(5.5)%
(4.1)%
(0.4)%
3.9 %
8.2 %
10.1 %

16
$1.29 $1.54 $1.66 $1.66 $1.68 $1.76 $1.85
$2.00 $2.16 $2.26 $2.38
2006 2007 2008 2009 2010 2011 2012 2013 2014 2015 2016
Over 60 RMZ-listed REITs cut their dividend
during the recession; our dividend grew…
Rewarding Our Shareholders We have a cycle-tested management team that showed superior financial discipline and outperformed peers during the Great Recession (2007-2010):
Demonstrated Financial Discipline Going Into and During the Great Recession
Dividend per Share (2006-2016)(1)
Our Dividend Grew During the Great Recession 2007-2010 Dividend per Share CAGR vs Peers
Dividend Cut
Equity Raise
Stock Dividend Bankruptcy
Taubman
SPG MAC GGP
Note: (1) 2010 excludes special dividend of $0.1834 per share paid in December 2010. 2014 excludes special dividend of $4.75 per share paid in December 2014. Source: Capital IQ, Company filings, Annual dividend per share as of December 31 for each respective year
2007-2010 Dividend per Share CAGR vs Peers
3.0 %
(8.2)% (10.5)%
(41.5)%
(20.0)%
Taubman SPG MAC GGPRMZ
Average

17
$1.97 $2.01 $2.02 $2.02 $2.02 $2.08 $2.18 $2.40 $2.60 $2.80 $3.04 $3.36 $3.60 $2.70 $2.60
$3.30 $4.10 $4.65 $5.15
$6.05 $6.50
1996 1997 1998 1999 2000 2001 2002 2003 2004 2005 2006 2007 2008 2009 2010 2011 2012 2013 2014 2015 2016
$1.70 $1.78 $1.87 $1.97 $2.06 $2.14 $2.22 $2.32 $2.48 $2.63 $2.75 $2.93 $3.20 $2.60
$2.10 $2.05 $2.23 $2.36 $2.51 $2.63 $2.75
1996 1997 1998 1999 2000 2001 2002 2003 2004 2005 2006 2007 2008 2009 2010 2011 2012 2013 2014 2015 2016
$0.56 $0.60 $0.60 $0.63 $0.68 $0.72 $0.86 $0.98 $1.22 $1.45 $1.64 $1.81 $1.50
$0.18 $0.37 $0.40 $0.42 $0.51 $0.63 $0.71 $0.80
1996 1997 1998 1999 2000 2001 2002 2003 2004 2005 2006 2007 2008 2009 2010 2011 2012 2013 2014 2015 2016
The Only High Quality Mall REIT Not to Cut Dividends During the Great Recession
Note: (1) 2010 excludes special dividend of $0.1834 per share paid in December 2010. 2014 excludes special dividend of $4.75 per share paid in December 2014. Source: Capital IQ as of 17-Jan-2017, company websites
CAGR(1) 10-Year 20-Year
6.3% 5.0%
CAGR 10-Year 20-Year
7.9% 6.2%
CAGR 10-Year 20-Year
0.0% 2.4%
CAGR 10-Year 20-Year (6.9)% 1.8%
$0.89 $0.93 $0.95 $0.97 $0.99 $1.01 $1.03 $1.05 $1.10 $1.16 $1.29 $1.54 $1.66 $1.66 $1.68 $1.76 $1.85 $2.00 $2.16 $2.26 $2.38
1996 1997 1998 1999 2000 2001 2002 2003 2004 2005 2006 2007 2008 2009 2010 2011 2012 2013 2014 2015 2016

18
0
5
10
15
20
25
30
35
40
45
50
-
2,000
4,000
6,000
8,000
10,000
12,000
1992 1997 2002 2007 2012 (2014) 2016
Dol
lars
in m
illion
s
Ow
ned and Operating M
alls
Total Market Cap
Equity Market Cap
Number Owned and Operating
Malls
Strong Track Record of Recycling Capital for Growth
As of year-end 2016, we had grown our total market capitalization from $2.2 billion at our IPO to $11.1 billion
Our growth is the result of intensively managing our portfolio and strategically recycling capital as opposed to raising dilutive equity
— Since 2008 we have developed, renovated, or expanded over 75% of our assets
— Our number of owned centers has only increased by five malls since IPO (1992)
— We have issued only $50mm of net common equity(2)
Note: (1) Equity market cap does not include dividends and distributions. (2) Excludes equity compensation.
Our Intensively Managed Portfolio Drives Sustainable Growth Over the Long-Term
Our Portfolio
Number of centers owned at IPO (1992) 19
Centers developed 20
Centers acquired 11
Centers sold/exchanged (26 )
Number of centers owned today 24
Market Capitalization vs. Number of Owned Malls Since 1992 IPO
(1)

19
The Mall Sector is the Most Undervalued Among All Major REIT Sectors; While Undervalued, TCO Remains In Line with Peers…
Source: NAVs per Green Street Advisors as of 31-Dec-2016
REIT Industry Premium/(Discount) to Net Asset Value (NAV)
Mall Sector Premium/(Discount) to Net Asset Value (NAV)
21.0 % 20.5 %
9.3 % 8.3 %3.3 %
(3.5)% (4.1)%(9.6)% (11.8)%
(26.8)%(30.0)%
(20.0)%
(10.0)%
0.0 %
10.0 %
20.0 %
30.0 %
Net Lease Data Center Healthcare Industrial Self Storage Strip Center Hotel Apartment Office Mall
(25.4)% (25.8)%(31.0)% (31.7)%
(39.3)%(43.4)%
(52.1)%
(70.0)%
(60.0)%
(50.0)%
(40.0)%
(30.0)%
(20.0)%
(10.0)%
0.0 %
20
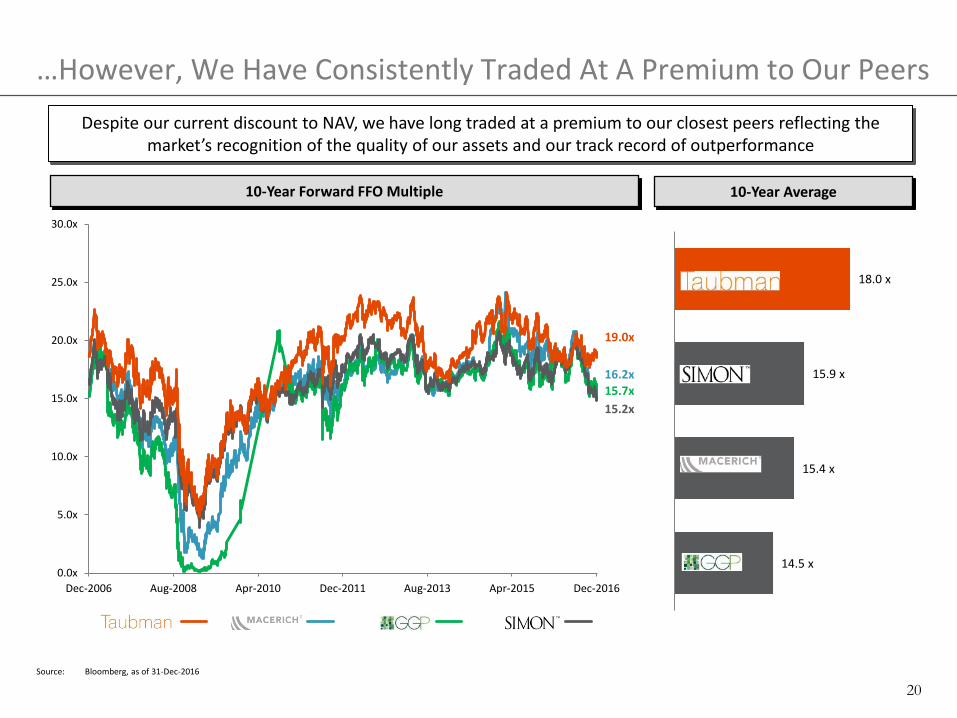
…However, We Have Consistently Traded At A Premium to Our Peers
10-Year Forward FFO Multiple
Despite our current discount to NAV, we have long traded at a premium to our closest peers reflecting the market’s recognition of the quality of our assets and our track record of outperformance
Source: Bloomberg, as of 31-Dec-2016
10-Year Average
14.5 x
15.4 x
15.9 x
18.0 x
16.2x15.7x15.2x
19.0x
0.0x
5.0x
10.0x
15.0x
20.0x
25.0x
30.0x
Dec-2006 Aug-2008 Apr-2010 Dec-2011 Aug-2013 Apr-2015 Dec-2016
T G M S

21
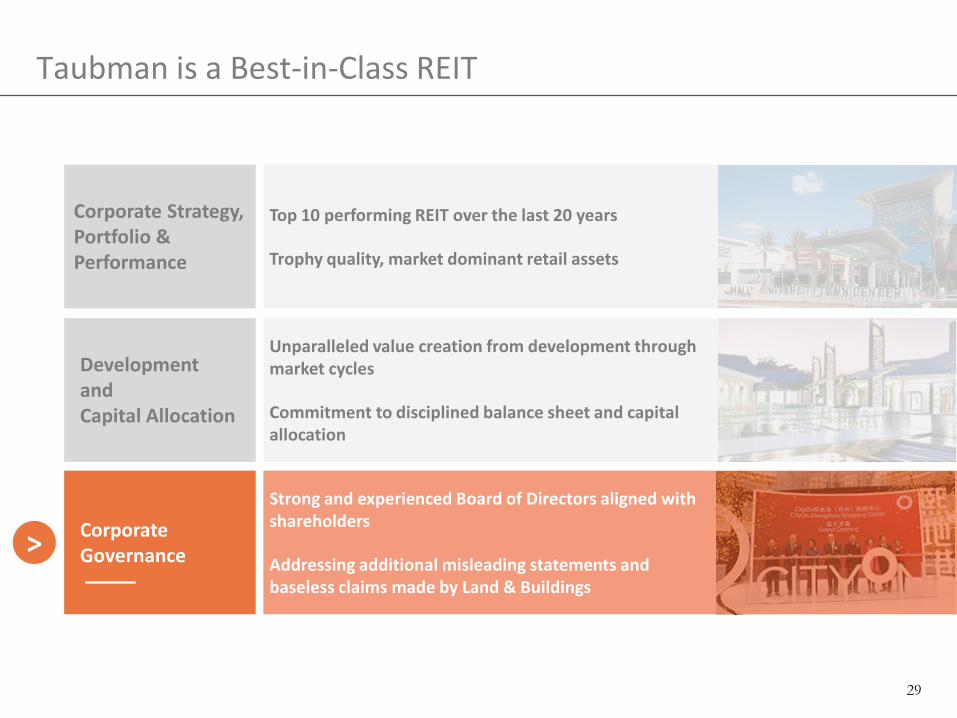
Top 10 performing REIT over the last 20 years
Trophy quality, market dominant retail assets
Development and Capital Allocation
Unparalleled value creation from development through market cycles
Commitment to disciplined balance sheet and capital allocation
Corporate Governance
Taubman is a Best-in-Class REIT
>
Corporate Strategy, Portfolio & Performance
Strong and experienced Board of Directors aligned with shareholders
Addressing additional misleading statements and baseless claims made by Land & Buildings
22
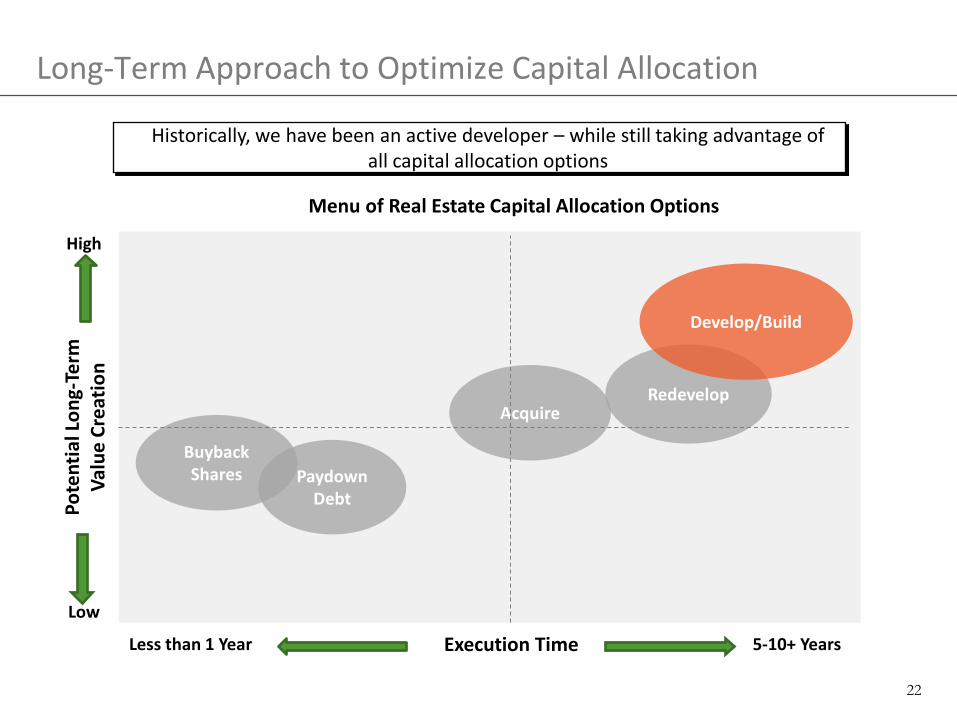
Long-Term Approach to Optimize Capital Allocation
Historically, we have been an active developer – while still taking advantage of all capital allocation options
Execution Time Less than 1 Year 5-10+ Years
Pote
ntia
l Lon
g-Te
rm
Valu
e Cr
eatio
n
High
Low
Acquire Redevelop
Develop/Build
Buyback Shares Paydown
Debt
Menu of Real Estate Capital Allocation Options

23
Capital Allocation: A Board-Driven Process with Disciplined Hurdle Rates
The Five “Gates”
Investment returns
greater than hurdle rate
Sufficient specialty store opportunity Entitle site Anchor/tenant
interest in site Identify
market/site Allocate Capital
Hurdle Rates: Levered IRRs
Taubman weighted average cost of capital(1) ≈ 5.5%
Hurdle Rates(2)
Acquisitions ≈ 8-10%
U.S. development projects ≈ 10%
South Korea development projects ≈ 12%
China development projects ≈ 15%
Why We Develop (a Development Project Example)
$80M Value Creation
$400M Cost
6.0% Yield
$24M Annual NOI
5% Cap Rate
$480M Asset Value
$160M Value Creation
$400M Cost
7.0% Yield
$28M Annual NOI
5% Cap Rate
$560M Asset Value
$240M Value Creation
$400M Cost
8.0% Yield
$32M Annual NOI
5% Cap Rate
$640M Asset Value
Note: (1) Assumes a 65/35 equity/debt balance sheet mix. (2) Hurdle Rate is based on a 10-Year Levered After-tax IRR. Source: Taubman Analysis
24
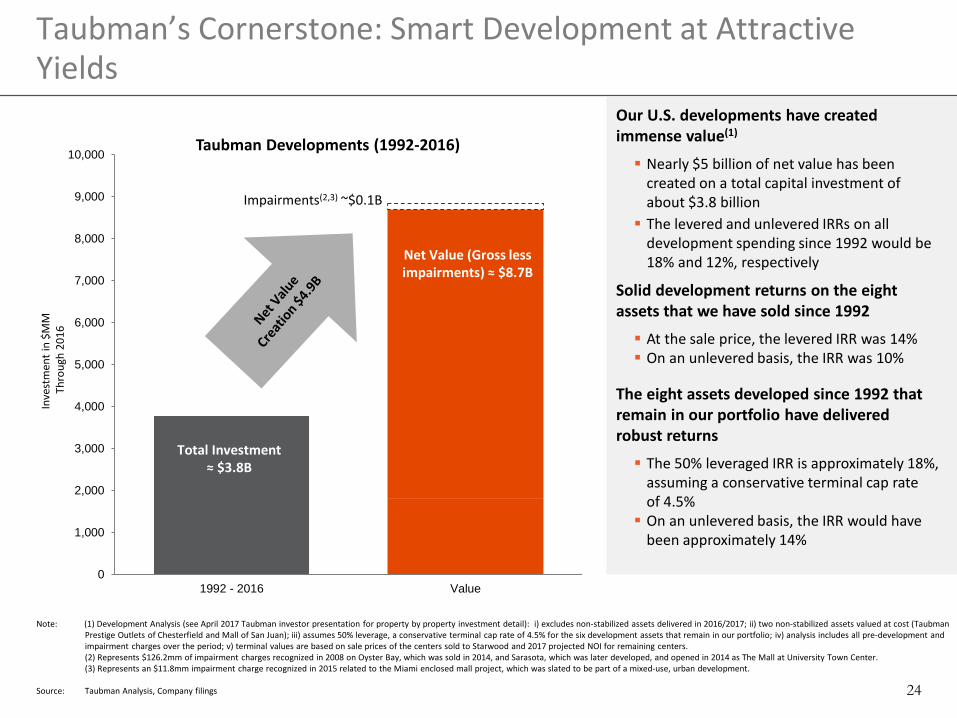
Taubman’s Cornerstone: Smart Development at Attractive Yields
Taubman Developments (1992-2016)
Our U.S. developments have created immense value(1)
Nearly $5 billion of net value has been created on a total capital investment of about $3.8 billion The levered and unlevered IRRs on all
development spending since 1992 would be 18% and 12%, respectively
Solid development returns on the eight assets that we have sold since 1992
At the sale price, the levered IRR was 14% On an unlevered basis, the IRR was 10%
The eight assets developed since 1992 that remain in our portfolio have delivered robust returns
The 50% leveraged IRR is approximately 18%, assuming a conservative terminal cap rate of 4.5% On an unlevered basis, the IRR would have
been approximately 14%
0
1,000
2,000
3,000
4,000
5,000
6,000
7,000
8,000
9,000
10,000
1992 - 2016 Value
Net Value (Gross less impairments) ≈ $8.7B
Inve
stm
ent i
n $M
M
Thr
ough
201
6
Impairments(2,3) ~$0.1B
Total Investment ≈ $3.8B
Note: (1) Development Analysis (see April 2017 Taubman investor presentation for property by property investment detail): i) excludes non-stabilized assets delivered in 2016/2017; ii) two non-stabilized assets valued at cost (Taubman Prestige Outlets of Chesterfield and Mall of San Juan); iii) assumes 50% leverage, a conservative terminal cap rate of 4.5% for the six development assets that remain in our portfolio; iv) analysis includes all pre-development and impairment charges over the period; v) terminal values are based on sale prices of the centers sold to Starwood and 2017 projected NOI for remaining centers.
(2) Represents $126.2mm of impairment charges recognized in 2008 on Oyster Bay, which was sold in 2014, and Sarasota, which was later developed, and opened in 2014 as The Mall at University Town Center. (3) Represents an $11.8mm impairment charge recognized in 2015 related to the Miami enclosed mall project, which was slated to be part of a mixed-use, urban development. Source: Taubman Analysis, Company filings

25
Asset Location GSA Estimated
Sales per Square Foot(1) GSA Quality Ranking(1)
Year Completed
The Mall at Millenia Orlando, FL $1,345 A++ 2002
Dolphin Mall Miami, FL $935 A+ 2001
International Plaza Tampa, FL $925 A+ 2001
The Mall at University Town Center Sarasota, FL $900 A 2014
City Creek Center Salt Lake City, UT $615 A 2012
Great Lakes Crossing Auburn Hills, MI $610 A 1998
Taubman Has Developed Some of the Most Productive Assets in the Industry, As Recognized By Equity Research
Source: Green Street Advisors, Company filings
Note: (1) Per Green Street Advisors.

26
Taubman Asia – Strategy
Identify our preferred markets Second-tier cities in China; South Korea
Build a team Now operating with a tested, comprehensive
Taubman Asia team with employees and skills in all disciplines
Select strategic partners
Wangfujing, one of the oldest and largest department store chains in China
Shinsegae, one of South Korea’s largest retailers operating multiple retail platforms
Develop and execute the right shopping center
concept
Maintained targeted yields and costs in China Lowered costs and raised yields in South Korea Exceptional leasing execution with CityOn.Xi’an
95% leased at opening and both Starfield Hanam and CityOn.Zhengzhou 100% leased at opening
Grand Opening of our first Taubman
Asia developments
CityOn.Xi’an opened April 2016 Starfield Hanam opened September 2016 CityOn.Zhengzhou opened March 2017
Use established platform to
gradually expand our business
Prepared to leverage our successful developments to yield lucrative future opportunities
Strategy – “Own, Operate and Develop Centers of International Quality”
Additional Growth
Exposure to rapidly growing GDP
Augments our U.S. development
Utilize Our Expertise
Leasing/retailer relationships
Design/development expertise
Operational/marketing skills
Generational Opportunity
Demand for high-quality retail is early to mid-cycle
Significant deal flow Diversifies longer-term
growth investment opportunities
Why Asia?
1
2
3
✔ ✔ ✔ ✔ ✔ ✔

27
Developments in Asia on Track to Meet Our Expectations
Asset Date Opened % Leased On Budget Open
On-Time Positioned to Create
Substantial Value
CityOn.Xi'an – Xi'an, China
Apr-2016 100%
CityOn.Zhengzhou – Zhengzhou, China
Mar-2017 100%
Starfield Hanam – Hanam, South Korea
Sept-2016 100%
Source: Company filings and transcripts
✔
✔
✔
✔ ✔
- ✔
✔ ✔ ✔ (under budget) (3 months early)
✔
(4 months delayed)
✔

28
Wei
ghte
d Av
erag
e In
tere
st R
ate
Weighted Average Debt Maturity
Most efficient debt pricing Cost of capital advantage
Lowest Cost and Longest Term Debt in U.S. Mall REIT Sector
Dolla
rs in
$M
M
Debt Maturities by Year (as of 12/31/2016, in millions at our share)1
Note: (1) Maturities assume that all extension options have been exercised and no pay downs are required upon extension. Source: Company Quarterly Supplementals, Taubman analysis
(as of 12/31/2016)
Strong Balance Sheet
Balance Sheet Composition (as of 12/31/2016)
$ 41 $ 146
$ 932 $ 578
$ 241
$ 2,438
$ 0
$ 500
$ 1,000
$ 1,500
$ 2,000
$ 2,500
$ 3,000
2017 2018 2019 2020 2021 Thereafter
TCO
3.43%
SPG MAC
GGP WPG
PEI CBL
3.0%
3.5%
4.0%
4.5%
5.0%
4.0 4.5 5.0 5.5 6.0 6.5 7.0
57%
3%
25%
7%8%
Common Stock andOperating PartnershipEquity ($6.3B)Preferred Stock ($0.4B)
Fixed Rate Debt ($2.7B)
Floating Rate Debt Swappedto Fixed Rate ($0.7B)
Floating Rate Debt ($0.9B)
We have extremely attractive, stable, high-quality assets that allow for financing at the best rates with extended maturities
29
Unparalleled value creation from development through market cycles
Commitment to disciplined balance sheet and capital allocation
Development and Capital Allocation
Corporate Governance
Taubman is a Best-in-Class REIT
> Strong and experienced Board of Directors aligned with shareholders
Addressing additional misleading statements and baseless claims made by Land & Buildings
Top 10 performing REIT over the last 20 years
Trophy quality, market dominant retail assets
Corporate Strategy, Portfolio & Performance
30
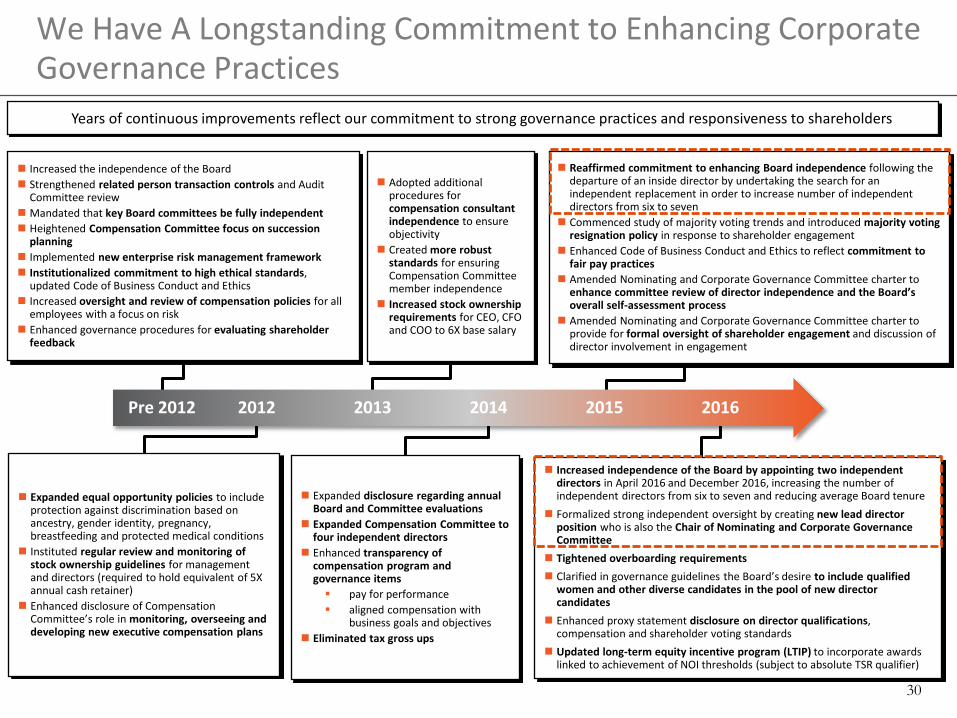
Years of continuous improvements reflect our commitment to strong governance practices and responsiveness to shareholders
We Have A Longstanding Commitment to Enhancing Corporate Governance Practices
2013 2015 2012 2014 2016
Increased independence of the Board by appointing two independent directors in April 2016 and December 2016, increasing the number of independent directors from six to seven and reducing average Board tenure
Formalized strong independent oversight by creating new lead director position who is also the Chair of Nominating and Corporate Governance Committee
Tightened overboarding requirements Clarified in governance guidelines the Board’s desire to include qualified
women and other diverse candidates in the pool of new director candidates
Enhanced proxy statement disclosure on director qualifications, compensation and shareholder voting standards
Updated long-term equity incentive program (LTIP) to incorporate awards linked to achievement of NOI thresholds (subject to absolute TSR qualifier)
Adopted additional procedures for compensation consultant independence to ensure objectivity
Created more robust standards for ensuring Compensation Committee member independence
Increased stock ownership requirements for CEO, CFO and COO to 6X base salary
Increased the independence of the Board Strengthened related person transaction controls and Audit
Committee review Mandated that key Board committees be fully independent Heightened Compensation Committee focus on succession
planning Implemented new enterprise risk management framework Institutionalized commitment to high ethical standards,
updated Code of Business Conduct and Ethics Increased oversight and review of compensation policies for all
employees with a focus on risk Enhanced governance procedures for evaluating shareholder
feedback
Expanded equal opportunity policies to include protection against discrimination based on ancestry, gender identity, pregnancy, breastfeeding and protected medical conditions
Instituted regular review and monitoring of stock ownership guidelines for management and directors (required to hold equivalent of 5X annual cash retainer)
Enhanced disclosure of Compensation Committee’s role in monitoring, overseeing and developing new executive compensation plans
Expanded disclosure regarding annual Board and Committee evaluations
Expanded Compensation Committee to four independent directors
Enhanced transparency of compensation program and governance items pay for performance aligned compensation with
business goals and objectives Eliminated tax gross ups
Reaffirmed commitment to enhancing Board independence following the departure of an inside director by undertaking the search for an independent replacement in order to increase number of independent directors from six to seven
Commenced study of majority voting trends and introduced majority voting resignation policy in response to shareholder engagement
Enhanced Code of Business Conduct and Ethics to reflect commitment to fair pay practices
Amended Nominating and Corporate Governance Committee charter to enhance committee review of director independence and the Board’s overall self-assessment process
Amended Nominating and Corporate Governance Committee charter to provide for formal oversight of shareholder engagement and discussion of director involvement in engagement
Pre 2012

31
Our Recent Proactive Steps to Improve Corporate Governance Have Been Mischaracterized by Land & Buildings
Added Cia Buckley Marakovits to the Board; an independent, highly
regarded, industry-leading businesswoman
Appointed Mike Ullman to newly created role of Lead Director with
significant oversight function(1)
“By adding Cia Buckley’s [sic] to the Board, Taubman
has further demonstrated its lack of regard for Shareholders”
16-Dec-2016
“…appears to lack any meaningful powers that could change the status quo of prioritizing the Taubman
Family’s interests”
24-Jan-2017
Our Actions Response
✔
✔
Note: (1) For a detailed description of the Lead Director roles and responsibilities, please visit Section D of our Corporate Governance Guidelines.
??
??

32
The Series B Shares Ensure Voting Interests in TCO Are Aligned with the Economic Interests in the Operating Partnership
Series B shares can be accumulated/bought to hold a disproportionate number of votes
Series B shares generally cannot be traded separately from the OP units, and have liquidation value at par ($0.01)
Series B shares must be tendered if OP units are converted to common shares
Myth Fact
Series B shares have the same economic interest as the common shares
Series B shares are not entitled to any dividends or earnings
Series B shares can only be converted to common stock at a ratio of 14,000 Series B shares to one common share
Series B shares were created for the sole benefit of the Taubman Family
Series B shares were issued to create a democratic voting and governance structure that aligns ownership and voting interests(1)
The $38,400 paid for the Series B shares was an egregiously low price for the voting power acquired
The OP unit holders elected in 1998 to give up their partnership voting power for Series B share voting power when TCO became the managing general partner of the operating partnership
Taubman family effectively reduced their economic ownership in the Company by more than one third by pledging both shares and OP units as collateral for loans
Pledging of shares and OP units caused neither actual change in ownership nor effective change in ownership
The Series B shares have an outsized vote relative to common shares
Series B shares are effectively stapled to operating partnership units and give the holder one vote, which is identical to common shares
Note: (1) Refer to appendix for details of the 1998 restructuring.

33
Our Margins are In Line with Peers Given Our Size
Note: (1) See appendix regarding reconciliations of Consolidated EBITDA and Consolidated NOI to Net Income. Source: Public filings
Mall Peers 2016 Consolidated EBITDA Margin vs Consolidated Revenues ($ in 000’s)(1)
Mall Peers 2016 Consolidated EBITDA Margin vs Number of Owned Assets
Mall Peers 2016 Consolidated EBITDA Margin vs Consolidated NOI ($ in 000’s)(1)
Land & Buildings’ fixation on our margins is erroneous, requires myriad assumptions, and reflects their lack of appreciation for one of the most important drivers of regional mall EBITDA margins: scale
A-Mall Peers
TCO
SPG
MAC
GGP
PEI
CBL
WPG
R² = 0.9177
50.0 %
60.0 %
70.0 %
80.0 %
- 1,000,000 2,000,000 3,000,000 4,000,000 5,000,000 6,000,000
R² = 0.92 (A-Mall)
TCO
SPG
MAC
GGP
PEI
CBLWPG
R² = 0.9153
50.0 %
60.0 %
70.0 %
80.0 %
- 500,000 1,000,000 1,500,000 2,000,000 2,500,000 3,000,000 3,500,000 4,000,000 4,500,000
R² = 0.92 (A-Mall)
TCO
SPG
MAC
GGP
PEI
CBLWPG
R² = 0.9966
50.0 %
60.0 %
70.0 %
80.0 %
20 40 60 80 100 120 140 160 180 200
R² = 0.99 (A-Mall)

34
0.60 %
0.51 %0.49 %
0.45 %
0.39 %0.37 %
0.33 % 0.32 % 0.31 % 0.29 % 0.27 %
0.19 % 0.19 %
BRX ARE INVH DRE DDR TCO O AIV VER UDR FRT MAA EXR
Average: 0.36 %
$14.6B $13.7B $13.0B $12.3B $12.7B $14.3B $16.1B $12.7B $16.8B $16.4B $12.9B $16.3B $14.0B GSA GAV
Mall Average: 0.42 %
A Mall Average: 0.25 %
Our G&A as a % of GAV is better than the mall sector average and in-line with similar size REITs across other sectors
As our developments stabilize and incremental NOI comes online through 2019, our G&A as a % of GAV will continue to decrease as asset value increases
Our G&A as a % of Gross Asset Value is In Line with REITs of Similar Sizes Across Sectors
G&A as a % of Green Street Advisors’ Gross Asset Value(1)
Note: (1) Companies included are all GSA-covered REITs w/ $11B-$17B GAV. GAV stands for Gross Asset Value (“GAV”). “Mall Average” includes GGP, SPG, MAC, WPG, PEI, and CBL. “A Mall Average” includes GGP, SPG and MAC. G&A for all companies as of the year ended 31-Dec-2016.
Source: Company filings and Green Street Advisors, data as of 31-Dec-2016
Stabilization of Developments Will Further Drive Growth in GAV, NOI and Margins

35
What We Don’t Do What We Do
Our G&A Practices Are Consistent with Peers and Have Been Taken Out of Context by Land & Buildings
Allow shareholders to pay for executives’ personal use of the corporate jet
Compensate our executives with personal use corporate jet perks as some of our peers do
Lease a corporate jet; a practice common across the REIT sector and our mall peers
Executives reimburse the Company for personal use flights at amounts that are more than their value as computed under the IRS-prescribed Standard Industry Fare Level formula (SIFL)
Provide an Annual Internal Audit report to the Board’s Audit Committee summarizing the use of the corporate jet by executives and their subsequent reimbursements for the Committee’s review
Task our Financial Reporting and Accounting and Corporate Tax departments with reviewing itineraries and allocating costs to ensure compliance with IRS guidelines
Maintain small office in New York City, as do most peers, to facilitate business development given proximity to tenants, brokers, investors and other key business counterparties
36
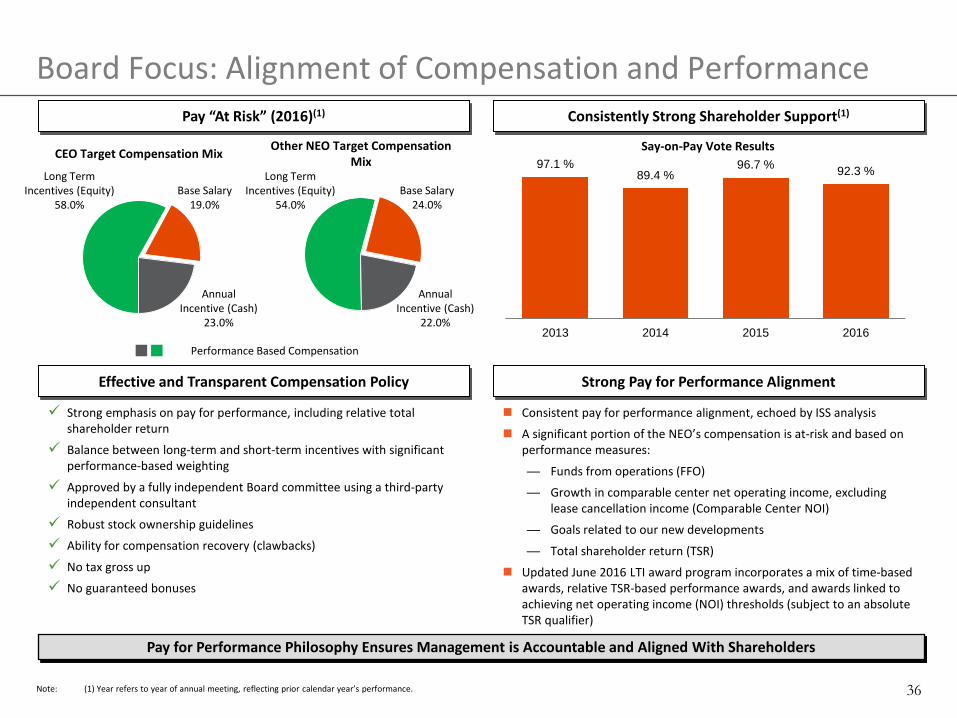
Strong emphasis on pay for performance, including relative total shareholder return
Balance between long-term and short-term incentives with significant performance-based weighting
Approved by a fully independent Board committee using a third-party independent consultant
Robust stock ownership guidelines
Ability for compensation recovery (clawbacks)
No tax gross up
No guaranteed bonuses
Board Focus: Alignment of Compensation and Performance Pay “At Risk” (2016)(1) Consistently Strong Shareholder Support(1)
Effective and Transparent Compensation Policy Strong Pay for Performance Alignment
Consistent pay for performance alignment, echoed by ISS analysis
A significant portion of the NEO’s compensation is at-risk and based on performance measures:
— Funds from operations (FFO)
— Growth in comparable center net operating income, excluding lease cancellation income (Comparable Center NOI)
— Goals related to our new developments
— Total shareholder return (TSR)
Updated June 2016 LTI award program incorporates a mix of time-based awards, relative TSR-based performance awards, and awards linked to achieving net operating income (NOI) thresholds (subject to an absolute TSR qualifier)
Pay for Performance Philosophy Ensures Management is Accountable and Aligned With Shareholders
CEO Target Compensation Mix Other NEO Target Compensation Mix
Performance Based Compensation
Say-on-Pay Vote Results
Long Term Incentives (Equity)
58.0%
Annual Incentive (Cash)
23.0%
Base Salary 19.0%
Long Term Incentives (Equity)
54.0%
Annual Incentive (Cash)
22.0%
Base Salary 24.0%
Note: (1) Year refers to year of annual meeting, reflecting prior calendar year’s performance.
97.1 %89.4 %
96.7 % 92.3 %
2013 2014 2015 2016

37
Strong and Respected Board With Right Mix of Skills and Experience
Strong Board with a balanced mix of skills, experience and in-depth Company knowledge
Experience across a wide range of industries, including real estate
Given Taubman’s focus on high-end malls, the Board has, from day one, sought directors with direct retail knowledge and experience
Majority of the Board has a brand marketing/technology background, increasingly important in an omni-channel retail environment
Global perspectives provide added expertise in the oversight of Taubman’s Asian development projects
Extensive management experience, with a number of current or former CEOs, COOs, and CFOs serving as directors
78% independent directors (7 of 9)
Fully independent key Board committees
Senior Leadership Experience 9/9
Business Entrepreneurship and
Transactional Experience
8/9
Financial and Accounting Experience
7/9
Real Estate Experience 7/9
Brand Marketing, Social Media, and
Technology Experience
7/9
Public Company Board Experience 7/9
Global Experience 9/9
Highly Qualified Directors Director Skills Evaluation Matrix
Operational [xxx] [xxx]
[xxx] [xxx] [xxx]
[xxx] [xxx] [xxx]
[xxx] [xxx] [xxx]
[xxx] [xxx] [xxx]
[xxx] [xxx] [xxx]
Growth Mindset [xxx] Emerging Markets
Relationships
Business Execution
Operational Expertise
Strategic Thinking
Transaction Execution Growth Mindset Merger
Integration
Risk Management Accounting Knowledge Capital Allocation
Retail Experience Acquisition/ Disposition
Ground Up Development
Social Media Customer Loyalty Brand Relationships
Oversight Corporate Strategy Accountability
Cultural Awareness

38
An Engaged, Experienced and Skills-Driven Board Current and Past
Affiliations Bio
Robert S. Taubman
CEO (Chair, Exec. Comm.)
Chairman of the Board (2001-present), President and Chief Executive Officer at Taubman and the Manager (1990-present), Director at Taubman (1992-present)
Director at Comerica Bank Former Chairman and Director at the Real Estate Roundtable Member and former Trustee at the Urban Land Institute Member of the Executive Board at the National Association of Real Estate Investment Trusts
William S. Taubman
COO Chief Operating Officer (2005-present) and Director at Taubman (2000-present) Executive Vice President of the Manager (1994-present) Executive Vice President at Taubman (1994-2005) Director, Executive Committee Member and former Chairman of the Board at the International Council of
Shopping Centers Chairman of New Detroit, an organization dedicated to improving race relations
Lead, Independent (Chair, Nom. & Corp. Gov.
Comm.)
Former Executive Chairman, Chief Executive Officer (2013-2015), Chairman of the Board and Chief Executive Officer (2004-2011) at J.C. Penney Company
Director at Starbucks (2003-present), Chair of the Compensation and Management Development Committee, Presiding (Lead) Independent Director
Former Chairman of the Federal Reserve Bank of Dallas Former Director at Ralph Lauren Directeur General, Group Managing Director of LVMH Möet Hennessy Louis Vuitton (1999-2000) Chairman and Chief Executive Officer of DFS Group Limited, a retailer of luxury branded merchandise (1995-
1999) Chairman and Chief Executive Officer of R.H. Macy & Co., Inc. (1992-1995)
Independent Chief Investment Officer, Partner, Managing Director and member of the Investment Committee at Dune Real Estate Partners (2007-present)
Former President of U.S. Fund Business, Chief Financial Officer, Head of Asset Management, and Head of Acquisitions at JER Partners, an affiliate of the J.E. Robert Companies (1997-2007)
Formerly worked in the Real Estate Investment Banking Group of Bankers Trust for 9 years Member and Trustee at the Urban Land Institute (2011-present) Director and Treasurer at ULI Foundation, Chair of the Investment Committee and member of the Audit
Committee (2015-present)
Source: Company filings, Company website
Myron Ullman III
Cia Buckley Marakovits
New Role- Lead Director,
Effective Dec 2016
Added to Board,
Effective Dec 2016

39
An Engaged, Experienced and Skills-Driven Board Current and Past
Affiliations Bio Independent Director and Douglas Dillon Professor of Government at Harvard’s Belfer Center for Science and International Affairs (1995-
present) Director at Joule Unlimited (Joule Biotechnologies) (2009-present) Integral to establishing the Kennedy School of Government at Harvard University Assistant Secretary of Defense under President Clinton Special advisor to the Secretary of Defense under President Reagan Former Director at CDC Nvest Funds and IXIS Asset Advisors, as well as Belco Oil and Gas, Chase Manhattan Bank, Getty Oil
Company, and USEC
Independent Founder and Chairman of Chazen Capital Partners, a private investment company (1996-present) Co-founder, Former CEO and Chairman Emeritus of Fifth & Pacific Companies Inc. (Liz Claiborne, Inc.) (1976-present) Director at Atrinsic, Inc. (New Motion, Inc.) (2005-2013) Founder of Jerome A. Chazen Institute of International Business at Columbia University Chairman Emeritus of the Board of Overseers of the Columbia Business School Director at the New York City Investment Fund
Independent (Chair, Comp. Comm.) Director at SL Green Realty Corp (2011-present)
Chairman of Turtle Pond Publications, a children’s publishing and entertainment firm Co-founder of the Tribeca Film Festival Adjunct Professor at Columbia Business School (2015) A trustee of the New York City School Construction Authority (2002-2005) Vice Chairman (1997-2000) and Director (1997-2010) at Capital Trust, Inc., a real estate investment management company Former co-head of real estate investment banking at Chemical Bank
Independent Founder, Chairman (1978-2013), Executive Chairman (2011-2013), Chief Executive Officer (1987-2011), President (2003-2008), and Director (1973-2013) at Compuware Corporation
Chairman and co-founder of MadDog Technology (2014-present) Chief Executive Officer and co-owner of the Carolina Hurricanes, owner of the Florida Everblades Director at Worthington Industries (1997-present), member of its Executive Committee and Chair of its Nominating and
Governance Committee Independent
(Chair, Audit Comm.) Lead Director (2016-present) and Director at J.C. Penney Company (2013-present) Director at Scripps Networks Interactive (2008-present) Director at Canadian Imperial Bank of Commerce (2004-present) Director at Cintas Corporation (2007-present) Vice Chairman, Finance and Real Estate (1990-2006) and Chief Financial Officer (1990-1997) at Federated Department Stores,
Inc. (now Macy’s, Inc.) Director at Pzena Investment Management, Inc. (2008-2013)
Source: Company filings, Company website
Craig Hatkoff
Ronald Tysoe
Peter Karmanos
Graham Allison
Jerome Chazen

40
Taubman’s Contested Board Members are Far More Qualified than Land & Buildings’ Nominees – The Choice is Clear
Stronger Candidates?
Senior Leadership Experience
Business Entrepreneurship and
Transactional Experience
Financial and Accounting Experience
Real Estate Experience
Brand Marketing, Social Media, and
Technology Experience
Public Company Board Experience
Global Experience
Myron Ullman III Jonathan Litt Robert S. Taubman Charles Elson
41
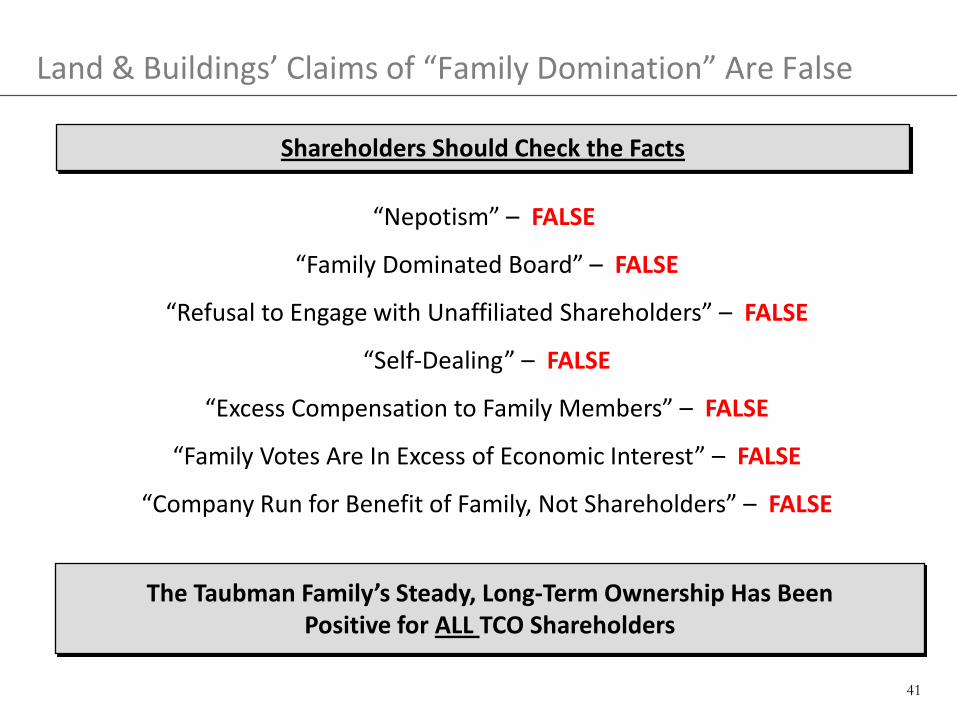
Land & Buildings’ Claims of “Family Domination” Are False
“Nepotism” – FALSE
“Family Dominated Board” – FALSE
“Refusal to Engage with Unaffiliated Shareholders” – FALSE
“Self-Dealing” – FALSE
“Excess Compensation to Family Members” – FALSE
“Family Votes Are In Excess of Economic Interest” – FALSE
“Company Run for Benefit of Family, Not Shareholders” – FALSE
Shareholders Should Check the Facts
The Taubman Family’s Steady, Long-Term Ownership Has Been Positive for ALL TCO Shareholders

42
$0
$10
$20
$30
$40
$50
$60
$70
Jan-1999 Jan-2000 Jan-2001 Jan-2002 Jan-2003 Jan-2004 Jan-2005 Jan-2006 Jan-2007
Neutral
Outperform
Sell / UnderperformShar
e Pr
ice(4
)Jonathan Litt Has Consistently Failed to Understand Taubman’s Story
Average 12 Month Stock Price Performance Following the Date of Litt’s Report (1)
Number of Ratings
Litt’s Target Stock
Returns(2)
Taubman Actual Stock
Returns(3) “The Litt
Difference”
Outperform 6 15.1% 27.0% (11.9)%
Neutral 14 (0.1)% 19.8% (19.9)%
Sell / Underperform 28 (13.7)% 33.3% (47.5)%
Note: (1) Based on Litt’s recommendations while he was at Smith Barney Citigroup between 2000 and 2006. (2) Excludes dividends, based on change in closing stock price the day of Smith Barney Citigroup research report and the report’s stated target share price. (3) Excludes dividends, based on change in closing stock price the day of Smith Barney Citigroup research report and the closing stock price 365 calendar days later. (4) Share price in chart reflects historical share price adjusted for dividends (including special dividends). Share price performance percent change values in table based on actual historical share price, not adjusted
for dividends, in order to align with historical Litt research reports. Source: Smith Barney Citigroup research reports, Thomson Reuters and Cap IQ
Case Study: Dolphin Mall (opened in 2001) Litt’s Prognosis
“[Dolphin Mall] has been an underperformer, in our opinion, since day 1…” Jonathan Litt, February 13, 2002
“Dolphin Mall should have been sold.” Jonathan Litt, August 1, 2002
“Dolphin…should probably never have been built.” Jonathan Litt, November 3, 2003
Actual Outcome Dolphin Mall has become the highest NOI producing asset in TCO history
Throughout his tenure as an equity research analyst, Jonathan Litt consistently under-estimated Taubman’s performance, demonstrating his fundamental lack of understanding of Taubman’s business model

43
(100)%
(50)%
0%
50%
100%
150%
200%
250%
300%
Sep-1996 Oct-1998 Nov-2000 Dec-2002
Sunbeam Corp. Peers S&P 500
22.4 %28.9 %
(99.9)%
(1)
(100)%
0%
100%
200%
300%
400%
500%
Sep-2004 Nov-2008 Jan-2013 Apr-2017Healthsouth Corp Peers S&P 500
333.1%
178.6%
92.3%
(1)
Served on the board for ~2 years, ending when the company was acquired by Maxxim Medical for less than what the company was worth when Elson joined the Board
Charles Elson Has Failed to Create Shareholder Value as a Public Company Director…
Healthsouth (2004-Present)
Note: (1) Healthsouth peers include: Kindred Healthcare (KND), Select Medical Holdings (SEM), LifePoint Health (LPNT), HCA Holdings (HCA), Brookdale Senior Living (BKD), Genesis Healthcare (GEN), Tenet Healthcare (THC), Acadia Healthcare (ACHC), Quorum Health (QHC) and Universal Health (UHS); Bob Evans peers include: Cracker Barrel (CBRL), Cheesecake Factory (CAKE), BJ’s Restaurants (BJRI), Red Robin (RRGB), Texas Roadhouse (TXRH), Dunkin’ Brands (DNKN), Ruby Tuesday (RT), Papa John’s (PZZA) and DineEquity (DIN); Sunbeam Corp peers include Newell (NWL), Gillette Company (G), Brunswick Corporation (BC), and Salton, Inc. (SFP); Circon Corp peers include Boston Scientific Corp. (BSX), Conmed Corp. (CNMD.O), C.R. Bard, Inc. (BCR), STERIS Corp (STE), and Stryker Corp. (SYK). Nuevo Energy peers include Chesapeake Energy (CHK), Apache Corporation (APA), Cabot Oil & Gas (COG), and Anadarko Petroleum Corp (APC). Autozone peers include: O’Reilly Automotive (ORLY), Advance Auto Parts (AAP), Lithia Motors (LAD), Group 1 Automotive (GPI), Sonic Automotive (SAH), Asbury Automotive (ABG), CarMax (KMX), Staples (SPLS), AutoNation (AN) and Best Buy (BBY).
Source: CapIQ, Bloomberg, Company filings
Has served on the Board since Sep-2004, during which timeframe the company has underperformed its peers by ~240% and the S&P 500 by ~85%
Sunbeam Corp (1996-2002)
Circon Corp (1997-1999) Nuevo Energy (1998-2004)
Perpetual underperformance under Elson’s watch which led to Nuevo being acquired by Plans Exploration & Production Company for less than what the company was worth when Elson joined the board
Bob Evans (2014-Present)
After years of underperformance, BOBE only recently caught up with peers after agreeing to sell their restaurant business
Company filed for bankruptcy during Elson’s Board tenure
Autozone (2000-2008)
The only instance in Elson’s career serving on public company Boards that the Company has outperformed both peers and the market
(30)%
(20)%
(10)%
0%
10%
20%
30%
40%
50%
60%
Aug-2014 Jul-2015 Jun-2016 Apr-2017Bob Evans Peers S&P 500
48.6%46.5%
27.0%
(1)
(60)%
(40)%
(20)%
0%
20%
40%
Oct-1997 Mar-1998 Aug-1998 Dec-1998Circon Corp Peers S&P 500
33.6%
11.1%
(9.5)%
(1)
(50)%
50%
150%
250%
350%
450%
550%
Aug-2000 May-2003 Feb-2006 Dec-2008Autozone Inc Peers S&P 500
483.8%
41.6%(29.1)%
(1)
(110)%
(80)%
(50)%
(20)%
10%
40%
70%
100%
130%
Apr-1998 Apr-2000 Apr-2002 May-2004Nuevo Energy Peers S&P 500
93.6%
7.9%
(1.8)%
(1)
44
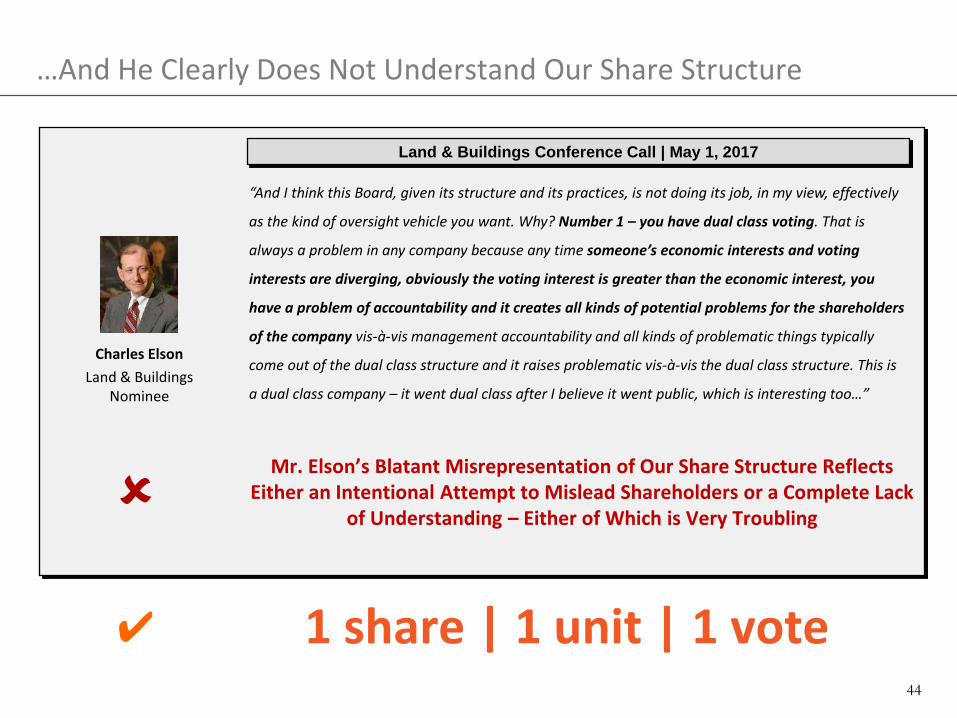
…And He Clearly Does Not Understand Our Share Structure
1 share | 1 unit | 1 vote ✔
Charles Elson Land & Buildings
Nominee
“And I think this Board, given its structure and its practices, is not doing its job, in my view, effectively
as the kind of oversight vehicle you want. Why? Number 1 – you have dual class voting. That is
always a problem in any company because any time someone’s economic interests and voting
interests are diverging, obviously the voting interest is greater than the economic interest, you
have a problem of accountability and it creates all kinds of potential problems for the shareholders
of the company vis-à-vis management accountability and all kinds of problematic things typically
come out of the dual class structure and it raises problematic vis-à-vis the dual class structure. This is
a dual class company – it went dual class after I believe it went public, which is interesting too…”
Land & Buildings Conference Call | May 1, 2017
Mr. Elson’s Blatant Misrepresentation of Our Share Structure Reflects Either an Intentional Attempt to Mislead Shareholders or a Complete Lack
of Understanding – Either of Which is Very Troubling

45
Taubman’s Track Record of Superior Value Creation
The Taubman family is aligned with shareholders through the one share, one unit, one vote structure
We have a strong and experienced Board of Directors with a diverse mix of skills and expertise
We have a tested development track record through long cycles, and have created nearly $5 billion of net value on our developments
We have achieved an 18% levered IRR on all development spending since 1992
Under the current management team, we have delivered compounded annualized total shareholder return of 14.9%(1) over the last 20 years
Our industry leading portfolio quality is a testament to our long-term strategy of creating best-in-class assets through development, redevelopment and active portfolio management
Our Leadership Team Has Delivered
Superior Results
We Remain Committed to Driving Long-Term Growth
and Value Creation
We are Aligned With Our
Shareholders
Note: (1) Per KeyBanc Capital Markets: The Leaderboard as of 12/31/2016.

46
Taubman Has and Expects to Continue to Deliver Superior Results Vote the Taubman White Card FOR
Performance in the top 10 percentile of REITs over the last 20 years
Long-standing focus on best-in-class, dynamic retail destination centers
Positioned to realize significant value from recent development projects as they stabilize
Strong and experienced Board, including recent additions and creation of Lead Director role
Taubman family is fully aligned with shareholders and has long maintained a ~30% interest in the Company
>1,500% TSR Over Last 20 Years
(14.9% Annualized)
>$3bn Equity Dividends and
Distributions Paid
1 1 Share, 1 Unit,
1 Vote
70% Higher Sales per Sqft
Than ICSC Index
✔
✔
✔
✔
✔ ~$5bn
of Value Created From Development
Source: CapIQ, Company filings, KeyBanc Capital Markets: The Leaderboard as of 31-Dec-2016

47

48
Appendix

49
Taubman Realty Group (TRG) Current Ownership and Voting Structure
Publicly Traded Entity
The Taubman Realty Group Limited Partnership (TRG) Operating Partnership
Taubman Centers, Inc. Public REIT (NYSE : TCO)
Unit-Holders (Includes Taubman family)
Economic Ownership(1): Voting Interest(2):
29.3% 29.3%
70.7% 70.7%
21 U.S. Operating Centers 3 Asian Operating Centers The Taubman Company LLC (Property Manager & Leasing Agent)
What are the Series B Preferred Shares?
The Series B preferred shares are a class of voting shares that give the Taubman Family and Other Unit-Holders (outside the TCO entity) the ability to vote commensurate with their economic interest in the partnership and ensure “one share, one unit, one vote”
When and why were the Series B Preferred Shares Created?
They were created in 1998 as a result of a restructuring of the operating partnership to allow the operating partnership’s unit holders voting interests commensurate with their economic interest, in exchange for the governance rights they were forfeiting in the operating partnership as part of the 1998 restructuring
(1) TCO’s sole asset is a ~71% interest in the Operating Partnership. The remaining ~29% interest in the Operating Partnership is held by members of the Taubman family and other unit holders. (2) Members of the Taubman family and other unit holders of the Operating Partnership have voting rights commensurate with their economic interest in the Operating Partnership through the ownership of TCO Series B Preferred Shares
More Information? Please see this link to our “FAQs” section of our investor website for greater detail: Investor FAQs
As of Dec. 31, 2016

50
Taubman Realty Group (TRG – Operating Partnership) Historical Ownership and Voting Structure
Econ
omic
Inte
rest
Vo
ting
Inte
rest
The 1998 Restructuring In the company’s 1998 restructuring, GM Pension Trusts (GMPT) exchanged its 37.2% partnership interest in the operating partnership for ten mall properties Before this restructuring, the operating partnership was 39.4% owned by TCO, 37.2% owned by GMPT, and 23.4% owned by the other unit holders (including members of the Taubman
family) After the exchange by GMPT, the economic interests in the operating partnership of all the remaining investors increased pro rata, as in any share repurchase. Consequently, TCO’s
interest in the operating partnership increased from 39.4% to 62.7%, and the unit holders' interest in the operating partnership increased from 23.4% to 37.3% Also as part of the 1998 restructuring, the company’s Partnership Committee – which previously controlled the operating partnership (TRG) – was dissolved, and governance moved
from the Partnership Committee to the board of directors of TCO The five independent Partnership Committee members representing TCO and the four Partnership Committee members representing the operating partnership’s unit holders became
the nine members of TCO’s board of directors
Pre-1998 Restructuring Post-1998 Restructuring(1) Current Structure(2)
Note: (1) Reflects GM Pension Trust exchange and pro rata increase in ownership by remaining investors. (2) As of April 3, 2017, the combined beneficial ownership of the members of the Taubman family was 96.7% and 2.9%, respectively, of the Series B Preferred Stock and common stock outstanding, resulting in a total voting
interest of 30.2%. Taubman Family & Other Unit Holders percentage decreased from 37.3% after the 1998 Restructuring to 29.3% as of Dec. 31, 2016 due to disposition of Units by non-Taubman Family Unit Holders. Source: Per KeyBanc Capital Markets: The Leaderboard as of 12/31/2016
TCO Public Shareholders
39.4%
GM Pension Trust37.2%
Taubman Family & Other
Unit Holders23.4%
TCO Public Shareholders
62.7%
Taubman Family & Other
Unit Holders37.3%
TCO Public Shareholders
70.7%
Taubman Family & Other
Unit Holders29.3%
TaubmanFamily & Other
Unit Holders30.8%
TCO Public Shareholders
38.4%
GM PensionTrust30.8%
TCO Public Shareholders
62.7%
Taubman Family & Other
Unit Holders37.3%
TCO Public Shareholders
70.7%
Taubman Family & Other
Unit Holders29.3%
(as of Dec. 31, 2016) (Reflects GMPT exchange)

51
Reconciliations to Non-GAAP Measures – Taubman Centers
CORE NOI GROWTH: RECONCILIATION OF NET INCOME TO NET OPERATING INCOME 1
(in millions of dollars; amounts may not add due to rounding)
Year ended 2005 2006 2007 2008 2009 2010 2011 2012 2013 2014 2015 201657.4 95.1 116.2 (8.1) (79.2) 102.3 287.4 157.8 189.4 1,278.1 192.6 188.2
152.4 150.2 143.7 158.1 157.8 165.5 155.0 162.5 175.6 146.0 137.0 185.3 153.7 146.9 150.7 162.7 160.9 165.3 163.8 166.8 162.3 135.1 103.5 133.4
(0.0) (5.8) (5.0) (7.4) (3.1) (9.8) (14.4) (11.9) (10.3) (34.2) (11.2) (8.1)
106.7 104.6 116.6 122.2 109.5 123.6 121.2 125.5 113.5 149.0 137.9 164.5
- - - - - - - - - - 11.8 -
470.3 491.1 522.2 427.5 346.0 547.0 713.0 600.7 630.4 1,674.0 571.5 663.3
29.2 30.4 33.1 162.9 239.3 41.2 (121.8) 59.9 55.2 (1,013.1) 50.4 40.4
499.4 521.5 555.2 590.4 585.3 588.2 591.2 660.5 685.6 660.9 621.9 703.7
(21.5) (24.9) (16.5) (15.8) (2.6) (8.4) (4.1) (29.7) (10.2) (72.3) (25.1) (90.2)
478.0 496.6 538.7 574.5 582.7 579.8 587.1 630.8 675.4 588.6 596.8 613.5
(9.5) (15.9) (15.6) (13.5) (24.2) (23.5) (3.2) (4.9) (5.8) (12.6) (8.5) (6.2)
468.5 480.7 523.1 561.0 558.5 556.3 583.8 625.9 669.7 576.1 588.3 607.3
6.3% 3.8% 5.3% 4.9% -2.7% 0.5% 4.9% 7.2% 3.4% 2.7% 3.1% 3.9%
1 The Company uses Net Operating Income (NOI) as an alternative measure to evaluate the operating performance of centers, both on individual and stabilized portfolio bases. TheCompany defines NOI as property-level operating revenues (includes rental income excluding straightline adjustments of minimum rent) less maintenance, taxes, utilities, promotion,ground rent (including straightline adjustments), and other property operating expenses. Since NOI excludes general and administrative expenses, pre-development charges, interestincome and expense, depreciation and amortization, impairment charges, restructuring charges, and gains from land and property dispositions, it provides a performance measure that,when compared period over period, reflects the revenues and expenses most directly associated with owning and operating rental properties, as well as the impact on their operationsfrom trends in tenant sales, occupancy and rental rates, and operating costs. The Company also uses NOI excluding lease cancellation income as an alternative measure because thisincome may vary significantly from period to period, which can affect comparability and trend analysis. The Company generally provides separate projections for expected comparablecenter NOI growth and lease cancellation income. In addition to the reasons noted above, we believe the disclosure of the adjusted items is similarly useful to investors and others tounderstand management's view on comparability of such measures between periods. Comparable centers are generally defined as centers that were owned and open for the entirecurrent and preceding period presented.
This presentation includes non-GAAP financial measures as defined by S.E.C. Regulation G. Definitions, discussion and reconciliations of non-GAAP financial measures to thecomparable GAAP financial measure are disclosed in the Company's most recent Annual Report on Form 10-K and the Company's Annual Report, included on the Company's website.
Net Operating Income at 100% - excluding lease cancellation income of comparable centers
Net incomeDepreciation and amortizationInterest expense and income tax expenseNoncontrolling share of income of consolidated joint venturesEBITDA attributable to outside partnersBeneficial interest in Unconsolidated Joint Venture partner impairment chargeEBITDA at 100%
Net Operating Income - Excluding Lease Cancellation Income- growth %
Items excluded from shopping center Net Operating Income Net Operating Income - all centers at 100% Less - Net Operating Income of non-comparable centers Net Operating Income at 100% of comparable centersLess - lease cancellation income

52
Reconciliations to Non-GAAP Measures – TCO and Peers
Year ended 2016Net income $ 77Merger & restructuring costs 30 Depreciation and amortization 281 Impairment loss 22 Interest expense 136 Gain on extinguishment of debt, net (35) Income and other taxes 2 (Income) / loss from unconsolidated entities, net 2 (Gain) / loss on disposition of interests in properties, net 2
Consolidated EBITDA $ 518G&A 37 Consolidated NOI $ 555Consolidated Revenues $ 843
WPG
Year ended 2016Net income $ 196Depreciation and amortization 293Loss on impairment 117Interest and other income (2)Interest expense 216Gain on investments (8)Equity in earnings of unconsolidated affiliates (118)Income tax benefit (provision) (2)Gain on sales of real estate assets (30)Consolidated EBITDA $ 663Mgmt. fees and non property-level revenues (15)G&A 63 Consolidated NOI $ 712Consolidated Revenues $ 1,028
CBL
Year ended 2016Net Income $(13)Provision for doubtful accounts (5)Depreciation and amortization 127Interest expense 71Impairment of assets 63Equity in income of partnerships (18)Gains on sales of interests in real estate, net (23)Gains on sales of non-operating real estate (0)Consolidated EBITDA $ 200G&A Expenses, Employee Separation / Acquisition and Other Expenses 38
Consolidated NOI $ 238Consolidated Revenues $ 395
PEI
Year ended 2016Net income $ 555Equity income of Unconsolidated Joint Ventures (57) Income tax expense 1 Depreciation and amortization 348 Interest expense 164 Gain on sales of controlling interests/disposal of assets and interests in unconsolidated entities, net (415)
Co-Venture Expense 13 Gain on Extinguishment of Debt (2) Consolidated EBITDA $ 607General & Administrative Expense 28 Management, leasing, and development services, net 59
Consolidated NOI $ 694Consolidated Revenues $ 1,041
MAC
Year ended 2016Net income $ 2,135Equity income of Unconsolidated Joint Ventures (353)Income tax expense 30Depreciation and amortization 1,253Interest expense 858Gain on sales of controlling interests/disposal of assets and interests in unconsolidated entities, net (85)
Loss on extinguishment of debt 137Consolidated EBITDA $ 3,974G&A and Home Office Expense 223Management, leasing, and development services, net (144)
Nonoperating income, net -Consolidated NOI $ 4,053Consolidated Revenues $ 5,435
SPG
Year ended 2016Net income $ 188Equity income of Unconsolidated Joint Ventures (70) Income tax expense 2 Depreciation and amortization 138 Interest expense 86 Consolidated EBITDA $ 345General and administrative expense 48 Costs associated with shareowner activism 3 Management, leasing, and development services, net (24)
Nonoperating income, net (23) Consolidated NOI $ 349Consolidated Revenues $ 613
TCOYear ended 2016Net Income $ 1,308Provision for doubtful accounts 8Provision for loan loss 30Provision for impairment 73Depreciation and amortization 661Interest and dividend income (60)Interest expense 571Loss (gain) on foreign currency (14)Loss (gain) from changes in control of investment properties and other (723)
Provision for (benefit from) income taxes 1Equity in income of Unconsolidated RE Affiliates (232)Unconsolidated Real Estate Affiliates - gain on investment (52)
Consolidated EBITDA $ 1,572General & Administrative Expense 56
Management, leasing, and development services, net 43
Consolidated NOI $ 1,670Consolidated Revenues $ 2,346
GGP
Source: Public Company filings Note: Consolidated EBITDA is used as an alternative measure to evaluate operating performance of peer consolidated businesses on a basis unaffected by capital structure, which is customary in the industry. Consolidated EBITDA is defined as earnings before interest, income taxes, and depreciation and amortization of the consolidated businesses. Consolidated NOI is used as an alternative measure to evaluate operating performance of peer consolidated centers on a basis unaffected by capital structure, which is customary in the industry. Consolidated NOI is defined here as property-level operating revenues less maintenance, taxes, utilities, promotion, and other property operating expenses. Since Consolidated NOI excludes general and administrative expenses, nonoperating income (expense), interest expense, depreciation and amortization, impairment charges, and restructuring charges, it provides a performance measure that, when compared period over period, reflects the revenues and expenses most directly associated with owning and operating rental properties, as well as the impact on their operations from trends in tenant sales, occupancy and rental rates, and operating costs.

53
Forward-Looking Language and Non-GAAP Measures
For ease of use, references in this presentation to “Taubman Centers,” “company,” “Taubman” or an operating platform mean Taubman Centers, Inc. and/or one or more of a number of separate affiliated entities. Business is actually conducted by an affiliated entity rather than Taubman Centers, Inc. itself or the named operating platform. This presentation may contain forward-looking statements within the meaning of Section 27A of the Securities Act of 1933, as amended, and Section 21E of the Securities Exchange Act of 1934, as amended. These statements reflect management’s current views with respect to future events and financial performance. Forward-looking statements can be identified by words such as “will”, “may”, “could”, “expect”, “anticipate”, “believes”, “intends”, “should”, “plans”, “estimates”, approximate”, “guidance”, and similar expressions in this press release that predict or indicate future events and trends that do not report historical matters. The forward-looking statements included in this release are made as of the date hereof. Except as required by law, we assume no obligation to update these forward-looking statements, even if new information becomes available in the future. Actual results may differ materially from those expected because of various risks, uncertainties and other factors. Such factors include, but are not limited to: changes in market rental rates; unscheduled closings or bankruptcies of tenants; relationships with anchor tenants; trends in the retail industry; the liquidity of real estate investments; the company’s ability to comply with debt covenants; the availability and terms of financings; changes in market rates of interest and foreign exchange rates for foreign currencies; changes in value of investments in foreign entities; the ability to hedge interest rate and currency risk; risks related to acquiring, developing, expanding, leasing and managing properties; changes in value of investments in foreign entities; risks related to joint venture properties; insurance costs and coverage; security breaches that could impact the company’s information technology, infrastructure or personal data; the loss of key management personnel; terrorist activities; maintaining the company’s status as a real estate investment trust; changes in the laws of states, localities, and foreign jurisdictions that may increase taxes on the company’s operations; and changes in global, national, regional and/or local economic and geopolitical climates. You should review the company's filings with the Securities and Exchange Commission, including “Risk Factors”, in its most recent Annual Report on Form 10-K and subsequent quarterly reports, for a discussion of such risks and uncertainties This presentation may also include disclosures regarding, but not limited to, estimated future earnings assumptions and estimated project costs and stabilized returns for centers under development which are subject to adjustment as a result of certain factors that may not be under the direct control of the company. Refer to the company’s filings with the Securities and Exchange Commission on Form 10-K and Form 10-Q for other risk factors. This presentation includes non-GAAP financial measures as defined by S.E.C Regulation G. Definitions, discussion and reconciliations of non-GAAP financial measures to the comparable GAAP financial measure are disclosed in the Company’s most recent Annual Report on Form 10-K and the Company’s Annual Report, included on the Company’s website. Non-GAAP measures referenced in this presentation may include estimates of future EBITDA, NOI and/or FFO performance of our investment properties. Such forward-looking non-GAAP measures may differ significantly from the corresponding GAAP measure, net income, due to deprecation and amortization, tax expense, and/or interest expense, some or all of which management has not quantified for the future periods.
Except as specified herein, the information contained in the Company’s website is not part of this presentation.