texas transportation by the numbers - trip key transportation numbers in texas $25.1 billion driving...
TRANSCRIPT

TEXAS TRANSPORTATION BY THE NUMBERS:
Meeting the State’s Need for Safe and Efficient Mobility
JULY 2014
202-466-6706
tripnet.org
Founded in 1971, TRIP ® of Washington, DC, is a nonprofit organization that researches, evaluates and distributes economic and technical data on surface transportation issues. TRIP is sponsored by insurance companies, equipment manufacturers, distributors and suppliers; businesses involved in highway and transit engineering and construction; labor unions; and organizations concerned with efficient and safe surface transportation.
1
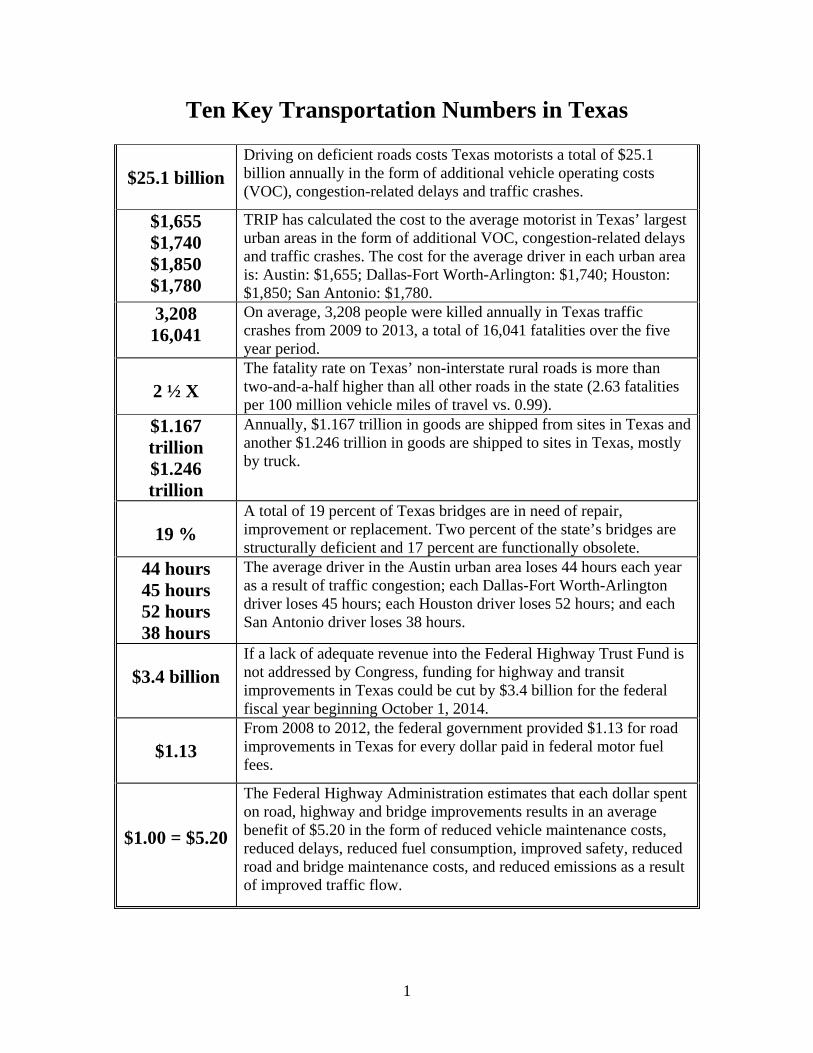
Ten Key Transportation Numbers in Texas
$25.1 billion
Driving on deficient roads costs Texas motorists a total of $25.1 billion annually in the form of additional vehicle operating costs (VOC), congestion-related delays and traffic crashes.
$1,655 $1,740 $1,850 $1,780
TRIP has calculated the cost to the average motorist in Texas’ largest urban areas in the form of additional VOC, congestion-related delays and traffic crashes. The cost for the average driver in each urban area is: Austin: $1,655; Dallas-Fort Worth-Arlington: $1,740; Houston: $1,850; San Antonio: $1,780.
3,208 16,041
On average, 3,208 people were killed annually in Texas traffic crashes from 2009 to 2013, a total of 16,041 fatalities over the five year period.
2 ½ X
The fatality rate on Texas’ non-interstate rural roads is more than two-and-a-half higher than all other roads in the state (2.63 fatalities per 100 million vehicle miles of travel vs. 0.99).
$1.167 trillion $1.246 trillion
Annually, $1.167 trillion in goods are shipped from sites in Texas and another $1.246 trillion in goods are shipped to sites in Texas, mostly by truck.
19 %
A total of 19 percent of Texas bridges are in need of repair, improvement or replacement. Two percent of the state’s bridges are structurally deficient and 17 percent are functionally obsolete.
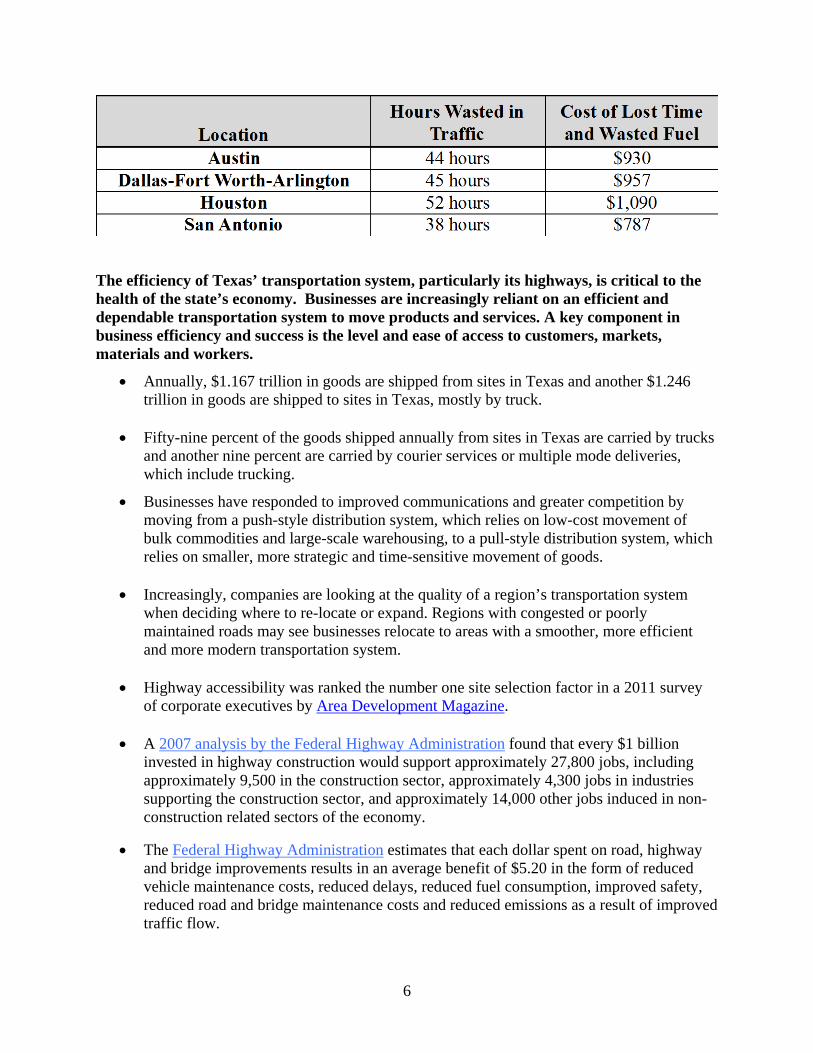
44 hours 45 hours 52 hours 38 hours
The average driver in the Austin urban area loses 44 hours each year as a result of traffic congestion; each Dallas-Fort Worth-Arlington driver loses 45 hours; each Houston driver loses 52 hours; and each San Antonio driver loses 38 hours.
$3.4 billion
If a lack of adequate revenue into the Federal Highway Trust Fund is not addressed by Congress, funding for highway and transit improvements in Texas could be cut by $3.4 billion for the federal fiscal year beginning October 1, 2014.
$1.13
From 2008 to 2012, the federal government provided $1.13 for road improvements in Texas for every dollar paid in federal motor fuel fees.
$1.00 = $5.20
The Federal Highway Administration estimates that each dollar spent on road, highway and bridge improvements results in an average benefit of $5.20 in the form of reduced vehicle maintenance costs, reduced delays, reduced fuel consumption, improved safety, reduced road and bridge maintenance costs, and reduced emissions as a result of improved traffic flow.
2
Executive Summary Texas’ extensive system of roads, highways and bridges provides the state’s residents, visitors and businesses with a high level of mobility. This transportation system forms the backbone that supports the state’s economy. Texas’ surface transportation system enables the state’s residents and visitors to travel to work and school, visit family and friends, and frequent tourist and recreation attractions while providing its businesses with reliable access to customers, materials, suppliers and employees. As Texas looks to retain its businesses, maintain its level of economic competitiveness and achieve further economic growth, the state will need to maintain and modernize its roads, highways and bridges by improving the physical condition of its transportation network and enhancing the system’s ability to provide efficient and reliable mobility for motorists and businesses. Making needed improvements to Texas’ roads, highways and bridges could also provide a significant boost to the state’s economy by creating jobs in the short term and stimulating long term economic growth as a result of enhanced mobility and access.
With a current unemployment rate of 5.1 percent and with the state’s population continuing to grow, Texas must improve its system of roads, highways and bridges to foster economic growth and keep businesses in the state. In addition to economic growth, transportation improvements are needed to ensure safe, reliable mobility and quality of life for all Texans. Meeting Texas’ need to modernize and maintain its system of roads, highways and bridges will require a significant boost in local, state and federal funding.
Signed into law in July 2012, MAP-21(Moving Ahead for Progress in the 21st Century
Act), has improved several procedures that in the past had delayed projects, MAP-21 does not address long-term funding challenges facing the federal surface transportation program.
The impact of inadequate federal surface transportation revenues could be felt as early as
August, when the balance in the Highway Account of the federal Highway Trust Fund is expected to drop below $1 billion, which will trigger delays in the federal reimbursement to states for road, highway and bridge projects. States are expected to respond to this delay in federal reimbursement for road, highway and bridge repairs and improvements by delaying or postponing numerous projects.
As a further result, nationwide federal funding for highways will be cut by almost 100
percent from the current investment level for the fiscal year starting on October 1, 2014 (FY 2015) unless Congress provides additional transportation revenues. This is due to a cash shortfall in the Highway Trust Fund as projected by the Congressional Budget Office.
The level of funding and the provisions of the federal surface transportation program
have a significant impact on highway and bridge conditions, roadway safety, transit service, quality of life and economic development opportunities in Texas.

3
An inadequate transportation system costs Texas residents a total of $25.1 billion every year in the form of additional vehicle operating costs (VOC), congestion-related delays and traffic crashes.
• TRIP estimates that Texas roadways that lack some desirable safety features, have inadequate capacity to meet travel demands or have poor pavement conditions cost the state’s residents approximately $25.1 billion annually in the form of additional VOC (including accelerated vehicle depreciation, additional repair costs, and increased fuel consumption and tire wear), the cost of lost time and wasted fuel due to traffic congestion, and the financial cost of traffic crashes.
• TRIP has calculated the average cost to drivers in the state’s largest urban areas as a result of driving on roads that are deteriorated, congested and lack some desirable safety features. The chart below details the costs to drivers in the Austin, Dallas-Fort Worth-Arlington, Houston and San Antonio areas.
Population and economic growth in Texas have resulted in increased demands on the state’s major roads and highways, leading to increased wear and tear on the transportation system.
• Texas’ population reached approximately 26.1 million in 2012, a 53 percent increase since 1990. Texas had 15,252,192 licensed drivers in 2012.
• Vehicle miles traveled (VMT) in Texas increased by 47 percent from 1990 to 2012 – jumping from 162.2 billion VMT in 1990 to 237.8 billion VMT in 2012.
• By 2030, vehicle travel in Texas is projected to increase by another 25 percent.
• From 1990 to 2012, Texas’ gross domestic product, a measure of the state’s economic output, increased by 107 percent, when adjusted for inflation.
A lack of adequate state and local funding has resulted in sixteen percent of major locally and state-maintained urban roads and highways in Texas having pavement surfaces in poor condition, providing a rough ride and costing motorist in the form of additional vehicle operating costs.
• Sixteen percent of Texas’ major urban roads and highways have pavements in poor condition. An additional 51 percent of the state’s major urban roads are rated in mediocre or fair condition and the remaining 33 percent are rated in in good condition.
4
• Roads rated in poor condition may show signs of deterioration, including rutting, cracks
and potholes. In some cases, poor roads can be resurfaced, but often are too deteriorated and must be reconstructed.
• Driving on rough roads costs all Texas motorists a total of $5.7 billion annually in extra
vehicle operating costs. Costs include accelerated vehicle depreciation, additional repair costs, and increased fuel consumption and tire wear.
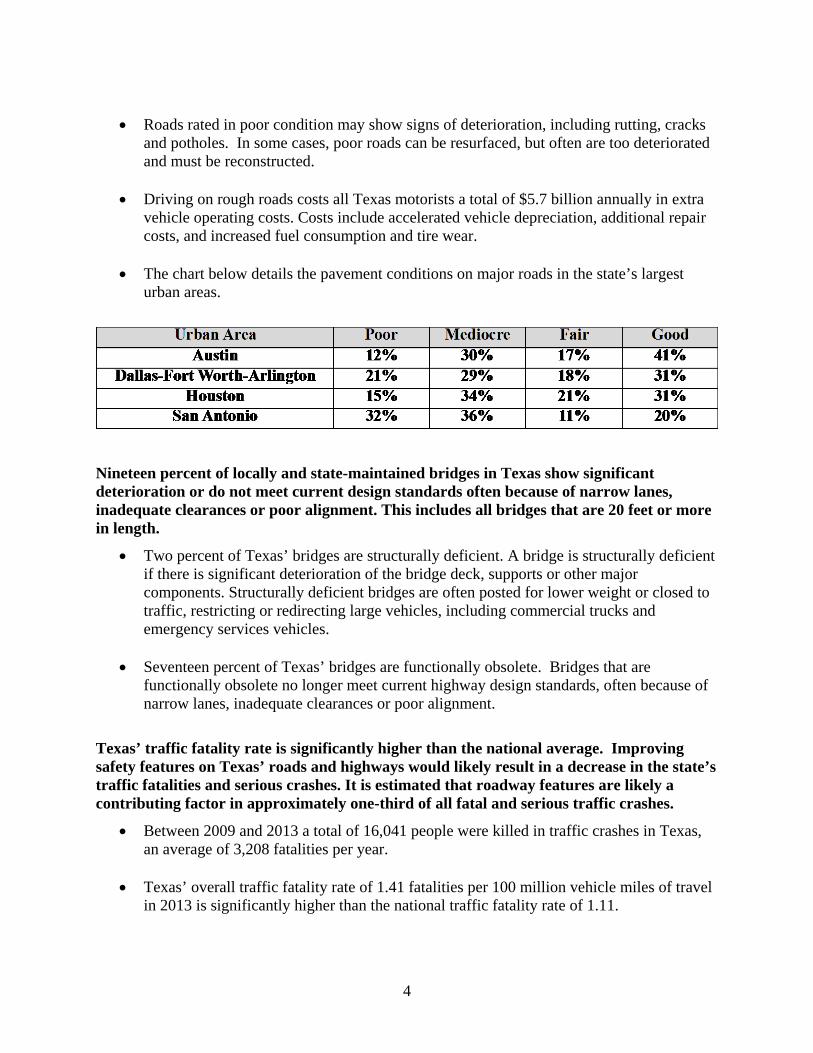
• The chart below details the pavement conditions on major roads in the state’s largest
urban areas.
Nineteen percent of locally and state-maintained bridges in Texas show significant deterioration or do not meet current design standards often because of narrow lanes, inadequate clearances or poor alignment. This includes all bridges that are 20 feet or more in length.
• Two percent of Texas’ bridges are structurally deficient. A bridge is structurally deficient if there is significant deterioration of the bridge deck, supports or other major components. Structurally deficient bridges are often posted for lower weight or closed to traffic, restricting or redirecting large vehicles, including commercial trucks and emergency services vehicles.
• Seventeen percent of Texas’ bridges are functionally obsolete. Bridges that are
functionally obsolete no longer meet current highway design standards, often because of narrow lanes, inadequate clearances or poor alignment.
Texas’ traffic fatality rate is significantly higher than the national average. Improving safety features on Texas’ roads and highways would likely result in a decrease in the state’s traffic fatalities and serious crashes. It is estimated that roadway features are likely a contributing factor in approximately one-third of all fatal and serious traffic crashes.
• Between 2009 and 2013 a total of 16,041 people were killed in traffic crashes in Texas, an average of 3,208 fatalities per year.
• Texas’ overall traffic fatality rate of 1.41 fatalities per 100 million vehicle miles of travel
in 2013 is significantly higher than the national traffic fatality rate of 1.11.
5
• The fatality rate on Texas’ rural non-Interstate roads was 2.63 fatalities per 100 vehicle miles of travel in 2013, more than two-and-a-half times greater than the 0.99 fatality rate on all other roads and highways in the state.
• Roadway features that impact safety include the number of lanes, lane widths, lighting,
lane markings, rumble strips, shoulders, guard rails, other shielding devices, median barriers and intersection design. The cost of serious crashes includes lost productivity, lost earnings, medical costs and emergency services.
• Several factors are associated with vehicle crashes that result in fatalities, including driver behavior, vehicle characteristics and roadway features. TRIP estimates that roadway features are likely a contributing factor in approximately one-third of fatal traffic crashes.
• Where appropriate, highway improvements can reduce traffic fatalities and crashes while improving traffic flow to help relieve congestion. Such improvements include removing or shielding obstacles; adding or improving medians; improved lighting; adding rumble strips, wider lanes, wider and paved shoulders; upgrading roads from two lanes to four lanes; and better road markings and traffic signals.
• Investments in rural traffic safety have been found to result in significant reductions in serious traffic crashes. A 2012 report by the Texas Transportation Institute (TTI) found that improvements completed recently by the Texas Department of Transportation that widened lanes, improved shoulders and made other safety improvements on 1,159 miles of rural state roadways resulted in 133 fewer fatalities on these roads in the first three years after the improvements were completed (as compared to the three years prior). TTI estimates that the improvements on these roads are likely to save 880 lives over the next 20 years.
Increasing levels of traffic congestion cause significant delays in Texas, particularly in its larger urban areas, choking commuting and commerce. Traffic congestion robs commuters of time and money and imposes increased costs on businesses, shippers and manufacturers, which are often passed along to the consumer.
• Increasing levels of congestion add significant costs to consumers, transportation
companies, manufacturers, distributors and wholesalers and can reduce the attractiveness of a location to a company to consider expansion or even to locate a new facility. Congestion costs can also increase overall operating costs for trucking and shipping companies, leading to revenue losses, lower pay for drivers and employees, and higher consumer costs.
• The chart below details the annual number of hours wasted in traffic by the average driver in each urban area, as well as the annual congestion cost to the average motorist in the form of lost time and wasted fuel:
6
The efficiency of Texas’ transportation system, particularly its highways, is critical to the health of the state’s economy. Businesses are increasingly reliant on an efficient and dependable transportation system to move products and services. A key component in business efficiency and success is the level and ease of access to customers, markets, materials and workers.
• Annually, $1.167 trillion in goods are shipped from sites in Texas and another $1.246 trillion in goods are shipped to sites in Texas, mostly by truck.
• Fifty-nine percent of the goods shipped annually from sites in Texas are carried by trucks and another nine percent are carried by courier services or multiple mode deliveries, which include trucking.
• Businesses have responded to improved communications and greater competition by moving from a push-style distribution system, which relies on low-cost movement of bulk commodities and large-scale warehousing, to a pull-style distribution system, which relies on smaller, more strategic and time-sensitive movement of goods.
• Increasingly, companies are looking at the quality of a region’s transportation system when deciding where to re-locate or expand. Regions with congested or poorly maintained roads may see businesses relocate to areas with a smoother, more efficient and more modern transportation system.
• Highway accessibility was ranked the number one site selection factor in a 2011 survey of corporate executives by Area Development Magazine.
• A 2007 analysis by the Federal Highway Administration found that every $1 billion
invested in highway construction would support approximately 27,800 jobs, including approximately 9,500 in the construction sector, approximately 4,300 jobs in industries supporting the construction sector, and approximately 14,000 other jobs induced in non-construction related sectors of the economy.
• The Federal Highway Administration estimates that each dollar spent on road, highway and bridge improvements results in an average benefit of $5.20 in the form of reduced vehicle maintenance costs, reduced delays, reduced fuel consumption, improved safety, reduced road and bridge maintenance costs and reduced emissions as a result of improved traffic flow.
7
The federal government is a critical source of funding for Texas’ roads, highways and bridges and provides a significant return to Texas in road and bridge funding based on the revenue generated in the state by the federal motor fuel tax.
• MAP-21(Moving Ahead for Progress in the 21st Century Act), approved by Congress in July 2012, increased funding flexibility for states and streamlined project approval processes to improve the efficiency of state and local transportation agencies in providing needed transportation improvements in the state.
• MAP-21, which expires on September 30, 2014, does not provide sufficient long-term
revenues to support the current level of federal surface transportation investment.
• The impact of inadequate federal surface transportation revenues could be felt as early as this summer, when federal funding for road, highway and bridge projects is likely to be delayed because the balance in the Highway Account of the federal Highway Trust Fund is expected to drop below $1 billion. This delay and uncertainty in funding will likely result in the postponement of numerous projects.
• Nationwide federal funding for highways is expected to be cut by almost 100 percent
from the current investment level for the fiscal year starting October 1, 2014 (FY 2015) unless Congress provides additional transportation revenues. This is due to a cash shortfall in the Highway Trust Fund as projected by the Congressional Budget Office.
• If the funding shortfalls into the federal Highway Trust Fund are addressed solely by
cutting spending it is estimated that federal funding for highway and transit improvements in Texas will be cut by $3.4 billion for the federal fiscal year starting October 1, 2014, unless Congress provides additional transportation revenues.
• From 2008 to 2012, the federal government provided $1.13 for road improvements in
Texas for every dollar the state paid in federal motor fuel fees.
• If Congress decides to provide additional revenues for the federal Highway Trust Fund in tandem with authorizing a new federal surface transportation program, a number of technically feasible revenue options have been identified by the American Association of State Highway and Transportation Officials.
Sources of information for this report include the Texas Department of Transportation (TXDOT), the Federal Highway Administration (FHWA), the Bureau of Transportation Statistics (BTS), the U.S. Census Bureau, the American Association of State Highway and Transportation Officials (AASHTO), the Texas Transportation Institute (TTI) and the National Highway Traffic Safety Administration (NHTSA). All data used in the report is the latest available.

8
Introduction
Texas’ roads, highways and bridges form vital transportation links for the state’s
residents, visitors and businesses, providing daily access to homes, jobs, shopping, natural
resources and recreation. Today, with the Lone Star State striving to foster quality of life
improvements and economic competitiveness, the modernization of Texas’ transportation system
is crucial, particularly to critical areas of the state’s economy including tourism, agriculture and
manufacturing.
As the U.S. and Texas look to sustain long-term economic growth, the preservation and
modernization of the state’s transportation system could play an important role in retaining
Texas’ economic competitiveness and improving its economic well-being by providing critically
needed jobs in the short term and by improving the productivity and competitiveness of the
state’s businesses in the long term. As Texas faces the challenge of preserving and modernizing
its transportation system, the future level of federal, state and local transportation funding will be
a critical factor in whether the state’s residents and visitors continue to enjoy access to a safe and
efficient transportation network. Meeting Texas’ need to modernize and maintain its system of
roads, highways and bridges will require a significant boost in local, state and federal funding.
Signed into law in July 2012, MAP-21 (Moving Ahead for Progress in the 21st Century
Act), makes provisions to streamline procedures that in the past delayed projects, but MAP-21
does not address long-term funding problems facing surface transportation programs.
The level of funding and the provisions of the federal surface transportation program
have a significant impact on highway and bridge conditions, roadway safety, transit service,
quality of life and economic development opportunities in all of the states.

9
This report examines the condition, use and safety of Texas’ roads, highways and
bridges, federal, state and local funding needs, and the future mobility needs of the state.
Sources of information for this study include the Texas Department of Transportation (TXDOT),
the Federal Highway Administration (FHWA), the U.S. Census Bureau, the American
Association of State Highway and Transportation Officials (AASHTO), the Texas
Transportation Institute (TTI), the Bureau of Transportation Statistics (BTS), and the National
Highway Traffic Safety Administration (NHTSA). All data used in the report is the latest
available.
Population, Travel and Economic Trends in Texas
Texas residents and businesses require a high level of personal and commercial mobility.
Population increases and economic growth in the state have resulted in an increase in the demand
for mobility as well as an increase in vehicle miles of travel (VMT). To foster a high quality of
life and spur economic growth in Texas, it will be critical that the state provide a safe and
modern transportation system that can accommodate future growth in population, tourism,
recreation and vehicle travel.
Texas’ population grew to approximately 26.1 million residents in 2012, a 53 percent
increase since 1990.1 Texas had 15,252,192 licensed drivers in 2012.2 From 1990 to 2012,
Texas’ gross domestic product (GDP), a measure of the state’s economic output, increased by
107 percent, when adjusted for inflation – the sixth highest in the nation and nearly twice the
U.S. increase of 56 percent3

10
From 1990 to 2012, annual vehicle miles of travel (VMT) in Texas increased by 47
percent, from 162.2 billion miles to 237.8 billion miles.4 Based on population and other lifestyle
trends, TRIP estimates that travel on Texas’ roads and highways will increase by another 25
percent by 2030.5
Condition of Texas’ Roads
The life cycle of Texas’ roads is greatly affected by the state and local government’s
ability to perform timely maintenance and upgrades to ensure that road and highway surfaces last
as long as possible.
Sixteen percent of Texas’ major state and locally-maintained urban roads and highways
have pavements rated in poor condition. 6 Another 51 percent of Texas’ major roads are rated in
mediocre or fair condition and the remaining 33 percent are rated in good condition.7
The chart below details the pavement conditions on major roads in the state’s largest
urban areas.
Chart 1. Percentage of major roads in poor, mediocre, fair and good condition in Texas’ largest urban areas.
Source: TRIP analysis of Federal Highway Administration data.
The pavement data in this report for all arterial roads and highways is provided by the
Federal Highway Administration, based on data submitted annually by the Texas Department of
11
Transportation (TXDOT) on the condition of major state and locally maintained roads and
highways in the state.
Pavement failure is caused by a combination of traffic, moisture and climate. Moisture
often works its way into road surfaces and the materials that form the road’s foundation. Road
surfaces at intersections are even more prone to deterioration because the slow-moving or
standing loads occurring at these sites subject the pavement to higher levels of stress. It is critical
that roads are fixed before they require major repairs because reconstructing roads costs
approximately four times more than resurfacing them.8 As roads and highways continue to age,
they will reach a point of deterioration where routine paving and maintenance will not be
adequate to keep pavement surfaces in good condition and costly reconstruction of the roadway
and its underlying surfaces will become necessary.
The Costs to Motorists of Roads in Inadequate Condition
TRIP has calculated the additional cost to motorists of driving on roads in poor or
unacceptable condition. When roads are in poor condition – which may include potholes, rutting
or rough surfaces – the cost to operate and maintain a vehicle increases. These additional vehicle
operating costs include accelerated vehicle depreciation, additional vehicle repair costs,
increased fuel consumption and increased tire wear. TRIP estimates that additional vehicle
operating costs borne by Texas motorists as a result of poor road conditions is $5.7 billion
annually.9
Additional vehicle operating costs have been calculated in the Highway Development
and Management Model (HDM), which is recognized by the U.S. Department of Transportation
12
and more than 100 other countries as the definitive analysis of the impact of road conditions on
vehicle operating costs. The HDM report is based on numerous studies that have measured the
impact of various factors, including road conditions, on vehicle operating costs.10
The HDM study found that road deterioration increases ownership, repair, fuel and tire
costs. The report found that deteriorated roads accelerate the pace of depreciation of vehicles and
the need for repairs because the stress on the vehicle increases in proportion to the level of
roughness of the pavement surface. Similarly, tire wear and fuel consumption increase as roads
deteriorate since there is less efficient transfer of power to the drive train and additional friction
between the road and the tires.
TRIP’s additional vehicle operating cost estimate is based on taking the average number
of miles driven annually by a motorist, calculating current vehicle operating costs based on
AAA’s 2013 vehicle operating costs and then using the HDM model to estimate the additional
vehicle operating costs paid by drivers as a result of substandard roads.11 Additional research on
the impact of road conditions on fuel consumption by the Texas Transportation Institute (TTI) is
also factored into TRIP’s vehicle operating cost methodology.
Bridge Conditions in Texas
Texas’ bridges form key links in the state’s highway system, providing communities and
individuals access to employment, schools, shopping and medical facilities, and facilitating
commerce and access for emergency vehicles.
Nineteen percent of Texas’ locally and state - maintained bridges (20 feet or longer) are
currently rated as structurally deficient or functionally obsolete.
13
Two percent of Texas’ locally and state - maintained bridges are rated as structurally
deficient.12 A bridge is structurally deficient if there is significant deterioration of the bridge
deck, supports or other major components. Bridges that are structurally deficient may be posted
for lower weight limits or closed if their condition warrants such action. Deteriorated bridges can
have a significant impact on daily life. Restrictions on vehicle weight may cause many vehicles –
especially emergency vehicles, commercial trucks, school buses and farm equipment – to use
alternate routes to avoid posted bridges. Redirected trips also lengthen travel time, waste fuel
and reduce the efficiency of the local economy.
Seventeen percent of Texas’ locally and state- maintained bridges are rated functionally
obsolete.13 Bridges that are functionally obsolete no longer meet current highway design
standards, often because of narrow lanes, inadequate clearances or poor alignment with the
approaching roadway.
The service life of bridges can be extended by performing routine maintenance such as
resurfacing decks, painting surfaces, insuring that a facility has good drainage and replacing
deteriorating components. But most bridges will eventually require more costly reconstruction
or major rehabilitation to remain operable.
Traffic Safety in Texas
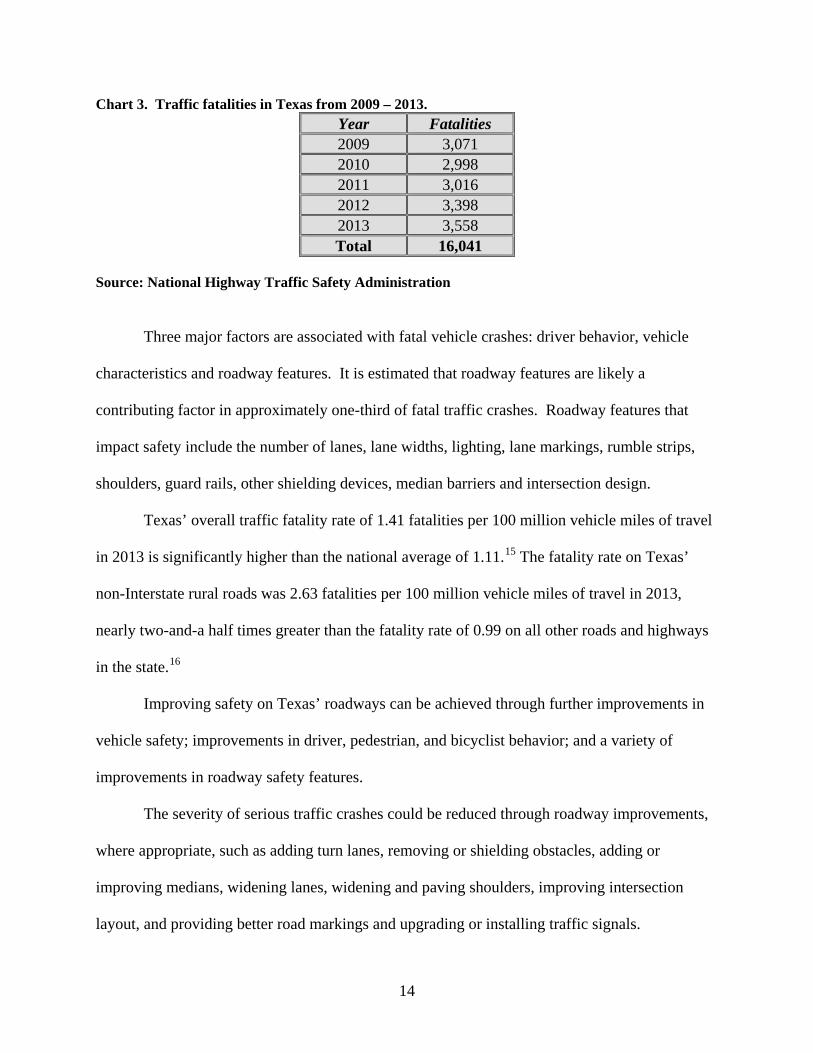
A total of 16,041 people were killed in motor vehicle crashes in Texas from 2009 through
2013, an average of 3,208 fatalities per year.14
14
Chart 3. Traffic fatalities in Texas from 2009 – 2013. Year Fatalities 2009 3,071 2010 2,998 2011 3,016 2012 3,398 2013 3,558 Total 16,041
Source: National Highway Traffic Safety Administration
Three major factors are associated with fatal vehicle crashes: driver behavior, vehicle
characteristics and roadway features. It is estimated that roadway features are likely a
contributing factor in approximately one-third of fatal traffic crashes. Roadway features that
impact safety include the number of lanes, lane widths, lighting, lane markings, rumble strips,
shoulders, guard rails, other shielding devices, median barriers and intersection design.
Texas’ overall traffic fatality rate of 1.41 fatalities per 100 million vehicle miles of travel
in 2013 is significantly higher than the national average of 1.11.15 The fatality rate on Texas’
non-Interstate rural roads was 2.63 fatalities per 100 million vehicle miles of travel in 2013,
nearly two-and-a half times greater than the fatality rate of 0.99 on all other roads and highways
in the state.16
Improving safety on Texas’ roadways can be achieved through further improvements in
vehicle safety; improvements in driver, pedestrian, and bicyclist behavior; and a variety of
improvements in roadway safety features.
The severity of serious traffic crashes could be reduced through roadway improvements,
where appropriate, such as adding turn lanes, removing or shielding obstacles, adding or
improving medians, widening lanes, widening and paving shoulders, improving intersection
layout, and providing better road markings and upgrading or installing traffic signals.

15
Roads with poor geometry, with insufficient clear distances, without turn lanes, having
inadequate shoulders for the posted speed limits, or poorly laid out intersections or interchanges,
pose greater risks to motorists, pedestrians and bicyclists.
Investments in rural traffic safety have been found to result in significant reductions in
serious traffic crashes. A 2012 report by the Texas Transportation Institute (TTI) found that
improvements completed recently by the Texas Department of Transportation that widened
lanes, improved shoulders and made other safety improvements on 1,159 miles of rural state
roadways resulted in 133 fewer fatalities on these roads in the first three years after the
improvements were completed (as compared to the three years prior). TTI estimates that the
improvements on these roads are likely to save 880 lives over the next 20 years.17
Traffic Congestion in Texas
Increasing levels of traffic congestion cause significant delays in Texas, particularly in its
larger urban areas, choking commuting and commerce. Traffic congestion robs commuters of
time and money and imposes increased costs on businesses, shippers and manufacturers, which
are often passed along to the consumer.
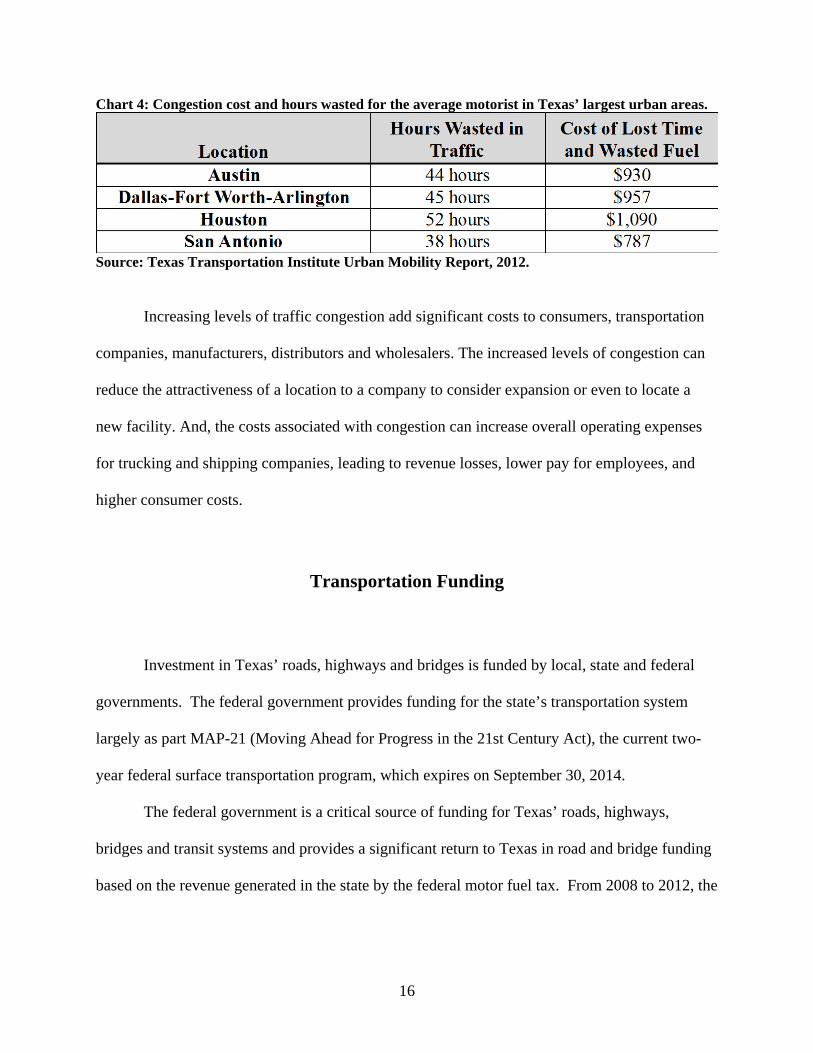
The chart below details the number of hours wasted annually in congestion by the
average driver in each urban area, as well as the cost of congestion to the average motorist in the
form of lost time and wasted fuel.
16
Chart 4: Congestion cost and hours wasted for the average motorist in Texas’ largest urban areas.
Source: Texas Transportation Institute Urban Mobility Report, 2012.
Increasing levels of traffic congestion add significant costs to consumers, transportation
companies, manufacturers, distributors and wholesalers. The increased levels of congestion can
reduce the attractiveness of a location to a company to consider expansion or even to locate a
new facility. And, the costs associated with congestion can increase overall operating expenses
for trucking and shipping companies, leading to revenue losses, lower pay for employees, and
higher consumer costs.
Transportation Funding
Investment in Texas’ roads, highways and bridges is funded by local, state and federal
governments. The federal government provides funding for the state’s transportation system
largely as part MAP-21 (Moving Ahead for Progress in the 21st Century Act), the current two-
year federal surface transportation program, which expires on September 30, 2014.
The federal government is a critical source of funding for Texas’ roads, highways,
bridges and transit systems and provides a significant return to Texas in road and bridge funding
based on the revenue generated in the state by the federal motor fuel tax. From 2008 to 2012, the
17
federal government provided $1.13 for road improvements in Texas for every dollar the state
paid in federal motor fuel fees.18
Federal funds for highway and transit improvements in Texas are provided through the
federal Highway Trust Fund, which raises revenue through federal user fees, largely an 18.4
cents-per-gallon tax on gasoline and a 24.4 cents-per-gallon tax on diesel fuel. Since 2008
revenue into the federal Highway Trust Fund has been inadequate to support legislatively set
funding levels so Congress has transferred approximately $53 billion in general funds and an
additional $2 billion from a related trust fund into the federal Highway Trust Fund.19
MAP-21, approved by Congress in July 2012, greatly increased funding flexibility for
states and streamlined project approval processes to improve the efficiency of state and local
transportation agencies in providing needed transportation improvements in the state. But MAP-
21, which expires on September 30, 2014, did not provide sufficient long-term revenues in place
to support the current level of federal surface transportation investment.
The impact of inadequate federal surface transportation revenues could be felt as early as
this summer, when the balance in the Highway Account of the federal Highway Trust Fund is
expected to drop below $1 billion, which will trigger delays in the federal reimbursement to
states for road, highway and bridge projects. States are expected to respond to this delay in
federal reimbursement for road, highway and bridge repairs and improvements by delaying or
postponing numerous projects.20
Nationwide, federal funding for highways is expected to be cut by almost 100 percent
from the current investment level for the fiscal year starting October 1, 2014 (FY 2015) unless
Congress provides additional transportation revenues. This is due to a cash shortfall in the
Highway Trust Fund as projected by the Congressional Budget Office.

18
If Congress decides to provide additional revenues into the federal Highway Trust Fund
in tandem with authorizing a new federal surface transportation program, a number of technically
feasible revenue options have been identified by the American Association of State Highway and
Transportation Officials.
But if the funding shortfalls into the federal Highway Trust Fund are addressed solely by
cutting spending it is estimated that federal funding for highway and transit improvements in
Texas will be cut by approximately $3.4 billion for the federal fiscal year starting October 1,
2014, unless Congress provides additional transportation revenues.21
Increasing investment in the state’s roads, highways and bridges could boost Texas’
economy by creating jobs. A 2007 analysis by the Federal Highway Administration found that
every $1 billion invested in highway construction would support approximately 27,800 jobs,
including approximately 9,500 in the construction sector, approximately 4,300 jobs in industries
supporting the construction sector, and approximately 14,000 other jobs induced in non-
construction related sectors of the economy.22
Importance of Transportation to Economic Growth
Today’s culture of business demands that an area have well-maintained and efficient
roads, highways and bridges if it is to remain economically competitive. Global communications
and the impact of free trade in North America and elsewhere have resulted in a significant
increase in freight movement, making the quality of a region’s transportation system a key
component in a business’s ability to compete locally, nationally and internationally.
19
Businesses have responded to improved communications and the need to cut costs with a
variety of innovations including just-in-time delivery, increased small package delivery, demand-
side inventory management and e-commerce. The result of these changes has been a significant
improvement in logistics efficiency as firms move from a push-style distribution system, which
relies on large-scale warehousing of materials, to a pull-style distribution system, which relies on
smaller, more strategic movement of goods. These improvements have made mobile inventories
the norm, resulting in the nation’s trucks literally becoming rolling warehouses.
Highways are vitally important to continued economic development in Texas,
particularly to the state’s agriculture, natural resource extraction, manufacturing and tourism
industries. As the economy expands, creating more jobs and increasing consumer confidence, the
demand for consumer and business products grows. In turn, manufacturers ship greater quantities
of goods to market to meet this demand, a process that adds to truck traffic on the state’s
highways and major arterial roads.
Every year, $1.167 trillion in goods are shipped from sites in Texas and another $1.246
trillion in goods are shipped to sites in Texas, mostly by trucks.23 Fifty-nine percent of the goods
shipped annually from sites in Texas are carried by trucks and another nine percent are carried by
courier services or multiple-mode deliveries, which include trucking.24
The cost of road and bridge improvements are more than offset by the reduction of user
costs associated with driving on rough roads, the improvement in business productivity, the
reduction in delays and the improvement in traffic safety. The Federal Highway Administration
estimates that each dollar spent on road, highway and bridge improvements results in an average
benefit of $5.20 in the form of reduced vehicle maintenance costs, reduced delays, reduced fuel
consumption, improved safety, reduced road and bridge maintenance costs and reduced
emissions as a result of improved traffic flow.25
20
Local, regional and state economic performance is improved when a region’s surface
transportation system is expanded or repaired. This improvement comes as a result of the initial
job creation and increased employment created over the long-term because of improved access,
reduced transport costs and improved safety Highway accessibility was ranked the number one
site selection factor in a 2011 survey of corporate executives by Area Development Magazine.26
Increasingly, companies are looking at the quality of a region’s transportation system
when deciding where to re-locate or expand. Regions with congested or poorly maintained roads
may see businesses relocate to areas with a smoother, more efficient and more modern
transportation system.
Conclusion
As Texas looks to build and enhance a thriving, growing and dynamic state, it will be
critical that it is able to provide a 21st century network of roads, highways and bridges that can
accommodate the mobility demands of a modern society.
As the nation looks to sustain long-term economic growth, the U.S. will need to
modernize its surface transportation system by improving the physical condition of its
transportation network and enhancing the system’s ability to provide efficient and reliable
mobility for motorists and businesses. Making needed improvements to Texas’ roads, highways
and bridges could provide a significant boost to the state’s economy by creating jobs in the short
term and stimulating long-term economic growth as a result of enhanced mobility and access.
Without a substantial boost in federal, state and local highway funding, numerous
projects to improve the condition and expand the capacity of Texas’ roads, highways and bridges
21
will not be able to proceed, hampering the state’s ability to improve the condition of its
transportation system and to enhance economic development opportunities in the state.
# # #

22
Endnotes
1 U.S. Census Bureau (2013). 2 Highway Statistics (2012). Federal Highway Administration. DL-1C 3 TRIP analysis of Bureau of Economic Analysis data. 4 U.S. Department of Transportation - Federal Highway Administration: Highway Statistics 1990 and 2012. 5 TRIP calculation based on U.S. Census and Federal Highway Administration data. 6 Federal Highway Administration (2013). Pavement condition data is for 2012. 7 Ibid. 8 Selecting a Preventative Maintenance Treatment for Flexible Pavements. R. Hicks, J. Moulthrop. Transportation Research Board. 1999. Figure 1. 9 TRIP calculation 10 Highway Development and Management: Volume Seven. Modeling Road User and Environmental Effects in HDM-4. Bennett, C. and Greenwood, I. 2000. 11 Your Driving Costs. American Automobile Association. 2013. 12 Federal Highway Administration (2013). National Bridge Inventory. 13 Ibid. 14 TRIP analysis of TxDOT data (2014). 15 TRIP analysis of National Highway Traffic Safety Administration and Federal Highway Administration data (2013). 16 Ibid. 17 Adding Highway Shoulders, Width, Reduce Crash Numbers and Save Lives (August 9, 2012). Texas Transportation Institute. 18 TRIP analysis of Federal Highway Administration data. 2008 to 2012 Highway Statistics sf-1. 19 “Surface Transportation Reauthorization and the Solvency of the Highway Trust Fund,” presentation by Jim Tyson, American Association of State Highway and Transportation Officials (2014). 20 Testimony of Michael Hancock, president of the American Association of State Highway and Transportation Officials, to the Senate Committee on Environment and Public Works. (Fe. 12, 2014). 21 U.S. Senate Committee on Environment and Public Works (2013). http://www.epw.senate.gov/public/index.cfm?FuseAction=Files.View&FileStore_id=cf1dfe4e-8e60-4506-a9e0-205fe809f314 22 Federal Highway Administration, 2008. Employment Impacts of Highway Infrastructure Investment. 23 Bureau of Transportation Statistics (2010), U.S. Department of Transportation. 2007 Commodity Flow Survey, State Summaries. http://www.bts.gov/publications/commodity_flow_survey/2007/states/ 24 Ibid. 25 FHWA estimate based on its analysis of 2006 data. For more information on FHWA’s cost-benefit analysis of highway investment, see the 2008 Status of the Nation's Highways, Bridges, and Transit: Conditions and Performance. 26 Area Development Magazine (Winter, 2012). 26th Annual Survey of Corporate Executive Results.