the aaa protein msp1 mediates clearance of excess tail
TRANSCRIPT

*For correspondence: vdenic@
mcb.harvard.edu
Competing interests: The
authors declare that no
competing interests exist.
Funding: See page 26
Received: 10 May 2017
Accepted: 12 September 2017
Published: 14 September 2017
Reviewing editor: Ramanujan S
Hegde, MRC Laboratory of
Molecular Biology, United
Kingdom
Copyright Weir et al. This
article is distributed under the
terms of the Creative Commons
Attribution License, which
permits unrestricted use and
redistribution provided that the
original author and source are
credited.
The AAA protein Msp1 mediatesclearance of excess tail-anchored proteinsfrom the peroxisomal membraneNicholas R Weir, Roarke A Kamber, James S Martenson, Vladimir Denic*
Department of Molecular and Cellular Biology, Harvard University, Cambridge,United States
Abstract Msp1 is a conserved AAA ATPase in budding yeast localized to mitochondria where it
prevents accumulation of mistargeted tail-anchored (TA) proteins, including the peroxisomal TA
protein Pex15. Msp1 also resides on peroxisomes but it remains unknown how native TA proteins
on mitochondria and peroxisomes evade Msp1 surveillance. We used live-cell quantitative cell
microscopy tools and drug-inducible gene expression to dissect Msp1 function. We found that a
small fraction of peroxisomal Pex15, exaggerated by overexpression, is turned over by Msp1.
Kinetic measurements guided by theoretical modeling revealed that Pex15 molecules at
mitochondria display age-independent Msp1 sensitivity. By contrast, Pex15 molecules at
peroxisomes are rapidly converted from an initial Msp1-sensitive to an Msp1-resistant state. Lastly,
we show that Pex15 interacts with the peroxisomal membrane protein Pex3, which shields Pex15
from Msp1-dependent turnover. In sum, our work argues that Msp1 selects its substrates on the
basis of their solitary membrane existence.
DOI: https://doi.org/10.7554/eLife.28507.001
IntroductionTail-anchored (TA) proteins are integral membrane proteins with a single C-terminal transmembrane
segment (TMS). In the budding yeast Saccharomyces cerevisiae, the majority of TA proteins are cap-
tured post-translationally by cytosolic factors of the conserved Guided Entry of TA proteins (GET)
pathway, which deliver them to the endoplasmic reticulum (ER) membrane for insertion by a dedi-
cated insertase (Denic et al., 2013; Hegde and Keenan, 2011). TA proteins native to the outer
mitochondrial and peroxisomal membranes are directly inserted into these membranes by mecha-
nisms that are not well defined (Chen et al., 2014a; Papic et al., 2013, and reviewed in
Borgese and Fasana, 2011). Gene deletions of GET pathway components (getD) result in reduced
cell growth, TA protein mistargeting to mitochondria, and cytosolic TA protein aggregates
(Jonikas et al., 2009; Schuldiner et al., 2008). Two recent studies identified the ATPase associated
with diverse cellular activities (AAA ATPase) Msp1 as an additional factor for supporting cell viability
in the absence of GET pathway function (Chen et al., 2014b; Okreglak and Walter, 2014). Specifi-
cally, they observed that msp1D cells accumulate mislocalized TA proteins in the mitochondria and
that double msp1D getD cells have synthetic sick genetic interactions. This sick phenotype is associ-
ated with disruption of mitochondrial function and is exacerbated by overexpression of TA proteins
prone to mislocalization (Chen et al., 2014b). Msp1 is a cytosolically-facing transmembrane AAA
ATPase which resides on both mitochondria and peroxisomes (Chen et al., 2014b; Okreglak and
Walter, 2014). Closely-related members of Msp1’s AAA ATPase subfamily form hexamers that bind
hydrophobic membrane substrates and use the energy of ATP hydrolysis to extract them from the
membrane for protein degradation (Olivares et al., 2016). Several lines of evidence are consistent
with the working model that Msp1 operates by a similar mechanism: ATPase-dead mutations of
Weir et al. eLife 2017;6:e28507. DOI: https://doi.org/10.7554/eLife.28507 1 of 28
RESEARCH ARTICLE

Msp1 are unable to complement msp1D mutant phenotypes; mitochondrial mistargeting of TA pro-
teins leads to their enhanced co-immunoprecipitation with ATPase-dead Msp1; cells lacking Msp1
have increased half-lives of mistargeted TA proteins; and lastly, a complementary analysis of the
mammalian Msp1 homolog ATAD1 (Chen et al., 2014b) established a conserved role for Msp1 in
correcting errors in TA protein sorting.
Substrate selectivity mechanisms of many AAA proteins have been successfully dissected by bulk
cell approaches for measuring substrate turnover. These approaches are resolution-limited, however,
when used to study Msp1 in getD cells because TA proteins mistargeted to mitochondria co-exist
with a dominant TA population that remains correctly localized in the same cell. Previous studies
overcame this issue through two different approaches that increased the ratio of mistargeted to
properly localized substrates. In one case, cells were engineered to produce a Pex15 deletion
mutant (Pex15DC30) that is efficiently mistargeted to mitochondria because it lacks its native peroxi-
somal targeting signal (Okreglak and Walter, 2014). A major limitation of this approach, however,
is its inherent unsuitability for establishing if native Pex15 is a latent Msp1 substrate because of
undefined peroxisomal factors. Second, a cell microscopy pulse-chase approach was used to monitor
turnover of mitochondrial signal from transiently expressed fluorescently-labeled wild-type Pex15
made susceptible to mistargeting by deletion of GET3 (Chen et al., 2014b). In this approach,
expression of Pex15 was transcriptionally controlled by the inducible GAL promoter in cells express-
ing wild-type, ATPase-dead, or no Msp1. Comparison of mitochondrial Pex15 clearance following
GAL promoter shut-off revealed that cells lacking functional Msp1 had a reduced fractional rate of
substrate clearance (Chen et al., 2014b); however, these cells also had a larger starting population
of mitochondrial Pex15. Thus the presence of Msp1 during Pex15 pulse periods (Chen et al., 2014b;
Okreglak and Walter, 2014) leaves open the possibility that Msp1 does not mediate substrate
extraction from the mitochondrial outer membrane but instead blocks substrate insertion into this
membrane. Distinguishing between these possibilities requires better tools for temporally control-
ling and accurately measuring Msp1 activity in cells.
eLife digest The phrase “finding a needle in a haystack” refers to the difficulty of locating a
specific target among a large number of very similar objects. Living cells face a comparable
challenge whenever they carry out seek and destroy missions aimed at broken or otherwise
undesirable molecules. Scientists are still figuring out how these quality control systems can quickly
and accurately pick out the few unwanted molecules that occasionally appear in crowds of normal
molecules.
Msp1 is a quality control protein that resides on the outer surfaces of two compartments within
cells: mitochondria and peroxisomes. Previous work showed that when a protein called Pex15, which
is normally found in peroxisomes, is mistakenly sent to mitochondria it is rapidly eliminated by
Msp1.
Weir et al. set out to understand if Msp1 can distinguish incorrectly localized Pex15 from
correctly localized Pex15. Fluorescence microscopy was used to watch how Msp1 eliminates Pex15
from compartments within living yeast cells. Although Msp1 did not normally recognize Pex15 at
peroxisomes, when Weir et al. attempted to over-load peroxisomes with Pex15 they saw that Msp1
provided a counterforce. Comparing how quickly cells eliminated excess Pex15 at peroxisomes with
predictions from mathematical models showed that Pex15 “matures” from an Msp1-sensitive to an
Msp1-insensitive state. Further experiments revealed that Pex15 binds to another protein found in
peroxisomes, called Pex3, which protects Pex15 from Msp1. By contrast, occasional Pex15
molecules that reached mitochondria remained immature and sensitive to Msp1.
Proteins similar to Msp1 are also found in humans, and Weir et al. hope that a better
understanding of how Msp1 works in yeast will help scientists studying human disorders caused by
defects in similar quality control systems. This could help to combat disease like cancer,
neurodegenerative diseases and cystic fibrosis – which have all been linked to quality control
systems that have started to target too few or too many proteins.
DOI: https://doi.org/10.7554/eLife.28507.002
Weir et al. eLife 2017;6:e28507. DOI: https://doi.org/10.7554/eLife.28507 2 of 28
Research article Cell Biology
Substrate recognition by AAA proteins can be controlled by a variety of intrinsic substrate deter-
minants and extrinsic factors (Olivares et al., 2016). Some insight into Msp1 substrate selectivity
comes from negative evidence showing that native mitochondrial TA proteins are inefficient Msp1
substrates (Chen et al., 2014b). Thus, substrates might contain intrinsic Msp1 recognition determi-
nants or native mitochondrial TA proteins might be protected from Msp1 recognition by extrinsic
mitochondrial factors. Similarly, the potential existence of extrinsic peroxisomal factors might explain
why Pex15 (a native peroxisomal TA protein) appears to stably co-reside with Msp1 at peroxisomes
but is a substrate for Msp1 at mitochondria (Chen et al., 2014b; Okreglak and Walter, 2014).
Results
Efficient clearance of a fully-integrated substrate from mitochondria byde novo Msp1 inductionTo generate a defined Msp1 substrate population prior to initiation of Msp1 activity, we utilized two
established synthetic drug-inducible gene expression systems to orthogonally control expression of
Pex15 and Msp1. Briefly, we created a yeast strain genetic background with two transcriptional acti-
vator-promoter pairs: 1. the doxycycline (DOX)-activated reverse tetracycline trans-activator (rTA)
(Roney et al., 2016) for controlling expression of fluorescently-labeled Pex15 (YFP-Pex15) from the
TET promoter; and 2. the b-estradiol-activated synthetic transcription factor Z4EV (McIsaac et al.,
2013) for controlling Msp1 expression from the Z4EV-driven (ZD) promoter (Figure 1—figure sup-
plement 1A–C). Next, we pre-loaded mitochondria with Pex15 in the absence of any detectable
Msp1 (Figure 1—figure supplement 1A) by growing cells for 2 hr in the presence of a high DOX
concentration (50 mg/ml) necessary to induce sufficient mitochondrial mistargeting (Figure 1A and
see below). This was followed by 2 hr of DOX wash-out to allow for mitochondrial maturation of
newly-synthesized YFP-Pex15 (Figure 1A). Using confocal microscopy, we could resolve the rela-
tively faint mitochondrial YFP fluorescence from the much brighter punctate YFP fluorescence (corre-
sponding to peroxisomes, see below) by signal co-localization with Tom70-mTurquoise2 (a
mitochondrial marker; Figure 1B) (see Figure 1—figure supplement 2, Videos 1 and 2, and Materi-
als and methods for computational image analysis details). Lastly, we monitored changes in mito-
chondrial YFP-Pex15 fluorescence density by timelapse live-cell imaging in the presence or absence
of b-estradiol to define the effect of de novo induction of Msp1 activity (Figure 1A). Starting with
the same pre-existing mitochondrial Pex15 population, we found that de novo Msp1 induction sig-
nificantly enhanced mitochondrial YFP signal decay (Figure 1B–C). We reached a similar conclusion
when we used a deletion variant of Pex15 (Pex15DC30) that is efficiently mistargeted to mitochondria
because it lacks a C-terminal peroxisome targeting signal (Okreglak and Walter, 2014)(Figure 2A–
C). To establish if Pex15DC30was fully membrane-integrated prior to Msp1 induction, we harvested
cells after DOX treatment. Following cell lysis, we isolated crude mitochondria by centrifugation and
treated them with Proteinase K (PK). Immunoblotting analysis against a C-terminal epitope engi-
neered on Pex15 revealed the existence of a protected TMS-containing fragment that became PK-
sensitive after solubilizing mitochondrial membranes with detergent (Figure 2D). Taken together,
these findings argue that Msp1 can extract a fully-integrated substrate from the mitochondrial outer
membrane and gave us a new tool for mechanistic dissection of Msp1 function in vivo.
Differential kinetic signatures of mitochondrial versus peroxisomalPex15 clearance by Msp1While performing the previous analysis, we observed that b-estradiol also enhanced YFP-Pex15 sig-
nal decay at punctate, non-mitochondrial structures. To test if these punctae corresponded to perox-
isomes, we used a strain with mCherry-marked peroxisomes (mCherry-PTS1) and induced YFP-Pex15
expression with a lower DOX concentration (10 mg/ml). Indeed, we saw robust YFP and mCherry sig-
nal co-localization with little apparent Pex15 mistargeting to mitochondria (Figure 3A–B). As we ini-
tially surmised, b-estradiol-driven Msp1 expression enhanced YFP-Pex15 signal decay at
peroxisomes (Figure 3A–C). Immunoblotting analysis of lysates prepared from comparably-treated
cells provided further support for our conclusion that de novo induction of Msp1 activity enables
degradation of peroxisomal Pex15 (Figure 3D).
Weir et al. eLife 2017;6:e28507. DOI: https://doi.org/10.7554/eLife.28507 3 of 28
Research article Cell Biology
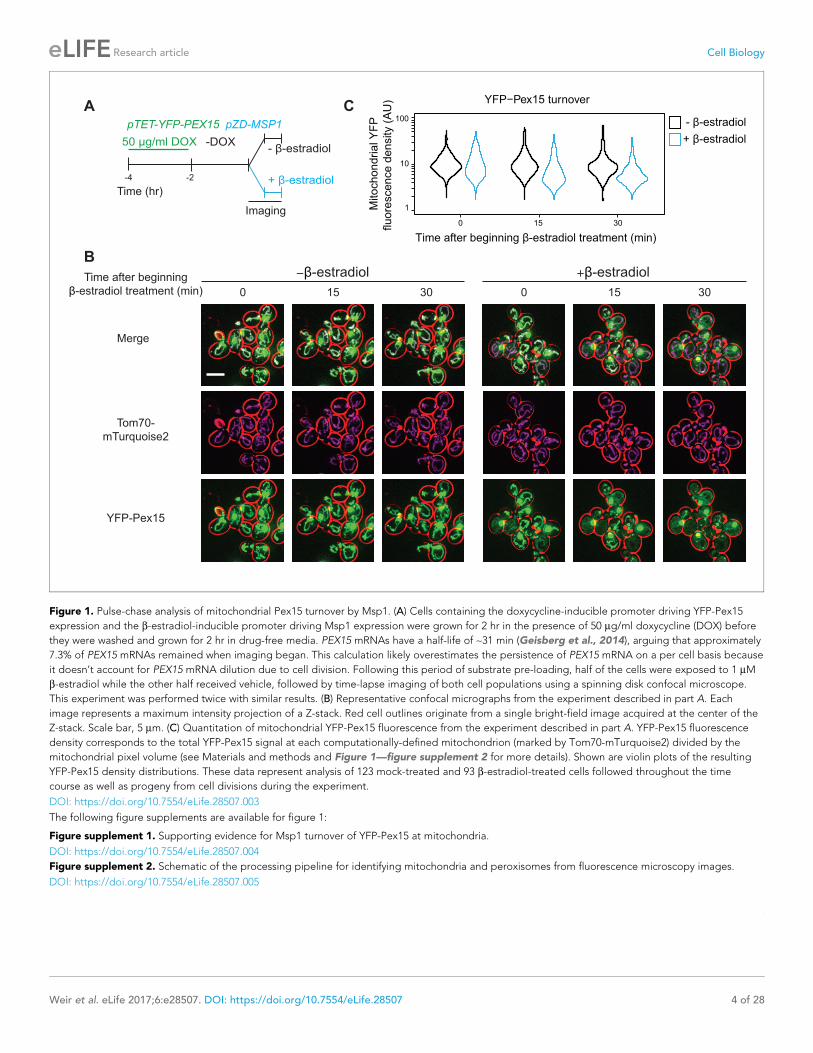
Figure 1. Pulse-chase analysis of mitochondrial Pex15 turnover by Msp1. (A) Cells containing the doxycycline-inducible promoter driving YFP-Pex15
expression and the b-estradiol-inducible promoter driving Msp1 expression were grown for 2 hr in the presence of 50 mg/ml doxycycline (DOX) before
they were washed and grown for 2 hr in drug-free media. PEX15 mRNAs have a half-life of ~31 min (Geisberg et al., 2014), arguing that approximately
7.3% of PEX15 mRNAs remained when imaging began. This calculation likely overestimates the persistence of PEX15 mRNA on a per cell basis because
it doesn’t account for PEX15 mRNA dilution due to cell division. Following this period of substrate pre-loading, half of the cells were exposed to 1 mM
b-estradiol while the other half received vehicle, followed by time-lapse imaging of both cell populations using a spinning disk confocal microscope.
This experiment was performed twice with similar results. (B) Representative confocal micrographs from the experiment described in part A. Each
image represents a maximum intensity projection of a Z-stack. Red cell outlines originate from a single bright-field image acquired at the center of the
Z-stack. Scale bar, 5 mm. (C) Quantitation of mitochondrial YFP-Pex15 fluorescence from the experiment described in part A. YFP-Pex15 fluorescence
density corresponds to the total YFP-Pex15 signal at each computationally-defined mitochondrion (marked by Tom70-mTurquoise2) divided by the
mitochondrial pixel volume (see Materials and methods and Figure 1—figure supplement 2 for more details). Shown are violin plots of the resulting
YFP-Pex15 density distributions. These data represent analysis of 123 mock-treated and 93 b-estradiol-treated cells followed throughout the time
course as well as progeny from cell divisions during the experiment.
DOI: https://doi.org/10.7554/eLife.28507.003
The following figure supplements are available for figure 1:
Figure supplement 1. Supporting evidence for Msp1 turnover of YFP-Pex15 at mitochondria.
DOI: https://doi.org/10.7554/eLife.28507.004
Figure supplement 2. Schematic of the processing pipeline for identifying mitochondria and peroxisomes from fluorescence microscopy images.
DOI: https://doi.org/10.7554/eLife.28507.005
Weir et al. eLife 2017;6:e28507. DOI: https://doi.org/10.7554/eLife.28507 4 of 28
Research article Cell Biology

To our knowledge, Msp1-induced turnover of
peroxisomal Pex15 had not been reported previ-
ously. We found two pieces of evidence that this unexpected phenotype was the product of Pex15
overexpression. First, treatment of pTET-YFP-PEX15 cells with 5 mg/ml DOX concentration still
induced a > 10 fold higher YFP fluorescence at peroxisomes relative to steady state levels of YFP-
Pex15 expressed from its native promoter (Figure 3—figure supplement 1A–B). Second, we could
detect no difference in natively-expressed peroxisomal Pex15 levels when we compared wild-type and
msp1D cells (Figure 3E, left panel). This is unlikely a signal detection problem because we could
robustly detect the accumulation of natively-expressed Pex15DC30 at mitochondria in msp1D cells
(Figure 3E, right panel).
Why does Msp1-dependent turnover of peroxisomal Pex15 necessitate excess substrate when the
same AAA machine clears mitochondria of even trace amounts of mistargeted Pex15? In search of an
answer to this question, we repeated our analysis at higher temporal resolution and found a major dif-
ference between the kinetic signatures of mitochondrial and peroxisomal Pex15 turnover by Msp1
(Figure 4A and see below). Specifically, while mitochondrial Pex15 turnover showed simple exponen-
tial decay (i.e. linear decay after log-transformation), the decay of peroxisomal Pex15 appeared to be
more complex, comprising faster and slower kinetic components. We detected no major kinetic differ-
ences between Msp1 targeting to mitochondria and peroxisomes that could explain this phenomenon
(Figure 1—figure supplement 1B–C) but found a potential clue from a proteome-wide pulse-chase
study showing that while most proteins decay exponentially, some exhibit non-exponential decay that
can be explained by their stoichiometric excess over their binding partners (McShane et al., 2016).
Since peroxisomal membranes have unique residents that interact with native Pex15 (Eckert and
Johnsson, 2003), we hypothesized that non-exponential decay of overexpressed peroxisomal Pex15
arises due to the existence of an Msp1-sensitive ‘solitary’ Pex15 state and an Msp1-insensitive ‘part-
ner-bound’ Pex15 state. This solitary state would be minimally populated by endogenously expressed
Pex15 under steady-state conditions, but a significant fraction of overexpressed Pex15 molecules
would be solitary because of stoichiometric excess. By contrast, since mitochondria are unlikely to
have Pex15-binding partners, mitochondrial Pex15 would exist in an obligate solitary state and would
therefore decay exponentially.
To test this hypothesis, we fit our microscopic YFP-Pex15 decay data against two competing sto-
chastic models, which were previously used to describe proteome-wide protein decay data (see Mate-
rials and methods for modelling details) (McShane et al., 2016). In the 1-state (exponential) model
(Figure 4B, left), we posit that all Pex15 molecules have the same probability of decay (kdecay). In the
2-state (non-exponential) model (Figure 4B, right), we introduce the probability (kmat) of nascent
Pex15 maturation, alongside distinct probabilities for decay of the nascent (kdecay,1) and mature (kde-
cay,2) Pex15 states. Depending upon the determined fit parameters, the 2-state model can
Video 1. Representative output from segmenting
mitochondria in confocal Z-stacks. An animated Z-stack
showing raw Tom70-mTurquoise2 fluorescence
visualized by spinning disk confocal microscopy (left),
segmented mitochondria identified in the image
(middle), and an overlay of the raw image and
segmentation output (right). See Materials and
methods and Figure 1—figure supplement 2 for
segmentation details. Each contiguous single-color
object represents one segmented mitochondrion.
Video travels from the bottom to the top of the Z-stack
in 0.2 mm slices.
DOI: https://doi.org/10.7554/eLife.28507.008
Video 2. Representative output from segmenting
peroxisomes in confocal Z-stacks. An animated Z-stack
showing raw mCherry-PTS1 fluorescence visualized by
spinning disk confocal microscopy (left), segmented
peroxisomes identified in the image (middle), and an
overlay of the raw image and segmentation output
(right). See Materials and methods and Figure 1—
figure supplement 2 for segmentation details. Each
contiguous single-color object represents one
segmented peroxisome. Video travels from the bottom
to the top of the Z-stack in 0.2 mm slices.
DOI: https://doi.org/10.7554/eLife.28507.009
Weir et al. eLife 2017;6:e28507. DOI: https://doi.org/10.7554/eLife.28507 5 of 28
Research article Cell Biology

Figure 2. Pulse-chase analysis of mitochondrial Pex15DC30 turnover by Msp1. (A) Experimental timeline of the staged expression experiment for
monitoring Msp1-dependent turnover of mitochondrial YFP-Pex15DC30. This experiment was performed twice with similar results. (B) Representative
confocal micrographs from the experiment described in part A. Each image represents a maximum intensity projection of a Z-stack. Red cell outlines
originate from a single bright-field image acquired at the center of the Z-stack. Contrast-enhanced YFP-Pex15DC30 fluorescence is shown for later
Figure 2 continued on next page
Weir et al. eLife 2017;6:e28507. DOI: https://doi.org/10.7554/eLife.28507 6 of 28
Research article Cell Biology

approximate a 1-state model by minimizing the contribution of one of the two states (Sin et al., 2016).
To quantify the difference between the 1-state and 2-state models for each sample, and therefore to
assess the contribution of a distinct second substrate state to turnover, we measured the area
between the 1-state and 2-state fit curves (see Materials and methods).
To analyze mitochondrial Msp1 substrate turnover, we chose YFP-Pex15DC30 over wild-type
Pex15 to avoid measuring weak mitochondrial signals juxtaposed to strong peroxisomal signals
(compare Figure 1B and Figure 2B). We also restricted our analysis to the first 45 min of b-estradiol
treatment because longer Msp1 induction times led to a significant fraction of mitochondria with no
detectable YFP signal, which would interfere with turnover fitting (Figure 2B, later timepoints). In
both the presence and absence of Msp1, our measurements could be similarly explained by both 1-
state and 2-state models. The fits from these two models were almost identical (Figure 4C–D,
Figure 4G, and Figure 4—figure supplement 1A). Thus, we parsimoniously concluded that Msp1
enhances Pex15 clearance from mitochondria as part of a simple exponential process. Turning to
overexpressed YFP-Pex15 at peroxisomes, where YFP-Pex15 persisted at peroxisomes for over 3 hr
(Figure 3B, later timepoints), we could undertake quantitative analysis on a longer timescale. We
again found that the 1-state model and 2-state were indistinguishable in the absence of Msp1. By
contrast, the 1-state and 2-state models yielded markedly different fits for our measurements taken
after inducing expression of Msp1 (Figure 4E–G and Figure 4—figure supplement 1A–B). The fit
parameters from the 2-state model, which more closely approximated measured Pex15 turnover,
revealed that Pex15 in the nascent state decayed ~4 fold faster (kdecay, 1 = 3.45 hr�1) than Pex15 in
the mature state (kdecay, 2 = 0.87 hr�1) (Figure 4—figure supplement 1A).
Msp1 selectively clears newly-resident Pex15 molecules fromperoxisomesThe 1-state and 2-state models of peroxisomal Pex15 turnover make distinct predictions about the
effect of Msp1 expression on the age of Pex15 molecules. Specifically, in the 1-state model, transient
Msp1 overexpression in cells with constitutive Pex15 expression should equally destabilize all Pex15
molecules, thus rapidly reducing their mean age over time (Figure 5B, top left panel). By contrast, in
the 2-state model, Pex15 age should be buffered against Msp1 overexpression because of two oppos-
ing forces (Figure 4B and Figure 5B, top right panel): At one end, there would be an increase in kde-
cay,1 leading to less nascent Pex15, which would drive down the mean age over time. However, there
would also be an opposing consequence of rapid depletion of new peroxisomal Pex15 by Msp1: the
mature population of Pex15 would receive fewer new (younger) molecules, which would drive up the
mean age over time. Notably, both models predict that transient Msp1 expression would result in a
decrease in peroxisomal Pex15 levels, albeit with differing kinetics (Figure 5B, bottom panels). We
simulated Pex15 levels and age following transient Msp1 activation in the 1- and 2-state models with a
set of possible half-lives that ranged from our microscopically determined value of 58 min to as slow as
Figure 2 continued
timepoints +b-estradiol to permit visualization of dim signals. Scale bar, 5 mm. (C) Quantitation of mitochondrial YFP-Pex15DC30 fluorescence from the
experiment described in part B. YFP-Pex15DC30 fluorescence density corresponds to the total YFP signal at each computationally-defined
mitochondrion (marked by Tom70-mTurquoise2) divided by the mitochondrial pixel volume (see Materials and methods for more details). These data
represent analysis of 382 mock-treated and 210 b-estradiol-treated TET-YFP-PEX15DC30 cells and 198 cells lacking YFP-tagged Pex15 followed
throughout the time course as well as progeny from cell divisions during the experiment. Laser power was increased from the experiment shown in
Figure 1B–C, and therefore AUs are not comparable between these experiments. (D) Protease protection assay monitoring YFP-Pex15DC30-V5
integration into mitochondria. Crude mitochondria were isolated from TET-YFP-pex15DC30-V5 cells (see Materials and methods for details) and
subjected to Proteinase K (PK) or mock treatment in the presence or absence of 1% Triton X-100. Samples were resolved by SDS-PAGE and analyzed
by immunoblotting with the indicated antibodies. Immunoblotting with an a-V5 antibody visualized bands at the predicted molecular weight for full-
length YFP-Pex15DC30-V5 (top), Pex15DC30-V5 lacking the YFP tag (middle and Figure 2—figure supplement 1), and a smaller protease-resistant
fragment (PF, bottom). Immunoblotting was performed against the mitochondrial inner membrane protein Sdh4 to assess accessibility of the
mitochondrial intermembrane space to PK. See Figure 2—figure supplement 1 for a-YFP immunoblotting.
DOI: https://doi.org/10.7554/eLife.28507.006
The following figure supplement is available for figure 2:
Figure supplement 1. Supporting evidence for Msp1-dependent turnover of mitochondrial YFP-Pex15DC30.
DOI: https://doi.org/10.7554/eLife.28507.007
Weir et al. eLife 2017;6:e28507. DOI: https://doi.org/10.7554/eLife.28507 7 of 28
Research article Cell Biology
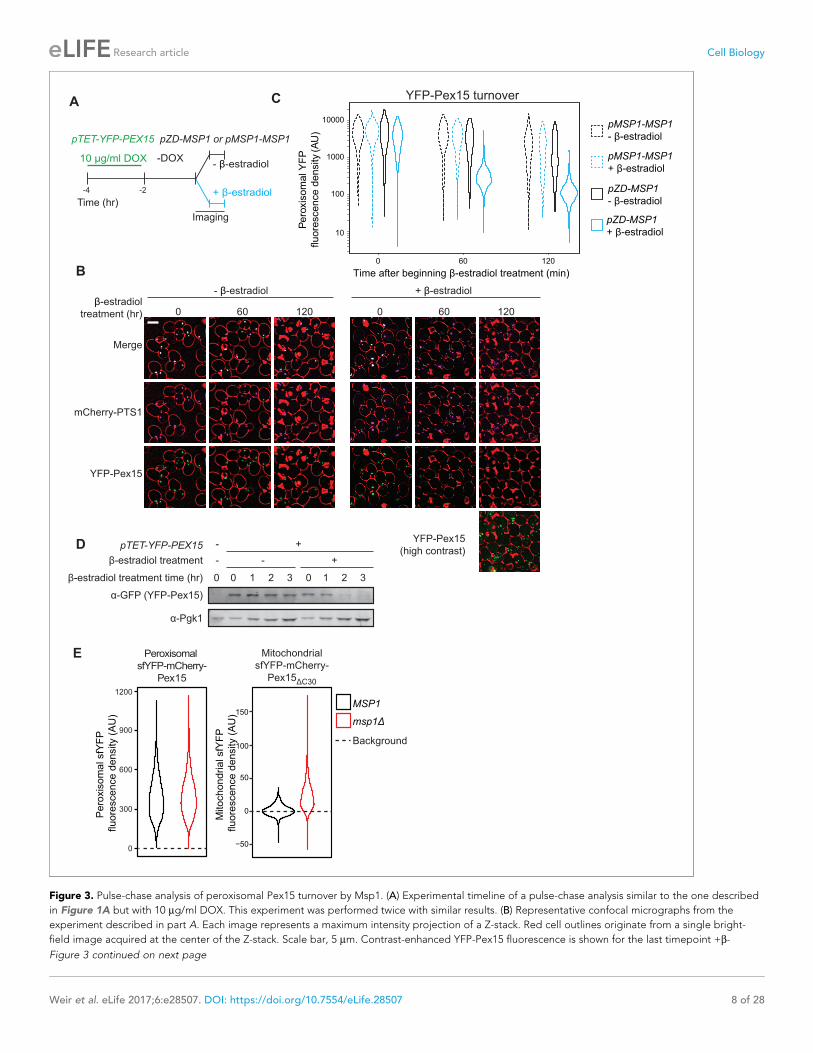
Figure 3. Pulse-chase analysis of peroxisomal Pex15 turnover by Msp1. (A) Experimental timeline of a pulse-chase analysis similar to the one described
in Figure 1A but with 10 mg/ml DOX. This experiment was performed twice with similar results. (B) Representative confocal micrographs from the
experiment described in part A. Each image represents a maximum intensity projection of a Z-stack. Red cell outlines originate from a single bright-
field image acquired at the center of the Z-stack. Scale bar, 5 mm. Contrast-enhanced YFP-Pex15 fluorescence is shown for the last timepoint +b-
Figure 3 continued on next page
Weir et al. eLife 2017;6:e28507. DOI: https://doi.org/10.7554/eLife.28507 8 of 28
Research article Cell Biology
143 min, as reported in the literature (Belle et al., 2006) (Figure 5B). Since our half-life value includes
decay due to dilution from cell division, it is likely an underestimate of the actual value.
To measure the effect of Msp1 overexpression on the age of Pex15 molecules, we N-terminally
tagged natively-expressed Pex15 with a tandem fluorescent timer (tFT-Pex15) (Figure 5—figure
supplement 1A and Khmelinskii et al., 2012) comprising a slow-maturing mCherry and a rapidly-
maturing superfolder YFP (sfYFP). On a population level, the mean ratio of mCherry to sfYFP fluores-
cence is a hyperbolic function of tFT-Pex15 age (Figure 5—figure supplement 1B and
Khmelinskii et al., 2012). In this strain background, we marked peroxisomes using mTurquoise2-
PTS1 and induced overexpression of Msp1 from a ZD promoter using b-estradiol (Figure 5A). Live-
cell confocal microscopy combined with computational image analysis revealed a progressive reduc-
tion in peroxisomal sfYFP signal following Msp1 overexpression consistent with the predictions of
both models, though with kinetics more akin to the predictions of the 2-state model (Figure 5B–C,
bottom panels). More strikingly, the peroxisomal mCherry:sfYFP fluorescence ratio was insensitive to
b-estradiol treatment, consistent with the prediction of the 2-state model (Figure 5B–C, top panels).
Collectively, our experimental evidence and theoretical analysis strongly support the existence of a
Pex15 maturation process at peroxisomes that converts newly-synthesized Pex15 molecules from an
Msp1-sensitive to an Msp1-insensitive state.
Pex3 is a Pex15-interacting protein that protects Pex15 from Msp1-dependent clearance at peroxisomesTo gain insight into the molecular basis of Pex15 maturation at peroxisomes, we hypothesized the
existence of peroxisomal proteins that interact with Pex15 and whose absence would reveal that
natively-expressed Pex15 is a latent substrate for Msp1. The cytosolic AAA proteins Pex1 and Pex6
are two prime candidates for testing this hypothesis because they form a ternary complex with
Pex15 (Birschmann et al., 2003). However, we did not observe the expected decrease in YFP-Pex15
levels in pex1D or pex6D cells that would be indicative of enhanced turnover by Msp1 (Figure 6—
figure supplement 1A). To look for additional Pex15 binding partners, we noted that the Pex1/6/15
complex is a regulator of peroxisome destruction by selective autophagy (Kamber et al., 2015;
Nuttall et al., 2014). This process is initiated by Atg36, a receptor protein bound to the peroxisomal
Figure 3 continued
estradiol to permit visualization of dim signals. (C) Quantitation of peroxisomal YFP-Pex15 fluorescence from the experiment described in part A. YFP-
Pex15 fluorescence density corresponds to the total YFP-Pex15 signal at each computationally-defined peroxisome (marked by mCherry-PTS1) divided
by the peroxisomal pixel volume (see Materials and methods for more details). Shown are violin plots of the resulting YFP-Pex15 density distributions.
Solid lines represent cells with Msp1 expression driven by the b-estradiol-inducible ZD promoter. Dashed lines represent cells with Msp1 produced
from the endogenous MSP1 promoter. These data represent analysis of 270 mock-treated and 304 b-estradiol-treated pMSP1-MSP1 cells and 219
mock-treated and 319 b-estradiol-treated pZD-MSP1 cells followed throughout the time course as well as progeny from cell divisions during the
experiment. The 515 nm laser power was decreased relative to the experiments in Figures 1 and 2 and therefore AUs are not comparable between
these experiments. (D) Immunoblot analysis of YFP-Pex15 levels after activating MSP1 expression. Whole cell lysates were prepared from cells grown as
described in part A at the indicated timepoints after initiating b-estradiol treatment, and then YFP-Pex15 protein was resolved by SDS-PAGE and
immunoblotting. Each sample was prepared from an equal volume of culture to measure turnover of YFP-Pex15 from equivalent amounts of starting
material. a-Pgk1 immunoblotting was performed as a loading control. Immunoblotting revealed no significant YFP-Pex15 turnover in the absence of
Msp1 induction, whereas the corresponding peroxisomal Pex15 levels dropped somewhat during the timecourse (compare lanes 2–5 to left Figure 3C
left panels). YFP-Pex15 dilution by cell division may explain this discrepancy. (E) Quantitation of endogenously expressed peroxisomal sfYFP-mCherry-
Pex15 (left) or mitochondrial sfYFP-mCherry-Pex15DC30 (right) sfYFP fluorescence density in wild-type and msp1D cells. Peroxisomal sfYFP fluorescence
density corresponds to the total sfYFP signal at each computationally-defined peroxisome (marked by mTurquoise2-PTS1) divided by the peroxisome
volume in pixels. Mitochondrial sfYFP fluorescence density corresponds to the total sfYFP signal at each computationally-defined mitochondrion
(marked by Tom70-mTurquoise2) divided by the mitochondrial volume in pixels. Shown are violin plots of the resulting sfYFP fluorescence density
distributions. Background represents the mean auto-fluorescence in the sfYFP channel from peroxisomes and mitochondria in strains lacking
fluorescently labeled Pex15. Background is normally distributed around the mean and therefore low-fluorescence or non-fluorescent organelles can
have negative fluorescence density after background subtraction. These data represent analysis of 941 sfYFP-mCherry-Pex15 MSP1 cells, 942 sfYFP-
mCherry-Pex15 msp1D cells, 807 sfYFP-mCherry-Pex15DC30 MSP1 cells, and 918 sfYFP-mCherry-Pex15
DC30 msp1D cells.
DOI: https://doi.org/10.7554/eLife.28507.010
The following figure supplement is available for figure 3:
Figure supplement 1. Supporting evidence that Msp1 induces turnover of overexpressed Pex15 at peroxisomes.
DOI: https://doi.org/10.7554/eLife.28507.011
Weir et al. eLife 2017;6:e28507. DOI: https://doi.org/10.7554/eLife.28507 9 of 28
Research article Cell Biology

Pex15
Synthesis and
targeting
Degradationkdecay
Nascent
Pex15
Synthesis and
targeting
Degradation
Maturation
kmat
kdecay,1
kdecay,2
Mature
Pex15
1-state model 2-state modelA B
F
Time (hr)
-6 -2
-DOX- -estradiol
+ -estradiol
pTET-YFP-pex15 pZD-MSP1C
Imaging
Time (hr)
-4 -2
-DOX- -estradiol
+ -estradiol
pTET-YFP-PEX15 pZD-MSP1
E
Imaging
0
0 60 90 120
ran
sfo
rme
d p
ero
xis
om
al Y
FP
flu
ore
sce
nce
de
nsity n
orm
aliz
ed
to
t =
0
YFP-Pex15 turnover
One-state model fits
Two-state model fits
0
0 15 45
ran
sfo
rme
d m
ito
ch
on
dri
al Y
FP
flu
ore
sce
nce
de
nsity n
orm
aliz
ed
to
t =
0
YFP-Pex15 turnoverD
YFP-Pex15 YFP-Pex15
0
0.1
0.2
Diffe
ren
ce
in
are
a u
nd
er
fits
ho
ur
G
0
0 15 45
Time after beginningLo
g-t
ran
sfo
rme
d Y
FP
flu
ore
sce
nce
de
nsity n
orm
aliz
ed
to
t =
0
YFP-Pex15
(peroxisomes)
YFP-Pex15
(mitochondria)
Figure 4. Experimental and theoretical evidence for the 2-state model of Pex15 turnover at peroxisomes. (A) The apparent difference in the kinetic
profiles of Msp1-induced substrate turnover at peroxisomes (Pex15) versus mitochondria (Pex15DC30). These data represent quantitation of data from
the experiments described in Figure 2 (YFP-Pex15DC30) and additional timepoints from the experiment described in Figure 3 (YFP-Pex15). YFP signal
density at mitochondria (red) or peroxisomes (purple) is plotted after normalization to the 0 hr timepoint, with lines directly connecting timepoints. Error
Figure 4 continued on next page
Weir et al. eLife 2017;6:e28507. DOI: https://doi.org/10.7554/eLife.28507 10 of 28
Research article Cell Biology

membrane protein Pex3 (Motley et al., 2012). Consistent with a previously published split-ubiquitin
assay for detecting protein-protein interactions (Eckert and Johnsson, 2003), we found that Pex15
interacts with Pex3 by co-immunoprecipitation analysis (Figure 6A). Before we could test if Pex3
protects Pex15 from Msp1-dependent turnover, we had to overcome a major technical challenge.
Specifically, Pex3 is essential for targeting of numerous peroxisomal membrane proteins, which is
why pex3D cells lack functional peroxisomes (Fang et al., 2004). Since Pex3 is normally turned over
very slowly (Figure 6—figure supplement 1D and Belle et al., 2006), promoter shut-off is not a suit-
able method for acutely depleting Pex3. Instead, we exploited an established Auxin-inducible degra-
dation system to rapidly eliminate Pex3 from peroxisomes in situ. First, we appended a tandem V5
epitope tag followed by an Auxin-inducible degron sequence (Nishimura et al., 2009) to the cyto-
solic C-terminus of Pex3 (Pex3-V5-AID). Next, we overexpressed an E3 ubiquitin ligase from rice
(OsTir1) that binds and ubiquitinates Auxin-bound AID to enable degradation of AID fusions by the
proteasome (Nishimura et al., 2009). Immunoblotting analysis for the V5 epitope revealed that
Auxin addition induced rapid Pex3 destruction, which was dependent on OsTir1 expression and
independent of Msp1 (Figure 6—figure supplement 1B–E). Importantly, microscopic analysis of
cells co-expressing Pex3-GFP-AID and mCherry-PTS1 revealed that peroxisomes persisted for hours
following Pex3 destruction (Figure 6—figure supplement 1B).
We next introduced the Pex3 AID system into either wild-type or msp1D cells with endogenously
expressed tFT-Pex15. To monitor changes in peroxisomal sfYFP fluorescence density after Pex3
depletion we again used live-cell confocal microscopy combined with computational image analysis
(Figure 6B). Strikingly, we observed that Pex3 degradation immediately increased the rate of Msp1-
dependent Pex15 turnover (Figure 6C), thus unmasking endogenous Pex15 as a latent substrate. By
contrast, Pex3 degradation did not result in Msp1-dependent destabilization of Pex11 and Pex12,
two peroxisomal membrane proteins we analyzed as controls for the substrate specificity of Msp1
(Figure 6—figure supplement 1I–J). We observed a similar phenomenon in cells overexpressing
YFP-Pex15, albeit to a lesser extent, possibly because of excess YFP-Pex15 relative to endogenous
Pex3 prior to Auxin addition (Figure 6—figure supplement 1F–H). Consistent with this idea, consti-
tutive overexpression of Pex3 from the strong TDH3 promoter blunted the effect of de novo Msp1
induction on transiently overexpressed YFP-Pex15 (Figure 6D–E). Taken together, these data argue
that Pex3 stoichiometrically protects Pex15 from Msp1 recognition at peroxisomes.
Organelle-restricted Pex15 clearance by Msp1 with artificialtransmembrane anchorsA recent study showed that GFP fused to the TMS of the mammalian Msp1 homolog ATAD1 is tar-
geted to both mitochondria and peroxisomes (Liu et al., 2016). This suggests that the TMS of Msp1 is
Figure 4 continued
bars represent standard error of the mean. These data are reproduced in parts D and F. (B) Schematics of the two competing models for Pex15
turnover. In the 1-state model, newly-synthesized Pex15 is first targeted and inserted into the peroxisome membrane and then degraded by a simple
exponential decay process that occurs with the rate constant kdecay. In the 2-state model, there is an additional exponential maturation process that
converts Pex15 from a nascent state to a mature state at a rate defined by kmat. In addition, this model includes the new exponential decay constant
kdecay,2 for the mature Pex15 state that is distinct from the kdecay,1 of the nascent state. (C) Experimental timeline of the staged expression experiment
for monitoring Msp1-dependent turnover of mitochondrial Pex15DC30 with high temporal resolution. (D) Quantitation of mitochondrial YFP-Pex15
DC30
fluorescence from the experiment described in part C. YFP signal density at mitochondria was determined as described in Figure 1 and plotted after
normalization to the 0 hr timepoint. Error bars represent standard error of the mean. Data were fitted to the competing models described in part B as
indicated (See Materials and methods for model fitting details). See Figure 4—figure supplement 1A for fit parameters. (E) Experimental timeline of
the staged expression experiment for monitoring Msp1-dependent turnover of peroxisomal Pex15 with high temporal resolution. This experiment was
performed twice with similar results. (F) Quantitation of peroxisomal YFP-Pex15 fluorescence from the experiment described in part E. YFP signal
density at peroxisomes was determined as described in Figure 3C and plotted as in part D. See Figure 4—figure supplement 1A for fit parameters.
See Figure 4—figure supplement 1B for a similar plot containing only 0–45 min timepoints as plotted for YFP-Pex15DC30 in part D. (G) Area between
the 1-state and 2-state fits shown in parts D and F. See Materials and methods for details. Total area between curves is divided by time to normalize
between fits from different time scales.
DOI: https://doi.org/10.7554/eLife.28507.012
The following figure supplement is available for figure 4:
Figure supplement 1. Supporting evidence for the 2-state model of Pex15 turnover at peroxisomes.
DOI: https://doi.org/10.7554/eLife.28507.013
Weir et al. eLife 2017;6:e28507. DOI: https://doi.org/10.7554/eLife.28507 11 of 28
Research article Cell Biology

an ambiguous targeting signal whose function is to localize the rest of Msp1 into proximity with its sub-
strates. To explore this issue, we first attempted to restrict Msp1 to either mitochondria or peroxi-
somes by replacing Msp1’s TMS with the signal anchor of Tom70 (Tom70TMS-Msp1), a mitochondrial
outer membrane resident, or the transmembrane peroxisomal targeting signal of Pex22 (Pex22TMS-
Msp1), respectively (Figure 7A). Indeed, Tom70TMS-Msp1-YFP produced from the MSP1 promoter is
primarily localized to mitochondria with some residual localization to peroxisomes, whereas Pex22TMS-
Msp1-YFP was exclusively localized to peroxisomes (Figure 7B and Figure 7—figure supplement
1A). Next, we monitored the ability of these Msp1 chimeras to suppress mitochondrial accumulation
of tFT-Pex15DC30 in cells lacking wild type Msp1 and found that Tom70TMS-Msp1 was fully functional,
whereas Pex22TMS-Msp1 was unable to complement themsp1D phenotype (Figure 7C and Figure 7—
figure supplement 1B). Lastly, we monitored clearance of excess peroxisomal YFP-Pex15 following
de novo induction of Msp1 chimaeras (Figure 7D). This analysis revealed that Pex22TMS-Msp1
enhanced substrate turnover more robustly than Tom70TMS-Msp1 (Figure 7E), which we can simply
explain by its relatively higher peroxisome abundance (Figure 7B). These data lead us to speculate
that the Msp1 AAA domain (with its juxtamembrane region) initiates substrate clearance by directly
binding to substrate regions at the interface between the aqueous cytosol and the lipid core.
DiscussionErrors in TA protein targeting by the GET pathway pose a constant threat to mitochondrial health.
Two recent studies revealed that yeast Msp1 (ATAD1 in humans), a AAA membrane protein resident
on the surface of mitochondria and peroxisomes, is part of a conserved mechanism for preventing
mistargeted TA proteins from accumulating in mitochondria (Chen et al., 2014b; Okreglak and
Walter, 2014). At the same time, this pioneering work raised an important question about Msp1’s
substrate selectivity: What distinguishes TA proteins mistargeted to mitochondria from TA proteins
native to mitochondria and peroxisomes?
Here, we answer this question as it pertains to Pex15, a native peroxisomal TA protein known to
be an Msp1 substrate when mistargeted to mitochondria (Chen et al., 2014b; Okreglak and Wal-
ter, 2014). As our starting point, we coupled live-cell quantitative microscopy with two orthogonal
drug-inducible gene-expression systems to show that de novo induction of Msp1 activity clears a
fully-integrated Pex15 variant from mitochondria (Figure 7). This result solidifies the working model
in the literature that Msp1 is a mechanoenzyme capable of extracting its substrates from the mem-
brane (Chen et al., 2014b; Okreglak and Walter, 2014; Wohlever et al., 2017). We were also able
to reveal that peroxisomal Pex15 is a latent Msp1 substrate at peroxisomes. The key starting obser-
vation that led us to this conclusion was that Pex15 overexpressed at peroxisomes was turned over
by an unusual non-exponential process, which depended on Msp1 induction. By model fitting of
these data and comparative analysis with the exponential decay of mitochondrial Pex15, we found
evidence for a Pex15 maturation mechanism unique to peroxisomes. By positing that this mechanism
converts newly-resident peroxisomal Pex15 from an initial Msp1-sensitive state to an Msp1-resistant
state, we were able to account for the non-exponential decay kinetics (Figure 8). Moreover, we vali-
dated a key prediction of this mechanism by showing that Msp1 selectively removes peroxisomal
Pex15 from the young end of its molecular age distribution. More broadly, a testable hypothesis
that emerges as an extension of our work is that native mitochondrial TA proteins are latent sub-
strates normally shielded from Msp1 by maturation mechanisms specific to mitochondria.
The precise molecular mechanism by which Pex15 matures into an Msp1-resistant state remains
to be worked out. However, our evidence strongly argues that complex assembly between Pex15
and the peroxisomal membrane protein Pex3 is a critical component of this process. Pex3 has been
previously shown to play a role in the insertion of peroxisomal membrane proteins (Fang et al.,
2004). Thus, it is possible that loss of Pex3 function leads to indirect loss of another membrane pro-
tein that itself blocks Msp1-dependent turnover of Pex15. We cannot formally exclude this possibility
but we find it unlikely for three reasons. First, we showed that Pex3 co-immunoprecipitates with
Pex15. Thus, in principle, Pex3 could physically occlude an Msp1 binding site on Pex15 or make
Pex15 structurally more resistant to mechanodisruption. Second, we showed that rapid degradation
of Pex3 causes a near-instantaneous increase in the rate of Msp1-dependent Pex15 clearance from
peroxisomes without destabilizing two control peroxisomal membrane proteins. Third, we found
that overproduction of Pex3 increased protection of overexpressed Pex15 from Msp1-dependent
Weir et al. eLife 2017;6:e28507. DOI: https://doi.org/10.7554/eLife.28507 12 of 28
Research article Cell Biology

turnover at peroxisomes. Our results do not rule out the possibility that additional binding partners
of Pex15, such as certain components of the importomer for peroxisomal matrix proteins
(Rosenkranz et al., 2006), confer protection from Msp1. More broadly, a simple extension of our
working model for Msp1 substrate selectivity leads to the intriguing hypothesis that native mitochon-
drial TA proteins are shielded from Msp1 by their binding partners. The microscopy methodology
we have described here will facilitate testing of this idea in the near future.
Lastly, our work adds Msp1 to the growing class of proteostasis pathways that mediate degrada-
tion of excess subunits of soluble (Sung et al., 2016) and transmembrane complexes (Kihara et al.,
1995; Lippincott-Schwartz et al., 1988; Westphal et al., 2012). Interestingly, Msp1 is expressed at
a relatively low level (Ghaemmaghami et al., 2003) and its prolonged overexpression induces severe
growth defects (data not shown). This raises the possibility that superphysiological levels of Msp1
are detrimental because they reduce the abundance of undefined protein complexes via hypervigi-
lant membrane clearance of immature subunits and complex assembly intermediates. Future tests of
this idea using proteome-wide approaches have the potential to define the full breadth of Msp1’s
role in maintaining protein complex homeostasis.
Materials and methods
Key resources table
Reagent type (species)or resource Designation
Source orreference Identifiers Additional information
strain, strain background(S. cerevisiae)
BY4741 PMID: 9483801
strain, strain background(S. cerevisiae)
BY4741 trp1D::pTDH3-mTURQUOISE2-PTS1-SpHIS5
This paper Euroscarf:VDY3349
strain, strain background (S. cerevisiae) BY4741 trp1D::pTDH3-mTURQUOISE2-PTS1-SpHIS5ura3D::pPEX15-sfYFP-mCHERRY-PEX15-tPEX15-KANMX
This paper Euroscarf:VDY3350
strain, strain background(S. cerevisiae)
BY4741 trp1D::pTDH3-mTURQUOISE2-PTS1-SpHIS5ura3D::pPEX15-sfYFP-mCHERRY-PEX15-tPEX15-KANMXmsp1D::HPHMX
This paper Euroscarf:VDY3351
strain, strain background(S. cerevisiae)
BY4741 trp1D::pTDH3-mTURQUOISE2-PTS1-SpHIS5ura3D::pPEX15-sfYFP-mCHERRY-PEX15-tPEX15-KANMXCgLEU2-Z4EV-pZD-MSP1
This paper Euroscarf:VDY3352
strain, strain background(S. cerevisiae)
BY4741 trp1D::pTDH3-mTURQUOISE2-PTS1-SpHIS5ura3D::pPEX15-sfYFP-mCHERRY-PEX15-tPEX15-KANMX pex15D::URA
This paper Euroscarf:VDY3516
strain, strain background(S. cerevisiae)
BY4741 trp1D::pTDH3-mTURQUOISE2-PTS1-SpHIS5ura3D::pPEX15-sfYFP-mCHERRY-PEX15-tPEX15-KANMXpex15D::URA msp1D::HPHMX PEX3-3FLAG-NATMX
This paper Euroscarf:VDY3518
strain, strain background(S. cerevisiae)
BY4741 trp1D::pTDH3-mTURQUOISE2-PTS1-SpHIS5pex15D::URAmsp1D::HPHMXPEX3-3FLAG-NATMX
This paper Euroscarf:VDY3519
strain, strain background(S. cerevisiae)
BY4741 TOM70-mTURQUOISE2-SpHIS5
This paper Euroscarf:VDY3354
Weir et al. eLife 2017;6:e28507. DOI: https://doi.org/10.7554/eLife.28507 13 of 28
Research article Cell Biology

strain, strain background(S. cerevisiae)
BY4741 TOM70-mTURQUOISE2-SpHIS5ura3D::pPEX15-sfYFP-mCHERRY-pex15
DC30-tPEX15-KANMX
This paper Euroscarf:VDY3355
strain, strain background(S. cerevisiae)
BY4741 TOM70-mTURQUOISE2-SpHIS5ura3D::pPEX15-sfYFP-mCHERRY-pex15
DC30-tPEX15-KANMX msp1D::HPHMX
This paper Euroscarf:VDY3356
strain, strain background(S. cerevisiae)
BY4741 TOM70-mTURQUOISE2-SpHIS5trp1D::pTDH3-mCHERRY-PTS1-CgURA3
This paper Euroscarf:VDY3357
strain, strain background(S. cerevisiae)
BY4741 TOM70-mTURQUOISE2-SpHIS5trp1D::pTDH3-mCHERRY-PTS1-CgURA3 MSP1-YFP-KANMX
This paper Euroscarf:VDY3358
strain, strain background(S. cerevisiae)
BY4741 TOM70-mTURQUOISE2-SpHIS5trp1D::pTDH3-mCHERRY-PTS1-CgURA3 CgLEU2-Z4EV-pZD-MSP1-YFP-KANMX
This paper Euroscarf:VDY3359
strain, strain background(S. cerevisiae)
BY4741 TOM70-mTURQUOISE2-SpHIS5trp1D::pTDH3-mCHERRY-PTS1-CgURA3 CgLEU2-Z4EV-pZD-MSP1
This paper Euroscarf:VDY3360
strain, strain background(S. cerevisiae)
BY4741 trp1D::pTDH3-mCHERRY-PTS1-CgURA3YFP-PEX15-tPEX15-KANMX
This paper Euroscarf:VDY3001
strain, strain background(S. cerevisiae)
BY4741 TOM70-mTURQUOISE2-SpHIS5trp1D::pTDH3-mCHERRY-PTS1-CgURA3ura3D::CgTRP1-rTA-pTET-YFP-PEX15-tPEX15
This paper Euroscarf:VDY3607
strain, strain background(S. cerevisiae)
BY4741 TOM70-mTURQUOISE2-SpHIS5trp1D::pTDH3-mCHERRY-PTS1-CgURA3CgLEU2-Z4EV-pZD-MSP1ura3D::CgTRP1-rTA-pTET-YFP-PEX15-tPEX15
This paper Euroscarf:VDY3527
strain, strain background(S. cerevisiae)
BY4741 TOM70-mTURQUOISE2-SpHIS5trp1D::pTDH3-mCHERRY-PTS1-CgURA3CgLEU2-Z4EV-pZD-MSP1ura3D::CgTRP1-rTA-pTET-YFP-PEX15-tPEX15NATMX-pTDH3-PEX3
This paper Euroscarf:VDY3608
strain, strain background(S. cerevisiae)
BY4741 TOM70-mTURQUOISE2-SpHIS5trp1D::pTDH3-mCHERRY-PTS1-CgURA3 CgLEU2-Z4EV-pZD-MSP1 ura3D::CgTRP1-rTA-pTET-YFP-pex15
DC30-tPEX15
This paper Euroscarf:VDY3362
strain, strain background(S. cerevisiae)
BY4741 TOM70-mTURQUOISE2-SpHIS5trp1D::pTDH3-mCHERRY-PTS1-CgURA3CgLEU2-Z4EV-pZD-MSP1ura3D::CgTRP1-rTA-pTET-YFP-pex15
DC30-V5-tPEX15
This paper Euroscarf:VDY3412
Weir et al. eLife 2017;6:e28507. DOI: https://doi.org/10.7554/eLife.28507 14 of 28
Research article Cell Biology

strain, strain background(S. cerevisiae)
BY4741 trp1D::pTDH3-mCherry-PTS1::HPHMX,Pex3-GFP-AID-HIS3M � 6leu2D::pTDH3-OsTIR1-CgLEU2
This paper Euroscarf:VDY2837
strain, strain background(S. cerevisiae)
BY4741 PEX3-V5-AID-KANMX This paper Euroscarf:VDY2770
strain, strain background(S. cerevisiae)
BY4741 PEX3-V5-AID-KANMXleu2D::pTDH3-OsTIR1-CgLEU2
This paper Euroscarf:VDY2773
strain, strain background(S. cerevisiae)
BY4741 PEX3-V5-AID-KANMXleu2D::pTDH3-OsTIR1-CgLEU2msp1D::HIS
This paper Euroscarf:VDY3399
strain, strain background(S. cerevisiae)
BY4741 TOM70-mTURQUOISE2-SpHIS5trp1D::pTDH3-mCHERRY-PTS1-CgURA3 ura3D::CgTRP1-rTA-pTET-YFP-PEX15-tPEX15PEX3-V5-AID-KANMXleu2D::pTDH3-OsTIR1-CgLEU2
This paper Euroscarf:VDY3363
strain, strain background(S. cerevisiae)
BY4741 TOM70-mTURQUOISE2-SpHIS5trp1D::pTDH3-mCHERRY-PTS1-CgURA3 ura3D::CgTRP1-rTA-pTET-YFP-PEX15-tPEX15PEX3-V5-AID-KANMXleu2D::pTDH3-OsTIR1-CgLEU2 msp1D::HPHMX
This paper Euroscarf:VDY3364
strain, strain background(S. cerevisiae)
BY4741 PEX11-mTURQUOISE2-SpHIS5
This paper Euroscarf:VDY3444
strain, strain background(S. cerevisiae)
BY4741 PEX11-mTURQUOISE2-SpHIS5ura3D::pPEX15-sfYFP-mCHERRY-PEX15-tPEX15-KANMX
This paper Euroscarf:VDY3445
strain, strain background(S. cerevisiae)
BY4741 PEX11-mTURQUOISE2-SpHIS5ura3D::pPEX15-sfYFP-mCHERRY-PEX15-tPEX15-KANMX pex1D::NATMX
This paper Euroscarf:VDY3446
strain, strain background(S. cerevisiae)
BY4741 PEX11-mTURQUOISE2-SpHIS5ura3D::pPEX15-sfYFP-mCHERRY-PEX15-tPEX15-KANMX pex6D::URA
This paper Euroscarf:VDY3447
strain, strain background(S. cerevisiae)
BY4741 PEX3-V5-AID-KANMXtrp1D::pTDH3-mTURQUOISE2-PTS1-SpHIS5
This paper Euroscarf:VDY3528
strain, strain background(S. cerevisiae)
BY4741 PEX3-V5-AID-KANMXtrp1D::pTDH3-mTURQUOISE2-PTS1-SpHIS5leu2D::pTDH3-OsTIR1-CgLEU2
This paper Euroscarf:VDY3529
strain, strain background(S. cerevisiae)
BY4741 PEX3-V5-AID-KANMXtrp1D::pTDH3-mTURQUOISE2-PTS1-SpHIS5PEX11-sfYFP-mCHERRY-CgURA3leu2D::pTDH3-OsTIR1-CgLEU2
This paper Euroscarf:VDY3609
strain, strain background(S. cerevisiae)
BY4741 PEX3-V5-AID-KANMXtrp1D::pTDH3-mTURQUOISE2-PTS1-SpHIS5PEX11-sfYFP-mCHERRY-CgURA3leu2D::pTDH3-OsTIR1-CgLEU2 msp1D::HPHMX
This paper Euroscarf:VDY3610
Weir et al. eLife 2017;6:e28507. DOI: https://doi.org/10.7554/eLife.28507 15 of 28
Research article Cell Biology

strain, strain background(S. cerevisiae)
BY4741 PEX3-V5-AID-KANMXtrp1D::pTDH3-mTURQUOISE2-PTS1-SpHIS5PEX12-sfYFP-mCHERRY-CgURA3 leu2D::pTDH3-OsTIR1-CgLEU2
This paper Euroscarf:VDY3611
strain, strain background(S. cerevisiae)
BY4741 PEX3-V5-AID-KANMXtrp1D::pTDH3-mTURQUOISE2-PTS1-SpHIS5PEX12-sfYFP-mCHERRY-CgURA3leu2D::pTDH3-OsTIR1-CgLEU2 msp1D::HPHMX
This paper Euroscarf:VDY3612
strain, strain background(S. cerevisiae)
BY4741 PEX3-V5-AID-URAtrp1D::pTDH3-mTURQUOISE2-PTS1-SpHIS5ura3D::pPEX15-sfYFP-mCHERRY-PEX15-tPEX15-KANMX
This paper Euroscarf:VDY3615
strain, strain background(S. cerevisiae)
BY4741 PEX3-V5-AID-URAtrp1D::pTDH3-mTURQUOISE2-PTS1-SpHIS5ura3D::pPEX15-sfYFP-mCHERRY-PEX15-tPEX15-KANMX msp1D::HPHMX
This paper Euroscarf:VDY3616
strain, strain background(S. cerevisiae)
BY4741 PEX3-V5-AID-URAtrp1D::pTDH3-mTURQUOISE2-PTS1-SpHIS5ura3D::pPEX15-sfYFP-mCHERRY-PEX15-tPEX15-KANMX leu2D::pTDH3-OsTIR1-CgLEU2
This paper Euroscarf:VDY3613
strain, strain background(S. cerevisiae)
BY4741 PEX3-V5-AID-URAtrp1D::pTDH3-mTURQUOISE2-PTS1-SpHIS5ura3D::pPEX15-sfYFP-mCHERRY-PEX15-tPEX15-KANMXleu2D::pTDH3-OsTIR1-CgLEU2 msp1D::HPHMX
This paper Euroscarf:VDY3614
strain, strain background(S. cerevisiae)
BY4741 TOM70-mTURQUOISE2-SpHIS5trp1D::pTDH3-mCHERRY-PTS1-CgURA3PEX22TMS-MSP1-YFP
This paper Euroscarf:VDY3617
strain, strain background(S. cerevisiae)
BY4741 TOM70-mTURQUOISE2-SpHIS5trp1D::pTDH3-mCHERRY-PTS1-CgURA3 TOM70TMS-MSP1-YFP
This paper Euroscarf:VDY3618
strain, strain background(S. cerevisiae)
BY4741 TOM70-mTURQUOISE2-SpHIS5ura3D::pPEX15-sfYFP-mCHERRY-pex15
DC30-tPEX15-KANMX PEX22TMS-MSP1
This paper Euroscarf:VDY3619
strain, strain background(S. cerevisiae)
BY4741 TOM70-mTURQUOISE2-SpHIS5ura3D::pPEX15-sfYFP-mCHERRY-pex15
DC30-tPEX15-KANMXTOM70TMS-MSP1
This paper Euroscarf:VDY3620
strain, strain background(S. cerevisiae)
BY4741 TOM70-mTURQUOISE2-SpHIS5trp1D::pTDH3-mCHERRY-PTS1-CgURA3CgLEU2-Z4EV-pZD-PEX22TMS-MSP1ura3D::CgTRP1-rTA-pTET-YFP-PEX15-tPEX15
This paper Euroscarf:VDY3621
Weir et al. eLife 2017;6:e28507. DOI: https://doi.org/10.7554/eLife.28507 16 of 28
Research article Cell Biology
strain, strain background(S. cerevisiae)
BY4741 TOM70-mTURQUOISE2-SpHIS5trp1D::pTDH3-mCHERRY-PTS1-CgURA3CgLEU2-Z4EV-pZD-TOM70TMS-MSP1ura3D::CgTRP1-rTA-pTET-YFP-PEX15-tPEX15
This paper Euroscarf:VDY3622
antibody Mouse anti-V5 monoclonal Invitrogen Cat #R960
antibody Mouse anti-FLAGmonoclonal (M2)
Sigma Cat #F3165
antibody Mouse anti-mCherrymonoclonal (1C51)
Novus Cat #NBP1-96752
antibody Mouse anti-Pgk1monoclonal
Thermo Fisher Cat #459250
antibody Rabbit anti-Hsc82polyclonal
Abcam Cat #ab30920
antibody Rabbit anti-Sdh4polyclonal
Pfanner Lab Kind giftof N. Pfanner
antibody Mouse anti-GFPmonoclonal
Sigma Cat # 11814460001
antibody Goat anti-mouse IgG(H + L)-HRP conjugatedsecondary
Bio-Rad Cat #170–6515
recombinantDNA reagent
pKT211 (pKT-YFP-SpHIS5) (plasmid)
PMID: 15197731
recombinantDNA reagent
pKT-mTURQUOISE2-SpHIS5 (plasmid)
This paper
recombinantDNA reagent
pKT-pTDH3-mTURQUOISE2-SpHIS5 (plasmid)
This paper
recombinantDNA reagent
pKT-pTDH3-mCHERRY-CgURA3 (plasmid)
This paper
recombinantDNA reagent
pNH604-rTA-pTET-YFP-PEX15 (plasmid)
This paper
recombinantDNA reagent
pNH604-rTA-pTET-YFP-pex15DC30 (plasmid)
This paper
recombinantDNA reagent
pFA6a-pPEX15-sfYFP-mCHERRY-PEX15-KANMX (plasmid)
This paper
recombinantDNA reagent
pFA6a-pPEX15-sfYFP-mCHERRY-pex15DC30-KANMX (plasmid)
This paper
recombinantDNA reagent
pFA6a-V5-AID-KANMX (plasmid)
PMID: 27798238
recombinantDNA reagent
pFA6a-V5-AID-URA3 (plasmid)
PMID: 27798238
recombinantDNA reagent
pFA6a-GFP-AID-HIS3M � 6 (plasmid)
PMID: 27798238
recombinantDNA reagent
pNH605-OsTIR1(plasmid)
PMID: 27798238
recombinantDNA reagent
pNH605-Z4EV-pZD(plasmid)
This study
recombinantDNA reagent
p3FLAG-NATMX (plasmid) PMID: 17719544
peptide,recombinant protein
Proteinase K Sigma Cat #3115879001
commercialassay or kit
SuperSignal WestFemto Substrate
Thermo Fisher Cat #34095
Weir et al. eLife 2017;6:e28507. DOI: https://doi.org/10.7554/eLife.28507 17 of 28
Research article Cell Biology

chemicalcompound, drug
3-indoleacetic acid(Auxin)
Sigma Cat #I3750
chemicalcompound, drug
b-Estradiol Sigma Cat #E8875
chemicalcompound, drug
Doxycycline Sigma Cat #D3447
chemicalcompound, drug
Cycloheximide Sigma Cat #C7698
chemicalcompound, drug
Concanavalin A MP Biomedicals Cat #2195283
chemicalcompound, drug
3 � FLAG peptide Sigma Cat #F4799
chemicalcompound, drug
Complete ProteaseInhibitor Cocktail, EDTA-free
Sigma Cat #5056489001
chemicalcompound, drug
Phenylmethylsulfonylfluoride Sigma Cat #78830
software,algorithm
R 3.3.0 R foundationfor StatisticalComputing
www.R-project.org/
software,algorithm
ggplot2 R package Hadley Wickham www.ggplot2.org/
software,algorithm
reshape2 R package Hadley Wickham www.CRAN.R-project.org/package=reshape2
software,algorithm
gridExtra R package Baptiste Auguie www.CRAN.R-project.org/package=gridExtra
software,algorithm
readr R package Hadley Wickham,Jim Hester,Roman Francois
www.CRAN.R-project.org/package=readr
software,algorithm
plyr R package Hadley Wickham www.CRAN.R-project.org/package=plyr
software,algorithm
Cairo R package Simon UrbanekandJeffrey Horner
www.CRAN.R-project.org/package=Cairo
software,algorithm
minpack.lm Rpackage
Timur V. Elzhov,Katharine M.Mullen,Andrej-NikolaiSpiess, BenBolker
www.CRAN.R-project.org/package=minpack.lm
software,algorithm
Python 3.5.2 Python SoftwareFoundation
www.python.org/
software,algorithm
scipy Pythonpackage
Open source www.scipy.org/
software,algorithm
numpy Pythonpackage
Open source www.numpy.org/
software,algorithm
scikit-imagePython package
Open source www.scikit-image.org/
software,algorithm
pyto_segmenterPython package
This paper https://github.com/deniclab/pyto_segmenter
software,algorithm
Various Python andR analysis scripts
This paper https://github.com/deniclab/Weir_2017_Analysis
Yeast strain constructionAll S. cerevisiae gene deletion and tagged strains were constructed using standard homologous
recombination methods (Longtine et al., 1998) and are listed in the Key resources table. Cassettes
Weir et al. eLife 2017;6:e28507. DOI: https://doi.org/10.7554/eLife.28507 18 of 28
Research article Cell Biology

for fluorescent protein tagging at genes’ endogenous loci were PCR amplified from the pKT vector
series (Sheff and Thorn, 2004). Tandem fluorescent timer-tagged Pex15 was expressed from a
transgene integrated at the ura3 locus. Fluorescent peroxisome markers, expressed as transgenes
from the TRP1 locus, were generated by creating pKT plasmid variants containing the S. cerevisiae
TDH3 promoter upstream of a gene encoding a fluorescent protein with an engineered PTS1
sequence (Serine-Lysine-Leucine-stop). Strains with b-estradiol-induced Msp1 expression were made
by homologous recombination of a 5’ LEU2-marked Z4EV expression cassette with a 3’ Z4EV-driven
Figure 5. Experimental measurement of Pex15 levels and age after Msp1 activation compared to theoretical
modeling. (A) Schematic of the staged expression experiment for monitoring turnover of sfYFP-mCherry-Pex15
expressed from the native genomic PEX15 promoter following Msp1 overexpression. (B) Simulations of mCherry/
sfYFP ratio (top) and Pex15 decay (bottom) as a function of time following Msp1 activation in a 1-state or 2-state
regime. Different colors show Pex15 dynamics resulting from the indicated theoretical half-life parameters. See
Materials and methods for simulation details. (C) Experimentally measured mCherry/sfYFP ratio (top) and sfYFP
density decay (bottom) from the experiment described in part B. Error bars represent standard error of the mean.
Greater than 100 cells were imaged for each sample at each time point, and different fields of cells were imaged
at each time point to minimize photobleaching. This experiment was performed twice with similar results.
DOI: https://doi.org/10.7554/eLife.28507.014
The following figure supplement is available for figure 5:
Figure supplement 1. Supporting information for tandem fluorescent timer-tagged Pex15.
DOI: https://doi.org/10.7554/eLife.28507.015
Weir et al. eLife 2017;6:e28507. DOI: https://doi.org/10.7554/eLife.28507 19 of 28
Research article Cell Biology
+
+
-
+
+
-
*
+
+
-
+
+
-
+
+
-
+
+
-
+
+
-
+
+
-
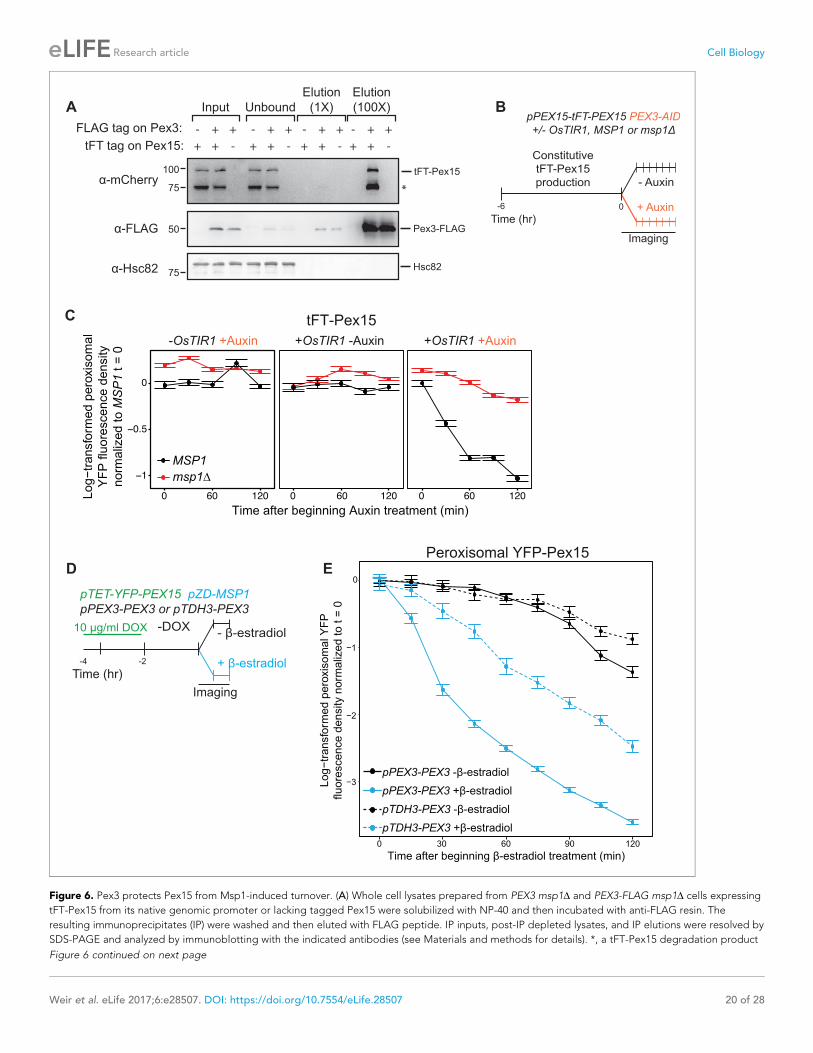
Figure 6. Pex3 protects Pex15 from Msp1-induced turnover. (A) Whole cell lysates prepared from PEX3 msp1D and PEX3-FLAG msp1D cells expressing
tFT-Pex15 from its native genomic promoter or lacking tagged Pex15 were solubilized with NP-40 and then incubated with anti-FLAG resin. The
resulting immunoprecipitates (IP) were washed and then eluted with FLAG peptide. IP inputs, post-IP depleted lysates, and IP elutions were resolved by
SDS-PAGE and analyzed by immunoblotting with the indicated antibodies (see Materials and methods for details). *, a tFT-Pex15 degradation product
Figure 6 continued on next page
Weir et al. eLife 2017;6:e28507. DOI: https://doi.org/10.7554/eLife.28507 20 of 28
Research article Cell Biology
(ZD) promoter (McIsaac et al., 2013) upstream of the endogenous MSP1 ORF. Similar cassettes
were constructed for yeast expression of Pex221-35-Msp132-362 protein and Msp11-12-Tom7012-29-
Msp128-362 from the endogenous MSP1 locus. Strains with doxycycline-induced expression of Pex15
variants were made by homologous recombination of a 5’ CgTRP1-marked expression cassette the
G76V variant of the reverse tetracycline transactivator (rTA) (Roney et al., 2016) with a 3’ GAL1 pro-
moter variant altered for control by rTA driving expression of the YFP ORF (lacking a stop codon)
fused to the PEX15 ORF or mutant variant, and followed by the PEX15 terminator. This cassette was
integrated into the ura3 locus of strains as indicated in the strain table. PEX3-FLAG was generated
by integrating a previously described C-terminal 3 � FLAG tagging cassette (Denic and Weissman,
2007).
Immunoblotting analysisYeast cultures were grown overnight to 0.8 OD600 units at 30˚C in YEPD (1% yeast extract (BD Bio-
sciences, San Jose, CA), 2% bacto-peptone (BD Biosciences), 2% glucose (Sigma, St. Louis, MO))
and treated with 3-indoleacetic acid (auxin, 500 mM) (Sigma), cycloheximide (100 mg/mL) (Sigma) or
DMSO vehicle as indicated. Cells were pelleted by 3000 � g centrifugation for 1 min, resuspended
in ice cold 0.2 M NaOH and incubated on ice for 10 min. Cells were then pelleted by 10,000 � g
centrifugation for 1 min and boiled in SDS-PAGE sample buffer (50 mM Tris-HCl pH 6.8, 2.5%
sodium dodecyl sulfate, 0.008% bromophenol blue, 10% glycerol, 5% b-mercaptoethanol). Following
centrifugation to remove any insoluble cell debris, supernatant samples were resolved by SDS-PAGE
(70 min at 195V) using Novex 4–20% Tris-Glycine gels (Thermo Fisher Scientific, Waltham, MA) and
electroblotted onto nitrocellulose membranes. Blocking and antibody incubations (mouse anti-FLAG
M2 (Sigma), mouse anti-V5 R960-25 (Thermo Fisher Scientific), mouse anti-GFP (Sigma), mouse anti-
Pgk1 22C5D8 (Thermo Fisher Scientific), rabbit anti-Hsc82 ab30920 (Abcam), and rabbit anti-Sdh4
(gift of N. Pfanner)) were performed in 5% milk in TBST (10 mM Tris-HCl pH 7.4, 150 mM NaCl, 0.25
mM EDTA, 0.05% Tween-20). HRP-conjugated secondary antibodies (BioRad, Hercules, CA) were
detected following incubation with SuperSignal West Femto Substrate (Thermo Fisher Scientific)
using a ChemImager (AlphaInnotech, San Jose, CA). Fluorescent secondary antibodies (Thermo
Fisher Scientific) were detected using a Typhoon Trio imager (GE Healthcare, Chicago, IL).
Protease protection of YFP-Pex15DC30-V5 at mitochondriaVDY3412 cells were pre-grown to late log phase (1 OD600) in 100 mL YEPD and then diluted to 0.1
OD600 in 1 L YEPD. Cells were grown with shaking at 30˚C to 1 OD600 and then treated with 50 mg/
ml doxycycline (Sigma) for 4 hr at 30˚C with shaking. Cells were harvested by centrifugation. Crude
Figure 6 continued
lacking the N-terminal sfYFP. (B) Schematic of the staged degradation experiment for monitoring tFT-Pex15 turnover following Pex3-AID degradation.
Wild-type and msp1D cells containing tFT-Pex15 constitutively expressed from the PEX15 promoter and expressing Pex3-AID were grown in
exponential phase for 6 hr. The experiment was performed in the presence and absence of the E3 ligase OsTir1 which ubiquitinates Pex3-AID following
Auxin treatment (Nishimura et al., 2009). Half of the cells were then subjected to treatment with 1 mM Auxin while the other half received DMSO
vehicle, followed by time-lapse imaging of both cell populations using a spinning disk confocal microscope. (C) Quantitation of peroxisomal sfYFP
fluorescence from tFT-Pex15 from the experiment described in part B. YFP signal density at peroxisomes was determined as described in Figure 3C
and plotted after normalization to the 0 hr timepoint of the identically treated MSP1 strain. Error bars represent standard error of the mean. These data
represent analysis of >100 cells for each sample at each timepoint. Different fields of cells were imaged at each timepoint to minimize photobleaching.
This experiment was performed twice with similar results. (D) Schematic of the staged expression experiment for monitoring Msp1-dependent turnover
of peroxisomal Pex15 in the presence and absence of overexpressed Pex3. This experiment was performed twice with similar results. (E) Quantitation of
peroxisomal YFP-Pex15 fluorescence from the experiment described in part D. YFP signal density at peroxisomes was determined as described in
Figure 3C and plotted as in Figure 4F. Pex3-overexpressing cells (pTDH3-PEX3) are shown with dashed lines, whereas solid lines indicate peroxisomal
YFP levels in cells producing Pex3 from its endogenous promoter. These data represent analysis of 243 mock-treated and 128 b-estradiol-treated PEX3
wild type cells and 171 mock-treated and 197 b-estradiol-treated pTDH3-PEX3 cells followed throughout the time course as well as progeny from cell
divisions during the experiment.
DOI: https://doi.org/10.7554/eLife.28507.016
The following figure supplement is available for figure 6:
Figure supplement 1. Supporting evidence for Pex15 interaction with Pex3 and rapid in situ destruction of Pex3-AID.
DOI: https://doi.org/10.7554/eLife.28507.017
Weir et al. eLife 2017;6:e28507. DOI: https://doi.org/10.7554/eLife.28507 21 of 28
Research article Cell Biology

Figure 7. The Msp1 TMS targets Msp1 to peroxisomes and mitochondria, but is dispensible for substrate engagement. (A) Schematic representation of
Msp1 TMS chimaeras. Top, wild type Msp1, with an N-terminal TMS and C-terminal AAA ATPase domain. Middle, Msp1 with its N-terminal 31 amino
acids deleted and replaced with the first 35 amino acids of Pex22. Bottom, Msp1 with its TMS (residues 13–27) replaced with residues 12–29 of Tom70.
(B) Quantitation of mitochondrial (left) and peroxisomal (right) YFP density in cells producing Pex22TMS-Msp1-YFP (pink) or Tom70TMS-Msp1-YFP
(purple) from the native MSP1 promoter. YFP signal density was determined at mitochondria as described in Figure 2C, and at peroxisomes as
described in Figure 3C. YFP fluorescence density at each organelle was normalized to the mean fluorescence density at the same organelle for wild
type Msp1-YFP. Error bars represent standard error of the population mean. See Figure 7—figure supplement 1A for representative images. These
data represent analysis of >250 cells from each strain. (C) Quantitation of endogenously expressed mitochondrial tFT-Pex15DC30 sfYFP fluorescence
density in cells producing Pex22TMS-Msp1 or Tom70TMS-Msp1 from the native MSP1 promoter. Mitochondrial sfYFP fluorescence density was calculated
Figure 7 continued on next page
Weir et al. eLife 2017;6:e28507. DOI: https://doi.org/10.7554/eLife.28507 22 of 28
Research article Cell Biology

mitochondria were isolated from harvested cells as described previously (Meisinger et al., 2006).
100 mg of crude mitochondria was treated with 10 mg Proteinase K (Roche, Basel, Switzerland) or
mock treated in the presence or absence of 1% Triton X-100 (Sigma) at room temperature for 30
min. Phenylmethanesulfonyl fluoride (PMSF) (Sigma) was added to each sample to a final concentra-
tion of 5 mM to inhibit Proteinase K and samples were incubated 10 min on ice. Samples were mixed
with boiling SDS-PAGE sample buffer and subjected to SDS-PAGE and immunoblotting analysis as
described earlier.
Live-cell imaging of tagged Pex15 and Msp1Cells were inoculated into 2 mL of complete synthetic media with glucose (0.67% yeast nitrogen
base (BD Biosciences), 2% glucose, 1 � CSM (Sunrise Sciences, San Diego, CA)) and grown over-
night at 30˚C on a roller drum. The following morning, cells were back-diluted to 0.05 OD600 in fresh
media and grown to mid-to-late log phase (0.5–1 OD600) for imaging with drug treatments as indi-
cated in figure schematics. b-estradiol (Sigma) was used at 1 mM for all experiments; doxycycline was
used at concentrations indicated in figure legends. Cells in culture media were applied directly to
the well of a concanavalin A (MP Biomedicals, Santa Ana, CA)-coated Lab-Tek II chambered cover-
glass (Thermo Fisher) and allowed to adhere for 5 min at room temperature. Culture media was
removed and adhered cells were immediately overlaid with a 1% agarose pad containing complete
synthetic media with glucose and supplemented with drugs when applicable. The agarose pad was
Figure 7 continued
as described for Figure 3E. Bars represent the fraction of tFT-Pex15DC30 eliminated by the Msp1 variant, calculated as (mitochondrial mean YFP density
in msp1D - mitochondrial mean YFP density in TMS variant)/(mitochondrial mean YFP density in msp1D - mitochondrial mean YFP density in MSP1). See
Figure 7—figure supplement 1B for a violin plot of the mitochondrial sfYFP fluorescence distributions. These data represent analysis of >250 cells
from each strain. (D) Experimental timeline of the staged expression experiment for monitoring turnover of peroxisomal Pex15 following transient
expression of Pex22TMS-Msp1 or Tom70TMS-Msp1 from the ZD promoter. (E) Quantitation of peroxisomal YFP-Pex15 fluorescence from the experiment
described in part D. YFP signal density at peroxisomes was determined as described in Figure 3C and plotted as in Figure 4F. Cells producing
Pex22TMS-Msp1 and Tom70TMS-Msp1 from the ZD promoter are shown with solid lines and dashed lines respectively. These data represent analysis of
158 mock-treated Pex22TMS-Msp1 cells, 231 b-estradiol-treated Pex22TMS-Msp1 cells, 130 mock-treated Tom70TMS-Msp1 cells, and 171 b-estradiol-
treated Tom70TMS-Msp1 cells followed throughout the time course as well as progeny from cell divisions during the experiment.
DOI: https://doi.org/10.7554/eLife.28507.018
The following figure supplement is available for figure 7:
Figure supplement 1. Supporting evidence for the role of the Msp1 TMS in membrane targeting and substrate clearance.
DOI: https://doi.org/10.7554/eLife.28507.019
Figure 8. Model for substrate selection by Msp1. On the left, mistargeted Pex15 inserts into mitochondria and is
then recognized by Msp1 for extraction. On the right, following insertion into peroxisomes, nascent Pex15 can be
recognized by Msp1 in principle but in practice this requires either Pex15 and/or Msp1 to be present above their
usual levels. Otherwise, normal Msp1 recognition is slow relative to the faster ‘maturation’ process involving Pex3
interaction with Pex15, which blocks Msp1 recognition.
DOI: https://doi.org/10.7554/eLife.28507.020
Weir et al. eLife 2017;6:e28507. DOI: https://doi.org/10.7554/eLife.28507 23 of 28
Research article Cell Biology
overlaid with liquid media for timelapse imaging experiments. Live-cell imaging was performed at
25˚C on a TI microscope (Nikon, Tokyo, Japan) equipped with a CSU-10 spinning disk
(Yokogawa, Tokyo, Japan), an ImagEM EM-CCD camera (Hamamatsu, Hamamatsu, Japan), and a
100 � 1.45 NA objective (Nikon). The microscope was equipped with 447 nm, 515 nm and 591 nm
wavelength lasers (Coherent, Santa Clara, CA) and was controlled with MetaMorph imaging software
(Molecular Devices, Sunnyvale, CA). Z-stacks were acquired with 0.2 mm step size for 6 mm per stack.
Camera background noise was measured with each Z-stack for normalization during timelapse
imaging.
Sample size estimation and experimental replication detailsFor quantitative microscopy experiments, the number of cells present in each sample was manually
counted in brightfield images and indicated in the associated figure legend. Each experiment was
repeated the number of times indicated in the associated figure legend. Replicates represent techni-
cal replicates in which the same strains were subjected to repetition of the entire experiment, often
on different days.
Image post-processing and organelle segmentationAll fluorescence images were normalized to background noise to compensate for uneven illumina-
tion and variability in camera background signal. To identify peroxisomes and mitochondria, images
of their respective markers were processed by an object segmentation script. Briefly, images were
smoothed using a Gaussian filter and then organelle edges were identified by processing each slice
with a Canny edge detector (Canny, 1986) implemented in the Python package scikit-image.
Enclosed objects were filled and individual three-dimensional objects were identified by locally maxi-
mizing Euclidean distance to the object border. Individual objects were identified and separated by
watershed segmentation as implemented in scikit-image. For mitochondria, contiguous but sepa-
rately segmented objects were merged to form one mitochondrion. For YFP-Pex15 quantitation at
mitochondria, regions of mitochondria that overlapped with peroxisomes were removed by eliminat-
ing segmented mitochondria pixels that overlapped with segmented peroxisomes. Segmentation
code is available at http://www.github.com/deniclab/pyto_segmenter (Weir, 2017a) and sample
implementation is available at www.github.com/deniclab/Weir_2017_analysis (Weir, 2017b) (copies
archived at https://github.com/elifesciences-publications/pyto_segmenter and https://github.com/
elifesciences-publications/Weir_2017_analysis respectively). Raw source images are available on the
Dryad data repository associated with this manuscript.
Fluorescence intensity analysisFollowing organelle segmentation, total fluorescence intensity for Pex15 was determined in each
segmented object by summing intensities in the corresponding pixels for YFP fluorescence images
(and mCherry images for mCherry-sfYFP-Pex15 and mCherry-sfYFP-Pex15DC30 in Figure 5C). Fluo-
rescence density was calculated by dividing total pixel intensity by object volume in pixels. Back-
ground was calculated empirically by measuring Pex15 fluorescence intensity in peroxisomes and/or
mitochondria in cells lacking fluorescently labeled Pex15, and the mean background density was
subtracted from each segmented object’s fluorescence density. Because Pex15 fluorescence density
was approximately log-normally distributed, mean and standard error of the mean were calculated
on logarithmically transformed fluorescence densities when applicable. Plotting was performed using
R and the ggplot2 package. See www.github.com/deniclab/Weir_2017_analysis for tabulated data
and analysis code.
Model fitting and statisticsFor 1-state and 2-state model fitting, organelle fluorescence density means were first normalized to
the sample’s mean at time 0. For the 1-state model, log-transformed mean fluorescence densities at
each time point were fit to a linear model using least squares fitting in R. For the 2-state model, log-
arithmically transformed data was fit to a logarithmically transformed version of a previously derived
2-state degradation model (Sin et al., 2016) using the Levenberg-Marquardt algorithm (Leven-
berg, 1944) for non-linear least squares fitting as implemented in the R package minpack.lm. Error
for fit parameters was obtained from fit summary statistics. The difference between the 1-state and
Weir et al. eLife 2017;6:e28507. DOI: https://doi.org/10.7554/eLife.28507 24 of 28
Research article Cell Biology
2-state model fits was determined by integrating the difference between the two fit equations over
the measured time interval, then dividing by the time interval to normalize across timecourse experi-
ments of different lengths. See www.github.com/deniclab/Weir_2017_analysis for tabulated data
and R code. Observed half-life was determined by converting the peroxisomal YFP-Pex15 –Msp1
kdecay (Figure 4—figure supplement 1) using the equation half-life = ln(2)/kdecay, and then multiplied
by 60 to convert from hours to minutes. Error bars represent standard error of the mean.
Simulation of protein age and turnoverTo stochastically model peroxisomal Pex15 levels and age following transient Msp1 expression, we
used a Gillespie algorithm approach (Gillespie, 1977). In brief, this approach cycles through the fol-
lowing steps: 1. Model the expected time until the next ‘event’ takes place (import, degradation, or
maturation of a Pex15 molecule) by summing event rates and drawing from an exponential distribu-
tion based on the summed rate constant, 2. Age all simulated Pex15 molecules according to time
passage, 3. Determine which of the possible events took place by weighted random draws based on
each event’s probability of occurring, 4. Execute that event, and then repeat these steps until the
simulation’s time has expired. Based on our observation that Pex15 turnover in the absence of Msp1
occurs with exponential decay kinetics (Figure 4F), we established starting conditions by drawing
1000 ages from an exponential distribution with half-life indicated in Figure 5B. For the rest of the
simulation we used this rate constant to predict import of new molecules and as a steady-state deg-
radation rate constant (and as kdecay,2 in 2-state simulations). We treated this vector of 1000 ages as
a single peroxisome containing 1000 Pex15 molecules (this is likely an over-estimation of Pex15
amounts in many cases, but over-estimating Pex15 levels improved statistical robustness of the anal-
ysis and did not alter simulation mean outcomes). When simulating steady state 2-state behavior
using the calculated kmat value, we found that ~60% of the elements existed in the ‘unstable’ form at
steady state (data not shown) and therefore used this as a starting value. For 2-state simulations we
randomly drew 600 of the vector elements to be ‘unstable’ at the start of the simulation, weighting
probabilities of each draw using an exponential distribution with kmat as the decay rate constant.
After validating that our starting conditions represented a stable steady state by simulating without
perturbing rate constants, we began the reported simulations with kdecay set to 2.82 hr�1, the best
linear fit for turnover from the first three time points (for 1-state simulations), or with kdecay,1 (for 2-
state simulations) set to the calculated value from Figure 4F. Simulations ran for 4 hr of simulated
time and values for particle age and abundance were recorded at every simulated minute. 100 simu-
lations were performed with each set of parameters and the mean particle age and abundance at
each minute were calculated across the 100 simulations. Finally, we modeled maturation of sfYFP
fluorescence and mCherry fluorescence based on established maturation half-times (Hansen and
O’Shea, 2013; Khmelinskii et al., 2012), respectively) and calculated the mean population tFT ratio
at each minute. We normalized these data to the value at the simulation’s starting point. See the
www.github.com/deniclab/Weir_2017_analysis for Gillespie simulation R code.
Pex3-GFP-AID fluorescence microscopyYeast cultures were grown overnight in synthetic medium to 0.5 OD600 and treated with 3-indoleace-
tic acid (Auxin, 1 mM) (Sigma) or DMSO vehicle as indicated. Following concentration of cells by cen-
trifugation, cells were imaged at room temperature on an Axiovert 200M microscope body (Carl
Zeiss, Oberkochen, Germany) equipped with a CSU-10 spinning disk (Yokogawa) and 488 nm and
561 nm lasers (Coherent) using an oil-immersion 100 � 1.45 NA objective (Carl Zeiss). Images were
acquired using a Cascade 512B EM-CCD detector (Photometrics, Tuscon, AZ) and MetaMorph
acquisition software (Molecular Devices).
Pex3-FLAG immunoprecipitation1 L yeast cell culture was grown to 1.8–2.2 OD600 in YEP +5% glucose at 30˚C with shaking. Cells
were collected by centrifuging 20 min at 3000 � g, 4˚C, then washed once with 50 ml sterile H2O.
Cells were resuspended in 1 ml ice-cold lysis buffer (50 mM HEPES-KOH pH 6.8, 150 mM KOAc, 2
mM MgCl2, 1 mM CaCl2, 0.2 M sorbitol, 2x cOmplete protease inhibitors (Sigma)) per 6 g wet
weight, and dripped into liquid nitrogen to flash-freeze. Cells were lysed cryogenically using a
PM100 ball mill (Retsch, Haan, Germany) and stored at �80˚C. 0.4 g lysed cell powder was thawed
Weir et al. eLife 2017;6:e28507. DOI: https://doi.org/10.7554/eLife.28507 25 of 28
Research article Cell Biology

on ice and mixed with 1.6 mL IP buffer (50 mM HEPES-KOH pH 6.8, 150 mM KOAc, 2 mM Mg
[OAc]2, 1 mM CaCl2, 15% glycerol, 1% NP-40, 5 mM sodium fluoride, 62.5 mM b-glycerophosphate,
10 mM sodium vanadate, 50 mM sodium pyrophosphate). Lysates were detergent solubilized at 4˚Cfor 1 hr with nutation and then subjected to low-speed centrifugation (twice at 3000 � g, 4˚C for 5
min) to remove any unlysed cells and cell debris. The supernatants were further cleared by ultracen-
trifugation (100,000 � g, 4˚C for 30 min) before adding 40 mL protein G Dynabeads (Sigma) conju-
gated to anti-FLAG M2 monoclonal antibody (Sigma). Following incubation for 3 hr at 4˚C with
nutation, Dynabeads were washed four times with IP buffer and bound proteins were eluted at room
temperature with two sequential rounds of 10 ml 1 mg/mL 3 � FLAG peptide (Sigma) in IP buffer.
Immunoblotting analysis was performed as described above.
Note added in proofA complementary structure-function analysis of Msp1 was published while this work was under
review (Wohlever et al., 2017).
AcknowledgementsWe thank A Murray, E O’Shea, D Botstein, S McIsaac, N Pfanner, and A Amon for reagents, S
Mukherji for modeling advice, L Bagamery for microscopy assistance, and members of the Denic
Laboratory, M Gropp, A Murray, and R Gaudet for comments on the manuscript. This work was sup-
ported by the National Institutes of Health (R01GM099943-04).
Additional information
Funding
Funder Author
National Institutes of Health Vladimir Denic
The funders had no role in study design, data collection and
interpretation, or the decision to submit the work for publication.
Author contributions
Nicholas R Weir, Data curation, Software, Formal analysis, Investigation, Visualization, Methodology,
Writing—original draft, Writing—review and editing; Roarke A Kamber, James S Martenson, Investi-
gation, Visualization, Writing—review and editing; Vladimir Denic, Conceptualization, Supervision,
Funding acquisition, Methodology, Writing—original draft, Project administration, Writing—review
and editing
Author ORCIDs
Nicholas R Weir, http://orcid.org/0000-0002-1797-849X
Vladimir Denic, http://orcid.org/0000-0002-1982-7281
Decision letter and Author response
Decision letter https://doi.org/10.7554/eLife.28507.024
Author response https://doi.org/10.7554/eLife.28507.025
Additional filesSupplementary files. Transparent reporting form
DOI: https://doi.org/10.7554/eLife.28507.021
Major datasets
The following dataset was generated:
Weir et al. eLife 2017;6:e28507. DOI: https://doi.org/10.7554/eLife.28507 26 of 28
Research article Cell Biology
Author(s) Year Dataset title Dataset URL
Database, license,and accessibilityinformation
Weir NR, KamberRA, Martenson JS,Denic V
2017 Data from: The AAA protein Msp1mediates clearance of excess tail-anchored proteins from theperoxisomal membrane
http://dx.doi.org/10.5061/dryad.pc4d6
Available at DryadDigital Repositoryunder a CC0 PublicDomain Dedication
ReferencesBelle A, Tanay A, Bitincka L, Shamir R, O’Shea EK. 2006. Quantification of protein half-lives in the budding yeastproteome. PNAS 103:13004–13009. DOI: https://doi.org/10.1073/pnas.0605420103, PMID: 16916930
Birschmann I, Stroobants AK, van den Berg M, Schafer A, Rosenkranz K, Kunau WH, Tabak HF. 2003. Pex15p ofSaccharomyces cerevisiae provides a molecular basis for recruitment of the AAA peroxin Pex6p to peroxisomalmembranes. Molecular Biology of the Cell 14:2226–2236. DOI: https://doi.org/10.1091/mbc.E02-11-0752,PMID: 12808025
Borgese N, Fasana E. 2011. Targeting pathways of C-tail-anchored proteins. Biochimica et Biophysica Acta (BBA)- Biomembranes 1808:937–946. DOI: https://doi.org/10.1016/j.bbamem.2010.07.010, PMID: 20646998
Canny J. 1986. A computational approach to edge detection. IEEE Transactions on Pattern Analysis and MachineIntelligence 8:679–698. DOI: https://doi.org/10.1109/TPAMI.1986.4767851, PMID: 21869365
Chen Y, Pieuchot L, Loh RA, Yang J, Kari TM, Wong JY, Jedd G. 2014a. Hydrophobic handoff for direct deliveryof peroxisome tail-anchored proteins. Nature Communications 5:5790. DOI: https://doi.org/10.1038/ncomms6790, PMID: 25517356
Chen YC, Umanah GK, Dephoure N, Andrabi SA, Gygi SP, Dawson TM, Dawson VL, Rutter J. 2014b. Msp1/ATAD1 maintains mitochondrial function by facilitating the degradation of mislocalized tail-anchored proteins.The EMBO Journal 33:1548–1564. DOI: https://doi.org/10.15252/embj.201487943, PMID: 24843043
Denic V, Weissman JS. 2007. A molecular caliper mechanism for determining very long-chain fatty acid length.Cell 130:663–677. DOI: https://doi.org/10.1016/j.cell.2007.06.031, PMID: 17719544
Denic V, Dotsch V, Sinning I. 2013. Endoplasmic reticulum targeting and insertion of tail-anchored membraneproteins by the GET pathway. Cold Spring Harbor Perspectives in Biology 5:a013334. DOI: https://doi.org/10.1101/cshperspect.a013334, PMID: 23906715
Eckert JH, Johnsson N. 2003. Pex10p links the ubiquitin conjugating enzyme Pex4p to the protein importmachinery of the peroxisome. Journal of Cell Science 116:3623–3634. DOI: https://doi.org/10.1242/jcs.00678,PMID: 12876220
Fang Y, Morrell JC, Jones JM, Gould SJ. 2004. PEX3 functions as a PEX19 docking factor in the import of class Iperoxisomal membrane proteins. The Journal of Cell Biology 164:863–875. DOI: https://doi.org/10.1083/jcb.200311131, PMID: 15007061
Geisberg JV, Moqtaderi Z, Fan X, Ozsolak F, Struhl K. 2014. Global analysis of mRNA isoform half-lives revealsstabilizing and destabilizing elements in yeast. Cell 156:812–824. DOI: https://doi.org/10.1016/j.cell.2013.12.026, PMID: 24529382
Ghaemmaghami S, Huh WK, Bower K, Howson RW, Belle A, Dephoure N, O’Shea EK, Weissman JS. 2003.Global analysis of protein expression in yeast. Nature 425:737–741. DOI: https://doi.org/10.1038/nature02046,PMID: 14562106
Gillespie DT. 1977. Exact stochastic simulation of coupled chemical reactions. The Journal of Physical Chemistry81:2340–2361. DOI: https://doi.org/10.1021/j100540a008
Hansen AS, O’Shea EK. 2013. Promoter decoding of transcription factor dynamics involves a trade-off betweennoise and control of gene expression. Molecular Systems Biology 9:704. DOI: https://doi.org/10.1038/msb.2013.56, PMID: 24189399
Hegde RS, Keenan RJ. 2011. Tail-anchored membrane protein insertion into the endoplasmic reticulum. NatureReviews Molecular Cell Biology 12:787–798. DOI: https://doi.org/10.1038/nrm3226, PMID: 22086371
Jonikas MC, Collins SR, Denic V, Oh E, Quan EM, Schmid V, Weibezahn J, Schwappach B, Walter P, WeissmanJS, Schuldiner M. 2009. Comprehensive characterization of genes required for protein folding in theendoplasmic reticulum. Science 323:1693–1697. DOI: https://doi.org/10.1126/science.1167983, PMID: 19325107
Kamber RA, Shoemaker CJ, Denic V. 2015. Receptor-bound targets of selective autophagy use a scaffoldprotein to activate the Atg1 kinase. Molecular Cell 59:372–381. DOI: https://doi.org/10.1016/j.molcel.2015.06.009, PMID: 26166702
Khmelinskii A, Keller PJ, Bartosik A, Meurer M, Barry JD, Mardin BR, Kaufmann A, Trautmann S, Wachsmuth M,Pereira G, Huber W, Schiebel E, Knop M. 2012. Tandem fluorescent protein timers for in vivo analysis ofprotein dynamics. Nature Biotechnology 30:708–714. DOI: https://doi.org/10.1038/nbt.2281, PMID: 22729030
Kihara A, Akiyama Y, Ito K. 1995. FtsH is required for proteolytic elimination of uncomplexed forms of SecY, anessential protein translocase subunit. PNAS 92:4532–4536. DOI: https://doi.org/10.1073/pnas.92.10.4532,PMID: 7753838
Levenberg K. 1944. A method for the solution of certain non-linear problems in least squares. Quarterly ofApplied Mathematics 2:164–168. DOI: https://doi.org/10.1090/qam/10666
Weir et al. eLife 2017;6:e28507. DOI: https://doi.org/10.7554/eLife.28507 27 of 28
Research article Cell Biology
Lippincott-Schwartz J, Bonifacino JS, Yuan LC, Klausner RD. 1988. Degradation from the endoplasmic reticulum:disposing of newly synthesized proteins. Cell 54:209–220. DOI: https://doi.org/10.1016/0092-8674(88)90553-3,PMID: 3292055
Liu Y, Yagita Y, Fujiki Y. 2016. Assembly of peroxisomal membrane proteins via the direct Pex19p-Pex3ppathway. Traffic 17:433–455. DOI: https://doi.org/10.1111/tra.12376, PMID: 26777132
Longtine MS, McKenzie A, Demarini DJ, Shah NG, Wach A, Brachat A, Philippsen P, Pringle JR. 1998. Additionalmodules for versatile and economical PCR-based gene deletion and modification in Saccharomyces cerevisiae.Yeast 14:953–961. DOI: https://doi.org/10.1002/(SICI)1097-0061(199807)14:10<953::AID-YEA293>3.0.CO;2-U,PMID: 9717241
McIsaac RS, Oakes BL, Wang X, Dummit KA, Botstein D, Noyes MB. 2013. Synthetic gene expressionperturbation systems with rapid, tunable, single-gene specificity in yeast. Nucleic Acids Research 41:e57.DOI: https://doi.org/10.1093/nar/gks1313, PMID: 23275543
McShane E, Sin C, Zauber H, Wells JN, Donnelly N, Wang X, Hou J, Chen W, Storchova Z, Marsh JA, VallerianiA, Selbach M. 2016. Kinetic analysis of protein stability reveals age-dependent degradation. Cell 167:803–815.DOI: https://doi.org/10.1016/j.cell.2016.09.015, PMID: 27720452
Meisinger C, Pfanner N, Truscott KN. 2006. Isolation of yeast mitochondria. Methods in molecular biology 313:33–39. DOI: https://doi.org/10.1385/1-59259-958-3:033, PMID: 16118422
Motley AM, Nuttall JM, Hettema EH. 2012. Pex3-anchored Atg36 tags peroxisomes for degradation inSaccharomyces cerevisiae. The EMBO Journal 31:2852–2868. DOI: https://doi.org/10.1038/emboj.2012.151,PMID: 22643220
Nishimura K, Fukagawa T, Takisawa H, Kakimoto T, Kanemaki M. 2009. An auxin-based degron system for therapid depletion of proteins in nonplant cells. Nature Methods 6:917–922. DOI: https://doi.org/10.1038/nmeth.1401, PMID: 19915560
Nuttall JM, Motley AM, Hettema EH. 2014. Deficiency of the exportomer components Pex1, Pex6, and Pex15causes enhanced pexophagy in Saccharomyces cerevisiae. Autophagy 10:835–845. DOI: https://doi.org/10.4161/auto.28259, PMID: 24657987
Okreglak V, Walter P. 2014. The conserved AAA-ATPase Msp1 confers organelle specificity to tail-anchoredproteins. PNAS 111:8019–8024. DOI: https://doi.org/10.1073/pnas.1405755111, PMID: 24821790
Olivares AO, Baker TA, Sauer RT. 2016. Mechanistic insights into bacterial AAA+ proteases and protein-remodelling machines. Nature Reviews Microbiology 14:33–44. DOI: https://doi.org/10.1038/nrmicro.2015.4,PMID: 26639779
Papic D, Elbaz-Alon Y, Koerdt SN, Leopold K, Worm D, Jung M, Schuldiner M, Rapaport D. 2013. The role ofDjp1 in import of the mitochondrial protein Mim1 demonstrates specificity between a cochaperone and itssubstrate protein. Molecular and Cellular Biology 33:4083–4094. DOI: https://doi.org/10.1128/MCB.00227-13,PMID: 23959800
Roney IJ, Rudner AD, Couture JF, Kærn M. 2016. Improvement of the reverse tetracycline transactivator bysingle amino acid substitutions that reduce leaky target gene expression to undetectable levels. ScientificReports 6:27697. DOI: https://doi.org/10.1038/srep27697, PMID: 27323850
Rosenkranz K, Birschmann I, Grunau S, Girzalsky W, Kunau WH, Erdmann R. 2006. Functional association of theAAA complex and the peroxisomal importomer. FEBS Journal 273:3804–3815. DOI: https://doi.org/10.1111/j.1742-4658.2006.05388.x, PMID: 16911527
Schuldiner M, Metz J, Schmid V, Denic V, Rakwalska M, Schmitt HD, Schwappach B, Weissman JS. 2008. TheGET complex mediates insertion of tail-anchored proteins into the ER membrane. Cell 134:634–645.DOI: https://doi.org/10.1016/j.cell.2008.06.025, PMID: 18724936
Sheff MA, Thorn KS. 2004. Optimized cassettes for fluorescent protein tagging in Saccharomyces cerevisiae.Yeast 21:661–670. DOI: https://doi.org/10.1002/yea.1130, PMID: 15197731
Sin C, Chiarugi D, Valleriani A. 2016. Degradation parameters from pulse-chase experiments. PLoS One 11:e0155028. DOI: https://doi.org/10.1371/journal.pone.0155028, PMID: 27182698
Sung MK, Porras-Yakushi TR, Reitsma JM, Huber FM, Sweredoski MJ, Hoelz A, Hess S, Deshaies RJ. 2016. Aconserved quality-control pathway that mediates degradation of unassembled ribosomal proteins. eLife 5:e19105. DOI: https://doi.org/10.7554/eLife.19105, PMID: 27552055
Weir NR. 2017a. pyto_segmenter. Github. baa4dcf. https://github.com/deniclab/pyto_segmenter/tree/publicationWeir NR. 2017b. Weir_2017_Analysis. Github. 5119163. https://github.com/deniclab/Weir_2017_AnalysisWestphal K, Langklotz S, Thomanek N, Narberhaus F. 2012. A trapping approach reveals novel substrates andphysiological functions of the essential protease FtsH in Escherichia coli. Journal of Biological Chemistry 287:42962–42971. DOI: https://doi.org/10.1074/jbc.M112.388470, PMID: 23091052
Wohlever ML, Mateja A, McGilvray PT, Day KJ, Keenan RJ. 2017. Msp1 Is a membrane protein dislocase for tail-anchored proteins. Molecular Cell 67:194–202. DOI: https://doi.org/10.1016/j.molcel.2017.06.019, PMID: 28712723
Weir et al. eLife 2017;6:e28507. DOI: https://doi.org/10.7554/eLife.28507 28 of 28
Research article Cell Biology