the australian principal occupational health, safety and ... · pdf filecopenhagen...
TRANSCRIPT

The Australian Principal
Occupational Health, Safety and
Wellbeing Survey
2016 Data
Philip Riley
2
Produced and Published by:
Institute for Positive Psychology and Education
Faculty of Education and Arts
Australian Catholic University
Fitzroy, Victoria, Australia, 3605
Printed February 2017
© Copyright 2017
NOT FOR RESALE. All material in this document is protected by copyright. Use of these
materials including copying or resale may infringe copyright unless written permission has
been obtained from the copyright owners. Enquiries should be made to the publisher.
3
Acknowledgements
The major change to the project in 2016 was the awarding of an Australian Research Council
Linkage Grant (LP160101056) in conjunction with our industry partners who are also still
substantially contributing cash and in-kind support to the project (Teachers Health Fund,
Catholic Church Insurance, The Australian Primary Principals Association, The New South
Wales Secondary Principals Council, and the Association of Heads of Independent Schools
of Australia). This grant will enable the research to continue for three years. The whole team
is very grateful for this wonderful support.
Projects on this scale do not happen without a number of dedicated people’s support. I would
like to firstly thank the research team for their skill, dedication and track record that were
fundamental to securing the ARC grant. I am equally indebted to the Teachers Health Fund
who became the major sponsor of the research in 2014. Without the strong support of CEO
Bradley Joyce and National Partnerships Manager, Jane Stower, these reports would not have
been possible. I would also like to thank the National Principal Organisations and their
affiliates for co-funding the project along with in-kind resources, and a determination to see
the project run. They have also provided the essential function of facilitated access to the
survey for the principals and deputy/assistant principals in their jurisdictions. Special thanks
go to project manager, research assistant and PhD student, Aimee Maxwell who works
tirelessly to tight deadlines time and again. Aimee completed her thesis in 2016 and we await
the outcome of the examination.
In 2016 as a result of the ARC grant we now have a dedicated research team of world-
renowned experts in the field, and will include two new PhD candidates from 2017. The
developments in matrix sampling methods and cutting edge statistical modelling will be a
huge enhancement to the project going forward. For Web development and report
construction thanks go to Jason Cleeland. A big thank you also goes to the members of the
project consultative committee, who each contributed many hours of thought, travel for
meetings and invaluable questions along with discussion. It is a much better product for their
efforts. Finally, I am indebted to Australia’s school principals who give up their valuable
time each year to participate in the survey. The research rests on their good will and
generosity.
2016 Consultative committee
Bradley Joyce, Teachers Health Fund
Jane Stower, Teachers Health Fund
Dennis Yarrington, President, Australian Primary Principals Association (APPA)
Michael Nuttal, Executive Officer, Australian Primary Principals Association (APPA)
Rob Nairn, President Australian Secondary Principals Association (ASPA)
Geoff Ryan and Beth Blackwood, Chief Executives of the Association of Heads of
Independent Schools of Australia (AHISA)
Philip Lewis, President Catholic Secondary Principals Association
Gabrielle Leigh, President, Victorian Principals Association (VPA)
Liliana Mularczyk JP and Chris Presland, Presidents, NSW Secondary Principals Council
Judy Crowe, President, Victorian Association of Secondary School Principals (VASSP)

4
Research Team
Professor Herbert W. Marsh, IPPE (ACU) and Oxford University, Director International
SELF Research Centre
Professor Richard M. Ryan, IPPE (ACU) and Rochester University NY, Co-developer (with
Edward L. Deci) of Self Determination Theory
Professor Robert J. Vallerand, IPPE (ACU) and Université du Québec à Montréal. Past
President International Positive Psychology Association. Developer of the Dualistic Model of
Passion
Associate Professor Philip D. Parker, IPPE (ACU). ARC DECRA Fellow
Dr. Theresa Dicke, IPPE (ACU) Post Doctoral Fellow
Dr. Paul W. B. Atkins, IPPE (ACU). Senior Research Fellow
Dr. Jiesi Guo, IPPE (ACU) Post Doctoral Fellow
Dr. Simon Beausaert, Université catholique de Louvain, Belgium and Maastricht University,
The Netherlands
Dr. Christelle Devos, Université catholique de Louvain, Belgium
Dr. Dominik Froehlich, University of Vienna, Austria
Contact Information www.principalhealth.org Chief Investigator: Associate Professor Philip Riley, PhD.
Technical Support and Project Management: Aimee Maxwell
IPPE Project Management: Jenny-Lee Heylen, Linda Riek
Research Assistance: Carol Brown
Media Enquiries
Mountain Media
John Hill [email protected] http://www.mountainmedia.com.au/
Disclaimer: The recommendations in the report represent the opinion of the author alone and
are not necessarily endorsed by the Consultative Committee.

5
Table of Contents
Acknowlegements .................................................................................. Error! Bookmark not defined. 2016 Consultative committee .......................................................................................................................... 3 Research Team ...................................................................................................................................................... 4 Contact Information .............................................................................................................................................. 4 Media Enquiries ...................................................................................................................................................... 4 Table of Contents .................................................................................................................................................. 5
Executive Summary & Recommendations .......................................................................... 9 Background ............................................................................................................................................................... 9 Project Aims ............................................................................................................................................................. 9 Participant Care ...................................................................................................................................................... 9 Chief Investigator ................................................................................................................................................... 9 The Survey ............................................................................................................................................................. 10 Innovation ............................................................................................................................................................... 10 Research Questions .......................................................................................................................................... 10 Impact ....................................................................................................................................................................... 11 Australia’s School Principals: A 6-year Longitudinal Snapshot ................................................... 13 Summary .................................................................................................................................................................... 9
Recommendations....................................................................................................................... 10 Context ..................................................................................................................................................................... 10 15 Recommendations, 6 Foundations, 4 Strategies ......................................................................... 12
Recommendations.................................................................................................................................. 13 What Governments can do ............................................................................................................................ 13 What employers can do ................................................................................................................................... 13 What the Professional Associations and Unions can do ................................................................ 13 What the community can do.......................................................................................................................... 14 What schools can do......................................................................................................................................... 14 What individual educators can do .............................................................................................................. 14 What the research community can do ..................................................................................................... 14
Strategies ................................................................................................................................................... 15 Strategy A: Improving the wellbeing of principals and deputy/assistant principals through
Professional Support......................................................................................................................................... 16 Strategy B. Professional Learning ............................................................................................................. 17 Strategy C. Review the work practices of Principals and deputy/assistant principals in light of the Job Demands-Resources Model of organizational health...................................... 17 Strategy D: Address Bullying and Violence ........................................................................................... 18 Summary ................................................................................................................................................................. 18
Technical Report 2016 Data ....................................................................................................... 2
1. Copenhagen PsychoSocial Questionnaire – II ............................................................. 3 Demands at work ...................................................................................................................................... 3
Trend data 2011 – 2016 ..................................................................................................................................... 3 2016 Data in Detail ............................................................................................................................................... 4 Results ........................................................................................................................................................................ 4 Quantitative Demands disaggregated by State, Sector, Level, Role and compared with the General Population ....................................................................................................................................... 5 Work Pace disaggregated by State, Sector, Level, Role and compared with the General Population.................................................................................................................................................................. 6 Cognitive Demands disaggregated by State, Sector, Level, Role and compared with the General Population ............................................................................................................................................... 7 Emotional Demands disaggregated by State, Sector, Level, Role and compared with the
General Population ............................................................................................................................................... 8

6
Demands for Hiding Emotions disaggregated by State, Sector, Level, Role and compared with the General Population ...................................................................................................... 9
Work Organisation and Job Contents ........................................................................................... 10 Trend data 2011 – 2016 .................................................................................................................................. 10 2016 Data in detail ............................................................................................................................................. 11 Results ..................................................................................................................................................................... 11 Influence disaggregated by State, Sector, Level, Role and compared with the General Population............................................................................................................................................................... 12 Possibilities for Development disaggregated by State, Sector, Level, Role and compared with the General Population ................................................................................................... 13 Variation disaggregated by State, Sector, Level, Role and compared with the General
Population............................................................................................................................................................... 14 Meaning of Work disaggregated by State, Sector, Level, Role and compared with the
General Population ............................................................................................................................................ 15 Commitment to the Workplace disaggregated by State, Sector, Level, Role and
compared with the General Population ................................................................................................... 16 Interpersonal Relations & Leadership ........................................................................................... 17
Trend data 2011 – 2016 .................................................................................................................................. 17 2016 Data in Detail ............................................................................................................................................ 18 Results ..................................................................................................................................................................... 18 Predictability disaggregated by State, Sector, Level, Role and compared with the General Population ............................................................................................................................................ 20 Recognition (Reward) disaggregated by State, Sector, Level, Role and compared with the General Population .................................................................................................................................... 21 Role Clarity disaggregated by State, Sector, Level, Role and compared with the General Population............................................................................................................................................................... 22 Role Conflicts disaggregated by State, Sector, Level, Role and compared with the General Population ............................................................................................................................................ 23 Quality of Leadership disaggregated by State, Sector, Level, Role and compared with
the General Population .................................................................................................................................... 24 Social Support, Colleagues Inside School disaggregated by State, Sector, Level, Role
and compared with the General Population .......................................................................................... 25 Social Support, Colleagues Outside School disaggregated by State, Sector, Level, Role
and compared with the General Population .......................................................................................... 26 Social Support from Supervisor disaggregated by State, Sector, Level, Role and
compared with the General Population ................................................................................................... 27 Social Community at Work disaggregated by State, Sector, Level, Role and compared with the General Population .......................................................................................................................... 28
Work-individual Interface .................................................................................................................... 29 Trend data 2011 – 2016 .................................................................................................................................. 29 2016 Data in Detail ............................................................................................................................................ 30 Results ..................................................................................................................................................................... 30 Job Satisfaction disaggregated by State, Sector, Level, Role and compared with the General Population ............................................................................................................................................ 31 Work-Family Conflict disaggregated by State, Sector, Level, Role and compared with the General Population .................................................................................................................................... 32 Family-Work Conflict disaggregated by State, Sector, Level, Role and compared with
the General Population .................................................................................................................................... 33 Values at the Workplace ...................................................................................................................... 34
Trend data 2011 – 2016 .................................................................................................................................. 34 2016 Data in Detail ............................................................................................................................................ 35 Results ..................................................................................................................................................................... 35 Trust regarding management disaggregated by State, Sector, Level, Role and
compared with the General Population ................................................................................................... 36

7
Mutual Trust between Employees disaggregated by State, Sector, Level, Role and compared with the General Population ................................................................................................... 37 Justice disaggregated by State, Sector, Level, Role and compared with the General Population............................................................................................................................................................... 38 Social Inclusiveness disaggregated by State, Sector, Level, Role and compared with the General Population ............................................................................................................................................ 39
Health and Wellbeing ............................................................................................................................ 40 Trend data 2011 – 2016 .................................................................................................................................. 40 2016 Data in Detail ............................................................................................................................................ 41 Results ..................................................................................................................................................................... 41 General Health disaggregated by State, Sector, Level, Role and compared with the
General Population ............................................................................................................................................ 43 Burnout disaggregated by State, Sector, Level, Role and compared with the General
Population............................................................................................................................................................... 44 Stress disaggregated by State, Sector, Level, Role and compared with the General
Population............................................................................................................................................................... 45 Sleeping Troubles disaggregated by State, Sector, Level, Role and compared with the
General Population ............................................................................................................................................ 46 Depressive Symptoms disaggregated by State, Sector, Level, Role and compared with the General Population ation ........................................................................................................................ 47 Somatic Stress disaggregated by State, Sector, Level, Role and compared with the General Population ............................................................................................................................................ 48 Cognitive Stress disaggregated by State, Sector, Level, Role and compared with the General Population ............................................................................................................................................ 49 Self-Efficacy disaggregated by State, Sector, Level, Role and compared with the General Population ............................................................................................................................................ 50
Offensive Behaviour .............................................................................................................................. 51 Trend data 2011 – 2016 .................................................................................................................................. 51 2016 Data in Detail ............................................................................................................................................ 52 Results ..................................................................................................................................................................... 52 Threats of Violence Trend Prevalence disaggregated by State ................................................. 54 Threats of Violence Trend Prevalence disaggregated by Frequency and Perpetrator Group ........................................................................................................................................................................ 55 Physical Violence Trend Prevalence disaggregated by State ..................................................... 56 Physical Violence Trend Prevalence disaggregated by disaggregated by Frequency and
Perpetrator Group .............................................................................................................................................. 57 Bullying Trend Prevalence disaggregated by State .......................................................................... 58 Physical Violence Trend Prevalence disaggregated by disaggregated by Frequency and
Perpetrator Group .............................................................................................................................................. 59 Sexual Harassment disaggregated by State, Sector, Level, Role and compared with the
General Population ............................................................................................................................................ 60 Threats of Violence disaggregated by State, Sector, Level, Role and compared with the
General Population ............................................................................................................................................ 61 Physical Violence disaggregated by State, Sector, Level, Role and compared with the
General Population ............................................................................................................................................ 62 Bullying disaggregated by State, Sector, Level, Role and compared with the General Population............................................................................................................................................................... 63 Unpleasant Teasing disaggregated by State, Sector, Level, Role and compared with the General Population ............................................................................................................................................ 64 Conflicts and Quarrels disaggregated by State, Sector, Level, Role and compared with the General Population .................................................................................................................................... 65 Gossip and Slander disaggregated by State, Sector, Level, Role and compared with the General Population ............................................................................................................................................ 66
8
2. Sources of Stress .................................................................................................................... 67 Introduction ............................................................................................................................................... 67
Trend data 2011 - 2016 ................................................................................................................................... 67 Sources of Stress 2011 - 2016 .................................................................................................................... 68 2016 Data in Detail ............................................................................................................................................ 69 Results ..................................................................................................................................................................... 69 Sources of Stress disaggregated by Sector and School Type .................................................... 71 Sources of Stress disaggregated by Role .............................................................................................. 72
3. Sources of Support ................................................................................................................ 73 Introduction ............................................................................................................................................... 73
Trend data 2011 - 2016 ................................................................................................................................... 73 Sources of Support 2011 - 2016 ................................................................................................................. 74 2016 in Detail ........................................................................................................................................................ 75 Results ..................................................................................................................................................................... 75 Sources of Support disaggregated by Gender .................................................................................... 76 Sources of Support disaggregated by Sector and School Type ................................................. 77 Sources of Support disaggregated by Role .......................................................................................... 78
4. Quality of Life ............................................................................................................................ 79 Introduction ............................................................................................................................................... 79
Trend data 2011 - 2016 ................................................................................................................................... 79 Assessment of Quality of Life 8–D 2011 - 2016 ................................................................................ 80 2016 Data in Detail ............................................................................................................................................ 81 Results ..................................................................................................................................................................... 81 Quality of Life disaggregated by Gender compared with the General Population ............. 82 Quality of Life disaggregated by school sector and type ................................................................ 83 Assessment of Quality of Life disaggregated by Role ..................................................................... 84
5. Social Capital ............................................................................................................................ 85 Introduction ............................................................................................................................................... 85
2016 Data in Detail ............................................................................................................................................ 85 Social Capital Trend Data 2011-2016 ...................................................................................................... 86 Social Capital trend data disaggregated by Gender, Role and Sector .................................... 87 Correlations between Social Capital and Quantitative and Emotional Demands, Work-Family Conflict, Burnout, Stress and Sleeping Troubles ................................................................ 88 Correlations between Social Capital and Cognitive Stress, Somatic Stress, Depressive
Symptoms, General Health, Job Satisfaction and Commitment to the Workplace ........... 89 Correlations between Social Capital and Obsessive & Harmonious Passion and
Decisional Capital (Confidence and Autonomy) ................................................................................. 90
6. Positive and Negative Affect Scale (PANAS) .............................................................. 91
7 Basic Psychological Needs at Work. ............................................................................... 92
8 Passion ......................................................................................................................................... 93 Introduction ............................................................................................................................................... 93
2016 Data in Detail ............................................................................................................................................ 94 Passion disaggregated by Type, Gender, Role and Sector .......................................................... 95 Correlations between Passion, Quantitative & Emotional Demands, and Work-Family
Conflict ..................................................................................................................................................................... 96 Correlations between Passion and Cognitive Stress, Depressive Symptoms, and
Trouble Sleeping ................................................................................................................................................. 97 Correlations between Passion, Burnout, General Health and Self Efficacy ......................... 98 Correlations between Passion, Quality of Life, Commitment to the Workplace and Job
Satisfaction ............................................................................................................................................................ 99

9
References ................................................................................................................................... 100
Executive Summary & Recommendations
Background
The survey has run nationally every year since 2011 in response to growing concern about
principals’ occupational health, safety and wellbeing. Since the project began, approximately
50% of Australia’s 10,000 principals have taken part. Many have completed multiple
surveys. The full background information is available in both short and long form at:
www.principalhealth.org/au/reports.
Project Aims
The aim of this research project is to conduct a longitudinal study monitoring school
principals and deputy/assistant principals’ health and wellbeing annually. Principals and
deputy/assistant principals’ health and wellbeing in differing school types, levels and size
will be monitored along with lifestyle choices such as exercise and diet and the professional
and personal social support networks available to individuals. The turnover of principals and
deputy/assistant principals within schools will allow investigations of moderator effects, such
as years of experience prior to taking up the role. The longitudinal study will allow the
mapping of health outcomes on each of these dimensions over time.
Participant Care
Each survey participant received a comprehensive, individual report from his/her own survey
responses. The report is an interactive secure webpage allowing participants to compare their
scores on 45 separate dimensions with the general population, other principals and
themselves over time. The other form of feedback is a red flag indicator that has been
programmed to be automatically triggered by the survey system if a participant reported
either consideration of self-harm in the week preceding completing the survey, or if their
combined answers to the quality of life questions add to a total score that falls two Standard
Deviations below the mean score for principals. A ‘red flag’ email is then generated and sent
to the participant outlining his or her individual result and includes a list of support services
available in the local area. This is done anonymously so participants can choose what course
of action to take.
Chief Investigator
Associate Professor Philip Riley, from Australian Catholic University, a registered
psychologist with the Australian Health Practitioner Regulation Agency, oversaw the project.
He is a former school principal and is also the Chief Investigator for The Irish Principals and
Deputy Principals Health and Wellbeing Survey. The Irish survey was conducted using the
same protocols as the Australian survey, which has run annually in Australia since 2011. The
reports for this survey are available at http://www.principalhealth.org/ie/reports.php.
10
The Survey
The survey captured three types of information drawn from existing robust and widely used
instruments. First, comprehensive school demographic items drawn from the Trends in
International Mathematics and Science Study (TIMSS) (Williams, et al., 2007), Program for
International Student Assessment (PISA) (Thomson, et al., 2011), The MySchool Website
(ACARA) and International Confederation of Principals surveys were used to capture
differences in occupational health and safety (OH&S) associated with the diversity of school
settings and types. Second, personal demographic and historical information was captured.
Third, principals and deputy/assistant principals’ quality of life and psychosocial coping were
investigated, by employing two widely used measures, the Assessment of Quality of Life – 8D
(AQoL-8D: Richardson, et al., 2009; Richardson, Iezzi & Maxwell, 2014), The Copenhagen
PsychoSocial Coping Scale-II (COPSOQ-II: Jan Hyld Pejtersen, et al., 2010). This year we
also measured individual levels of passion (its presence, or absence, and harmonious vs
obsessional) as it links to both job demands and resources (Trepanier, Fernet, Austin, Forest
& Vallerand, 2014; Vallerand, 2015). Alcohol use was measured using The Alcohol Use
Disorders Identification Test (AUDIT: Babour et al., 2001), developed for the World Health
Organization. The combination of items from these instruments allows opportunities for
comprehensive analysis of variation in both OH&S and wellbeing as a function of school
type, sector differences and the personal attributes of the principals themselves.
In 2016 two new scales were added to the survey instrument (The Positive and Negative
Affect Scale (PANAS: Watson, Clark, and Tellegen, 1988), and the short form of the Basic
Psychological Needs at Work Scale (BPNWS: Deci & Ryan, 2004; Van den Broeck, Ferris,
Chang, & Rosen, 2016).
Innovation
The principals and deputy/assistant principals who complete the survey receive interactive
feedback through a dedicated secure website, affording them instant health and wellbeing
checkups tailored to their specific work context. In future iterations of the survey it is hoped
to incorporate feedback to individuals using like-group comparisons. The instant benefit to
individuals has increased both participation rates and the veracity of the information they
submit.
Research Questions
The specific research questions guiding the initial survey were:
Can recognizable occupational health, safety and wellbeing subgroups of principals and
deputy/assistant principals be identified through the survey? These groups may be inferred
from a number of criteria including: Sector; Location (Urban, Suburban, Large Town, Rural,
Remote); Type (Primary, Secondary, Special, Early Childhood,); Background (Family of
Origin, School Education); Person Factors (Gender, Family of Origin and Procreation, Social
Support, Educational Level); Role Factors (Hours worked, number and type of teachers,
students and parents, resources, professional support); Occupational Constraints.
Do(es) any group(s) thrive in the role?
Do(es) any group(s) only just survive in the role?
Do(es) any group(s) show signs of adverse health, safety, and wellbeing outcomes.
11
Do(es) any factors affect these group(s), and in what ways?
Are changes to educational policy or policy implementation suggested by the results?
Impact
The impact of the research in the wider community is highlighted by the mainstream media
coverage: >1,200 TV, Radio, Print and on-line reports appearing between July 2013 –
December 2014, reaching an audience of ~10,000,000 people (~50% of the Australian
population). The “real world impact” is evidenced by changes to political parties’ policies.
Better support for school principals became Green Party policy in 2013, and was named first
priority by incoming Victorian education minister Merlino in December 2014. The research
has been debated in the Tasmanian parliament (28.5.2015) and the WA Parliament
(23.10.2015), a significant real world impact. In 2016 under the new enterprise bargaining
agreement for South Australian principals the SA government allocated .05 FTE to be spent
on principal health and wellbeing, at the principal’s discretion! This is a significant step in
both acknowledging the problems that have been identified in the research, and directing
resources toward tackling it. The autonomy afforded to principals in the freedom to identify
the most efficacious way to allocate this valuable resource is a strong vote of confidence in
SA principals by their employer.
Summary of impact
Year-on-year increase in participation (2011–2016) 2049–5247 participants. Individual
feedback has been welcomed and prompted some to positive behavioural change (e.g., not
letting work interfere so much with family life).
The increase in media coverage has been spectacular (2013: 160 unique insertions reaching
~2.1 million Australians. 2014: >1,200 insertions reaching >10 million, 2015 725 media
insertions reaching 9.1 million Australians), raising awareness of the issues and alerting
politicians to the importance of the issues to the community. In 2014 and 2015 there were
over 50 minutes of prime time TV, and many hours of talk back radio focused on the report.
There is growing interest in replicating the research from a number of jurisdictions. Currently
the survey has run for the second year in Ireland (www.principalhealth.org/ie) and for the
first time in New Zealand (www.principalhealth.org/nz). There is particularly strong interest
from the International Confederation of Principals in conducting the research in multiple
countries. The Ontario Principals Council has applied for funding to conduct the research in
Canada, and most recently the US Elementary and Secondary Principals’ Associations have
requested the research extend to their 95,000 members. These studies will help enormously
with the analysis phase for the Australian survey. We will be able to disentangle cultural and
cross cultural issues from “the human condition” variables, and compare education policies
and policy enactment in various settings to determine the best, evidence based approaches to
address the issues that arise both from within and across contexts.
Perhaps the most important direct impact has been the reaction by the Teachers Health Fund.
Since the release of the 2014 report they have reduced waiting time for new members

12
wishing to access psychological services from 12 to 2 months and added rebates to tele-
psychological services, making distance from capital cities less of a burden.

13
Australia’s School Principals: A 6-year Longitudinal Snapshot
Response Rate
a. Over the 6-years of the survey to date, responses have been collected from
5247 school leaders. This represents approximately ~50% of all principals in
the country with 20-28% completing the survey each year.
b. It is impossible to calculate the response rate of assistants/deputies. They are
not in all schools, and many schools have more than one.
c. Raw numbers suggest a good proportion of those eligible to take part did.
Participants
a. 68.4% Principals; 27.6% Deputies/Assistants; 0.3%Teaching Principals; 0.8%
Acting Principals; 0.7% Directors of Early Childhood settings; 2.2% not
currently principals
b. 59% Primary; 26.1% Secondary; 13.8% Kinder/Primary – Year12; 1% Early
Childhood
c. 58% Female; 42% Male
d. Average age 54.58 years: Age range 25 – 80 years
e. 73.7% Government; 14.7% Catholic; 11.5% Independent
State
Table 1. Participant numbers (N) and percentage proportion of the total
State N % of Sample
NT 156 3.1
NSW 1080 21.2
VIC 1535 30.2
QLD 921 18.1
SA 502 9.9
WA 651 12.8
TAS 128 2.5
ACT 109 2.1
Overseas 2 0
Geolocation figures will be provided again once we receive that data from ACARA
Experience
a. The average level of experience has dropped during the life of the survey as
many principals reach retirement. Years in current role have dropped from 5.2
to 3.8. Years in leadership have dropped from 12.4 to 12.2 years, and time in
teaching before taking up the leadership role has dropped from 12.4 to 11.5.
Average Working Hours
a. Average working hours have remained stable over the 6 years of the survey.
They remain too high for a healthy lifestyle to be maintained.
b. On average, 55% of principals worked upwards of 51-56 hours per week
during term with ~27% working upwards of 61-65 hours per week.
c. During school holidays, ~22% work upwards of 25 hours per week.
The US Department of Health and Human Services found the costs of working too
much include:
i. Working >10 hours a day led to a 60% increased risk of cardiovascular
disease
ii. 10% of those working 50–60 hours a week report relationship
problems, and 30% for those working more than 60 hours.
iii. Working >40 hours per week is associated with

14
1. increased alcohol and tobacco consumption
2. unhealthy weight gain in men
3. depression in women
iv. Little productive work occurs after 50 hours per week.
v. In white collar jobs, productivity declines by as much as 25% when
workers put in 60 hours or more.
vi. Working >60 hours per week led to 23% higher injury hazard rate
(Caruso, Hitchcock, Dick, Russo, & Schmit, 2004).
Salary
a. Annual salaries ranged from <$50,000 - >$160,000 per annum. Average
salary has risen from ~$108,000 -$125,000 per annum during the past 6 years
with a disproportionate number of women consistently in lower paid roles
during the last 6 years. On average women earn ~$5,000 less per annum than
their male colleagues.
Personal achievement and values
a. In 2016 two new scales were added to the survey instrument (The Positive and
Negative Affect Scale (PANAS: Watson, Clark, and Tellegen, 1988), and the
short form of the Basic Psychological Needs at Work Scale (BPNWS: Deci &
Ryan, 2004; Van den Broeck, Ferris, Chang, & Rosen, 2016). Participants
reported significantly higher satisfaction levels for autonomy support,
relatedness to others and competency than the general population on the
BPNWS and were located on the 77th
percentile for Positive Affect and 74th
percentile on the Negative Affect subscales of the PANAS.
b. The importance of personal achievement has increased over the life of the
survey from 3.95 – 4.33/5.
c. The importance of personal relationships with family and friends has remained
stable (4.7/5) and clearly the most important value for the participants of all
listed.
d. Participants report significantly higher job satisfaction than the general
population.
Personal supports and challenges
a. ~86% were in a partner relationship in 2011. This fell to 83.5% in 2016.
However,
i. The numbers of principals who report their partner as “their greatest
source of support” dropped from 84% in 2011 to 71% in 2015 but
rebounded to 81% in 2016.
ii. Most sources of support rebounded in 2016 after declining in 2015 (see
Figure 1).
iii. The number of partners who work in education has also dropped form
41.6% in 2011 to 39% in 2016.
b. Approximately half the participants have children living at home (51-56%).
c. The number of participants who have a family member with a long-term
health condition has increased from ~25% in 2011 to ~ 32% in 2016, with
serious impact on the family also rising from 28-31%.
d. ~41% volunteer their time for community support outside of their role, and a
slightly higher number are active members of formal community or sporting
associations.
e. ~ Regular spiritual practice has fluctuated between 26-35% of participants.

15
Figure 1. Sources of Support 2011-2016
Personal background
a. Participants come from stable backgrounds ~84-88% were living with their
mother and father at age 14.
b. Just under 40% of participants now have a Masters degree or above, mostly in
formal leadership courses, up from 30% in 2011. In 2011 ~75% of those
completing formal leadership courses believed the course helped them to
better cope with the demands of the job. This has declined to 60% in 2016.
Health
a. There are large differences in self-reported health maintenance that have
remained relatively stable across the 6-year period: levels of exercise (Range
1-10, Mean ~5.5); diet (Range 1-10, Mean ~6); and, weight control (Range 1-
10, Mean ~5.5).
b. In 2011 ~49% of participants were taking prescription medication for a
diagnosed condition. This had dropped to ~40% by 2016
c. Most maintain a healthy alcohol intake, and do not use it or prescription
medication to manage stress.
d. Self-rated health, a single item in the survey, has been shown in numerous
studies to accurately predict long term health outcomes, including mortality,

16
cardiovascular diseases, hospitalizations, use of medicine, absence, and early
retirement (Idler, & Benyamini, 1997). Participants’ self-ratings have fallen
slightly during the survey period and remain at ~10% below the population
average.
e. Principals experience high levels of job demands (1.5 times the general
population) emotional demands (1.7 times) and emotional labour (1.7 times)
being the highest demands when compared to the general population. This is
correlated with higher levels of burnout (1.6 times higher), stress symptoms
(1.7 times higher), difficulty sleeping (2.2 times higher), cognitive stress (1.5
times higher), somatic symptoms (1.3 times higher), and, depressive
symptoms (1.3 times higher).
f. ‘Red flag’ responses (thoughts of self-harm and/or global quality of life scores
>2 Standard Deviations below the mean score for principals) has remained
relatively stable at 9-10% of respondents. This result is a serious concern for
the profession as a whole.
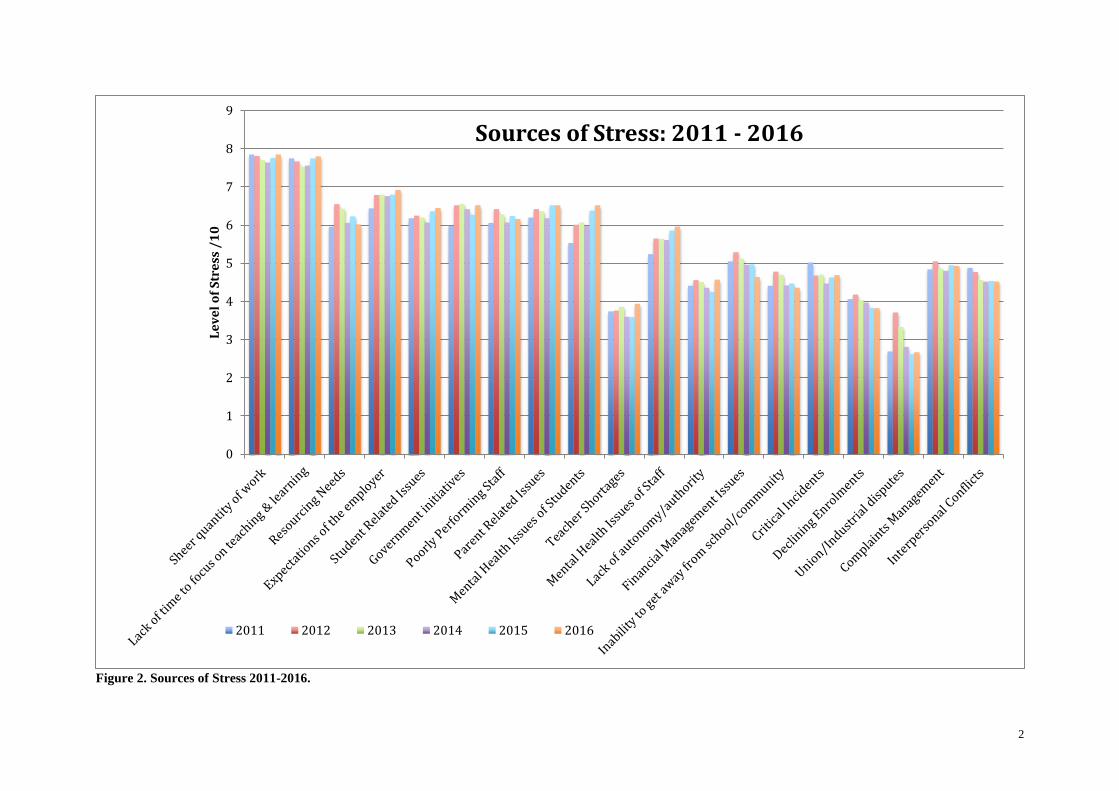
Sources of Stress
a. The two greatest sources of stress that have remained consistently high
(~8/10) over the length of the survey have been
i. Sheer Quantity of Work, and
ii. Lack of Time to Focus on Teaching and Learning
b. The worrying trend over time has been the increase in stress caused by
i. Mental Health Issues of Students (5.5-6.5/10),
ii. Mental Health Issues of Staff (5.2-6/10: see Figure 2).
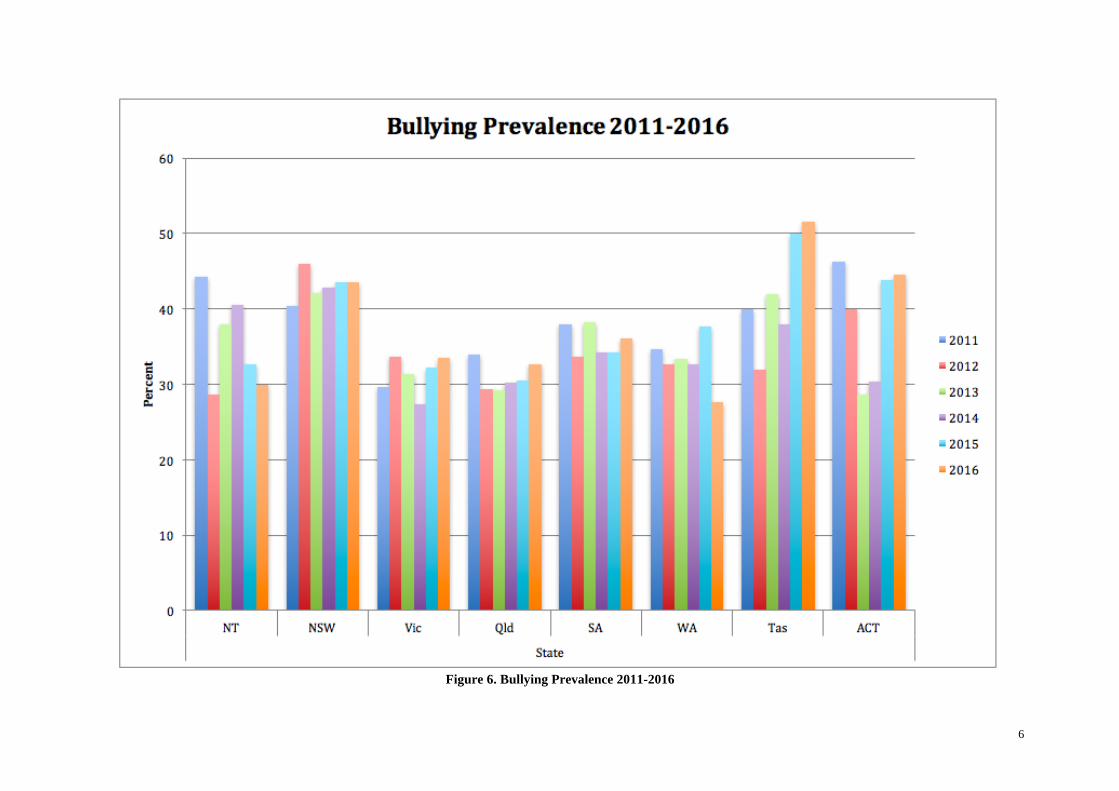
Offensive Behaviour
a. Principals and deputy/assistant principals experience far higher prevalence of
offensive behaviour at work each year than the general population.
b. The prevalence rate for Threats of Violence is extremely high (in 2011, 38%
of participants had been threatened. This rose to 44% by 2016; close to 1 in 2
principals receiving a threat).
c. Actual Physical Violence prevalence has risen from ~27% in 2011 to ~34% in
2016; 1 in 3 principals (now 8.6 times the rate of the general population, up
from 7 times in 2011).
d. Adult-adult bullying has risen from ~34-36% (4.1-4.3 times higher than the
general population); threats of violence (increased from 4.9-5.3 times higher).
e. The prevalence rates vary from state to state with concerning upward trends
reported for NSW, NT, Tasmania and the ACT (see Figures 2-5). Both South
Australia and Queensland have gone against this trend, and seen a fall in
offensive behaviour during the survey period.
Wellbeing
a. Despite having many predictive attributes for high scores on health and
wellbeing (COPSOQ-II; Personal Wellbeing Index) and quality of life
(Assessment of Quality of Life-8D) measures, collectively principals and
deputy/assistant principals score below the general population average.
b. All positive measures (self-rated health; happiness; mental health; coping;
relationships; self-worth; personal wellbeing index) are lower than the
population average.
c. All negative measures are higher than the general population (burnout-1.6
times the population; stress-1.7 times; sleeping troubles-2.2 times; depressive
symptoms-1.3 times; somatic stress symptoms-1.3 times; cognitive stress
symptoms-1.6 times). The differences are detailed in the full report.
2
Figure 2. Sources of Stress 2011-2016.
0
1
2
3
4
5
6
7
8
9
Le
ve
l o
f S
tre
ss /
10
Sources of Stress: 2011 - 2016
2011 2012 2013 2014 2015 2016

3
Figure 3. Participants' experiences of offensive behaviour at the workplace

4
Figure 4. Threats of Violence Prevalence 2011-2016

5
Figure 5. Physical Violence Prevalence 2011-2016
0
10
20
30
40
50
60
NT NSW Vic Qld SA WA Tas ACT
State
Pe
rce
nt
Physical Violence Prevalence 2011-2016
2011
2012
2013
2014
2015
2016
6
Figure 6. Bullying Prevalence 2011-2016

7
Figure 7. Assessment of Quality of Life (AQoL-8D) subscale and super dimension score
8
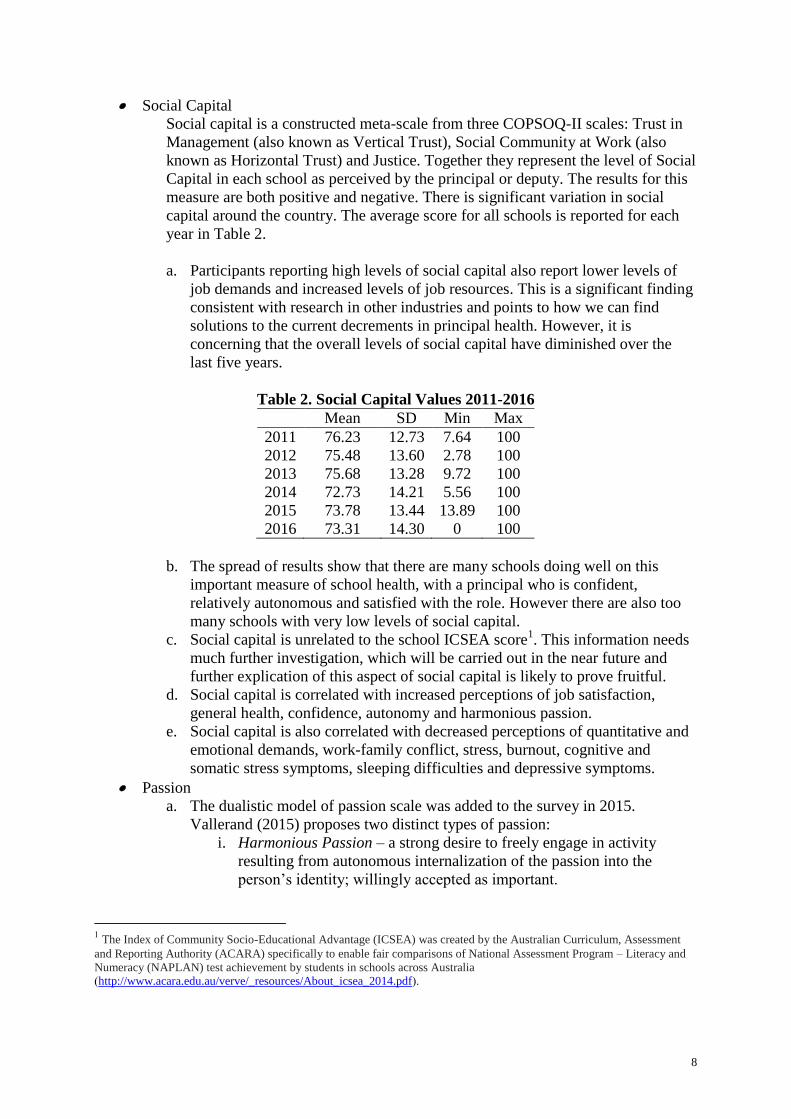
Social Capital
Social capital is a constructed meta-scale from three COPSOQ-II scales: Trust in
Management (also known as Vertical Trust), Social Community at Work (also
known as Horizontal Trust) and Justice. Together they represent the level of Social
Capital in each school as perceived by the principal or deputy. The results for this
measure are both positive and negative. There is significant variation in social
capital around the country. The average score for all schools is reported for each
year in Table 2.
a. Participants reporting high levels of social capital also report lower levels of
job demands and increased levels of job resources. This is a significant finding
consistent with research in other industries and points to how we can find
solutions to the current decrements in principal health. However, it is
concerning that the overall levels of social capital have diminished over the
last five years.
Table 2. Social Capital Values 2011-2016
Mean SD Min Max
2011 76.23 12.73 7.64 100
2012 75.48 13.60 2.78 100
2013 75.68 13.28 9.72 100
2014 72.73 14.21 5.56 100
2015 73.78 13.44 13.89 100
2016 73.31 14.30 0 100
b. The spread of results show that there are many schools doing well on this
important measure of school health, with a principal who is confident,
relatively autonomous and satisfied with the role. However there are also too
many schools with very low levels of social capital.
c. Social capital is unrelated to the school ICSEA score1. This information needs
much further investigation, which will be carried out in the near future and
further explication of this aspect of social capital is likely to prove fruitful.
d. Social capital is correlated with increased perceptions of job satisfaction,
general health, confidence, autonomy and harmonious passion.
e. Social capital is also correlated with decreased perceptions of quantitative and
emotional demands, work-family conflict, stress, burnout, cognitive and
somatic stress symptoms, sleeping difficulties and depressive symptoms.
Passion
a. The dualistic model of passion scale was added to the survey in 2015.
Vallerand (2015) proposes two distinct types of passion:
i. Harmonious Passion – a strong desire to freely engage in activity
resulting from autonomous internalization of the passion into the
person’s identity; willingly accepted as important.
1 The Index of Community Socio-Educational Advantage (ICSEA) was created by the Australian Curriculum, Assessment
and Reporting Authority (ACARA) specifically to enable fair comparisons of National Assessment Program – Literacy and
Numeracy (NAPLAN) test achievement by students in schools across Australia (http://www.acara.edu.au/verve/_resources/About_icsea_2014.pdf).
9
ii. Obsessive Passion (OP) – an uncontrollable urge to partake in the
passion resulting from controlled internalization into one’s identity.
This process originates from intrapersonal and/or interpersonal pressure
because particular contingencies are attached to the passion, such as
feelings of social acceptance, and can overwhelm other aspects of the
person’s life.
b. Most principals describe themselves as passionate educators, so it will be
crucial to determine whether this represents risk or protection as related to
school setting. Indeed, research in education settings in other countries
(Trépanier, Fernet, Austin, Forest & Vallerand, 2014) has shown that
increasing demands in the absence of sufficient resources leads to obsessive
passion, which, in turn, leads to burnout and undermines work engagement.
Conversely, resources in the absence of demands, facilitates harmonious
passion, which, in turn, prevents burnout and facilitates work engagement. The
results for this measure in 2015 are in line with previous studies and
significantly correlated both positively and negatively with the Job Demands
and Resources.
c. ~90% of participants report being passionate (M=5.46, SD=0.93). Harmonious
passion (M=4.1, SD=1.16) was more common than Obsessive passion
(M=2.72, SD=1.07).
d. The combination of social capital and passion may provide significant new
areas for combating the increasing demands of the role. Examples of the
relationships between job demands, outcomes, social capital and the dualistic
model of passion are represented in Figures 4-11 below.
Summary
Job Demands On average, Quantitative Demands, Work Pace, Emotional Demands, Having
to Hide Emotions, Average Working Hours during Term, and Work-family Conflict have
remained very high or increased slightly during the last 5 years. Sources of stress that
remained stable during the period were: Sheer Quantity of Work; Not Enough Time for
Teaching and Learning; and Expectations of the Employer. Sources of stress that increased
were: Resourcing Needs, Student and Parent related issues. The largest increases in stress
were reported for Mental Health Issues of both staff and students. Stress diminished for
Union/Industrial Disputes, Critical Incidents, Financial Management Issues, and Lack of
Autonomy.
Job Resources such as formal leadership education, job satisfaction, degree to which
individuals can influence their work, possibilities for development, variation of work tasks,
meaning of work, commitment to the workplace and level of self-efficacy have all increased.
These resources help individuals cope with increased demands. However, the job demands
and Work-Family Conflict measure indicates a significant and sustained threat to participant
wellbeing.
Positive Trends Participants are reducing their working hours during holiday periods, which
indicates a more appropriate balance between work and life.
Negative Trends Offensive behavior rates and decreasing social support are very concerning.
Health and Wellbeing Outcomes Self-rated health results, as mentioned earlier, is a very
robust measure of future health, so the decline over time is of great concern.

10
Recommendations
Context
The recommendations are designed to help the many stakeholders who are responsible for the
quality of education in Australia. And, there is much to be done if we are to achieve our
potential as a nation. They are the same recommendations published last year, as the situation
across the country continues to trend in the same direction. The recommendations for the
2015 report, re-stated here were framed in such a way that all stakeholders are provided with
potential action items. These are clustered under headings of responsible bodies: Government,
Employers, Community, Schools, Individuals and the Research community. If we improve
the working conditions for principals and teachers we also improve the learning conditions for
students, as the two are inseparable (Leithwood, 2006). The recommendations are addressed
to each stakeholder group, because many of the issues identified during the last six years
represent issues for the nation, not just schools. Therefore, we must all be involved if we are
to build on the positive factors and diminish the entrenched problems. There are particular
challenges to the occupational health, safety and wellbeing of principals and
deputies/assistants which result from contextual and geographical determinates, but most
relate to more general occupational conditions found across the country in every state and
school sector.
The recommendations were developed in response to trends identified over the six waves of
data collection and build on the 2014 recommendations, which have been recast as strategies
under the recommendations. Some of the strategies are beginning to be implemented in
various jurisdictions. In light of these developments, the current recommendations extend to
the aspirational. They are provocative, and some, perhaps many experts would say
unachievable.
The recommendations are based on the best available evidence from both Australia and
internationally. As recommendations, they will not be easily adopted, and will need
coordinated and staged implementation. However, the hope in presenting them this way is
that they will begin a full and frank national conversation about what we want for our future
as a nation. Today’s children are tomorrow’s nation builders. We owe it to them and
ourselves to give them the best opportunities we can. Countless studies show the
transformative nature of education. If we, as a nation, are serious about the key role of
education in the growth and development of this country, then as custodians of the future we
ignore the powerful evidence contained in this, and many other reports at our peril. The
results of this project demonstrate that the educational milieu has shifted over recent times
and we now need to reassess the foundations upon which we build our education systems for
maximum national benefit.
We can learn a great deal from how Finland, a country now admired for its educational
outcomes, coped with a similar cross-roads moment in their history. At a time of economic
difficulty ~40 years ago, they took a powerful and radical decision to invest in their people:
the most important resource any country has. The major policy shift Finland collectively
decided upon was to depoliticize education. Since then they have had 20 changes of
government, but education was not a political issue and did not feature much in election
rhetoric. Then, steadily, Finland became one of the best education systems in the world. It

11
took a long time. It will take time in Australia too. Education systems are simply too complex
for quick fixes.
Since Finland ascended to the top of the PISA table at the turn of this century, researchers
from many other countries have been trying to find the ‘secret’ of their success. Local
academics, who know Finland from the inside as well as education systems worldwide, such
as Pasi Sahlberg, suggest that Finland’s educational success, along with most other countries
at the top of the table, is due in large part to forces outside education directly: equity,
collaboration, creativity, trust-based responsibility, professionalism and equity. This was
confirmed by large studies carried out by the OECD. The “highest performing education
systems are those that combine excellence with equity” (OECD, 2013). Sahlberg (2015) has
also identified the forces that impede school system improvement: competition,
standardization, test-based accountability, de-professionalization and school choice. These
forces are all on the increase in Australia, and in many other countries (Sellar & Lingard,
2014), in the absence of evidence of long-term positive effect.
Sahlberg’s (2015) “Finnish Lessons … portrays an alternate universe, one
that respects educators and enables them to do their best work, one that
recognizes that society has an obligation to ensure the health and well-being of
children. Sahlberg knew that the Finnish story stood in sharp contrast with what
was happening in the United States and other countries” Diane Ravich (2015,
Foreword, para 8).
If Australia were to adopt a similarly courageous decision to the one Finland took five
decades ago, and use the best minds in the country to develop, elaborate and evaluate
effective, context-derived, educational policy in a cycle of continuous improvement we could
expect to achieve similar national gains. However, Australia’s mix of 3- and 4-year political
cycles that intersect across states, territories and nationally does not lend itself to the
development of long-term solutions or long-term evaluation and promulgation of best
practice, so we must start with the fundamentals. If we do not, we are simply deluding
ourselves that we can effect significant change.
Short-term political cycles coupled with heavily politicized educational standpoints from
major parties, has led to slogans rather than policy and short-term interventions open to
further politicization and polemic. This is no surprise. Politicians are experts in politics not
education. For Australian education to progress, we need the healthy clash of ideas in a
complex discussion where experts and communities share the common goal of making
schools the best places for our children; giving them the best opportunities in life. This would
also provide the nation with sustainable, social and therefore economic benefit. Depoliticizing
education would allow conversations aimed at building cases for change with highest quality
evidence drawn from many sources and not driven by short-term political advantage. As the
Finns realized, education is far too important for that.
The evidence from this report and many other studies carried out by the research community
demonstrate that the successful ingredients to a continuously improving system that are
abundant in Finland are generally diminishing in Australia, not growing. However, the good
news from this project is that this is not universally true. The social capital data in particular

12
show that many Australian schools, from all sectors, states and territories, right around the
country have been able to thrive despite the issues outlined in the main report. We need to
learn from these schools and rapidly mobilize the knowledge so that the others can adopt and
adapt their schools with the new knowledge. It appears we are currently enclosed in a system
that nobody wants. Equally important is that no one group is to blame for getting us in this
situation. However, we are all responsible for the continuation of this system because we are
co-creating it every day. In light of the evidence reported in this year’s summary and taking
previous years’ evidence into account, Australia would do well to have a national
conversation about the best way forward. The recommendations are offered in the spirit of
seeding that debate.
15 Recommendations, 6 Foundations, 4 Strategies
In light of the comments above, and offered in the spirit of a national conversation starter, the
following recommendations are offered in the form of what can be done, and who can do it.
The recommendations rest on six foundations:
1. No single stakeholder group is responsible for the state of education in Australia, nor
do they hold the power to effect much change to the system on their own.
2. Many issues impacting negatively on the education system are entrenched in the wider
Australian culture.
3. Taking a long-term, rather than short-term focus is essential for significant
improvement in the system.
4. Taking a holistic inquiry approach to both the successes and failures in the Australian
education system is also essential. We can learn a great deal from both if we do not
limit our gaze, or look for quick fixes.
5. De-politicising education at the macro- and micro-political levels will promote equity,
continuity and transparency. For example the politicisation of the Gonski report,
universally agreed by educators to provide a sensible and equitable way forward in
education, should have set the conditions for a decade of educational development.
Instead, it is suffering the fate of many educationally sensible reforms in Australia and
its potential is being diminished. This becomes demotivating to educators. It is an
example of the ‘moral harassment’ suffered by educators (Burens, 2015).
6. Australian education needs a change of mindset: moving beyond sectorised thinking.
The problems and the solutions are very similar in all sectors so the differences
between the sectors are more superficial than substantive. The variation in social
capital inside schools demonstrates that simple resourcing, while important, is not
going to fix intractable issues. A change of mindset is also needed.
This change of fundamentals in Australian education systems might be difficult, particularly
point 5, but together they hold the greatest chance of long-term success, and there is strong
international evidence to support it.
13
Recommendations
What Governments can do
1. Adopt a whole of government approach to education. This would mean the
federal government, states and territories combining to oversee a single
education budget in a managerial way. All school funding should be
transparent so that anyone, at any level of the system can confidently know
how much money they will have at their disposal so budgeting can be long
term. The role of government should be to fairly set the global amount, not
specify the detail of how it is to be spent. That should be the role of specialist
education bureaucrats working collaboratively across jurisdictions. The
current mixed jurisdiction model is antiquated, complex, obscure and difficult
to traverse. Australia needs bipartisan and cross-jurisdictional agreement
regarding school funding and a transparent mechanism that is simple to
understand. This may be seen as a naïve recommendation, but the demolition
of the Gonski funding model also had a significant symbolic as well as
financial impact on schools. When everyone knows things will change
significantly whenever governments do, it is demotivating for the educators.
We need highly motivated educators, if we are to have the best school system
possible.
2. Stop looking for short-term quick fixes and concentrate on getting a better grip
of the fundamentals (collaboration, creativity, trust-based responsibility,
professionalism and equity). These conditions underpin the whole of society
not simply schools.
What employers can do
3. Take the moral choice of reducing job demands, or increase resources to cope
with increased demands. Better still, do both. This will help to increase the
level of social capital in schools.
4. Trust rather than rule educators. Leave the mechanisms for producing the
best educators to the educators. This will also increase social capital. Long
term increases in social capital helped Finland become the world leader.
What the Professional Associations and Unions can do
5. Collaborate and speak with one voice. Peak bodies and stakeholder groups can discuss
their differences in camera and then speak with one voice publically about the
standing of the profession to Government and the community. The sheer weight of
numbers they collectively represent would mean they would be carefully listened to.
Currently the system is atomised into Primary and Secondary Associations x 3 sectors
x 9 states and territories + 2 unions. While each of these bodies has important
functions and close connections with their membership, which is essential for the
building and maintenance of social capital, their united voice on the big picture issues
that are common to all principals while we live in a politicized education system is
diminished. In Finland there is one union, which advocates for everyone.
14
What the community can do
6. Support your local school. Even if your child does not attend the local school it is an
important part of your community. So support it whenever and however you can.
Schools and communities thrive when they work together. The high variance in social
capital across the country is powerful evidence of both its benefit and the risks
associated with its absence. So the recommendation to the community is if you value
your school and want it to be the best it can be for children, offer to help make it
happen.
7. Stop the offensive behaviour. This is beyond debate. It simply must stop. The real
issue is how to achieve this outcome. The steadily increasing levels of offensive
behaviour across the country in schools of all types should give us pause. But this is
not just occurring in schools, with increases noted in all frontline professions and
domestic violence rates that we should be nationally ashamed about. Australia needs
to have an adult conversation about the root causes of this and set about addressing
them at every level of society.
What schools can do
8. Increase internal social capital. This is best achieved by studying those schools that
have achieved high levels already in spite of the current conditions. Rapid
dissemination of how they have achieved this will contribute to significant
improvement in schools with low levels of social capital. But each school needs to do
this in relation to their resources and particular contexts. This also intersects with
Recommendation 7.
What individual educators can do
9. Increase personal capital (social, human and decisional). At the individual level this
means increasing possibilities for development and exerting influence over the work
based on sound values and moral judgements.
10. Respectfully speak back when faced with “moral harassment”, which is an
occupational threat.
11. Ensure your passions are harmonious. This means to be in control of them. For
example, love your work but do not let it dominate your life (become obsessive about
it). A way to determine if passion is harmonious rather than obsessive is to monitor
energy levels. Harmonious passion energises, so you feel better after engaging in your
passion than when you began. Harmonious passion “… leads to a pervasive level of
self-growth”, while obsessive passion has “corrosive effects” (Vallerand, 2015,
p.334).
12. Take responsibility for your personal work-life balance. Only you can know what is
reasonable for your long-term health and wellbeing. It is therefore incumbent on all of
us to find and maintain a healthy balance. This cannot be done for you from outside
and is too important to be left in other’s control.
What the research community can do
13. There is a need to provide better longitudinal evidence of the differential impact of all
the forces that come to bear on education. Researchers need to be careful that they are
not contributing to the problem by conducting short-term research without appropriate
follow up studies that have been carefully designed to tease out the long-term
15
implications of short-term interventions. An example of the deficiencies of short-term
research relates to dieting. Many diets are successful in the short-term. However, the
long-term outcome is often weight gain. Educational interventions that work in the
short term but lead to worse outcomes long-term are not picked up with short-term
cross-sectional research. The process and true benefit of education is longitudinal.
Students are in the system for over a decade, and the benefits are life-long. Therefore
we need well-designed longitudinal research, well translated for principals and
teachers so that the most efficacious policies, processes and procedures are most
widely adopted. This takes time and the considered and coordinated efforts of a
number of people in the field working together toward better long-term outcomes.
14. Adopt the EMU methodology (Ryan, 2015) to rapidly identify Exemplars of best
practice, accurately and fully Measure the determinants of success, and Utilize the
knowledge in the most efficacious way. This may involve determining thresholds to
identify school communities that will require more resources than they currently have
available to arrest the diminishing returns and reset back to a positive trajectory. This
would allow the targeted use of resources, and create the greatest return on investment
for employers and government.
15. Look for thresholds that may be the key to administering limited resources. The
variance in social capital suggests that while there are many examples of best practice
from which we can and should learn, the paucity in a small percentage of schools
suggests that there may be thresholds below which a school does not have the internal
resources to rapidly utilize new knowledge about best practice and would benefit from
outside support. If researchers can identify robust thresholds, this would enable the
concentration of resources around those who needed them most, and not waste them
on diffuse, but unnecessary distribution.
Principals, deputy/assistant principals and teachers are Australia’s nation builders. They need
to be well resourced, not just logistically, but also symbolically, emotionally, and
intellectually. The Finnish experience suggests that if we too can make courageous decisions
about our national future we will then make it happen. It is time we began the conversation in
earnest.
Strategies
The strategies are designed to help policy makers, (including: government; employer groups;
professional associations; unions; school boards and governors) improve both working
conditions for the paid work force and learning conditions for students, as the two are
inseparable (Leithwood, 2006). They are grouped under thematic headings that emerged from
the data analysis. While there are particular challenges to the occupational health, safety and
wellbeing of principals and deputy/assistant principals which result from contextual and
geographical determinates, they relate to more general occupational conditions found across
the country in every state and school sector. Strategies A-C are relatively straightforward and
consistent with evidence from other countries showing that professional support for principals
provides many benefits that flow through to improved student learning outcomes.
Strategy D addresses the most complex and challenging findings: maintenance of dignity at
work. The results suggest that the need to look for the causes, and reduce the levels, of adult-

16
to-adult bullying, threats of, and actual physical violence in schools is urgently required.
Given that this report reflects six years of consistent results drawn from approximately half of
all principals in the country, the need to address these issues is important. If subsequent waves
of data collection show similar patterns of increasing offensive behaviour, we are likely to see
violence at 10 times the population rate by 2019/20.
The population figures used for comparisons are drawn from a number of large population
studies conducted in Europe. Reducing levels of offensive behaviour will produce significant
educational gains for students. Previous research has shown that the most effective ways to
prevent or diminish bullying and violence are through whole school approaches (Antonio &
Salzfass, 2007; Dake et al., 2003; de Wet, 2010; Espelage et al., 2013; Twemlow, Fonagy, &
Sacco, 2001). The research presented in this report suggests the problem is system-wide and
therefore a system-wide approach is also needed: ideally a whole of government approach.
Strategy A: Improving the wellbeing of principals and deputy/assistant principals through Professional Support
Principals and deputy/assistant principals mostly learn how to deal with the demanding
emotional aspects of the role on the job, rather than through systematic preparation. In other
professions, such as psychology and social work, where highly charged emotional interactions
occur, high levels of professional support and debriefing are standard procedure. This is not
so in education. As a result, the average principals’ and deputy/assistant principals’ wellbeing
survey scores are lower than the average citizen. However, there is a lot of variation and
distinct differences between the principals and deputy/assistant principals who appear to be
coping well with the complexity of the role and those who are not. Professional support is a
strong predictor of coping with the stresses of the role (job demands). Therefore, policies need
to be developed that address this issue directly. In the 21st Century, no principals and
deputy/assistant principals should feel unsupported in the face of growing job complexity,
increased scrutiny stress from public accountability and decreased control over the ways in
which the accountability targets are met (Riley & Langan-Fox, 2013).
The evidence from the cluster analysis in the 2011 report and the findings of this survey
clearly point to the benefits of professional support for all principals and deputy/assistant
principals. Those who receive the least have the greatest challenges to maintain their mental
health. The principals and deputy/assistant principals identified as coping least well with their
daily tasks had the lowest levels of professional support from colleagues and superiors while
those who coped the best reported the highest levels of professional support. This is an area of
improvement that would be relatively easy for education systems to improve.
Provide opportunities for principals and deputy/assistant principals to engage in
professional support networks on a regular basis.
Networks would need to be determined locally, contextually and formally, and
provide opportunities for informal support alongside formal support, outlined in
Recommendation B.
A provision of time for principals and deputy/assistant principals to build and
maintain professional support networks would be needed.
This could be augmented by experienced principal mentors, perhaps retired principals,
visiting schools to provide support in the form of professional conversations (“agenda-
17
less” meetings) allowing school principals and deputy/assistant principals time to
discuss the day-to-day functioning of their schools with a sympathetic, experienced
colleague.
Strategy B. Professional Learning
Systematic attention needs to be paid to the professional learning of principals and
deputy/assistant principals, as targeted professional support. There is a considerable need for
skill development in the emotional aspects of the leadership role outlined in Strategy A:
dealing with the highs and lows associated with the emotional investment of parents in their
children. In-service provision of education on the emotional aspects of teaching, learning,
organizational function, emotional labour, dealing with difficulties and conflicts in the
workplace, employee assistance programs, debriefing self and others would be a great benefit.
Targeted professional learning is likely to make principals and deputy/assistant principals feel
better supported than they currently report. Provision of ongoing professional learning is
likely to assist all principals and deputy/assistant principals in two ways. First, by skill
improvement and secondly through the benefits of increased perceptions of support outlined
in Strategy A.
Strategy C. Review the work practices of Principals and deputy/assistant principals in light of the Job Demands-Resources Model of organizational health
Stress and psychological risk at work can be conceptualised through the balance of job
demands (e.g., workload, time pressures, physical environment, emotional labour) and job
resources (e.g., feedback, rewards, control, job security, support). The Job Demands-
Resources model (Demerouti, Bakker, Nachreiner, & Schaufeli, 2001) along with the
Conservation of Resources theory (Hobfoll, 1989 (Halbesleben, 2006; Hobfoll & Freedy,
1993) posit that work demands and available resources need to be in balance for good
psychological health at work. High job demands lead to exhaustion while low job resources
lead to disengagement, both symptoms of job burnout. However, high job resources buffer job
demands, reducing their negative impact on individuals. Principals and deputies/assistants
report very high demands, out of balance with available resources to buffer the demands.
The average hours spent at work by principals and deputies/assistants ranges between 51-60
hours per week during term time and 25-30 hours per week during gazetted holiday periods.
Too many participants in the survey are working too many hours and it is taking a toll on their
greatest support group; their families. Work-Family conflict occurs at approximately double
the rate for the population generally. The amount of emotional labour expected of principals
and deputies/assistants is 1.7-times that of the population. When job demands are this high,
they need to be balanced with significant resources to buffer the demands. Therefore, all
stakeholders need to be consulted about ways in which this can be achieved. Obvious, but
unlikely to be funded, examples of reducing job demands would be job sharing. However,
working groups tasked with addressing the issues of job demands may identify lower cost and
equally effective solutions to job sharing. What is clear is that this level of demand is
18
dangerous to the long-term health and wellbeing of principals who find consistently that the
resources available to them are not concomitant with the demands.
Strategy D: Address Bullying and Violence
There is an urgent need to establish an independent authority to investigate three types of
offensive behavior identified as consistently occurring in schools:
adult-adult bullying
threats of violence and,
actual violence
The authority should be independent from all stakeholder groups in schools and government.
Specifically, the task force authority should have powers to interview teachers, parents and
students, to investigate:
differences in the occupational risk of the different types of principals and
deputy/assistant principals, to determine who are most at risk, why and what can be
done to protect them.
whether/how the risk also extends to teachers and students.
Governance structures, information flow between adults, and external influences on
school functioning.
The consequences of offensive behaviour in schools are likely to become costly for
employers, through time lost to ill health, OH&S claims against employers’ responsibility for
not providing a safe working environment and reduced functioning while at work as a result
of the high levels of offensive behavior in the workplace. Therefore, the investment in such a
taskforce may prove to be the least expensive option in relation to this issue. The cost to
mental health is high. Price Waterhouse Coopers have recently conducted a Return on
Investment for addressing mental health in the workplace. They found that the impact of not
addressing it amounted to $10.6 billion annually (see, http://www.headsup.org.au/creating-a-
mentally-healthy-workplace/the-business-case). However, they also reported that every dollar
spent on addressing the issue returned $2.30. So, addressing the problem in schools is also a
good investment for the future of the nation.
Summary
Principals, deputy/assistant principals and teachers deal daily with parents’ greatest hopes and
deepest fears: the lives and potential futures of their children. While this is recognized in the
law of loco parentis, the emotional consequences remain under-researched (Hargreaves,
2013; Woolfolk Hoy, 2013). This means high levels of emotion are attached to many aspects
of school functioning, and principals and deputy/assistant principals have to learn how to deal
with this on the job, rather than through systematic preparation. This can be particularly
difficult for principals and deputy/assistant principals who must communicate the way
education policy is both developed and practiced to teachers, parents and students, sometimes
in emotionally charged situations. The difficulties between the adult stakeholders in schools
that have been consistently reported in every year of the survey need to be acknowledged and
dealt with on a more systematic basis. Systematic attention also needs to be paid to the
professional learning of principals and deputy/assistant principals, and presumably teachers,
in the emotional aspects of their roles and the emotional investment of parents in their
children, which may underlie the high rate of violence and threats principals and
deputy/assistant principals are experiencing. In-service provision of education on the
19
emotional aspects of teaching, learning, organizational function, emotional labour, dealing
with difficulties and conflicts in the workplace, employee assistance programs, debriefing self
and others appears to be urgently needed.
__________
2
Technical Report 2016 Data
The following pages report the 2016 data in detail. The report is broken up by section.
Section 1 covers the dimensions of the Copenhagen Psychosocial Questionnaire and uses the
population figures from the original work (Pejtersen, Kristensen, Borg, & Bjorner, 2010).
Section 2 covers Sources of Stress. Section 3 covers Sources of Support. Section 4 covers
Quality of Life and uses population figures from the original work in Australia (Richardson,
Khan, Iezzi, & Maxwell, 2013). Sections 5 (Social Capital) and Section 6 (Dualistic Model of
Passion) reports preliminary findings on the relationships between these two new important
additions to the survey and different aspects of Job Demands and Resources theory on which
the survey is largely built (Bakker, & Demerouti, 2014).
For each dimension the scores are presented as trends over time first. Then the 2015 data is
reported in a table to facilitate easy comparisons on one page and then each subscale is
represented graphically by State, Sector, Level, Role, and in comparison with population
norms.
The data reported here are descriptive in nature. More detailed statistical analyses will follow
in 2016 and further reports will become available as the work progresses.
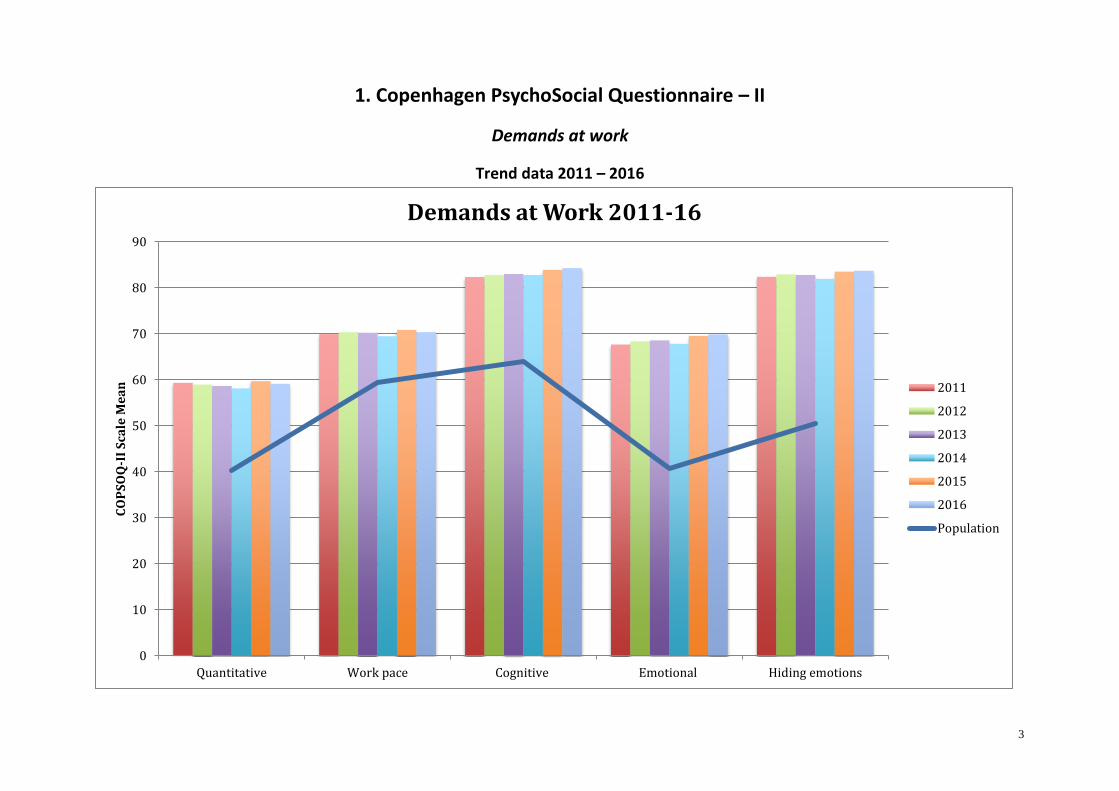
3
1. Copenhagen PsychoSocial Questionnaire – II
Demands at work
Trend data 2011 – 2016
0
10
20
30
40
50
60
70
80
90
Quantitative Work pace Cognitive Emotional Hiding emotions
CO
PS
OQ
-II
Sca
le M
ea
n
Demands at Work 2011-16
2011
2012
2013
2014
2015
2016
Population
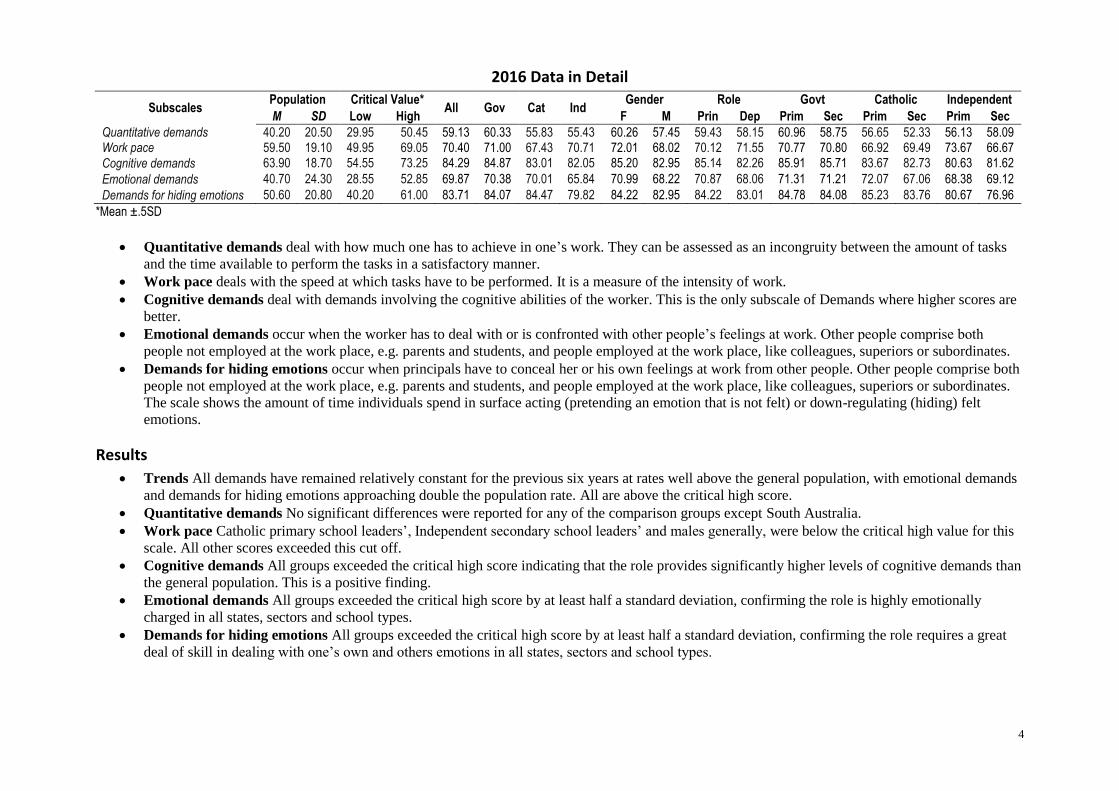
4
2016 Data in Detail
Subscales Population Critical Value*
All Gov Cat Ind Gender Role Govt Catholic Independent
M SD Low High F M Prin Dep Prim Sec Prim Sec Prim Sec
Quantitative demands 40.20 20.50 29.95 50.45 59.13 60.33 55.83 55.43 60.26 57.45 59.43 58.15 60.96 58.75 56.65 52.33 56.13 58.09 Work pace 59.50 19.10 49.95 69.05 70.40 71.00 67.43 70.71 72.01 68.02 70.12 71.55 70.77 70.80 66.92 69.49 73.67 66.67
Cognitive demands 63.90 18.70 54.55 73.25 84.29 84.87 83.01 82.05 85.20 82.95 85.14 82.26 85.91 85.71 83.67 82.73 80.63 81.62
Emotional demands 40.70 24.30 28.55 52.85 69.87 70.38 70.01 65.84 70.99 68.22 70.87 68.06 71.31 71.21 72.07 67.06 68.38 69.12
Demands for hiding emotions 50.60 20.80 40.20 61.00 83.71 84.07 84.47 79.82 84.22 82.95 84.22 83.01 84.78 84.08 85.23 83.76 80.67 76.96
*Mean ±.5SD
Quantitative demands deal with how much one has to achieve in one’s work. They can be assessed as an incongruity between the amount of tasks
and the time available to perform the tasks in a satisfactory manner.
Work pace deals with the speed at which tasks have to be performed. It is a measure of the intensity of work.
Cognitive demands deal with demands involving the cognitive abilities of the worker. This is the only subscale of Demands where higher scores are
better.
Emotional demands occur when the worker has to deal with or is confronted with other people’s feelings at work. Other people comprise both
people not employed at the work place, e.g. parents and students, and people employed at the work place, like colleagues, superiors or subordinates.
Demands for hiding emotions occur when principals have to conceal her or his own feelings at work from other people. Other people comprise both
people not employed at the work place, e.g. parents and students, and people employed at the work place, like colleagues, superiors or subordinates.
The scale shows the amount of time individuals spend in surface acting (pretending an emotion that is not felt) or down-regulating (hiding) felt
emotions.
Results
Trends All demands have remained relatively constant for the previous six years at rates well above the general population, with emotional demands
and demands for hiding emotions approaching double the population rate. All are above the critical high score.
Quantitative demands No significant differences were reported for any of the comparison groups except South Australia.
Work pace Catholic primary school leaders’, Independent secondary school leaders’ and males generally, were below the critical high value for this
scale. All other scores exceeded this cut off.
Cognitive demands All groups exceeded the critical high score indicating that the role provides significantly higher levels of cognitive demands than
the general population. This is a positive finding.
Emotional demands All groups exceeded the critical high score by at least half a standard deviation, confirming the role is highly emotionally
charged in all states, sectors and school types.
Demands for hiding emotions All groups exceeded the critical high score by at least half a standard deviation, confirming the role requires a great
deal of skill in dealing with one’s own and others emotions in all states, sectors and school types.

5
Quantitative Demands disaggregated by State, Sector, Level, Role and compared with the General Population
____________________________________________________________________________________________________________________
0.00
10.00
20.00
30.00
40.00
50.00
60.00
70.00
80.00
90.00
NT NSW Vic Qld SA WA Tas ACT
Quantitative demands
0.00
10.00
20.00
30.00
40.00
50.00
60.00
70.00
80.00
90.00
Prim Sec Prim Sec Prim Sec
Govt Catholic Independent
Quantitative demands
0
10
20
30
40
50
60
70
80
90
Population Principal Deputy
Quantitative demands

6
Work Pace disaggregated by State, Sector, Level, Role and compared with the General Population
____________________________________________________________________________________________________________________
0.00
10.00
20.00
30.00
40.00
50.00
60.00
70.00
80.00
90.00
NT NSW Vic Qld SA WA Tas ACT
Work pace
0.00
10.00
20.00
30.00
40.00
50.00
60.00
70.00
80.00
90.00
Prim Sec Prim Sec Prim Sec
Govt Catholic Independent
Work pace
0
10
20
30
40
50
60
70
80
90
Population Principal Deputy
Work pace

7
Cognitive Demands disaggregated by State, Sector, Level, Role and compared with the General Population
____________________________________________________________________________________________________________________
0.00
10.00
20.00
30.00
40.00
50.00
60.00
70.00
80.00
90.00
NT NSW Vic Qld SA WA Tas ACT
Cognitive demands
0.00
10.00
20.00
30.00
40.00
50.00
60.00
70.00
80.00
90.00
Prim Sec Prim Sec Prim Sec
Govt Catholic Independent
Cognitive demands
0
10
20
30
40
50
60
70
80
90
Population Principal Deputy
Cognitive demands
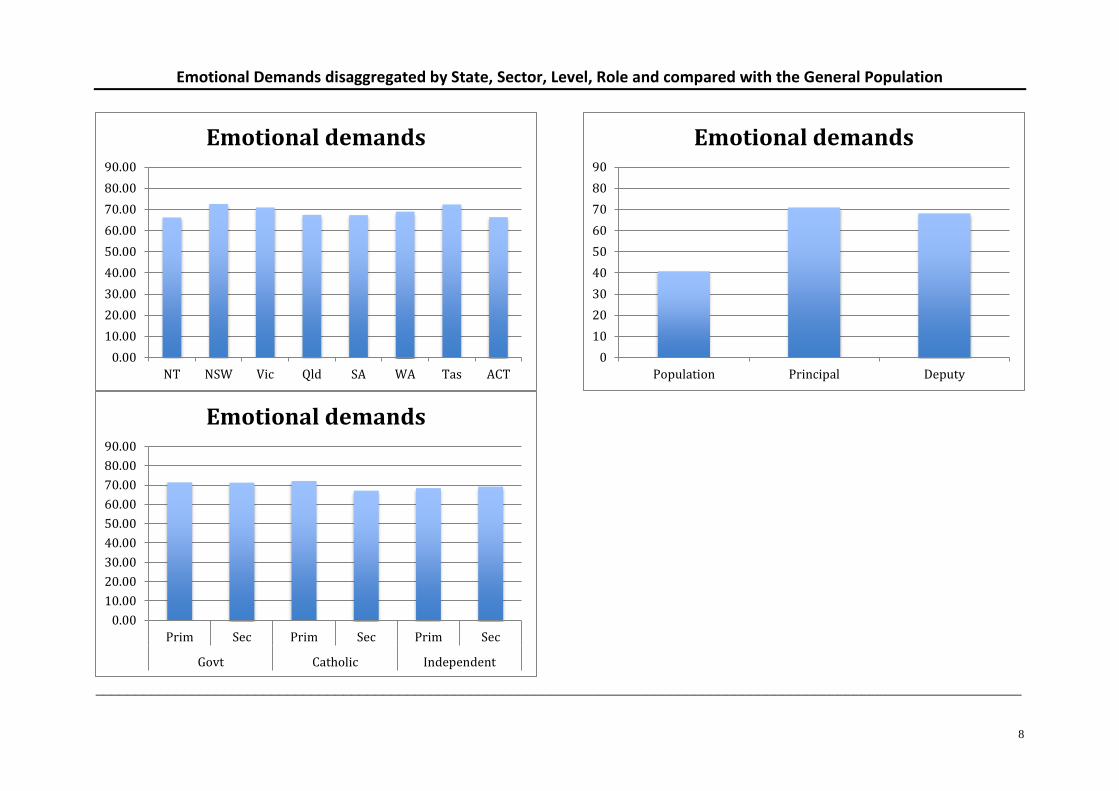
8
Emotional Demands disaggregated by State, Sector, Level, Role and compared with the General Population
____________________________________________________________________________________________________________________
0.00
10.00
20.00
30.00
40.00
50.00
60.00
70.00
80.00
90.00
NT NSW Vic Qld SA WA Tas ACT
Emotional demands
0.00
10.00
20.00
30.00
40.00
50.00
60.00
70.00
80.00
90.00
Prim Sec Prim Sec Prim Sec
Govt Catholic Independent
Emotional demands
0
10
20
30
40
50
60
70
80
90
Population Principal Deputy
Emotional demands
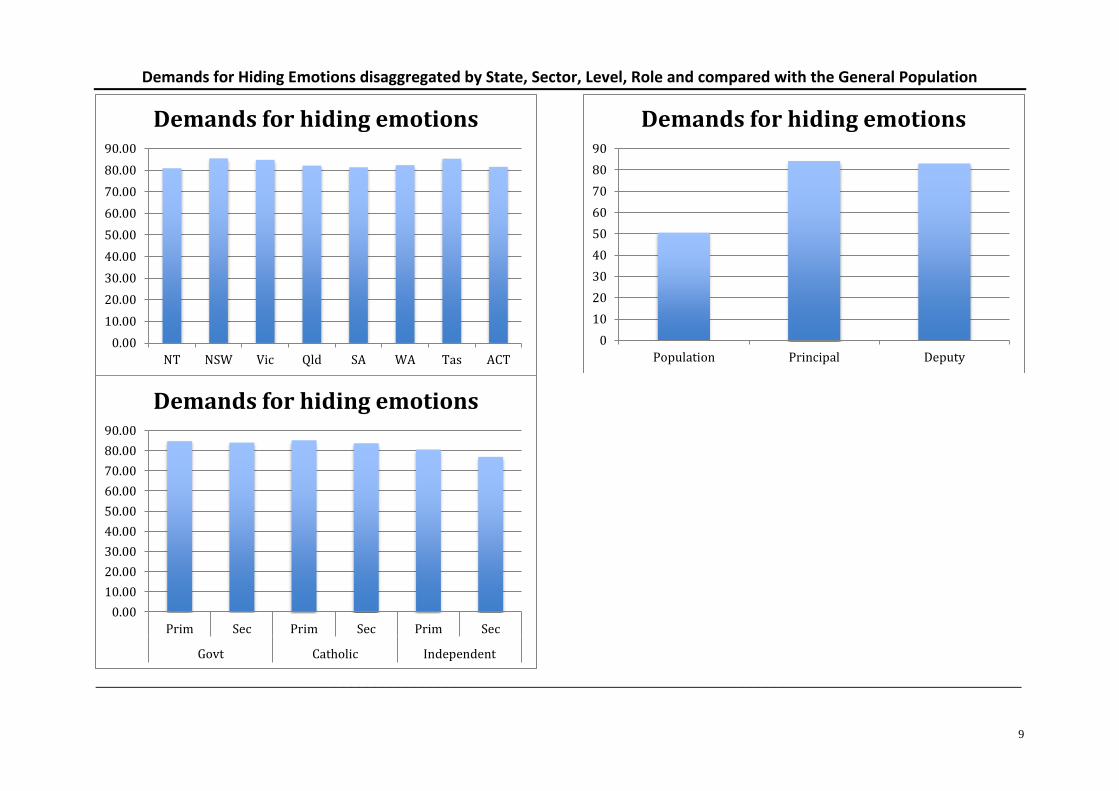
9
Demands for Hiding Emotions disaggregated by State, Sector, Level, Role and compared with the General Population
____________________________________________________________________________________________________________________
0.00
10.00
20.00
30.00
40.00
50.00
60.00
70.00
80.00
90.00
NT NSW Vic Qld SA WA Tas ACT
Demands for hiding emotions
0.00
10.00
20.00
30.00
40.00
50.00
60.00
70.00
80.00
90.00
Prim Sec Prim Sec Prim Sec
Govt Catholic Independent
Demands for hiding emotions
0
10
20
30
40
50
60
70
80
90
Population Principal Deputy
Demands for hiding emotions

10
Work Organisation and Job Contents
Trend data 2011 – 2016
0
10
20
30
40
50
60
70
80
90
100
Influence Possibilities fordevelopment
Variation Meaning of work Commitment to theworkplace
CO
PS
OQ
-II
Sca
le M
ea
n
Work Organisation & Job Contents 2011-2016
2011
2012
2013
2014
2015
2016
Population

11
2016 Data in detail
Subscales Population Critical Value*
All Gov Cat Ind Gender Role Govt Catholic Independent
M SD Low High F M Prin Dep Prim Sec Prim Sec Prim Sec
Influence 49.80 21.20 39.20 60.40 57.37 55.71 61.14 63.93 56.15 59.17 58.91 53.77 57.01 58.91 61.13 64.62 69.00 68.75
Possibilities for development 65.90 17.60 57.10 74.70 81.91 81.38 83.67 83.14 83.19 80.00 83.29 78.25 83.08 83.73 84.26 84.00 88.38 81.62
Variation 60.40 21.40 49.70 71.10 65.48 64.86 67.78 66.65 66.59 63.85 66.24 63.54 65.44 66.03 67.32 69.70 66.25 66.18
Meaning of work 73.80 15.80 65.90 81.70 85.61 85.38 85.86 86.98 86.71 83.98 86.73 82.64 86.18 88.75 85.64 88.70 89.17 88.24
Commitment to the workplace 60.90 20.40 50.70 71.10 72.42 72.05 72.20 75.47 73.61 70.65 73.63 68.97 72.40 77.63 71.99 74.05 77.50 80.15
*Mean ±.5SD
Influence at work deals with the degree to which the employee can influence aspects of work itself, ranging from planning of work to the order of
tasks.
Possibilities for Development assesses if the tasks are challenging for the employee and if the tasks provide opportunities for learning and thus
opportunities for development not only in the job but also at the personal level. Lack of development can create apathy, helplessness and passivity.
Variation of work deals with the degree to which work (tasks, work process) is varied, that is if tasks are or are not repetitive.
Meaning of Work concerns both the meaning of the aim of work tasks and the meaning of the context of work tasks. The aim is “vertical”: that the
work is related to a more general purpose, such as providing students with a good education. Context is “horizontal”: that one can see how ones’ own
work contributes to the overall product of the organisation.
Commitment to the Workplace deals with the degree to which one experiences being committed to ones’ workplace. It is not the work by itself or
the work group that is the focus here, but the organization in which one is employed.
Results
Trends Work organisation and job contents have remained relatively constant for the previous six years.
Influence at work Catholic and Independent school principals and deputies average scores were just above the critical high score indicating
noticeably more influence than the general population.
Possibilities for Development All groups’ average scores are above the critical high score indicating they have noticeably more possibilities for
developing than the general population.
Variation All groups were within half of one standard deviation of the general population suggesting their work is not noticeably more or less varied
than the general population.
Meaning of Work All groups report high average scores on this dimension. They therefore get noticeably more meaning from their work than the
general population.
Commitment to the Workplace Deputy principals were the only group not to exceed the critical high score. However, they fell short by ~1 point
suggesting that all participants are noticeably more committed to their workplaces than the general population.
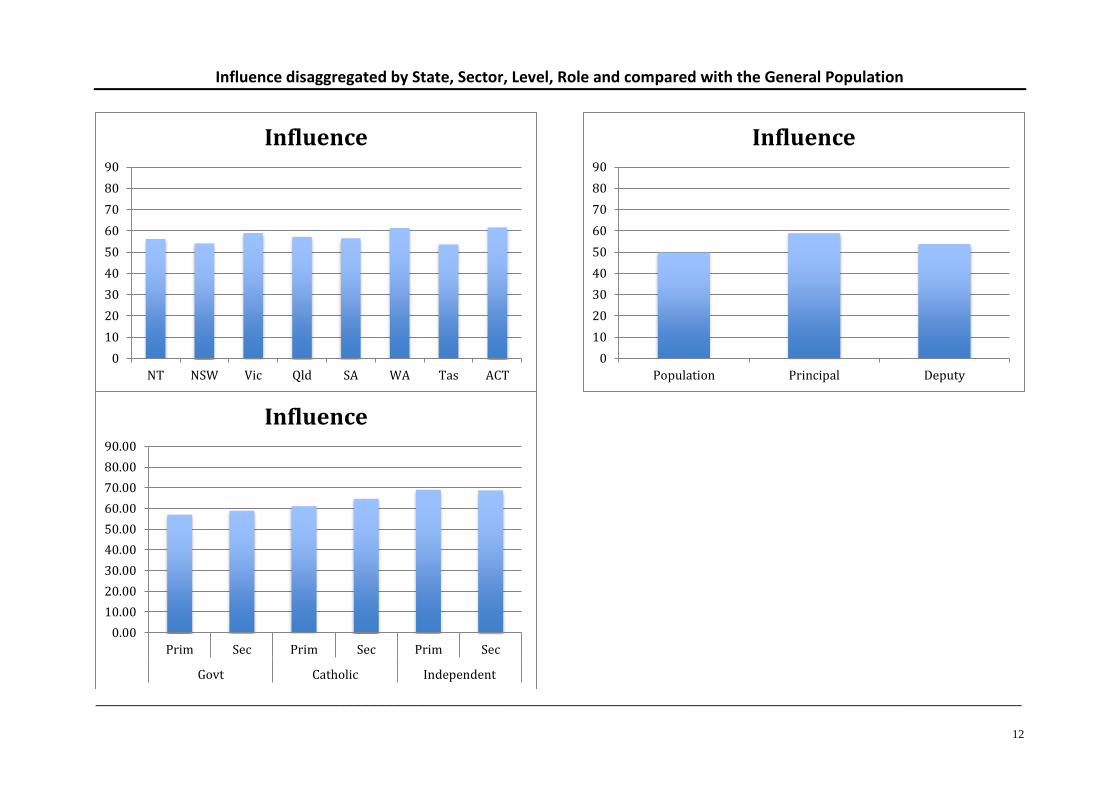
12
Influence disaggregated by State, Sector, Level, Role and compared with the General Population
____________________________________________________________________________________________________________________
0
10
20
30
40
50
60
70
80
90
NT NSW Vic Qld SA WA Tas ACT
Influence
0.00
10.00
20.00
30.00
40.00
50.00
60.00
70.00
80.00
90.00
Prim Sec Prim Sec Prim Sec
Govt Catholic Independent
Influence
0
10
20
30
40
50
60
70
80
90
Population Principal Deputy
Influence

13
Possibilities for Development disaggregated by State, Sector, Level, Role and compared with the General Population
____________________________________________________________________________________________________________________
0
10
20
30
40
50
60
70
80
90
NT NSW Vic Qld SA WA Tas ACT
Possibilities for development
0.00
10.00
20.00
30.00
40.00
50.00
60.00
70.00
80.00
90.00
Prim Sec Prim Sec Prim Sec
Govt Catholic Independent
Possibilities for development
0
10
20
30
40
50
60
70
80
90
Population Principal Deputy
Possibilities for development

14
Variation disaggregated by State, Sector, Level, Role and compared with the General Population
____________________________________________________________________________________________________________________
0
10
20
30
40
50
60
70
80
90
NT NSW Vic Qld SA WA Tas ACT
Variation
0.00
10.00
20.00
30.00
40.00
50.00
60.00
70.00
80.00
90.00
Prim Sec Prim Sec Prim Sec
Govt Catholic Independent
Variation
0
10
20
30
40
50
60
70
80
90
Population Principal Deputy
Variation
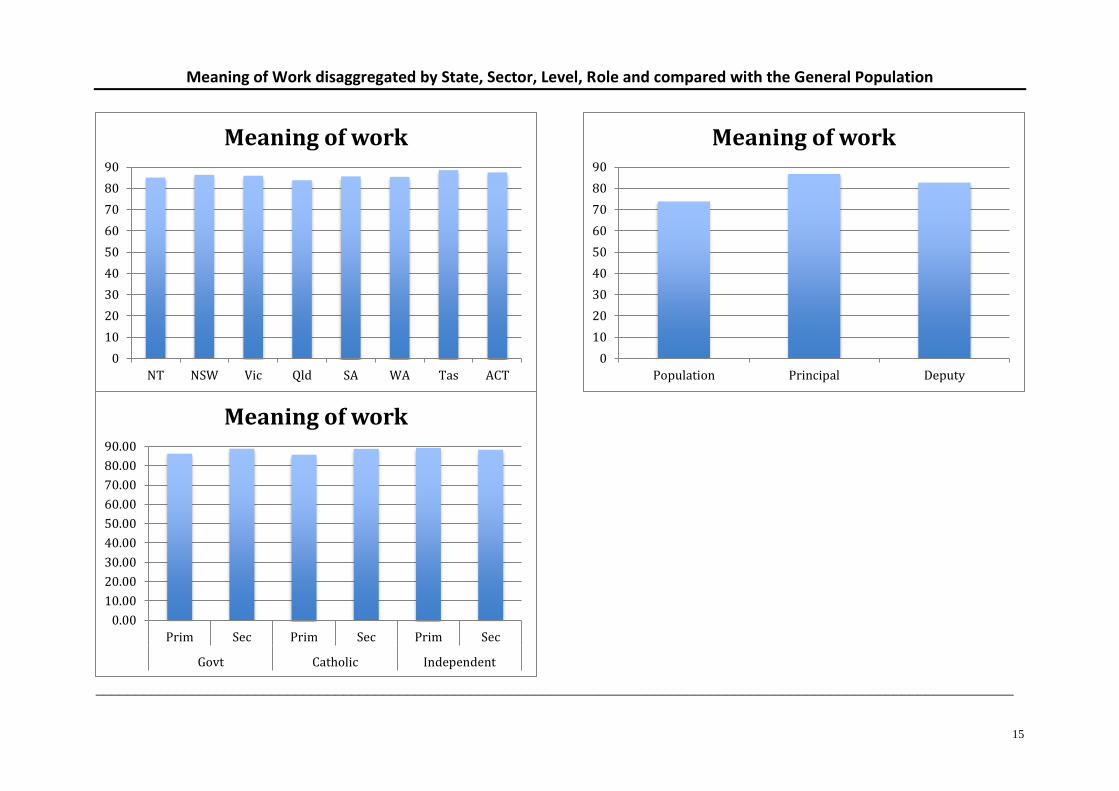
15
Meaning of Work disaggregated by State, Sector, Level, Role and compared with the General Population
___________________________________________________________________________________________________________________
0
10
20
30
40
50
60
70
80
90
NT NSW Vic Qld SA WA Tas ACT
Meaning of work
0.00
10.00
20.00
30.00
40.00
50.00
60.00
70.00
80.00
90.00
Prim Sec Prim Sec Prim Sec
Govt Catholic Independent
Meaning of work
0
10
20
30
40
50
60
70
80
90
Population Principal Deputy
Meaning of work
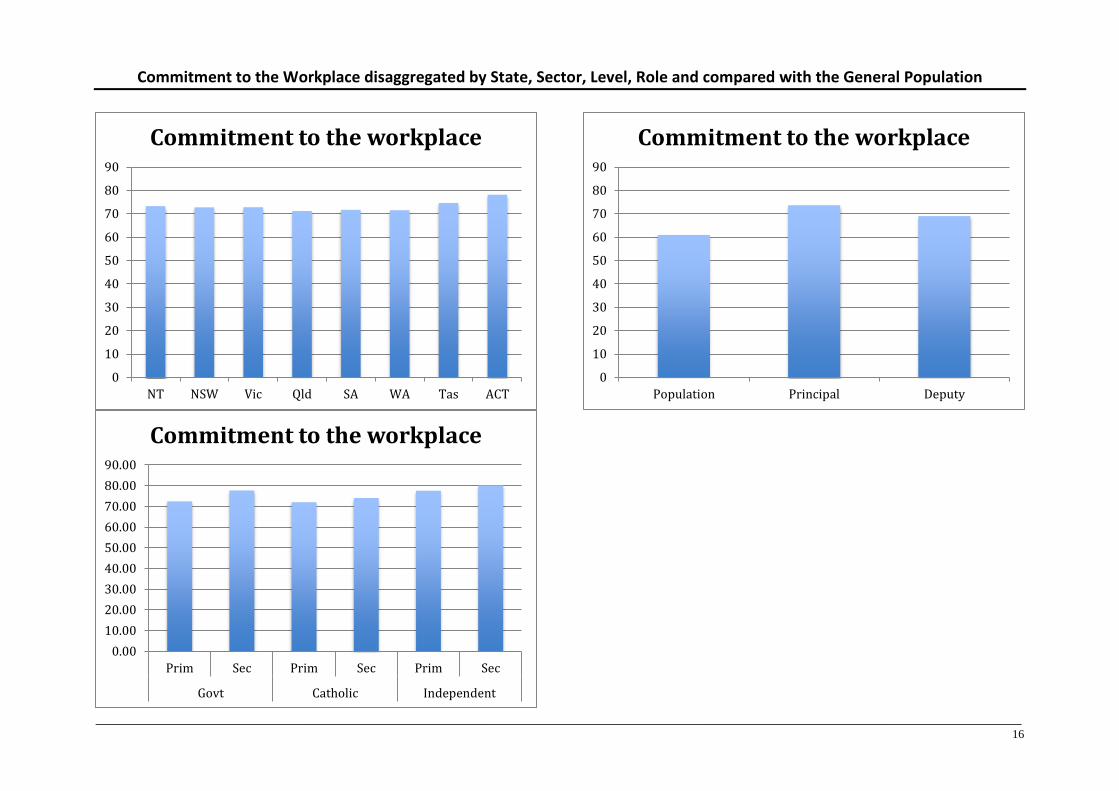
16
Commitment to the Workplace disaggregated by State, Sector, Level, Role and compared with the General Population
____________________________________________________________________________________________________________________
0
10
20
30
40
50
60
70
80
90
NT NSW Vic Qld SA WA Tas ACT
Commitment to the workplace
0.00
10.00
20.00
30.00
40.00
50.00
60.00
70.00
80.00
90.00
Prim Sec Prim Sec Prim Sec
Govt Catholic Independent
Commitment to the workplace
0
10
20
30
40
50
60
70
80
90
Population Principal Deputy
Commitment to the workplace

17
Interpersonal Relations & Leadership
Trend data 2011 – 2016
0
10
20
30
40
50
60
70
80
90
Predictability Recognition(Reward)
Role clarity Role conflicts Quality ofleadership
Socialsupport from
colleagues:Inside school
Socialsupport from
colleagues:Outsideschool
Socialsupport from
supervisor
Socialcommunity at
work
CO
PS
OQ
-II
Sca
le M
ea
n
Interpersonal Relations & Leadership 2011-2016
2011
2012
2013
2014
2015
2016
Population

18
2016 Data in Detail
Subscales Population Critical Value*
All Gov Cat Ind Gender Role Govt Catholic Independent
M SD Low High F M Prin Dep Prim Sec Prim Sec Prim Sec
Predictability 57.70 20.90 47.25 68.15 59.05 57.02 63.71 66.84 57.87 60.79 58.13 61.70 55.12 56.32 64.04 67.16 66.25 63.97
Recognition (Reward) 66.20 19.90 56.25 76.15 65.46 63.65 68.00 74.94 65.14 65.93 63.11 71.93 59.53 65.29 65.46 72.92 79.17 76.47
Role clarity 73.50 16.40 65.30 81.70 79.57 79.38 80.63 79.21 79.99 78.93 81.21 75.63 81.40 82.11 81.26 82.06 82.00 81.86
Role conflicts 42.00 16.60 33.70 50.30 50.20 51.12 50.76 42.41 49.57 51.14 51.74 46.39 52.40 52.96 52.03 51.69 43.38 44.49
Quality of leadership 55.30 21.10 44.75 65.85 55.63 55.23 55.22 59.19 55.67 55.55 53.28 61.71 51.74 54.85 53.21 56.91 61.33 55.51
Social support: colleagues Inside school 57.30 19.70 47.45 67.15 60.72 60.83 60.63 60.07 61.86 59.05 61.00 59.81 61.51 61.62 60.45 60.31 60.50 66.18 Social support: colleagues Outside school 57.30 19.70 47.45 67.15 50.57 50.39 53.11 47.92 52.44 47.82 53.12 43.68 53.01 54.24 54.90 53.81 49.67 53.92
Social support from supervisor 61.60 22.40 50.40 72.80 49.36 47.89 52.18 56.02 49.79 48.73 46.62 56.48 43.70 47.56 49.75 53.45 57.48 56.25
Social community at work 78.70 18.90 69.25 88.15 78.15 77.98 78.08 79.53 78.61 77.47 78.87 76.21 79.12 79.93 78.07 77.44 82.17 80.88
*Mean ±.5SD
Predictability deals with the means to avoid uncertainty and insecurity. This is achieved if employees receive the relevant information at the right
time.
Recognition (Reward) deals with the recognition by the management of your effort at work.
Role Clarity deals with the employee's understanding of her or his role at work, e.g., content of tasks, expectations to be met and her or his
responsibilities.
Role Conflicts stem from two sources. The first source is about possible inherent conflicting demands within a specific task. The second source is
about possible conflicts when prioritising different tasks.
Quality of Leadership deals with the next higher managers’ leadership in different contexts and domains. For many principals, this is a regional
leader, but may be interpreted by some as school board chairperson, particularly in the independent sector.
Social support from colleagues inside and outside the school deals with principals’ impressions of the possibility to obtain support from colleagues
if one should need it.
Social community at work concerns whether there is a feeling of being part of the group of employees at the workplace, e.g. if employee’s relations
are good and if they work well together.
Results
Trends Predictability and Recognition (Reward) has been trending down over the last 6 years, as has Social Support from Supervisors and Quality of
Leadership. However, Social Support from Colleagues Inside School has trended up on average. All other scales have remained steady over time.
Predictability No group reported average scores above the critical high score suggesting no difference in work predictability than the general
population.
Recognition (Reward) Only Independent principals reported average scores above the critical high score suggesting noticeably higher levels of
recognition than the general population.
Role Clarity Government secondary school leaders along with Catholic and Independent principals report noticeably higher scores than the general
population.
19
Role Conflicts The groups who report on average noticeably higher levels of role conflict than the general population are: Males but not Females;
Principals but not Deputies; and, Independent Primary and Secondary school leaders.
Quality of Leadership No group reported the quality of leadership (that they report to) as being noticeably different from the general population.
However, there were some significant differences within groups. Victoria and Western Australia report lower perceived quality of leadership than the
other states and principals report much lower perceived quality of their leaders than their deputies do, suggesting that on average the quality of
principal leadership throughout the country exceeds that of their up-line managers.
Social support from colleagues inside and outside the school is reported at levels very close to the general population.
Social community at work is also reported at levels very close to the general population.

20
Predictability disaggregated by State, Sector, Level, Role and compared with the General Population
____________________________________________________________________________________________________________________
0
10
20
30
40
50
60
70
80
90
NT NSW Vic Qld SA WA Tas ACT
Predictability
0.00
10.00
20.00
30.00
40.00
50.00
60.00
70.00
80.00
90.00
Prim Sec Prim Sec Prim Sec
Govt Catholic Independent
Predictability
0
10
20
30
40
50
60
70
80
90
Population Principal Deputy
Predictability
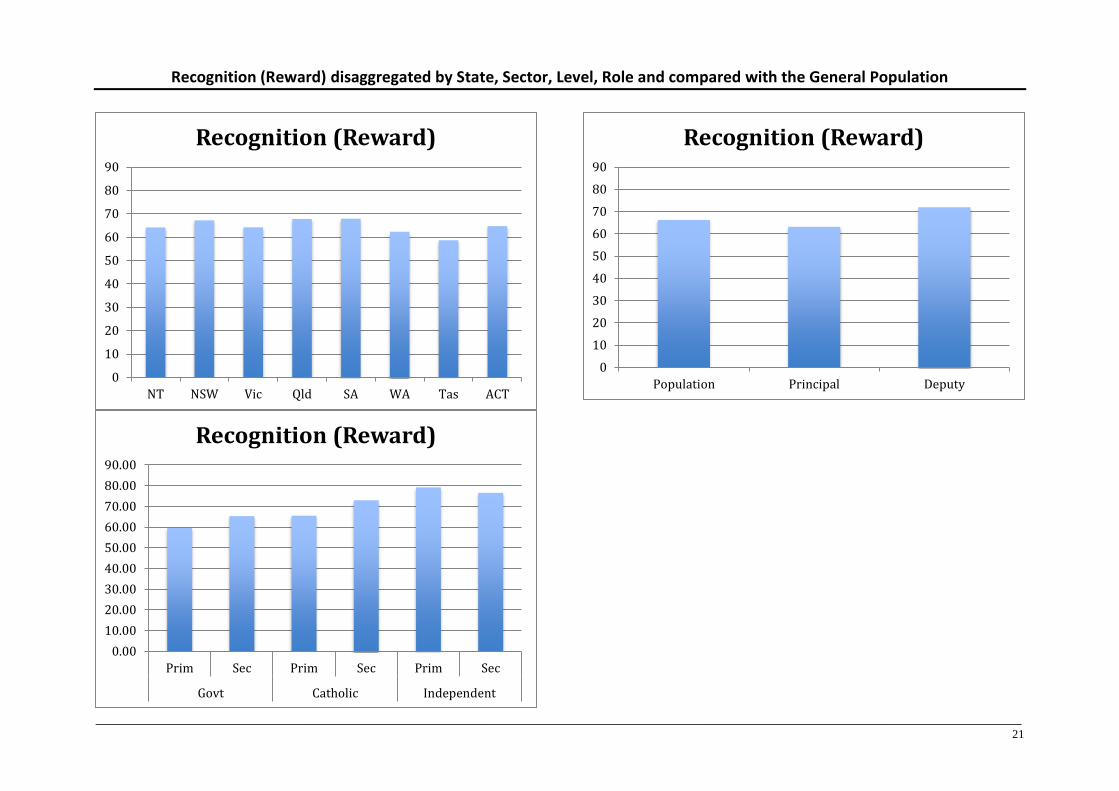
21
Recognition (Reward) disaggregated by State, Sector, Level, Role and compared with the General Population
____________________________________________________________________________________________________________________
0
10
20
30
40
50
60
70
80
90
NT NSW Vic Qld SA WA Tas ACT
Recognition (Reward)
0.00
10.00
20.00
30.00
40.00
50.00
60.00
70.00
80.00
90.00
Prim Sec Prim Sec Prim Sec
Govt Catholic Independent
Recognition (Reward)
0
10
20
30
40
50
60
70
80
90
Population Principal Deputy
Recognition (Reward)

22
Role Clarity disaggregated by State, Sector, Level, Role and compared with the General Population
____________________________________________________________________________________________________________________
0
10
20
30
40
50
60
70
80
90
NT NSW Vic Qld SA WA Tas ACT
Role clarity
0.00
10.00
20.00
30.00
40.00
50.00
60.00
70.00
80.00
90.00
Prim Sec Prim Sec Prim Sec
Govt Catholic Independent
Role clarity
0
10
20
30
40
50
60
70
80
90
Population Principal Deputy
Role clarity

23
Role Conflicts disaggregated by State, Sector, Level, Role and compared with the General Population
____________________________________________________________________________________________________________________
0
10
20
30
40
50
60
70
80
90
NT NSW Vic Qld SA WA Tas ACT
Role conflicts
0.00
10.00
20.00
30.00
40.00
50.00
60.00
70.00
80.00
90.00
Prim Sec Prim Sec Prim Sec
Govt Catholic Independent
Role conflicts
0
10
20
30
40
50
60
70
80
90
Population Principal Deputy
Role conflicts
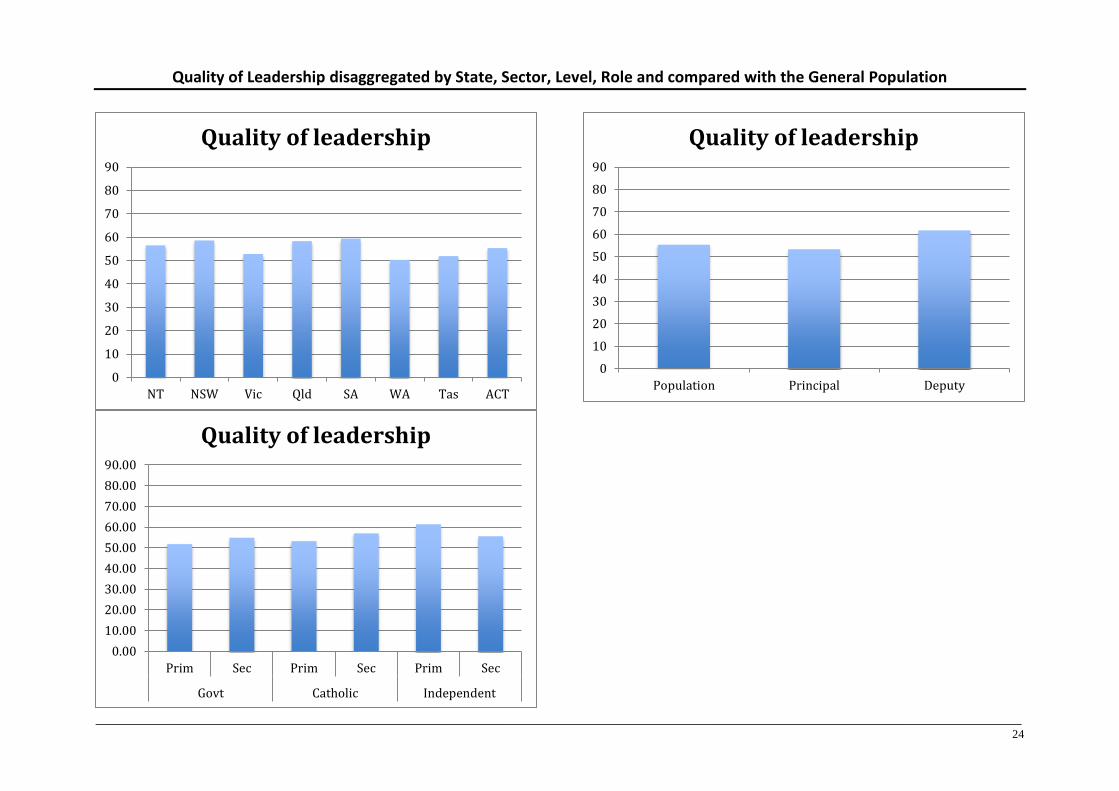
24
Quality of Leadership disaggregated by State, Sector, Level, Role and compared with the General Population
____________________________________________________________________________________________________________________
0
10
20
30
40
50
60
70
80
90
NT NSW Vic Qld SA WA Tas ACT
Quality of leadership
0.00
10.00
20.00
30.00
40.00
50.00
60.00
70.00
80.00
90.00
Prim Sec Prim Sec Prim Sec
Govt Catholic Independent
Quality of leadership
0
10
20
30
40
50
60
70
80
90
Population Principal Deputy
Quality of leadership
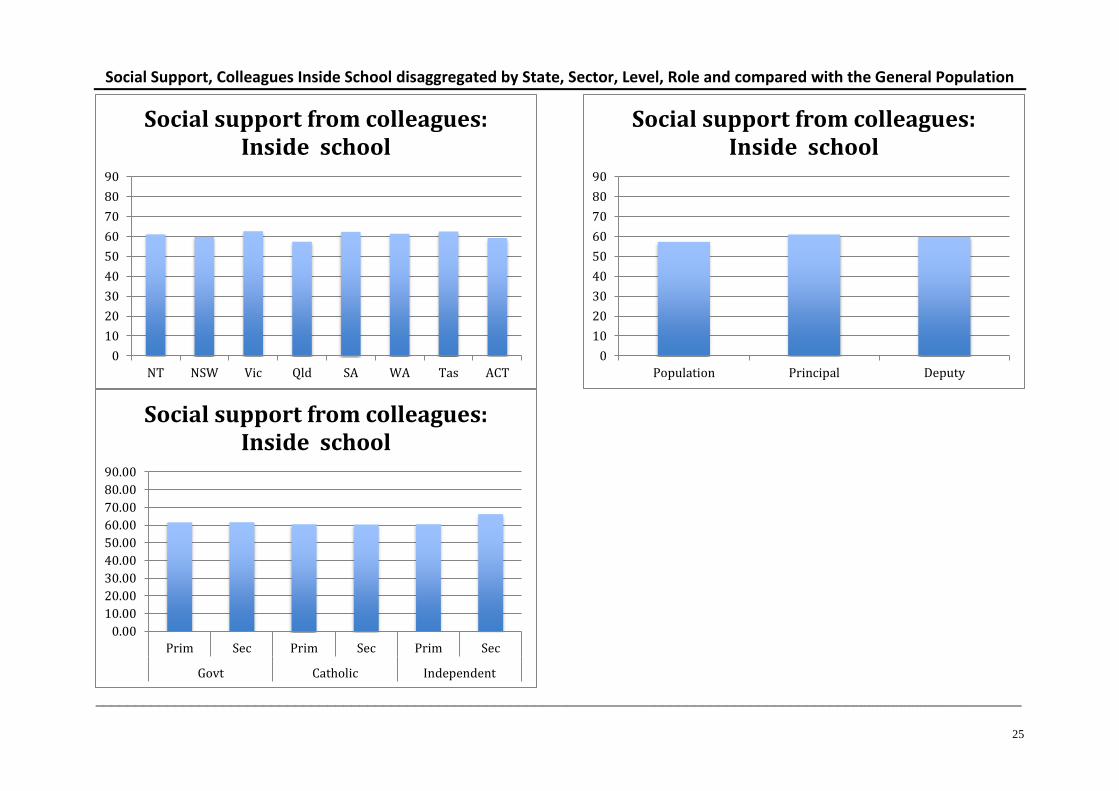
25
Social Support, Colleagues Inside School disaggregated by State, Sector, Level, Role and compared with the General Population
____________________________________________________________________________________________________________________
0
10
20
30
40
50
60
70
80
90
NT NSW Vic Qld SA WA Tas ACT
Social support from colleagues: Inside school
0.00
10.00
20.00
30.00
40.00
50.00
60.00
70.00
80.00
90.00
Prim Sec Prim Sec Prim Sec
Govt Catholic Independent
Social support from colleagues: Inside school
0
10
20
30
40
50
60
70
80
90
Population Principal Deputy
Social support from colleagues: Inside school

26
Social Support, Colleagues Outside School disaggregated by State, Sector, Level, Role and compared with the General Population
____________________________________________________________________________________________________________________
0
10
20
30
40
50
60
70
80
90
NT NSW Vic Qld SA WA Tas ACT
Social support from colleagues: Outside school
0.00
10.00
20.00
30.00
40.00
50.00
60.00
70.00
80.00
90.00
Prim Sec Prim Sec Prim Sec
Govt Catholic Independent
Social support from colleagues: Outside school
0
10
20
30
40
50
60
70
80
90
Population Principal Deputy
Social support from colleagues: Outside school
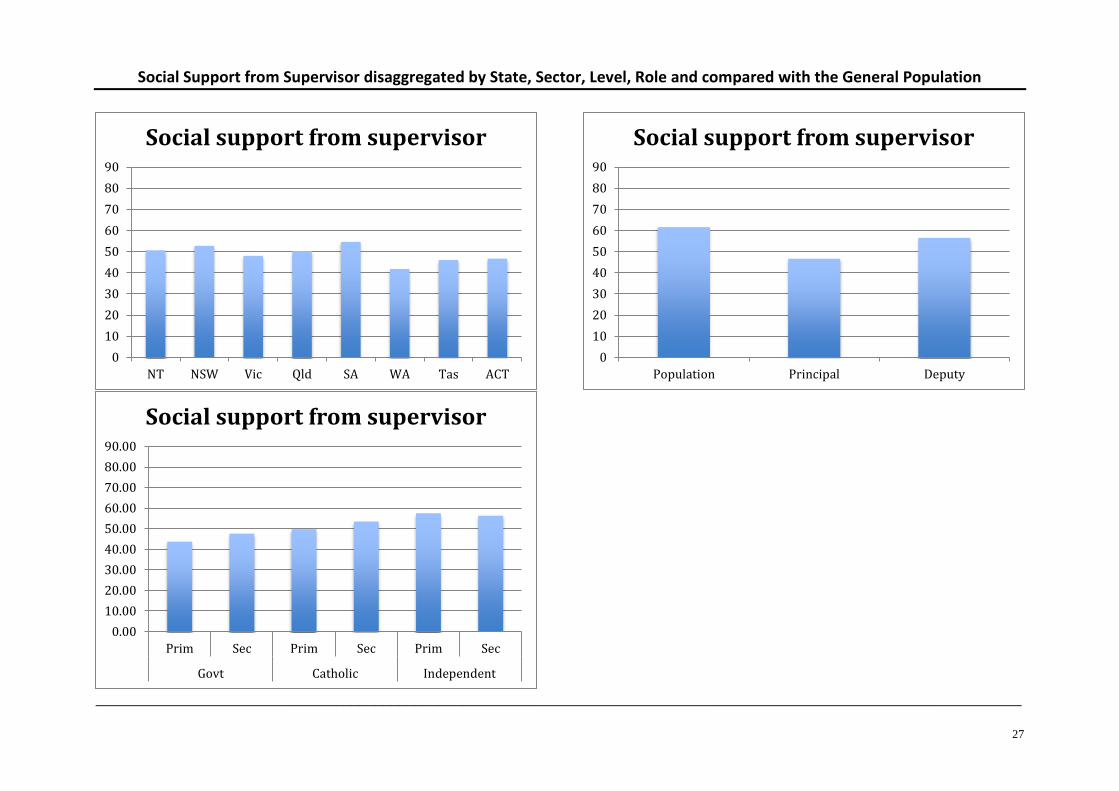
27
Social Support from Supervisor disaggregated by State, Sector, Level, Role and compared with the General Population
____________________________________________________________________________________________________________________
0
10
20
30
40
50
60
70
80
90
NT NSW Vic Qld SA WA Tas ACT
Social support from supervisor
0.00
10.00
20.00
30.00
40.00
50.00
60.00
70.00
80.00
90.00
Prim Sec Prim Sec Prim Sec
Govt Catholic Independent
Social support from supervisor
0
10
20
30
40
50
60
70
80
90
Population Principal Deputy
Social support from supervisor

28
Social Community at Work disaggregated by State, Sector, Level, Role and compared with the General Population
____________________________________________________________________________________________________________________
0
10
20
30
40
50
60
70
80
90
NT NSW Vic Qld SA WA Tas ACT
Social community at work
0.00
10.00
20.00
30.00
40.00
50.00
60.00
70.00
80.00
90.00
Prim Sec Prim Sec Prim Sec
Govt Catholic Independent
Social community at work
0
10
20
30
40
50
60
70
80
90
Population Principal Deputy
Social community at work
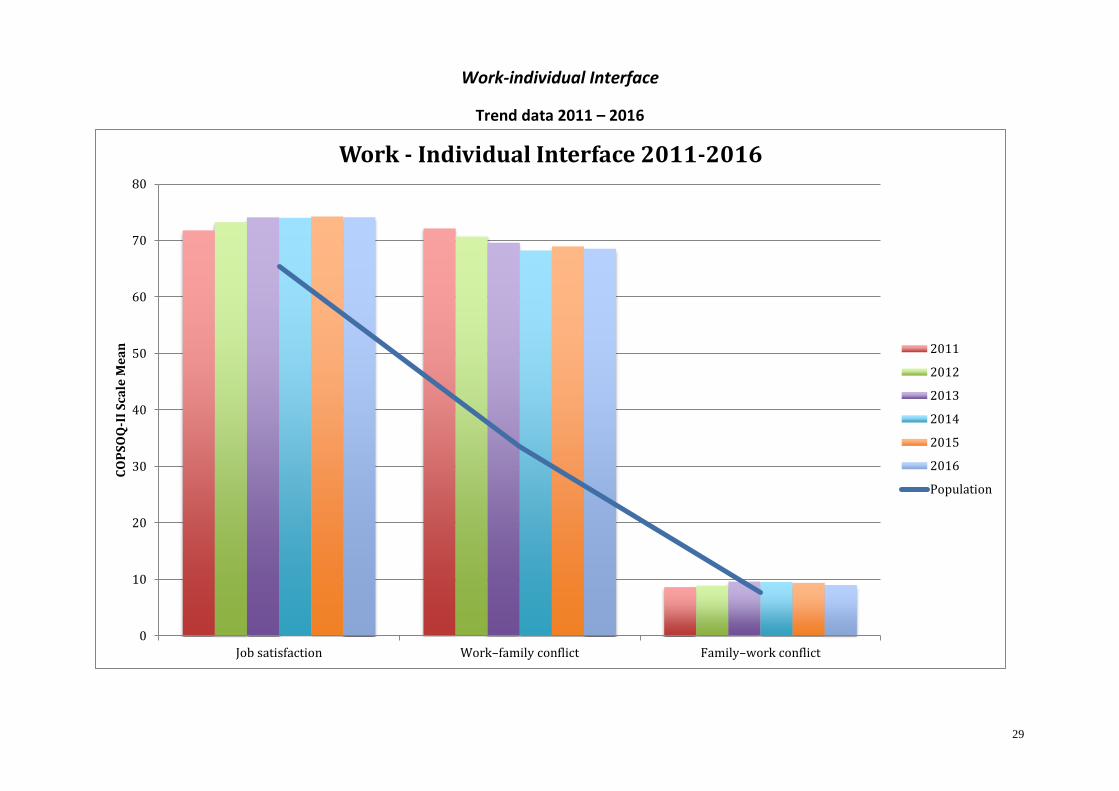
29
Work-individual Interface
Trend data 2011 – 2016
0
10
20
30
40
50
60
70
80
Job satisfaction Work–family conflict Family–work conflict
CO
PS
OQ
-II
Sca
le M
ea
n
Work - Individual Interface 2011-2016
2011
2012
2013
2014
2015
2016
Population

30
2016 Data in Detail
Subscales Population Critical Value*
All Gov Cat Ind Gender Role Govt Catholic Independent
M SD Low High F M Prin Dep Prim Sec Prim Sec Prim Sec
Job satisfaction 65.30 18.20 56.20 74.40 74.11 73.02 76.21 79.04 74.83 73.06 74.75 72.59 72.53 77.43 75.24 80.24 84.84 81.87
Work–family conflict 33.50 24.30 21.35 45.65 68.50 68.83 67.80 67.28 70.69 65.28 69.08 66.99 69.74 67.84 68.54 65.83 70.68 66.18
Family–work conflict 7.60 15.30 -0.05 15.25 8.97 9.09 8.45 9.12 8.18 10.14 9.14 8.41 8.67 9.91 8.87 10.45 10.00 15.69
*Mean ±.5SD
Job satisfaction deals with principals’ experience of satisfaction with various aspects of work.
Work-family conflict deals with the possible consequences of work on family/personal life. The focus is on two areas, namely conflict regarding
energy (mental and physical energy) and conflict regarding time.
Family-work conflict deals with the possible consequences of family/personal life on work. The focus is on two areas, namely conflict regarding
energy (mental and physical energy) and conflict regarding time.
Results
Trends Job satisfaction has been trending up slightly over the survey period. Work family conflict has been trending down slightly over the same
period.
Job satisfaction Generally speaking secondary school principals are noticeably more satisfied with their job than their primary colleagues and the
general population, with Independent primary school leaders the exception, reporting the highest average levels of Job Satisfaction.
Work-family conflict while the trend is down, the levels is still very high, at 2.2 times the rate of the general population. Every group score is well
above one standard deviation higher than the general population rate. This result has serious implications for the long-term future of school leaders as
their work is creating significant family stress. This finding along with the diminishing levels of support (Section 2 below) should be cause
considerable concern for policy makers, as it related directly to the Quantitative Demands of the role.
Family-work conflict School leaders’ average scores are at the general population levels.

31
Job Satisfaction disaggregated by State, Sector, Level, Role and compared with the General Population
____________________________________________________________________________________________________________________
0
10
20
30
40
50
60
70
80
90
NT NSW Vic Qld SA WA Tas ACT
Job satisfaction
0.00
10.00
20.00
30.00
40.00
50.00
60.00
70.00
80.00
90.00
Prim Sec Prim Sec Prim Sec
Govt Catholic Independent
Job satisfaction
0
10
20
30
40
50
60
70
80
90
Population Principal Deputy
Job satisfaction

32
Work-Family Conflict disaggregated by State, Sector, Level, Role and compared with the General Population
____________________________________________________________________________________________________________________
0
10
20
30
40
50
60
70
80
90
NT NSW Vic Qld SA WA Tas ACT
Work–family conflict
0.00
10.00
20.00
30.00
40.00
50.00
60.00
70.00
80.00
90.00
Prim Sec Prim Sec Prim Sec
Govt Catholic Independent
Work–family conflict
0
10
20
30
40
50
60
70
80
90
Population Principal Deputy
Work–family conflict

33
Family-Work Conflict disaggregated by State, Sector, Level, Role and compared with the General Population
___________________________________________________________________________________________________________________
0
10
20
30
40
50
60
70
80
90
NT NSW Vic Qld SA WA Tas ACT
Family–work conflict
0.00
10.00
20.00
30.00
40.00
50.00
60.00
70.00
80.00
90.00
Prim Sec Prim Sec Prim Sec
Govt Catholic Independent
Family–work conflict
0
10
20
30
40
50
60
70
80
90
Population Principal Deputy
Family–work conflict

34
Values at the Workplace
Trend data 2011 – 2016
0
10
20
30
40
50
60
70
80
90
Trust regarding management Mutual trust betweenemployees
Justice Social inclusiveness
CO
PS
OQ
-II
Sca
le M
ea
n
Values at the Workplace 2011-2016
2011
2012
2013
2014
2015
2016
Population
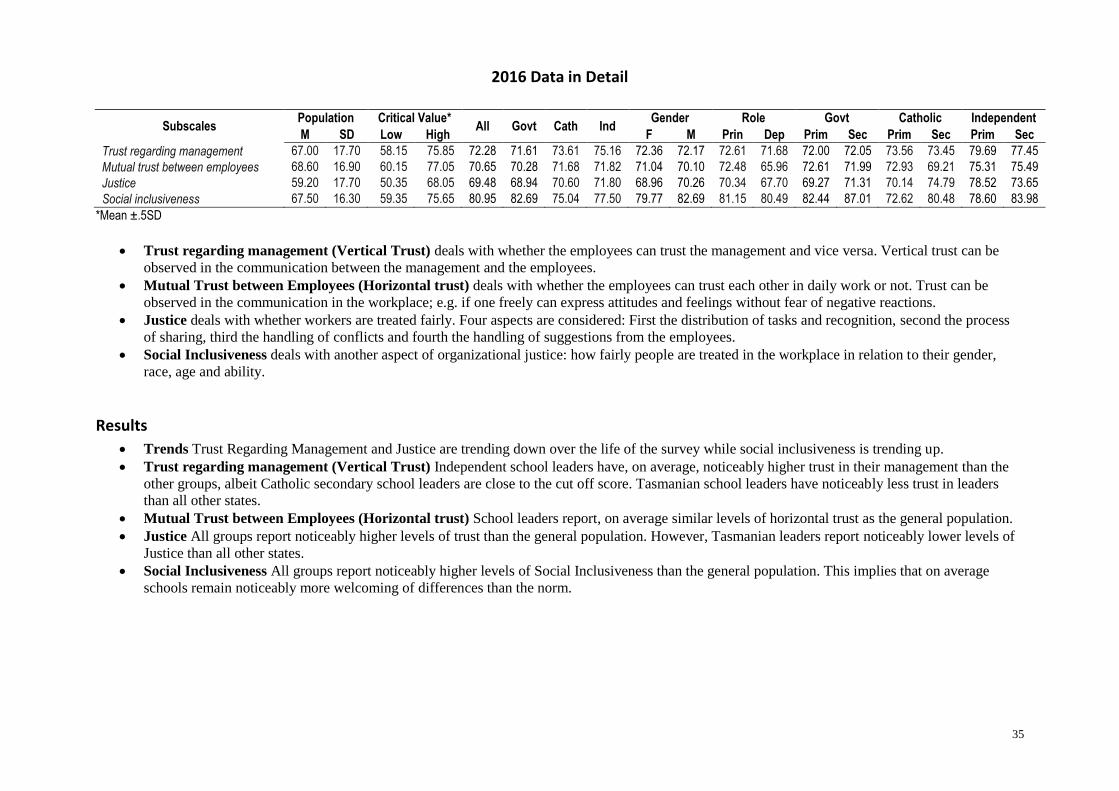
35
2016 Data in Detail
Subscales Population Critical Value*
All Govt Cath Ind Gender Role Govt Catholic Independent
M SD Low High F M Prin Dep Prim Sec Prim Sec Prim Sec
Trust regarding management 67.00 17.70 58.15 75.85 72.28 71.61 73.61 75.16 72.36 72.17 72.61 71.68 72.00 72.05 73.56 73.45 79.69 77.45
Mutual trust between employees 68.60 16.90 60.15 77.05 70.65 70.28 71.68 71.82 71.04 70.10 72.48 65.96 72.61 71.99 72.93 69.21 75.31 75.49
Justice 59.20 17.70 50.35 68.05 69.48 68.94 70.60 71.80 68.96 70.26 70.34 67.70 69.27 71.31 70.14 74.79 78.52 73.65
Social inclusiveness 67.50 16.30 59.35 75.65 80.95 82.69 75.04 77.50 79.77 82.69 81.15 80.49 82.44 87.01 72.62 80.48 78.60 83.98
*Mean ±.5SD
Trust regarding management (Vertical Trust) deals with whether the employees can trust the management and vice versa. Vertical trust can be
observed in the communication between the management and the employees.
Mutual Trust between Employees (Horizontal trust) deals with whether the employees can trust each other in daily work or not. Trust can be
observed in the communication in the workplace; e.g. if one freely can express attitudes and feelings without fear of negative reactions.
Justice deals with whether workers are treated fairly. Four aspects are considered: First the distribution of tasks and recognition, second the process
of sharing, third the handling of conflicts and fourth the handling of suggestions from the employees.
Social Inclusiveness deals with another aspect of organizational justice: how fairly people are treated in the workplace in relation to their gender,
race, age and ability.
Results
Trends Trust Regarding Management and Justice are trending down over the life of the survey while social inclusiveness is trending up.
Trust regarding management (Vertical Trust) Independent school leaders have, on average, noticeably higher trust in their management than the
other groups, albeit Catholic secondary school leaders are close to the cut off score. Tasmanian school leaders have noticeably less trust in leaders
than all other states.
Mutual Trust between Employees (Horizontal trust) School leaders report, on average similar levels of horizontal trust as the general population.
Justice All groups report noticeably higher levels of trust than the general population. However, Tasmanian leaders report noticeably lower levels of
Justice than all other states.
Social Inclusiveness All groups report noticeably higher levels of Social Inclusiveness than the general population. This implies that on average
schools remain noticeably more welcoming of differences than the norm.
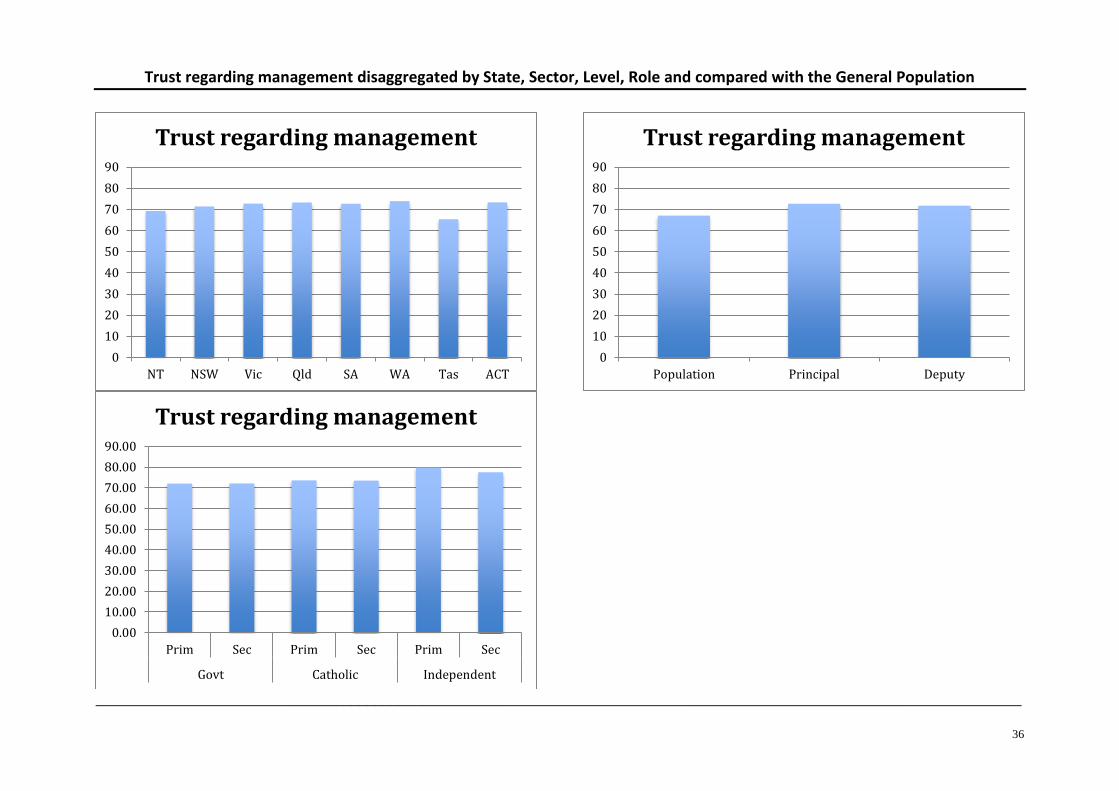
36
Trust regarding management disaggregated by State, Sector, Level, Role and compared with the General Population
____________________________________________________________________________________________________________________
0
10
20
30
40
50
60
70
80
90
NT NSW Vic Qld SA WA Tas ACT
Trust regarding management
0.00
10.00
20.00
30.00
40.00
50.00
60.00
70.00
80.00
90.00
Prim Sec Prim Sec Prim Sec
Govt Catholic Independent
Trust regarding management
0
10
20
30
40
50
60
70
80
90
Population Principal Deputy
Trust regarding management
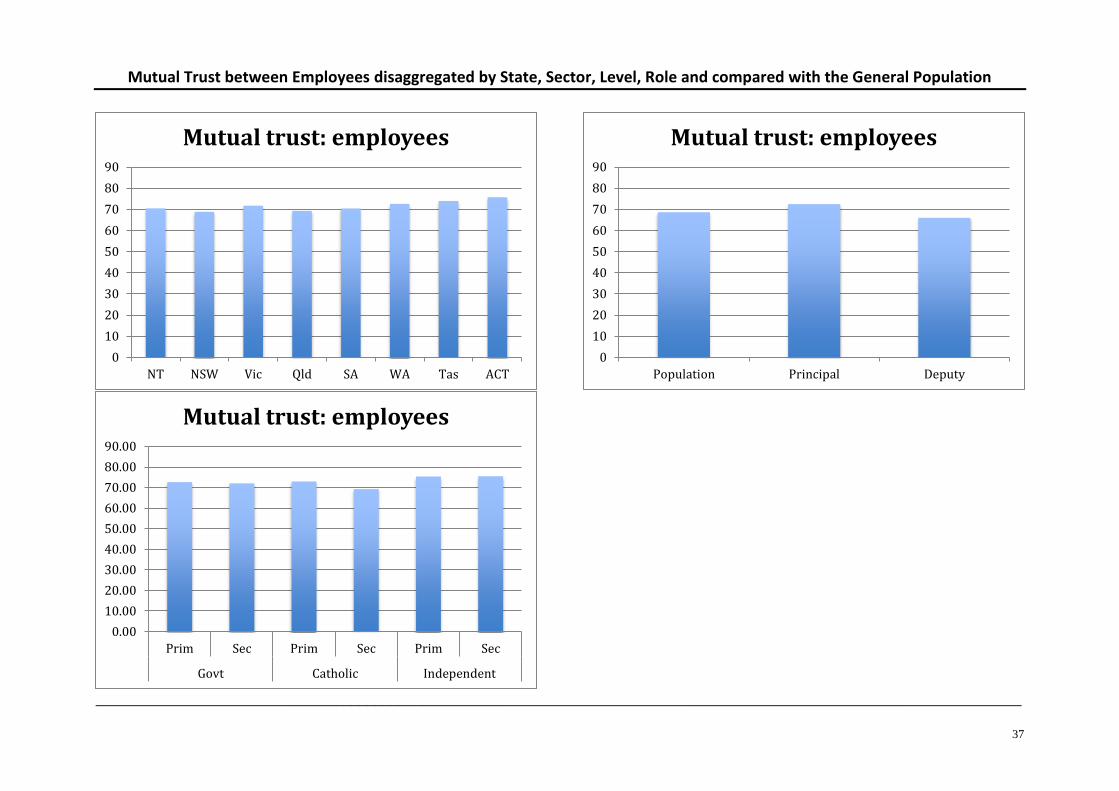
37
Mutual Trust between Employees disaggregated by State, Sector, Level, Role and compared with the General Population
____________________________________________________________________________________________________________________
0
10
20
30
40
50
60
70
80
90
NT NSW Vic Qld SA WA Tas ACT
Mutual trust: employees
0.00
10.00
20.00
30.00
40.00
50.00
60.00
70.00
80.00
90.00
Prim Sec Prim Sec Prim Sec
Govt Catholic Independent
Mutual trust: employees
0
10
20
30
40
50
60
70
80
90
Population Principal Deputy
Mutual trust: employees
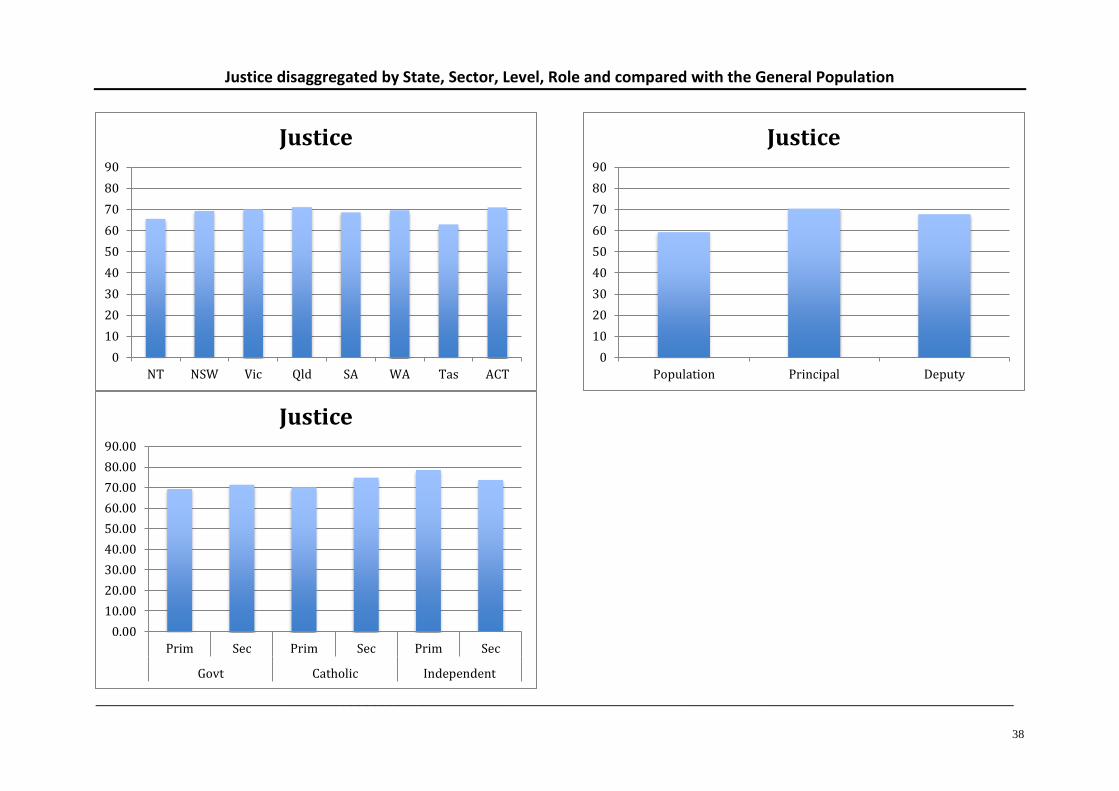
38
Justice disaggregated by State, Sector, Level, Role and compared with the General Population
___________________________________________________________________________________________________________________
0
10
20
30
40
50
60
70
80
90
NT NSW Vic Qld SA WA Tas ACT
Justice
0.00
10.00
20.00
30.00
40.00
50.00
60.00
70.00
80.00
90.00
Prim Sec Prim Sec Prim Sec
Govt Catholic Independent
Justice
0
10
20
30
40
50
60
70
80
90
Population Principal Deputy
Justice
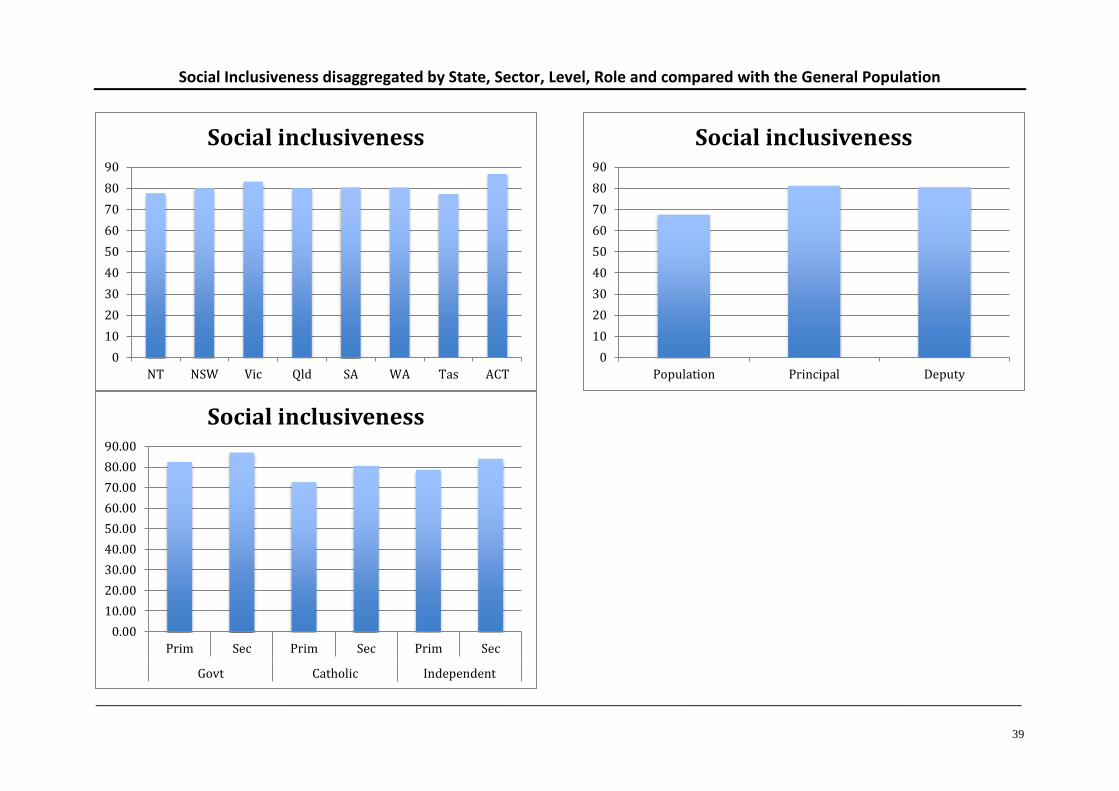
39
Social Inclusiveness disaggregated by State, Sector, Level, Role and compared with the General Population
____________________________________________________________________________________________________________________
0
10
20
30
40
50
60
70
80
90
NT NSW Vic Qld SA WA Tas ACT
Social inclusiveness
0.00
10.00
20.00
30.00
40.00
50.00
60.00
70.00
80.00
90.00
Prim Sec Prim Sec Prim Sec
Govt Catholic Independent
Social inclusiveness
0
10
20
30
40
50
60
70
80
90
Population Principal Deputy
Social inclusiveness

40
Health and Wellbeing
Trend data 2011 – 2016
0
10
20
30
40
50
60
70
80
Self-ratedhealth
Burnout Stress Sleepingtroubles
Depressivesymptoms
Somatic stresssymptoms
Cognitive stresssymptoms
Self-efficacy
CO
PS
OQ
-II
Sca
le M
ea
n
Health & Wellbeing 2011-2016
2011
2012
2013
2014
2015
2016
Population
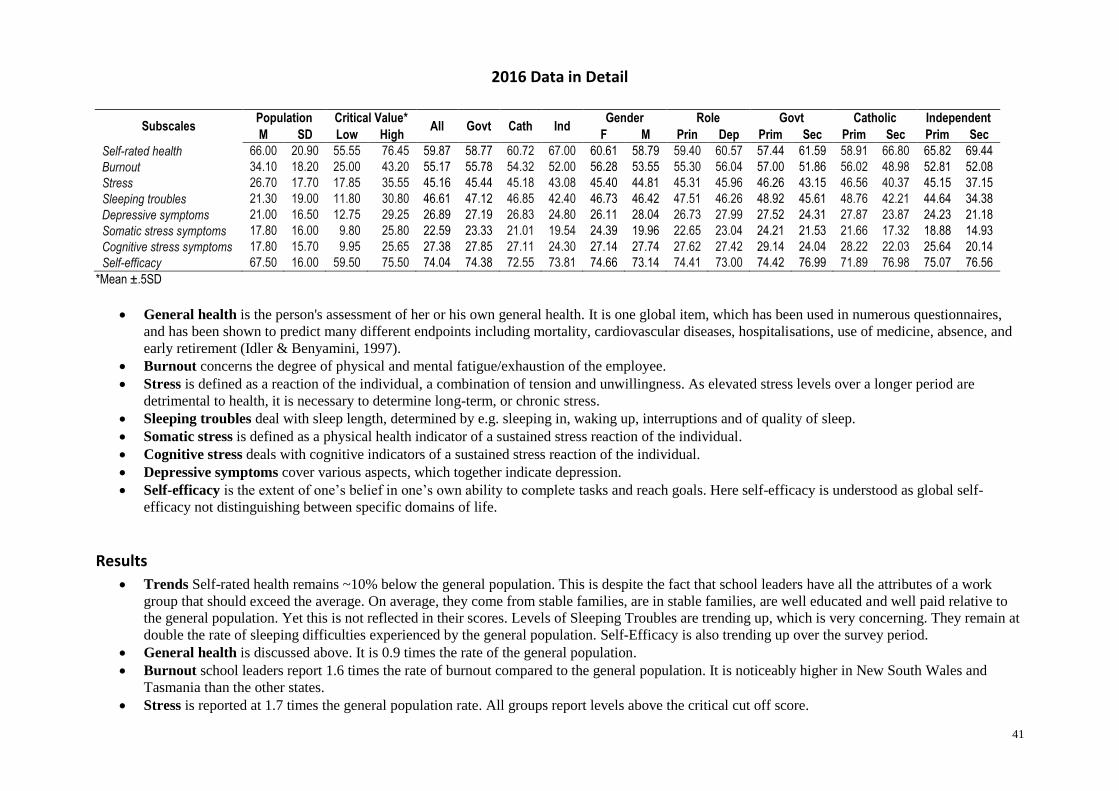
41
2016 Data in Detail
Subscales Population Critical Value*
All Govt Cath Ind Gender Role Govt Catholic Independent
M SD Low High F M Prin Dep Prim Sec Prim Sec Prim Sec
Self-rated health 66.00 20.90 55.55 76.45 59.87 58.77 60.72 67.00 60.61 58.79 59.40 60.57 57.44 61.59 58.91 66.80 65.82 69.44
Burnout 34.10 18.20 25.00 43.20 55.17 55.78 54.32 52.00 56.28 53.55 55.30 56.04 57.00 51.86 56.02 48.98 52.81 52.08
Stress 26.70 17.70 17.85 35.55 45.16 45.44 45.18 43.08 45.40 44.81 45.31 45.96 46.26 43.15 46.56 40.37 45.15 37.15
Sleeping troubles 21.30 19.00 11.80 30.80 46.61 47.12 46.85 42.40 46.73 46.42 47.51 46.26 48.92 45.61 48.76 42.21 44.64 34.38
Depressive symptoms 21.00 16.50 12.75 29.25 26.89 27.19 26.83 24.80 26.11 28.04 26.73 27.99 27.52 24.31 27.87 23.87 24.23 21.18
Somatic stress symptoms 17.80 16.00 9.80 25.80 22.59 23.33 21.01 19.54 24.39 19.96 22.65 23.04 24.21 21.53 21.66 17.32 18.88 14.93
Cognitive stress symptoms 17.80 15.70 9.95 25.65 27.38 27.85 27.11 24.30 27.14 27.74 27.62 27.42 29.14 24.04 28.22 22.03 25.64 20.14
Self-efficacy 67.50 16.00 59.50 75.50 74.04 74.38 72.55 73.81 74.66 73.14 74.41 73.00 74.42 76.99 71.89 76.98 75.07 76.56
*Mean ±.5SD
General health is the person's assessment of her or his own general health. It is one global item, which has been used in numerous questionnaires,
and has been shown to predict many different endpoints including mortality, cardiovascular diseases, hospitalisations, use of medicine, absence, and
early retirement (Idler & Benyamini, 1997).
Burnout concerns the degree of physical and mental fatigue/exhaustion of the employee.
Stress is defined as a reaction of the individual, a combination of tension and unwillingness. As elevated stress levels over a longer period are
detrimental to health, it is necessary to determine long-term, or chronic stress.
Sleeping troubles deal with sleep length, determined by e.g. sleeping in, waking up, interruptions and of quality of sleep.
Somatic stress is defined as a physical health indicator of a sustained stress reaction of the individual.
Cognitive stress deals with cognitive indicators of a sustained stress reaction of the individual.
Depressive symptoms cover various aspects, which together indicate depression.
Self-efficacy is the extent of one’s belief in one’s own ability to complete tasks and reach goals. Here self-efficacy is understood as global self-
efficacy not distinguishing between specific domains of life.
Results
Trends Self-rated health remains ~10% below the general population. This is despite the fact that school leaders have all the attributes of a work
group that should exceed the average. On average, they come from stable families, are in stable families, are well educated and well paid relative to
the general population. Yet this is not reflected in their scores. Levels of Sleeping Troubles are trending up, which is very concerning. They remain at
double the rate of sleeping difficulties experienced by the general population. Self-Efficacy is also trending up over the survey period.
General health is discussed above. It is 0.9 times the rate of the general population.
Burnout school leaders report 1.6 times the rate of burnout compared to the general population. It is noticeably higher in New South Wales and
Tasmania than the other states.
Stress is reported at 1.7 times the general population rate. All groups report levels above the critical cut off score.

42
Sleeping troubles is reported at 2.2 times the general population rate. Chronic sleep deprivation predicts a number of long-term health issues,
including memory difficulties, obesity and depression.
Somatic stress is reported at 1.3 times the general population rate.
Cognitive stress school leaders report 1.6 times the rate of Cognitive Stress compared to the general population. It appears to predominate in primary
school leaders regardless of state and sector, and is noticeably higher in New South Wales, South Australia and Victoria.
Depressive symptoms are reported for school leaders at 1.3 times the rate of the general population.
Self-efficacy All school leaders report, on average, levels at or approaching noticeably higher scores on this scale than the general population.
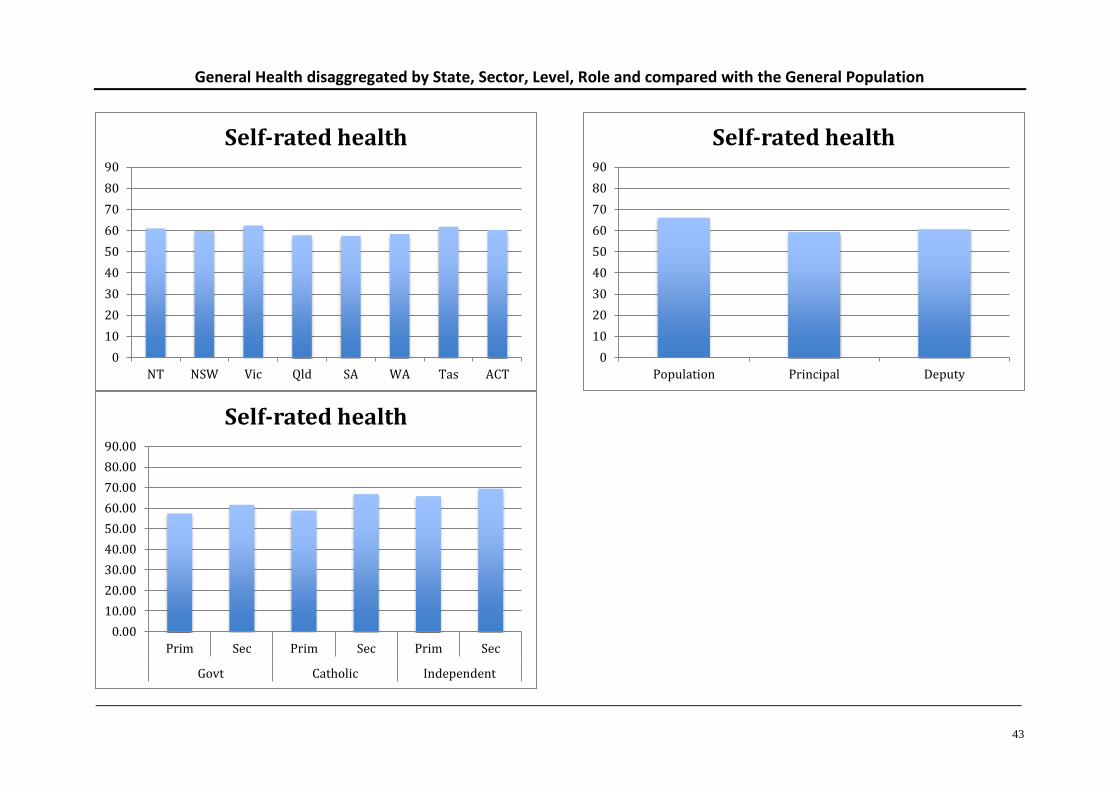
43
General Health disaggregated by State, Sector, Level, Role and compared with the General Population
____________________________________________________________________________________________________________________
0
10
20
30
40
50
60
70
80
90
NT NSW Vic Qld SA WA Tas ACT
Self-rated health
0.00
10.00
20.00
30.00
40.00
50.00
60.00
70.00
80.00
90.00
Prim Sec Prim Sec Prim Sec
Govt Catholic Independent
Self-rated health
0
10
20
30
40
50
60
70
80
90
Population Principal Deputy
Self-rated health

44
Burnout disaggregated by State, Sector, Level, Role and compared with the General Population
____________________________________________________________________________________________________________________
0
10
20
30
40
50
60
70
80
90
NT NSW Vic Qld SA WA Tas ACT
Burnout
0.00
10.00
20.00
30.00
40.00
50.00
60.00
70.00
80.00
90.00
Prim Sec Prim Sec Prim Sec
Govt Catholic Independent
Burnout
0
10
20
30
40
50
60
70
80
90
Population Principal Deputy
Burnout

45
Stress disaggregated by State, Sector, Level, Role and compared with the General Population
____________________________________________________________________________________________________________________
0
10
20
30
40
50
60
70
80
90
NT NSW Vic Qld SA WA Tas ACT
Stress
0.00
10.00
20.00
30.00
40.00
50.00
60.00
70.00
80.00
90.00
Prim Sec Prim Sec Prim Sec
Govt Catholic Independent
Stress
0
10
20
30
40
50
60
70
80
90
Population Principal Deputy
Stress
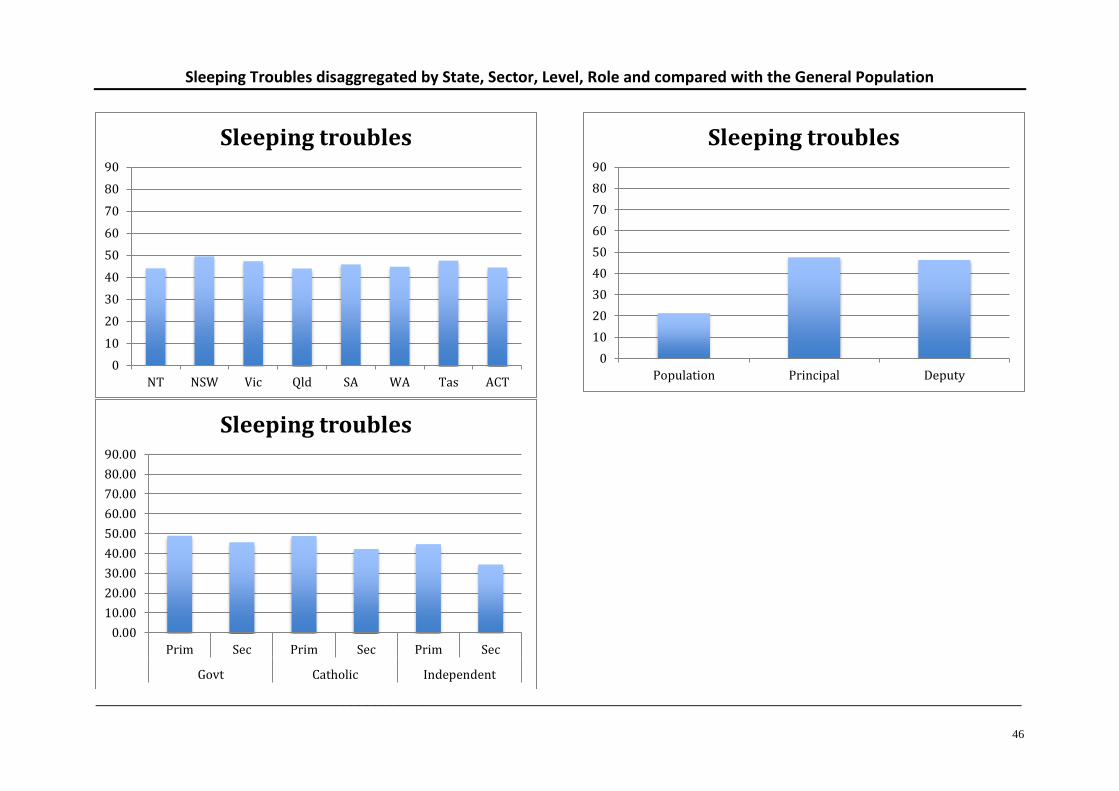
46
Sleeping Troubles disaggregated by State, Sector, Level, Role and compared with the General Population
____________________________________________________________________________________________________________________
0
10
20
30
40
50
60
70
80
90
NT NSW Vic Qld SA WA Tas ACT
Sleeping troubles
0.00
10.00
20.00
30.00
40.00
50.00
60.00
70.00
80.00
90.00
Prim Sec Prim Sec Prim Sec
Govt Catholic Independent
Sleeping troubles
0
10
20
30
40
50
60
70
80
90
Population Principal Deputy
Sleeping troubles

47
Depressive Symptoms disaggregated by State, Sector, Level, Role and compared with the General Population
____________________________________________________________________________________________________________________
0
10
20
30
40
50
60
70
80
90
NT NSW Vic Qld SA WA Tas ACT
Depressive symptoms
0.00
10.00
20.00
30.00
40.00
50.00
60.00
70.00
80.00
90.00
Prim Sec Prim Sec Prim Sec
Govt Catholic Independent
Depressive symptoms
0
5
10
15
20
25
30
35
40
Population Principal Deputy
Depressive symptoms

48
Somatic Stress disaggregated by State, Sector, Level, Role and compared with the General Population
____________________________________________________________________________________________________________________
0
10
20
30
40
50
60
70
80
90
NT NSW Vic Qld SA WA Tas ACT
Somatic stress symptoms
0.00
10.00
20.00
30.00
40.00
50.00
60.00
70.00
80.00
90.00
Prim Sec Prim Sec Prim Sec
Govt Catholic Independent
Somatic stress symptoms
0
10
20
30
40
50
60
70
80
90
Population Principal Deputy
Somatic stress symptoms

49
Cognitive Stress disaggregated by State, Sector, Level, Role and compared with the General Population
____________________________________________________________________________________________________________________
0
10
20
30
40
50
60
70
80
90
NT NSW Vic Qld SA WA Tas ACT
Cognitive stress symptoms
0.00
10.00
20.00
30.00
40.00
50.00
60.00
70.00
80.00
90.00
Prim Sec Prim Sec Prim Sec
Govt Catholic Independent
Cognitive stress symptoms
0
10
20
30
40
50
60
70
80
90
Population Principal Deputy
Cognitive stress symptoms
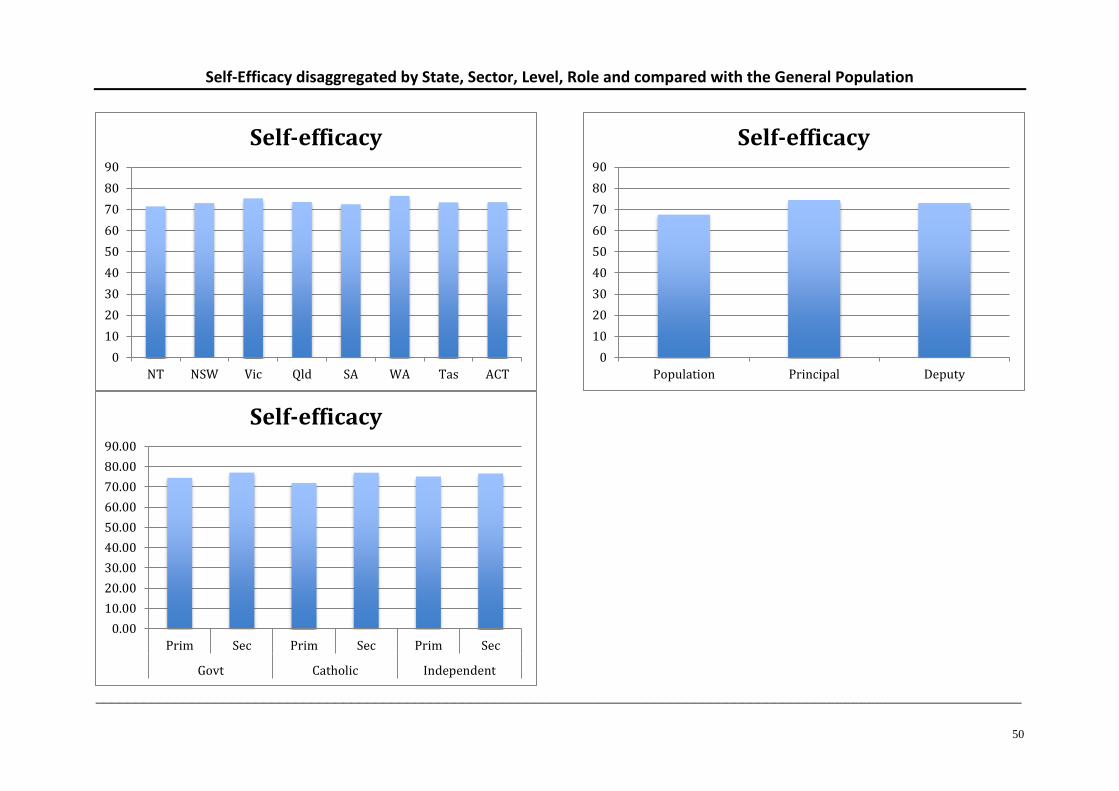
50
Self-Efficacy disaggregated by State, Sector, Level, Role and compared with the General Population
____________________________________________________________________________________________________________________
0
10
20
30
40
50
60
70
80
90
NT NSW Vic Qld SA WA Tas ACT
Self-efficacy
0.00
10.00
20.00
30.00
40.00
50.00
60.00
70.00
80.00
90.00
Prim Sec Prim Sec Prim Sec
Govt Catholic Independent
Self-efficacy
0
10
20
30
40
50
60
70
80
90
Population Principal Deputy
Self-efficacy
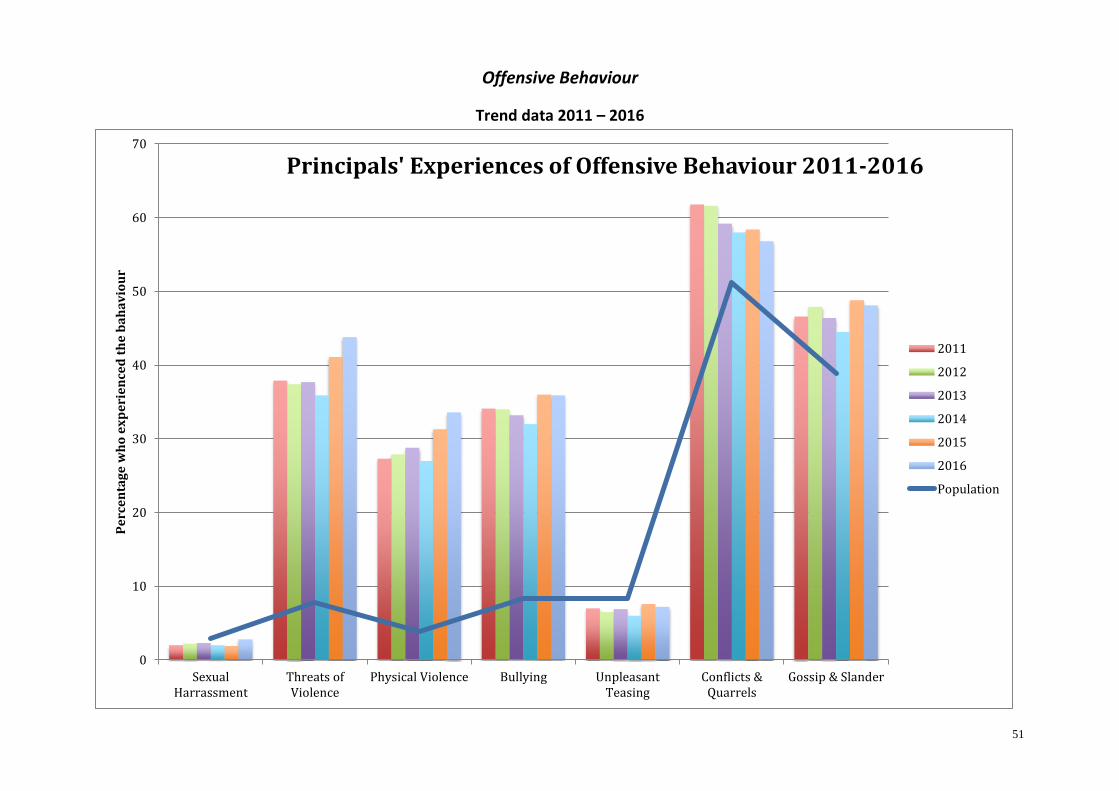
51
Offensive Behaviour
Trend data 2011 – 2016
0
10
20
30
40
50
60
70
SexualHarrassment
Threats ofViolence
Physical Violence Bullying UnpleasantTeasing
Conflicts &Quarrels
Gossip & Slander
Pe
rce
nta
ge
wh
o e
xp
eri
en
ced
th
e b
ah
av
iou
r
Principals' Experiences of Offensive Behaviour 2011-2016
2011
2012
2013
2014
2015
2016
Population
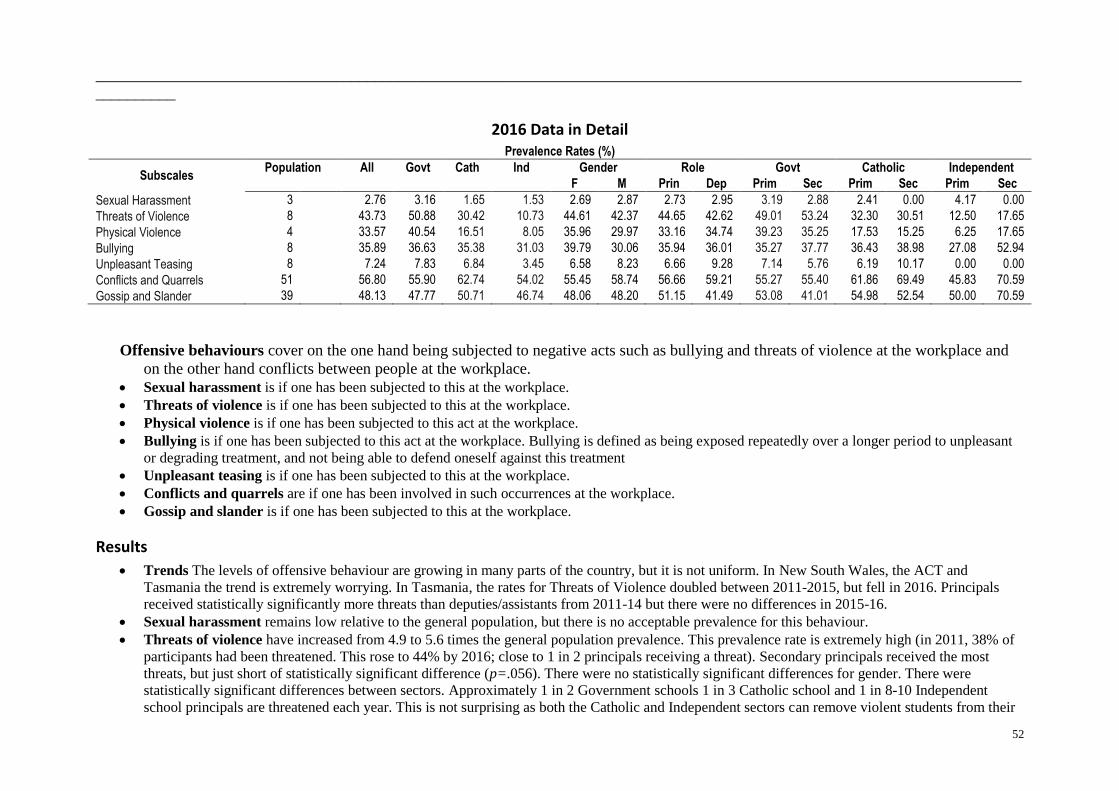
52
____________________________________________________________________________________________________________________
__________
2016 Data in Detail Prevalence Rates (%)
Subscales Population All Govt Cath Ind Gender Role Govt Catholic Independent
F M Prin Dep Prim Sec Prim Sec Prim Sec
Sexual Harassment 3 2.76 3.16 1.65 1.53 2.69 2.87 2.73 2.95 3.19 2.88 2.41 0.00 4.17 0.00
Threats of Violence 8 43.73 50.88 30.42 10.73 44.61 42.37 44.65 42.62 49.01 53.24 32.30 30.51 12.50 17.65
Physical Violence 4 33.57 40.54 16.51 8.05 35.96 29.97 33.16 34.74 39.23 35.25 17.53 15.25 6.25 17.65
Bullying 8 35.89 36.63 35.38 31.03 39.79 30.06 35.94 36.01 35.27 37.77 36.43 38.98 27.08 52.94
Unpleasant Teasing 8 7.24 7.83 6.84 3.45 6.58 8.23 6.66 9.28 7.14 5.76 6.19 10.17 0.00 0.00
Conflicts and Quarrels 51 56.80 55.90 62.74 54.02 55.45 58.74 56.66 59.21 55.27 55.40 61.86 69.49 45.83 70.59
Gossip and Slander 39 48.13 47.77 50.71 46.74 48.06 48.20 51.15 41.49 53.08 41.01 54.98 52.54 50.00 70.59
Offensive behaviours cover on the one hand being subjected to negative acts such as bullying and threats of violence at the workplace and
on the other hand conflicts between people at the workplace.
Sexual harassment is if one has been subjected to this at the workplace.
Threats of violence is if one has been subjected to this at the workplace.
Physical violence is if one has been subjected to this act at the workplace.
Bullying is if one has been subjected to this act at the workplace. Bullying is defined as being exposed repeatedly over a longer period to unpleasant
or degrading treatment, and not being able to defend oneself against this treatment
Unpleasant teasing is if one has been subjected to this at the workplace.
Conflicts and quarrels are if one has been involved in such occurrences at the workplace.
Gossip and slander is if one has been subjected to this at the workplace.
Results
Trends The levels of offensive behaviour are growing in many parts of the country, but it is not uniform. In New South Wales, the ACT and
Tasmania the trend is extremely worrying. In Tasmania, the rates for Threats of Violence doubled between 2011-2015, but fell in 2016. Principals
received statistically significantly more threats than deputies/assistants from 2011-14 but there were no differences in 2015-16.
Sexual harassment remains low relative to the general population, but there is no acceptable prevalence for this behaviour.
Threats of violence have increased from 4.9 to 5.6 times the general population prevalence. This prevalence rate is extremely high (in 2011, 38% of
participants had been threatened. This rose to 44% by 2016; close to 1 in 2 principals receiving a threat). Secondary principals received the most
threats, but just short of statistically significant difference (p=.056). There were no statistically significant differences for gender. There were
statistically significant differences between sectors. Approximately 1 in 2 Government schools 1 in 3 Catholic school and 1 in 8-10 Independent
school principals are threatened each year. This is not surprising as both the Catholic and Independent sectors can remove violent students from their
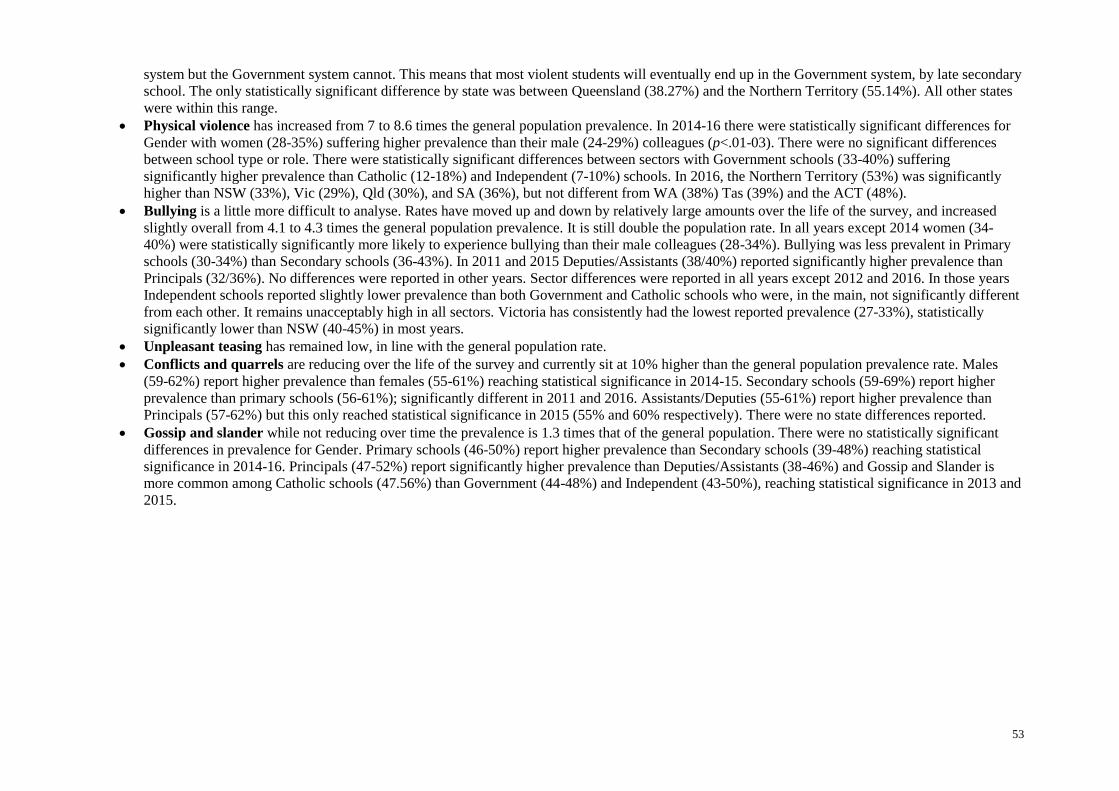
53
system but the Government system cannot. This means that most violent students will eventually end up in the Government system, by late secondary
school. The only statistically significant difference by state was between Queensland (38.27%) and the Northern Territory (55.14%). All other states
were within this range.
Physical violence has increased from 7 to 8.6 times the general population prevalence. In 2014-16 there were statistically significant differences for
Gender with women (28-35%) suffering higher prevalence than their male (24-29%) colleagues (p<.01-03). There were no significant differences
between school type or role. There were statistically significant differences between sectors with Government schools (33-40%) suffering
significantly higher prevalence than Catholic (12-18%) and Independent (7-10%) schools. In 2016, the Northern Territory (53%) was significantly
higher than NSW (33%), Vic (29%), Qld (30%), and SA (36%), but not different from WA (38%) Tas (39%) and the ACT (48%).
Bullying is a little more difficult to analyse. Rates have moved up and down by relatively large amounts over the life of the survey, and increased
slightly overall from 4.1 to 4.3 times the general population prevalence. It is still double the population rate. In all years except 2014 women (34-
40%) were statistically significantly more likely to experience bullying than their male colleagues (28-34%). Bullying was less prevalent in Primary
schools (30-34%) than Secondary schools (36-43%). In 2011 and 2015 Deputies/Assistants (38/40%) reported significantly higher prevalence than
Principals (32/36%). No differences were reported in other years. Sector differences were reported in all years except 2012 and 2016. In those years
Independent schools reported slightly lower prevalence than both Government and Catholic schools who were, in the main, not significantly different
from each other. It remains unacceptably high in all sectors. Victoria has consistently had the lowest reported prevalence (27-33%), statistically
significantly lower than NSW (40-45%) in most years.
Unpleasant teasing has remained low, in line with the general population rate.
Conflicts and quarrels are reducing over the life of the survey and currently sit at 10% higher than the general population prevalence rate. Males
(59-62%) report higher prevalence than females (55-61%) reaching statistical significance in 2014-15. Secondary schools (59-69%) report higher
prevalence than primary schools (56-61%); significantly different in 2011 and 2016. Assistants/Deputies (55-61%) report higher prevalence than
Principals (57-62%) but this only reached statistical significance in 2015 (55% and 60% respectively). There were no state differences reported.
Gossip and slander while not reducing over time the prevalence is 1.3 times that of the general population. There were no statistically significant
differences in prevalence for Gender. Primary schools (46-50%) report higher prevalence than Secondary schools (39-48%) reaching statistical
significance in 2014-16. Principals (47-52%) report significantly higher prevalence than Deputies/Assistants (38-46%) and Gossip and Slander is
more common among Catholic schools (47.56%) than Government (44-48%) and Independent (43-50%), reaching statistical significance in 2013 and
2015.

54
Threats of Violence Trend Prevalence disaggregated by State
____________________________________________________________________________________________________________________
0
10
20
30
40
50
60
70
NT NSW Vic Qld SA WA Tas ACT
State
Pe
rce
nt
Threats of Violence Prevalence 2011-2016
2011
2012
2013
2014
2015
2016

55
Threats of Violence Trend Prevalence disaggregated by Frequency and Perpetrator Group
____________________________________________________________________________________________________________________
__________
0
5
10
15
20
25
30
35
40
A few times Monthly Weekly Daily Colleagues Manager/Superior
Subordinates Parents Students
Frequency Perpetrator
Pe
rce
nt
Threats of Violence 2011-2016
2011
2012
2013
2014
2015
2016
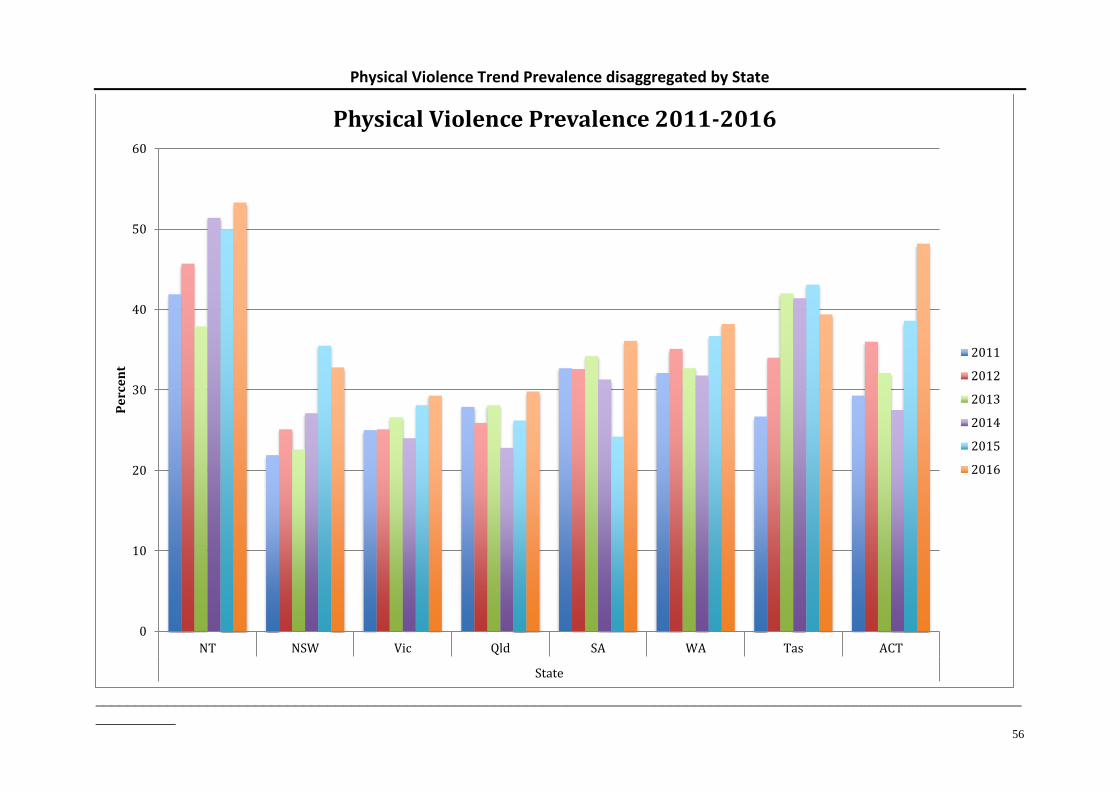
56
Physical Violence Trend Prevalence disaggregated by State
____________________________________________________________________________________________________________________
__________
0
10
20
30
40
50
60
NT NSW Vic Qld SA WA Tas ACT
State
Pe
rce
nt
Physical Violence Prevalence 2011-2016
2011
2012
2013
2014
2015
2016

57
Physical Violence Trend Prevalence disaggregated by disaggregated by Frequency and Perpetrator Group
____________________________________________________________________________________________________________________
__________
0
5
10
15
20
25
30
35
A few times Monthly Weekly Daily Colleagues Manager/Superior
Subordinates Parents Students
Frequency Perpetrator
Pe
rce
nt
Physical Violence 2011-2016
2011
2012
2013
2014
2015
2016

58
Bullying Trend Prevalence disaggregated by State
____________________________________________________________________________________________________________________

59
Physical Violence Trend Prevalence disaggregated by disaggregated by Frequency and Perpetrator Group
____________________________________________________________________________________________________________________
0
5
10
15
20
25
30
35
A few times Monthly Weekly Daily Colleagues Manager/Superior
Subordinates Parents Students
Frequency Perpetrator
Pe
rce
nt
Bullying 2011-2016
2011
2012
2013
2014
2015
2016
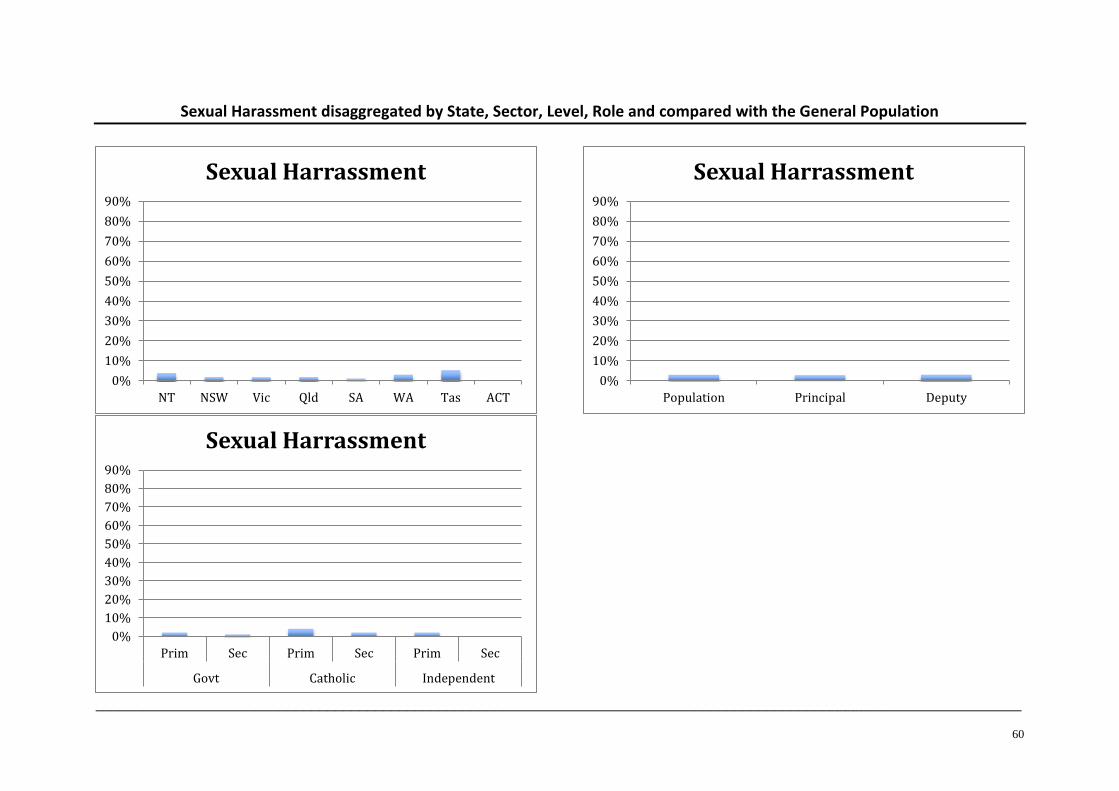
60
Sexual Harassment disaggregated by State, Sector, Level, Role and compared with the General Population
____________________________________________________________________________________________________________________
0%
10%
20%
30%
40%
50%
60%
70%
80%
90%
NT NSW Vic Qld SA WA Tas ACT
Sexual Harrassment
0%
10%
20%
30%
40%
50%
60%
70%
80%
90%
Prim Sec Prim Sec Prim Sec
Govt Catholic Independent
Sexual Harrassment
0%
10%
20%
30%
40%
50%
60%
70%
80%
90%
Population Principal Deputy
Sexual Harrassment
61
Threats of Violence disaggregated by State, Sector, Level, Role and compared with the General Population
____________________________________________________________________________________________________________________
0%
10%
20%
30%
40%
50%
60%
70%
80%
90%
NT NSW Vic Qld SA WA Tas ACT
Threats of Violence
0%
10%
20%
30%
40%
50%
60%
70%
80%
90%
Prim Sec Prim Sec Prim Sec
Govt Catholic Independent
Threats of Violence
0%
10%
20%
30%
40%
50%
60%
70%
80%
90%
Population Principal Deputy
Threats of Violence
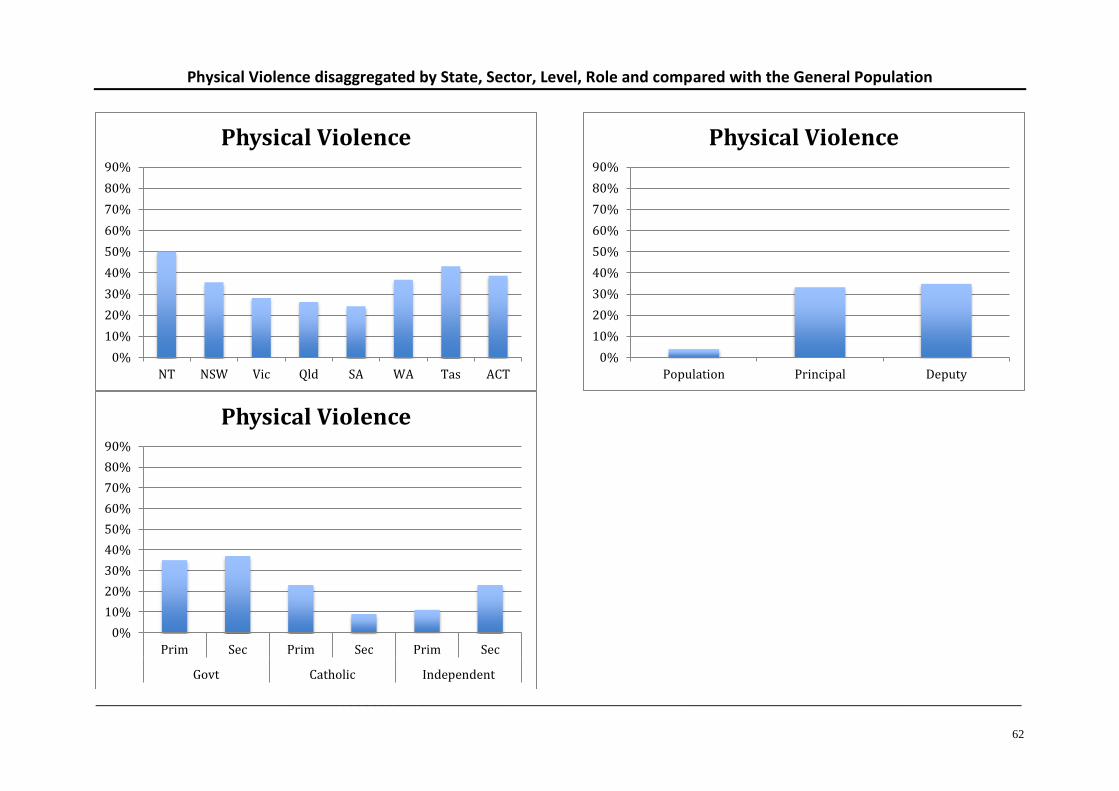
62
Physical Violence disaggregated by State, Sector, Level, Role and compared with the General Population
____________________________________________________________________________________________________________________
0%
10%
20%
30%
40%
50%
60%
70%
80%
90%
NT NSW Vic Qld SA WA Tas ACT
Physical Violence
0%
10%
20%
30%
40%
50%
60%
70%
80%
90%
Prim Sec Prim Sec Prim Sec
Govt Catholic Independent
Physical Violence
0%
10%
20%
30%
40%
50%
60%
70%
80%
90%
Population Principal Deputy
Physical Violence

63
Bullying disaggregated by State, Sector, Level, Role and compared with the General Population
____________________________________________________________________________________________________________________
0%
10%
20%
30%
40%
50%
60%
70%
80%
90%
NT NSW Vic Qld SA WA Tas ACT
Bullying
0%
10%
20%
30%
40%
50%
60%
70%
80%
90%
Prim Sec Prim Sec Prim Sec
Govt Catholic Independent
Bullying
0%
10%
20%
30%
40%
50%
60%
70%
80%
90%
Population Principal Deputy
Bullying

64
Unpleasant Teasing disaggregated by State, Sector, Level, Role and compared with the General Population
____________________________________________________________________________________________________________________
0%
10%
20%
30%
40%
50%
60%
70%
80%
90%
NT NSW Vic Qld SA WA Tas ACT
Unpleasant Teasing
0%
10%
20%
30%
40%
50%
60%
70%
80%
90%
Prim Sec Prim Sec Prim Sec
Govt Catholic Independent
Unpleasant Teasing
0%
10%
20%
30%
40%
50%
60%
70%
80%
90%
Population Principal Deputy
Unpleasant Teasing

65
Conflicts and Quarrels disaggregated by State, Sector, Level, Role and compared with the General Population
____________________________________________________________________________________________________________________
0%
10%
20%
30%
40%
50%
60%
70%
80%
90%
NT NSW Vic Qld SA WA Tas ACT
Conflicts and Quarrels
0%
10%
20%
30%
40%
50%
60%
70%
80%
90%
Prim Sec Prim Sec Prim Sec
Govt Catholic Independent
Conflicts and Quarrels
0%
10%
20%
30%
40%
50%
60%
70%
80%
90%
Population Principal Deputy
Conflicts and Quarrels

66
Gossip and Slander disaggregated by State, Sector, Level, Role and compared with the General Population
____________________________________________________________________________________________________________________
0%
10%
20%
30%
40%
50%
60%
70%
80%
90%
NT NSW Vic Qld SA WA Tas ACT
Gossip and Slander
0%
10%
20%
30%
40%
50%
60%
70%
80%
90%
Prim Sec Prim Sec Prim Sec
Govt Catholic Independent
Gossip and Slander
0%
10%
20%
30%
40%
50%
60%
70%
80%
90%
Population Principal Deputy
Gossip and Slander
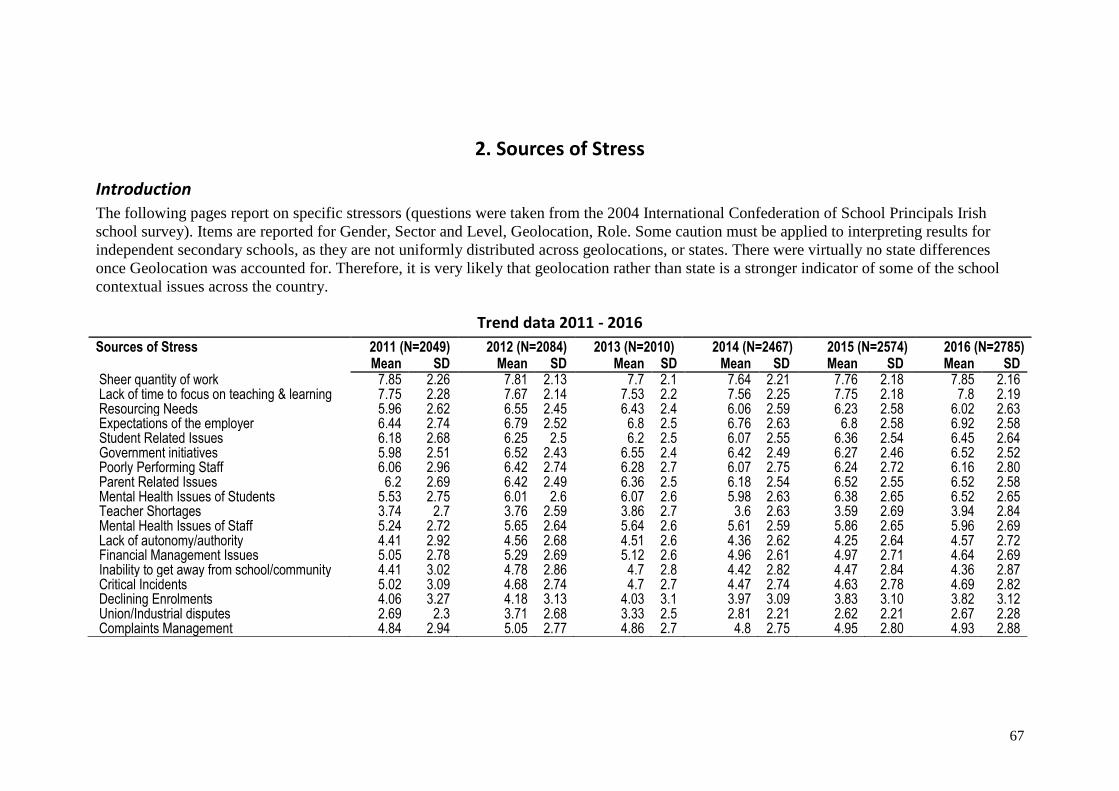
67
2. Sources of Stress
Introduction The following pages report on specific stressors (questions were taken from the 2004 International Confederation of School Principals Irish
school survey). Items are reported for Gender, Sector and Level, Geolocation, Role. Some caution must be applied to interpreting results for
independent secondary schools, as they are not uniformly distributed across geolocations, or states. There were virtually no state differences
once Geolocation was accounted for. Therefore, it is very likely that geolocation rather than state is a stronger indicator of some of the school
contextual issues across the country.
Trend data 2011 - 2016
Sources of Stress 2011 (N=2049) 2012 (N=2084) 2013 (N=2010) 2014 (N=2467) 2015 (N=2574) 2016 (N=2785)
Mean SD Mean SD Mean SD Mean SD Mean SD Mean SD
Sheer quantity of work 7.85 2.26 7.81 2.13 7.7 2.1 7.64 2.21 7.76 2.18 7.85 2.16 Lack of time to focus on teaching & learning 7.75 2.28 7.67 2.14 7.53 2.2 7.56 2.25 7.75 2.18 7.8 2.19 Resourcing Needs 5.96 2.62 6.55 2.45 6.43 2.4 6.06 2.59 6.23 2.58 6.02 2.63 Expectations of the employer 6.44 2.74 6.79 2.52 6.8 2.5 6.76 2.63 6.8 2.58 6.92 2.58 Student Related Issues 6.18 2.68 6.25 2.5 6.2 2.5 6.07 2.55 6.36 2.54 6.45 2.64 Government initiatives 5.98 2.51 6.52 2.43 6.55 2.4 6.42 2.49 6.27 2.46 6.52 2.52 Poorly Performing Staff 6.06 2.96 6.42 2.74 6.28 2.7 6.07 2.75 6.24 2.72 6.16 2.80 Parent Related Issues 6.2 2.69 6.42 2.49 6.36 2.5 6.18 2.54 6.52 2.55 6.52 2.58 Mental Health Issues of Students 5.53 2.75 6.01 2.6 6.07 2.6 5.98 2.63 6.38 2.65 6.52 2.65 Teacher Shortages 3.74 2.7 3.76 2.59 3.86 2.7 3.6 2.63 3.59 2.69 3.94 2.84 Mental Health Issues of Staff 5.24 2.72 5.65 2.64 5.64 2.6 5.61 2.59 5.86 2.65 5.96 2.69 Lack of autonomy/authority 4.41 2.92 4.56 2.68 4.51 2.6 4.36 2.62 4.25 2.64 4.57 2.72 Financial Management Issues 5.05 2.78 5.29 2.69 5.12 2.6 4.96 2.61 4.97 2.71 4.64 2.69 Inability to get away from school/community 4.41 3.02 4.78 2.86 4.7 2.8 4.42 2.82 4.47 2.84 4.36 2.87 Critical Incidents 5.02 3.09 4.68 2.74 4.7 2.7 4.47 2.74 4.63 2.78 4.69 2.82 Declining Enrolments 4.06 3.27 4.18 3.13 4.03 3.1 3.97 3.09 3.83 3.10 3.82 3.12 Union/Industrial disputes 2.69 2.3 3.71 2.68 3.33 2.5 2.81 2.21 2.62 2.21 2.67 2.28 Complaints Management 4.84 2.94 5.05 2.77 4.86 2.7 4.8 2.75 4.95 2.80 4.93 2.88
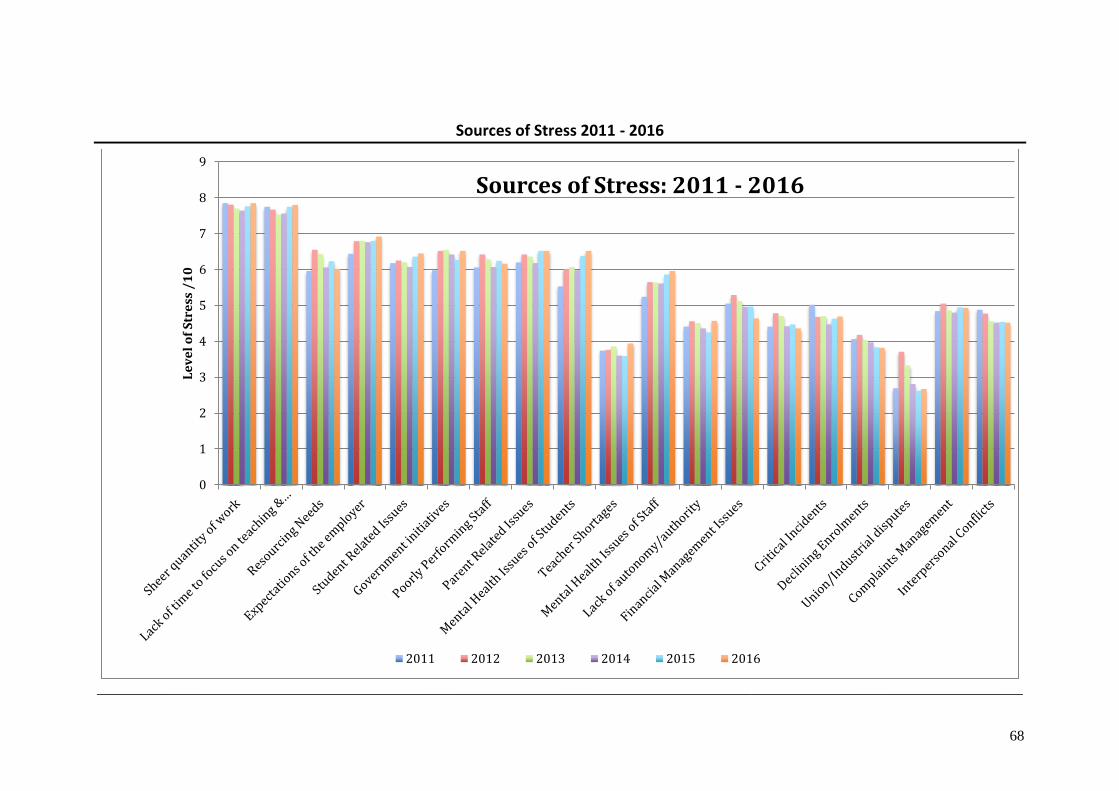
68
Sources of Stress 2011 - 2016
____________________________________________________________________________________________________________________
0
1
2
3
4
5
6
7
8
9
Le
ve
l o
f S
tre
ss /
10
Sources of Stress: 2011 - 2016
2011 2012 2013 2014 2015 2016

69
2016 Data in Detail
Items All Gov Cat Ind Gender Role Govt Catholic Independent
F M Prin Dep Prim Sec Prim Sec Prim Sec
Sheer quantity of work 7.85 7.97 7.71 7.20 8.00 7.63 7.96 7.59 8.10 7.88 7.82 7.34 7.57 7.59
Lack of time to focus on teaching & learning 7.80 7.87 8.04 6.84 7.93 7.60 7.97 7.37 8.03 7.86 8.31 7.34 7.00 7.94
Resourcing Needs 6.03 6.14 5.95 5.32 6.05 5.99 6.11 5.84 6.18 6.10 6.09 5.51 4.80 6.35
Expectations of the employer 6.92 7.25 6.31 5.34 7.02 6.78 7.07 6.52 7.43 7.41 6.54 5.32 5.22 4.76
Student Related Issues 6.45 6.51 6.63 5.72 6.54 6.32 6.40 6.68 6.39 6.15 6.89 5.83 5.31 6.00
Government initiatives 6.52 6.71 6.28 5.42 6.56 6.45 6.59 6.36 6.68 6.89 6.49 5.81 5.19 7.82
Poorly Performing Staff 6.16 6.13 6.36 6.15 6.12 6.22 6.12 6.44 5.61 7.13 6.28 6.92 5.56 6.82
Parent Related Issues 6.52 6.43 6.90 6.54 6.58 6.42 6.55 6.54 6.60 6.06 7.23 6.41 6.50 6.18
Mental Health Issues of Students 6.52 6.64 6.50 5.63 6.68 6.29 6.46 6.76 6.31 7.04 6.41 7.17 4.89 7.59
Teacher Shortages 3.94 4.03 3.83 3.49 4.00 3.86 3.89 4.14 3.53 4.40 3.80 3.73 2.89 4.82
Mental Health Issues of Staff 5.96 6.01 5.95 5.51 6.07 5.78 5.98 6.04 5.76 6.79 5.99 6.00 5.48 7.24
Lack of autonomy/authority 4.58 4.75 4.22 3.83 4.59 4.55 4.53 4.71 4.63 5.25 4.01 4.56 3.46 4.18
Financial Management Issues 4.64 4.65 4.76 4.42 4.60 4.71 4.83 4.21 4.73 4.93 4.88 4.64 4.39 5.24
Inability to get away from school/community 4.36 4.16 5.00 4.82 4.28 4.48 4.42 4.28 4.20 3.90 5.05 4.86 4.89 6.29
Critical Incidents 4.69 4.81 4.41 4.17 4.67 4.71 4.69 4.71 4.49 5.19 4.48 4.64 3.93 5.12
Declining Enrolments 3.82 3.56 4.55 4.68 3.86 3.75 3.99 3.43 3.59 4.03 4.80 4.14 4.91 3.65
Union/Industrial disputes 2.67 2.50 3.47 2.71 2.58 2.80 2.73 2.59 2.36 2.82 3.34 4.19 2.24 3.71
Complaints Management 4.93 4.87 5.32 4.76 4.82 5.09 5.01 4.88 4.73 5.57 5.27 6.08 4.76 5.59
Interpersonal Conflicts 4.52 4.46 4.90 4.39 4.35 4.77 4.52 4.67 4.24 4.82 4.75 5.66 4.22 5.24
Sources of stress. Principals were asked to rate the level of stress they felt in relation to their job tasks listed above
Results
Trends Most stressors have remained relatively stable. Sheer Quantity of Work and Lack of Time to Focus on Teaching and Learning have
consistently been the highest rated by all groups. There are significant increases in the stress caused by Mental Health issues of both students and staff
over the 6-year survey period. This is a worrying trend that goes well beyond the school gate, and confirms similar findings in various studies of
mental health. The costs associated with this trend were recently estimated to be $10.9 Billion annually (PricewaterhouseCoopers Australia, 2014). As
the education workforce is very large, a significant proportion of these costs could be saved. PwC reported a 2.3 return on investment when
organisations addressed the issues directly. It appears foolhardy not to do so in the education sector. Declines are noted in Union/Industrial Disputes
for the same period.
70
Gender No significant differences exist for individual stressors except interpersonal conflicts, which are experienced as more stressful by men. Both
groups report the same ranking of each stressor.
Sector and Type The pattern here is similar to gender. While the differences are larger between these groups than gender differences most are less
than 1-point and the rankings are identical except for independent secondary school principals who rate government initiatives along with the mental
health issues of students as the most stressful items. The similarities rather than differences are the major finding here. The only exceptions to this
was that Government school principals reported more stress resulting from expectations of their employers, while teacher shortages impacted more on
secondary principals.
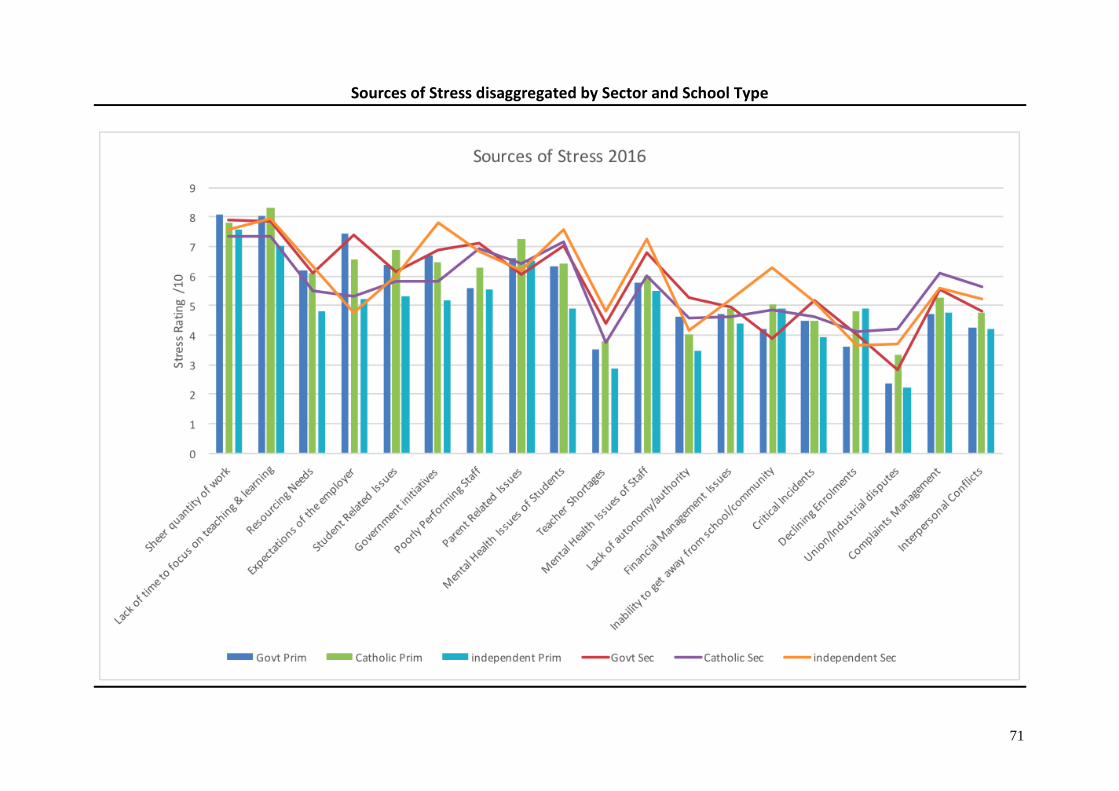
71
Sources of Stress disaggregated by Sector and School Type
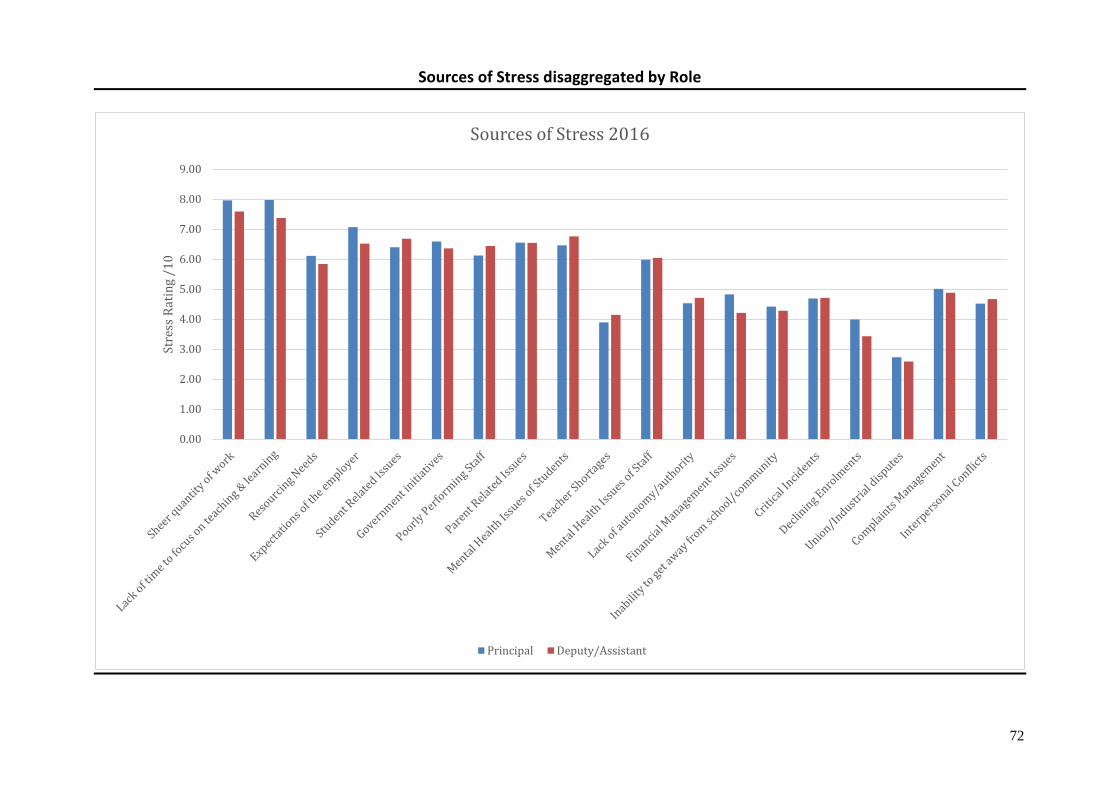
72
Sources of Stress disaggregated by Role
0.00
1.00
2.00
3.00
4.00
5.00
6.00
7.00
8.00
9.00St
ress
Rat
ing
/10
Sources of Stress 2016
Principal Deputy/Assistant
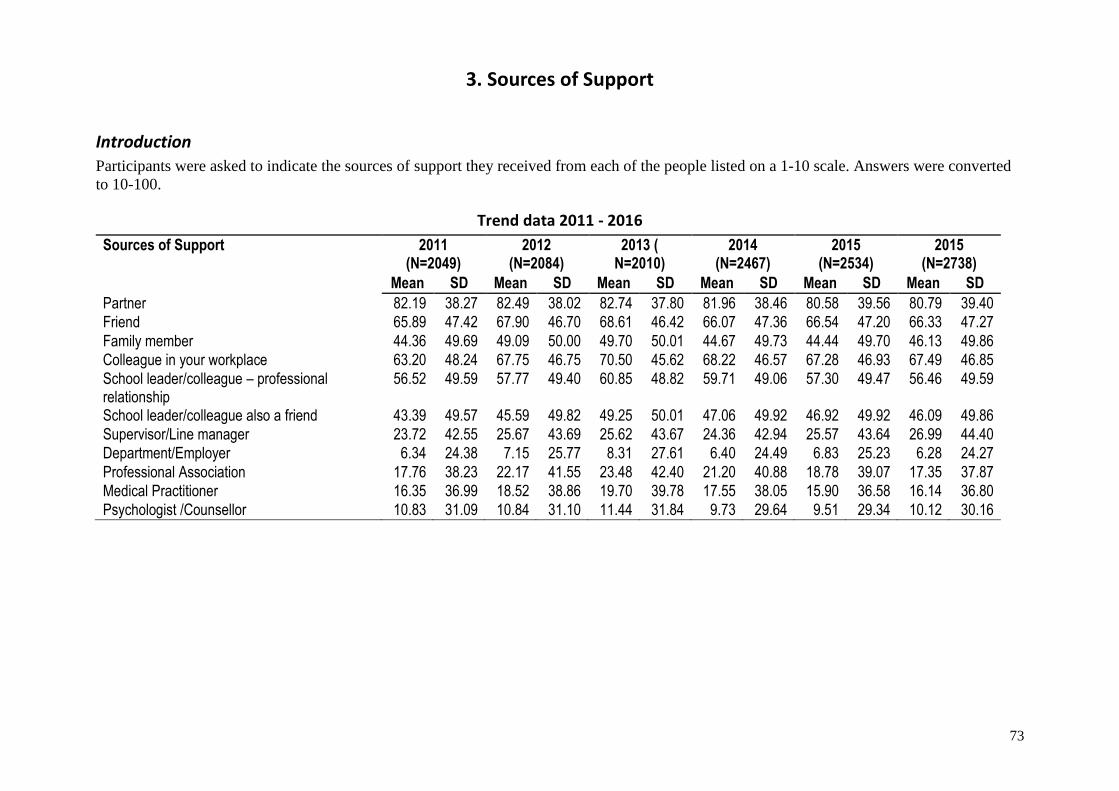
73
3. Sources of Support
Introduction
Participants were asked to indicate the sources of support they received from each of the people listed on a 1-10 scale. Answers were converted
to 10-100.
Trend data 2011 - 2016
Sources of Support 2011 (N=2049)
2012 (N=2084)
2013 ( N=2010)
2014 (N=2467)
2015 (N=2534)
2015 (N=2738)
Mean SD Mean SD Mean SD Mean SD Mean SD Mean SD
Partner 82.19 38.27 82.49 38.02 82.74 37.80 81.96 38.46 80.58 39.56 80.79 39.40
Friend 65.89 47.42 67.90 46.70 68.61 46.42 66.07 47.36 66.54 47.20 66.33 47.27
Family member 44.36 49.69 49.09 50.00 49.70 50.01 44.67 49.73 44.44 49.70 46.13 49.86
Colleague in your workplace 63.20 48.24 67.75 46.75 70.50 45.62 68.22 46.57 67.28 46.93 67.49 46.85
School leader/colleague – professional relationship
56.52 49.59 57.77 49.40 60.85 48.82 59.71 49.06 57.30 49.47 56.46 49.59
School leader/colleague also a friend 43.39 49.57 45.59 49.82 49.25 50.01 47.06 49.92 46.92 49.92 46.09 49.86
Supervisor/Line manager 23.72 42.55 25.67 43.69 25.62 43.67 24.36 42.94 25.57 43.64 26.99 44.40
Department/Employer 6.34 24.38 7.15 25.77 8.31 27.61 6.40 24.49 6.83 25.23 6.28 24.27
Professional Association 17.76 38.23 22.17 41.55 23.48 42.40 21.20 40.88 18.78 39.07 17.35 37.87
Medical Practitioner 16.35 36.99 18.52 38.86 19.70 39.78 17.55 38.05 15.90 36.58 16.14 36.80
Psychologist /Counsellor 10.83 31.09 10.84 31.10 11.44 31.84 9.73 29.64 9.51 29.34 10.12 30.16
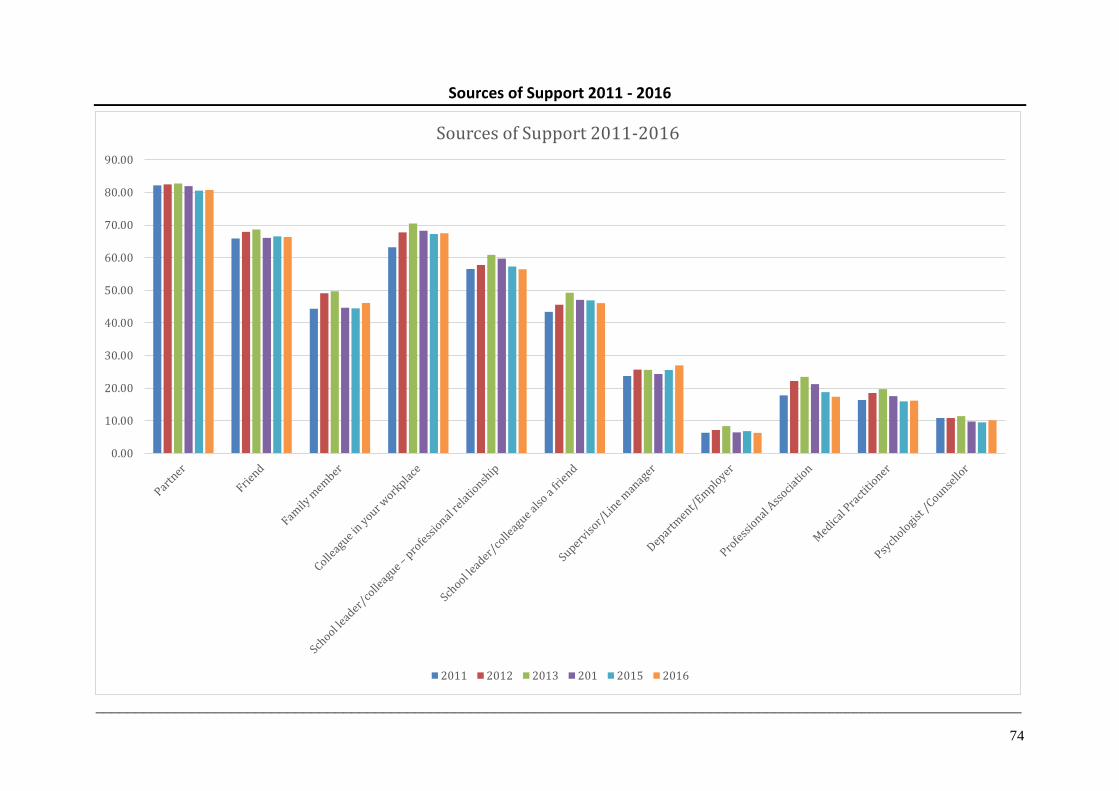
74
Sources of Support 2011 - 2016
____________________________________________________________________________________________________________________
0.00
10.00
20.00
30.00
40.00
50.00
60.00
70.00
80.00
90.00
Sources of Support 2011-2016
2011 2012 2013 201 2015 2016

75
2016 in Detail
Items All Gov Cat Ind Gender Role Govt Catholic Independent
F M Prin Dep Prim Sec Prim Sec Prim Sec
Partner 80.82 79.49 84.58 84.64 75.34 88.94 81.01 79.78 79.36 83.27 84.07 84.75 84.00 76.47
Friend 66.35 66.08 68.69 64.42 71.91 58.11 66.39 66.53 67.59 64.77 71.19 54.24 68.00 70.59
Family member 46.15 46.99 44.39 42.32 54.59 33.64 45.34 46.99 46.52 43.06 45.08 38.98 48.00 23.53
Colleague in your workplace 67.48 68.48 65.42 63.30 70.56 62.92 67.63 66.67 68.24 71.53 66.10 62.71 68.00 58.82
School leader/colleague – professional 56.45 55.56 59.35 58.80 56.55 56.30 57.44 53.55 56.47 62.63 61.02 66.10 60.00 52.94
School leader/colleague also a friend 46.07 46.84 46.96 38.95 49.63 40.80 47.25 44.40 47.06 50.53 48.81 42.37 36.00 41.18
Supervisor/Line manager 27.00 28.29 25.23 19.85 26.93 27.11 29.49 19.13 29.63 34.16 26.10 27.12 18.00 41.18
Department/Employer 6.28 6.36 7.01 4.49 6.24 6.35 7.10 4.37 6.10 9.61 7.12 8.47 4.00 5.88
Professional Association 17.35 18.70 9.35 19.85 15.67 19.85 19.09 12.43 18.93 27.40 9.83 11.86 24.00 23.53
Medical Practitioner 16.15 18.16 9.81 10.86 16.16 16.14 15.49 17.76 17.01 21.71 11.19 5.08 14.00 5.88
Psychologist /Counsellor 10.12 10.62 7.94 9.74 10.95 8.88 9.32 12.43 9.84 9.96 7.80 11.86 14.00 17.65
Sources of Support. Principals were asked to indicate the sources of support from 11 options.
Results
Trends show that every type of support is diminishing except from supervisors. The greatest declines are from the strongest supporters – Family.
This is likely to be linked to the increasing job demands, which are related to high levels of work family conflict. These results suggest that there is a
high level of structural problems in the system as a whole. There are differences between various groups depending on the support type, but they are
more statistical than substantive. The pattern of responses across the system is remarkably similar. All principals face essentially the same difficulties
and call on the same people to support them. The most worrying finding is that over time employers rate at <1 on a 1-10 scale for all 6 years of the
survey. There is much work to be done by this important stakeholder group if adequate levels of trust are to be returned to the system. Social Capital
is built on trust and schools rely on social capital to fully function (see Section 3 for detailed Social Capital findings).
Gender Significant differences exist for individual sources of support. While family provides the largest source of support, the differences between
males and females are very different. Both Males and Females report that their strongest support is from partners. However, females also perceive
support coming from friends and other family members in much greater amounts than males. Women also experience higher levels of support from
colleagues, which is an important aspect of social capital.
Sector and Type The differences are strongest for Independent Secondary leaders, so should be read with the cautions outlined at the beginning of
the technical report. There are no substantive differences between groups.
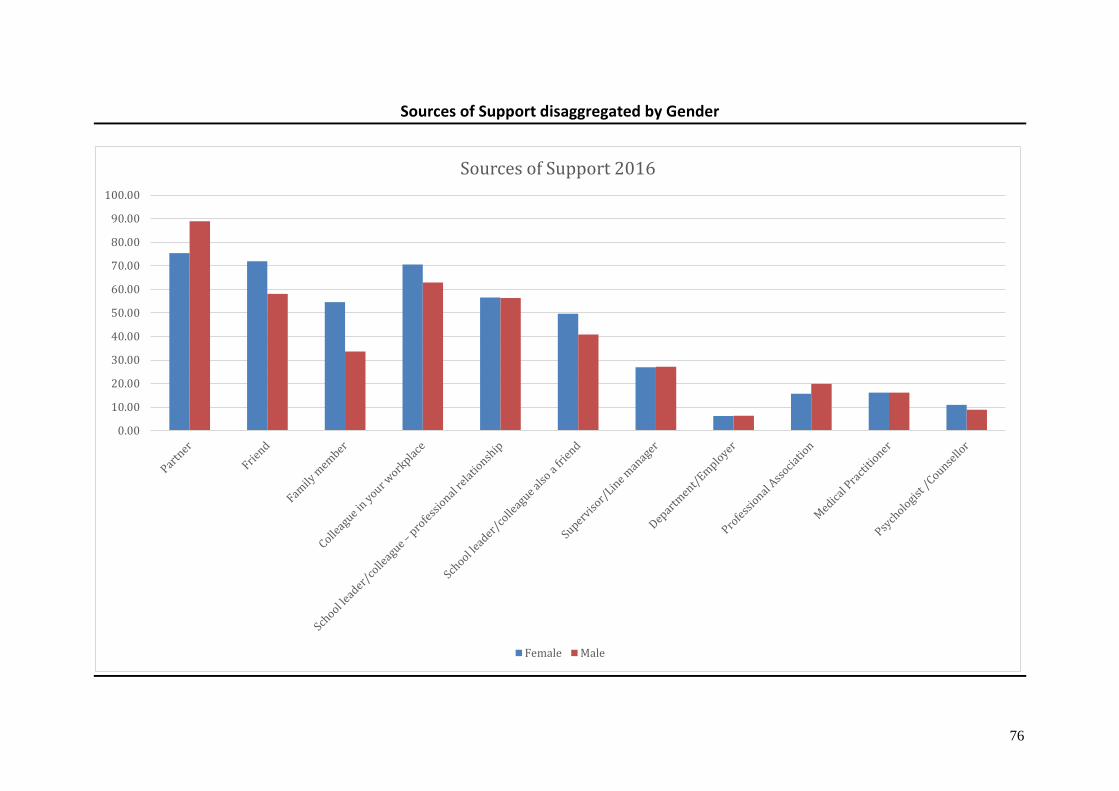
76
Sources of Support disaggregated by Gender
0.00
10.00
20.00
30.00
40.00
50.00
60.00
70.00
80.00
90.00
100.00
Sources of Support 2016
Female Male

77
Sources of Support disaggregated by Sector and School Type
0.00
10.00
20.00
30.00
40.00
50.00
60.00
70.00
80.00
90.00
Sources of Support 2016
Govt Catholic Independent Govt Catholic Independent

78
Sources of Support disaggregated by Role
0.00
10.00
20.00
30.00
40.00
50.00
60.00
70.00
80.00
90.00
Sources of Support 2016
Principal Deputy/Assistant

79
4. Quality of Life
Introduction The following pages report on the Assessment of Quality of Life – 8D (Richardson, Khan, Iezzi & Maxwell 2013). Items are reported for
Gender, Sector and Level, Geolocation, Role. Some caution must be applied to interpreting results for independent secondary schools, as they
are not uniformly distributed across geolocations, or states. There were virtually no state differences once Geolocation was accounted for.
Therefore, it is very likely that geolocation rather than state is a stronger indicator of some of the school contextual issues across the country.
The assessment covers eight dimensions of quality of life clustered under two super dimensions: physical life quality and psychosocial life
quality (hence the 8D suffix). The subscales are self-explanatory
Trend data 2011 - 2016
Population 2011 (N=2049) 2012 (N=2084) 2013 (N=2010) 2014 (N=2467) 2015 (N=2641) 2016 (N=2843)
Mean SD Mean SD Mean SD Mean SD Mean SD Mean SD Mean SD
AQoL8D score 81.66 9.66 79.22 9.47 78.92 9.89 78.86 10.03 79.30 10.05 78.65 10.45 78.65 10.45
Subscale
Independent Living 93.30 10.56 93.09 8.86 92.56 9.74 92.75 9.94 92.92 9.71 92.60 9.99 92.60 9.99
Happiness 72.91 14.19 71.99 14.03 71.63 14.72 71.09 14.82 71.58 14.79 70.57 15.25 70.57 15.25
Mental Health 76.08 12.43 71.74 12.73 72.03 12.85 72.40 12.79 72.71 13.00 71.95 13.51 71.95 13.51
Coping 74.92 14.38 71.34 13.73 70.87 14.30 70.68 14.32 70.94 14.47 70.06 14.98 70.06 14.98
Relationships 84.85 11.69 82.74 11.82 82.23 12.76 82.04 12.95 82.90 12.76 82.48 13.16 82.48 13.16
Self-Worth 81.71 15.21 79.72 13.93 79.65 14.64 79.44 14.70 80.19 14.89 79.08 15.52 79.08 15.52
Pain 84.50 18.43 83.83 17.95 82.86 18.49 82.29 19.10 82.67 19.16 82.36 19.44 82.36 19.44
Senses 87.79 10.10 83.84 10.10 83.36 10.01 83.31 9.98 83.45 9.81 83.05 10.02 83.05 10.02
Super Dimensions
Psycho-Social 89.41 9.92 87.90 8.62 87.27 8.94 87.21 9.30 87.42 9.21 87.08 9.39 87.08 9.39
Physical 78.48 11.21 75.66 11.17 75.49 11.79 75.43 11.82 75.97 11.84 75.20 12.38 75.20 12.38

80
Assessment of Quality of Life 8-D 2011 - 2016
____________________________________________________________________________________________________________________
0
10
20
30
40
50
60
70
80
90
100
Ind
epen
den
t L
ivin
g
Hap
pin
ess
Men
tal H
ealt
h
Co
pin
g
Rel
atio
nsh
ips
Self
Wo
rth
Pai
n
Sen
ses
Ph
ysi
cal
Psy
cho
Soci
al
Subscales Super Dimensions
Psy
cho
me
tric
Sco
rin
g
Assessment of Quality of Life-8D 2011-2016
2011
2012
2013
2014
2015
2016
Population

81
2016 Data in Detail
Items Population Critical Value Gender Role Govt Catholic Independent
M SD Low High F M Prin Dep Prim Sec Prim Sec Prim Sec
Independent Living 93.30 10.56 88.02 98.58 92.77 92.45 93.75 93.52 92.79 92.73 92.96 92.22 92.57 93.38
Happiness 72.91 14.19 65.82 80.01 70.39 70.00 71.98 70.63 70.99 69.51 70.80 68.93 69.82 72.69
Mental Health 76.08 12.43 69.87 82.30 72.06 71.73 72.59 73.62 71.82 72.42 72.13 71.29 71.41 73.57
Coping 74.92 14.38 67.73 82.11 69.95 69.46 71.55 70.98 70.06 69.79 70.02 69.33 68.87 71.95
Relationships 84.85 11.69 79.01 90.70 82.54 82.17 83.59 83.53 83.16 81.62 82.54 82.22 81.70 84.09
Self-Worth 81.71 15.21 74.11 89.32 79.35 79.03 80.70 79.56 79.53 79.09 79.81 77.96 78.72 82.89
Pain 84.50 18.43 75.29 93.72 82.30 81.33 84.45 86.09 82.06 82.67 82.01 82.63 81.47 79.70
Senses 87.79 10.10 82.74 92.84 83.34 83.33 83.19 83.67 84.27 81.98 83.33 83.23 83.13 83.53
Psychosocial Super dimension 89.41 9.92 84.45 94.37 87.23 86.85 88.14 88.58 87.47 86.87 87.23 87.03 86.87 86.92
Physical Super dimension 78.48 11.21 72.88 84.09 75.24 74.88 76.31 76.21 75.46 74.92 75.40 74.43 74.51 77.19
Total 81.66 9.66 76.83 86.49 78.73 78.36 79.75 79.81 78.95 78.40 78.84 78.09 78.10 80.02
Results
Trends The significant finding is that school leaders do not reach the Australian average for Quality of Life despite having many attributes that would
predict above average scores: e.g., in comparison to the general population school leaders are more likely to have grown up, and are currently in
stable families, they have relatively secure and well-paid employment. They are also well educated. Taken together these attributes predict higher
quality of life. While the average numbers for all groups do not fall into the critically low category, the numbers of leaders who report very low
quality of life is also very concerning. Averages can be misleading. The high levels of red flag individuals suggest very high levels of distress that is
across all states and territories, all sectors and school types.
Gender No significant differences on average.
Sector and Type No significant differences on average.

82
Quality of Life disaggregated by Gender compared with the General Population
0.00
10.00
20.00
30.00
40.00
50.00
60.00
70.00
80.00
90.00
100.00
Ind
epen
den
t L
ivin
g
Hap
pin
ess
Men
tal H
ealt
h
Co
pin
g
Rel
atio
nsh
ips
Self
Wo
rth
Pai
n
Sen
ses
Psy
cho
soci
al
Ph
ysi
cal
To
tal s
core
Subscales Super Dimensions Total
AQoL-8D 2016
Female
Male
Population

83
Quality of Life disaggregated by school sector and type
____________________________________________________________________________________________________________________
0.00
10.00
20.00
30.00
40.00
50.00
60.00
70.00
80.00
90.00
100.00
IndependentLiving
Happiness Mental Health Coping Relationships Self Worth Pain Senses
Assessment of Quality of Life - 8D 2016
Govt
Catholic
Independent
Govt
Catholic
Independent
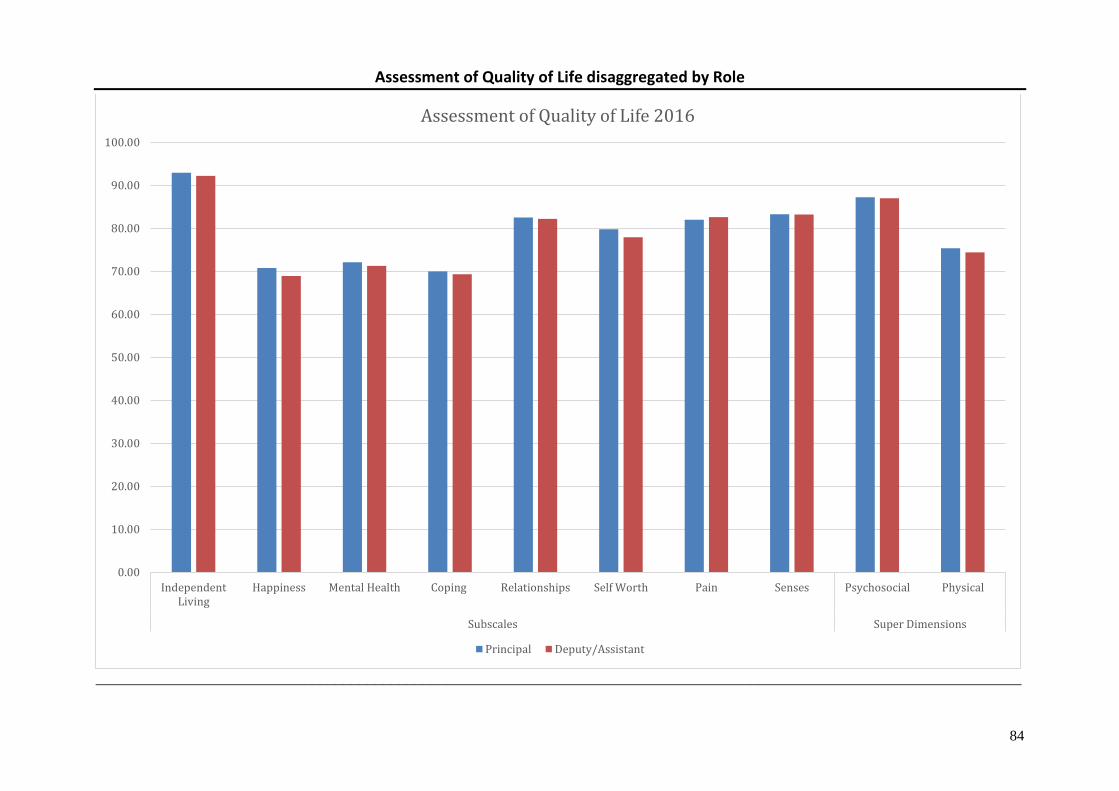
84
Assessment of Quality of Life disaggregated by Role
____________________________________________________________________________________________________________________
0.00
10.00
20.00
30.00
40.00
50.00
60.00
70.00
80.00
90.00
100.00
IndependentLiving
Happiness Mental Health Coping Relationships Self Worth Pain Senses Psychosocial Physical
Subscales Super Dimensions
Assessment of Quality of Life 2016
Principal Deputy/Assistant
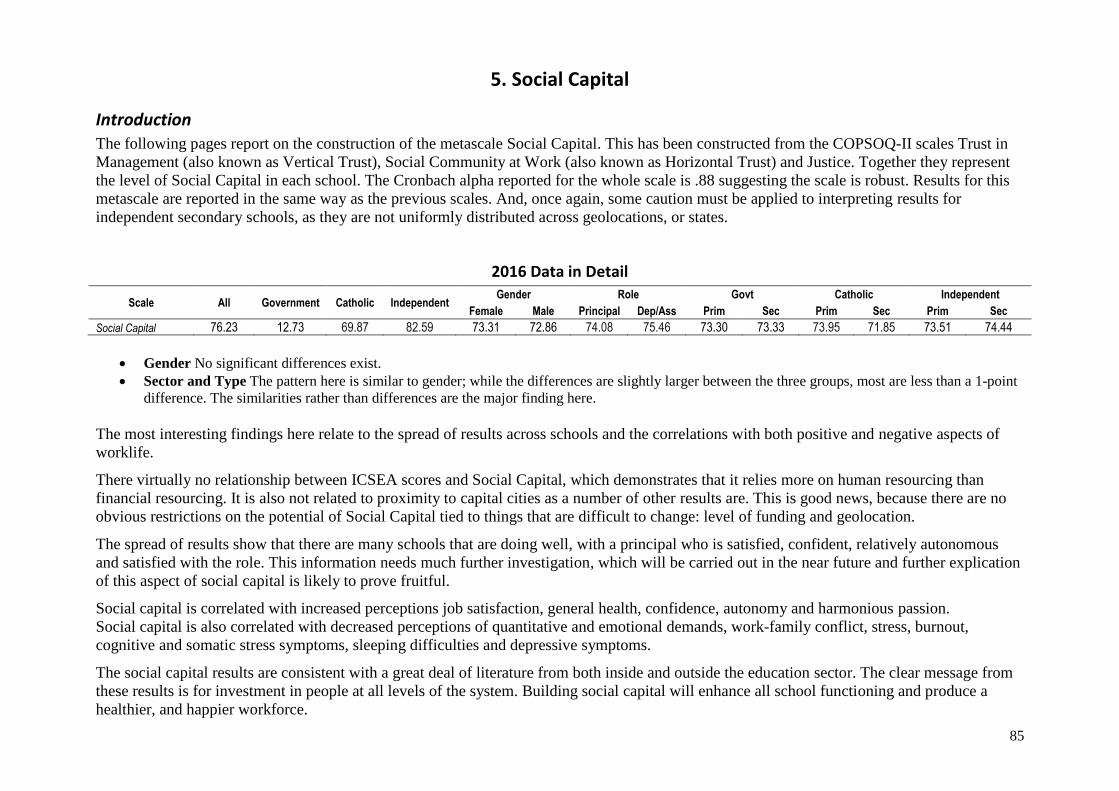
85
5. Social Capital
Introduction The following pages report on the construction of the metascale Social Capital. This has been constructed from the COPSOQ-II scales Trust in
Management (also known as Vertical Trust), Social Community at Work (also known as Horizontal Trust) and Justice. Together they represent
the level of Social Capital in each school. The Cronbach alpha reported for the whole scale is .88 suggesting the scale is robust. Results for this
metascale are reported in the same way as the previous scales. And, once again, some caution must be applied to interpreting results for
independent secondary schools, as they are not uniformly distributed across geolocations, or states.
2016 Data in Detail
Scale All Government Catholic Independent Gender Role Govt Catholic Independent
Female Male Principal Dep/Ass Prim Sec Prim Sec Prim Sec
Social Capital 76.23 12.73 69.87 82.59 73.31 72.86 74.08 75.46 73.30 73.33 73.95 71.85 73.51 74.44
Gender No significant differences exist.
Sector and Type The pattern here is similar to gender; while the differences are slightly larger between the three groups, most are less than a 1-point
difference. The similarities rather than differences are the major finding here.
The most interesting findings here relate to the spread of results across schools and the correlations with both positive and negative aspects of
worklife.
There virtually no relationship between ICSEA scores and Social Capital, which demonstrates that it relies more on human resourcing than
financial resourcing. It is also not related to proximity to capital cities as a number of other results are. This is good news, because there are no
obvious restrictions on the potential of Social Capital tied to things that are difficult to change: level of funding and geolocation.
The spread of results show that there are many schools that are doing well, with a principal who is satisfied, confident, relatively autonomous
and satisfied with the role. This information needs much further investigation, which will be carried out in the near future and further explication
of this aspect of social capital is likely to prove fruitful.
Social capital is correlated with increased perceptions job satisfaction, general health, confidence, autonomy and harmonious passion.
Social capital is also correlated with decreased perceptions of quantitative and emotional demands, work-family conflict, stress, burnout,
cognitive and somatic stress symptoms, sleeping difficulties and depressive symptoms.
The social capital results are consistent with a great deal of literature from both inside and outside the education sector. The clear message from
these results is for investment in people at all levels of the system. Building social capital will enhance all school functioning and produce a
healthier, and happier workforce.
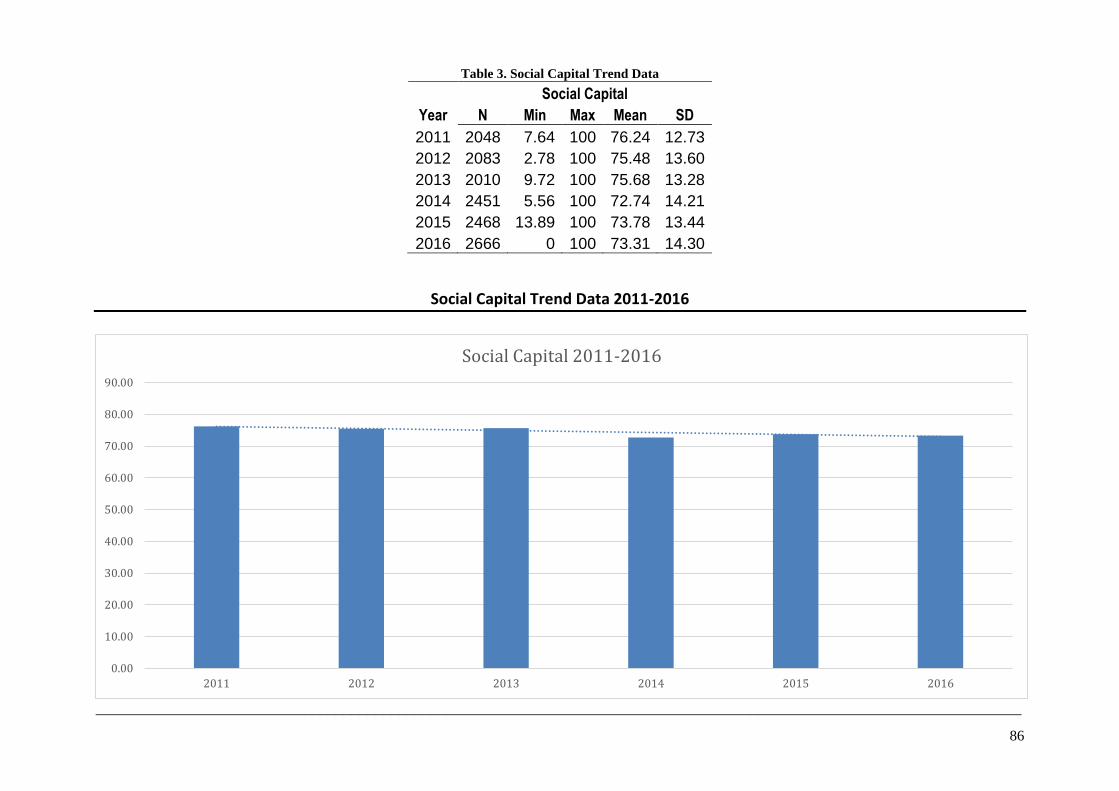
86
Table 3. Social Capital Trend Data
Social Capital
Year N Min Max Mean SD
2011 2048 7.64 100 76.24 12.73
2012 2083 2.78 100 75.48 13.60
2013 2010 9.72 100 75.68 13.28
2014 2451 5.56 100 72.74 14.21
2015 2468 13.89 100 73.78 13.44
2016 2666 0 100 73.31 14.30
Social Capital Trend Data 2011-2016
____________________________________________________________________________________________________________________
0.00
10.00
20.00
30.00
40.00
50.00
60.00
70.00
80.00
90.00
2011 2012 2013 2014 2015 2016
Social Capital 2011-2016
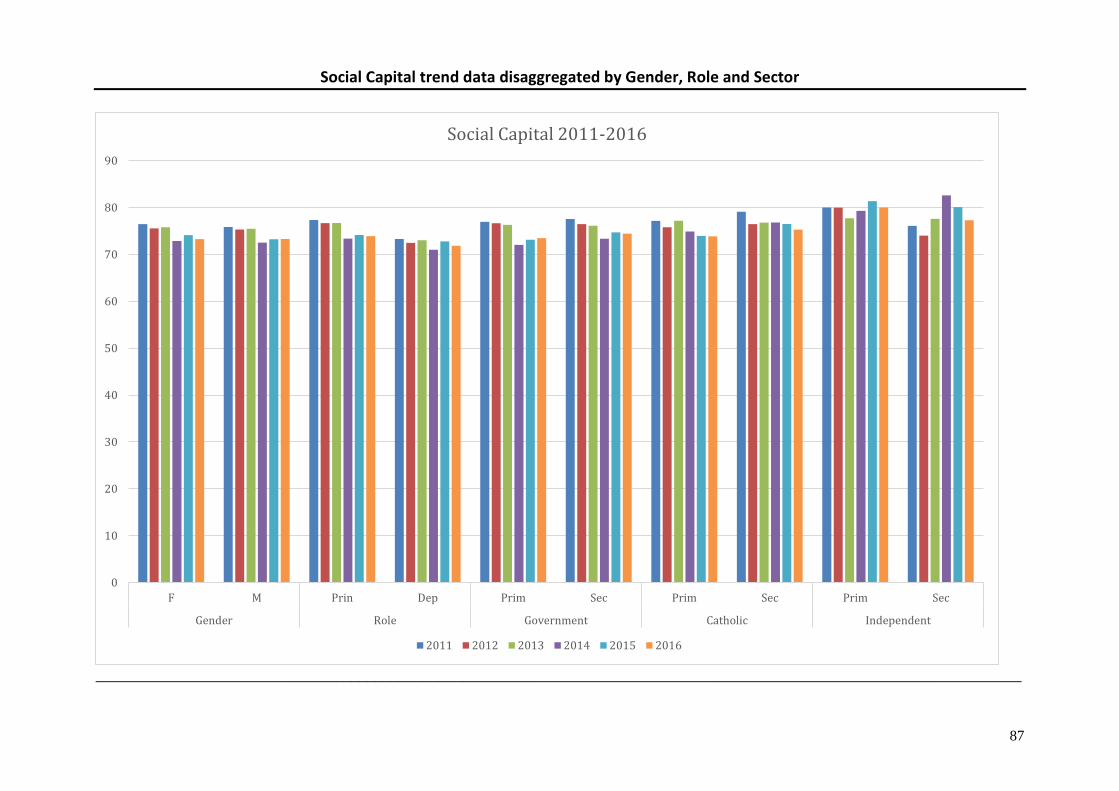
87
Social Capital trend data disaggregated by Gender, Role and Sector
____________________________________________________________________________________________________________________
0
10
20
30
40
50
60
70
80
90
F M Prin Dep Prim Sec Prim Sec Prim Sec
Gender Role Government Catholic Independent
Social Capital 2011-2016
2011 2012 2013 2014 2015 2016

88
Correlations between Social Capital and Quantitative and Emotional Demands, Work-Family Conflict, Burnout, Stress and Sleeping Troubles
____________________________________________________________________________________________________________________
____________________________________________________________________________________________________________________
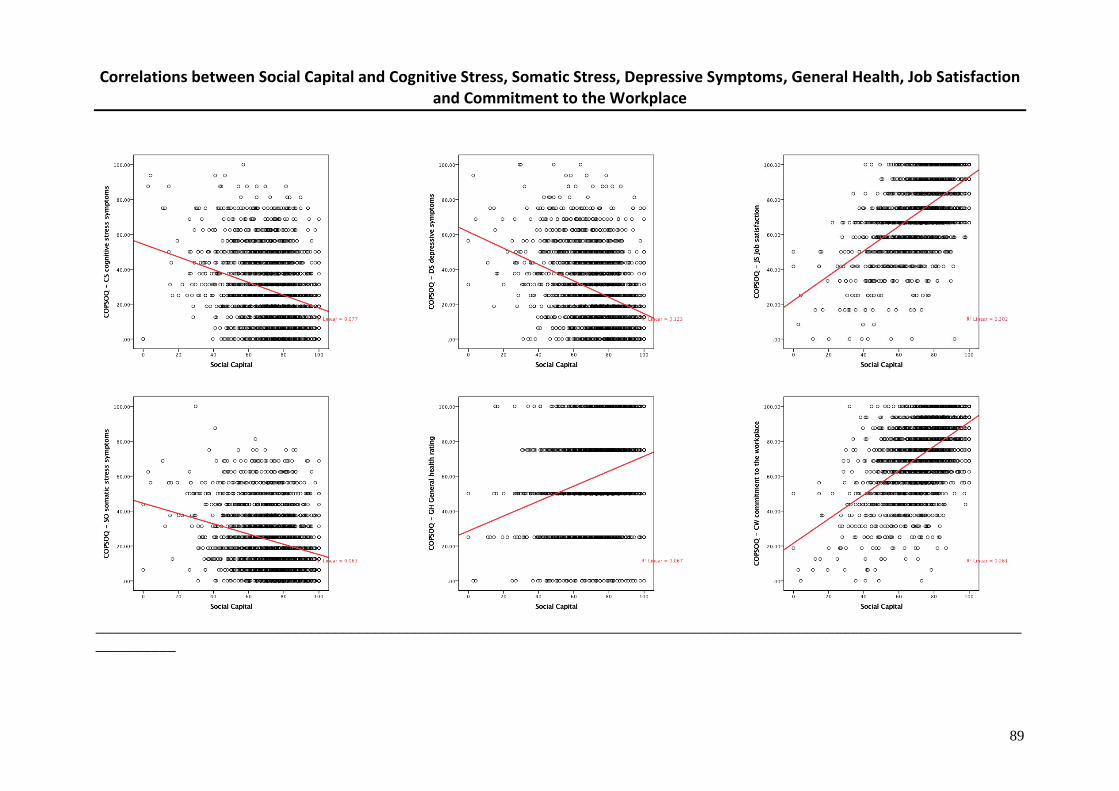
89
Correlations between Social Capital and Cognitive Stress, Somatic Stress, Depressive Symptoms, General Health, Job Satisfaction and Commitment to the Workplace
____________________________________________________________________________________________________________________
__________
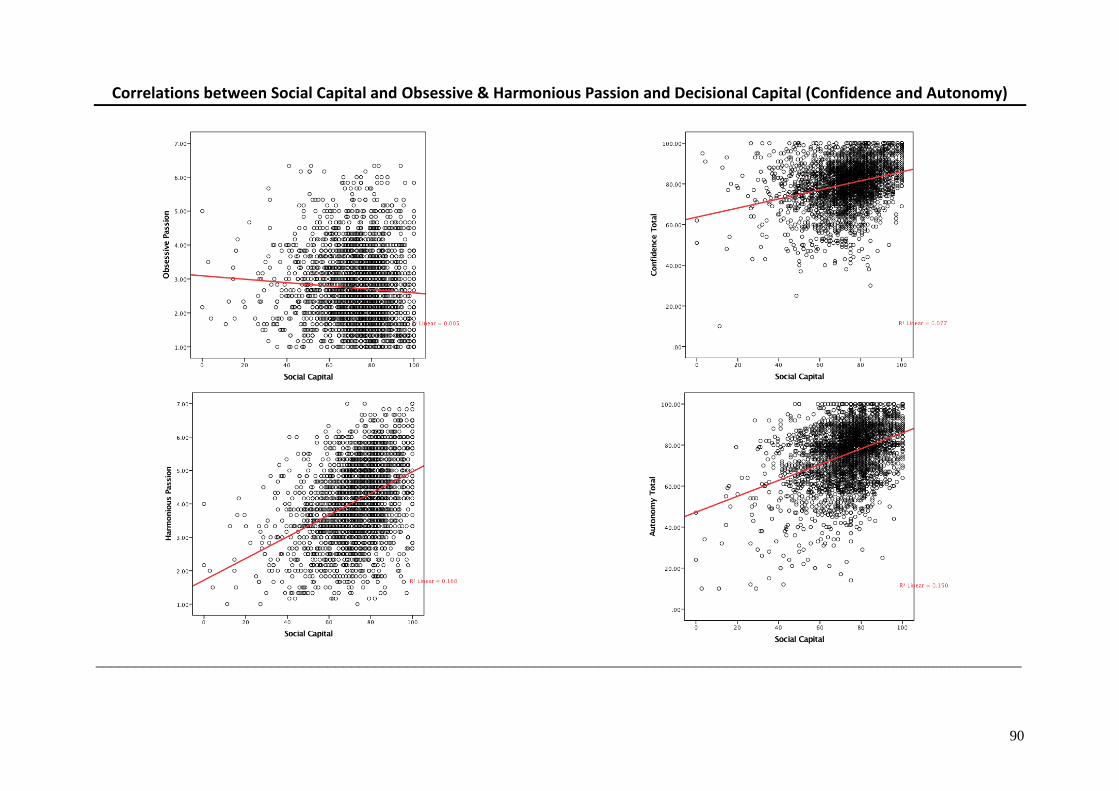
90
Correlations between Social Capital and Obsessive & Harmonious Passion and Decisional Capital (Confidence and Autonomy)
____________________________________________________________________________________________________________________
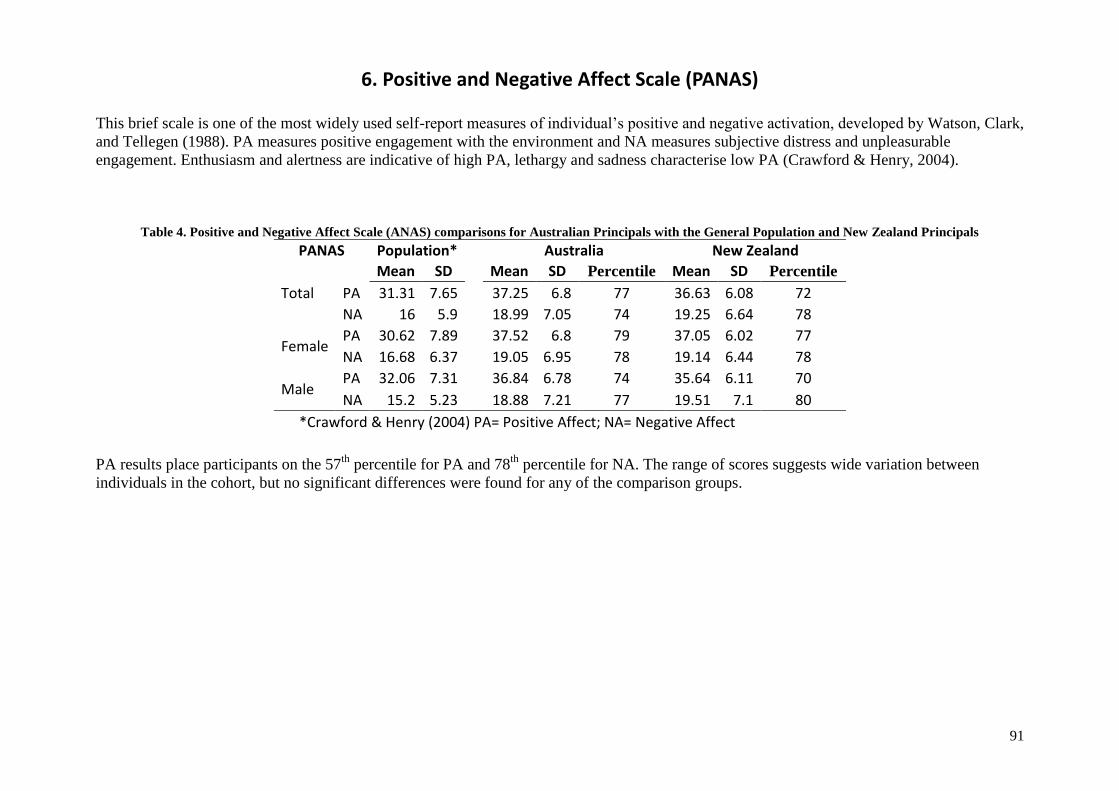
91
6. Positive and Negative Affect Scale (PANAS)
This brief scale is one of the most widely used self-report measures of individual’s positive and negative activation, developed by Watson, Clark,
and Tellegen (1988). PA measures positive engagement with the environment and NA measures subjective distress and unpleasurable
engagement. Enthusiasm and alertness are indicative of high PA, lethargy and sadness characterise low PA (Crawford & Henry, 2004).
Table 4. Positive and Negative Affect Scale (ANAS) comparisons for Australian Principals with the General Population and New Zealand Principals
PANAS Population* Australia New Zealand
Mean SD
Mean SD Percentile Mean SD Percentile
Total PA 31.31 7.65
37.25 6.8 77 36.63 6.08 72
NA 16 5.9
18.99 7.05 74 19.25 6.64 78
Female PA 30.62 7.89
37.52 6.8 79 37.05 6.02 77
NA 16.68 6.37
19.05 6.95 78 19.14 6.44 78
Male PA 32.06 7.31
36.84 6.78 74 35.64 6.11 70
NA 15.2 5.23 18.88 7.21 77 19.51 7.1 80
*Crawford & Henry (2004) PA= Positive Affect; NA= Negative Affect
PA results place participants on the 57
th percentile for PA and 78
th percentile for NA. The range of scores suggests wide variation between
individuals in the cohort, but no significant differences were found for any of the comparison groups.
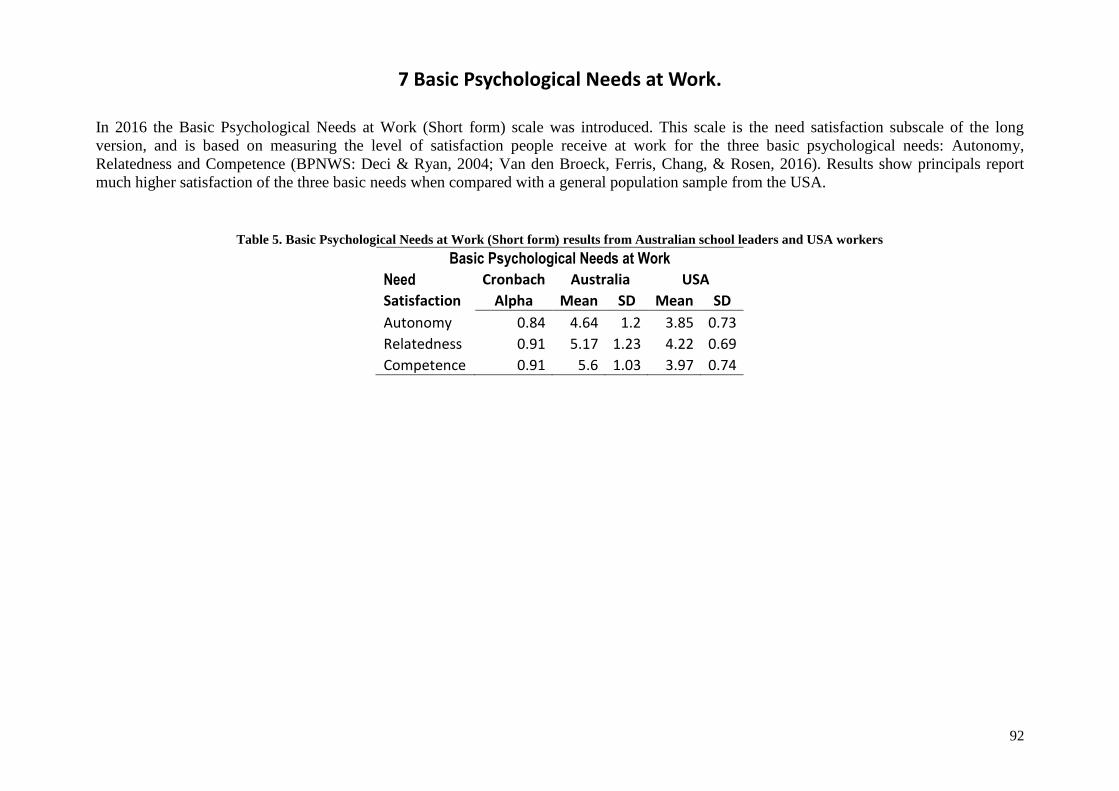
92
7 Basic Psychological Needs at Work.
In 2016 the Basic Psychological Needs at Work (Short form) scale was introduced. This scale is the need satisfaction subscale of the long
version, and is based on measuring the level of satisfaction people receive at work for the three basic psychological needs: Autonomy,
Relatedness and Competence (BPNWS: Deci & Ryan, 2004; Van den Broeck, Ferris, Chang, & Rosen, 2016). Results show principals report
much higher satisfaction of the three basic needs when compared with a general population sample from the USA.
Table 5. Basic Psychological Needs at Work (Short form) results from Australian school leaders and USA workers
Basic Psychological Needs at Work
Need Cronbach Australia USA
Satisfaction Alpha Mean SD Mean SD
Autonomy 0.84 4.64 1.2 3.85 0.73
Relatedness 0.91 5.17 1.23 4.22 0.69
Competence 0.91 5.6 1.03 3.97 0.74
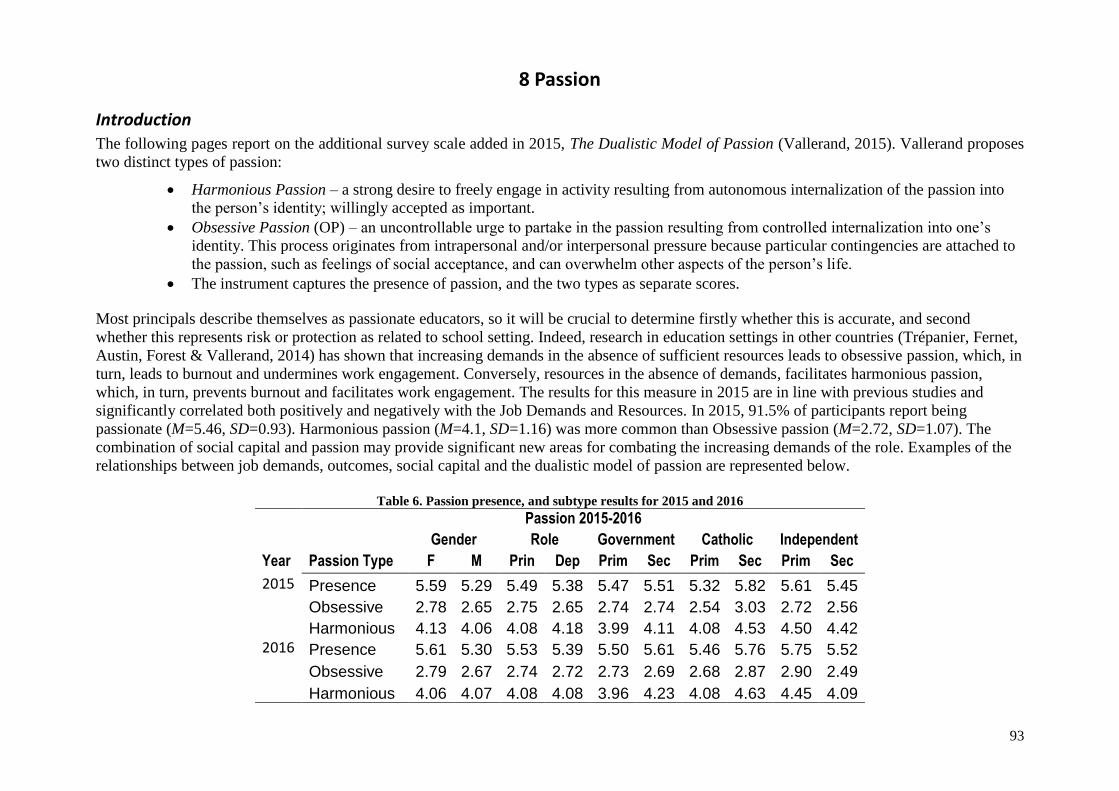
93
8 Passion
Introduction The following pages report on the additional survey scale added in 2015, The Dualistic Model of Passion (Vallerand, 2015). Vallerand proposes
two distinct types of passion:
Harmonious Passion – a strong desire to freely engage in activity resulting from autonomous internalization of the passion into
the person’s identity; willingly accepted as important.
Obsessive Passion (OP) – an uncontrollable urge to partake in the passion resulting from controlled internalization into one’s
identity. This process originates from intrapersonal and/or interpersonal pressure because particular contingencies are attached to
the passion, such as feelings of social acceptance, and can overwhelm other aspects of the person’s life.
The instrument captures the presence of passion, and the two types as separate scores.
Most principals describe themselves as passionate educators, so it will be crucial to determine firstly whether this is accurate, and second
whether this represents risk or protection as related to school setting. Indeed, research in education settings in other countries (Trépanier, Fernet,
Austin, Forest & Vallerand, 2014) has shown that increasing demands in the absence of sufficient resources leads to obsessive passion, which, in
turn, leads to burnout and undermines work engagement. Conversely, resources in the absence of demands, facilitates harmonious passion,
which, in turn, prevents burnout and facilitates work engagement. The results for this measure in 2015 are in line with previous studies and
significantly correlated both positively and negatively with the Job Demands and Resources. In 2015, 91.5% of participants report being
passionate (M=5.46, SD=0.93). Harmonious passion (M=4.1, SD=1.16) was more common than Obsessive passion (M=2.72, SD=1.07). The
combination of social capital and passion may provide significant new areas for combating the increasing demands of the role. Examples of the
relationships between job demands, outcomes, social capital and the dualistic model of passion are represented below.
Table 6. Passion presence, and subtype results for 2015 and 2016
Passion 2015-2016
Gender Role Government Catholic Independent
Year Passion Type F M Prin Dep Prim Sec Prim Sec Prim Sec
2015 Presence 5.59 5.29 5.49 5.38 5.47 5.51 5.32 5.82 5.61 5.45
Obsessive 2.78 2.65 2.75 2.65 2.74 2.74 2.54 3.03 2.72 2.56
Harmonious 4.13 4.06 4.08 4.18 3.99 4.11 4.08 4.53 4.50 4.42
2016 Presence 5.61 5.30 5.53 5.39 5.50 5.61 5.46 5.76 5.75 5.52
Obsessive 2.79 2.67 2.74 2.72 2.73 2.69 2.68 2.87 2.90 2.49
Harmonious 4.06 4.07 4.08 4.08 3.96 4.23 4.08 4.63 4.45 4.09

94
2016 Data in Detail
Passion All Govt Catholic Independent Gender Role Govt Catholic Independent
F M Prin Dep Prim Sec Prim Sec Prim Sec
Presence 5.49 5.48 5.22 5.56 5.61 5.30 5.53 5.39 5.50 5.61 5.46 5.76 5.75 5.52
Obsessive 2.74 2.73 2.70 2.80 2.79 2.67 2.74 2.72 2.73 2.69 2.68 2.87 2.90 2.49
Harmonious 4.06 4.02 4.20 4.35 4.06 4.07 4.08 4.08 3.96 4.23 4.08 4.63 4.45 4.09
Gender No significant differences exist.
Sector and Type No significant differences exist.
The most interesting findings here relate to the spread of results across schools and the correlations with both positive and negative
aspects of worklife, which are represented graphically in the following pages
These early results suggest that the combination of passion and social capital, both of which appear unrelated to resourcing offer enticing
possibilities for fundamental improvement of the school system.

95
Passion disaggregated by Type, Gender, Role and Sector
____________________________________________________________________________________________________________________
0.00
1.00
2.00
3.00
4.00
5.00
6.00
7.00
Female Male Prin Dep Prim Sec Prim Sec Prim Sec
Government Catholic Independent
Gender Role Sector
Passion Subtypes 2015-16
2015 2016 2015 2016

96
Correlations between Passion, Quantitative & Emotional Demands, and Work-Family Conflict
____________________________________________________________________________________________________________________
____________________________________________________________________________________________________________________

97
Correlations between Passion and Cognitive Stress, Depressive Symptoms, and Trouble Sleeping
____________________________________________________________________________________________________________________

98
Correlations between Passion, Burnout, General Health and Self-Efficacy
____________________________________________________________________________________________________________________
____________________________________________________________________________________________________________________

99
Correlations between Passion, Quality of Life, Commitment to the Workplace and Job Satisfaction
____________________________________________________________________________________________________________________

100
References ACARA. (2011). My School. Retrieved from http://www.myschool.edu.au/
ACARA. (2013). Guide to understanding 2012 Index of Community Socio-educational Advantage
(ICSEA) values. Retrieved from Sydney: http://www.myschool.edu.au
Bakker, A. B., & Demerouti, E. (2014). Job demands-resources theory. In P. Y. Chen & C. L. Cooper
(Eds.), Work and wellbeing (Vol. III, pp. 37-64). London: Wiley-Blackwell.
Babor, T. F., Higgins-Biddle, J. C., Saunders, J. B., & Monteiro, M. G. (2001). AUDIT: The alcohol
use disorders identification test. Guidelines for use in primary care (W. H. Organization Ed.
2nd ed.). Geneva.
Burens, I. (2015, Oct 7-9). Psychosocial risk mangagement in France. Paper presented at the
COPSOQ International Workshop, MAS Centre Paris.
Chen, B., Vansteenkiste, M., Beyers, W., Boone, L., Deci, E., Kaap-Deeder, J., . . . Verstuyf, J.
(2015). Basic psychological need satisfaction, need frustration, and need strength across four
cultures. Motiv Emot, 39(2), 216-236. doi:10.1007/s11031-014-9450-1
Deci, E. L., & Ryan, R. M. (2000). The "What" and "Why" of goal pursuits: Human needs and the
self-determination of behavior. Psychological Inquiry, 11(4), 227-268.
doi:10.1207/S15327965PLI1104_01
Deci, E. L., & Ryan, R. M. (2012). Self-determination theory. In P. A. M. Van Lange, A. W.
Kruglanski, E. T. Higgins, P. A. M. Van Lange, A. W. Kruglanski, & E. T. Higgins (Eds.),
Handbook of theories of social psychology (Vol 1). (pp. 416-436). Thousand Oaks, CA: Sage
Publications Ltd.
Fernet, C., Lavigne, G. L., Vallerand, R. J., & Austin, S. (2014). Fired up with passion: Investigating
how job autonomy and passion predict burnout at career start in teachers. Work & Stress,
28(3), 270-288. doi:http://dx.doi.org/10.1080/02678373.2014.935524
Idler, E. L., & Benyamini, Y. (1997). Self-rated health and mortality: A review of twenty-seven
community studies. J Health Soc Behavior, 38, 21–37.
Leithwood, K. (2006). Teacher working conditions that matter: Evidence for change. Retrieved from
Toronto.
OECD (2013). Education at a Glance: Education indicators. Paris. OECD
Pejtersen, J. H., Kristensen, T. S., Borg, V., & Bjorner, J. B. (2010). The second version of the
Copenhagen Psychosocial Questionnaire. Scandinavian Journal of Public Health, 38(Suppl 3),
8-24. doi:http://dx.doi.org/10.1177/1403494809349858
PricewaterhouseCoopers Australia. (2014). Creating a mentally healthy workplace: Return on
investment analysis. Retrieved from http://www.headsup.org.au/creating-a-mentally-
healthy-workplace/the-business-case). website: www.headsup.org.au Retrieved from
www.headsup.org.au Richardson, J., Khan, M., Iezzi, A., Sinha, K., Mihalopoulos, C., Herrman, H., . . . Schweitzer, I.
(2009). The AQoL-8D (PsyQoL) MAU Instrument: Overview September 2009. Retrieved from
Melbourne:
Richardson, J., Khan, M. A., Iezzi, A., & Maxwell, A. (2013). Validity and reliability of the
Assessment of Quality of Life (AQoL)-8D multi-attribute utility instrument. The Patient -
Patient-Centered Outcomes Research, 7(1), 85-96.
Ryan, R. M. (2015). EMU methodology. ARC Centre of Excellence for Indigenous thriving. IPPE.
Sydney.
Sahlberg, P. (2015). Finnish lessons 2.0: What can the world learn from educational change in
Finland? New York: Teachers College Press.
Sellar, S., & Lingard, B. (2014). The OECD and the Expansion of PISA: New Global Modes of
Governance in Education. British Educational Research Journal, 40(6), 917-936
Thomson, S., Bortoli, L. D., & Buckley, S. (2013). PISA 2012: How Australia measures up. Retrieved
from Camberwell:
Trepanier, S.-G., Fernet, C., Austin, S., Forest, J., & Vallerand, R. J. (2014). Linking job demands and
101
resources to burnout and work engagement: Does passion underlie these differential
relationships? Motivation and Emotion, 38(3), 353-366. doi:http://dx.doi.org/10.1007/s11031-
013-9384-z
Twemlow, S. W., Fonagy, P., & Sacco, F. C. (2001). An innovative psychodynamically influenced
approach to reduce school violence. Journal of the American Academy of Child & Adolescent
Psychiatry, 40(3), 377-379. doi:http://dx.doi.org/10.1097/00004583-200103000-00019
Twemlow, S. W., Fonagy, P., & Sacco, F. C. (2002). Feeling safe in school. Smith College Studies in
Social Work, 72(2), 303-326.
Vallerand, R. J. (2015). The psychology of passion: A dualistic model. New York, NY: Oxford
University Press.
Van den Broeck, A., Ferris, D. L., Chang, C.-H., & Rosen, C. C. (2016). A review of Self-
Determination Theory’s Basic Psychological Needs at Work. Journal of Management, 42(5),
1195-1229. doi:10.1177/0149206316632058
Williams, T., Ferraro, D., Roey, S., Brenwald, S., Kastberg, D., Jocelyn, L., . . . Stearns, P. (2007).
TIMSS 2007 U.S. technical report and user guide. Retrieved from Washington DC: