the fiscal state of the nation paul johnson chartered institute of housing conference june 12 2012...
TRANSCRIPT
The fiscal state of the nationPaul JohnsonChartered Institute of Housing Conference
June 12 2012
© Institute for Fiscal Studies
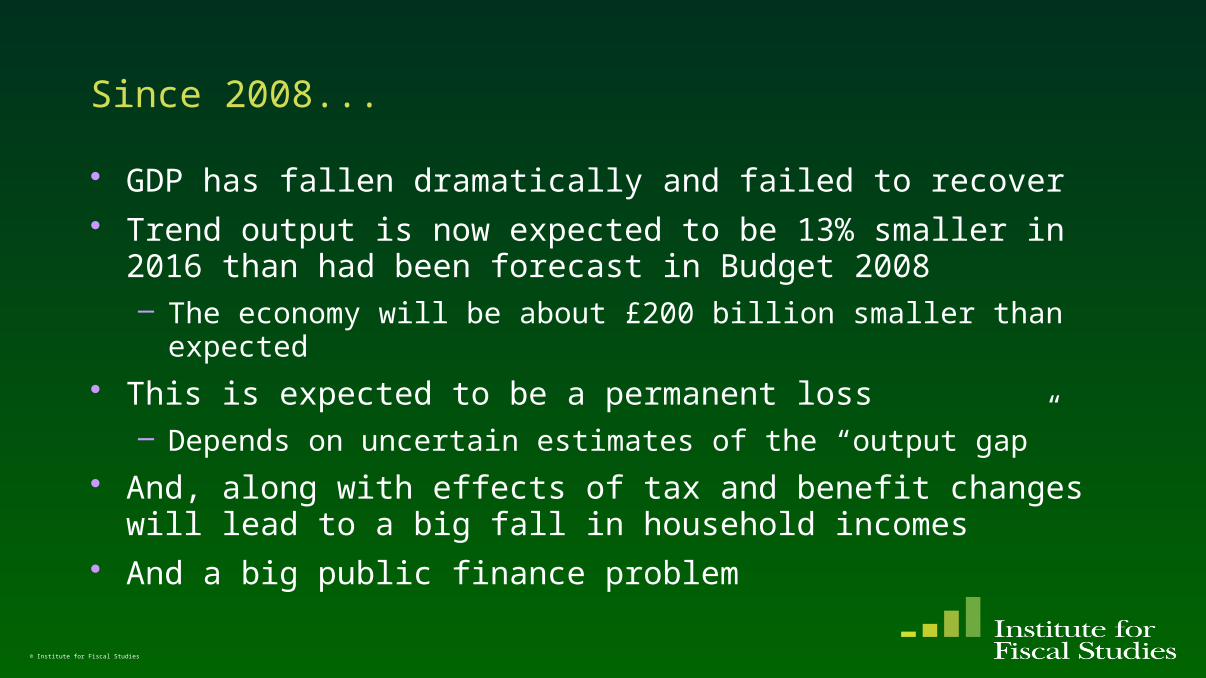
Since 2008...
• Following a long period of growth, GDP has fallen dramatically and failed to recover
© Institute for Fiscal Studies

GDP has nowhere near recovered pre-crisis levels
© Institute for Fiscal Studies
-4 -3 -2 -1 0 1 2 3 4 5 6 7 8 9
10
11
12
13
14
15
16
17
18
19
20
21
22
23
24
90
95
100
105
110
115
2007Q1–2014Q1
Quarters from peak
Peak
= 1
00
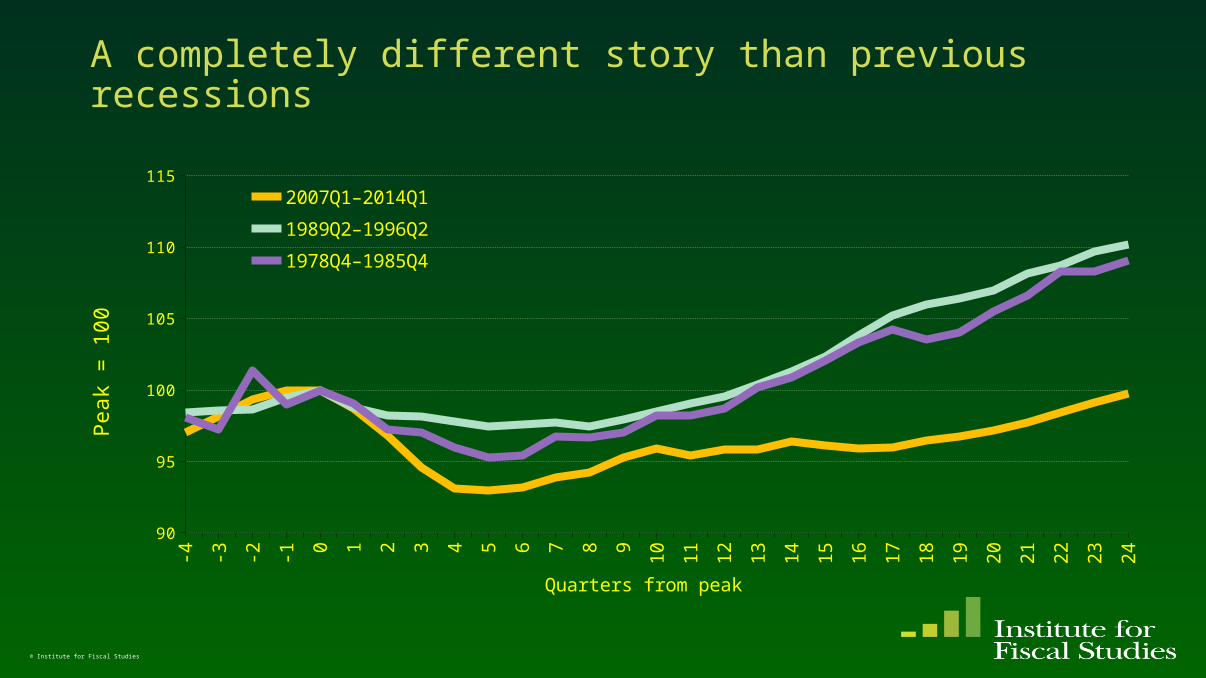
A completely different story than previous recessions
© Institute for Fiscal Studies
-4 -3 -2 -1 0 1 2 3 4 5 6 7 8 9
10
11
12
13
14
15
16
17
18
19
20
21
22
23
24
90
95
100
105
110
115
2007Q1–2014Q1
1989Q2–1996Q2
1978Q4–1985Q4
Quarters from peak
Peak
= 1
00
Since 2008...
• GDP has fallen dramatically and failed to recover• Trend output is now expected to be 13% smaller in 2016
than had been forecast in Budget 2008– The economy will be about £200 billion smaller than expected
• This is expected to be a permanent loss– Depends on uncertain estimates of the “output gap”
• And, along with effects of tax and benefit changes will lead to a big fall in household incomes
© Institute for Fiscal Studies
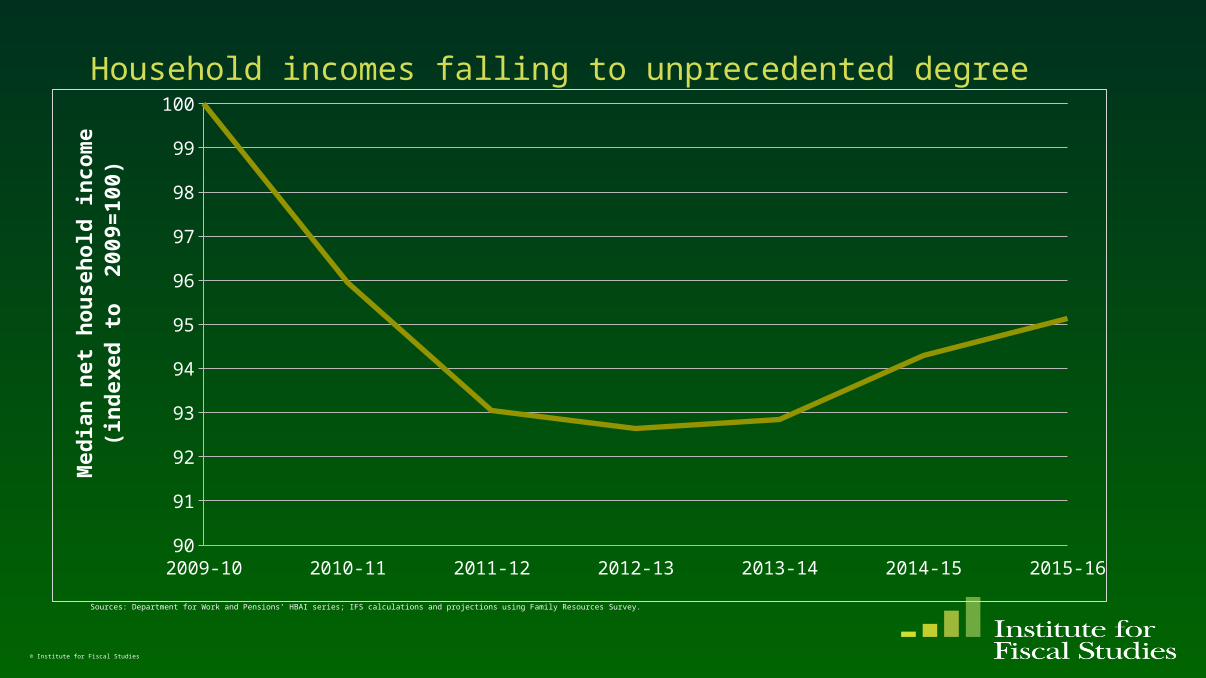
Household incomes falling to unprecedented degree
© Institute for Fiscal Studies
2009-10 2010-11 2011-12 2012-13 2013-14 2014-15 2015-1690
91
92
93
94
95
96
97
98
99
100M
ed
ian
net
hou
seh
old
in
com
e
(in
dexed
to 2
00
9=
10
0)
Sources: Department for Work and Pensions’ HBAI series; IFS calculations and projections using Family Resources Survey.
Since 2008...
• GDP has fallen dramatically and failed to recover• Trend output is now expected to be 13% smaller in 2016
than had been forecast in Budget 2008– The economy will be about £200 billion smaller than expected
• This is expected to be a permanent loss– Depends on uncertain estimates of the “output gap”
• And, along with effects of tax and benefit changes will lead to a big fall in household incomes
• And a big public finance problem
© Institute for Fiscal Studies
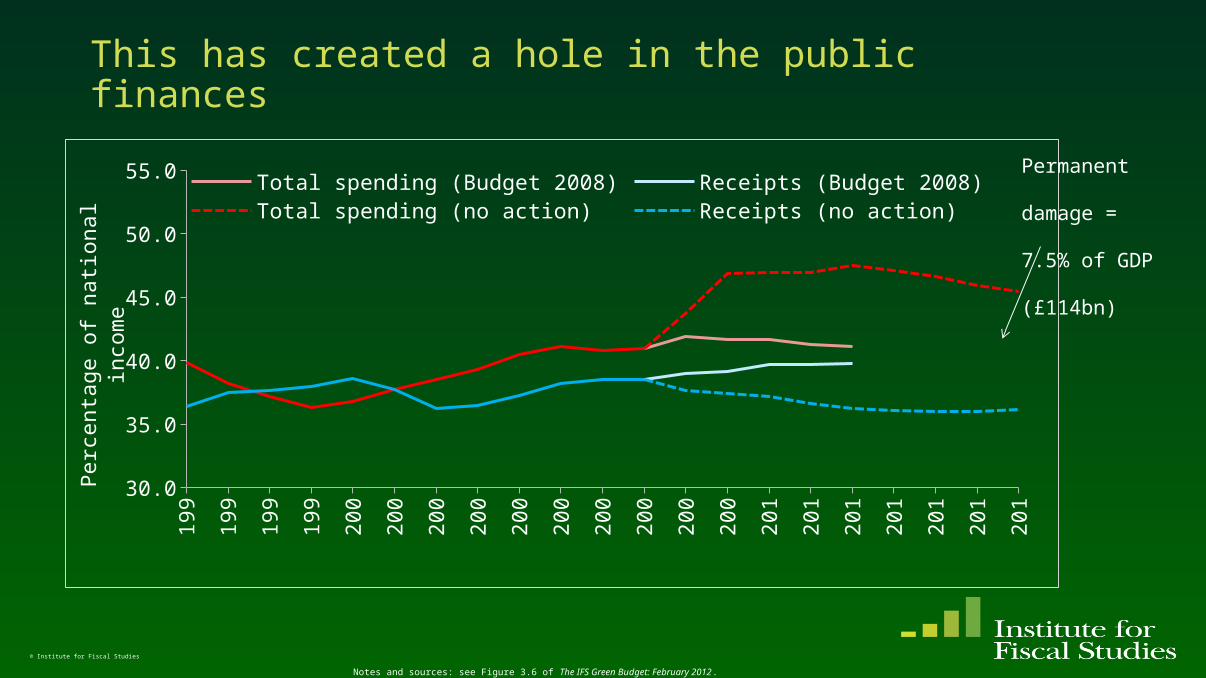
This has created a hole in the public finances
© Institute for Fiscal Studies
199
199
199
199
200
200
200
200
200
200
200
200
200
200
201
201
201
201
201
201
201
30.0
35.0
40.0
45.0
50.0
55.0 Total spending (Budget 2008) Receipts (Budget 2008)Total spending (no action) Receipts (no action)
Perc
enta
ge o
f nati
onal in
com
e
Permanent
damage =
7.5% of GDP
(£114bn)
Notes and sources: see Figure 3.6 of The IFS Green Budget: February 2012.
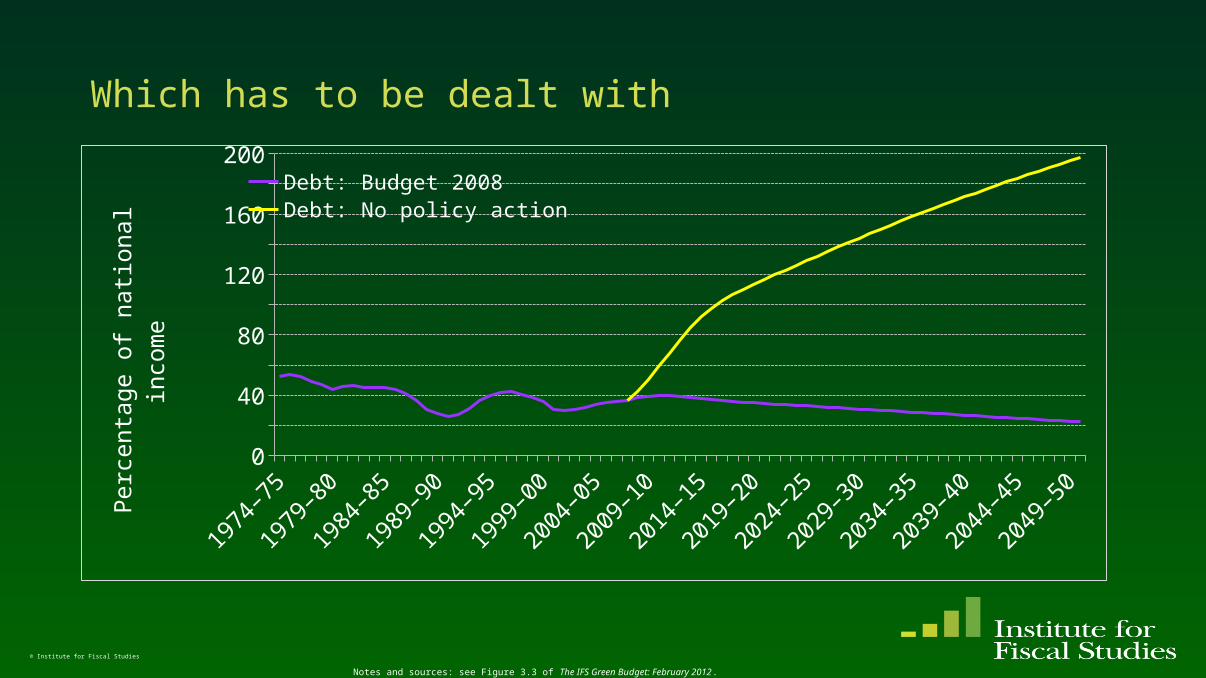
Which has to be dealt with
© Institute for Fiscal Studies
1974
–75
1978
–79
1982
–83
1986
–87
1990
–91
1994
–95
1998
–99
2002
–03
2006
–07
2010
–11
2014
–15
2018
–19
2022
–23
2026
–27
2030
–31
2034
–35
2038
–39
2042
–43
2046
–47
2050
–51
020406080
100120140160180200
Debt: Budget 2008Debt: No policy action
Perc
enta
ge o
f nati
onal
inco
me
Notes and sources: see Figure 3.3 of The IFS Green Budget: February 2012.
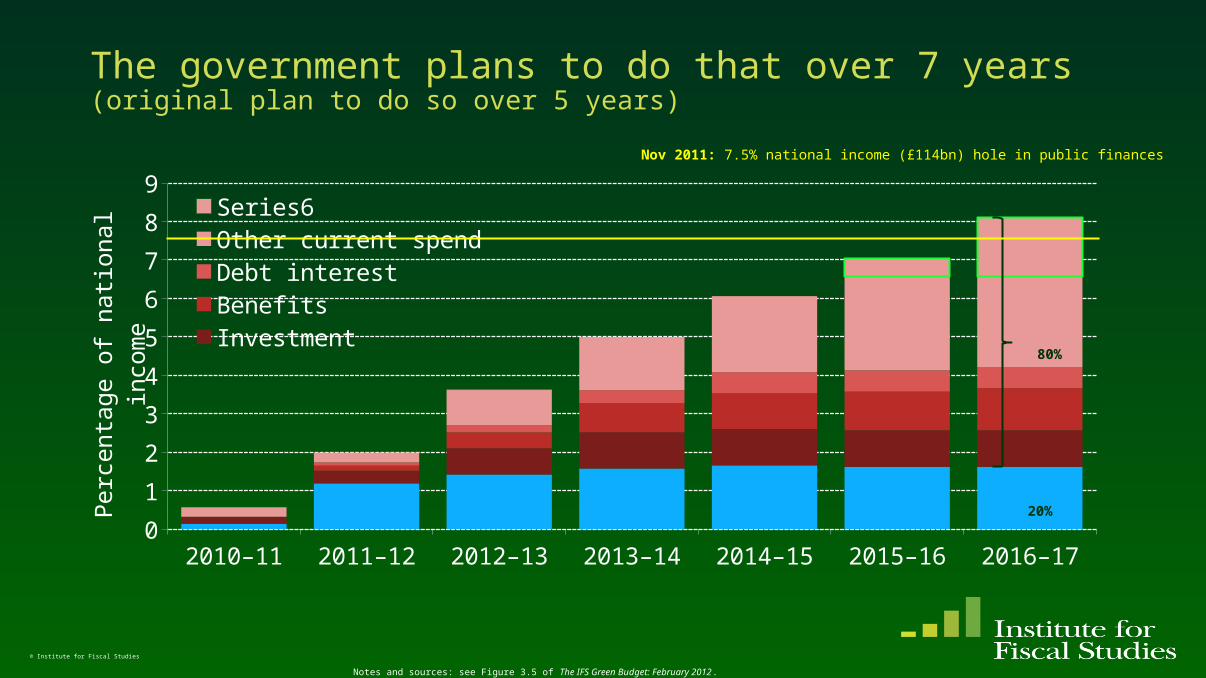
2010–11 2011–12 2012–13 2013–14 2014–15 2015–16 2016–170
1
2
3
4
5
6
7
8
9Series6Other current spendDebt interestBenefitsInvestment
Perc
enta
ge o
f nati
onal
inco
me
© Institute for Fiscal Studies
The government plans to do that over 7 years(original plan to do so over 5 years)
20%
80%
Notes and sources: see Figure 3.5 of The IFS Green Budget: February 2012.
Nov 2011: 7.5% national income (£114bn) hole in public finances
© Institute for Fiscal Studies
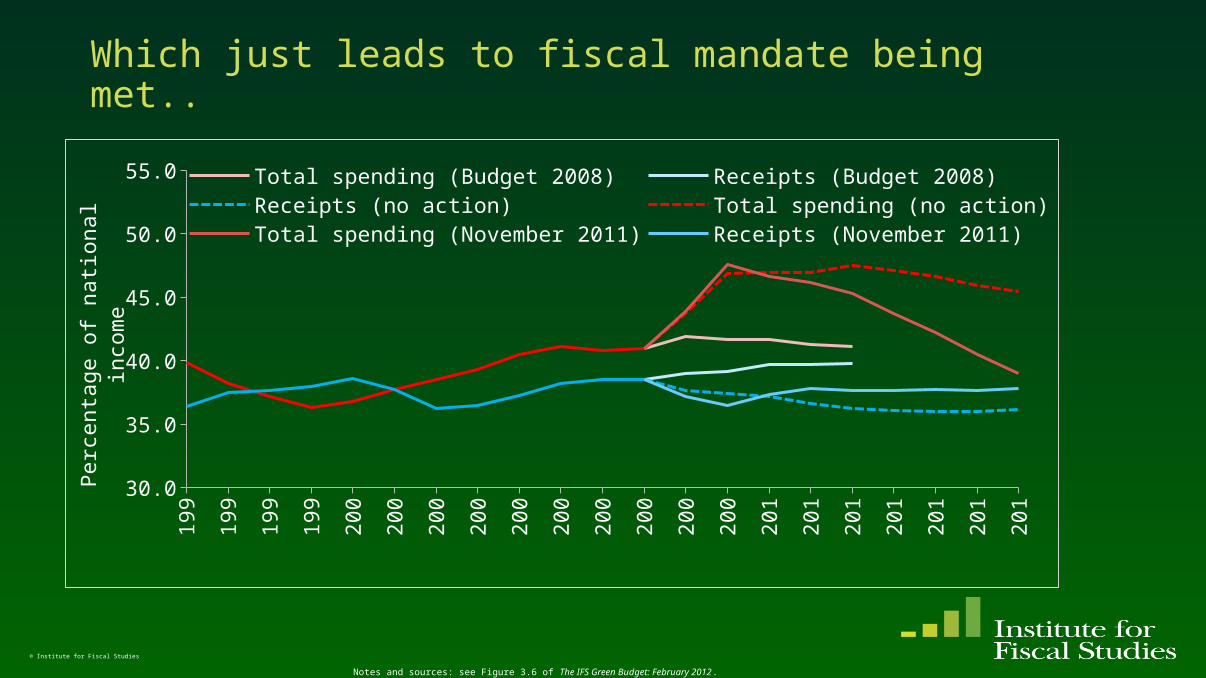
Which just leads to fiscal mandate being met..
199
199
199
199
200
200
200
200
200
200
200
200
200
200
201
201
201
201
201
201
201
30.0
35.0
40.0
45.0
50.0
55.0 Total spending (Budget 2008) Receipts (Budget 2008)Receipts (no action) Total spending (no action)Total spending (November 2011) Receipts (November 2011)
Perc
enta
ge o
f nati
onal in
com
e
Notes and sources: see Figure 3.6 of The IFS Green Budget: February 2012.
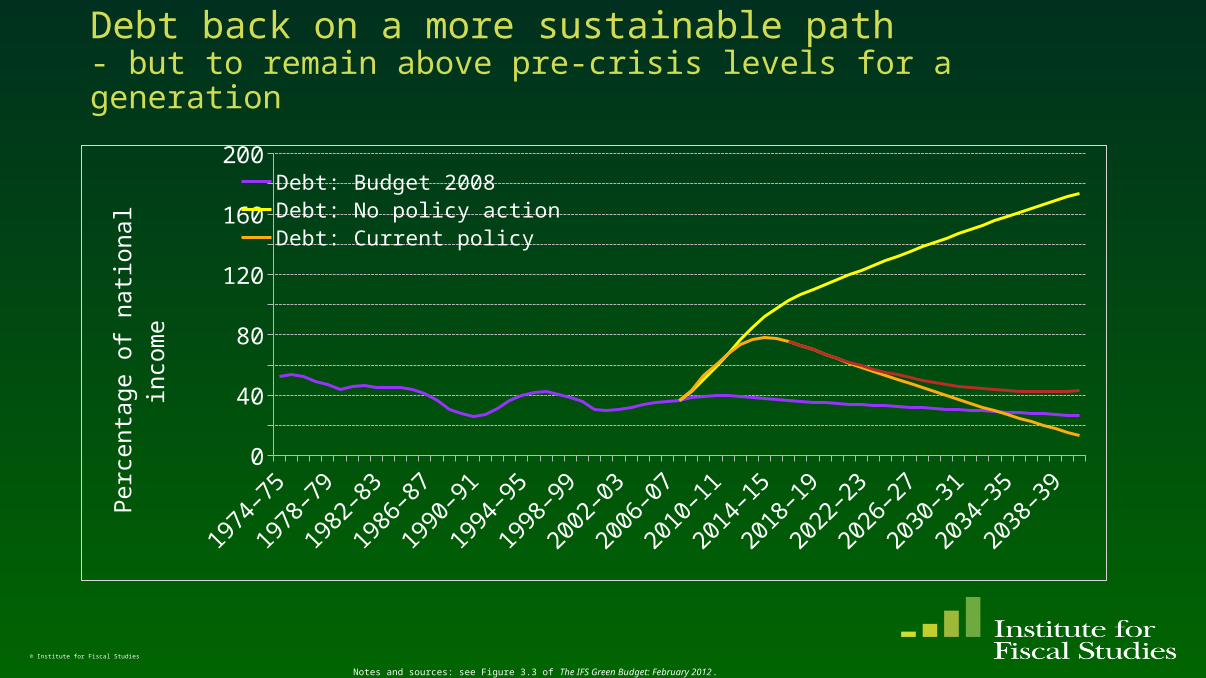
Debt back on a more sustainable path- but to remain above pre-crisis levels for a generation
© Institute for Fiscal Studies
1974
–75
1978
–79
1982
–83
1986
–87
1990
–91
1994
–95
1998
–99
2002
–03
2006
–07
2010
–11
2014
–15
2018
–19
2022
–23
2026
–27
2030
–31
2034
–35
2038
–39
020406080
100120140160180200
Debt: Budget 2008Debt: No policy actionDebt: Current policy
Perc
enta
ge o
f nati
onal
inco
me
Notes and sources: see Figure 3.3 of The IFS Green Budget: February 2012.
Risks to the public finances
• Macroeconomic forecasts might not prove accurate– Even if they did, revenues/spending might not turn out as forecast
• Government may yet be unable or unwilling to implement the planned spending cuts– Only 12% of the planned cut to public service spending (6% of the planned
cut to current public service spending) implemented by the end of 2011–12
• Nothing close to this scale of cuts has been attempted in the last 60 years
© Institute for Fiscal Studies
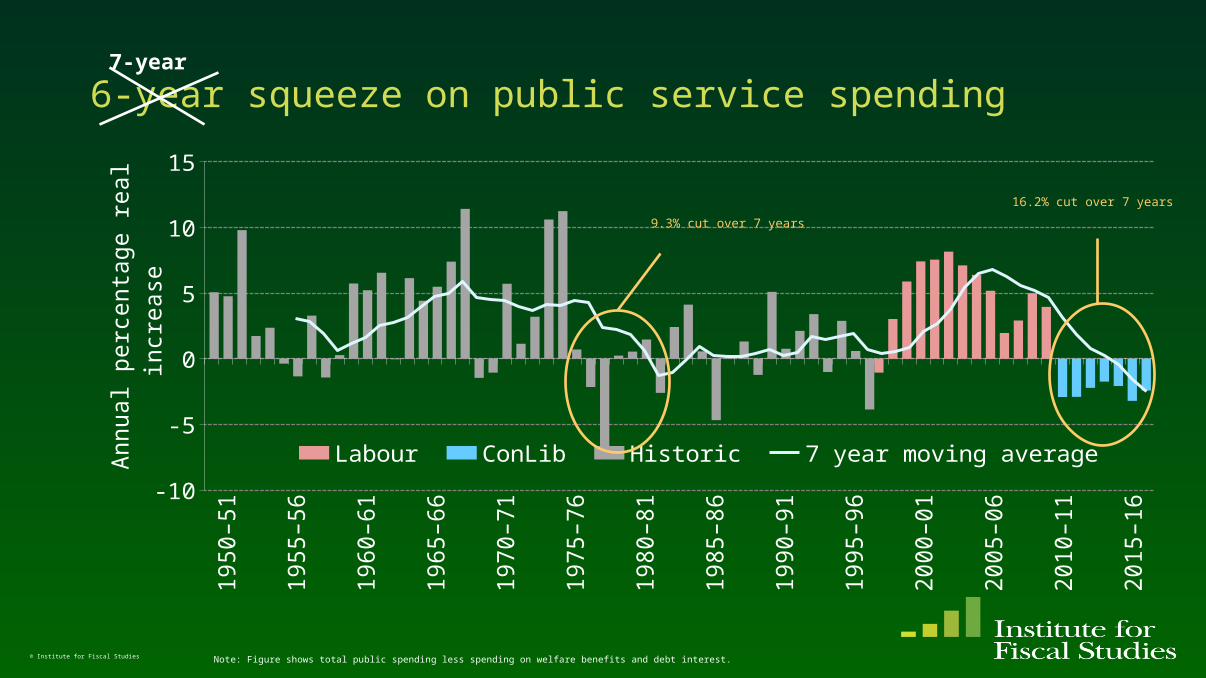
6-year squeeze on public service spending
© Institute for Fiscal Studies
1950–51
1955–56
1960–61
1965–66
1970–71
1975–76
1980–81
1985–86
1990–91
1995–96
2000–01
2005–06
2010–11
2015–16-10
-5
0
5
10
15
Labour ConLib Historic 7 year moving average
Annual p
erc
enta
ge r
eal i
ncr
ease
Note: Figure shows total public spending less spending on welfare benefits and debt interest.
9.3% cut over 7 years
16.2% cut over 7 years
7-year
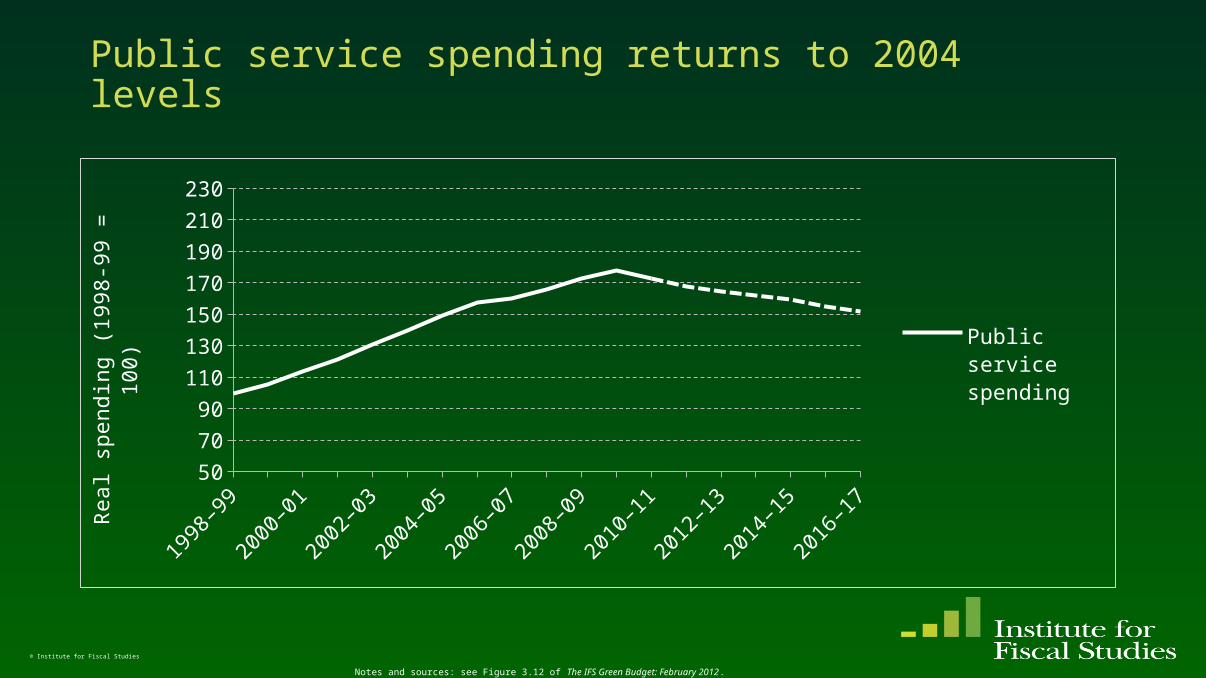
Public service spending returns to 2004 levels
© Institute for Fiscal Studies
1998
–99
1999
–00
2000
–01
2001
–02
2002
–03
2003
–04
2004
–05
2005
–06
2006
–07
2007
–08
2008
–09
2009
–10
2010
–11
2011
–12
2012
–13
2013
–14
2014
–15
2015
–16
2016
–17
50
70
90
110
130
150
170
190
210
230
Public service spending
Real sp
endin
g (
1998-9
9 =
100)
Notes and sources: see Figure 3.12 of The IFS Green Budget: February 2012.
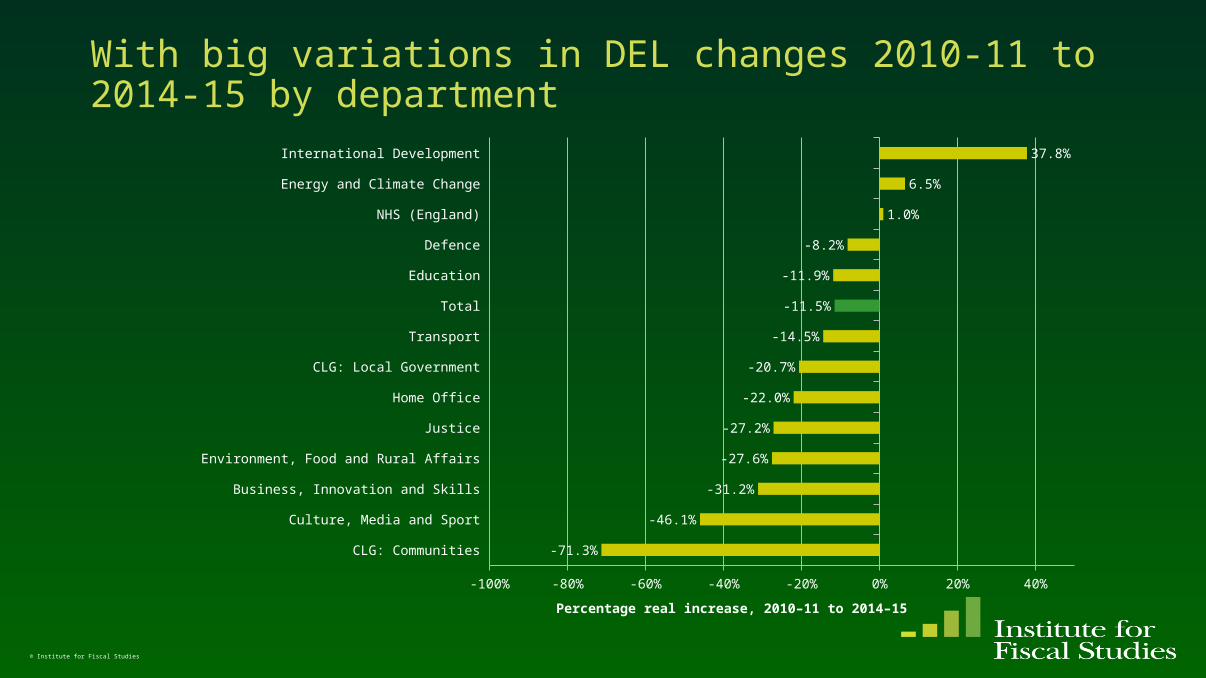
With big variations in DEL changes 2010-11 to 2014-15 by department
© Institute for Fiscal Studies
International Development
Energy and Climate Change
NHS (England)
Defence
Education
Total
Transport
CLG: Local Government
Home Office
Justice
Environment, Food and Rural Affairs
Business, Innovation and Skills
Culture, Media and Sport
CLG: Communities
-100% -80% -60% -40% -20% 0% 20% 40%
37.8%
6.5%
1.0%
-8.2%
-11.9%
-11.5%
-14.5%
-20.7%
-22.0%
-27.2%
-27.6%
-31.2%
-46.1%
-71.3%
Percentage real increase, 2010–11 to 2014–15
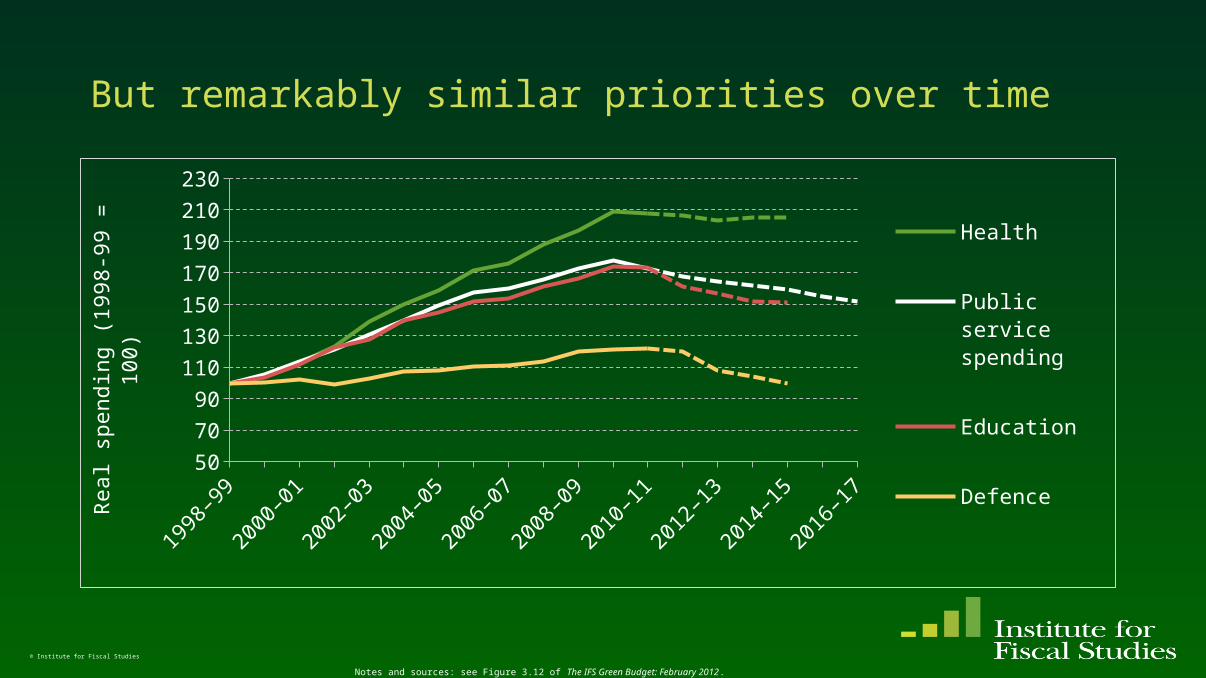
But remarkably similar priorities over time
© Institute for Fiscal Studies
1998
–99
1999
–00
2000
–01
2001
–02
2002
–03
2003
–04
2004
–05
2005
–06
2006
–07
2007
–08
2008
–09
2009
–10
2010
–11
2011
–12
2012
–13
2013
–14
2014
–15
2015
–16
2016
–17
50
70
90
110
130
150
170
190
210
230
Health
Public service spending
Education
Defence
Real sp
endin
g (
1998-9
9 =
100)
Notes and sources: see Figure 3.12 of The IFS Green Budget: February 2012.
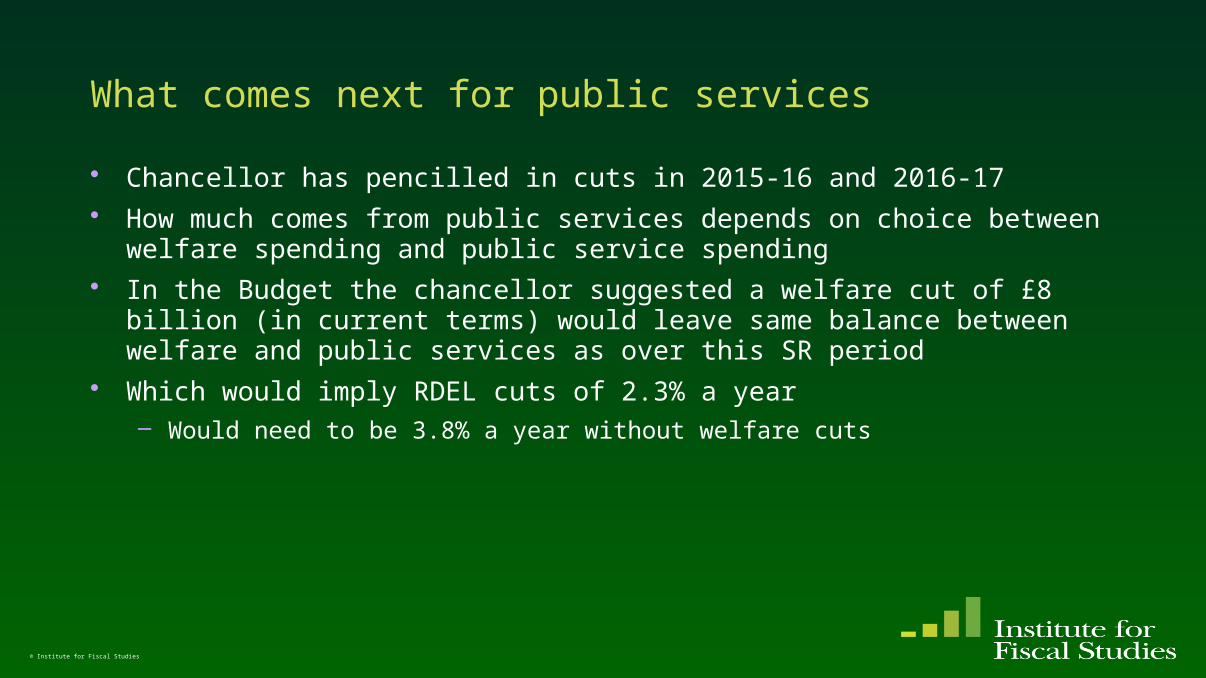
What comes next for public services
• Chancellor has pencilled in cuts in 2015-16 and 2016-17• How much comes from public services depends on choice between
welfare spending and public service spending• In the Budget the chancellor suggested a welfare cut of £8 billion (in
current terms) would leave same balance between welfare and public services as over this SR period
• Which would imply RDEL cuts of 2.3% a year – Would need to be 3.8% a year without welfare cuts
© Institute for Fiscal Studies
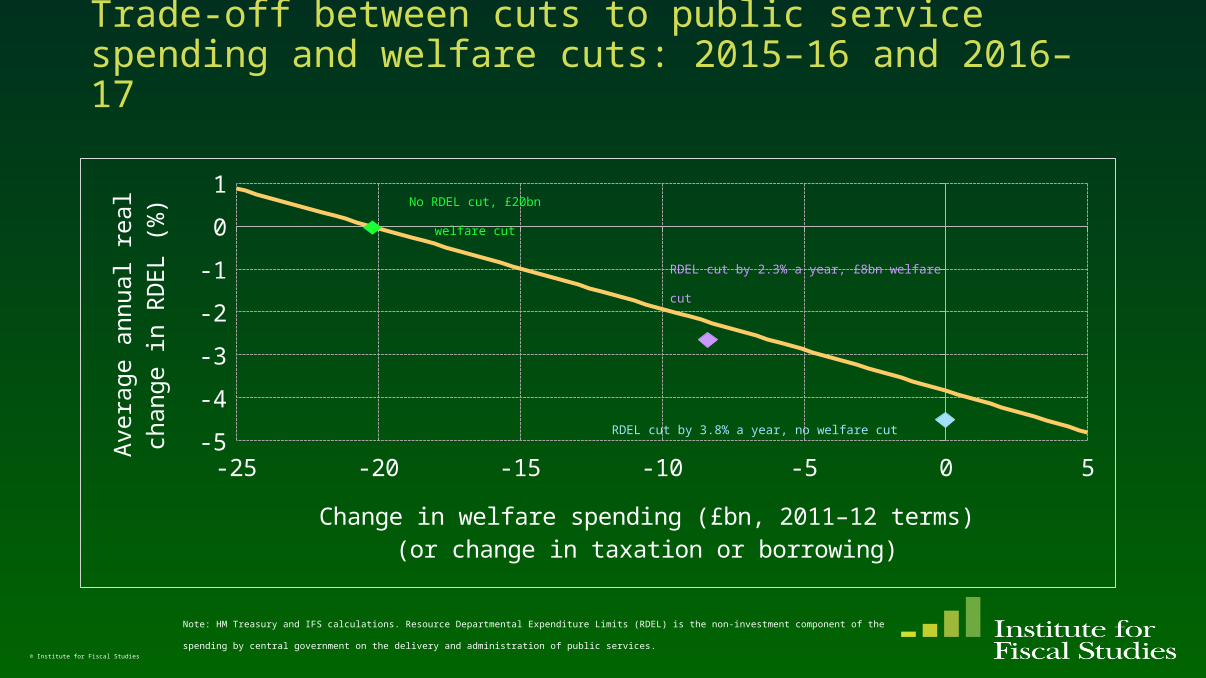
Trade-off between cuts to public service spending and welfare cuts: 2015–16 and 2016–17
-25 -20 -15 -10 -5 0 5-5
-4
-3
-2
-1
0
1
Change in welfare spending (£bn, 2011–12 terms)(or change in taxation or borrowing)
Avera
ge a
nnual re
al
change in R
DEL
(%)
© Institute for Fiscal Studies
Note: HM Treasury and IFS calculations. Resource Departmental Expenditure Limits (RDEL) is the non-investment component of the spending by central
government on the delivery and administration of public services.
RDEL cut by 2.3% a year, £8bn welfare cut
RDEL cut by 3.8% a year, no welfare cut
No RDEL cut, £20bn welfare
cut

What comes next for public services
• Chancellor has pencilled in cuts in 2015-16 and 2016-17• How much comes from public services depends on choice between
welfare spending and public service spending• In the Budget the chancellor suggested a welfare cut of £8 billion (in
current terms) would leave same balance between welfare and public services as over this SR period
• Which would imply RDEL cuts of 2.3% a year – Would need to be 3.8% a year without welfare cuts
• With no welfare cuts and health still protected (no real cuts) rest of public service spending would need to fall even faster
© Institute for Fiscal Studies
Summary
• The loss of output following the crisis has been deep and prolonged• With a consequent reduction in household incomes and dramatic
worsening of the public finances• Government’s fiscal consolidation is most dramatic in 60 years
– But still leaves debt above pre-crisis levels for a generation or more
• Though a remarkable consistency of priorities across time• Cuts pencilled in for 2015-16 and 2016-17 look painful• The new fiscal framework, especially the independent OBR, looks more
robust than what went before• But there remain risks to deliverability
– And the short term problems shouldn’t lead to us ignoring long term pressures
© Institute for Fiscal Studies