the impact of monetary policy on stock market performance
TRANSCRIPT

See discussions, stats, and author profiles for this publication at: https://www.researchgate.net/publication/318308256
The impact of monetary policy on stock market performance: Evidence from
twelve (12) African countries
Article in Research in International Business and Finance · July 2017
DOI: 10.1016/j.ribaf.2017.07.075
CITATIONS
0READS
581
3 authors:
Some of the authors of this publication are also working on these related projects:
Economic growth and Stock market Developments; Evidence from Africa View project
Capital makrket Developkments and its potential benefits to the African Continent View project
Suhaibu Iddrisu
University for Development Studies
2 PUBLICATIONS 0 CITATIONS
SEE PROFILE
Simon Kwadzogah Harvey
Bank of Ghana
25 PUBLICATIONS 198 CITATIONS
SEE PROFILE
Mohammed Amidu
University of Ghana
54 PUBLICATIONS 485 CITATIONS
SEE PROFILE
All content following this page was uploaded by Suhaibu Iddrisu on 19 November 2017.
The user has requested enhancement of the downloaded file.

Accepted Manuscript
Title: THE IMPACT OF MONETARY POLICY ON STOCKMARKET PERFORMANCE: EVIDENCE FROM TWELVE(12) AFRICAN COUNTRIES
Authors: Suhaibu Iddrisu, Simon K. Harvey, MohammedAmidu
PII: S0275-5319(16)30479-2DOI: http://dx.doi.org/doi:10.1016/j.ribaf.2017.07.075Reference: RIBAF 765
To appear in: Research in International Business and Finance
Received date: 18-12-2016Accepted date: 3-7-2017
Please cite this article as: Iddrisu, Suhaibu, Harvey, Simon K., Amidu, Mohammed,THE IMPACT OF MONETARY POLICY ON STOCK MARKET PERFORMANCE:EVIDENCE FROM TWELVE (12) AFRICAN COUNTRIES.Research in InternationalBusiness and Finance http://dx.doi.org/10.1016/j.ribaf.2017.07.075
This is a PDF file of an unedited manuscript that has been accepted for publication.As a service to our customers we are providing this early version of the manuscript.The manuscript will undergo copyediting, typesetting, and review of the resulting proofbefore it is published in its final form. Please note that during the production processerrors may be discovered which could affect the content, and all legal disclaimers thatapply to the journal pertain.

THE IMPACT OF MONETARY POLICY ON STOCK MARKET PERFORMANCE:
EVIDENCE FROM TWELVE (12) AFRICAN COUNTRIES
Suhaibu Iddrisu a,
University for Development Studies
P.O. Box 24, Navrongo Campus, Ghana, Email: [email protected]
Simon K. Harvey b, *
University of Ghana Business School, UGBS
P.O. Box LG 78, Accra, Email: [email protected]
Mohammed Amidu c, *
University of Ghana Business School, UGBS
P.O. Box LG 78, Accra, Email: [email protected]
NB: The corresponding author: SUHAIBU IDDRISU is a financial mathematics lecturer at the University for
Development Studies, Navrongo Campus, Navrongo; Ghana West Africa.
Abstract
This work takes a comprehensive look at the monetary policy and stock market dynamics from the African
perspective, using five indicators namely; S&P global equity indices, inflation rate, money and quasi growth
(M2), real interest rate and GDP growth in a panel VAR model. The panel VAR approach addresses the
endogeneity problem by allowing the endogenous interaction between the variables in the system of equations.
The study models the dynamic relationship in the system of panel VAR equations with data from 1979:2013,
performing cross-sectional dependence, unit-root and cointegration tests, and thus estimated the
contemporaneous regression model. The study established that, the stock markets of the 12 African countries
are positively affected contemporaneously by their respective monetary policies through the interest rate
channel, but could not find evidence to the reverse reaction.

The study then estimated impulse response functions and thus established that both money supply and real
interest rate decline in response to positive and negative stock market shocks respectively, whiles inflation
responds positively to a negative stock market shock. Using the forecast error variance decompositions (fevds),
we establish that between the two monetary policy stances considered (money supply and real interest rate), real
interest rate has the greatest influence on the stock market and inflation. Conversely, the stock market turns to
exert greater influence on real interest rate than it does on money supply, therefore indicating a reverse
relationship between monetary policy and the stock market. Similar reverse relationships among the other
variables have been observed. This in the estimation of the researchers is enough evidence to conclude that
there is a bidirectional relationship between monetary policy and stock market performance.
In conclusion, our results confirm the economic theories and empirics that there are complicated and significant
relationships between monetary policy and stock market performance and that the relationship is bidirectional.
JEL classification
Keywords: Monetary policy; Stock Market; Endogeneity; Panel VAR; Impulse Response Functions (IRF); and Forecast Error Variance Decomposition (FEVD).
1 INTRODUCTION Economies all over the world operate monetary policy with the main objective to create stable macroeconomic
environment for economic prosperity. The achievement of this objective depends on whether or not monetary
policy actions permeate the real sector of the economy (Laopodis 2013). Channels through which monetary
policy permeates the real sector of the economy are the debt instruments (i.e interest rate) or asserts prices
particularly stock prices (Mishkin, 2001). Laopodis (2013) found that monetary actions can propagate the real
sector if they are properly transmitted into the macro-economy through the various channels; notably interest
rate channel, consumption channel, and wealth effect channel.
Most African countries have been plagued with economic challenges over the years, in the face of many, and
frequent changes in monetary and other macro-economic policies, raising the question whether monetary policy
is making the desired economic impact. Views on whether monetary policy is making economic impact are
many and varied. The monetarists strongly believe that monetary policy exact greater impact on economic
activity arguing that unanticipated change in the stock of money affects output and growth i.e. the stock of
money must increase unexpectedly for central bank to promote economic growth (Adeolu et al, 2012). Patelis,
(1997) argues that if monetary policy has real economic impact, then shifts in monetary conditions should affect
stock prices, since equities are claims on future economic output. Alan Greenspan (US Fed Chairman: August,
1987- Dec. 2005) addressing the Fund’s Open Market Committee (FOMC) after increasing the Fed Funds rate,
advised that Central Bankers should put an eye on the stock market behavior as it reflects the macroeconomic
conditions of an economy (Laopodis, 2013).
Empirical evidence supports the position that monetary policy actions affect the real sector of the economy
(Ioannidis & kontonikas, 2007). Ioannidis & kontonikas, (2007) found that monetary policy actions affect stock
prices, which are linked to the real economy through their influence on consumption and investment spending.
This finding is in line with both Modigliani’s life cycle model and the Tobin q’s Model. Modigliani’s life cycle
model posits a direct relationship between the lifetime resources of consumers and stock prices, and Tobin q’s
Model, posits a direct relationship between investment spending and stock prices (Miskin, 2001). Laopodis et
al, (2013) discovered that monetary policy affects the real economy through financial markets, in other words
financial markets are the connecting links in the transmission mechanism of monetary policy actions to the real
economy. The finding of Chami et al. (1999) that modern day process for transmitting the effect of monetary
policy shifts is primarily through asset prices adjustment rather than through the traditional money and credit
channel does not only corroborates this evidence but also suggest that the stock market could be an alternate
channel for monetary policy transmission.
There is a reasonable body of contrasting literature explaining the monetary policy and stock market dynamics.
Laopodis (2013), discovered that an increase in money supply leads to an increase in stock prices, which in
turn, stimulates the stock market and the economy at large, and given that, stock prices are determined by
expected dividends and interest rates, any surprises in monetary policy are likely to influence stock prices. This
however, is in sharp contrast with Friedman (1956) position that increase in money supply might not
necessarily imply an increase in stock prices, as the disequilibrium in the money market may be offset by
conditions in the real sector.
Despite the apparent interaction between monetary policy and stock market in literature, the existence of a
single consistent empirical framework that describes the nature of the relationship across different economies
and different monetary regimes remains an issue (Laopodis, 2013). Laopodis, (2013) examined the dynamic
linkages between US monetary policy and its stock market during the three distinct monetary regimes of Arthur
Burns (1970–1978), Paul Volcker (1979–1987) and Alan Greenspan (1987-2005), and found no consistent
dynamic relationship between the two magnitudes. Thorbecke, (1997) studied stock market returns and
monetary policy in US, and found a strong positive relationship between expansionary monetary policy and
stock market returns. Rigobon & Sack (2003) studied the impact of monetary policy on asset prices, and Sousa
(2010) studied housing wealth, financial wealth, money demand and policy rule in Europe, both found evidence
of a negative relationship between contractionary monetary policy and stock market performance. Cooper,
(1974) studied the efficient capital markets and the quantity theory of money and Rozeff, (1974) studied money
and stock prices, both found no interaction between the two magnitudes. Hayford & Malliaris, (2004) studied
monetary policy and the US stock market, and found a weak relationship between monetary policy and the
stock market. Indeed, the empirical evidence as to what the exact nature and strength of the relationship
between the two magnitudes is; is unclear, and the results of several studies, some of which have been outlined,
has not helped particularly in measuring the extent to which a change in one magnitude can affect the other.
To fill this void, the current study undertakes a cross-country analysis of the bidirectional link between
monetary policy and stock market performance within the context of monetary and macroeconomic variables in
Africa, and therefore seeks to answer the questions: 1. is there contemporaneous relationship between the stock
market performance and monetary policy variables? 2. Does monetary policy respond to changes in stock
market performance? 3. What is the effect of changes in monetary policy variables on the stock market
performance?
The rest of the paper is organized as follows: Section 2 reviews and discusses salient literature. Section 3,
presents the methodology, section 4 discusses the data set and results, and Section 5 concludes.
2 LITERATURE REVIEW Stock market developments facilitate and promote efficient resource mobilization and allocation to the various
sectors of the economy; thereby promoting economic growth and development by increasing the quantity and
quality of investment (Errunza, 2001). Recent literature suggests that the stock market because of its tendency
to affect the various sectors of an economy is an alternative channel for the transmission mechanism of
monetary policy actions (Chatziantonious et al. 2013). In a multi-country study of Stock market response to
monetary and fiscal policy shocks in Germany, UK and US, Chatziantonious et al. (2013) reports that while
innovations in monetary policy instruments greatly affect stock market performance, stock prices largely reflect
economic developments. In that regard, stock market performance not only responds to monetary policy
decisions, but also provides feedback to central banks regarding the private sector's expectations about the
future course of key macroeconomic variables. Other studies support this notion (Bernanke & Gertler, 2000;
Bjornland & Leitemo, 2009). Bernanke & Gertler, (2000) examined the impact of monetary policy on asset
price volatility on the US economy, and found evidence that asset prices could constitute a source of turmoil
and trigger the Central Bank's response to stock market performance.

On the other hand, Rigobon & Sack, (2001) studied the topic “measuring the reaction of monetary policy to the
stock market” in the US, and found that monetary policy reacts significantly to stock market movements.
Ioannidis & Kontonikas, (2007), investigated the impact of monetary policy on stock returns in 13 OECD
countries over the period 1972–2002, and found that monetary policy shifts significantly affect stock returns.
Other studies support the hypotheses that past money supply data could be use to predict stock returns (Homa &
Jaffee, 1971; Hamburger & Kochin 1972). Subsequent studies, however, rejected these findings and showed
that past money changes had no predictive power on stock returns (Rozeff, 1974; Rogalski & Vinso, 1977). In
contrast, Friedman (1988) found proof that the real quantity of money demanded is positively related to the real
price of equities with a three-quarter lag and negatively related to the contemporaneous real stock price.
Despite the empirical evidence to the interdependence between monetary policy and stock markets, very few
studies have considered the two directions of the relationship in tandem (Laopodis, 2013). However,
considering either of the directions separately may not capture the full dynamics of the relationship. To obtain a
better estimate, there is the need to consider both directions of the relationship in tandem.
A comprehensive strand of literature shows that inflation is not only a monetary phenomenon and thus reflects
what happens to the quantity of money per unit of output, but also influences the stock market (Fama &
Schwert, 1977), and therefore plays an important role in the monetary policy-stock market nexus. Nelson
(1976) found that inflation and stock prices are inversely related; a finding supported by; Fama (1981), Gertler
& Grinols (1982), amongst others. However, this finding is contrary to a priori expectations by the Fisher
hypothesis of a one-to-one increasing relationship between stock returns and inflation. These contrasting ideas
led to the emergence of several hypotheses, to explain the negative relationship between stock returns and
inflation.
First: the tax-effect hypothesis of Feldstein & Horioka (1980) explains that inflation lowers stock market
returns because the tax assessment of depreciation and inventory valuation are done in a non-neutral manner,
thereby causing inflation to introduce corporate tax liability and reduce real after-tax earnings, thus reducing
stock returns.. Second: the proxy effect hypothesis, of Fama (1981) posits a negative relationship between stock
returns and inflation, since real activity is correlated positively with stock returns, but negatively with inflation
through the money demand effect. Fama’s explanation for the inverse relationship between expected economic
activity and current inflation follows two main assumptions: 1. that individuals are “rational” in the sense of
making use of all available current information relevant to their monetary and financial decisions, and 2. that
individuals’ current demand for money is related to future real economic activity and current interest rates.
Assuming that money supply, real economic activity, and interest rates are exogenous, the demand for money
will become a means for the transmission of expected future inflation to current inflation. On reverse causality
hypothesis; Geske & Roll (1983), argue that the reaction of stock markets to future economic activity is
correlated with government revenue. In the event of a budget deficit and a decline of real activity, there is
increased domestic borrowing or increased supply of money through the central bank to balance the budget.
The increase in domestic borrowing or issuance of money has inflationary effects that dampen real activity. In
the end, stock market returns also fall due to a fall in real activity and the inflationary effect; hence the negative
relationship between stock market returns and inflation.
A large body of empirics shows that macroeconomic variables affect stock market developments. In Asia,
Ibrahim, (2003) studied the long run relationship and dynamic interactions between Malaysian Stock Market,
various economic variables, and major equity markets in the United States and Japan. He found that the
Malaysian stock price index relates positively with money supply, consumer price index, and industrial
production, and negatively with the movement of exchange rates. Mukherjee & Naka, (1995) studied the
relationship between stock prices and several macroeconomic variables in Tokyo, using exchange rate, money
supply, industrial production index, inflation and interest rates, using data from 1971–1990 in a Vector Error
Correction Model. They found a positive relationship for all other variables except for inflation and interest
rates, which were observed to exhibit a mixed relationship. Further, Tsoukalas, (2003) studied the relationship
between stock prices and macroeconomic factors: exchange rate, industrial production, money supply and
consumer price index, in Cyprus using Vector Autoregressive model, and found a strong relationship between
stock prices and all the macroeconomic factors. Zafar, (2013) studied the impact of macroeconomic factors on
stock market performance in Pakistan, and found among other things a negative relationship between real
interest rate and stock market performance.
In Africa, Coleman & Agyire-Tettey, (2008) explored the impact of macroeconomic variables: inflation,
exchange rate, lending rate, and Treasury bill rate on the performance of Ghana Stock Exchange using quarterly
time series data from 1991:1- 2005:4 in an error correction model. They found that lending rates from deposit
money banks have an adverse effect on stock market performance and particularly serve as major hindrance to
business growth. The study again established that, inflation rate has a negative effect on stock market
performance, but it takes time for this to take effect due to the presence of a lag period; and that investors
benefit from exchange-rate losses as a result of domestic currency depreciation. In a related study Sunday,
(2013) studied the impact of monetary policy on Nigerian economy, using time series data from 1970–2010 in a
vector error correction model. He found a long-run equilibrium relationship between monetary policy
instruments and economic growth in Nigeria and that interest rate and inflation rate were negatively correlated
with gross domestic product (GDP). Most of the studies have not only been single country based, with different
regulatory frameworks and monetary policy targets, but have focused on only one direction of the two-way
relationship, and also neglected some of the macroeconomic variables which could otherwise have significant
impact on the relationship of interest. Therefore, an inclusion of more macroeconomic variables like money
supply and GDP, in a panel VAR study of African countries, will not only produce results that are more
reliable, but will add to literature an interdependent empirical framework that possibly could capture the full
dynamics of the bidirectional relationship between monetary policy and stock market.
A good number of theories explain the transmission mechanism of monetary policy – stock market nexus,
including Tobin’s q Model, Modigliani’s life cycle model, Quantity Theory of Money among others. According
to the Tobin’s q Model, defined as the market value of firms divided by the replacement cost of capital; if q is
high, the market price of firms is high relative to the replacement cost of capital, and new plant and equipment
capital is cheap relative to the market value of firms. Companies can then issue stocks and get a high price for it
relative to the cost of the facilities and equipment they buy. Investment spending will rise because firms can
now buy many new investment goods with only a small issue of stocks. The crux of Tobin’s q model is that
there exist a link between stock prices and investment spending. In expansionary monetary policy lower interest
rates make bonds less attractive relative to stocks and results in increased demand for stocks that bids up their
prices. This coupled with the fact that higher stock prices will lead to higher investment spending leading to the
following transmission mechanism of monetary policy.
i.e 𝑀 ↑=> 𝑃𝑠 ↑=> 𝑞 ↑=> 𝐼 ↑=> 𝑌 ↑ ……………………………………(1)
Where 𝑀 ↑ indicates expansionary monetary policy, leading to a rise in stock prices 𝑃𝑠 ↑, Which raises q (𝑞 ↑), and increase investment 𝐼 ↑, thereby leading to an increase in aggregate demand and a rise in output.
Conversely, by recognizing that firms can also finance investment by issuing equities other than bonds; equity
financing becomes cheaper when stock prices rise because each share issued produce more funds. Thus, a rise
in stock prices leads to increase in investment spending. Therefore an alternative description of this mechanism
is that expansionary monetary policy (𝑀 ↑) which raises stock prices (𝑃𝑠 ↑) lowers the cost of capital (𝑐 ↓) and
so causes investment and output to rise (𝐼 ↑, 𝑌 ↑). i.e𝑀 ↑=> 𝑃𝑠 ↑=> 𝑐 ↓=> 𝐼 ↑=> 𝑌 ↑ ……………………………………(2)
According to Modigliani’s life cycle model, the lifetime resources of consumers determine their consumption.
Financial wealth, of which common stock is a major component, is an important part of consumer’s lifetime
resources. Therefore, expansionary monetary policy, which raises stock prices, raises the value of household
wealth, thereby increasing the lifetime resources of consumers, causing consumption to rise. This leads to the
following transmission mechanism of monetary policy.
𝑀 ↑=> 𝑃𝑠 ↑=> 𝐶 ↑=> 𝑌 ↑ …………………………………………….(3)
Hence through consumption and investment spending stock markets can transmit monetary policy actions into
the economy and therefore can serve as an alternative channel in the monetary policy transmission mechanism,
but the question of whether that’s is true for Africa’s emerging and relatively underdeveloped exchanges;
operating different monetary regulatory frameworks, remain unresolved and needs further examination. The
main objective of this study is to examine the bidirectional interaction between monetary policy and stock
market, and to further determine whether the stock market can act as an alternate monetary policy transmission
Channel within the context of Africa.

3 METHODOLOGY To examine the relationship of interest, the study employed data from 1997 to 2013 on the variables: S&P
global equity indices, Real interest rate, Money and quasi; money growth, GDP growth rate and inflation rate;
from world development indicators-world Bank data site. The data is drawn on Ghana, South Africa, Namibia,
Nigeria, Morocco, Mauritius; Kenya, Egypt, Botswana, Ivory coast, Zambia and Zimbabwe.
3.1 Variable Measurement/Justification
S&P global equity index is an aggregate measure of the performance of stocks in a particular stock market
relative to global stock market index. The New-Keynesian theory argues that, asset prices are determined in a
forward-looking manner, reflecting the expected future discounted sum of return on assets. Changes in asset
prices can then be due to changes in the expected future dividends, the expected future interest rate or changes
in the stock return premium. If monopolistic competition and mark-up pricing dominate the goods market,
profits will at least, in the short-run be affected by all factors that influence aggregate demand (Bjornland &
Leitemo, 2009). Monetary policy is therefore likely to influence stock prices through the interest rate channel,
and indirectly through its influence on the determinants of dividends and the stock return premium by
influencing the degree of uncertainty agents face.
We employed two monetary policy stances: money supply and real interest rate. Money supply is a measure of
the amount of money in circulation and therefore determines the level of liquidity in the economy. Increased
money supply due to lower interest rates attracts investors away from the stock market; making the stock
market unattractive (Chatziantoniou et al, 2013), and this according to Coleman & Agyire-Tettey, (2008) results
in lower stock demands and consequently lower volumes and values of stocks traded. Thus, money supply and
stock returns are expected to be negatively related. Real interest rate is a measure of the cost of capital in an
economy. The marginal efficiency of capital function posits an inverse relationship between real interest rate
and the present value of capital and consumer durable goods. Thus, a reduction in the real interest rate will
cause an increase in the present value of capital and durable consumer goods and increase the ratio of the
market value to asset value (Mbutor, 2007).
GDP growth and inflation can have significant influence on the monetary policy-stock market nexus and thus
are used as control variables in this study. GDP growth rate is the rate at which the overall level of economic
activities in an economy changes with time. A high economic activity in a country results in higher incomes,
which leads to higher investments and thus an increase in stock returns (Mishkin, 2001). Inflation on the other
hand is the rate at which the overall prices of goods and services change in an economy. High rates of inflation
increases the cost of living and a shift of resources from stock market instruments to consumables, leading to a
reduction in the demand for stock market instruments, which tends to reduce the volume of trading and thus
value of traded stocks with no price increase (Mishkin, 2001). Market capitalization, which is the product of the
share price and the total number of outstanding shares, may therefore fall as the demand for shares falls due to
the substitution process.
3.2 Estimation Strategy
This study adapts a panel VAR framework in analyzing the relationship of interest, with the variables
mentioned above. GDP and inflation are incorporated into the model to help capture the full dynamics of
monetary policy impulse mechanisms.
The study focuses on a number of countries therefore the model has both structural and panel VAR features.
The structural representation of the general PVAR model is:
𝑴𝟎𝒚𝒊𝒕 =
P
j
jtj yM1
+ 𝝁𝒊𝒕…………………….………………………….4
𝑴𝒐= 5 5 contemporaneous matrix of coefficients.
𝑦𝑖𝑡 = 5 × 1 vector of endogenous variables, i.e. 𝑦𝑖𝑡=[GDPGit, IRit, GMSit, RIRit, SMIit]. Mj = 5× 5
autoregressive coefficient matrices for the jth lag, 𝒚𝒊𝒕−𝒋= 5 × 1 vector of the lags of the endogenous variables for

each country i, and 𝝁𝒊𝒕 = 5×1 vector of structural disturbances assumed to have zero covariance and generally
correlated across each country, i.
The contemporaneous covariance matrix of the structural disturbances takes the following form:
E[𝜺𝒕𝜺𝒕 ']=DxI………………………………………………………………4.1
I is the identity matrix of order 5 5,
𝐷 =
(
𝝈𝟏𝟐 0 0 0 0
0 𝝈𝟐𝟐 0 0 0
0 0 𝝈𝟑𝟐 0 0
0 0 0 𝝈𝟒𝟐 0
0 0 0 0 𝝈𝟓𝟐 )
……………………………………………4.2
and 𝜀𝑖𝑡 = 𝑀0−1 × 𝜇𝑖𝑡…………..4.3
Equation 4 is reduced to equation 5 (reduced form of the model) by multiplying both sides by 𝑴𝟎−𝟏.
P
j
itjtijit yNy1
,
……………...………………………………………..5
𝑁𝑗 = 𝑀0−1 ×𝑀𝑗 …………………………………5.1
And 𝜀𝑖𝑡 = 𝑀0−1 × 𝜇𝑖𝑡………………………………………....5.2
The reduced form errors 𝜀𝑖𝑡 , are linear combinations of the panel errors 𝜇𝑖𝑡, with a covariance matrix of the
form: E[ it it '] =𝑴𝟎−𝟏𝑫𝑴𝟎
−𝟏…………….........................................................5.3
The reduced form of the model is subject to the following system of specific equations to be estimated:
...5.4μΔSMIERIRaMSaIRaGDPGaGDPG P
1j
P
1j
t1,
P
1j
jt51jjt41jjt31j
P
1j
P
1j
jt21jjt11jt
5.5...μΔSMIaRIRaMSaIRaGDPGaIRP
1j
P
1j
t2,
P
1j
jt25jjti,24jjt23j
P
1j
P
1j
jti,22jjt12jt
..5.7μΔSMIaRIRaMSaIRaGDPGaRIRP
1j
P
1j
t4,
P
1j
jti,54jjt44jjt34j
P
1j
P
1j
jt24jjt14jt
...5.8μΔSMIaRIRaMSaIRaGDPGaΔSMI P
1j
P
1j
t5,
P
1j
jt55jjt45jjt35j
P
1j
P
1j
jt25jjt15jt
𝜇1,𝑡 , 𝜇2,𝑡 , 𝜇3,𝑡 , …………… . . 𝜇5,𝑖𝑡 are the respective shocks of the variables which are assumed to be serially
uncorrelated and uncorrelated with each other.
3.2.1 Shocks
In line with Bjornland and Leitemo (2009) and Chatziantoniou et al, (2013), the study identifies the shocks of
all the variables including stock market shocks, money supply shock, interest rate shock, income shock and
price shock.
3.2.2 Restrictions
To estimate the panel disturbances in equation (4), suitable restrictions are imposed on M0 as has been done in
other related studies (Chartziantoniou et al. 2013).
...5.6μΔSMIaRIRaMSaIRaGDPGaMS P
1j
P
1j
it3,
P
1j
jt53jjt43jjt33j
P
1j
P
1j
jt23jjt13jt

The short-run restrictions are:
1) GDP cannot be contemporaneously influenced by any other variable (Kim & Roubini, 2000). On the
contrary, it can contemporaneously influence all other variables (Chatziantoniou et al, 2013).
2) Inflation reacts contemporaneously only to an income shock and external shock, i.e. imported inflation (Kim
& Roubini, 2000).
3) Both monetary and fiscal policy tools react contemporaneously to income and price shocks (Afonso &
Sousa, 2011).
4) Interest rates are influenced contemporaneously by the external shock, the money supply shock (Elbourne,
2008) and the stock market shock (Bjornland & Leitemo, 2009).
5) Stock market returns are influenced contemporaneously by all variables (Bjornland, 2008).
Thus from tttt MM
0
1
0 ,,
deuced from equation (4), the restrictions show up in the system
of matrix equations as:
(
𝜀1,𝑖𝑡𝑖𝑠
𝜀2,𝑖𝑡𝑝𝑠
𝜀3,𝑖𝑡𝑚𝑠𝑠
𝜀4,𝑖𝑡𝑖𝑟𝑠
𝜀5,𝑖𝑡𝑠𝑚𝑠)
=
(
𝑎11 0 0 0 0𝑎12 𝑎22 0 0 0𝑎13 𝑎23 𝑎33 0 0𝑎14 0 𝑎34 𝑎44 𝑎54𝑎15 𝑎25 𝑎35 𝑎45 𝑎55)
(
𝜇1,𝑖𝑡𝐺𝐷𝑃
𝜇2,𝑖𝑡𝐼𝑅
𝜇3,𝑖𝑡𝐺𝑀𝑆
𝜇4,𝑖𝑡𝑅𝐼𝑅
𝜇5,𝑖𝑡𝑆𝑀𝐼)
……………….(6)
ms = stock market shocks mss = money supply shock
irs = interest rate shock, is = income shock and ps = price shock.
3.3 Preliminary Tests
We investigate the properties of the data employing Pesaran (2004) test for cross-sectional dependence, Hadri
LM test for unit root and Westerlund (2007) test for cointegration. We then perform the Akaike Information
Criterion (AIC) test and serial autocorrelation LM test to determine the appropriate lag length for the model,
and to check serial correlation of the variables in the model.
3.4 Econometric Tools for Data Analysis
Because of the complicated dynamics in the panel VAR we employ impulse response functions and forecast
error variance decomposition, according to Stock & Watson,(2001) these statistics are more informative than
the estimated PVAR regression coefficients or R2s.
4 RESULTS AND DISCUSSION
4.1 Cross-sectional Dependence Test
The cross-sectional dependence test of Pesaran (2004), is performed under the hypothesis:
H0: Cross-sectional independence
Pesaran's test of cross sectional independence statistic = 17.650 and Pr = 0.0000
Average absolute value of the off-diagonal elements = 0.372.
The CD test statistic of 17.650 and a p value of 0.000 strongly rejects the null hypothesis of no cross-sectional
dependence. Further, the average absolute correlation of 0.372, is evidence of cross-sectional dependence
across the panels.
Therefore, all the series are cross-sectional correlated, which may imply the existence of similar regulations in
various fields such as macroeconomic policies, monetary policy frame works, and stock market operations
(Boubtane et al. 2012). The results here imply that the results of the study will hold for all the countries in the
sample studied.
4.2 Results of Unit-root Test
The study performs Hadri LM panel unit root test under the hypothesis:

H0: All panels are stationary
The figures (i.e P< 0.05 for most of the variables) in the table support a strong rejection of the null hypothesis
in favor of the alternative that at least one of them contains a unit root, for all the variables. This means that
some of the series are non-stationary, implying there could be a possible long-run relationship in some of the
series.
4.3 Panel Cointegration Test Results
Haven’t established that some of the panel series are non-stationary, we proceed to perform cointegration test to
ascertain a possible long-run relationship. We employ Westerlund, (2007) panel cointegration test under the
hypothesis: H0: No Cointegration in panels
Table 4- Panel cointegration test results-Westerlund (2007)
The results showed no evidence to reject the null hypothesis of no cointegration, dismissing the existence of the
long-run relationship anticipated in some of the panels in the stationarity test.
4.4 Lag-Order Selection Test
The table below show the results of the lag-order selection tests for the model employing the Akaike
Information Criterion (AIC) test.
4.5 Heteroscedesticity Test Results
As a robustness check, we perform autocorrelation Lagrangian Multiplier (LM) test on the residuals generated
from the panel VAR model estimation under the hypothesis:
H0: no autocorrelation at lag order,
We found a strong support for the rejection of the null hypothesis, a base to conclude that there is significant
correlation of all series within and across panels. Therefore, the findings of this study hold for all sampled
countries studied.
4.6 Contemporaneous Relationships
This section presents the estimated contemporaneous coefficients of the panel VAR model with the imposed
restrictions.
Estimated at 5% significance level.
NB:𝑎11,𝑎12……………𝑎55 are the estimated contemporaneous coefficients of the system of equations: 6.4 – 6.8
4.6.1 Analysis of the Contemporaneous Relationship
Table 3: We cannot report of a significant contemporaneous effect of any of the monetary policy variables on
the stock market. However, the results show that the stock market (i.e a54 = .6721833 and p value 0.000) exerts
significant contemporaneous positive effects on real interest rate. This result does not support the position of
Ioannidis & Kontonikas, (2007) that higher interest rates are contemporaneously associated with lower stock
returns in 13 OECD countries. However, our results could mean that stock market changes are
contemporaneously transmitted to monetary policy through the real interest rate channel.
4.7 Accumulated Impulse Responses
The panel VAR model is estimated at lag 3 based on the results of the AIC) test and then the impulse responses
computed from the residuals generated. Below are the results
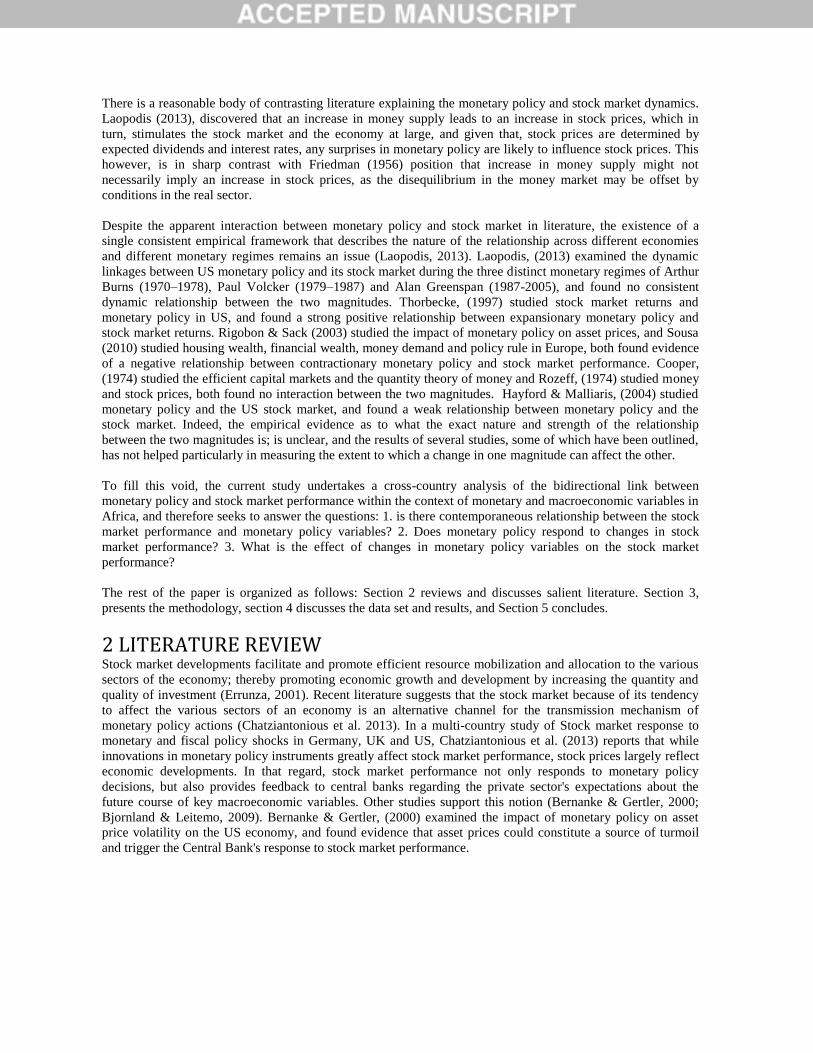
Figure 1: Apart from GDP, which seems not to be significantly responding to the stock market shock, the rest of
the variables are affected by the stock market. A negative stock market shock causes a positive inflation
response as captured in Nelson (1976) and tax hypothesis (Feldstein, 1980). Further, a negative stock market
shock causes a negative interest rate response; a result that is in line with that of Coleman & Agyire-Tettey,
(2008) and Zafar, (2013). Finally, a positive shock of the market leads to negative response of money supply.
This result supports the position of Sprinkel (1964) that past money supply data could be used to predict stock
returns, but contrasts the hypothesis that past money changes had no predictive power on stock returns (Cooper,
1974.

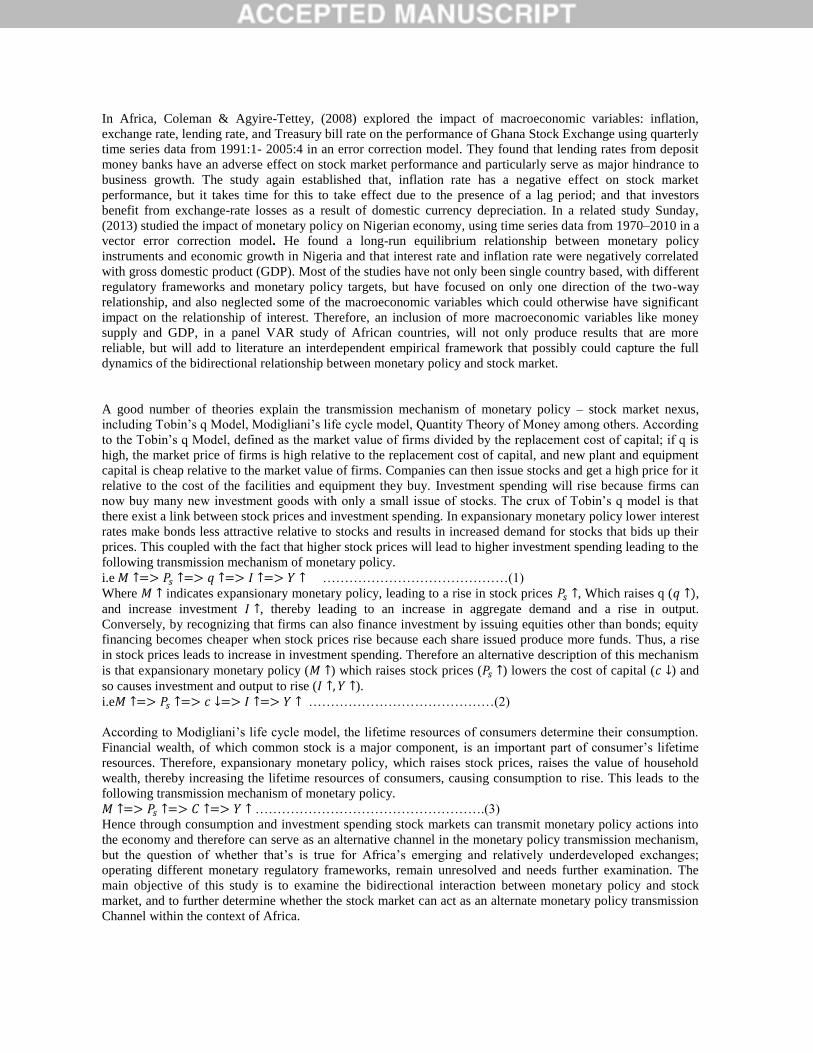
Figure 2 indicates that money supply positively responds to positive GDP shock sharply contrasting
Chatziantoniou et al. (2013)’s position that monetary policy fails to react significantly to GDP shock in UK. On
the other hand, inflation, real interest rate and stock market index all respond negatively to GDP shock. Fama
(1981)’s assumption that individuals’ current demand for money is related to future real economic activity and
current interest rates; may explain this findings. Chatziantoniou et al. (2013) again, report similar results in
Germany, UK and US, even though they found the reaction of the UK stock market to GDP to be insignificant.
Further, the negative response of stock market index to GDP shock is in line with the reverse causality
hypothesis by Geske & Roll, (1983)’s view that increased domestic borrowing or increase money supply in an
attempt to balance budget deficit, comes with an inflationary effect that dampen real activity and eventually
economic growth, subsequently stock prices fall.
In figure 3, whiles GDP growth appear dormant against inflation shock; a result which is at variance with Fama
(1981)’s explanation of the inverse relationship between current inflation and expected economic activity,
money supply growth, interest rate and stock market index all respond positively to inflation shock. This is
partly contrary to the findings of Mukherjee & Naka (1995) that Tokyo stock price index is positively related to
money supply and industrial production, but has a mixed relation with inflation and interest rates. Further,
Tsoukalas (2003) finding of a strong relationship between stock prices and inflation, consumer price index, and
money supply in Cyprus also contrast these findings.
Figure 4: inflation affects money supply positively, result which contrasts Friedman, (1956) quantity theory of
money that posits that the quantity demanded of money, is a negative function of inflation; since demand and
supply of money are positively correlated. The figure also shows that GDP growth remains flat against growth
in money supply, but negative shock in money supply leads to positive interest rate and stock market response,
a result consistent with both theory and practice (Chatziantoniou et al. 2013). Theoretically, an increase in
money supply is expected to lead to a reduction in interest rates, which is predicted to have a positive effect on
the stock market. Further, this result partly rejects and partly supports the findings of Ibrahim (2003) that the
Malaysian stock price index relates positively with money supply, consumer price index and industrial
production. Further, Geske & Roll (1983) reverse causality hypothesis explains the negative relationship
between money supply and stock market performance.
Figure 5: GDP is flat against interest rate shock, contrary to Sunday (2013) finding of a negative correlation
between GPD and inflation in Nigeria. Whereas inflation and money supply react negatively to interest rate
shock, real interest rate positively affect stock market index, contrary to the finding of Zafar, (2013) that the
relationship between interest rate and stock market is negative. However, the theoretical explanation to these
empirical findings as captured by Mishkin, (2007) is that a reduction in interest rate makes investment in equity
even with low returns more attractive relative to bonds; the decline in the required rate of return lowers the
denominator of Gordon growth model, thus leading to an increase in stock prices.
4.8 Graphs of Impulse Response Functions
We present the graphs of the impulse response functions; the interpretation and analysis of which has been
presented in the previous section.
4.9 Forecast Error Variance Decomposition (Fevd) Analysis
Even though impulse responses give information about the effect of changes in one variable on another, they do
not show how important shocks in one variable are in explaining fluctuations in other variables. We therefore
performed forecast error variance decomposition analysis. Below are the results:
From table 4, the results indicate that generally the explanatory power of changes in one variable over changes
on another variable improves as the forecast horizon moves from 1-10 forecast periods ahead. Specifically, at a
conventional forecast horizon of 10 periods ahead; GDP growth, inflation rate, money supply and real interest
rate explain approximately 2.5%, 1.3%, 0.9% and 5.3% respectively of the stock market shocks; whiles
inflation rate, money supply growth, real interest rate and stock market index explain approximately 7%, 1.3%,
2% and 0.5% respectively of GDP shock.

Further, table 4 shows that whereas money supply growth, real interest rate, stock market index and GDP growth
explain approximately 1.6%, 21%, 7% and 5.4% of the fluctuations in inflation rate; real interest rate, stock market
index, GDP growth and inflation explain approximately 6%, 5%, 0.4% and 14% of money supply shock. The results
further indicates that stock market index, GDP growth, inflation rate and money supply explain approximately 11%
0.3%, 2.3% and 1.3% of the fluctuations in real interest rate. It is important to add that all the above estimates are
shown to be statistically significant.
5. CONCLUSIONS We examined the impact of monetary policy on stock market performance in a sample of 12 African countries using
a panel VAR approach with data from 1997- 2013, and found that stock market changes are transmitted
contemporaneously to monetary policy through the interest rate channel.
In the long term, the study finds evidence of bidirectional relationship between monetary policy and stock markets
in Africa. Whiles stock market responds positively to interest rate shock, interest rate responds negatively to a
negative stock market shock. On the other hand, a negative money supply growth affects stock market positively, as
positive market shock affects money supply growth negatively. Thus, the finding is in line with Tobin q and
Modigliani’s life cycle models; explaining the stock market as monetary policy transmission channel.
We established a significant bidirectional positive relationship between money supply growth and real interest rate
but the influence of the latter on the former is greater. Again, both money supply and inflation rate affect real
interest rate negatively. Therefore, the monetary authorities in their policy decisions should use only one of these
instruments, preferably real interest rate. This will among other things, help avoid duplication of policy shifts
implications on the economy.
Further, although both money supply and real interest rate affect inflation rate, the influence of the latter is much
more greater. Therefore, economies with inflation targeting monetary policy should employ the interest rate channel
as against money supply, in their bid to control inflation and to have stable microenvironment.
We found a bidirectional relationship between inflation and stock market, implying inflation is an important
determinant of stock market movements. Further, real interest rate and stock market index have the highest reverse
causality relationship (5.3% and 11% fevd) relative to the other variables.
In line with Friedman (1956) position, we established that a change in money supply does not lead to a proportionate
change in stock market performance and vice versa, as stock market accounts for approximately 5%, of money
supply shock, whiles money supply accounts for approximately 0.9% of stock market shock.
Finally, it is essential that future studies on this topic consider countries with significantly different monetary policy
regimes, since our cross-sectional dependence test results indicates significant correlation across panels, implying
among other things similar monetary policy regimes across the sampled countries.
REFERENCES: Adeolu A M, Sunday K J, & Abike B S, (2012), International Journal of Academic Research in Economics and
Management Sciences September 2012, Vol. 1, No. 5
Afonso, A., & Sousa, R. M., (2011).What are the effects of fiscal policy on asset markets? Economic Modeling, 28,
1871–1890.
Bernanke, B. S., & Gertler, M. (2000). Monetary policy and asset price volatility. Working Paper 7559. National
Bureau of Economic Research.
Bjornland, H. C. (2008). Monetary policy and exchange rate interactions in a small open economy, Scandinavian
Journal of Economics 110, 197–221.
Bjornland, H. C., & Leitemo, K. (2009). Identifying the interdependence between US monetary policy and the stock
market. Journal of Monetary Economics, 56, 275–282.
Boubtane, E., Coulibaly, D. & Rault, C. (2013) Immigration, Growth and Unemployment: Panel VAR Evidence
from OECD Countries, IZA Discussion Paper No. 6966, October 2012.

Chami, R., Cosimano, T.F., & Fullenkamp, C. (1999). The Stock Market Channel of Monetary Policy. IMF
Working Paper, International Monetary Fund, WP/99/22.
Chatziantoniou I., Duffy D., & Filis G. (2013). Stock market response to monetary and fiscal policy shocks: Multi-
country evidence, www.elsevier.com/locate/ecmod, at Sci. Verse Science Direct, Economic Modeling 30
(2013) 754–769.
Coleman A. & Agyire-Tettey K.F (2008). “The Impact of Microeconomic indicators on Stock Exchange
Performance: The Case of the Ghana Stock Exchange”. Journal of Risk Finance, Emerad Group
Publishing Ghana.
Cooper, R.V.L. (1974). Efficient capital markets and the quantity theory of money, Journal of Finance 29, 115–146.
Elbourne, A., (2008). The UK housing market and the monetary policy transmission mechanism: an SVAR
approach, Journal of Housing Economics 17, 65–87.
Errunza, V. (2001). “Foreign portfolio equity investments, financial liberalization, and economic development”,
Review of International Economics, Vol. 9, pp. 703-26.
Fama, E. & Schwert, G. (1977). Asset returns and inflation, Journal of Financial Economics, 5, 115–146.
Fama, E. (1981). Stock returns, real activity, inflation and money. American Economic Review, 71, 545–565.
Feldstein, M. & Horioka, C. (1980). "Domestic Saving and International Capital Flows", Economic Journal 90
(358): 314–329, Jstor 2231790.
Friedman, M. (1956). “The Quantity Theory of Money – A Restatement,” Reprinted from Studies in the Quantity
Theory of Money, University of Chicago Press.
Friedman, M. (1988). Money and the stock market, Journal of Political Economy 96 (2), 221–245.
Gertler M, & Grinols L.E. (1982). “Unemployment, Inflation and Common Stock Returns”, J. Money, Credit Bank,
14(2): 216-233.
Geske R. & Roll R. (1983). “The Fiscal and Monetary Linkage between Stock Returns and Inflation,” Journal of
Finance 38 (March): 1 – 33.
Hadri,K., (2000). Testing for Stationarity in Heterogeneous Panel Data, Econometric Journal, 3(2), 14861.
Hamburger, M.J. & Kochin, L.A., (1972), Money and stock prices: the channels of influence, Journal of Finance 27,
231–249.
Hayford, J.D. & Malliaris A.G. (2004). Monetary policy and the US stock market. Economic Inquiry 42 (3), 145–
169.
Ibrahim, M.H. (2003). “Macroeconomic Forces and Capital Market Integration: A VAR Analysis for Malaysia,”
Journal of the Asian Pacific Economy, 8 (1), 19-40.
Ioannidis, C. & Kontonikas, A. (2007). The impact of monetary policy on stock prices. Journal of Policy Modeling
30 (2008) 33–53.
Im, K. Pesaran, M., & Shin, R. (2003). Testing for Unit Roots in Heterogeneous Panels, Journal of Econometrics,
115(1), 5374.
Kim, S. & Roubini, N., (2000). Exchange rate anomalies in the industrial countries: a solution with a structural VAR
approach. Journal of Monetary Economics 45, 561–586.
Laopodis, N.T, (2013). Monetary policy and stock market dynamics across monetary regimes, Journal of
International Money and Finance, www.elsevier.com/locate/jimf.
Mbutor, O. M. (2007). “The Lending Channel of Monetary Policy Transmission in Nigeria; Vector Autoregressive
(VAR) Verification,” Central Bank of Nigeria; Economic and Financial Review Vol.45/1.
Mishkin, F. (2001). The Transmission Mechanism and The Role of Asset Prices In Monetary Policy, Working Paper
8617 http://www.nber.org/papers/w8617
Modigliani, F. (1971). "Monetary Policy and Consumption," in Consumer Spending and Monetary Policy: The
Linkages, Boston: Federal Reserve Bank of Boston, 9-84.
Mukherjee, T. K. & Naka A. (1995). “Dynamic Relations Between Macroeconomic Variables and the Japanese
Stock Market: An Application of Vector Error Correction Model, “The Journal of Financial Research,
XVIII. (2), 223-237.
Nelson, C. R. (1976). “Inflation and Rates of Return on Common Stocks,” Journal of Finance 31, No.2, (May): 471-
483.
Patelis, A.D., (1997). Stock return predictability and the role of monetary policy. Journal of Finance 52, 1951–1972.
Pesaran, M., (2004). General Diagnostic Tests for Cross Section Dependence in Panels. Cambridge Working Papers
in Economics no. 435 and CE-Sifo Working Paper Series no. 1229, University of Cambridge,
Cambridge,United Kingdom. Econometrics 27(2), 265-312. Programme, New York.

Rigobon, R. & Sack, B. (2001). Measuring the Reaction of Monetary Policy to the Stock Market, NBER working
paper no. 8350.
Rigobon, R. & Sack, B., (2003). Measuring the response of monetary policy to the stock market. Quarterly Journal
of Economics 118, 639–669.
Rozeff, M.S. (1974). Money and stock prices, Journal of Financial Economics 1, 245–302.
Sprinkel, B.W., (1964). Money and Stock Prices, Richard D. Irwin, Homewood, IL
Stock J. H. & Watson M. W. (2001). A survey of articles on Vector Autoregression, Journal of Business and
Economic Statistics. 14, pp. 10 – 38.
Sunday O.A. (2013). Impact of monetary policy on Nigerian economic growth, Prime Journal of Social
Science (PJSS). 2315-5051. Vol. 2(2), pp. 195-199, February 25th, 2013, www.primejournal.org/PJSS ©
Prime Journals.
Thorbecke, W. (1997). Stock market returns and monetary policy. Journal of Finance, 52, 635–654.
Tobin, J. (1969). A general equilibrium approach to monetary theory. Journal of Money, Credit and Banking 1 (1),
15–29.
Tsoukalas, D. (2003). “Macroeconomic factors and stock prices in the emerging Cypriot equity market,” Journal of
Managerial Finance Vol. 2, No. 4, pp. 87-92.34
Westerlund, J. (2007). Testing for error correction in panel data, Oxford Bulletin of Economics and Statistics, 69(6),
709-748.
Zafar, M. (2013). Determinants of Stock Market Performance in Pakistan; Interdisciplinary Journal of
Contemporary Research In Business, January 2013 Vol 4, No 9.
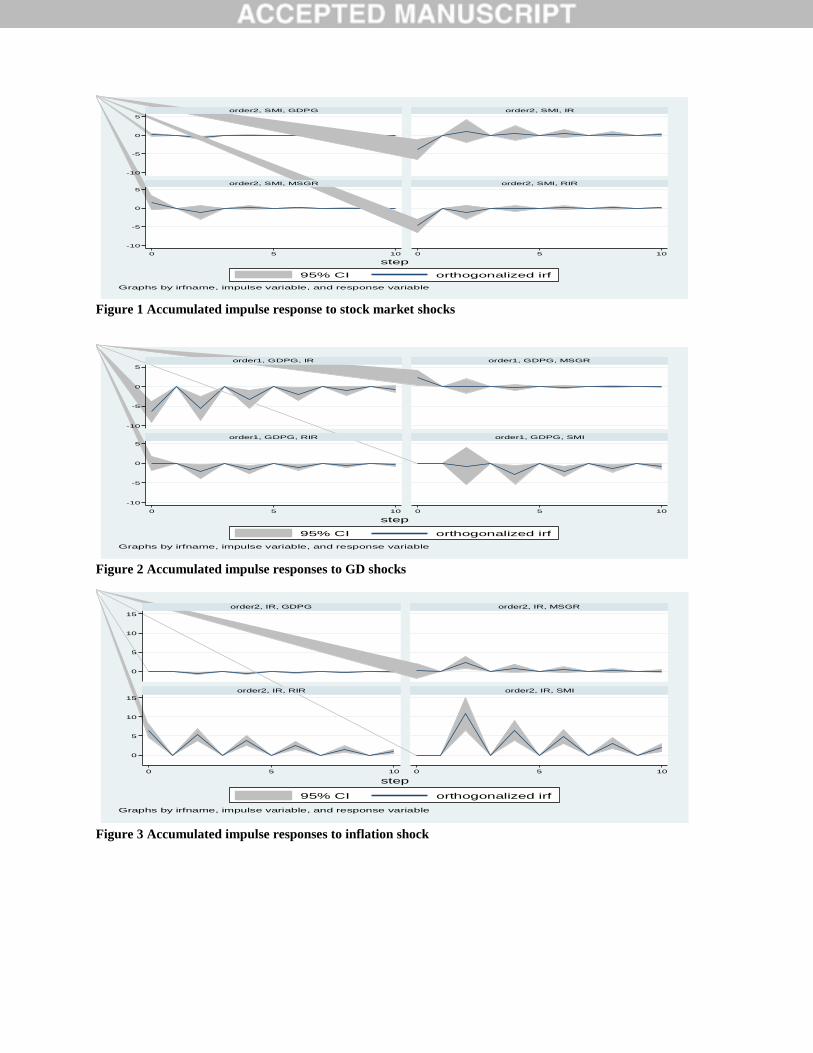
Figure 1 Accumulated impulse response to stock market shocks
Figure 2 Accumulated impulse responses to GD shocks
Figure 3 Accumulated impulse responses to inflation shock
-10
-5
0
5
-10
-5
0
5
0 5 10 0 5 10
order2, SMI, GDPG order2, SMI, IR
order2, SMI, MSGR order2, SMI, RIR
95% CI orthogonalized irf
step
Graphs by irfname, impulse variable, and response variable
-10
-5
0
5
-10
-5
0
5
0 5 10 0 5 10
order1, GDPG, IR order1, GDPG, MSGR
order1, GDPG, RIR order1, GDPG, SMI
95% CI orthogonalized irf
step
Graphs by irfname, impulse variable, and response variable
0
5
10
15
0
5
10
15
0 5 10 0 5 10
order2, IR, GDPG order2, IR, MSGR
order2, IR, RIR order2, IR, SMI
95% CI orthogonalized irf
step
Graphs by irfname, impulse variable, and response variable

Figure 4 Accumulated impulse responses to money supply shock
Figure 5 Accumulated impulse responses to real interest rate.
-20
-10
0
10
-20
-10
0
10
0 5 10 0 5 10
order2, MSGR, GDPG order2, MSGR, IR
order2, MSGR, RIR order2, MSGR, SMI
95% CI orthogonalized irf
step
Graphs by irfname, impulse variable, and response variable
-10
0
10
20
-10
0
10
20
0 5 10 0 5 10
order2, RIR, GDPG order2, RIR, IR
order2, RIR, MSGR order2, RIR, SMI
95% CI orthogonalized irf
step
Graphs by irfname, impulse variable, and response variable

Table 1- Hadri LM panel unit root tests-Results
Variable LM-test P-values
GDPG 2.5076 0.0061
IR 3.1286 0.0009
MSGR 1.1450 0.1261
RIR 3.6505 0.0001
SMI -0.0246 0.5098
Table 2.1 Lag-length selection results (Pre est.)
Table 2.2 lag-length selection results (post est)
*means optimum lag length
The results indicate that the optimum lag length for the estimation of the panel VAR is three.
Table 3 - PVAR results-Contemporaneous coefficients
Coefficient SE Z P>|𝒁| Confidence Interval
L-bound U-bound
𝑎11 .3458538 .0463173 7.47 0.000 .2550735 .4366342
𝑎12 -.1601677 .1094503 -1.46 0.143 -.3746865 .054351
𝑎22 .7191033 .0414405 17.35 0.000 .6378814 .8003253
𝑎13 .7173785 .1467401 4.89 0.000 .4297733 1.004984
𝑎23 .1945091 .0434611 4.48 0.000 .1093269 .2796914
𝑎33 .3899043 .0491286 7.94 0.000 .293614 .4861946
𝑎14 .2193147 .0994062 2.21 0.027 .0244821 .4141472
𝑎34 -.0129989 .0304703 -0.43 0.670 -.0727196 .0467219
𝑎44 -.0381963 .0137878 -2.77 0.006 -.0652199 -.0111728
𝑎54 .6721833 .0437793 15.35 0.000 .5863776 .7579891
𝑎15 .190749 .29933 0.64 0.524 -.3959269 .777425
𝑎25 -.0729507 .0470979 -1.55 0.121 -.1652608 .0193595
𝑎35 .0079984 .064298 0.12 0.901 -.1180234 .1340201
𝑎45 -.0502486 .1092119 -0.46 0.645 -.2643 .1638029
𝑎55 .1053386 .0526737 2.00 0.046 .0021 .2085772
Lag AIC
1 27.7544
2 27.3158
3 26.1865*
4 26.7242
Lag AIC
1 41.7597
2 41.3605
3 40.2414*

Table 4: Variance decomposition analysis
Variation in the row variable explained by column variable
(in %, 10 periods ahead)
Panel Vector Autoregression System
VARIABLE GDPG IR MS RIR SMI
GDPG 91.24% 5.4% 0.4% 0.3% 2.5%
IR 7% 75.53% 14% 2.3% 1.3%
MS 1.3% 1.6% 95.3 1.3% 0.9%
RIR 2% 21% 6% 68.5% 5.3%
SMI 0.5% 7% 5% 11% 70.8%
Summary of the Forecast Error Variance Decompositions Estimated at 95% C.I
View publication statsView publication stats