the missing piece in diabetes testing missing piece in diabetes testing ... besides free glucose in...
TRANSCRIPT

INNOVATIONS IN CLINICAL DIAGNOSTICS
DIAZYME
The Missing Piece in Diabetes Testing
For theQuantitativeDetermination ofGlycated Serum Protein(GSP, Glycated Albumin)
GlycoGap®
About Diazyme
Diazyme Laboratories is a Division of General Atomics
located in Poway, California. Diazyme uses its proprietary
enzyme and immunoassay technologies to develop diagnostic
reagents which can be used on most automated chemistry
analyzers in user-friendly formats. Diazyme is a cGMP
and ISO 13485 certified medical device manufacturer.
Diazyme’s products include test kits for diagnosis of
cardiovascular disease, liver disease, cancer markers, renal
disease, diabetes and electrolytes.
Our mission is to improve the quality
of healthcare by providing innovative
products in clinical diagnostics.
M I S S I O N S TAT E M E N T
1
About Diazyme
Introduction . . . . . . . . . . . . . . . . . . . . . . . . . . . . . . . . . . . . . . . . . . . . . . 3
1. Diabetes Mellitus . . . . . . . . . . . . . . . . . . . . . . . . . . . . . . . . . . . . . . 5
2. Blood Sugar and Protein Glycation . . . . . . . . . . . . . . . . . . . . . . . . 6
3. Diagnosis and Monitoring of Diabetes . . . . . . . . . . . . . . . . . . . . . 7
4. Glycation Gap . . . . . . . . . . . . . . . . . . . . . . . . . . . . . . . . . . . . . . . . 9
5. About Diazyme GlycoGap® Test Kit . . . . . . . . . . . . . . . . . . . . . . 11
6. Assay Principle of GlycoGap® . . . . . . . . . . . . . . . . . . . . . . . . . . . . 12
7. Reagent Composition . . . . . . . . . . . . . . . . . . . . . . . . . . . . . . . . . 12
8. Assay Procedure . . . . . . . . . . . . . . . . . . . . . . . . . . . . . . . . . . . . . . 12
9. GlycoGap® Performance Data on Hitachi 917 . . . . . . . . . . . . . . . 13
10. Sample Type . . . . . . . . . . . . . . . . . . . . . . . . . . . . . . . . . . . . . . . . . 17
11. Reference Range . . . . . . . . . . . . . . . . . . . . . . . . . . . . . . . . . . . . . . 17
12. Glycated Serum Protein (GSP) vs Glycated Albumin (GA) . . . . . 17
13. Ratio of Glycated Albumin over Total Albumin to Report as GA% . . . . . . . . . . . . . . . . . . . . . . . . . . . . 18
14. Fructosamine NBT Assay . . . . . . . . . . . . . . . . . . . . . . . . . . . . . . 19
15. Summary . . . . . . . . . . . . . . . . . . . . . . . . . . . . . . . . . . . . . . . . . . . 20
16. References .. . . . . . . . . . . . . . . . . . . . . . . . . . . . . . . . . . . . . . . . . . 21
Contents
2

3
Diazyme has developed a 2-part, liquid stable enzymatic test for quantitative determination of glycated serum protein (GSP, glycated albumin) in serum samples of patients. The
Diazyme enzymatic GSP test kit (GlycoGap®) is used for short-term to medium-term monitoring of glycemic control for average blood glucose levels over the past 2-3 week period.
Diazyme’s GlycoGap® test can be run on most automated clinical chemistry analyzers. The enzymatic assay is more specific for glycated serum protein than the old NBT based fructosamine assay which is significantly interfered by endogenous reducing substances. The GlycoGap® test offers excellent analytical performance in precision, accuracy, linearity and stability. The GlycoGap® liquid stable test provides good correlations as compared to its previous lyophilized version of the GSP test.
In 2010, The American Diabetes Association (ADA) Clinical Practice Recommendations recommend using HbA1c to diagnose and screen diabetes. However, recent studies have shown
IntroductionIntroduction

4
that blood HbA1c levels HbA1c alone may not accurately reflect serum glucose concentrations in all diabetic patients. The difference between the actual measured HbA1c concentration and the predicted HbA1c from glycated serum protein is called the glycation gap. Studies have demonstrated that the glycation gap information provided by measuring HbA1c and Glycated Serum Protein (GSP) together offers improved diagnostic accuracy by more reliably predicting complications of diabetes including nephropathy and retinopathy than HbA1c alone. GSP or Glycated Albumin (GA) test is gaining strong support from clinical research for its use as an essential test for better diagnosis of diabetes and glycemic control. In a more recent clinical study, GA was found to be a better indicator than HbA1c for assessing risk of death and hospitalization in diabetic dialysis patients (Freedman B. L. et al. CJASN ePress, May 19, 2011).
This document describes the detailed performance characteristics of the GlycoGap®, as well as background information about diabetes mellitus and glycation gap.

1. Diabetes Mellitus
5
Diabetes Mellitus, often simply referred to as diabetes is a group of metabolic diseases in which a person has high blood sugar, either because the body does not produce enough
insulin, or because cells do not respond to the insulin that is produced. Hyperglycaemia, or raised blood sugar, is a common effect of uncontrolled diabetes and over time leads to serious damage to many of the body’s systems, especially the nerves and blood vessels.
There are three main types of diabetes:
• Type 1 diabetes: results from the body’s failure to produce insulin, and presently requires the person to inject insulin.
• Type 2 diabetes: results from insulin resistance, a condition in which cells fail to use insulin properly, sometimes combined with an absolute insulin deficiency.
• Gestational diabetes: is when pregnant women, who have never had diabetes before, have a high blood glucose level during pregnancy. It may precede development of type 2 diabetes.
Type 2 diabetes is by far the most common, accounting for 90 to 95% of the total diabetes population.
In 2010, The International Diabetes Federation estimated that 285 million people around the world have diabetes, corresponding to 6.4% of the world’s adult population. This total is expected to rise to 438 million within 20 years, corresponding to 7.8% of the world adult population. Each year, an additional 7 million people develop diabetes.
In the United States, 25.8 million people have diabetes, corresponding to 8.3% of the total U.S. population as of January, 2011. In addition, 79 million people have pre-diabetes. In 2010, 1.9 million new cases of diabetes were diagnosed in the U.S.
Diabetes and its complications impose severe economic burden on individuals, families, and national health systems. In 2007, diabetes and pre-diabetes related medical cost was estimated to have reached $218 billion, which accounts for approximate 10% of the total U.S. healthcare spending (2.26 trillion or 16% of its GDP). If the current trend continues, it is estimated that by 2020, diabetes will cost the healthcare system $3.35 trillion and more than 50 percent of Americans could have diabetes by 2020 according to a recent UnitedHealth report, The United States of Diabetes (http://www.unitedhealthgroup.com).
1. Diabetes Mellitus
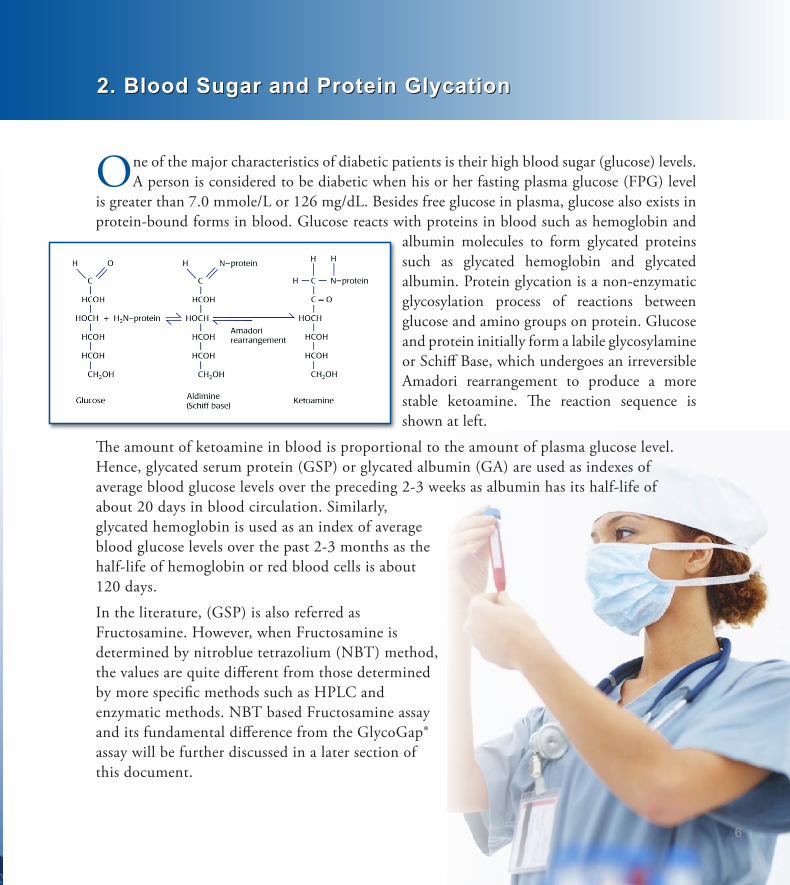
One of the major characteristics of diabetic patients is their high blood sugar (glucose) levels. A person is considered to be diabetic when his or her fasting plasma glucose (FPG) level
is greater than 7.0 mmole/L or 126 mg/dL. Besides free glucose in plasma, glucose also exists in protein-bound forms in blood. Glucose reacts with proteins in blood such as hemoglobin and
albumin molecules to form glycated proteins such as glycated hemoglobin and glycated albumin. Protein glycation is a non-enzymatic glycosylation process of reactions between glucose and amino groups on protein. Glucose and protein initially form a labile glycosylamine or Schiff Base, which undergoes an irreversible Amadori rearrangement to produce a more stable ketoamine. The reaction sequence is shown at left.
The amount of ketoamine in blood is proportional to the amount of plasma glucose level. Hence, glycated serum protein (GSP) or glycated albumin (GA) are used as indexes of average blood glucose levels over the preceding 2-3 weeks as albumin has its half-life of about 20 days in blood circulation. Similarly, glycated hemoglobin is used as an index of average blood glucose levels over the past 2-3 months as the half-life of hemoglobin or red blood cells is about 120 days.
In the literature, (GSP) is also referred as Fructosamine. However, when Fructosamine is determined by nitroblue tetrazolium (NBT) method, the values are quite different from those determined by more specific methods such as HPLC and enzymatic methods. NBT based Fructosamine assay and its fundamental difference from the GlycoGap® assay will be further discussed in a later section of this document.
2. Blood Sugar and Protein Glycation2. Blood Sugar and Protein Glycation
6

3. Diagnosis and Monitoring of Diabetes
7
3. Diagnosis and Monitoring of Diabetes
Diabetes is characterized by recurrent or persistent hyperglycemia, and hyperglycemia is diagnosed and monitored by measuring blood levels of glucose including fasting plasma
glucose (FPG) and protein conjugated glucose such as glycated hemoglobin A1c (HbA1c) and glycated serum protein (GSP) or glycated albumin (GA). These assays (FPG, GSP and HbA1c) are of different meanings and applications in clinical settings.
1. Daily blood glucose level testing (FPG) measures the plasma level of glucose at the time point of testing; it is a transient index of glucose for the day or at the point of testing.
2. Glycated Serum Protein (GSP) testing measures the average blood glucose level over a period of past 2-3 weeks. It is a short-term to medium-term index for glycemic control.
3. Glycated Hemoglobin A1c (HbA1c) test represents the average blood sugar level over a period of previous 2-3 months. It is a long-term index for glycemic control.
Currently, diabetes is diagnosed by demonstrating any one of the following conditions:
• Glycated hemoglobin (Hb A1c) ≥ 6.5%.
• Fasting plasma glucose level ≥ 7.0 mmol/L (126 mg/dL).
• Plasma glucose ≥ 11.1 mmol/L (200 mg/dL) two hours after a 75 g oral glucose load as in a glucose tolerance test.
• Symptoms of hyperglycemia and casual plasma glucose ≥ 11.1 mmol/L (200 mg/dL).

8
HbA1c was added to the clinical protocol for diagnosis and monitoring of diabetes in 2010 under the recommendation by American Diabetes Association (ADA). The recommendation was based on the latest scientific evidence and randomized clinical trials including Diabetes Control and Complications Trial (DCCT), a trial on Type I diabetes in U.S and Canada, and United Kingdom Prospective Diabetes Study (UKPDS), a trial on Type II diabetes in UK. These trials demonstrated that lowering HbA1c levels significantly reduces the onset and rate of progression of microvascular complications.
However, recent studies have shown that blood HbA1c levels alone may not accurately reflect serum glucose concentrations in all diabetic patients. The difference between the actual measured HbA1c concentration and the predicted HbA1c from glycated serum protein is called the glycation gap. Studies have demonstrated that the glycation gap information provided by measuring HbA1c and glycated serum protein together offers improved diagnostic accuracy by more reliably predicting complications of diabetes including nephropathy and retinopathy than HbA1c alone. More information about glycation gap is discussed in the next section.

4. Glycation Gap
9
4. Glycation Gap
HbA1c is regarded as the gold standard for measurement of glycemic control and is now used for diagnosing diabetes. For majority of patients, HbA1c is a strong index of average
glucose levels over the proceeding weeks-to-months. There exists a linear relationship between HbA1c and average glucose (AG), and the relation can be expressed by an equation: AG(mg/dL) = (35.6 x HbA1c) - 77.3, with a Pearson correlation coefficient (r) of 0.82 ( David M. Nathan et al. Diabetes Care, 31, 1473-1478, 2008). However, for some diabetic patients, HbA1c levels do not accurately predict their average glucose levels and diabetic complications. Recent studies have found that there are considerable interindividual HbA1c variations that are affected by nonglycemic factors such as genetics and age (Cohen RM, Smith EP Curr Opin Clin Nutr metab Care 11; 512-517, 2008). For example, race influences HbA1c. Mexican Americans and African Americans have higher mean HbA1c
values than Caucasians. Similarly, HbA1c values increase with age. It was known that 33% of the variance in HbA1c was not accounted for by mean blood glucose
in DCCT trial, and 21% of the variance in HbA1c among diabetic patients was not explained by mean blood glucose.
Nevertheless, the fact that there is a discrepancy in HbA1c and mean blood glucose for some diabetic patients can not be ignored
and needs to be scientifically addressed, otherwise, it may seriously undermine the power of HbA1c for use in diagnosing diabetes and monitoring glycemic control. To address the discrepancy between HbA1c and mean blood glucose, Robert Cohen et al.(Diabetes Care, Vol. 26, 163-167, 2003) proposed the measurement of glycation gap, that is defined as the difference between measured HbA1c and HbA1c predicted from GSP value. Studies with both Type 1 and Type

10
2 patients found that Glycation Gap is a significant predictor for progression of nephropathy even after adjustment for HbA1c and is also independent from GSP. The most recent study by Rodriguez-Segade has concluded that joint use of Glycation Gap and GSP as measures of nonglycemic and glycemic determinants of glycation, respectively, may improve evaluation of the risk of nephropathy and of the glycemic control desirable for individual patient (Rodriguez-Segade et al. Clin. Chem. 57:2, 264-271, 2011). The figure below shows the cumulative incidence of progression of nephropathy among patients in high, medium, and low Glycation Gap (gg) groups. The risk in the medium and high gg groups was respectively 1.6 and 2.5 times the risk of the low gg group.Diazyme GSP (GlycoGap®) assay is designed for specific determination of GSP which is in turn used for the measurement of Glycation Gap. GlycoGap® assay is particularly useful in the disease management of diabetic dialysis patients to whom regular HbA1c test does not work accurately due to shortened red blood cell survival in advanced kidney disease. Recently, Freedman Barry et al. reported that Glycated Albumin (GA), not HbA1c, accurately predicts the risk of death and hospitalizations in patients with diabetes mellitus and end stage renal disease (ESRD) recommending clinicians who care for patients with diabetes on dialysis to use GA test.
11
5. About Diazyme GlycoGap® Test Kit5. About Diazyme GlycoGap® Test Kit
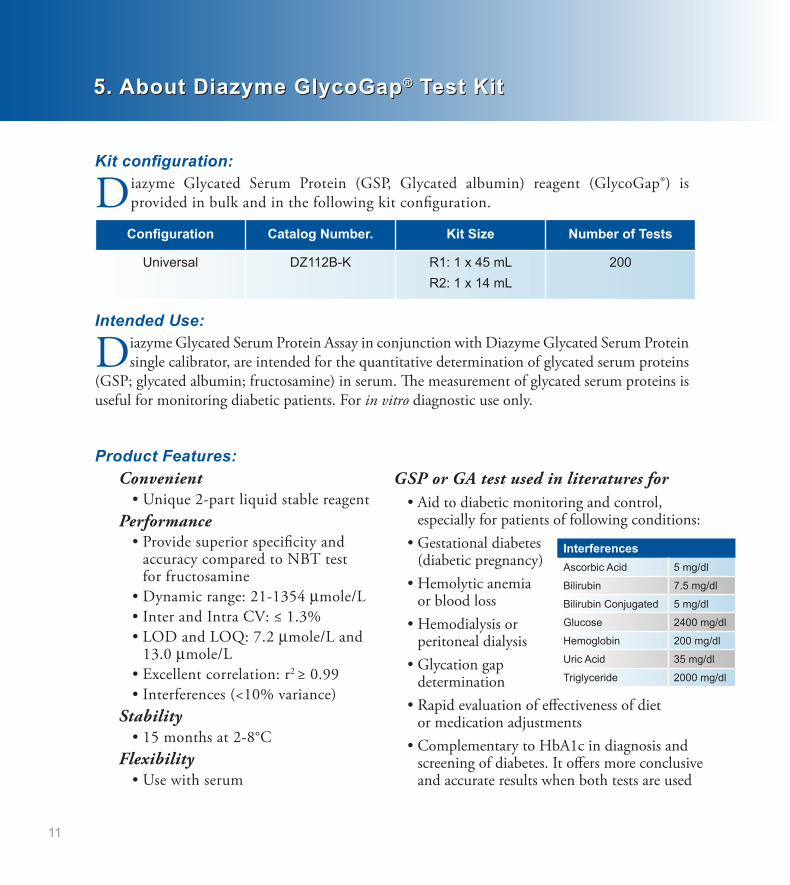
Kit configuration:
Diazyme Glycated Serum Protein (GSP, Glycated albumin) reagent (GlycoGap®) is provided in bulk and in the following kit configuration.
Configuration Catalog Number. Kit Size Number of Tests
Universal DZ112B-K R1: 1 x 45 mLR2: 1 x 14 mL
200
Intended Use:
Diazyme Glycated Serum Protein Assay in conjunction with Diazyme Glycated Serum Protein single calibrator, are intended for the quantitative determination of glycated serum proteins
(GSP; glycated albumin; fructosamine) in serum. The measurement of glycated serum proteins is useful for monitoring diabetic patients. For in vitro diagnostic use only.
Product Features:Convenient • Unique 2-part liquid stable reagentPerformance • Provide superior specificity and accuracy compared to NBT test for fructosamine • Dynamic range: 21-1354 μmole/L • Inter and Intra CV: ≤ 1.3% • LOD and LOQ: 7.2 μmole/L and 13.0 μmole/L • Excellent correlation: r2 ≥ 0.99 • Interferences (<10% variance)Stability • 15 months at 2-8°CFlexibility • Use with serum
GSP or GA test used in literatures for • Aid to diabetic monitoring and control, especially for patients of following conditions: • Gestational diabetes (diabetic pregnancy) • Hemolytic anemia or blood loss • Hemodialysis or peritoneal dialysis • Glycation gap determination • Rapid evaluation of effectiveness of diet or medication adjustments • Complementary to HbA1c in diagnosis and screening of diabetes. It offers more conclusive and accurate results when both tests are used
InterferencesAscorbic Acid 5 mg/dl
Bilirubin 7.5 mg/dl
Bilirubin Conjugated 5 mg/dl
Glucose 2400 mg/dl
Hemoglobin 200 mg/dl
Uric Acid 35 mg/dl
Triglyceride 2000 mg/dl

6. Assay Principle of GlycoGap®
7. Reagent Composition
8. Assay Procedure
6. Assay Principle of GlycoGap®
7. Reagent Composition
8. Assay Procedure
12
The Diazyme enzymatic assay for glycated serum proteins (GSP, glycated albumin (GA)) uses Proteinase K to digest serum proteins into low molecular weight glycated protein fragments
(GPF), and uses Diazyme’s specific fructosaminase™, a microorganism originated amadoriase to catalyze the oxidative degradation of Amadori product GPF to yield PF or amino acids, glucosone and H2O2. The H2O2 released is measured by a colorimetric Trinder end-point reaction. The absorbance at 546 nm is proportional to the concentration of glycated serum proteins (GSP) or glycated albumin.
GSP/GA GPF Proteinase K
Fructosaminase™
GPF PF or amino acids + H2O2
PeroxidaseH2O2 + TOOS + 4-AA Color + H2O
R1: Enzyme/substrate reagent containing Good’s buffer, 4-AA, Proteinase K and stabilizersR2: Enzyme/substrate reagent containing Good’s buffer, Fructosaminase™, TOOS, HRP, Geneticin and stabilizersCalibrators: 2 levels, 0 and 530 μmole/L Controls: 2 levels, 200 and 650 μmole/L
Diazyme GSP (GlycoGap®) assay procedure on automated chemistry analyzers is depicted below:
GSP Reaction Curve
0
500
1000
1500
0 4 8 12 16 20 24 28 32 36
Reaction Time (cycle number)
Absorbance
Control 2 -‐ 650 umol/L
Control 1 -‐ 200 umol/L
Typical reaction curveson chemistry analyzers

13
9. GlycoGap® Performance Data on Hitachi 9179. GlycoGap® Performance Data on Hitachi 917
9.1 Method Comparison
To demonstrate accuracy, the Diazyme GSP (GlycoGap®) assay was tested with individual serum
samples in comparison to predicate device. To ensure the GSP concentrations were distributed across the reportable dynamic range, some serum samples used for the study were diluted with saline to targeted concentrations. The samples range from 55 µmol/L to 1300 µmol/L GSP. Total 65 (n = 65) samples were tested with both methods on Hitachi 917 in singlet. The GSP concentrations obtained with the Diazyme GSP Assay were plotted against that obtained with the Predicate GSP Assay.The GSP concentrations obtained with the Diazyme GSP Assay were also plotted against that obtained with the Predicate GSP Assay using MedCalc Software. The results are summarized below
0 200 400 600 800 1000 1200 1400PREDICATE
1400
1200
1000
800
600
400
200
0
NEW
0 200 400 600 800 1000 1200 1400
PREDICATE
20
0
-20
-40
-60
-80
-100
NE
W -
F(x)
9.2 Linearity
Nine levels of linearity set were prepared by diluting an altered
serum sample containing 1579 µmol/L GSP with saline according to Clinical and Laboratory Standards Institute (CLSI) EP6-A as follows:
Level 8: 0 µl saline + 200 µl of 1579 µmol/L GSPLevel 7: 25 µl saline + 175 µl of 1579 µmol/L GSPLevel 6: 50 µl saline + 150 µl of 1579 µmol/L GSPLevel 5: 75 µl saline + 125 µl of 1579 µmol/L GSPLevel 4: 100 µl saline + 100 µl of 1579 µmol/L GSPLevel 3: 125 µl saline + 75 µl of 1579 µmol/L GSPLevel 2: 150 µl saline + 50 µl of 1579 µmol/L GSPLevel 1: 175 µl saline + 25 µl of 1579 µmol/L GSPLevel 0: 200 µl saline + 0 µl of 1579 µmol/L GSP
Method Comparison studies of the Diazyme GlycoGap® versus with the Predicate Diazyme GSP Enzymatic Assay indicated excellent accuracy with a slope of 0.9542, intercept of 14.57 and a correlation coefficient of 0.9966.

9.3 Precision
The precision of Diazyme GlycoGap® was evaluated according to Clinical and
Laboratory Standards Institute (CLSI) EP5-A guideline. In the study, two controls and two levels of serum specimens containing 200, 750, 250 and 375 µmol/L GSP, respectively, were tested 2 runs per day in duplicates over 20 working days. The two levels of serum samples were purchased from a commercial source.
The results on HITACHI 917 were calculated using the software precision statistic template and summarized in the following tables:
For two GSP Controls and two levels of serum specimens, 20-day reproducibility data showed that the within-run imprecision was from 0.6% to 1.1% and the within-laboratory imprecision was from 0.7% to 1.3%.
9.2 Linearity (continued)
The linearity samples were tested with the Diazyme GlycoGap® in triplicate. The
linearity analysis was performed using EP Evaluator Version 8 Software. The results are summarized below.
The bias between expected and recovered GSP is less than 10% for the nine levels of linearity set ranging from 0 μmol/L to 1579 μmol/L GSP. The linearity data of GSP was analyzed with the EP evaluator software with allowable systematic error (Sea) of 3.5% and results showed that the assay is linear from 0.0 to 1578.7 μmol/L GSP. Analytical measurement range (AMR) of Diazyme GlycoGap® is 21.0 – 1354.0 µmol/L.
EP Evaluator GSPInstrument: Hitachi 917Research and Development -- Diazyme Laboratories
Assigned (umol/L)2,0001,5001,0005000-500
Mea
sure
d (u
mol
/L)
2,000
1,500
1,000
500
0
-500
1:1 Line Fitted Overall
Scatter Plot
Assigned (umol/L)2,0001,5001,0005000-500
Res
idua
l (um
ol/L
)
100
50
0
-50
-100
Residual Plot
Linearity
14
Within Run Precision (Sr)ControlLevel 1:
198 µmol/L GSP
Control Level 2:
750 µmol/L GSP
Serum Level 1:
241 µmol/L GSP
Serum Level 2:
375 µmol/L GSP
Number ofData Points 80 80 80 80
Mean 204 751 251 373
SD 2.15 4.91 1.94 2.41
CV% 1.1% 0.7% 0.8% 0.6%
Total Precision (ST)ControlLevel 1:
198 µmol/L GSP
Control Level 2:
750 µmol/L GSP
Serum Level 1:
241 µmol/L GSP
Serum Level 2:
375 µmol/L GSP
Number ofData Points 80 80 80 80
Mean 204 751 251 373
SD 2.39 5.59 3.18 3.75
CV% 1.2% 0.7% 1.3% 1.0%

15
9.4 Limit of Detection (LOD) and Limit of Quantitation (LOQ)
To calculate the limit of detection (LOD) of the GlycoGap®, five Low Samples were tested
with 4 replicates daily for three days.LOD = LOB + (1.645* SD of Low samples).
To calculate the LOQ of the GlycoGap®, five patient serum samples from commercial source were diluted with saline to targeted concentrations and tested with the Diazyme GSP reagent on the Hitachi 917. Each diluted serum sample was tested on five separate runs with eight replicates per run. EP Evaluator Version 8 software was used to estimate the LOQ.
The LOD was found to be 7.2 µmol/L.The LOQ was found to be 13.0 μmol/L.
9.5 Interferences
To determine the level of interference from the substances normally present in serum, the
Diazyme GSP Assay were used to test two serum samples with “low” and “high” GSP concentration spiked with various concentrations of substances following Clinical and Laboratory Standards Institute EP7-A “Interference Testing in Clinical Chemistry”: dose-response guidelines.The common serum interfering substances ascorbic acid, bilirubin, glucose, triglyceride, uric acid and hemoglobin showed no significant interference (≤ 10%) up to the concentrations summarized below.
Interference ConcentrationAscorbic Acid 5 mg/dL
Bilirubin 7.5 mg/dL
Bilirubin Conjugated 5 mg/dL
Triglyceride 2000 mg/dL
Glucose 2400 mg/dL
Uric Acid 35 mg/dL
Hemoglobin 200 mg/dL
9.6 Stability
Two lots of the GlycoGap® reagents were used for this study. The reagents from each lot
were kept in incubators at 37°C and 4°C. Two levels of GlycoGap® control samples and two serum samples were tested. At indicated times, the GlycoGap® kits were removed from storage and tested with the two levels of the GlycoGap® controls and two serum samples. The results are summarized in the following table:
Reagent Accelerated Stability (37°C)
[GSP] Lot #
Day
0 3 5 7 9 11
Control 1 198 µmol/l
Lot 1 217 224 227 224 229 227
Lot 2 225 232 231 227 233 236
Control 2750 µmol/l
Lot 1 729 727 737 733 740 739
Lot 2 739 735 736 729 738 740
11556441261 µmol/l
Lot 1 254 255 254 252 260 254
Lot 2 251 247 246 247 246 244
11556424530 µmol/l
Lot 1 528 527 532 531 533 533
Lot 2 530 529 532 528 529 527
16
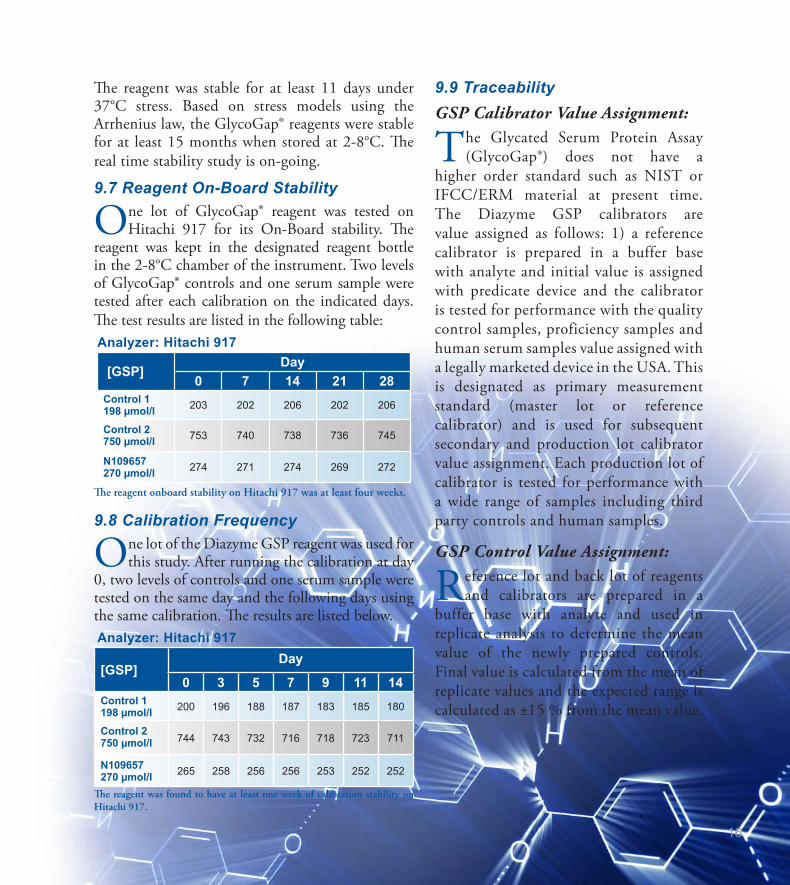
The reagent was stable for at least 11 days under 37°C stress. Based on stress models using the Arrhenius law, the GlycoGap® reagents were stable for at least 15 months when stored at 2-8°C. The real time stability study is on-going.
9.7 Reagent On-Board Stability
One lot of GlycoGap® reagent was tested on Hitachi 917 for its On-Board stability. The
reagent was kept in the designated reagent bottle in the 2-8°C chamber of the instrument. Two levels of GlycoGap® controls and one serum sample were tested after each calibration on the indicated days. The test results are listed in the following table: Analyzer: Hitachi 917
[GSP]Day
0 7 14 21 28Control 1198 µmol/l 203 202 206 202 206
Control 2750 µmol/l 753 740 738 736 745
N109657270 µmol/l 274 271 274 269 272
The reagent onboard stability on Hitachi 917 was at least four weeks.
9.8 Calibration Frequency
One lot of the Diazyme GSP reagent was used for this study. After running the calibration at day
0, two levels of controls and one serum sample were tested on the same day and the following days using the same calibration. The results are listed below. Analyzer: Hitachi 917
[GSP]Day
0 3 5 7 9 11 14Control 1 198 µmol/l 200 196 188 187 183 185 180
Control 2 750 µmol/l 744 743 732 716 718 723 711
N109657 270 µmol/l 265 258 256 256 253 252 252
The reagent was found to have at least one week of calibration stability on Hitachi 917.
9.9 TraceabilityGSP Calibrator Value Assignment:
The Glycated Serum Protein Assay (GlycoGap®) does not have a
higher order standard such as NIST or IFCC/ERM material at present time. The Diazyme GSP calibrators are value assigned as follows: 1) a reference calibrator is prepared in a buffer base with analyte and initial value is assigned with predicate device and the calibrator is tested for performance with the quality control samples, proficiency samples and human serum samples value assigned with a legally marketed device in the USA. This is designated as primary measurement standard (master lot or reference calibrator) and is used for subsequent secondary and production lot calibrator value assignment. Each production lot of calibrator is tested for performance with a wide range of samples including third party controls and human samples.
GSP Control Value Assignment:
Reference lot and back lot of reagents and calibrators are prepared in a
buffer base with analyte and used in replicate analysis to determine the mean value of the newly prepared controls. Final value is calculated from the mean of replicate values and the expected range is calculated as ±15 % from the mean value.

17
10. Sample Type10. Sample Type
Serum is the originally approved sample type for Diazyme GSP (GlycoGap®) assay. EDTA plasma samples were internally validated to have no matrix effect in comparison with
serum samples. Serum should be separated from cells immediately after blood collection. Samples can be stored at 2-8°C for 2 weeks or at -20°C for up to 4 weeks.
Adults (19-65 years) have a reported normal range of 151-300 µmol/L (Abidin D An Improved Enzymatic Assay for Glycated Serum Protein. Anal. Methods 2013; 5: 2461-
2469). It is recommended that each laboratory establish its own reference range to reflect the age, sex, diet and geographical location of the population.
11. Reference Range
12. Glycated Serum Protein (GSP) vs Glycated Albumin (GA)
11. Reference Range
12. Glycated Serum Protein (GSP) vs Glycated Albumin (GA)
Serum albumin is the most abundant plasma protein in human. Though albumin protein accounts for 55-60% of total serum protein, glycated albumin accounts for 80% of total
glycated serum protein (Schlelcher E.D. et al. Clin. Chem. 34. 320-323, 1988). Glycated serum protein (GSP) levels in serum are present proportionally to the levels of Glycated Albumin (GA). The relationship between GSP and GA can be expressed as GSP = GA + C (a constant factor). As shown in the figure below (from Clin. Chem. 34.320-323, 1988), GSP and GA are presented in two parallel lines. Therefore, determination of GSP is equivalent to the determination of GA which can be obtained from GSP value by including a factor in the calculation.
18
13. Ratio of Glycated Albumin over Total Albumin to Report as GA%13. Ratio of Glycated Albumin over Total Albumin to Report as GA%
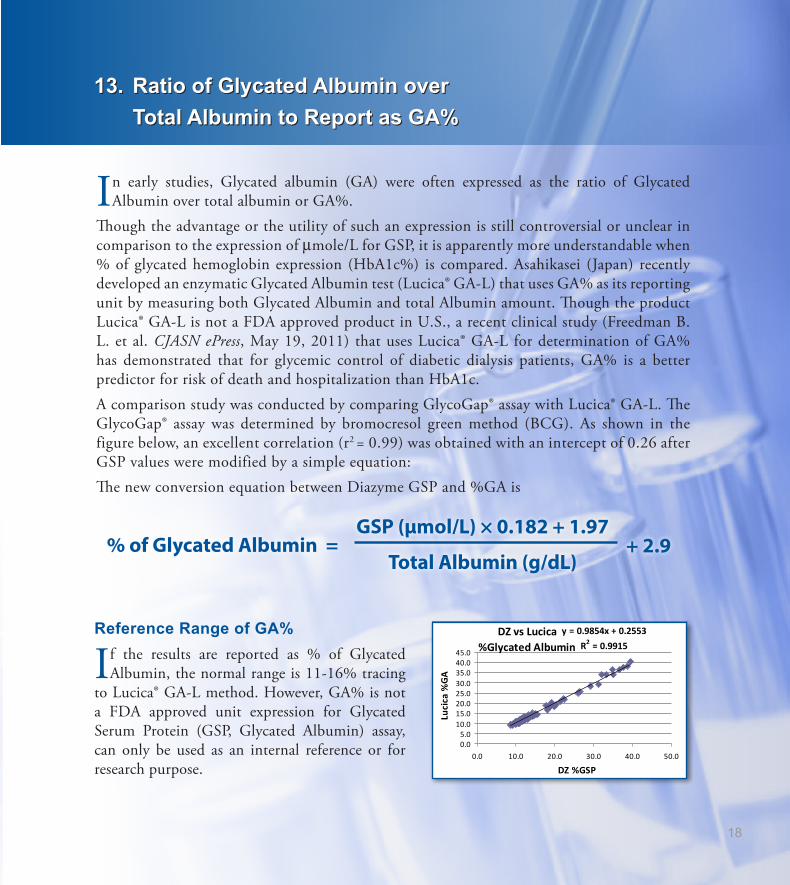
In early studies, Glycated albumin (GA) were often expressed as the ratio of Glycated Albumin over total albumin or GA%.
Though the advantage or the utility of such an expression is still controversial or unclear in comparison to the expression of μmole/L for GSP, it is apparently more understandable when % of glycated hemoglobin expression (HbA1c%) is compared. Asahikasei (Japan) recently developed an enzymatic Glycated Albumin test (Lucica® GA-L) that uses GA% as its reporting unit by measuring both Glycated Albumin and total Albumin amount. Though the product Lucica® GA-L is not a FDA approved product in U.S., a recent clinical study (Freedman B. L. et al. CJASN ePress, May 19, 2011) that uses Lucica® GA-L for determination of GA% has demonstrated that for glycemic control of diabetic dialysis patients, GA% is a better predictor for risk of death and hospitalization than HbA1c. A comparison study was conducted by comparing GlycoGap® assay with Lucica® GA-L. The GlycoGap® assay was determined by bromocresol green method (BCG). As shown in the figure below, an excellent correlation (r2 = 0.99) was obtained with an intercept of 0.26 after GSP values were modified by a simple equation:The new conversion equation between Diazyme GSP and %GA is
GSP (μmol/L) × 0.182 + 1.97
Total Albumin (g/dL)% of Glycated Albumin = + 2.9
Reference Range of GA%
If the results are reported as % of Glycated Albumin, the normal range is 11-16% tracing
to Lucica® GA-L method. However, GA% is not a FDA approved unit expression for Glycated Serum Protein (GSP, Glycated Albumin) assay, can only be used as an internal reference or for research purpose.
DZ vs Lucica %Glycated Albumin
y = 0.9854x + 0.2553R2 = 0.9915
0.05.0
10.015.020.025.030.035.040.045.0
0.0 10.0 20.0 30.0 40.0 50.0
DZ %GSP
Lucica %GA

19
14. Fructosamine NBT Assay14. Fructosamine NBT Assay
Fructosamine is a compound that can be considered the result of a reaction between sugar (fructose and glucose) and ammonia or an amine (with a molecule of water being released
through a non-enzymatic reaction known as Mailard reaction). Fructosamine is also formed when carbonyl group of glucose reacts with an amino group of a protein such as hemoglobin and albumin Traditionally, Fructosamines formed with serum proteins such as albumin are called Glycated Serum Protein (GSP), and are measured by a colorimetric method that utilizes the reducing ability of Amadori compounds (Fructosamine) to reduce nitroblue tetrazolium (NBT) to tetrazinolyl radical NBT+, which disproportionates to yield a highly colored formazan dye (MF+) under alkaline condition. The reaction mechanism of Fructosamine with NBT molecule is depicted in the following figure. However, this reaction was found to be not specific for Fructosamine. NBT reacts with various endogenous substances of reducing activity such as thiol groups, NADH, and ascorbate. In fact, studies showed that only about half of the reducing activity (Fructosamine) was due to specific non-enzymatic glycation of proteins, and the remaining unspecific activity varied from serum to serum. The non-specific activity was not reducible with NaBH4 and was independent of glycation of albumin (Schieicher ED. Clin. Chem. 342: 320-323, 1988). The NBT based Fructosamine assay is therefore of limited specificity for the exact measurement of glycated proteins in serum. Recently, it was reported that the interfering substances in the NBT assay can be minimized if the assay is given a 10-15 minute pre-incubation. Though this approach may improve the assay to some extent, it may not be applicable to some commonly used clinical chemistry analyzers which are often not flexible in changing incubation times. On the other hand, the GlycoGap® measures true Fructosamine enzymatically, and its specificity is guaranteed by the high specificity of the Fructosaminase™ enzyme used in the assay. The assay is not interfered by endogenous reducing substances, provides accurate measurement for Glycated Serum Protein (GSP, Glycated Albumin) in human serum or plasma samples. Therefore, the GlycoGap® assay is significantly different from NBT method in Fructosamine determination, it is more an improved version of GlyPro® in terms of formulation format (powder vs liquid) and enzyme specificity (ketoamine oxidase vs Fructosaminase).
CH2NHRC
CH
HC
HC OH
OH
O
H2C OH
HO
CH2NHRHC
CH
HC
HC OH
OH
H2C OH
HO
OH
NBT[ox] NBT[red]
Oxidized productsOH
CH2NHRC
CH
HC
HC OH
OH
O
H2C OH
HO
CH2NHRHC
CH
HC
HC OH
OH
H2C OH
HO
OH
NBT[yellow] NBT[purple]
Oxidized productsOH

15. Summary
20
15. Summary
Diazyme’s Glycated Serum Protein (GSP, Glycated Albumin) assay is an FDA approved, CE marked product designed specifically for the determination of Glycated Serum
Protein (GSP, Fructosamine, Glycated Albumin) in human serum samples. Diazyme GSP (GlycoGap®) uses 2-part, liquid stable reagents, and is user friendly designed for use on many commonly used clinical chemistry analyzers.GlycoGap® is not a replacement for HbA1c assay, but rather is a complementary assay to HbA1c for improved quality in diagnosing diabetes and monitoring glycemic control, especially for those patients whose HbA1c levels do not truly reflect the mean blood glucose levels or those with glycation gap. GlycoGap® provides a picture of past 2-week average blood glucose levels, and is a short to medium term index for glycemic control. GlycoGap® is especially useful in the management of various diabetic conditions such as diabetic pregnancy, dialysis diabetic patients, and diet or medication adjustment. GlycoGap® bridges the gap between blood glucose test (a transient index) and HbA1c test (a long-term index), and provides a complementary and unique system to the existing methods for glycemic control. A small improvement in glycemic control may lead to a significant improvement in the quality of life of diabetes, and to a huge reduction of economic burdens currently imposed on the families of diabetes and on the healthcare systems of all nations.

21
16. References16. References
David B. Sacks et al. Gaps in the Glycation Gap hypothesis. Clinical Chemistry, 57:2, 150-152, 2011Santiago Rodriguez-Segade et al. Progression of Nephropathy in Type 2 Diabetes: The Glycation Gap Is a Significant Predictor after Adjustment for Glycohemoglobin (HbA1c). Clinical Chemistry, 57-2, 264-271, 2011Robert M. Cohen et al. Discordance Between HbA1c and Fructosamine, Evidence for a glycosylation gap and its relation to diabetic nephropathy. Daibetes Care, 26; 163-167, 2003Barry I Freeman et al. Glycated Albumin and Risk of Death and Hospitalizations in Diabetic Dialysis Patients. Clinical Journal of American Society of Nephrology, 6; 1-9, 2011TP Peacock et al. Comparison of glycated albumin and hemoglobin A1c levels in diabetic subjects on hemodialysis. Kidney International, 73: 1062-1068, 2008R. Schleicher and O.H Wieland Protein Glycation: Measurement and Clinical Relevance. J. Clin. Chem. Clin. Biochem. 27: 577-587, 1989Williams R. The burden of diabetes in the next millenium. Diabetes Reviews International 1998;7:21-3.King H, Aubert RE, Herman WH. Global burden of diabetes, 1995-2025. Prevalence, numerical estimates, and projections. Diabetes Care 1998;21:1414-31.American Diabetes Association. Report of the expert committee on the diagnosis and classification of diabetes mellitus. Diabetes Care 1997;20:1183-201.Gale E. New diagnostic criteria for diabetes mellitus. A guide for the perplexed. CPD Bulletin Clin Biochem 1999;1:36-8.Gomez-Perez FJ, Aguilar-Salinas CA, Lopez-Alvarenga JC, Perez-Jauregui J, Guillen-Pineda LE, Rull JA. Lack of agreement between the World Health Organization category of impaired glucose tolerance and the American Diabetes Association category of impaired fasting glucose. Diabetes Care 1998;21:1866-8.Sacks DB. Implications of the revised criteria for diagnosis and classification of diabetes mellitus. Clin Chem 1997;43:2230-2.Alberti KG, Zimmet PZ for the WHO Consultation. Definition, diagnosis and classification of diabetes mellitus and its complications. Part 1: diagnosis and classification of diabetes mellitus provisional report of a WHO consultation. Diabet Med 1998;15:539-53.Day JF, Thorpe SR, Baynes JW. Nonenzymatically glucosylated albumin. In vitro preparation and isolation from normal human serum. J Biol Chem 1979;254:595-7Diabetes Control and Complications Trial Research Group. The effect of intensive treatment of diabetes on the development and progression of long-term complications of insulin-dependent diabetes mellitus. New Eng J Med 1993;329:977-86.UK Prospective Diabetes Study Group. Intensive bloodglucose control with sulphonylureas or insulin compared with conventional treatment and risk of complications in patients with type 2 diabetes (UKPDS 33). Lancet 1998; 352:837-53Atkinson MA, Maclaren NK. Mechanisms of disease: the pathogenesis of insulin-dependent diabetes mellitus. New Eng J Med 1994;331:1428-36European IDDM Policy Group 1993. Consensus guidelines for the management of insulin-dependent (Type 1) diabetes. Diabet Med 1993;10:990-1005Edelman SV. Type II diabetes mellitus. Adv Intern Med 1998;43:449-500UKPDS 26: Sulfonylurea failure in non-insulin dependent diabetic patients over 6 years. UK Prospective Diabetes Study Group. Diabet Med 1998;15:297-303American Diabetes Association. Gestational diabetes mellitus: Clinical practice recommendations 1999. Diabetes Care 1999; 22 Supplement 1:S74.
22
Magee MS, Walden CE, Benedetti TJ, Knopp MD. Influence of diagnostic criteria on the incidence of gestational diabetes and perinatal morbidity. JAMA 1993;269:609-15.Dornhurst A, Rossi M. Risk and prevention of Type 2 diabetes in women with gestational diabetes. Diabetes Care 1998;21(Suppl 2):B43-9.Williams CB, Iqbal S, Zawacki CM, Yu D, Brown MB, Herman WH. Effect of selective screening for gestational diabetes. Diabetes Care 1999;22:418-21.Goldstein DE, Little RR, Wiedmeyer H-M, England JD, McKenzie EM. Glycated hemoglobin: methodologies and clinical applications. Clin Chem 1986;32(Suppl): B64-70.Weykamp CW, Penders TJ, Muskiet FAJ, van der Slik W. Influence of hemoglobin variants and derivatives on glycohemoglobin determinations, as investigated by 102 laboratories using 16 methods. Clin Chem 1993;39:1717-23.Benjamin RJ, Sacks DB. Glycated protein update: implications of recent studies, including the Diabetes Control and Complications Trial. Clin Chem 1994;40:683-7.Rahlenbeck IS, Monitoring diabetic control in developing countries: a review of glycated haemoglobin and fructosamine assays. Tropical Doctor 1998;28:9-15.Armbruster DA. Fructosamine: structure, analysis, and clinical usefulness. Clin Chem 1987;33:2153-63.Nathan DM. The pathophysiology of diabetic complications: how much does the glucose hypothesis explain? Ann Intern Med 1996;124:86-9.Nathan DM. et al. Translating the A1c Assay Into Estimated Average Glucose Values. Diabetes Care, 2008, 31: 1473-1478,Wu JT. Advanced glycosylation end products: a new disease marker for diabetes and aging. J Clin Lab Anal 1993;7:252-5.Santiago JV. Overview of the complications of diabetes. Clin Chem 1986;32(Suppl):B46-53.Bloomgarden ZT. Nephropathy and retinopathy, American Diabetes Association Annual Meeting 1998. Diabetes Care 1999;22:640-8.Goyder E, Irwig L. Screening for diabetes: what are we really doing? BMJ 1998;317:1644-6.Schleicher E and Wieland OH. Specific Quantification by HPLC of protein (Lysine) Bound Glucose in Human Serum Albumin and Other Glycosylated Proteins. J Clin Chem Clin Biochem 1981;19:81-7.Johnson RN, Metcalf PA, Baker JR. Fructosamine: a new approach to the estimation of serum glycosylprotein. An index of diabetic control. Clin Chim Acta 1982;127:87-95.Jones AF, Winkles JW, Thornalley PJ, Lunec J, Jennings PE, Barnett AH. Inhibitory effect of superoxide dismutase on fructosamine assay. Clin Chem 1987;33:147-9.Baker JR, Zyzak DV, Thorpe SR, Baynes JW. Chemistry of the fructosamine assay: D-glucosone is the product of oxidation of Amadori compounds. Clin Chem 1994;40:1950-5.Vogt BW. Development of an improved fructosamine test. In Fructosamine Workshop Report, Boehringer Mannheim 1989 pp21-29.Schleicher ED, Mayer R, Wagner EM, Gerbitz KD. Is Serum Fructosamine Assay Specific for Determination of Glycated Serum Protein? Clin Chem 1988;34:320-3.Kricka LJ, Gregoire T, Dumont L, Wilding P. Interference-Free method for Glycated Proteins in Serum and Whole Blood,Torrens DJ, Shipley DP, Holdridge MB, Lane SR, Kallwass H. Calibration of the Genzyme GlyPro® method for the specific enzymatic measurement of glycated protein. Proc ACB National Meeting 1998:63.Abidin D. et al. An Improved Enzymatic Assay for Glycated Serum Protein. Anal. Methods 2013;5: 2461-2469.

MK064 Rev. HD-039 (5/15)
12889 Gregg Court Poway, CA 92064
Tel: 858-455-4768 858-455-4754Fax: 858-455-3701
Shanghai Diazyme Co., Ltd.Room 201, 1011 Halei Road Zhangjiang Hi-tech Park Shanghai, 201203 People’s Republic of China
Tel: 086-21-51320668Fax: 086-21-51320663
Diazyme Europe GmbHZum Windkanal 21 01109 Dresden, Deutschland
Tel: +49 (0) 351 886 3300Fax: +49 (0) 351 886 3366
Diazyme LaboratoriesA Life Science Division of General Atomics
Diazyme Laboratories