the project for rural road network planning in …
TRANSCRIPT

E I DJ R
12-009
THE PROJECT FOR
RURAL ROAD NETWORK PLANNING IN
NORTHERN UGANDA
FINAL REPORT
VOLUME 1: SUMMARY
FEBRUARY 2012
JAPAN INTERNATIONAL COOPERATION AGENCY
ORIENTAL CONSULTANTS CO., LTD. EIGHT-JAPAN ENGINEERING CONSULTANTS INC.
INTERNATIONAL DEVELOPMENT CENTER OF JAPAN
MINISTRY OF WORKS AND TRANSPORT (MOWT)THE REPUBLIC OF UGANDA

The exchange rates applied in this Study are:
US$ 1.00 = Ushs.* 1,947.9 = Japanese Yen 96.27
(Average exchange rate between October 2009 and March 2010)
* Ushs.: Uganda Shillings

SOUTH
Nwoya
Gulu
Lamwo
Kitgum
Pader Agago
AcholiSub-region
Amuru
REPUBLIC OF UGANDA
UGANDA
Kampala
■Area 241 thousand km2 ■GNI per capita US$ 460 (2009, WB)
■Population 32.7 million (2009,WB) ■Economic Growth
7.0% (2009, WB)
■Capital Kampala (with a population of 1.2 million in
2002)
■Ethnic
Groups
Buganda, Langi, Acholi etc.
■Major
Economic
Sectors
[Agriculture] Fish, Coffee, Tea, Cotton [Mining] Copper, Mineral Phosphate, Tungsten
[Industry] Textiles, Tobacco, Cement
■Language English, Swahili, Luganda, etc
■Religion Christian (60%), Traditional Belief (30%),
Muslim (10%)
■Currency Uganda Shilling (UGX)
Location Map of Study Area

Project for Rural Road Network Planning in Northern Uganda Final Report Vol.1: SUMMARY
Outline of the Project
1. Country: Republic of Uganda
2. Project Name: Project for Rural Road Network Planning in Northern Uganda
3. Execution Agency: Ministry of Works and Transport (MoWT)
4. Study Objective: The overall goal of the Study is to accelerate the IDPs’ return and resettlement process through establishing the Master Plan of rural road network with the target year of 2018; hence enhancing the regional development in Northern Uganda.
5. Study Contents:
1) Present Social Situation Survey
To comprehend rural development issues through SWOT analysis based on a social situation survey and socio-economic framework of Amuru and Nwoya districts.
2) Current Road Condition Survey
To comprehend road operation and maintenance issues and future traffic demands in Acholi Sub-region through traffic and road inventory surveys.
3) Establishing Rural Road Network Master Plan
To propose a Road Network Plan for Amuru and Nwoya districts using functional classifications based on various aspects of needs and roles of the rural roads. To select priority projects and to estimate the project
costs considering budget restrictions of the Ugandan side.
4) Implementation of Pilot Project
To construct two bridges on the Aswa river by which the study area is divided into north and south parts. To monitor the effect of the project on the IDP return and resettlement process.
5) Planning and Preparation of Urgent Projects
To select and prepare for urgent projects in Acholi Sub-region under the scheme of Japanese Grant Aid for Peace Building.
6) Technical Transfer
To implement technical transfer of Road Network Master Planning and Road Operation and Maintenance Planning to district engineers. To implement technical transfer of GIS to district and MoWT engineers in order to enhance sustainability of Road Network Master Planning.
6. Study Results and Recommendations
(1) Study Results
1) Priority Projects were selected based on weight parameters for “cost efficiency oriented evaluation” and “social impact oriented evaluation” among the rural road sections in Amuru and Nwoya districts.
2) Considering budget restrictions for improvement of national and district roads, high priority projects, which have both cost efficiency and social impact, are selected from priority projects.
3) Considering the difference of maintenance cost between before and after road improvement, options of intervention for road improvement are proposed with those annual disbursements.
4) The full improvement of high priority projects can not be economically feasible with the estimated future traffic demands, however there are various unquantifiable social impacts generated from the project.
5) IDPs’ return process was accelerated because closure of IDP camps was politically promoted during the construction stage of the Pilot Project. Therefore, it was difficult to confirm the effect of IDP return by the bridges.
6) A total of 6 projects are selected as the urgent projects in Acholi Sub-region based on the effect of IDP return and resettlement, urgency and necessity, benefits and existence of land issues.
(2) Recommendations
1) Although the proposed methodology of network planning can be applicable to the whole Acholi Sub-region, the detailed procedures of the proposed method shall be properly modified when it is applied for the wider area.
2) Although the effect of Pilot Project will be monitored for just one year after the bridge completion (it will be in the rainy season), it is recommended to monitor in the dry season also in order to comprehend the seasonal variation of traffic passing the bridges.
3) Although the IDPs’ returning process was accelerated by the closure of IDP camps, it is recommended to study continuous implementation of urgent projects because the necessity of improvement of social infrastructure and its access roads in rural areas is increasing after the returnees’ resettlement.
Project for Rural Road Network Planning in Northern Uganda Final Report Vol.1: SUMMARY
THE PROJECT FOR
RURAL ROAD NETWORK PLANNING IN
NORTHERN UGANDA
FINAL REPORT VOL. 1: SUMMARY
LOCATION MAP OF STUDY AREA
OUTLINE OF THE PROJECT
TABLE OF CONTENTS
LIST OF FIGURES AND TABLES
ABBREVIATIONS
- TABLE OF CONTENTS - Page
1. INTRODUCTION ........................................................................................................................S-1
PART 1: RURAL ROAD MASTER PLANNING IN AMURU AND NWOYA DISTRICTS
2. REGIONAL CONTEXT: NORTHERN UGANDA AND ACHOLI SUB-REGION..................S-1
3. PRESENT SITUATION OF AMURU AND NWOYA DISTRICTS ..........................................S-3
4. REVIEW OF EXISTING DEVELOPMENT PLANS .................................................................S-5
5. DEVELOPMENT POTENTIAL AND ISSUES OF AMURU AND NWOYA DISTRICTS .....S-7
6. SOCIOECONOMIC FRAMEWORK OF AMURU AND NWOYA DISTRICTS .....................S-8
7. REGIONAL DEVELOPMENT AND RURAL ROAD DEVELOPMENT IN AMURU AND
NWOYA DISTRICTS ..................................................................................................................S-9
8. PRESENT SYSTEM OF ROAD ADMINISTRATION AND ROAD MAINTENANCE.........S-10
9. PRESENT SITUATION OF ROAD TRAFFIC AND TRANSPORT IN AMURU DISTRICTS-11
10. PRESENT SITUATION OF ROAD TRAFFIC AND TRANSPORT IN AMURU AND
NWOYA DISTRICTS ................................................................................................................S-13
11. PRESENT SITUATION AND ISSUES OF THE ROAD NETWORK AND CONDITIONS
IN AMURU AND NWOYA DISTRICTS .................................................................................S-13
12. TRAFFIC DEMAND FORECAST ............................................................................................S-16
i

13. OBJECTIVES AND BASIC STRATEGIES FOR RURAL ROAD IMPROVEMENT AND
MAINTENANCE .......................................................................................................................S-16
14. RURAL ROAD NETWORK PLANNING ................................................................................S-18
15. SELECTION OF HIGH PRIORITY PROJECTS ......................................................................S-21
16. RURAL ROAD MAINTENANCE PLANNING .......................................................................S-25
17. RURAL ROAD IMPROVEMENT AND MAINTENANCE PLAN BY 2018..........................S-27
18. PROJECT EVALUATION FOR SELECTED HIGH PRIORITY PROJECTS.........................S-29
19. TECHNICAL TRANSFER TO AMURU AND NWOYA DISTRICTS ...................................S-30
20. TECHNICAL TRANSFER TO MOWT.....................................................................................S-31
PART 2: PREPARATION AND IMPLEMENTATION OF PILOT PROJECT
21. OBJECTIVE AND SCOPE OF THE PILOT PROJECT ...........................................................S-32
22. BASIC PLAN .............................................................................................................................S-33
23. BID CONDITIONS AND RESULT OF BIDDING...................................................................S-34
24. IMPLEMENTATION PLAN......................................................................................................S-35
25. BASELINE SURVEY ................................................................................................................S-36
26. EVALUATION OF PILOT PROJECT ......................................................................................S-37
PART 3: PLANNING AND PREPARATION OF URGENT PROJECT
IN ACHOLI SUB-REGION
27. BACKGROUND OF THE URGENT PROJECT.......................................................................S-41
28. CONTENTS OF THE PROJECT ...............................................................................................S-42
29. PROJECT EVALUATION AND RECOMMENDATIONS......................................................S-44
ii

Project for Rural Road Network Planning in Northern Uganda Final Report Vol.1: SUMMARY
- LIST OF TABLES -
Table 2.1 Population Movement in IDP Camps in Acholi Sub-region............................................ S-2 Table 6.1 Summary Result of Population Projections in Amuru and Nwoya
Districts ........................................................................................................................... S-9 Table 7.1 Vision, Mission, Goal and Objective of Former Amuru District..................................... S-9 Table 8.1 Shares of Works and Transport Sector in State Budgets of Uganda.............................. S-11 Table 9.1 DUCARIP Budget for Districts in Acholi Sub-region (Proposed in
Final Draft) .................................................................................................................... S-12 Table 12.1 Traffic Assignment Cases .............................................................................................. S-16 Table 14.1 Proposed Method of Using Existing Two Systems of Functional Road
Classification in an Integrated Manner.......................................................................... S-20 Table 14.2 Classes for Current Service Level of Roads.................................................................. S-21 Table 14.3 Classes for Service Level of Roads in Future Road Network Plans.............................. S-21 Table 15.1 Weights of Evaluation Parameters................................................................................. S-22 Table 15.2 List of High Priority Projects ........................................................................................ S-24 Table 16.1 Equipment Provided to District and Its Operation Costs .............................................. S-25 Table 16.2 Method and Responsible Organizations for road maintenance ..................................... S-26 Table 16.3 Capacity Required of District Officer ........................................................................... S-26 Table 17.1 Six Options of Intervention for Road Improvement...................................................... S-27 Table 17.2 Project Cost and Annual Disbursement Required by Type of
Intervention ................................................................................................................... S-28 Table 17.3 Road Length Improved/Rehabilitated by Type of Intervention..................................... S-28 Table 18.1 Summary Result of Economic Analysis ........................................................................ S-29 Table 18.2 Summary Result of Economic Analysis (Reduced Project Cost Case) ......................... S-30 Table 23.1 Bid Opening and Evaluation Schedule for Lot 1 and Lot 2 .......................................... S-34 Table 25.1 Contents of the OD survey ............................................................................................ S-36 Table 25.2 Outline of the Community Interview Survey ................................................................ S-36 Table 26.1 Contents of OD survey .................................................................................................. S-37 Table 28.1 Specifications of the Proposed Roads and Bridges ....................................................... S-43 Table 29.1 Traffic Assignment Cases .............................................................................................. S-44 Table 29.2 Assignment Results ....................................................................................................... S-45
iii

- LIST OF FIGURES -
Figure 3.1 Average Rainfall in Gulu 1980-2008............................................................................... S-3 Figure 3.2 Local Government Hierarchy ..........................................................................................S-4 Figure 14.1 General Flow of Rural Road Network Planning ........................................................... S-19 Figure 14.2 Road Network Plan with Functional Road Classes ....................................................... S-20 Figure 15.1 Procedure for Project Selection ..................................................................................... S-22 Figure 15.2 Priority Projects ............................................................................................................. S-23 Figure 15.3 Location Map of High Priority Projects and Second Priority Projects.......................... S-24 Figure 21.1 Location of the Pilot Project.......................................................................................... S-32 Figure 24.1 Construction Schedule for Pilot Project ........................................................................ S-35 Figure 27.1 Locations of the Requested Bridges .............................................................................. S-41 Figure 28.1 Location of High Priority Projects.................................................................................S-42 Figure 28.2 The Flow of the Construction and Procurement by Procurement
Agency........................................................................................................................... S-44
iv

Project for Rural Road Network Planning in Northern Uganda Final Report Vol.1: SUMMARY
- ABBREVIATIONS -
B B/C Cost Benefit Ratio BS British Standards C CAD Computer Aided Design CAO Chief Administrative Officer CAP Community Action Plan CAR Community Access Road D DANIDA Danish International Development Agency DBST Double Bitumineux Surface Treatment DDP District Development Plan DED German Development Service DFID Department for International Development DR District Road DSC District Service Commission DUCAR District, Urban and Community Access Roads DUCARIP The 10-year District, Urban and Community Access Roads Investment Plan E EC European Commission EIA Environmental Impact Assessment EIRR Economic Internal Rate of Return E/N Exchange of Notes EU Europe Union G GIS Geographic Information System GKMA The Greater Kampala Metropolitan Area GPS Global Positioning System H HC Health Centre HDI Human Development Index HPI Human Poverty Index I IATC Inter-Agency Technical Committee IDP Internally Displaced Person J JCT Junction JICA Japan International Cooperation Agency JICS Japan International Cooperation System L LBT Labour Based Technology LRA Lord’s Resistance Army M MoWT Ministry of Works and Transport N NDP 5-year National Development Plan for Uganda NEMA National Environment Management Authority NGO Non-Governmental Organizations NPV Net Present Value NR National Road NTMP National Transport Master Plan NUDEIL Northern Uganda Development of Enhanced Local Governance Infrastructure
and Livelihoods NUREP Northern Uganda Rehabilitation Programme NUSAF Northern Uganda Social Action Fund NUTI Northern Uganda Transition Initiative O OD Origin and Destination OPM Office of Prime Minister P PCU Passenger Car Unit PEAP Poverty Eradication Action Plan PRDP Peace, Recovery and Development Plan for Northern Uganda
v

vi
Q QPRS Quarterly Progress Reporting System R RAMPS Rehabilitation and Maintenance Planning System RC Reinforced Concrete RSDP Road Sector Development Programme S SPRING Stability, Peace and Reconciliation in Northern Uganda SWOT Strengths, Weaknesses, Opportunities and Threats U UBOS Uganda Bureau of Statistics UN United Nations UNDP United Nations Development Programme UNHCR United Nations High Commissioner for Refugees UNOCHA United Nations, Office for the Coordination of Humanitarian Affairs UNRA Uganda National Road Authority USAID United States Agency for International Development USD United States Dollar Ushs. Uganda shillings W WB World Bank

Project for Rural Road Network Planning in Northern Uganda Final Report Vol.1: SUMMARY
SUMMARY
1. INTRODUCTION
Northern Uganda has the largest proportion of people living in poverty in the country, estimated at 61 % of the region’s population, or almost twice the national level, despite having rich arable land suitable for rice, beans, millet, maize and cotton production. This high level of poverty can be attributed to the Lord's Resistance Army (LRA) insurgency. During the 20 year-conflict that began in the 1980s, much of the basic social infrastructure was destroyed or abandoned, and the local government became non-functional in the region. In particular, 90 % of the population were internally displaced (IDP: Internally Displaced Persons) from the Acholi Sub-region.
Since the cease-fire agreement concluded between LRA and the Government of Uganda in August 2006, the Government of Uganda has emphasized and facilitated the return process of IDPs. However, many challenges still remain in the process since houses and social infrastructure such as roads, water wells and health centres had been destroyed significantly during the conflict and also since there is a high unemployment rate.
The overall goal of the Study is to accelerate the IDPs’ return process and to improve the livelihood of people who will/have return(ed) to their original home areas; hence enhancing the regional development in Northern Uganda. In order to achieve this, the Master Plan of rural road network in Amuru and Nwoya Districts, with the target year of 2018, shall be established, in full consideration of the socio-economic conditions, development potential and traffic demand in the region. This Master Plan is expected to provide mid-term guidance for the road maintenance, rehabilitation and upgrading plans in Amuru and Nwoya Districts. Although the focus of the Study is limited to these districts, the method and techniques explored in this Study will be extended to the wider Acholi Sub-region in Northern Uganda.
The project for Rural Road Network Planning in Northern Uganda has the following three components:
Part 1: Rural Road Master Planning in Amuru and Nwoya Districts
Part 2: Preparation and Implementation of Pilot Project
Part 3: Planning and Preparation of Urgent Projects in Acholi Sub-Region
PART 1: RURAL ROAD MASTER PLANNING IN AMURU AND NWOYA DISTRICTS
2. REGIONAL CONTEXT: NORTHERN UGANDA AND ACHOLI SUB-REGION
Acholi Sub-region is bordered by Sudan and located in the central part of northern Uganda. To the west of it, the West Nile Sub-region is located across the Albert Nile. To the east lies Karamoja Sub-region. Lango Sub-region is located to the south of Acholi Sub-region.
In the 1970s, the former Acholi Province was divided into Gulu and Kitgum Districts.
In 2001, two counties of Kitgum District were separated off and a new district, Pader District, was created. In July 2006, Kilak and Nwoya Counties of Gulu District were curved out and became Amuru District. Furthermore, Lamwo County of Kitgum District was upgraded to a new district in early 2010. Nwoya County of Amuru District and Agago County of Pader
SUMMARY-1

SUMMARY-2
District were also upgraded to new districts in July 2010. As a result, at present, Acholi Sub-region is composed of seven districts.
During the insurgency in Northern Uganda, 120 IDP camps were created in Acholi Sub-region i.e. in Amuru District (including Nwoya District), Gulu District, Kitgum District (including Lamwo District) and Pader District (including Agago District) which accommodated 1.3 million IDPs .
However, compared to the original population of IDP camps in 2005, 86% of the people who used to live in IDP camps have already moved out of the IDP camps to relocate to their home villages or areas closer to their home villages, including transit sites. By August, 2009 about 184,000 people still lived in 120 IDP camps in Acholi Sub-region. Comparing the figures among the districts, Gulu District has the highest percentage with 91% of the people having moved out of the camps already. On the other hand, 80% of the people who lived in the camps moved out of them in Amuru and Nwoya Districts.
In accordance with the monitoring done by UNHCR, the population of IDPs who still remained in the IDP camps was about 76,800 in May 2010. This means that 94% of the 2006 registered population of IDPs had moved out of the IDP camps in Acholi Sub-region by May, 2010.
The population movement of IDP camps in Acholi Sub-region is shown in Table 2.1.
Table 2.1 Population Movement in IDP Camps in Acholi Sub-region
District
Number of IDP Camps Aug. 2009
Population in IDP Camps Dec. 2005
Registered Population in IDP Camps
2006
Population in IDP Camps
Aug. 2009 (% of 2006 Registered
Population in IDP Camps)
Population in IDP Camps
May 2010 (% of 2006 Registered
Population in IDP Camps)
Amuru Nwoya
33 204,000 368,228 73,494 (20%) 36,404 (10%)
Gulu 31 257,000 320,232 22,699 (7%) 14,029 (4%) Kitgum Lamwo
25 310,000 319.936 48,534 (15%) 15,509 (5%)
Pader Agago
31 339,000 339,000 39,472 (12%) 10,894 (3%)
Total 120 1,110,000 1,347,396 184,199 (14%) 76,836 (6%) Source: UNHCR
The dominant economic activity in Acholi Sub-region is agriculture. Most of the people living in the sub-region are engaged in agriculture. Small scale subsistence farming is widespread and animal husbandry follows it in prominence. Fisheries, which are located along small rivers and streams, are not so prominent in Acholi Sub-region. Apiculture was recently introduced in some areas. Basically, lands in the sub-region are fertile. However, most of them are not utilised due to the prolonged conflict. People have started to go back to their home villages to restart farming.
Human Development Index (HDI) and Human Poverty Index (HPI) of each district for the year 2005 are shown in Table 2.2. HDI measures overall human progress in a more holistic manner with special emphasis on living a decent life and HPI measures deprivations in the three basic dimensions of the HDI, which are “a long and healthy life”, “knowledge”, and “a decent standard of living”1. HDIs and HPIs are the same for Gulu District and Amuru District
1 HDI is better if it is close to 1 and HPI is better if it is close to 0.

Project for Rural Road Network Planning in Northern Uganda Final Report Vol.1: SUMMARY
SUMMARY-3
(including Nwoya District) because they were the same district in 2005. Considering the situations of these three districts, both HDI and HPI for Gulu District would be much better if calculations were done singly for each of the 3 districts.
Table 2.2 Human Development Index (HDI) and Human Poverty Index (HPI) for Four Districts in Acholi Sub-region (2005)
District HDI HDI Rank (out of 76 districts)
HPI HPI Rank (out of 65 districts)
Gulu 0.430 70 32.2 41 Kitgum and Lamwo 0.439 69 30.7 35 Pader and Agago 0.469 66 32.9 45 Amuru and Nwoya 0.430 70 32.2 41 North 0.499 - - - Urban 0.663 - - - Rural 0.549 - - - Uganda 0.581 - 25.21 -
Source: UNDP Uganda2
3. PRESENT SITUATION OF AMURU AND NWOYA DISTRICTS
The total land area of Amuru and Nwoya Districts is about 9,022 sq. km which is 3.7 % of that of Uganda. The Albert Nile flows along the western border of these districts and the Victoria Nile flows along their southern borders. Within Amuru and Nwoya Districts, there are six major rivers, namely the Unyama River, the Ayugi River, the Omee River, the Aswa River, Tangi River and the Ayago River. These rivers are major obstacles to movement of people and goods, especially in the rainy season.
In Acholi sub-region, the altitude ranges between 600 – 1,200 m above sea level. The altitude of Western Rift Valley, including the western part of Amuru and Nwoya districts is relatively low and ranges between 600 – 800 m above sea level. In these areas, many wild animals live along the Albert Nile and the Victoria Nile. The climate of Amuru and Nwoya Districts is characterized by dry and rainy seasons. The rainy season in these districts is from April to October. However, the rainfall in Uganda, including northern Uganda, has been erratic since the early 1990s. The annual average rainfall in the last 15 years (1994 - 2009) was about 1,400 mm according to the Gulu meteorological station. During the rainy season, the average rainfall is 171 mm per month.
0
50
100
150
200
250
JAN FEB MAR APR MAY JUN JUL AUG SEP OCT NOV DEC
(mm/month)
Source: Department of Meteorology, Ministry of Water and Environment
Figure 3.1 Average Rainfall in Gulu 1980-2008
2 Uganda Human Development Report – Rediscovering Agriculture for Human Development, United Nations Development Programme (UNDP) Uganda

SUMMARY-4
Regarding the geographical distribution of main vegetation types in Amuru and Nwoya Districts, grassland savannah is predominant in the western part and northern part of the districts. Woodland savannah is more concentrated in the central and eastern parts of the district. Grassland savannah covers 37% of the total land, woodland savannah covers 37% and bush covers 12%.
In Uganda, the Local government, including Amuru and Nwoya Districts, is made up of five levels of hierarchy, i.e. from LC5 to LC1 as shown in Figure 3.2. The District Council is the highest decision-making body with fully-fledged legislative and executive powers. The District Chairperson, who is elected through universal adult suffrage, is the political head of the District. The Chief Administrative Officer (CAO), who is appointed by the District Service Commission (DSC), is the administrative head of the District, and is the chief accounting officer for the district. For example, new Amuru District is composed of 5 lower local governments (4 sub-counties and 1 town council): they are, Amuru sub-county, Atiak sub-county, Lamogi sub-county, Pabbo sub-county, and Amuru town council. Nwoya District is composed of 4 lower local governments (4 sub-counties): they are, Alero sub-county, Anaka sub-county, Purongo sub-county, Koch Goma sub-county.
Source: JICA Study Team
Figure 3.2 Local Government Hierarchy
The population in the IDP camps of Amuru and Nwoya Districts used to be 368,228 in 2006, while figures in August 2009 show that 73,494 lived in the IDP camps in Amuru and Nwoya Districts as shown in Table 2.1. The population in the IDP camps decreased rapidly to 36,404 by May 2010, about 10% of the registered population in IDP camps in 2006. There were 33 IDP camps and 99 transit sites in Amuru and Nwoya Districts, as of August 2009. By July 2010, all of these IDP camps in Amuru and Nwoya Districts were officially closed down.
Agriculture is the backbone of the district economy in Amuru and Nwoya Districts. The major source of household incomes is sale of crops. In Amuru and Nwoya Districts, about 85% of income is from sale of crops, about 7% is from wages of casual labour and 5% is from sale of forest products.3 Returnees to home villages depend on the sale of crops more than people in transit sites and IDP camps. People in IDP camps and transit sites depend on wages of casual labour more than returnees to home villages.4 Based on the interview with the former Amuru District office5, 90% of the population is engaged in agriculture. About 60% of the population
3 DED-Refugee/IDP Programme (2009), Second Season 2008 Land Use and Crop Yield Assessment Report, Acholi Sub-region. 4 DED-Refugee/IDP Programme (2009), Second Season 2008 Land Use and Crop Yield Assessment Report, Acholi Sub-region. 5 These figures are rough estimations. National agricultural census is currently underway. Therefore, it was difficult to capture exact data at the time of interview.
District (LC5)
County (LC4)
Sub-county (LC3)
Parish (LC2)
Village (LC1)

Project for Rural Road Network Planning in Northern Uganda Final Report Vol.1: SUMMARY
is engaged in crop farming, about 20% in livestock, about 5% in fisheries and about 5% in beekeeping.
In Amuru and Nwoya districts, Arable land, which makes up about 90% of total land area, is fertile, although much of the land is not utilised partly because of the influence of the long-term conflict. Livestock and fisheries, which used to be active, are not so active at present. The major crops are the following by crop production: 1) cassava, 2) groundnuts, 3) sorghum, 4) simsim (sesame), 5) maize, 6) rice, and 7) other crops, such as finger millets, peas, and sunflowers. Fruits like citrus, mangoes, pineapple and bananas are also produced. These are considered as both food and cash crops. Cotton and tobacco were the major cash crops before. However, they are scarcely produced these days.
There are several challenges to provide sufficient water to the people. First of all, it is said that the condition of water points in the home/ return villages is still poor. According to the acting district water officer in Amuru District, water points at home villages were abandoned for more than 20 years during the conflict and most of them do not function properly. Therefore, the existing ones should be repaired and new ones should be constructed at the same time. However, there aren’t sufficient funds to do so. Even when there are funds available, other problems still remain. Some of water points do not have proper access roads. Drilling of boreholes requires heavy equipment. Therefore, if water points are to be newly opened, access roads are required to reach the points. Also, there are sometimes land disputes around the water points.
Health units in Amuru and Nwoya Districts include a hospital, health centre IVs (HC IV), health centre IIIs (HC III), and health centre IIs (HC II). There are various challenges facing the health sector of Amuru and Nwoya Districts. First of all, the number of health units is not at the level of the national standard. For example, the national standard requires one HC II per parish. However, many parishes still do not have any health centres. Furthermore, health units are currently located only along the major roads. Accessibility to existing health units is also a problem. Some roads are in bad condition and are not passable. For some health units, rivers are hindrances. Koch Lii HC II and Pogo HC II in particular have bad access roads.
There are many challenges in the education sector in Amuru and Nwoya Districts. First of all, the number of schools is still inadequate. Considering the aspect of accessibility to existing schools, more schools should be constructed, especially in home villages. However, lack of funding makes it difficult to build new schools. Furthermore, some locations suffer from land disputes. Existing schools do not have adequate facilities such as classrooms, furniture, sanitation facilities, and playgrounds. Also, some of the existing classrooms are temporary structures that are easily affected by the weather.
4. REVIEW OF EXISTING DEVELOPMENT PLANS
For the development of Uganda and Northern Uganda, three national development plans were established and have been implemented with the target of reducing poverty and regional disparity, enhancing human development and accelerating economic growth.
Poverty Eradication Action Plan (PEAP), 2004/5-2007/8
The PEAP is the government’s national framework for all actors in the country aiming at achievement of a number of key objectives in order to enable Uganda to meet its Millennium Development Goals and economic growth objectives. It has been revised and implemented on a 3-year cycle, matching the medium-expenditure frameworks. The PEAP 2004/5-2007/8 put larger emphasis on government functions and effort in economic development than previous PEAPs, as well as on security and governance.
SUMMARY-5

Although the third revision process of the PEAP was started in 2008, it was taken over by the preparation of the 5-year National Development Plan (2010-2015).
Peace, Recovery and Development Plan for Northern Uganda (PRDP), 2007-2010
In 2006, the National Peace Recovery and Development Plan (PRDP) for Northern Uganda was drafted as a commitment by the Government of Uganda as a national program with the overarching goal to stabilise the North. Forty districts of Northern Uganda, covering sub-regions of West Nile, Lango, Acholi, Karamoja, Elgon and Teso, are beneficiaries of the PRDP. In 2007, the PRDP was launched as an official national program; however, the actual funding was not started until 2009.
The overall goal of the PRDP is stabilization in order to regain and consolidate peace and lay the foundations for recovery and development in Northern Uganda, which suffered from prolonged conflicts over the previous 20 years. The targets and objectives of the PRDP are to contribute to the overall objectives of the PEAP. After implementation of the PRDP programmes, the targets of the PRDP will be reviewed and set in line with national goals of the PEAP.
5-year National Development Plan for Uganda (NDP), 2010-2015
The NDP of 2010-2015 intended to set Uganda on the path to becoming a middle-income economy. It replaces the PEAP and outlines the government’s intention to improve road and rail networks, create employment opportunities, improve labour force distribution and use the private sector as the “engine of growth and development”.
In order to improve the stock and quality of road infrastructure, the following strategies are included by the NDP:
1) Upgrade specific National Roads from gravel to Class I and II bitumen standard
2) Improve the condition of the National Roads Network from the current 60 % in fair to good condition to 85 %
3) Develop and maintain selected strategic roads for tourism, minerals, oil and gas and industry
4) Upgrade, rehabilitate and maintain District, Urban and Community Access Roads
In 2004, with the support by UNOCHA, the government of Uganda developed the National Policy for Internally Displaced Persons. The document defined the roles of different actors and consequently established the Inter-Agency Technical Committee (IATC) as a planning and coordinating body. The committee consists of the Office of Prime Minister (OPM), relevant ministries, private sectors, UN agencies, NGOs and donors.
In 2007, a transition strategy, called the “Parish Approach” was formulated, in responding to the on-going returning process and emergence of transit sites (return sites). In this transit strategy, rather than focusing humanitarian activities on IDP camps, provision of basic services in all parishes was emphasized.
In the transition period from the humanitarian phase to recovery and development, the donor funding for humanitarian response gradually is expected to decrease. In addition, larger roles should be played by the national and district governments. In this situation, a variety of projects have been implemented with donor assistance, including the following:
World Bank: Northern Uganda Social Action Fund (NUSAF), 2003-2008
World Bank and DFID: Northern Uganda Social Action Fund (NUSAF 2)
EC: Northern Uganda Rehabilitation Programme (NUREP)
SUMMARY-6

Project for Rural Road Network Planning in Northern Uganda Final Report Vol.1: SUMMARY
USAID: Northern Uganda Transition Initiatives (NUTI), 2008-2011
Stability, Peace and Reconciliation in Northern Uganda (SPRING), 2008-2011
Northern Uganda Development of Enhanced Local Governance Infrastructure and Livelihoods (NUDEIL)
UNDP: District Development Programme III
5. DEVELOPMENT POTENTIAL AND ISSUES OF AMURU AND NWOYA DISTRICTS
Development potential and issues observed in Amuru and Nwoya Districts are as follows:
Development Potential
1. Large Agricultural Potential 2. Good Inter-Regional Road Connections 3. Geographical Proximity to Market for Agricultural Produce 4. Effective Commercial Network for Agricultural Produce 5. Existence of Bases of Social Infrastructure and Services 6. Proximity to a Regional Centre, Gulu, where Universities and Hospitals are
Located 7. Tourism Potential 8. Existence of Old Railways
Development Issues
1. Lack of Provision of Social Infrastructure and Services 2. High Transport Costs 3. Erratic rainfall pattern 4. Lack of Labour Force for Agriculture 5. Land Disputes 6. Promotion of Commercial Farming 7. Weak Tourism Development 8. Lack of Economic Infrastructure 9. Lack of Human Resources at the District Offices 10. Dependency Syndrome 11. Weak Solidarity among People
A SWOT analysis was conducted through analysing strengths, weaknesses, opportunities and threats for Amuru and Nwoya Districts. Development potentials and issues described in the above are strengths and weaknesses of Amuru and Nwoya Districts. Opportunities and threats to development are as follows.
Opportunities
1. More Assistances for Development
It is expected that the support provided to the Acholi Sub-region would shift greatly from humanitarian to developmental aid given that the conflict has ended.
2. Continuity of Stability and Economic Infrastructure Development
The rehabilitated road from Kampala to Gulu town shortens travel time between Kampala and Gulu as well as lowers transportation costs dramatically.
Completion of prospective national road improvements between Gulu and Nimule as well as between Lira and Soroti would create a direct route from Amuru and Nwoya Districts to the border of Kenya, which will decrease transportation costs to Mombasa Port in Kenya.
SUMMARY-7

The development of other economic infrastructure, such as power supply (hydroelectric power plant at Karuma), is also expected in the Northern Region.
In addition to these economic infrastructure developments, the continuity of stability and peace in the region could boost investments and promote more development of economic infrastructures in Northern Uganda including Acholi Sub-region.
3. Promotion of Tourism Industry
Along with the increase of tourists visiting Murchison Falls National Park, it is expected that the number of tourists who visit Amuru and Nwoya Districts at the same time would also increase. This potential tourism development can be fostered by a more stable peace situation in the region.
Threats
The following threats will continue to exist more or less in the future in Amuru and Nwoya Districts, as well as in Acholi Sub-region.
1. Erratic rainfall 2. Rise of food prices partly due to erratic rainfall and partly due to increase in
demand for food crops from Southern Sudan 3. Insufficient developmental assistance 4. Return of LRA 5. Possibility of insufficient supply of electricity in Gulu which hinders urban
development of the town 6. Possibility of delay of road development in Gulu which makes roads inside Gulu
bottlenecks of the region
6. SOCIOECONOMIC FRAMEWORK OF AMURU AND NWOYA DISTRICTS
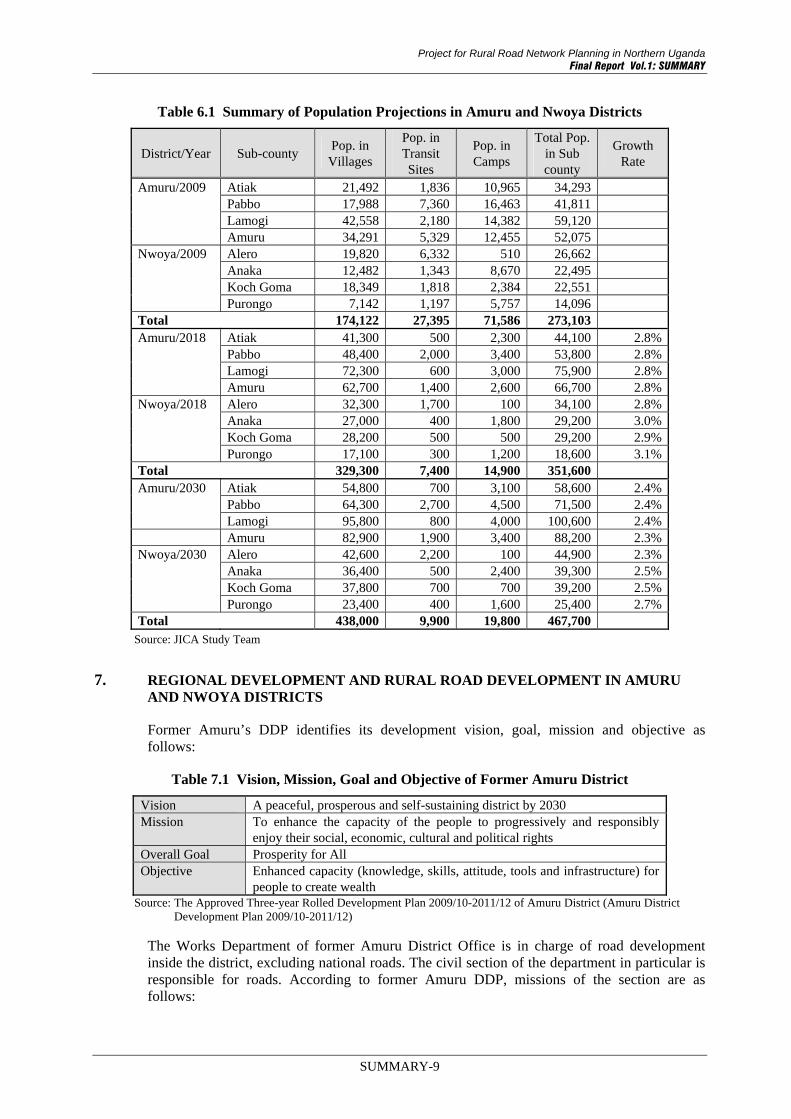
The following table tabulates the population projections in Amuru and Nwoya Districts. In Amuru District, the largest population is projected in Lamogi Sub-county throughout the projection period (76,000 in 2018 and 101,000 in 2030), followed by Amuru, Pabbo and Atiak Sub-counties. In Nwoya District, the population size is projected as relatively smaller than that in Amuru District. The largest population in Nwoya District can be seen in Alero Sub-county (34,000 in 2018 and 45,000 in 2030). The total population size in both Amuru and Nwoya Districts is estimated to increase to 352,000 in 2018 and 468,000 in 2030.
SUMMARY-8
Project for Rural Road Network Planning in Northern Uganda Final Report Vol.1: SUMMARY
Table 6.1 Summary of Population Projections in Amuru and Nwoya Districts
District/Year Sub-county Pop. in
Villages
Pop. in Transit Sites
Pop. in Camps
Total Pop. in Sub county
Growth Rate
Amuru/2009 Atiak 21,492 1,836 10,965 34,293 Pabbo 17,988 7,360 16,463 41,811 Lamogi 42,558 2,180 14,382 59,120 Amuru 34,291 5,329 12,455 52,075 Nwoya/2009 Alero 19,820 6,332 510 26,662 Anaka 12,482 1,343 8,670 22,495 Koch Goma 18,349 1,818 2,384 22,551 Purongo 7,142 1,197 5,757 14,096 Total 174,122 27,395 71,586 273,103 Amuru/2018 Atiak 41,300 500 2,300 44,100 2.8% Pabbo 48,400 2,000 3,400 53,800 2.8% Lamogi 72,300 600 3,000 75,900 2.8% Amuru 62,700 1,400 2,600 66,700 2.8%Nwoya/2018 Alero 32,300 1,700 100 34,100 2.8% Anaka 27,000 400 1,800 29,200 3.0% Koch Goma 28,200 500 500 29,200 2.9% Purongo 17,100 300 1,200 18,600 3.1%Total 329,300 7,400 14,900 351,600 Amuru/2030 Atiak 54,800 700 3,100 58,600 2.4% Pabbo 64,300 2,700 4,500 71,500 2.4% Lamogi 95,800 800 4,000 100,600 2.4% Amuru 82,900 1,900 3,400 88,200 2.3%Nwoya/2030 Alero 42,600 2,200 100 44,900 2.3% Anaka 36,400 500 2,400 39,300 2.5% Koch Goma 37,800 700 700 39,200 2.5% Purongo 23,400 400 1,600 25,400 2.7%Total 438,000 9,900 19,800 467,700
Source: JICA Study Team
7. REGIONAL DEVELOPMENT AND RURAL ROAD DEVELOPMENT IN AMURU AND NWOYA DISTRICTS
Former Amuru’s DDP identifies its development vision, goal, mission and objective as follows:
Table 7.1 Vision, Mission, Goal and Objective of Former Amuru District
Vision A peaceful, prosperous and self-sustaining district by 2030 Mission To enhance the capacity of the people to progressively and responsibly
enjoy their social, economic, cultural and political rights Overall Goal Prosperity for All Objective Enhanced capacity (knowledge, skills, attitude, tools and infrastructure) for
people to create wealth Source: The Approved Three-year Rolled Development Plan 2009/10-2011/12 of Amuru District (Amuru District
Development Plan 2009/10-2011/12)
The Works Department of former Amuru District Office is in charge of road development inside the district, excluding national roads. The civil section of the department in particular is responsible for roads. According to former Amuru DDP, missions of the section are as follows:
SUMMARY-9

To increase accessibility by road as well as provision of an efficient and sustainable road network that is sufficient to meet present and future traffic demand to all socio-economic centres in the district
To provide technical support to the lower local governments and the community for effective planning, operation and maintenance of road infrastructure for sustainable development.
Many people in Amuru and Nwoya Districts are still in transit towards settling in their home villages. They hesitate to go back and settle in their home villages because of uncertainty as regards whether they can maintain the standards of living they have become accustomed to in the IDP camps and transition villages. It is necessary to improve the socioeconomic environment of home villages in which returnees can maintain their living standards and reconstruct agricultural production bases.
In order to improve the socioeconomic environment in home villages, improvement of social and economic infrastructures is the highest priority of the districts. Roads themselves are basic social and economic infrastructures. Roads can connect people in home villages with various places, such as health centres, trading centres and schools. Particularly, it is critical for people to have access to major trading centres to which people go to sell agricultural produce, or for middlemen to come to home villages to buy agricultural produce, because selling agricultural produce is the major and only source of incomes for most people in Amuru and Nwoya.
In addition, roads are able to promote improvement of other social infrastructures and services, such as water points, health units and schools. It is necessary to bring heavy construction equipment and materials by motor vehicles to the exact sites of construction, rehabilitation, and upgrading of water points, health units or schools. These pieces of heavy construction equipment and materials require roads which are wide enough and bridges which can bear certain weights. Therefore, if there are no such roads, it is very difficult to have social service facilities.
In conclusion, the following two points should be focused upon in order to improve people’s socioeconomic environment:
Road Development to Improve Access from Home Villages to Trading Centres
Road Development to Improve Social Infrastructure and Services
8. PRESENT SYSTEM OF ROAD ADMINISTRATION AND ROAD MAINTENANCE
Development and maintenance of national roads is under the jurisdiction of the recently established UNRA. That of district roads is under the jurisdiction of district local governments. The development and maintenance of urban roads is under the jurisdiction of urban councils while community access roads are under that of sub-counties.
In May 2009, the Uganda Road Fund Board was established. The state budget of 2009/2010 did not feature any special budgetary allocation for the Uganda Road Fund. In FY 2010/2011 however, there was a special budgetary allocation for the Road Fund.
However, Table 8.1 shows that no substantial increase was made to the total budget for the Works and Transport Sector after the establishment of the Road Fund budgets.
SUMMARY-10

Project for Rural Road Network Planning in Northern Uganda Final Report Vol.1: SUMMARY
SUMMARY-11
Table 8.1 Shares of Works and Transport Sector in State Budgets of Uganda
Unit=Ushs Billion
2008/2009 2009/2010 2010/2011
MOWT (1) 169 138 124
UNRA (2) 949 904 614
Uganda Road Fund (3) 0 0 284
Total of Works and Transport SectorBudget
1,118 1,042 1,022
% of Works and Transport SectorBudget out of Total State Budget
18.2% 14.2% 13.5%
Total of State Budget (4) 6,143 7,334 7,552
100.0% 100.0% 100.0%
Source: (1), (2) and (3): Ministerial Budget Policy Statements (4): Budget Speech by Minister of Finance, Planning and Economic Development
The investment level for national roads has drastically increased in the last three years or so. The investment level in the early part of the last decade was around 80 million USD per year. However, the current investment level for national roads is 150-200 million USD per year, in accordance with the budget policies of MoWT.
On the other hand, the investment level for district roads was around 5-10 million USD per year during the last decade. The current level of investment for district roads is still very limited at about 18-21 million USD per year, which is very low compared to that for national roads.
The district Works Department uses the “Rehabilitation and Maintenance Planning System (RAMPS)” and “Quarterly Progress Reporting System (QPRS)” for monitoring, planning and management for rehabilitation and maintenance of district roads. These tools are supported by computer software, which was developed by the MoWT with DANIDA’s support.
With the inspected road data, the RAMPS can conduct calculations to determine priority sections for road maintenance and recommend necessary types of maintenance. Estimated budgets and expected monthly expenditures are also given.
However, given that the system considers only the population along the road and condition of the surface in the evaluation, it can be said that the system is inadequate in reflecting the people’s true needs, since other aspects such as availability of health and education facilities are not considered in the system’s evaluation. These factors are considered based on the engineer’s discretion and judgment when establishing priorities during the road planning.
9. PRESENT SITUATION OF ROAD TRAFFIC AND TRANSPORT IN AMURU DISTRICT
There are various levels (from national, district to sub-county levels) of master plans and development plans concerning the road sub-sector including improvement and maintenance. In this chapter, the following six plans are reviewed:
Unit: Billion Ushs.
Road Sector Development Program (RSDP) and Road Sector Development Program 2 (RSDP2)
National Transport Master Plan including a Transport Master Plan for the Greater Kampala Metropolitan Area (NTMP/GKMA) 2008-2023 (May 2009)
The Ten-Year District, Urban and Community Access Roads Investment Plan (DUCARIP), Final Draft (February 2008)
Road Programmes in District Development Plan of Former Amuru District 2009/10-2011/12
Road Programmes in Sub-county Development Plans (8 Sub-counties in Former Amuru District) 2009/10-2011/1
The investment plan for the road sub-sector is based on the Road Sector Development Programme (RSDP), the UNRA Strategic Plan and the District and Urban Roads Improvement Programme (DUCARIP) of 2008. The National Transport Master Plan (NTMP) shows activities which are necessary to be implemented during the 15 years, and incorporates DUCARIP.
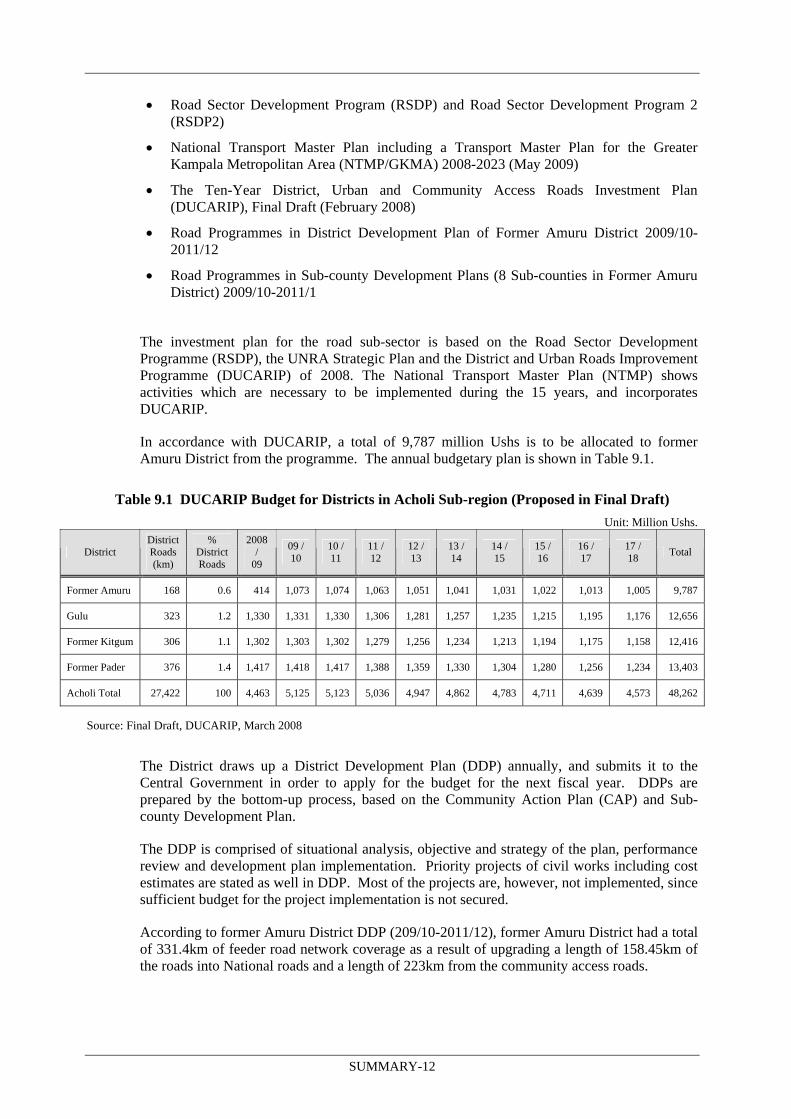
In accordance with DUCARIP, a total of 9,787 million Ushs is to be allocated to former Amuru District from the programme. The annual budgetary plan is shown in Table 9.1.
Table 9.1 DUCARIP Budget for Districts in Acholi Sub-region (Proposed in Final Draft) Unit: Million Ushs.
District District Roads (km)
% District Roads
2008 /
09
09 / 10
10 / 11
11 / 12
12 / 13
13 / 14
14 / 15
15 / 16
16 / 17
17 / 18
Total
Former Amuru 168 0.6 414 1,073 1,074 1,063 1,051 1,041 1,031 1,022 1,013 1,005 9,787
Gulu 323 1.2 1,330 1,331 1,330 1,306 1,281 1,257 1,235 1,215 1,195 1,176 12,656
Former Kitgum 306 1.1 1,302 1,303 1,302 1,279 1,256 1,234 1,213 1,194 1,175 1,158 12,416
Former Pader 376 1.4 1,417 1,418 1,417 1,388 1,359 1,330 1,304 1,280 1,256 1,234 13,403
Acholi Total 27,422 100 4,463 5,125 5,123 5,036 4,947 4,862 4,783 4,711 4,639 4,573 48,262
Source: Final Draft, DUCARIP, March 2008
The District draws up a District Development Plan (DDP) annually, and submits it to the Central Government in order to apply for the budget for the next fiscal year. DDPs are prepared by the bottom-up process, based on the Community Action Plan (CAP) and Sub-county Development Plan.
The DDP is comprised of situational analysis, objective and strategy of the plan, performance review and development plan implementation. Priority projects of civil works including cost estimates are stated as well in DDP. Most of the projects are, however, not implemented, since sufficient budget for the project implementation is not secured.
According to former Amuru District DDP (209/10-2011/12), former Amuru District had a total of 331.4km of feeder road network coverage as a result of upgrading a length of 158.45km of the roads into National roads and a length of 223km from the community access roads.
SUMMARY-12

Project for Rural Road Network Planning in Northern Uganda Final Report Vol.1: SUMMARY
Apart from the DDP, a sub-county development plan is published annually from each of the 8 sub-counties, in the case of former Amuru District, it contains a 3 year plan for the institutional, financial and infrastructural contexts. Since the sub-county has a responsibility to maintain the community access roads, the list of priority roads are shown in the Sub-county development plan. However these are not exactly harmonised with the DDP. Besides, as the format and description are not integrated, the level of information varies at each sub-county.
10. PRESENT SITUATION OF ROAD TRAFFIC AND TRANSPORT IN AMURU AND NWOYA DISTRICTS
During this Study, a Traffic Survey was conducted to grasp the baseline traffic information, e.g., traffic volume and OD (origin and destination) along the main trunk road and district roads in Acholi Sub-region, in order to understand the current traffic flow and examine the demand forecast analysis.
As for Amuru and Nwoya Districts, a Traffic Survey and Household Interview Survey were conducted to reveal traffic and travel characteristics of the residents. The present situation of road traffic and transport in Amuru and Nwoya Districts is summarized below:
A lot of traffic is observed along the national roads; north-south corridor between Gulu – Sudanese border and east-west corridor along Arua Road. However, the number of the vehicles observed in former Amuru District is very low, showing a maximum traffic volume of only 2,040 PCU per day along Arua Road. There seem to be no capacity constraints in former Amuru District.
The motorcycle is the dominant mode of transport in the region, consisting of 51% of the vehicles observed on the national roads and 59% on the districts roads. Following motorcycles, light goods vehicles (vans and pickups), truck and trailers are frequently observed at the survey locations. Public transport, including matatus, were rarely observed at the survey locations, consisting of less than 3% of the traffic on both national and district roads. There seems to be no reliable transport network or cost effective transport mode for vulnerable people who have no access to the public transport.
The interviewees in former Amuru District have almost no private transport mode, showing that only 1% of sampled households in former Amuru own motorbikes and only 24% own bicycles. Access to the public transport is the key towards enhancing the mobility of the residents in former Amuru. However, as mentioned earlier, there seems to be only very limited public transport service available to the residents.
Agriculture is the dominant economic activity in former Amuru District. A total of 95% of the workers interviewed in former Amuru are farmers/livestock keepers. A total of 89% of the interviewed households in former Amuru are involved in agricultural activities; mostly crop cultivation work. Accessibility to the farms is observed as relatively good. Half of the residents in former Amuru cultivate their farms within a 10-minute distance of their homes. A total of 91% of the interviewees answered that they accessed their farms by walking. Two-thirds of the interviewees sell their products by themselves, either by bringing them to the market places or by bringing them to the buying points. As a consequence, maintaining good linkage connecting home villages, farms and markets is an essential element towards accelerating the return process of the IDPs to their home villages and sustaining their livelihoods.
11. PRESENT SITUATION AND ISSUES OF THE ROAD NETWORK AND CONDITIONS IN AMURU AND NWOYA DISTRICTS
After reclassification of district roads to national roads in January 2009, Amuru and Nwoya Districts have 9 routes that are national roads and 13 routes that are district roads.
SUMMARY-13

The road from Karuma to Pakwach via Olwiyo is paved and connects Kampala and Western Nile. On the other hand, the road from Gulu town to Nimule which penetrates the north-west area of the districts plays an important role as a trade route between Uganda and South Sudan. This road from Gulu (Kati Kati in Amuru District) to Nimule in South Sudan will be upgraded to an asphalt road under loan agreements with the WB and the Japanese Government.
Other national roads traverse to connect the above 2 major national roads with the main trading centres and other district centres.
In Amuru and Nwoya Districts, it seems that the road network covers the entire district adequately. However, many road links are broken up by bottlenecks which hinder vehicle traffic. There are more than 60 points of bottlenecks caused by bushes and over 40 points by rivers. Wooden bridges which are constructed by the local government or NGO enable pedestrians and bicycles to cross rivers or streams; however, they do not have adequate structural strength to enable passage of motor vehicles.
Issues on Rural Road Development in Amuru and Nwoya Districts are as follows:
The total length of roads in Amuru and Nwoya Districts is much shorter than other districts, considering their populations and vast areas.
All-weather roads are few in Amuru and Nwoya Districts. More all-weather roads are required since more motor vehicles are expected on the roads in Amuru and Nwoya Districts in the future.
The road network of Amuru and Nwoya Districts has many missing links because bridges and culverts are broken or simply non-existent. Some existing bridges are made of wood. Those wooden bridges are too weak and/or too narrow for motor vehicles and motorbikes to cross.
Most roads in Amuru and Nwoya Districts are earth roads with no cross slopes provided. As a result, rainwater pools up on the road surface, which accelerates deterioration of road conditions.
In the rainy season, many road sections are in poor condition and are sometimes not passable by vehicles. This is especially so in the western part of Amuru and Nwoya Districts where organic soils exist on the road surfaces. In such areas, earth roads are too slippery to allow passage of vehicles. Those earth roads become so muddy that vehicles are often stuck in the mud. In the rainy season, the service level of roads in Amuru and Nwoya Districts is unstable and unreliable.
While people can cross most rivers without well-built bridges in the dry season, they cannot cross those rivers when the river water becomes high during the rainy season. In such situations, some villages are isolated and children cannot go to school for days.
Many community access roads are not passable by vehicles in Amuru and Nwoya Districts.
Home villages and hamlets are scattered along community access roads, many of which are not passable by vehicles. It is difficult to secure accessibility to social infrastructure from home villages/hamlets. It is also difficult to secure mobility and accessibility for vulnerable people, such as the elderly, pregnant women and small children.
Major roads of Amuru and Nwoya Districts are radial roads from Gulu City. There are a limited number of roads connecting those radial roads to each other in Amuru and Nwoya Districts.
SUMMARY-14

Project for Rural Road Network Planning in Northern Uganda Final Report Vol.1: SUMMARY
Although vehicle roads run through most villages in Amuru and Nwoya Districts, there are no direct access roads to some villages or the access roads to some villages are in very poor condition.
Most villages have only one access road, which limits mobility of villagers. They have to largely detour to reach some trading centres. Such a road situation does not secure enough redundancy for people’s social and economic activities.
In the dry season, running vehicles on earth roads raises dust so heavily that visibility for drivers is hampered compromising their ability to drive cars safely.
In the western part of Amuru Sub-county and the southern part of Koch Goma Sub-county, wild animals and tsetse flies pose a danger to road users.
Issues on Rural Road Maintenance in Amuru and Nwoya Districts are as follows:
Although the central government decided to introduce a government policy on force account for road maintenance of district roads, there hasn’t yet been any budgetary support for the policy and implementation program.
For the force account policy for road maintenance, Amuru and Nwoya Districts have neither equipment nor human resources for road maintenance because the districts were established recently.
Road maintenance works in rural areas like Amuru and Nwoya Districts cannot attract a reasonable quality of contractors, since many high quality contractors with proper machinery and adequate skill levels are mainly active in large urban areas like Kampala and Entebbe.
With their limited budgets, the district governments cannot award requisite contracts to contractors for road maintenance.
Companies operating in northern Uganda are financially weak. Therefore, such contractors tend to implement Labour-based Technology (LBT) maintenance work by not using even simple equipment. As a result, this situation adversely affects the quality of road maintenance work. They cannot compact road surfaces strongly enough because they do not own or rent rollers. They cannot use appropriate material (murram) for road surfaces because they do not own or rent trucks.
Sub-county governments are supposed to maintain community access roads. However, almost no budget allocations have been made for road maintenance purposes. In fact, sub-county governments have done nothing on road maintenance in Amuru and Nwoya Districts.
Although the central government and donors have provided funds for road development and rehabilitation for many road sections to encourage the process of resettlement and development in northern Uganda, these roads have deteriorated rapidly in the absence of any substantial road maintenance work.
The selection of priority sections for road maintenance is done by using tools, such as RAMPS and QPRS. However, these tools only use data describing road conditions and roadside populations in selection of priority sections, but they do not pay attention to needs for social infrastructure and services (health centres, schools and boreholes).
In Uganda, the university education of civil engineers is too academic in concentrating on theories, but not on practical technology and skills. As a result, Ugandan engineers tend to lack practical knowledge and management skills.
SUMMARY-15
Government officers, including engineers, tend to leave their government positions after a few years of experience in search of private sector jobs. Technical skills and capacity are thus diminished by the high rate of staff turnover in government offices.
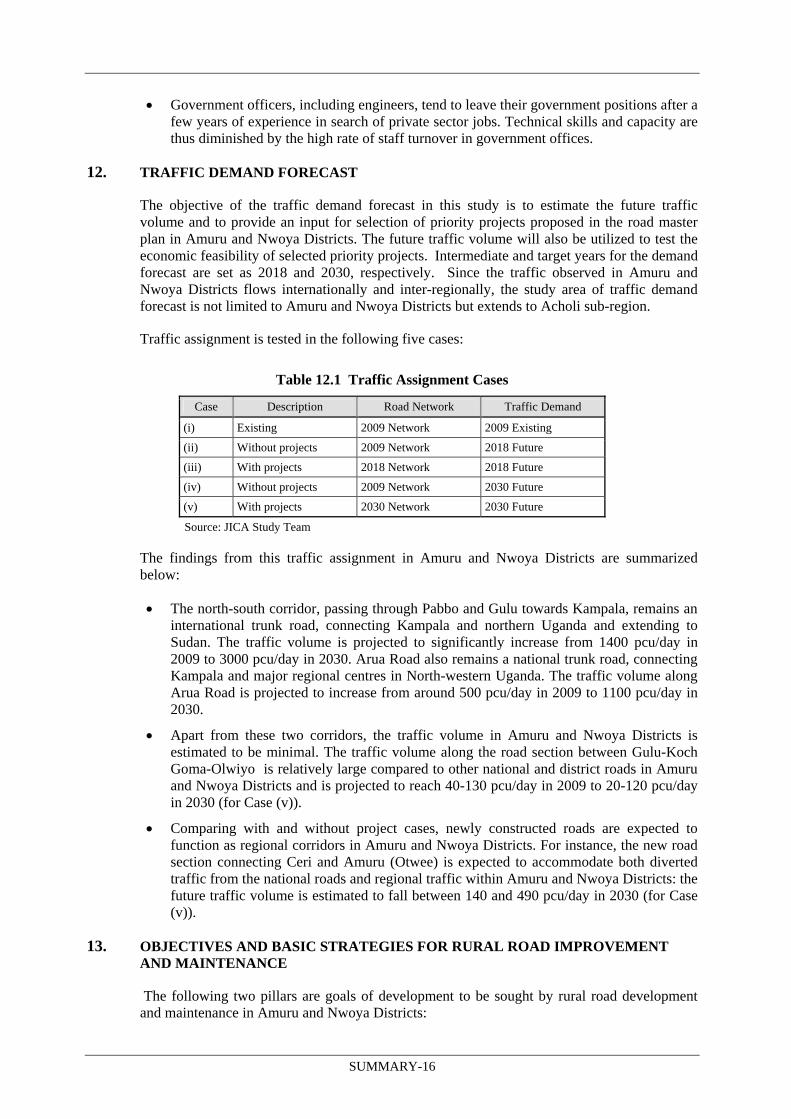
12. TRAFFIC DEMAND FORECAST
The objective of the traffic demand forecast in this study is to estimate the future traffic volume and to provide an input for selection of priority projects proposed in the road master plan in Amuru and Nwoya Districts. The future traffic volume will also be utilized to test the economic feasibility of selected priority projects. Intermediate and target years for the demand forecast are set as 2018 and 2030, respectively. Since the traffic observed in Amuru and Nwoya Districts flows internationally and inter-regionally, the study area of traffic demand forecast is not limited to Amuru and Nwoya Districts but extends to Acholi sub-region.
Traffic assignment is tested in the following five cases:
Table 12.1 Traffic Assignment Cases
Case Description Road Network Traffic Demand
(i) Existing 2009 Network 2009 Existing
(ii) Without projects 2009 Network 2018 Future
(iii) With projects 2018 Network 2018 Future
(iv) Without projects 2009 Network 2030 Future
(v) With projects 2030 Network 2030 Future
Source: JICA Study Team
The findings from this traffic assignment in Amuru and Nwoya Districts are summarized below:
The north-south corridor, passing through Pabbo and Gulu towards Kampala, remains an international trunk road, connecting Kampala and northern Uganda and extending to Sudan. The traffic volume is projected to significantly increase from 1400 pcu/day in 2009 to 3000 pcu/day in 2030. Arua Road also remains a national trunk road, connecting Kampala and major regional centres in North-western Uganda. The traffic volume along Arua Road is projected to increase from around 500 pcu/day in 2009 to 1100 pcu/day in 2030.
Apart from these two corridors, the traffic volume in Amuru and Nwoya Districts is estimated to be minimal. The traffic volume along the road section between Gulu-Koch Goma-Olwiyo is relatively large compared to other national and district roads in Amuru and Nwoya Districts and is projected to reach 40-130 pcu/day in 2009 to 20-120 pcu/day in 2030 (for Case (v)).
Comparing with and without project cases, newly constructed roads are expected to function as regional corridors in Amuru and Nwoya Districts. For instance, the new road section connecting Ceri and Amuru (Otwee) is expected to accommodate both diverted traffic from the national roads and regional traffic within Amuru and Nwoya Districts: the future traffic volume is estimated to fall between 140 and 490 pcu/day in 2030 (for Case (v)).
13. OBJECTIVES AND BASIC STRATEGIES FOR RURAL ROAD IMPROVEMENT AND MAINTENANCE
The following two pillars are goals of development to be sought by rural road development and maintenance in Amuru and Nwoya Districts:
SUMMARY-16

Project for Rural Road Network Planning in Northern Uganda Final Report Vol.1: SUMMARY
To improve the socioeconomic environment for stabilizing and enhancing the livelihood of returnees in Amuru and Nwoya Districts:
To promote agricultural development in areas of agricultural potential by providing road access
The primary objectives for rural road improvement and maintenance aim to attain the two identified goals and reverse a situation of underdevelopment in 10 years, as follows:
Vehicle roads should be improved by doing the following in a sustainable manner.
- Expanding the total length of vehicle roads
- Upgrading or improvement of service levels of vehicle roads
- Improving the network of vehicle roads
Vehicle roads should be maintained by locally appropriate technology and management methods.
Roads passable by bicycles and motorbikes should also be expanded and improved, in conjunction with vehicle road improvement and maintenance.
The following three basic strategies are proposed:
Basic Strategy A: Basic Strategy following Appropriately Set Functional Road Classes
This basic strategy is about how to actually guide road improvement, as well as road maintenance in Amuru and Nwoya Districts. This strategy is important because no functional classes are designated to any national roads or district roads and Amuru and Nwoya Districts are in the process of returning IDPs and effecting re-development of their economies and society. The strategy is as follows:
To establish functional road classes suitable for the context of Amuru and Nwoya Districts (suitable for the identified goals of rural road improvement in Amuru and Nwoya Districts)
To implement improvement and maintenance of roads, in accordance with the established functional road classes
Basic Strategy B: Basic Strategy on Rural Road Maintenance
This basic strategy provides directions and necessary steps for reconstructing a system of rural road maintenance as follows:
To clarify the roles of the central government, district governments, sub-county governments and private sectors in rural road maintenance
To reconstruct a practical system for rural road maintenance by effectively utilizing available resources (human resources, financial resources, etc.) of the central government, district governments, sub-county governments and private sectors
To promote capacity development of the central government, district governments, sub-county governments and private sectors for rural road maintenance
SUMMARY-17

Basic Strategy C: Basic Strategy for Community Development
This basic strategy is to guide vehicle road improvement and maintenance from the perspective of returnees and communities as follows.
To promote vehicle road improvement and maintenance, which is integrated with community roads to provide access to home villages of IDPs
To promote job creation for returnees by using Labour-based Technology for rural road maintenance
14. RURAL ROAD NETWORK PLANNING
Rural Roads are those roads which satisfy various needs of people and support various socio-economic activities. It is necessary to consider and formulate network plans and development levels of rural roads from the following various perspectives/aspects:
Population distribution (present and future populations including population distribution of returnees)
Linkage between local government administration centres (district centre and sub-county centres)
Access to health centres and schools from rural communities
Access to health centres and schools from local government administration centres
Access to trading centres from rural communities
Trade linkage among rural trading centres, major trading centres, major national roads and the regional commercial centre (Gulu town)
Access to agricultural development potential areas
The general flow of rural road network planning is shown in Figure 14.1.
This functional road classification could be a tool for guiding the development and management of roads. The functional road classification constitutes a basis of road sub-sector policies.
There are two ways of using functional road classifications. One is for formulating road investment plans or master plans. The other is for identification of adequate design standards in order to design actual roads.
In Uganda, the application of the first case of functional road classifications is very limited. The latter case of utilisation of functional road classifications is more common.
SUMMARY-18

Project for Rural Road Network Planning in Northern Uganda Final Report Vol.1: SUMMARY
Road Inventory
Current Service Level of Roads
Future Road Networks with Functional Road Classes
Future Service Levels of Roads
PopulationDistribution
Linkage ofGovernment
Centres
Access toHealth Centres
Access toVillage Centres
and Schools
TradingLinkage
Access toAgricultural
Potential
Integration
Future Traffic Demand
Source: JICA Study Team
Figure 14.1 General Flow of Rural Road Network Planning
There are two systems of functional road classification in Uganda. One is that prepared by MoWT for rural trunk roads (national roads), and the other is for rural feeder roads (district roads). For rural road network planning for a particular district, it is necessary to utilize both classification systems.
Since the system of functional road classification is concerned with the traffic function of the roads, but not the administrative status of roads, it is necessary to examine the genuine function of all roads in the district by initially disregarding the administrative status of roads. At this step, we are faced with the difficulty of using two different classification systems. It is necessary to have an integrated system of functional road classification or a method of utilizing the two functional road classification systems in an integrated manner, for rural road network planning as shown in Table 14.1.
SUMMARY-19

Table 14.1 Proposed Method of Using the Existing Two Systems of Functional Road Classification in an Integrated Manner
Integrated Method of Using Existing Two Systems of Functional Road Classification
Functional Classification for Rural Roads
Functional Classification for District Roads
A International Trunk Road International Trunk Road [A]
B Inter-regional Trunk Road National Trunk Road [B]
C Inter-district Road Primary Road [C] District Class I Road
D District-level Arterial Road Secondary Road [D] District Class II Road
E District-level Collector Road Minor Road [E] District Class III Road
F Important Community Access Road (Important Community Access
Roads)
G Other Community Access Road (Other Community Access Roads)
Source: JICA Study Team
By using the proposed method of using the two existing systems of functional road classification, and by considering the new district spatial patterns, the JICA Study Team proposed two road network plans for Amuru and Nwoya Districts. One is for the long term (2030) and the other is for the mid term (2018) as shown in Figure 14.2.
International Trunk Road
National Trunk Road(Inter-Regional Trunk Road)
Primary Trunk Road / District Class I(Inter-District Trunk Road)
Secondary Trunk Road / District Class II(District Trunk Road)
Tertiary Trunk Road / District Class III(District Feeder Road)
International Trunk Road
National Trunk Road(Inter-Regional Trunk Road)
Primary Trunk Road / District Class I(Inter-District Trunk Road)
Secondary Trunk Road / District Class II(District Trunk Road)
Tertiary Trunk Road / District Class III(District Feeder Road)
Long -term (Year 2030) Mid-term (Year 2018) Source: JICA Study Team
Figure 14.2 Road Network Plan with Functional Road Classes
SUMMARY-20

Project for Rural Road Network Planning in Northern Uganda Final Report Vol.1: SUMMARY
In order to assess requisite investment costs for achieving desirable service level of roads, the current service level of roads was examined. This was done using the data of the road inventory. Table 14.2 shows the Current Service Level of roads.
Table 14.2 Classes for Current Service Level of Roads Class Code Earth or Gravel Road Graded or Not Graded Road Width
0 Earth Footpath Not Graded <1.5 m 1 Earth Road Not Graded 3.0 m 2 Earth Road Not Graded 4.5 m 3 Earth Road Graded 4.5 m 4 Earth Road Graded 6.0 m 5 Gravel Road Graded 6.0 m
Source: JICA Study Team
Desirable service levels of roads for years 2018 and 2030 are proposed by using the design standards which are in accordance with proposed functional classes. Table 14.3 shows a list of service levels of roads which are used for future road network plans. The class codes in the table indicate the service levels of roads in the proposed future road network plans.
Table 14.3 Classes for Service Level of Roads in Future Road Network Plans
Class Code
Design Class Road Width Carriageway
Width 6 Community Access Road 3.0m 3.0m 7 District Class III 6.5m 4.0m 8 District Class II 7.8m 5.4m 9 District Class I 9,4m 6.0m
10 C Gravel 6.4m 4.0m 11 B Gravel 8.6m 5.6m 12 A Gravel 10.0m 6.0m 13 III Paved 8.6m 5.6m 14 II Paved 10.0m 6.0m 15 Ib Paved 11.0m 7.0m 16 District Class III in Embankment Sections Over 6.5m 4.0m 17 District Class II in Embankment Sections Over 7.8m 5.4m 18 District Class I in Embankment Sections Over 9,4m 6.0m 19 C Gravel in Embankment Sections Over 6.4m 4.0m 20 B Gravel in Embankment Sections Over 8.6m 5.6m 21 A Gravel in Embankment Sections Over 10.0m 6.0m 22 III Paved in Embankment Sections Over 8.6m 5.6m 23 II Paved in Embankment Sections Over 10.0m 6.0m 24 Ib Paved in Embankment Sections Over 11.0m 7.0m
Source: JICA Study Team
15. SELECTION OF HIGH PRIORITY PROJECTS
The result of the preliminary cost estimation concluded that the total project cost would exceed 120 million USD, if all national, district and important community access roads in Amuru and Nwoya Districts were upgraded to meet the design standards and service level of the desired functional classification. However, the local budget channelled for road improvement works is very scarce. Thus, there is a need for evaluating the priority of the projects to fully make the best use of the limited budget and maximize the benefits derived from the investment in road improvement projects. The following principles are set for the project evaluation and selection exercise.
SUMMARY-21

The method for selection of priority projects should be applicable to all the districts in Acholi sub-region (and elsewhere). Therefore, the methodology applied to this selection exercise should be straightforward and input data required for it should be locally and reasonably available and can be subjective if quantifiable data is not available.
The method applied to this project selection exercise should be well shared among all the stakeholders. Therefore, local participation is encouraged in identification of the criteria, allocation of weights and quantitative/qualitative assessment of the projects, preferably by brain-storming workshops and/or questionnaire surveys.
Intermediate and target years are set as 2018 and 2030. The high priority projects, proposed in this project selection exercise, are assumed to be implemented by 2018. The rest of the proposed projects are assumed to be completed by 2030.
This Study proposes that the road improvement master plan in Amuru/Nwoya Districts is formulated by the procedures shown in Figure 15.1.
Current Road Network and Service
Desired Road Service and Classification
Evaluation criteria: -Cost efficiency -Reliability-Accessibility-Serviceability
High Priority Projects by 2018
Weight of parameters
Projects after 2018
Yes
No
Any gap?
Multi criteria analysis
Function as network, Budgetary constraints
Traffic VolumeRoad Function
Necessary Projects
Source: JICA Study Team
Figure 15.1 Procedure for Project Selection
Two sets of weights allocated to the different evaluation criteria are prepared to aid the decision making process. These two sets of weights are namely; Cost efficiency oriented weights and social impact oriented weights as shown in Table 15.1.
Table 15.1 Weights of Evaluation Parameters
Evaluation Items Cost efficiency
oriented Social impact
oriented
Traffic volume 30%
Project cost per vehicle km, 40%
Cost efficiency
Time distance from district centre 30%
Reliability Likely deteriorated road section 20%
Access to schools 10% Accessibility
Access to hospitals 10%
Number of returnees 50% Serviceability
Availability of safe water 10%
Total 100% 100%
Source: JICA Study Team
SUMMARY-22
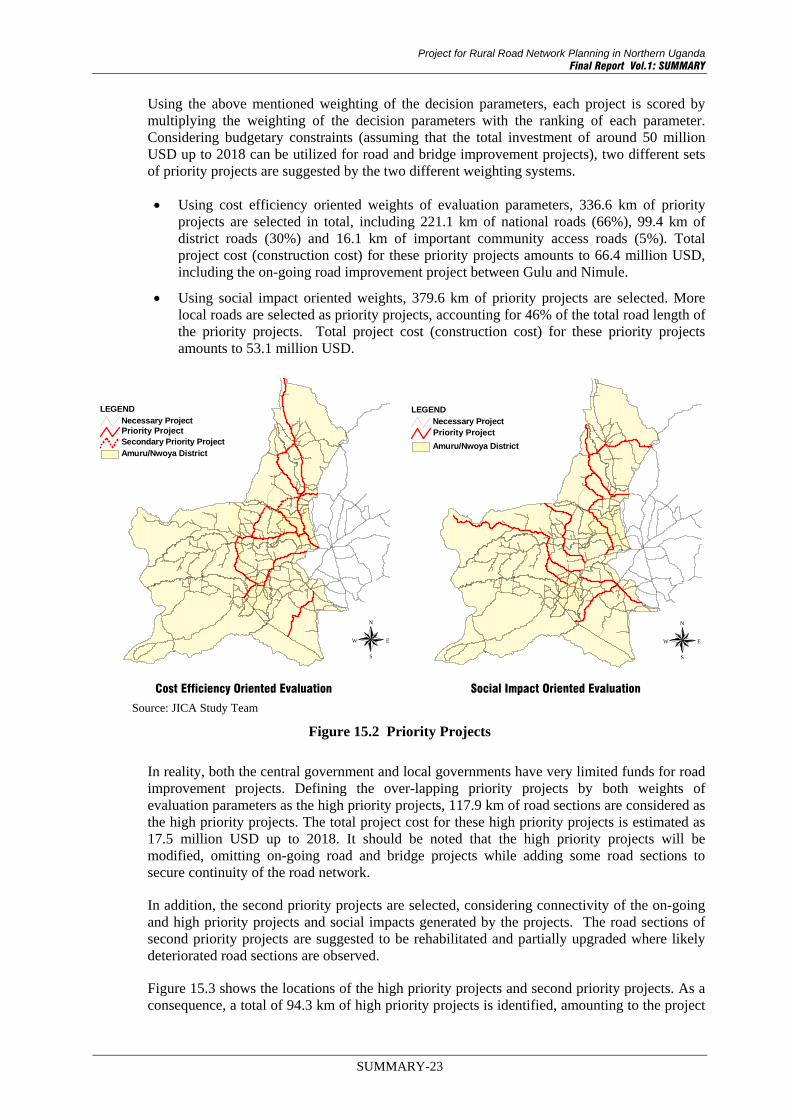
Project for Rural Road Network Planning in Northern Uganda Final Report Vol.1: SUMMARY
SUMMARY-23
Using the above mentioned weighting of the decision parameters, each project is scored by multiplying the weighting of the decision parameters with the ranking of each parameter. Considering budgetary constraints (assuming that the total investment of around 50 million USD up to 2018 can be utilized for road and bridge improvement projects), two different sets of priority projects are suggested by the two different weighting systems.
Using cost efficiency oriented weights of evaluation parameters, 336.6 km of priority projects are selected in total, including 221.1 km of national roads (66%), 99.4 km of district roads (30%) and 16.1 km of important community access roads (5%). Total project cost (construction cost) for these priority projects amounts to 66.4 million USD, including the on-going road improvement project between Gulu and Nimule.
Using social impact oriented weights, 379.6 km of priority projects are selected. More local roads are selected as priority projects, accounting for 46% of the total road length of the priority projects. Total project cost (construction cost) for these priority projects amounts to 53.1 million USD.
N
EW
S
Amuru/Nwoya District
Necessary ProjectHigh Priority Project
LEGEND
Secondary Priority Project
N
EW
S
Amuru/Nwoya District
Necessary ProjectHigh Priority Project
LEGEND
Cost Efficiency Oriented Evaluation Social Impact Oriented Evaluation
Source: JICA Study Team
Figure 15.2 Priority Projects
In reality, both the central government and local governments have very limited funds for road improvement projects. Defining the over-lapping priority projects by both weights of evaluation parameters as the high priority projects, 117.9 km of road sections are considered as the high priority projects. The total project cost for these high priority projects is estimated as 17.5 million USD up to 2018. It should be noted that the high priority projects will be modified, omitting on-going road and bridge projects while adding some road sections to secure continuity of the road network.
In addition, the second priority projects are selected, considering connectivity of the on-going and high priority projects and social impacts generated by the projects. The road sections of second priority projects are suggested to be rehabilitated and partially upgraded where likely deteriorated road sections are observed.
Figure 15.3 shows the locations of the high priority projects and second priority projects. As a consequence, a total of 94.3 km of high priority projects is identified, amounting to the project
Priority Project Priority Project

cost of 17.1 million USD. Also, 173.6 km of second priority projects are identified at the project cost of 11.2 million USD by omitting on-going road projects.
NR 005DR 60
3
NR
008
DR 1
37
CAR 110
DR 114
Atiak
Olamnyungo
PabboOtici Maro
Awobi
Kaladima
LegendHigh Priority ProjectUnder Construction ProjectSecond Priority Project
Source : JICA Study Team
Figure 15.3 Location Map of High Priority Projects and Second Priority Projects
Table 15.2 summarises the profile of the high priority projects.
Table 15.2 List of High Priority Projects
Project Cost (million Ushs.) ID Projects / Action
Length (km)
Width (m) Road
ConstructionBridge
ConstructionOthers Total
DR 603 Service Level 0⇒8 11.0 7.8 1,188 817 531 2,536
NR 005 Service Level 3⇒11 Service Level 3⇒20
14.5 8.1
8.6 12,927 0 3,426 16,353
NR 008 Service Level 2⇒11 13.0 8.6 4,300 0 1,140 5,440
DR 137 Service Level 0⇒7 6.2 6.5 1,357 0 360 1,717
CAR 110 Service Level 1⇒7 16.1 6.5 1,299 0 344 1,643
DR 114 Service Level 2⇒8 Service Level 2⇒17
10.0 5.3
7.8 4,405 0 1,167 5,572
Note: Other costs include contingency, engineering cost and local administration cost. Source: JICA Study Team
SUMMARY-24

Project for Rural Road Network Planning in Northern Uganda Final Report Vol.1: SUMMARY
SUMMARY-25
16. RURAL ROAD MAINTENANCE PLANNING
Capacity assessment of former Amuru District concerning road maintenance was conducted at three levels, namely; individual level, organization level and society level.
At the individual level, officers of the road sector were analyzed; at the organization level, the work department was targeted while the entire former Amuru District was considered at the society level. The capacity assessment was based on the comparison of expected capacity and current capacity.
From “cause analyses”, the main cause and measures to be taken were considered as shown below:
Cause-1: Some government and district positions remain vacant (lack of human assets)
Measure-1: Recruitment campaign by district or hiring of private consultants for support
Cause-2: Not enough equipment or basic facilities for operation (lack of physical assets)
Measure-2: Procurement and preparation of necessary facilities under donors’ support.
Cause-3: Personnel have limited experience of systematic technical training (lack of intellectual assets)
Measure-3: Take necessary training at institutes or training centres either domestically or internationally under donors’ support.
Cause-4: Poor management of policies and budgets by the central government
Measure-4: Engaging in PR/lobbying activities by district governments.
To respond to the increasingly deteriorating condition of DUCAR (District, Urban and Community Access Roads), the government has decided to change to an effective maintenance system by utilizing the private sector in the maintenance of the equipment. The key of the scheme is that the local governments will directly manage routine maintenance activities of their roads while the operator will manage the zonal equipment at a commercial cost to be met by the local governments.
The details of the Scheme, particularly the part which is concerned with district road maintenance, are shown in Table 16.1.
Table 16.1 Equipment Provided to the District and Its Operation Costs
No. Fuel per
day
No. of work-days in a
Month
Estimated fuel consumption per
month
Total estimated fuel consumption per
year 1 Motor Grader 1 150 15 2,250 27,0002 Dump Truck 1 70 15 1,050 12,6003 Pedestrian Roller 1 10 8 80 9604 Pick-up 1 20 10 200 2,4005 Motorcycle 2 5 15 150 1,800 Sub Total 44,760 Fuel Cost 2,000 x 44,760 = 89,520,000 Oil & Lubricants 0.1 x 89,520,000 = 8952000 Total 98,472,000
Source: The scheme for use of equipment in district labour (Force Account) operations in maintenance of district and urban roads, garbage collection and disposal and fire-fighting, MoWT, April 2010
Unit: Ushs.

According to the government policy, the road maintenance system for the national and district roads shall be implemented by the following method shown in Table 16.2.
Table 16.2 Method and Responsible Organizations for road maintenance
Road type Responsible organization
Type of road intervention
Method of delivery
Routine Force Account by utilizing Road Gangs and light equipment provided by the Government.
District & Urban District &
Urban (LGs) Periodic and Rehabilitation
Supervised by district under condition of utilizing the machinery and procuring material from the Zonal Mechanical Workshop.
Routine Contract basis, however partially by force account.
National UNRA Periodic and
Rehabilitation Contract basis.
Source: JICA Study Team To implement the above required tasks, a private consultant and mechanical staff shall be hired in each district and the district shall take responsibility in the following “three principal areas”.
a) Update and maintenance of the road inventory system
b) Development of road maintenance plan
c) Instruction, supervision and evaluation of the private consultant’s activity
The road inventory survey and continuous updating and maintenance of the road inventory system are the most significant activities in enabling the preparation of the road maintenance plan. Therefore, the road inventory survey shall be implemented by the district itself.
Furthermore, planning the annual and midterm road maintenance plans should be the key tasks for the district. To support the daily work of the district officer, the private consultant shall prepare the documents, drawings and cost estimates under the district officer’s instruction.
The capacities required for the district officer to manage the above “three principal areas” are as shown Table 16.3.
Table 16.3 Capacity Required of District Officer
Area Required Capacity
a) Update and maintenance of the road inventory system
Understanding the theory of RAMPS Practical operational skill to utilize RAMPS Understanding the technical evaluation skills of defects such as defect
type, cause of defect and countermeasure. b) Development of road
maintenance plan Road condition evaluation skill by utilizing output of RAMPS. Road planning skills, utilizing labour based technology in particular.
c) Instruction, supervision and evaluation of private consultants
Basic knowledge of road design and cost estimation. Basic knowledge of road construction.
Source: JICA Study Team
SUMMARY-26
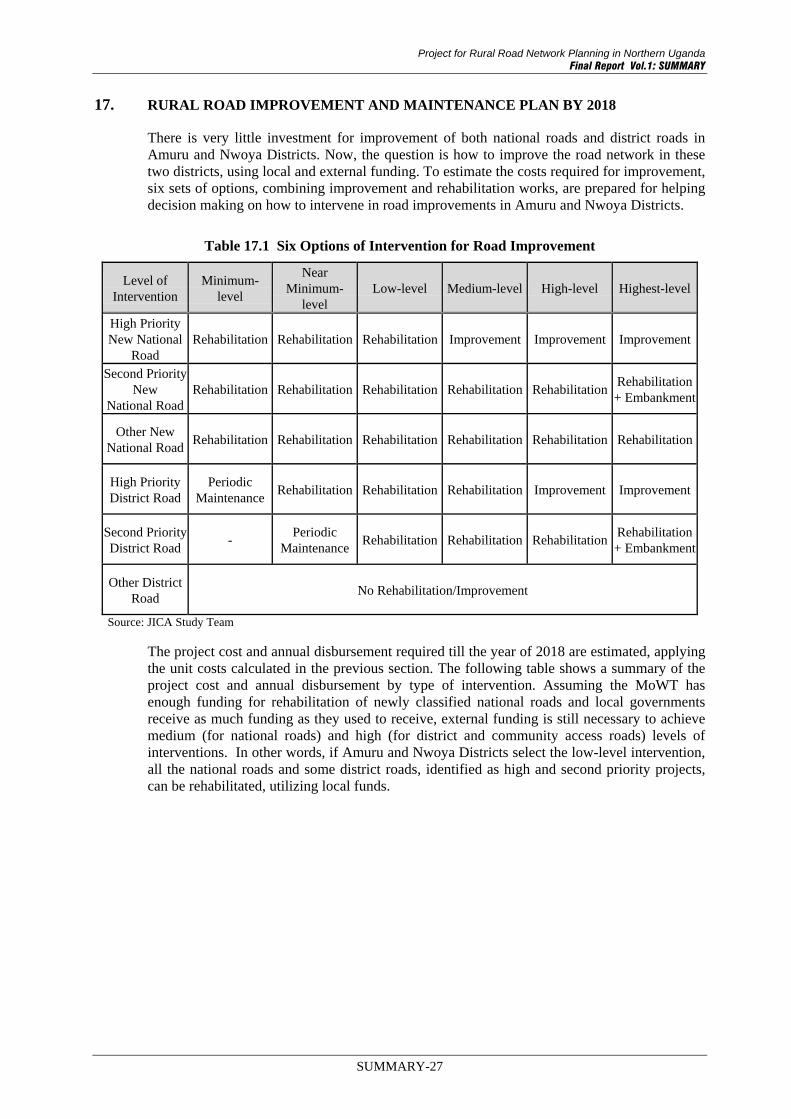
Project for Rural Road Network Planning in Northern Uganda Final Report Vol.1: SUMMARY
17. RURAL ROAD IMPROVEMENT AND MAINTENANCE PLAN BY 2018
There is very little investment for improvement of both national roads and district roads in Amuru and Nwoya Districts. Now, the question is how to improve the road network in these two districts, using local and external funding. To estimate the costs required for improvement, six sets of options, combining improvement and rehabilitation works, are prepared for helping decision making on how to intervene in road improvements in Amuru and Nwoya Districts.
Table 17.1 Six Options of Intervention for Road Improvement
Level of Intervention
Minimum-level
Near Minimum-
level Low-level Medium-level High-level Highest-level
High Priority New National
Road Rehabilitation Rehabilitation Rehabilitation Improvement Improvement Improvement
Second Priority New
National Road Rehabilitation Rehabilitation Rehabilitation Rehabilitation Rehabilitation
Rehabilitation + Embankment
Other New National Road
Rehabilitation Rehabilitation Rehabilitation Rehabilitation Rehabilitation Rehabilitation
High Priority District Road
Periodic Maintenance
Rehabilitation Rehabilitation Rehabilitation Improvement Improvement
Second Priority District Road
- Periodic
MaintenanceRehabilitation Rehabilitation Rehabilitation
Rehabilitation + Embankment
Other District Road
No Rehabilitation/Improvement
Source: JICA Study Team
The project cost and annual disbursement required till the year of 2018 are estimated, applying the unit costs calculated in the previous section. The following table shows a summary of the project cost and annual disbursement by type of intervention. Assuming the MoWT has enough funding for rehabilitation of newly classified national roads and local governments receive as much funding as they used to receive, external funding is still necessary to achieve medium (for national roads) and high (for district and community access roads) levels of interventions. In other words, if Amuru and Nwoya Districts select the low-level intervention, all the national roads and some district roads, identified as high and second priority projects, can be rehabilitated, utilizing local funds.
SUMMARY-27

Table 17.2 Project Cost and Annual Disbursement Required by Type of Intervention (Unit: thousand USD)
Level of Intervention
Minimum-level
Near Minimum-
level Low-level
Medium-level
High-level Highest-
level
National Road
Project Cost 5,008 5,008 5,008 15,530 15,530 20,743
Annual Disbursement
626 626 626 1,941 1,941 2,593
District Road/CARs
Project Cost 102 957 1,886 1,886 6,946 10,086
Annual Disbursement
13 120 236 236 868 1,261
Expected Funding Source
National Road Local Funding External Funding
District Road/CARs
Local Funding External Funding
Source: JICA Study Team
The cost estimated for the six options of the interventions reveals that the external funding is necessary for improvement of both national and district roads. The next question is the extent to which level of road improvement can be achieved in Amuru and Nwoya Districts. The following table compares the total road length of the necessary projects and the road length improved or rehabilitated by each intervention. It can be concluded that all the national roads will be either rehabilitated or improved and that most district roads and community access roads, identified as necessary projects, are left without any improvement or rehabilitation works.
Table 17.3 Road Length Improved/Rehabilitated by Type of Intervention (Unit: km)
Level of Intervention
Minimum-level
Near Minimum-
level Low-level
Medium-level
High-level Highest-
level
National Road: 294.6 km of Necessary Projects
Improved 0.0 0.0 0.0 39.2 39.2 142.2
Rehabilitated 294.6 294.6 294.6 255.4 255.4 152.4
No Improvement
0.0 0.0 0.0 0.0 0.0 0.0
% of Improved Road
0% 0% 0% 13% 13% 48%
District Road/CARs: 332.6 km of Necessary Projects
Improved 0.0 0.0 0.0 0.0 55.1 125.7
Rehabilitated 55.1 125.7 125.7 125.7 70.6 0.0
No Improvement
277.4 206.9 206.9 206.9 206.9 206.9
% of Improved Road
0% 0% 0% 0% 17% 38%
Source: JICA Study Team
SUMMARY-28

Project for Rural Road Network Planning in Northern Uganda Final Report Vol.1: SUMMARY
Accordingly, the following recommendations can be made to improve/rehabilitate district roads and community access roads.
The rural road master plan should be formulated to guide selection of priority projects and allocation of scarce local funds to these priority projects. This master plan should also be associated with the monitoring and evaluation plan to assess the achievement of the preset targets.
The Road Fund is going to provide a fixed percentage (23%) of its revenue for maintenance of the district roads. This definitely contributes to enhancing sustainability of rural road maintenance in Amuru and Nwoya Districts. Ideally, more funding should be available to rehabilitate more district and community access roads.
Another recommendation can be made on reduction of investment. One of the possibilities is use of cost efficient technology, e.g., low cost sealing for low traffic roads.
Donor coordination and inter-ministerial coordination should be in place to efficiently use scarce resources.
Capacity development, especially human resource development, is vital for planning and execution of physical works, and monitoring and evaluation exercises to improve district roads.
18. PROJECT EVALUATION FOR SELECTED HIGH PRIORITY PROJECTS
Economic benefits derived from the proposed necessary projects and high priority projects are composed of savings in time-related vehicle operating costs and travel time costs. Savings in the distance-related vehicle operating costs show negative gains since the road users travel longer distances since they divert from their routes to the project roads when the level of service of the project roads improves. As tabulated in the following table, the projected B/C ratio is estimated at 0.02-0.28. Assuming the social discount rate of 12% per annum, it can be concluded that the proposed necessary projects and high priority projects are NOT economically feasible. Also, any adverse effects such as increase in the project cost and/or reduction in the traffic demand will worsen the economic feasibility of those projects.
Table 18.1 Summary of Economic Analysis
Net Present Cost (thousand USD)
Economic Analysis Indicators
Case Construction
Cost Maintenance
Cost
Net Present Benefit
(thousand USD) B/C
Net Present Value
(thousand USD)
EIRR
All necessary projects
92,880 9,476 2,821 0.03 -99,534 #DIV/0!
CAR110 543 85 177 0.28 -450 3.6%DR114 1,840 415 320 0.14 -1,935 #DIV/0! DR137 567 346 31 0.03 -882 #DIV/0! DR603 838 299 195 0.17 -942 #DIV/0! NR005 5,401 1,133 361 0.06 -6,173 #DIV/0!
NR008 1,797 566 48 0.02 -2,315 #DIV/0! Source: JICA Study Team
However, there is a high probability that these high priority projects can turn into economically viable projects. For instance, the project cost of these high priority projects can
SUMMARY-29

be significantly reduced when the scope of project works is limited to improvement of specific road sections that require urgent upgrade works, e.g., embankment works at the swampy area. Assuming only 10% of the whole road section of high priority projects requires urgent upgrade works, the project’s economic viability is further substantiated with B/C Ratio of 0.06-1.28 and some priority projects, i.e., CAR110, show ample positive NPV, as tabulated in the following table.
Table 18.2 Summary of Economic Analysis (Reduced Project Cost Case)
Net Present Cost (thousand USD)
Economic Analysis Indicators
Case Construction
Cost Maintenance
Cost
Net Present Benefit
(thousand USD) B/C
Net Present Value
(thousand USD)
EIRR
All necessary projects
9,288 9,476 2,821 0.15 -15,942 #DIV/0!
CAR110 54 85 177 1.28 38 14.9%
DR114 184 415 320 0.53 -279 4.9%
DR137 57 346 31 0.08 -371 #DIV/0!
DR603 84 299 195 0.51 -188 4.1%
NR005 540 1,133 361 0.22 -1,312 #DIV/0!
NR008 180 566 48 0.06 -698 #DIV/0!
Note: The cost of each project is assumed to be reduced by 90%. Source: JICA Study Team
In addition to these quantifiable economic benefits, there are various unquantifiable impacts generated from the project, including decrease in traffic accidents, saving in energy consumption, income generation, stimulation of the regional economy and for the particular case of Amuru and Nwoya Districts; acceleration of the IDPs’ return and resettlement process by enhancing social infrastructure development in the home/return villages.
19. TECHNICAL TRANSFER TO AMURU AND NWOYA DISTRICTS
In order to enhance the sustainability of rural road network planning in Northern Uganda, technical transfer for the District Engineer, District Planner, Senior Engineer, Road Inspector, District Water Officer and Borehole Maintenance Officer of former Amuru District was conducted as shown in Table 19.1. The overall goal of the technical transfer was to increase capacity to develop and update the “Rural Road Master Plan”.
Table 19.1 Schedule of Technical Transfer
Date Contents Venue Participants
2009/10/23 Rural Road Master Planning and Capacity Building (Tsukahara)
Study Team Gulu Office
Okello Louis P’Abur (Acting District Engineer) from former Amuru District
2009/10/27 Rural Road Master Planning and Capacity Building (Tsukahara)
Social Infrastructure Survey (Tsukahara) Road Inventory Survey (Nakajima)
Study Team Gulu Office
Geofrey Nyeko (Acting District Water Officer) from former Amuru District
Ojok Robert (Road Inspector) from former Amuru District
2010/03/12 Formulation of Rural Road Development Master Plan for Amuru District (Sasaki)
Study Team Gulu Office
Okello Louis P’Abur (Acting District Engineer) from former Amuru District
SUMMARY-30
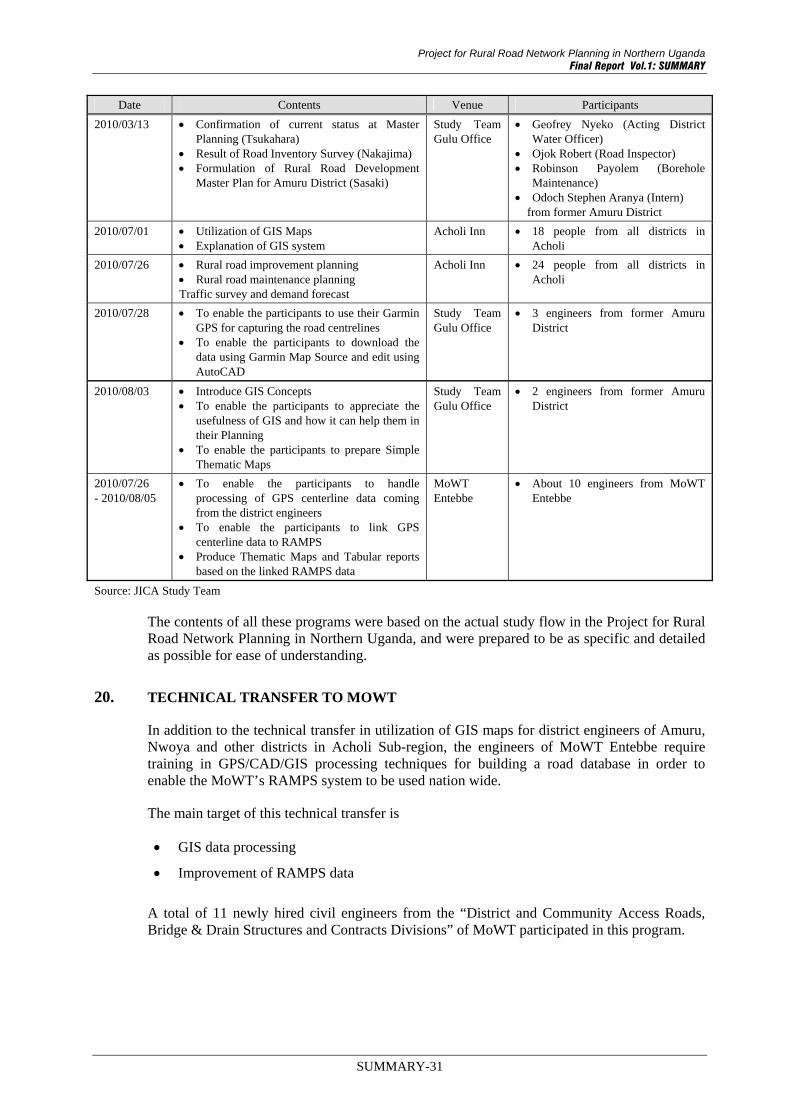
Project for Rural Road Network Planning in Northern Uganda Final Report Vol.1: SUMMARY
SUMMARY-31
Date Contents Venue Participants
2010/03/13 Confirmation of current status at Master Planning (Tsukahara)
Result of Road Inventory Survey (Nakajima) Formulation of Rural Road Development
Master Plan for Amuru District (Sasaki)
Study Team Gulu Office
Geofrey Nyeko (Acting District Water Officer)
Ojok Robert (Road Inspector) Robinson Payolem (Borehole
Maintenance) Odoch Stephen Aranya (Intern)
from former Amuru District
2010/07/01 Utilization of GIS Maps Explanation of GIS system
Acholi Inn 18 people from all districts in Acholi
2010/07/26 Rural road improvement planning Rural road maintenance planning Traffic survey and demand forecast
Acholi Inn 24 people from all districts in Acholi
2010/07/28 To enable the participants to use their Garmin GPS for capturing the road centrelines
To enable the participants to download the data using Garmin Map Source and edit using AutoCAD
Study Team Gulu Office
3 engineers from former Amuru District
2010/08/03 Introduce GIS Concepts To enable the participants to appreciate the
usefulness of GIS and how it can help them in their Planning
To enable the participants to prepare Simple Thematic Maps
Study Team Gulu Office
2 engineers from former Amuru District
2010/07/26 - 2010/08/05
To enable the participants to handle processing of GPS centerline data coming from the district engineers
To enable the participants to link GPS centerline data to RAMPS
Produce Thematic Maps and Tabular reports based on the linked RAMPS data
MoWT Entebbe
About 10 engineers from MoWT Entebbe
Source: JICA Study Team
The contents of all these programs were based on the actual study flow in the Project for Rural Road Network Planning in Northern Uganda, and were prepared to be as specific and detailed as possible for ease of understanding.
20. TECHNICAL TRANSFER TO MOWT
In addition to the technical transfer in utilization of GIS maps for district engineers of Amuru, Nwoya and other districts in Acholi Sub-region, the engineers of MoWT Entebbe require training in GPS/CAD/GIS processing techniques for building a road database in order to enable the MoWT’s RAMPS system to be used nation wide.
The main target of this technical transfer is
GIS data processing
Improvement of RAMPS data
A total of 11 newly hired civil engineers from the “District and Community Access Roads, Bridge & Drain Structures and Contracts Divisions” of MoWT participated in this program.

SUMMARY-32
PART 2: PREPARATION AND IMPLEMENTATION OF PILOT PROJECT
21. OBJECTIVE AND SCOPE OF THE PILOT PROJECT
At the initial stage of the Study, the pilot project, bridge construction and road improvement/maintenance works, were implemented in order to examine their impact on the IDPs return process and to feedback the findings to the formulation of the Master Plan of the rural road network.
Two bridge sites for the pilot project were selected out of the various bridge requests by the local personnel, because they were located on Aswa River which divides the northern original village area and southern IDP camps along the national road (Alero-Anaka-Wii Anaka-Lolim road).
Results of the pilot project will be evaluated so that an inference can be made on their effect on acceleration of the IDP return process and the viability of a road and bridge construction project in Northern Uganda. This would also be useful in setting the indexes for conducting monitoring in the 2nd Phase.
Location of the pilot project is shown in Figure 21.1. Both bridges are on the district feeder roads just upgraded from community access roads in June 2009. Bridge No.1 is along the Otwee-Anaka road and Bridge No.2 is along the Otwee-Wii Anaka road.
Source: JICA Study Team
Figure 21.1 Location of the Pilot Project
The pilot project is divided into 2 lots for procurement of the contractor. The general scopes of these lots are as follows:
Lot 1 (Otwee – Anaka Road): Road improvement for gravel road of 6.20km (including construction of a reinforced concrete bridge of 35m length, 3 box culverts and 1 pipe culvert) and maintenance of gravel road of 21.31km.
Amuru District
Nwoya District

Project for Rural Road Network Planning in Northern Uganda Final Report Vol.1: SUMMARY
Lot 2 (Otwee Wii Anaka Road): Road improvement for gravel road of 0.66km (including construction of a reinforced concrete bridge of 45m length) and maintenance of gravel road of 44.00km.
22. BASIC PLAN
The Pilot Project roads are split into sections requiring improvement and sections requiring maintenance with due consideration of need for prevention of future conflict between the road administrators and land owners given that most sections of the existing roads pass through private plots.
The design defines “improvement” and “maintenance” as follows;
Improvement: Horizontal and vertical alignment are newly designed in consideration of the future road network in the district. The cross sections, given in accordance with the drainages and safety facilities, are also designed.
Maintenance: Horizontal and vertical alignment remain unchanged and the work is done within the width of the existing road. No concrete structure is designed in such sections.
Generally, improvement is specified for sections where some problems such as poor drainage and safety exist and make the road impassable.
Bridge length and span arrangement were decided in consideration of the items below:
River width High Water Level Geological conditions Road profile Height of Abutment (less than 10m)
1) Bridge on Otwee - Anaka Road (Bridge No.1)
Bridge Length: 35.00 m Span arrangement: A three simple span arrangement, which is comprised of 10.00m +
15.00m +10.00m spans for a total bridge length of 35.00 m, was adopted. P1 Pier is located at the right bank and P2 Pier is located at the left bank.
2) Bridge on Otwee – Wii Anaka Road (Bridge No.2)
Bridge Length: 45.00 m
Span arrangement: A four simple span arrangement, which is comprised of 10.00m + 15.00m +10.00m + 10.00m spans for a total bridge length of 45.00 m was adopted. P1 Pier is located at the right bank side while the P2 and P3 Piers are located at the left bank side.
The former Amuru District prepared a Project Brief of the pilot project in coordination with the JICA Study Team. The conclusion of the Project Brief was that the negative impacts would be minor while positive impacts would be significant. The important mitigation measures were identified. The Project Brief was submitted to NEMA on Oct. 26, 2009. The district received formal approval for the environmental aspects of the pilot project from NEMA in February, 2010.
Land tenure is mostly of the customary type along the Otwee - Anaka road, and of leasehold type along the Otwee - Wii Anaka and Lolim roads. The former Amuru District organized public meetings with the local communities on the 21st and 22nd of Oct. 2009, with the
SUMMARY-33

purpose of obtaining written agreements with the local communities for the acquisition of the road reserve. Where the project affects the land properties in the leasehold tenure system, the District has engaged in negotiations to obtain the consent of the land owners for the implementation of the project and reach an agreement for compensation.
23. BID CONDITIONS AND RESULT OF BIDDING
The qualification criteria were decided in consideration of availability of a contractor with necessary engineering and financial capacity. The following requirements, in general, were thus introduced:
Compliance to the Contract Conditions Reliable Construction Schedule Reliable Construction Plan Reliable Bid Security Site Visit Certificate
The important subject to be focused on in this bidding was the engineering experience in reinforced concrete bridge construction. However, most of the major bridge construction projects in Uganda had been financed by foreign donors with adoption of international bidding. As a result, the projects, without exception, had been carried out by international contractors.
The MoWT recommended 10 Ugandan contractors who had experience in concrete bridge work. These were further assessed by the Study Team. According to the assessment by the Study, the contractors of classes B or lower were disqualified as being ineligible such that a class A or A+ classification for a contractor was set as a pre-requisite criterion for eligibility.
As for the criteria for the financial and engineering aspects, they were decided upon in consideration of the six general requirements in the case of Japan’s Loan Projects. However some modifications were made to the requirements so as to ensure appropriate competition among Ugandan contractors.
The bid evaluation started from the bid opening. At the bid opening, only the confirmation of the submission of required documents was carried out. No bids were removed at this stage even when the submissions of the bid were not in accordance with the instructions to the bidders.
Subsequently, the screening of the bids, i.e. the Preliminary Examination, was carried out by representatives from the Employer (JICA), Counterparts (MoWT and Amuru District) and the Study Team. The screening was conducted only to check for the submission of the required documents from the bidders. The detailed contents of the documents were not examined at this stage. The bids without required submissions were removed at this stage.
After the Preliminary Examination, the evaluations were carried out step by step and the bids without sufficient submissions and/or qualifications were removed at subsequent stages. The bids that passed through all the stages advanced to the final evaluation (Financial Aspect).
In the final evaluation, the price comparison among the remaining bids was carried out and the bid which offered the most reasonable price was selected as the Recommendable Bid.
The bid opening and evaluation were implemented as summarised in the following table:
SUMMARY-34

Project for Rural Road Network Planning in Northern Uganda Final Report Vol.1: SUMMARY
Table 23.1 Bid Opening and Evaluation Schedule for Lot 1 and Lot 2
Project Name (LOT 1) Construction of Bridge over Aswa River and Access Road Improvement/Maintenance Works in Amuru District (Lot 1)
Bid Notice 26th November, 2009
Site Visit for bidders 9th December , 2009 ( 7 companies )
Bidding Date 13th January, 2010 ( 4 companies )
# of Companies which passed the Evaluation
1 Company
Date of Contract 1st March, 2010
Project Name (LOT 2) Construction of Bridge over Aswa River and Access Road Improvement/Maintenance Works in Amuru District (Lot 2)
Bid Notice 26th November, 2009
Site Visit for bidders 6th December 9, 2009 ( 7 companies ) / 24th February, 2010 ( 2 Companies for re-tender)
Bidding Date 13th January, 2010 ( 5 companies ) / 10th March, 2010 ( 6 Companies for re-tender)
# of Companies which passed the Evaluation 1 Company / 1 Company (for re-tender)
Date of Contract 26th March, 2010
Source: JICA Study Team
24. IMPLEMENTATION PLAN
A provisional construction schedule for the pilot project was estimated on the basis of quantities of construction works, local conditions, etc. The construction schedules for the two routes of the pilot project are as shown in Figure 24.1.
: Rainy Season
Dec
Dec10
Bridge Surface
Demobilization
Sep Oct NovMay Jun Jul Aug
Otwee-Anaka Road
Otwee-Wii Anaka RoadMar Apr
Mobilization
Earth Works
Bridge Works
Drainage Works
Demobilization
Mobilization
Earth Works
Bridge Works River Diversion
Substructure
Superstructure
Superstructure
Bridge Surface
Box/Pipe Culvert
1Mar
River Diversion
Substructure
2Apr
3May
4JulJun5
Aug6 7
Sep8
Oct9
Nov
1 2 3 4 5 6 7 8 9 10
Source: JICA Study Team
Figure 24.1 Construction Schedules for Pilot Project
SUMMARY-35

25. BASELINE SURVEY
In order to evaluate the outcome and impact of the pilot project, an Origin-Destination (OD) survey and community interview survey were conducted prior to the commencement of the construction (March 2010). The same kind of survey will be conducted after the completion of the project. The changes, such as the amount of traffic including pedestrians, trip purpose and distance, would be expected to show the outcome effectively.
Origin-Destination (OD) survey
The OD survey was carried out by the local staff at the locations of Lot 1 and Lot 2 based on the contents of survey shown in Table 25.1. The first survey as before construction was conducted at the beginning of March 2010.
Table 25.1 Contents of the OD survey
Lot 1 (Otwee- Anaka) Lot 2 (Otwee-Wii Anaka) Location Beside the existing bridge on
Aswa River for Lot 1 Beside the existing bridge on Aswa River for Lot 2
Date 2010/3/2 (Tue) 2010/3/4 (Thu)
Time 7 a.m. – 7 p.m. (12hours)
Interviewee All by-passers
Method Interview of by-passers using interview form Source: JICA Study Team
Community Interview survey
It is expected that the pilot project will bring a change to the lives of the people who live near the bridges, in particular, regarding aspects concerning accessibility. Therefore, in addition to the origin-destination survey, interview surveys at several communities along the roads were conducted. The outline of the community interview survey is shown in Table 25.2.
Table 25.2 Outline of the Community Interview Survey
Lot 1 (Otwee- Anaka) Lot 2 (Otwee- Wii Anaka)
Northern Southern Northern Southern
Target Sub-village (Village)
Lungulu (Bwobonam B), Lacici (Lulyango)
Lulyango Center (Lulyango), Bidati (Bidati)
Denga (Pamin awure), Abongo Luduku (Latek Odong)
Lamin Olango (Pajengo), Ayero Olwangi (Pamin Olango)
Survey Date 18 Mar. 2010
4 Mar. 2010 (Lulyango Centre), 12 Mar. 2010 (Bidati)
30 Mar. 2010 (Denga), 26 Mar. 2010 (Abongo Luduku)
1 Apr. 2010
Methodology Interview survey by prepared questionnaire
Interviewee Sub-village Leader
Source: JICA Study Team
The summary of the baseline survey results are as follows.
Origin-Destination (OD) survey
(Lot 1)
Number of the by-passers: 128 people for both directions
SUMMARY-36

Project for Rural Road Network Planning in Northern Uganda Final Report Vol.1: SUMMARY
Transportation type: 4 motorbikes, 44 bicycles, 75 pedestrians for both directions Main trip purpose: Private 18, Hospital 17, School 13 for both directions Commodity type: Convey nothing 63 (to go to hospital or school and come home), Fuel 17, Vegetation 16 Origin-Destination: The largest number of trips was between Lacic and Lulyango at 33 trips
(Lot 2)
Number of the by-passers: 91 people for both directions Transportation type: 19 vehicles, 14 motorbikes, 20 bicycles, 11 pedestrians for both directions Main trip purpose: Work 38, Private 6 for both directions Commodity type: Food 63, Vegetation 12 Origin-Destination: The largest number of trips was between Lbengec and Latoro at 35 trips
Community Interview survey
(Lot 1) Villages located on the northern side of the bridge
Population of Original Village: Lungulu Sub-village; Returnees 320, transit site 80, Lacic Sub-village; Returnees 400, Transit site 200 Access to Anaka by car: Lungulu Sub-village; 1.5 hrs, Lacic Sub-village; 2.0 hrs Name of cash crop: Rice, Groundnuts Marketing: Sell to middlemen from Gulu or Anaka
(Lot 2) Villages located on the northern side of the bridge
Population of Original Village: Denga Sub-village; Returnees 450, Transit site 30, Abongo Luduku Sub-village; Returnees 400, Transit site 200 Access to Purongo by car: Denga Sub-village; 4.0 hrs, Abongo Luduku Sub-village; 2.0 hrs Name of cash crop: Rice, Groundnuts Marketing: Sell to middlemen from Gulu, Amuru or Pakwach
26. EVALUATION OF PILOT PROJECT
In order to evaluate the outcome and impact of the pilot project, an Origin-Destination (OD) survey and community interview survey were conducted one month after completion of the pilot project (October 2011).
Origin-Destination (OD) survey
The second OD survey after construction was conducted in the middle of October 2011 as shown in Table 26.1.
Table 26.1 Contents of OD survey
Lot 1 (Otwee- Anaka) Lot 2 (Otwee-Wii Anaka) Location On the constructed bridge on
Aswa River for Lot 1 On the constructed bridge on Aswa River for Lot 2
Date 2011/10/11 (Tue) 2011/10/18 (Tue)
Time 6 a.m. – 6 p.m. (12hours)
Interviewee All by-passers
Method Interview with by-passers by interview form Source: JICA Study Team
Community Interview survey
Two sub-villages were selected on the northern side of the bridge. One sub-village was selected on the southern side of the bridge. As a result, three sub-villages were selected for one
SUMMARY-37

bridge. The same number of sub-villages was also selected for the other bridge. Therefore, six sub-villages were selected for the interview survey in total. At the selected sub-villages, sub-village leaders were asked about their current lives there; such as population, accessibility to major trading centres, agriculture, and accessibility to social services. The outline of the community interview survey is shown in the Table 26.2.
Table 26.2 Outline of the Community Interview Survey
Lot 1 (Otwee- Anaka) Lot 2 (Otwee- Wii Anaka)
Northern Southern Northern Southern
Target Sub-village (Village)
Lungulu (Bwobonam B), Lacic (Lulyango)
(Bidati (Badati) Abongo Luduka (Latek Odong)
Lamin Olango (Pajengo), Ayero Olwangi (Pamin Olango)
Survey Date 10 Oct 2011 12 Oct 2011 19 Oct 2011 17 Oct 2011
Methodology Interview survey by prepared questionnaire
Interviewee Sub-village Leader
Source: JICA Study Team
The summary of survey results follows. The numbers in ( ) show the results of the previous survey (baseline survey in March 2010).
(1) Survey Results for Lot 1 (Otwee-Anaka)
Origin-Destination (OD) survey
Number of the by-passers: 193 (128) people for both directions Transportation type: 15 (0) vehicles, 21 (4) motorbikes, 64 (44) bicycles, 17 (75) pedestrians for both directions Main trip purpose: Work 27 (13), Private 22 (18), Business 20 (10), Hospital 9 (17), School 6 (13) for both directions Commodity type: Convey nothing 56 (63), Foods 34 (2), Fuel 1(17), Vegetation 4 (16) Origin-Destination: The largest number of trips was between Lukai and Anaka at 30 trips (Lacic and Lulyango at 33 trips)
Community Interview survey
Population of Original Village (on the northern side of the bridge): Lacic Sub-village ; Returnees 510, Transit site 0 (Returnees 400, Transit site 200)
Access to Anaka by car: Lungulu Sub-village; 20 min (1.5 hrs), Lacic Sub-village; 30 min (2.0 hrs)
Name of cash crop: Rice, Groundnuts (Rice, Groundnuts)
Marketing: Sell to middlemen at trading centre (Gulu, Anaka, Panyimur, Amuru), Sell to middlemen from Gulu or Anaka
(2) Survey Results for Lot 2 (Otwee- Wii Anaka)
Origin-Destination (OD) survey
Number of the by-passers: 46 (91) people for both directions Transportation type: 4 (19) vehicles, 6 (14) motorbikes, 1 (20) bicycles, 6 (11) pedestrians for both directions Main trip purpose: Work 10 (38), Private 2 (6), Business 3 (0) for both directions Commodity type: Foods 3 (63), Vegetation 1 (12)
SUMMARY-38

Project for Rural Road Network Planning in Northern Uganda Final Report Vol.1: SUMMARY
Origin-Destination: The largest number of trips was between Prongo and Latoro at 8 trips (Lbengec and Latoro at 35 trips)
Community Interview survey
Population of Original Village (on the northern side of the bridge): Abongo Luduku Sub-village; Returnees 672, Transit site 0 (Returnees 300, Transit site 200) Access to Purongo by car: Abongo Luduku Sub-village 40 min (2.0 hrs) Name of cash crop: Rice, Groundnuts (Rice, Groundnuts) Marketing: Sell to middlemen at trading centre (Gulu), Sell to middlemen from Gulu, Amuru or Pakwach
Comparing the survey results before and after construction of the bridges, the following impacts are observed.
(3) Impacts by Lot 1 (Otwee-Anaka) Bridge
This bridge is used for social purposes such as to commute to the hospital, school and their work place.
Before construction, no vehicle was able to cross the river. All vehicles were forced to use another route which is more than 1 hour drive further. Hence, there was a limit on the distance that they could convey products produced in the northern part of Nwoya to the consumption areas since the river was a bottleneck for transport. And most of the products ended up going to Anaka.
After the bridge was constructed, vehicles could pass in all seasons. It seems that the working and business opportunities for the people in the surrounding area were increased by improvement of the access road. For example, the village people can choose to sell their products in trading centres such as Gulu and Anaka by themselves using private trucks (a kind of shared-taxi), which now come in on this road after completion of the bridge, instead of waiting for a middle man at their home villages. These impacts will contribute to resettlement for the returnees in their original villages from an IDP camp.
Before construction of Bridge No.1, the number of IDP returnees of Lucic Sub-Village, located in the northern Area of the bridge, was around 400, and the number of IDP that lived in transit sites were around 200 (the rate of returnees was 67%). After completion of Bridge No.1, the number of IDP returnees of Lucic Sub-Village was around 510, and the number of IDP that lived in transit sites were zero (the rate of returnees was 100%). The main reason that all the IDP had already returned at the time of bridge completion can be that the Government had issued a closure policy for IDP camps by July 2010. In addition to this, the reopening of a school in this area and improved access to Anaka town with a detour during the bridge construction stage might accelerate IDP return and resettlement to their original villages.
The amount of traffic passing Bridge No.1 is still small at this moment and there are only 15 vehicles and 21 motorbikes per day according to the survey. However, it is expected that this number will increase soon as investment starts in this area. Thus, an additional survey after a year to monitor shall be necessary to find the true impact of the construction.
Another impact that can be observed is the travel distance between the two district capitals. From Otwee - the capital of Amuru district to Anaka – the capital of Nwoya district, vehicles had to travel through Lamogi or Alelo before construction, which took approximately 90 minutes to drive. After construction this became 30 minutes, so an hour of travel was eliminated.
SUMMARY-39

(4) Impacts by Lot 2 (Otwee- Wii Anaka) Bridge
Before construction of Bridge No.2, the number of IDP returnees of Abong Luduka Sub-Village, located in the northern Area of the bridge, was around 300, and the number of IDP that lived in transit sites were around 200 (the rate of returnees was 60%). After completion of Bridge No.2, the number of IDP returnees of Abong Luduka Sub-Village was 672, and the number of IDP that lived in transit sites was zero (the rate of returnees was 100%). The main reason that all the IDP had already returned at the time of bridge completion can be that the Government issued a closure policy for IDP camps by July 2010, as stated before.
This bridge is used for business purposes, especially for transporting agricultural products and the workers at the farms. The number of by-passers after completion of the bridge was only 46 per 12 hours. This number is 45 people less compare with before the construction. It seems that these traffic demands vary depending on planting and harvesting season of the products. In northern Uganda, the usual planting season is in the beginning of the rainy season (March to July) and crops are harvested at the end of the rainy season and then transported to markets during the dry season.
A total of 19 vehicles crossed No.2 Bridge at the time of the baseline survey before the bridge construction was conducted in March, 2010 (end of the dry season). On the other hand, only 4 vehicles crossed No.2 Bridge at the time of the survey after completion of the bridge conducted in October, 2011 (end of the rainy season). The reason for the decrease in traffic after completion of the bridge will be attributed to this seasonal variation.
In Lot-2, the impact of the bridge was not found clearly. However, considering the potential it has for the land, it is expected that the bridge shall contribute to the growth of the economy in the long term. It is recommended to monitor the traffic of this bridge for each season to comprehend the exact impacts of the bridge.
SUMMARY-40

Project for Rural Road Network Planning in Northern Uganda Final Report Vol.1: SUMMARY
PART 3: PLANNING AND PREPARATION OF URGENT PROJECT
IN ACHOLI SUB-REGION
27. BACKGROUND OF THE URGENT PROJECT
Acholi Sub-region was impoverished by the 20 year-conflict. Since the cease-fire agreement concluded between LRA and the Government of Uganda in August 2006, construction of hospitals, schools and wells have been implemented by humanitarian assistance organizations. However these facilities are not accessible enough and this could be considered as one of the reasons why the IDPs (Internally Displaced Persons) have been unable to return to their home villages.
Figure 27.1 shows the locations of the projects requested by the Ugandan side.
Source: JICA Study Team
Figure 27.1 Locations of the Requested Projects
Japanese Grant Aid for conflict prevention and peace building is to be applied for the detailed design and implementation stage of the Urgent Project. Since FY2002, in accordance with contracts with developing countries' governments, Japan International Cooperation System (JICS) has been serving as a procurement management agent, managing funds and overseeing and supporting activities appropriate to various program formats.
SUMMARY-41

28. CONTENTS OF THE PROJECT
The target of the project is improvement of National Roads and District Roads including Community Access Roads that will be upgraded to District Roads in Acholi Sub-region and Important Community Access Roads in Nwoya and Amuru Districts. The overall goal of the project is to contribute to the IDP return process by bridge reconstruction and road improvement projects such as: reconstruction of bridges that are aging and/ or have narrow widths that limit vehicle passage as well as temporary wooden bridges and Bailey bridges and improvement of poorly maintained trunk roads that vehicles pass over at low speeds.
The Ugandan side requested 13 projects to be undertaken by the Japanese side and these projects consisted of improvement of National Roads, District Roads and Community Access Roads (CAR) as shown in Table 28.1.
Although the Japanese side recognized the necessity of improvements or new construction on all of the requested roads and bridges, the degree of contribution to the return of IDPs, and the urgency and necessity are different with each location. Social environmental issues such as land acquisition and resettlement are also different at each location.
Consequently, selection of the project was carried out based on the following conditions.
High degree of contribution to the return and resettlement of IDPs
High degree of urgency
Significant benefit
Low social environmental issues
Figure 28.1 and Table 28.1 show the locations and specifications of the selected high prioritized projects.
Source: JICA Study Team
04 Otaka Bridge (Kilak-Abim Rd.)
01-1 Atiabar Bridge
01-2 Opal Box Culvert
01-3 Oitin Bridge (repair the
existing bridge)
02 Arainga Bridge
03 Ayago Bridge
04 Otaka Bridge
05-1 Chome Bridge
05-2 Dawa Bridge
02
05-1
05-2
01-2
01-3
01-1
03
06
Olwiyo-Anaka Road
Figure 28.1 Location of High Priority Projects
SUMMARY-42

Project for Rural Road Network Planning in Northern Uganda Final Report Vol.1: SUMMARY
Table 28.1 Specifications of the Proposed Roads and Bridges
No.1 No.2 No.3 No.4 No.5 No.6
Section No. New Bridge & Box Culvert Construction
Bridge Re-construction
New Bridge Construction
Bridge Re-construction
New Bridge Construction
Road Improvement
Location (District) Gulu – Amuru Lamwo Nwoya Agago Gulu Nwoya
Road Class
CAR
(that is planned to be upgraded
to a District Road )
District Road** CAR
National Road
(Design Class Road II)
District Road
(Partly CAR, to be upgraded to District Road )
National Road
(Design Class Road II)
Beginning Point North of Coope
IDP Camp Palonga Lamoki JCT
Approach Road only
District Road side JCT
Anaka Border (Gulu Side)
End Point Pabo JCT Palacam Lutuk SatelliteApproach Road
only Acet JCT Olwiyo JCT
Improvement Road Width (m)
6.0 6.0 3.0 9.0 6.0 9.0
Number of Carriageway lanes to be improved
2 2 1 2 2 2
Pavement Gravel Gravel Gravel DBST Gravel DBST
Total Road Length (km, including bridge
section) 22.8 19.8 7.9 0.6 23.0 11.0
Improvement (km)
2.7 0.7 0.8 0.6 5.9 11.0 Maintenance*
(km) 20.1 19.1 7.1 - 17.1 -
Bridge Name ‐Atiabar Br. - Arainga Br. - Ayago Br. - Otaka Br. - Chome Br. - Dawa Br.
-
Span Length (Number of Spans)
15.0 m (1) 15.0 m (1) 15 m (1) 15 m (3) total 45m
15.0 m (1) 15.0 m (1)
-
Superstructure Type RC Girder
Simple girder RC Girder
Simple girder RC Girder
Simple girder
RC Girder continuous
girder
RC Girder Simple girder
-
Live Load Type BS:HA
JPN: A type BS:HA
JPN: A type BS:HA
JPN: A type BS:HB
JPN: B type BS:HA
JPN: A type -
Bridge Width (m) 6.0 m 6.0 m 6.0 m 9.0 m*** 6.0 m -
Abutment Type
Reversed T Type
Reversed T Type
Reversed T Type
Reversed T Type
Reversed T Type
- Abutment
Foundation Type
Spread Foundation
Spread Foundation
Spread Foundation
Spread Foundation
Spread Foundation
-
Pier Type None None None Wall Type None - Pier
Foundation Type
- - - Spread
Foundation - -
River Bank Protection (Around Abutments)
Masonry Retaining Wall
Masonry Retaining Wall
Masonry Retaining Wall
Masonry Retaining Wall
Masonry Retaining Wall
-
CAR: Community Access Road, DBST: Double Bituminous Surface Treatment (Low cost pavement)
JPN: Japanese Bridge Speciation, A type (equivalent BS:HA) for District road, B type (equivalent BS:HB) for National road.
* Maintenance is spot maintenance work. It is basically for the work so that construction vehicles can pass safely within the present road
width.
** It is planned to be upgraded to a National Road
*** The standard width of Design Class Road II should be 9.0m.
Source: JICA Study Team
The responsible organization is the Office of the Prime Minister (OPM) and the execution Agency is the Ministry of Works and Transport (MoWT) for this project.
After signing of Exchange of Notes (E/N), the executing agency of Uganda (MoWT) and procurement agency of Japan (JICS) sealed an Agent Agreement. The Japanese procurement
SUMMARY-43

agency will conduct the detailed design together with Japanese consultants and it will oversee the construction by the contractor after tendering as shown in Figure 28.2.
Uganda Embassy of Japan
Government of Japan
Government of Uganda Responsible Agency
(Office of the Prime Minister)Government of Uganda
Executing Agency (MoWT)
Procurement Agency Administration of Fund
Administration of Tender Administration of Engineering
Consultant Agreement
Contractor Agreement
E/N
: Contract relations
: Discussion, Inspection and Report
Japanese Consultant Survey & Design
Tender Assistance Construction Supervision
Contractor
Construction
Agent Agreement
Source: JICA Study Team
Figure 28.2 The Flow of the Construction and Procurement by Procurement Agency
29. PROJECT EVALUATION AND RECOMMENDATIONS
The traffic demand in Acholi Sub-region is forecast based on the current traffic demand estimated by the results of roadside traffic counts and driver interview surveys and population projections by UBOS and UNHCR. As tabulated in the following table, traffic demands of five traffic assignment cases are projected, assigning traffic demand to the existing and future road network. As a result, Vehicle Operating Costs and Travel Time Costs are estimated for each traffic assignment case.
Table 29.1 Traffic Assignment Cases
Case Description Road Network Traffic Demand
Existing 2009 Network 2009 Existing
Without Project Without urgent project. 2009 Network
With Lira-Kitgum Rd. For economic analysis for Lira – Pader – Kitgum improvement project.
2009 Network + Lira – Pader - Kitgum
With Gulu – Kitgum Rd. For economic analysis for Gulu – Pader - Kitgum improvement project.
2009 Network + Gulu – Pader - Kitgum
All Urgent Projects Fully improved urgent projects in Acholi region.
2018 Network
2018 Future
Source: JICA Study Team
SUMMARY-44

Project for Rural Road Network Planning in Northern Uganda Final Report Vol.1: SUMMARY
SUMMARY-45
Table 29.2 Assignment Results
2009 2018 without projects
2018 with Lira – Kitgum only
2018 with Gulu – Kitgum only
2018 with All Urgent Projects
Veh*km Veh*hour Veh*km Veh*hour Veh*km Veh*hour Veh*km Veh*hour Veh*km Veh*hour
Car/ Sedan 127,214 2,265.3 215,803 3,820.5 222,618 3,769.7 226,226 3,464.1 228,930 3,255.1
Small Bus 5,286 82.3 9,478 147.0 9,537 145.3 9,573 142.8 9,654 138.3
Large Bus 6,737 111.4 11,182 183.4 11,319 179.8 11,276 159.9 11,348 158.7
Light Truck 16,075 278.0 26,423 461.7 27,198 438.7 27,185 440.5 27,784 409.9
Heavy Truck 62,360 1,044.9 97,903 1,648.6 99,872 1,614.7 100,695 1,517.5 101,623 1,448.1
Motorcycle 209,283 4,153.0 338,579 6,695.7 356,333 6,668.3 368,040 6,010.0 382,806 5,749.3
Total (PCU) 393,044 6,918 640,789 11,279 659,518 11,087 668,629 10,301 679,344 9,780
Source: JICA Study Team
A cost benefit analysis, comparing cost and benefit generated from the urgent projects, determines the economic validity of the projects. Investment in the projects and operation and maintenance costs are analyzed as cost factors while the savings in both Vehicle Operating Costs and Travel Time Costs are estimated as benefit factors. This cost benefit analysis is tested under the following assumptions:
In the ‘Without’ Project case, all the roads in Acholi Sub-region, without any maintenance, are assumed to be deteriorated and the level of service of the roads will worsen (i.e., the travel speed of the deteriorated roads will be reduced by half of the current speed.)
In the ‘With’ Project case, the level of service of the urgent project roads will improve while that of the rest of the roads will remain the same as the current service level.
Accordingly, operation and maintenance costs are estimated based on total road length of all the serviceable roads in Acholi sub-region. With that result, costs and benefits are analyzed, concluding that three indicators of the economic evaluation slightly substantiated the economic viability of the project investment, with EIRR of 12.7 %, B/C Ratio of 1.07 and ample positive NPV of 4,095,000 USD.