the quantum mechanics of nano-confined water: new ... · roberto senesi, universitat roma2, rome,...
TRANSCRIPT

GEORGE REITER, University of Houston, TX
ALEXANDER KOLESNIKOV, Oak Ridge National Laboratory, Oak Ridge, TN
STEPHEN PADDISON, University of Tennessee, Knoxville, TN
JERRY MAYERS, ISIS, RAL, UK
CARLA ANDREANI, Universitat Roma2, Rome, Italy
ROBERTO SENESI, Universitat Roma2, Rome, Italy
ANIRUDDHA DEB, University of Michigan, Ann Arbor, MI
PHIL PLATZMAN
1G. Reiter’s work was supported by the DOE, Office of Basic Energy Sciences, Contract No.DE-FG02-08ER46486. Work at ORNL was managed by UT-Battelle, under DOE contract DE-AC05-00OR22725.
The quantum mechanics of nano-confined water: new
cooperative effects in the confined ground state revealed
with neutron and x-ray Compton scattering

Weakly electrostatically interacting model of water

. C. Pantalei A. Pietropaolo, R. Senesi, S. Imberti, C. Andreani, J. Mayers, C. Burnham, and G.
Reiter, in Phys. Rev. Letts. 100, 177801(2008)
Fit to water g(r) with empirical potential(TTM4-F) based on weakly interacting
molecule model

Empirical potentials not able to fit momentum distribution of
protons at higher densities

Comparison of calculated momentum distribution width in water from the supercritical
to room temperature phase, using two different methods based on the isolated
molecule and electrostatic interactions model. Both fail to soften the potential
sufficiently in the higher density phases at room temperature and 150C, indicating a
failure of the weakly electrostatically interacting molecule model.
Test of weakly interacting molecule model in bulk water
Burnham C. J.; Hayashi T.; Napoleon R. L.; et al, J. Chem. Phys 135 , 144502 (2011)

Proposed structure of nanotube-water. The interior “chain” water molecules have
been colored yellow to distinguish them from the exterior “wall” water molecules
(colored red).
MD simulations and proposed nanotube-water structure
MD calculations have been performed using the TTM2-F polarizable flexible water model (uses smeared
charges and dipoles to model short range electrostatics) [1]. Our MD simulations consist of a rigid carbon
nanotube of length 40 Å in periodic boundary conditions that interacts with water through the Lennard-Jones
potential [2]. [1] Burnham & Xantheas, J. Chem. Phys. (2002); [2] Walther et al., J. Phys. Chem. (2001)

0 50 100 150 200 250 3000.00
0.05
0.10
0.15
<u
2 H>
(Å
2)
Temperature (K)
<u2
H>
harm
cal
d
nw
ice-Ih
<u2
H>
harm
cal+d
2
To describe <uH2> for nanotube-water the calculated curve was vertically shifted by
supposed delocalization, d~0.2 Å, of the hydrogen atoms due to the flat bottom of its potential (insert).
First evidence of something new happening in confined water
A. I. Kolesnikov, J.-M. Zanotti, C.-K. Loong, P. Thiyagarajan, A. P. Moravsky, R. O. Loutfy, and C. J. Burnham, Phys.
Rev. Lett. 93, 035503 (2004).

The momentum distribution of the protons in nanotube-
water compared with that in three forms of bulk ice. The
inset shows the effect of varying the parameters in an
anisotropic harmonic model of the bond. The hda-ice
and ice-VI data are displaced vertically for clarity.
samples T, K KE, meV
NT-water 5 106
NT-water 268 146
Ice-Ih 5 144
HDA-ice 5 141
Ice-VI 5 136
where the are associated Laguerre
polynomials, and the an are coefficients to be
determined by the least square fitting process.
G. Reiter, C. Burnham, D. Homouz, P. M. Platzman, J. Mayers, T. Abdul-Redah, A. P. Moravsky, J. C. Li, C.-K. Loong, and A.
I. Kolesnikov, Phys. Rev. Lett. 97, 247801 (2006)

Momentum distributions for NT-water at 268 K (green) and 5 K (black), and ice-Ih at 269 K
(red). The circles are a fit to a model in which the water proton is delocalized in a double well
potential. The potential (red) and wave-function (black) are shown in the inset.
Momentum (inv. Angstroms)
i i
i
i
z
z
zyx
p
d
dp
pppn
2
)2
exp(
)2
exp(1
)2
(cos2
),,(2
2
2
22
2

A Significantly Weaker Hydrogen-Bond Network in Nanotube-Water-
Stretch mode blue shifted
406 meV
RO–O=2.76 Å
422 meV
RO–O=2.92 Å
50 100 150 200 250 300 350 400 450 5000
200
400
600
800
1000
stretching
modesbending
modes
librational
band
NT-water
ice-I
h
G(E
) (a
rbitra
ry u
nits)
Energy transfer (meV)

But red shifted in D2O!

SWNT DWNT
SWNT(dia. 14Å) compared with DWNT(dia. 16Å)

The radial momentum distribution, 4πp2n(p), of the
water protons in 16 Å DWNT at different
temperatures, compared with that of bulk water at
room temperatures. The 290 K signal and the bulk
water signal have been displaced upward by 0.02 units
for clarity.
Temperature dependence of <uH2> for
9.5 wt.% water in DWNT (red dashed
line) and 5.3 wt % water in SWNT (blue
dotted line), and for 11.3 wt.% water in
SWNT (red dash-dotted line), and bulk
water (black full line).
Double wall nanotubes-16Å diameter
G. F. Reiter, R. Senesi and J. Mayers, Phys. Rev. 105, 148101 (2010)

If the wave function is
Then the momentum distribution n(p) is
More generally, the momentum distribution is the
diffraction pattern generated by the wave
function thought of as a transmission amplitude

Water in xerogel 23 Å pores (T=300 K). The
dashed red line is a fit to the data with a single
particle in a double-well model (top figure) [1].
[1] V. Garbuio et al., J. Chem. Phys. 127
(2007) 154501.
Water in xerogel-room temperature
Blue-bulk water
Red-80 Å pores
Black 23 Å pores
V. Garbuio, C. Andreani, S. Imberti, A. Pietropaolo, G. F. Reiter, R.
Senesi, and M. A. Ricci, J. Chem. Phys. 127, 154501 (2007).

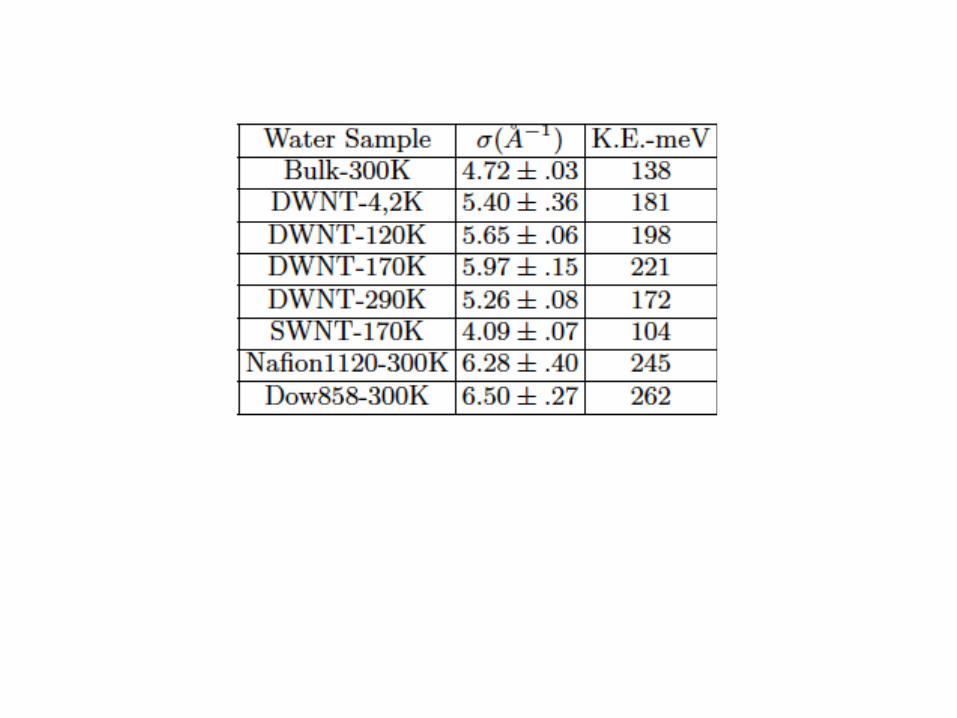
The radial momentum distribution, 4πp2n(p), of the protons
in Nafion1120 (blue) and Dow 858 (magenta) compared with
that of bulk water (black), all at room temperature.
Water in Nafion, Dow 858- Room temperature
G. F. Reiter, R. Senesi and J. Mayers, Phys. Rev. 105, 148101 (2010)
Ra
w C
ou
nts
0
2e+7
4e+7
6e+7 Hydrated Nafion 1120
Nafion1120 Background
Energy (keV)
95 100 105 110 115 120
Raw
Co
un
ts
-1e+6
0
1e+6
2e+6
3e+6
H2O in Nafion 1120
DI H2O
Ra
w C
ou
nts
-9.0e+5
1.1e+6
3.1e+6
5.1e+6
7.1e+6
DI H2O+Background
Background
(a)
(b)
(c)
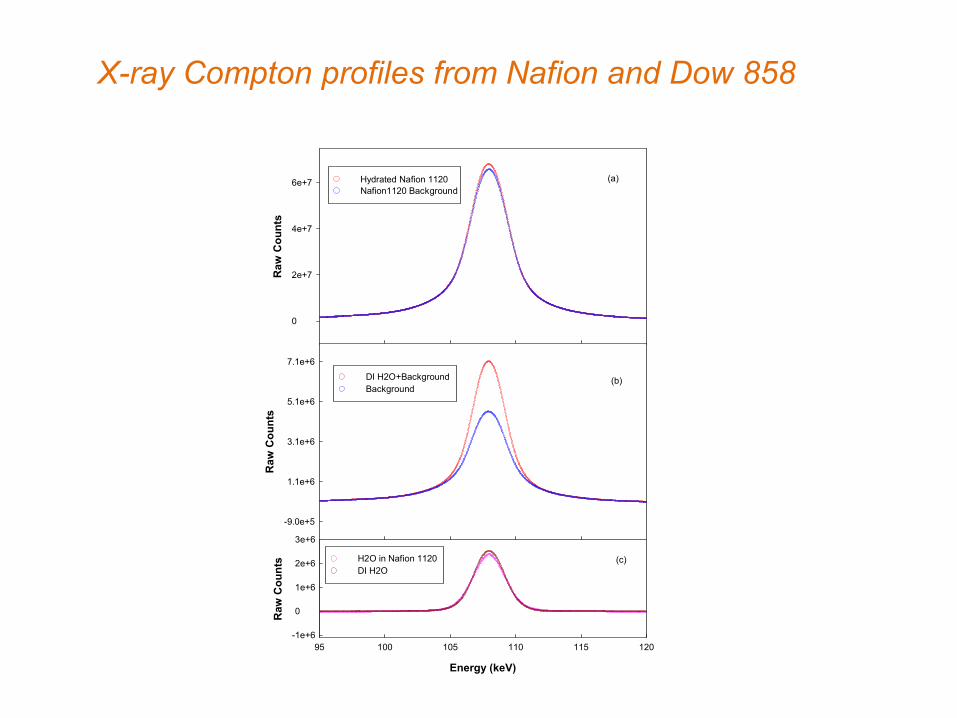
X-ray Compton profiles from Nafion and Dow 858

Difference profiles: Bulk water-water in Nafion, Dow 858
G. F. Reiter, A. Deb, Y. Sakurai, M. Itou, V. G. Krishnan and S. J. Paddison, PRL 111, 036803 (2013)
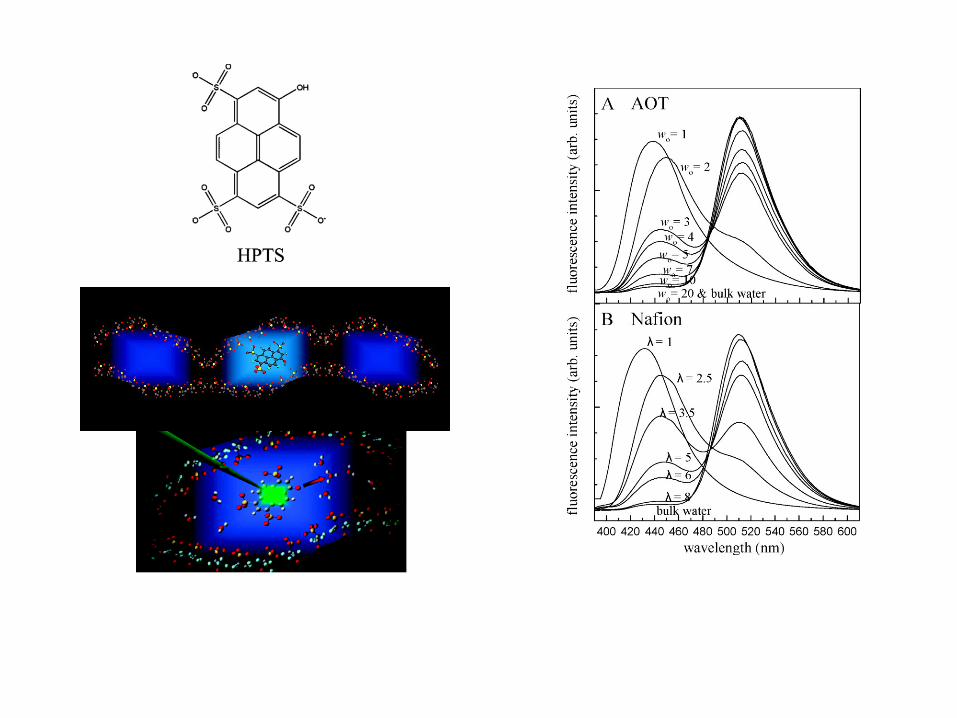

D. E. Moilanen, D. B. Spry and M. D. Fayer, Langmuir 24 (8), 3690-3698 (2008).

Klaas Jan Tielrooij, M Jocelyn Cox, and Huib J Bakker, ChemPhysChem 10, 245 (2009)
Direct electronic de-excitation of excited state possible in
nano-confined water

Dry A phase Biologically Inactive
Hydrated B phase Biologically active
Changes in the zero point energy of protons completely accounts for enthalpy change in A to B phase for 6 mol/bp of water PHYSICS WORLD.COM Feb 4 2011 http://physicsworld.com/cws/article/news/45037
G. F. Reiter, R. Senesi and J. Mayers, Phys. Rev. 105, 148101
(2010)
Changes in the kinetic energy(almost all zero
point motion) are biologically significant
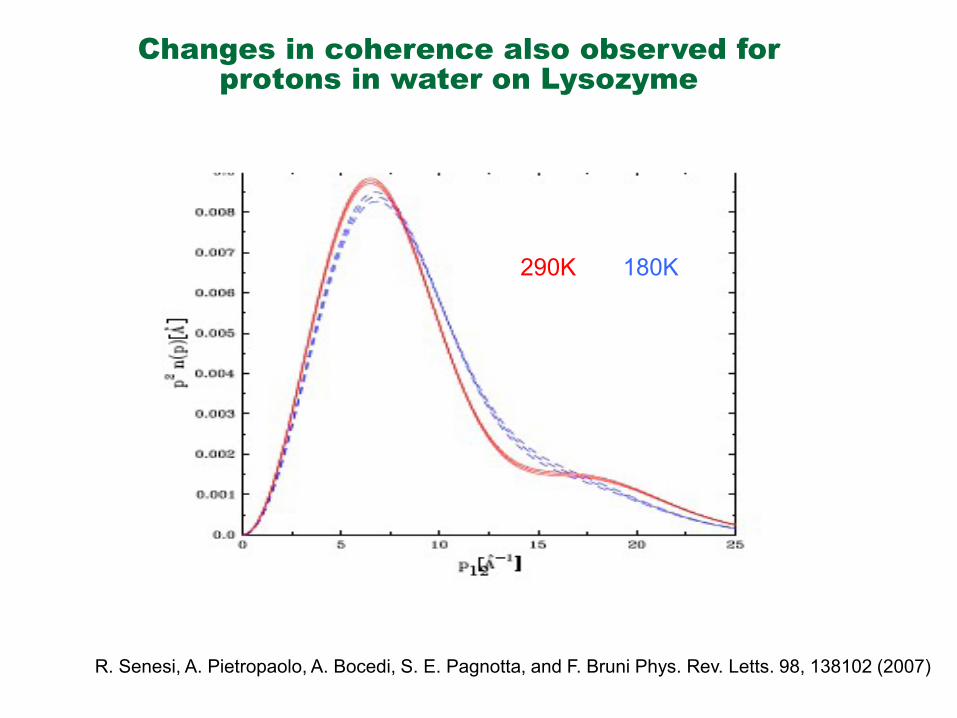
Changes in coherence also observed for
protons in water on Lysozyme
290K 180K
R. Senesi, A. Pietropaolo, A. Bocedi, S. E. Pagnotta, and F. Bruni Phys. Rev. Letts. 98, 138102 (2007)

Variation of kinetic energy of the protons in a dilute lysozyme
solution as the protein unfolds with temperature. Red line is what
is to be expected if there are no changes in the proton quantum
state
The making and breaking of hydrogen bonds as a protein unfolds with
temperature

Summary The momentum distribution of water confined to distances of the order
of 20 Å is sensitive to the global nature of the confinement.
The quantum ground state of the electrons and protons in nano-
confined water is qualitatively different from that of bulk water. The usual
model of molecules interacting weakly electrostatically does not apply.
Free proton transport in the nano-confined state is qualitatively
different from that of bulk water, as are the electronic excitations.
The changes in zero point energy of the protons are thermodynamically
significant in the transformations in shape of biological molecules, and
hence, most biological processes
It is necessary to understand the origin and properties of the
nanoconfined state to understand the role that quantum mechanics has
played in the origins of life.


• A.P. Moravsky – MER Corporation, Tuscon, AZ
• C. Burnham – University of Houston, TX
• C.-K. Loong – IPNS, Argonne Nat. Lab.
• M.A. Adams – ISIS, RAL, UK
Acknowledgements

The temperature dependences of the residence time for water in SWNT
(left) and DWNT (right), and their fits with a Vogel-Fulcher-Tamman (VFT)
law, = 0exp(DT0/(T-T0)), above and an Arrhenius law, = 0exp(EA/RT),
below the crossover temperatures TL=218 K for SWNT [1] and 190 K for
DWNT [2].
[1] E. Mamontov et al. J. Chem. Phys. 124 (2006) 194703.
[2] X.-Q. Chu et al., Phys. Rev. E 76 (2007) 021505.
,)(
)(1)(1)()(),(
22CBE
QE
QQxEQxEQS
resres
res
rDDQQ
6/,)exp(1)( 22
QENS spectra for Q=0.99 Å-1 at
different temperatures (HFBS,
NIST).
QENS, Fragile-to-Strong Liquid Transition
TL=218 K ↓

0.2 0.3 0.4 0.5 0.6
Inte
nsity (
arb
itra
ry u
nits)
Q (Å-1)
1b
1a
2a
3a
2b
3b
Water Enters the Nanotubes by Exposing SWNT to Water Vapor at 110°C
Low-angle neutron diffraction: I(Q) ~ S(Q)•F(Q). Here, S(Q) consists of a Bragg reflection
at 0.41 Å-1 from the (01) planes of the 2D hexagonal lattice of SWNT crystalline bundles.
1 – Dry SWNT; 2 – SWNT & H2O
3 – SWNT & D2O
F(Q)
TEM picture of
SWNT bundles
SWNT sample with D≈14±1 Å, l~10 μm was
characterized by HRTEM, TEM, SEM, Raman and ND.
To fill the SWNT with water, the dry SWNT sample was
first exposed to water vapor at 110°C in an enclosed
environment. The excess water adsorbed in the exterior of
the nanotubes was then evaporated at 35°C. An optimal
filling, in terms of H2O/SWNT mass ratio, was found to be
11%.

Radial/thermal distribution function of water
inside SWNT. Black surface: oxygen distribution,
Blue surface: hydrogen distribution.
‘Parallel tempering’ molecular dynamics simulation for water in
SWNT
100 150 200 250 300
0.9
1.0
1.1
1.2
De
nsity [
g/c
m3]
Temperature [K]