thermoelectric properties of cobalt triantimonide (cosb ... · thermoelectric properties of cobalt...
TRANSCRIPT

Thermoelectric Properties of Cobalt Triantimonide (CoSb3)
Prepared by an Electrochemical Technique
by J. Wolfenstine, D. Tran, K. Zhou, and J. Sakamoto
ARL-TR-5141 April 2010 Approved for public release; distribution unlimited.

NOTICES
Disclaimers The findings in this report are not to be construed as an official Department of the Army position unless so designated by other authorized documents. Citation of manufacturer’s or trade names does not constitute an official endorsement or approval of the use thereof. Destroy this report when it is no longer needed. Do not return it to the originator.

Army Research Laboratory Adelphi, MD 20783-1197
ARL-TR-5141 April 2010 Thermoelectric Properties of Cobalt Triantimonide (CoSb3)
Prepared by an Electrochemical Technique
J. Wolfenstine and D. Tran Sensors and Electron Devices Directorate, ARL
and
K. Zhou and J. Sakamoto Michigan State University
Department of Chemical Engineering and Materials Science Approve for public release; distribution unlimited.

ii
REPORT DOCUMENTATION PAGE Form Approved OMB No. 0704-0188
Public reporting burden for this collection of information is estimated to average 1 hour per response, including the time for reviewing instructions, searching existing data sources, gathering and maintaining the data needed, and completing and reviewing the collection information. Send comments regarding this burden estimate or any other aspect of this collection of information, including suggestions for reducing the burden, to Department of Defense, Washington Headquarters Services, Directorate for Information Operations and Reports (0704-0188), 1215 Jefferson Davis Highway, Suite 1204, Arlington, VA 22202-4302. Respondents should be aware that notwithstanding any other provision of law, no person shall be subject to any penalty for failing to comply with a collection of information if it does not display a currently valid OMB control number. PLEASE DO NOT RETURN YOUR FORM TO THE ABOVE ADDRESS.
1. REPORT DATE (DD-MM-YYYY)
April 2010 2. REPORT TYPE
Final 3. DATES COVERED (From - To)
August 2009–January 2010 4. TITLE AND SUBTITLE
Thermoelectric Properties of Cobalt Triantimonide (CoSb3) Prepared by an Electrochemical Technique
5a. CONTRACT NUMBER
5b. GRANT NUMBER
5c. PROGRAM ELEMENT NUMBER
6. AUTHOR(S)
J. Wolfenstine, D. Tran, K. Zhou, and J. Sakamoto 5d. PROJECT NUMBER
5e. TASK NUMBER
5f. WORK UNIT NUMBER
7. PERFORMING ORGANIZATION NAME(S) AND ADDRESS(ES)
U.S. Army Research Laboratory ATTN: RDRL SED-C 2800 Powder Mill Road Adelphi, MD 20783-1197
8. PERFORMING ORGANIZATION REPORT NUMBER
ARL-TR-5141
9. SPONSORING/MONITORING AGENCY NAME(S) AND ADDRESS(ES)
10. SPONSOR/MONITOR’S ACRONYM(S) 11. SPONSOR/MONITOR'S REPORT NUMBER(S)
12. DISTRIBUTION/AVAILABILITY STATEMENT
Approve for public release; distribution unlimited.
13. SUPPLEMENTARY NOTES
14. ABSTRACT
A novel electrochemical method has been used to transform an n-type skutterudite of composition Co0.95Pd0.05Te0.05Sb2.95 from a starting material having a crystalline structure with a grain size of about 1 µm into a material with an amorphous structure and a nanoscale grain size (70 nm). Differential scanning calorimetry revealed that crystallization of the amorphous Co0.95Pd0.05Te0.05Sb2.95 powders occurs between 220–260 °C. The electrical resistivity (4-point), Seebeck coefficient, and ZT of the nanoscale-amorphous material were greatly reduced compared to the micron-crystalline starting material. Our findings suggest that the major cause for this is the change in structure from crystalline to amorphous.
15. SUBJECT TERMS
Thermoelectric, CoSb3, skutterudite, nanoscale, amorphous, electrochemical
16. SECURITY CLASSIFICATION OF: 17. LIMITATION OF ABSTRACT
UU
18. NUMBER OF PAGES
22
19a. NAME OF RESPONSIBLE PERSON J. Wolfenstine
a. REPORT
Unclassified b. ABSTRACT
Unclassified
c. THIS PAGE
Unclassified 19b. TELEPHONE NUMBER (Include area code) (301) 394-0317
Standard Form 298 (Rev. 8/98) Prescribed by ANSI Std. Z39.18

iii
Contents
List of Figures iv
Acknowledgments v
1. Introduction 1
2. Experimental 2
2.1 Powder Preparation .........................................................................................................2
2.2 Powder Characterization .................................................................................................2
2.3 Electrochemical Testing ..................................................................................................3
3. Results and Discussion 4
3.1 Electrochemical ...............................................................................................................4
3.2 Structural .........................................................................................................................5
3.3 Morphology .....................................................................................................................6
3.4 Thermal ...........................................................................................................................7
4. Thermoelectric Properties 8
5. Conclusions 11
6. References 12
List of Symbols, Abbreviations, and Acronyms 13
Distribution List 14

iv
List of Figures
Figure 1. X-ray diffraction pattern of the milled Co0.95Pd0.05Te0.05Sb2.95 powders. .......................3
Figure 2. First cycle discharge/charge curve for the Co0.95Pd0.05Te0.05Sb2.95 powders....................5
Figure 3. X-ray diffraction pattern for the Co0.95Pd0.05Te0.05Sb2.95 alloy at the beginning of the first discharge (A) and the end of the first charge cycle (B). ..............................................6
Figure 4. Selected area electron diffraction pattern of the Co0.95Pd0.05Te0.05Sb2.95 alloy after the end of the first discharge/charge cycle. ................................................................................6
Figure 5. Scanning electron micrograph of the Co0.95Pd0.05Te0.05Sb2.95 powders after one discharge/charge cycle. ..............................................................................................................7
Figure 6. DSC curve of the amorphous Co0.95Pd0.05Te0.05Sb2.95 powders. ......................................8
Figure 7. Electrical resistivity versus temperature for the nanoscale-amorphous and micron-crystalline Co0.95Pd0.05Te0.05Sb2.95 powders after cold-pressing. ...............................................9
Figure 8. Seebeck coefficient versus temperature for the nanoscale-amorphous and micron-crystalline Co0.95Pd0.05Te0.05Sb2.95 powders after cold-pressing. .............................................10
Figure 9. ZT versus temperature for the nanoscale-amorphous and micron-crystalline Co0.95Pd0.05Te0.05Sb2.95 powders after cold-pressing. ...............................................................11

v
Acknowledgments
We would like to acknowledge support from a Director’s Research Initiative (DRI) award (SED-FY09-21). In addition, the electron microscopy support of Dr. Jim Sumner and Dr. Wendy Sarney is greatly appreciated.
vi
INTENTIONALLY LEFT BLANK.

1
1. Introduction
Thermoelectric (TE) devices are becoming increasing popular for power generators and/or cooling due to their ability to convert thermal energy into electricity or vice versa (1–6). They offer the advantages of being silent, reliable, and scalable, and having no moving parts (1–4). However, compared to conventional power generation and/or cooling systems, their main disadvantage is low efficiency. The low efficiency of TE devices is primarily limited by the TE materials. The performance of TE materials is characterized by a dimensionless parameter known as the figure-of-merit, ZT, given by equation 1 (1–6):
ZT=S2σT/κ, (1)
where S is the Seebeck coefficient, σ is electrical conductivity, T is temperature, and κ is thermal conductivity. κ is the sum of κL + κe, where κL is the lattice thermal conductivity and κe is the electronic thermal conductivity. For most bulk TE materials, the maximum value of ZT is ∼1 (1–6). It is been suggested to be competitive with existing commercial devices, such as a commercial refrigerator, a ZT of ∼3 or higher is needed (1–4).
One class of TE materials that has attracted attention recently for use up to ∼650 °C in bulk form is binary skutterudites (2, 3, 5, 7, 8), in particular, n- and p-type cobalt triantimonide (CoSb3). n- and p-type CoSb3 posses a large value of S and high σ; however, they also have large values for κL leading to low values of ZT. Thus, methods to reduce κL are needed. One strategy to reduce κL is to create a large number of interfaces to scatter phonons. One possible way to accomplish this is by decreasing the grain size to the nanoscale (<100 nm) (2, 3, 5, 6, 8). Several possible techniques can be used to produce skutterudites with nanoscale particles sizes, including spray pyrolysis, co-precipitation, solvothermal, and melting followed mechanical attrition (5). After which, the nanoscale powders are typically hot-pressed and/or sintered to form a dense material with a nanoscale grain size.
One alternative method to forming a nanoscale powder is to use a novel processing procedure based on an electrochemical means, which not only decreases the particle size but also disrupts long range crystallinity leading to an amorphous material. It is known that amorphous solids have lower lattice thermal conductivity than crystalline solids of the same composition (9). Thus, the electrochemical method can possible lead an amorphous nanoscale material with a much lower thermal conductivity compared to material with a crystalline structure with a micron-scale grain size, and hence, an increased ZT.
The electrochemical method involves the lithiation/de-lithiation into a host crystalline TE material, which results in the “breaking” of bonds between elements, thus disturbing long range crystallinity and reducing particle size. The electrochemical method can allow for a very precise method to tailor the TE properties with the degree of atomic rearrangement (i.e., percentage of
2
amorphous phase). Very precise control of the degree of atomic rearrangement is not currently available with the current ball milling method used to produce nanoscale TE materials. A major risk with this approach is that it is possible that the formation of a nanoscale/amorphous material will not only reduce lattice thermal conductivity but will result in an even greater lowering in the electron mobility, and hence, electrical conductivity, thus decreasing the figure of merit and efficiency of the TE material.
The goal of this work is to use an electrochemical method to form a nanoscale-amorphous n-type skutterudite material, with the intent to reduce thermal conductivity while not affecting electron transport, and hence, increase the ZT of the material compared to the starting micron-crystalline material.
2. Experimental
2.1 Powder Preparation
A skutterudite of composition Co0.95Pd0.05Te0.05Sb2.95 was chosen for investigation. Palladium (Pd) and telluride (Te) were added to make CoSb3 an n-type semiconductor. Co0.95Pd0.05Te0.05Sb2.95 powders were prepared by mixing elemental powders in the correct proportion. The powders were water quenched from 1100 °C, then annealed at 700 °C for 48 h, crushed in motorized mortar and pestle, and planetary ball milled for 9 h. During the heating steps the powders were in a sealed quartz tube, which was evacuated and then back filled with an inert atmosphere of argon prior to melting. In addition, the grinding and milling were conducted under an argon atmosphere.
2.2 Powder Characterization
The composition of the Co0.95Pd0.05Te0.05Sb2.95 powders was checked after milling by inductively coupled plasma mass spectrometry (Galbraith Laboratories, Inc.). The actual and predicted compositions were in excellent agreement. The phase purity of the powders was determined using x-ray diffraction. The x-ray diffraction pattern of the Co0.95Pd0.05Te0.05Sb2.95 powders is shown in figure 1. The x-ray diffraction pattern reveals only single-phase skutterudite. The lattice constant determined using Rietveld refinement yielded a=9.046±0.002 Å. This value is larger than that for binary CoSb3 (9.032 Å [10]), since the lattice is expanded by the Pd and Te substitutions.

3
0
100
200
300
400
500
600
700
800
10 20 30 40 50 60 70 80
Intens
ity
2Theta
* * * *
*
*
*
**
***
*
*
**
CoSb3
Co0.95
Pd0.05
Te0.05
Sb2.95
*
Figure 1. X-ray diffraction pattern of the milled Co0.95Pd0.05Te0.05Sb2.95 powders.
2.3 Electrochemical Testing
For electrochemical testing, the cathode consisted of Co0.95Pd0.05Te0.05Sb2.95 powders mixed with a 5 wt.% polyvinylidene fluoride (PVDF) binder. To prepare the cathode, the skutterudite powders were mixed with PVDF dissolved in N-methylpyrrolidinone (NMP). This mixture was coated onto a copper substrate. The cathode mixture was dried under vacuum at 100 °C for 24 h to remove the NMP. Lithium (Li) foil pressed onto nickel (Ni) mesh was used as the anode. The electrolyte was 1 M lithium tetrafluoroborate (LiBF4) in a 1:1 (wt.%) mixture of propylene carbonate (PC) and 1, 2-dimethoxyethane (DME). Celgard 3501 was used as the separator. The cell was placed between two Teflon sheets held together by a Ni wire and placed in a foil laminate pouch. After the pouch cell was sealed, it was clamped together to apply pressure to the cell. The cell was galvanostatically discharged (to 0.005 V versus Li+/Li) and charged (3.0 V versus Li+/Li) at room temperature at a rate of ∼C/20, where the theoretical capacity, C, for CoSb3=569 mAh/g.
The discharge and charge reactions are given as follows (11):
Discharge: 9 Li + CoSb3 (micro-crystalline) →3Li3Sb + Co (2)
Charge: 3Li3Sb+ Co→ 9 Li + CoSb3 (nano-amorphous) (3)
We hypothesized that, during the discharge and charge cycle, the Co0.95Pd0.05Te0.05Sb2.95 alloy would transform from a crystalline material with micron size particles to an amorphous material with a nanoscale particle size.

4
3. Results and Discussion
3.1 Electrochemical
The first cycle discharge and charge curve for the Co0.95Pd0.05Te0.05Sb2.95 alloy is shown in figure 2. From figure 2, it can be seen that during discharging there is an initial rapid decrease in voltage followed by a plateau at ∼0.56 V versus Li+/Li, after which the voltage slowly decreases. It has been suggested that the voltage plateau (∼0.56 V versus Li+/Li) corresponds to the two-phase region between CoSb3 and Li3Sb (11). The total capacity during discharge is ∼625 mAh/g. The theoretical capacity for CoSb3 is 569 mAh/g. The extra discharge capacity (∼60 mAh/g) is most like a result of the formation of a solid electrolyte interface (SEI) passivation film on the skuttterudite electrode surface as a result of its reaction with the liquid electrolyte. On charging, the voltage rapidly increases followed by a plateau at ∼1.0 V versus Li+/Li, after which the voltage rapidly increases. The voltage plateau (∼1 V versus Li+/Li) corresponds to the two-phase region between CoSb3 and Li3Sb (11). The charge capacity is ∼400 mAh/g, which is less than the theoretical capacity (569 mAh/g) and the observed discharge capacity (∼625 mAh/g). One potential reason for this difference is that there is a large volume expansion associated with the Li alloying of antimony (Sb), which may cause some of the alloy particles to break off and loose contact with the current collector and/or become electrical disconnected from each other leading to the lower capacity on charge versus discharge. We observed that the length of the charging plateau (∼1 V versus Li+/Li) was a strong function of cell pressure. For example, when little or no pressure was applied, the charge capacity (length of the 1-V plateau) was very low compared to the discharge capacity (length of the 0.56-V plateau). As the cell pressure increased, the length of the 1-V plateau significantly increased. The length of the discharge plateau at 0.56-V plateau was not that sensitive to the applied pressure. Apparently, applied compressive pressure is needed to prevent particles from breaking off and losing contact with the current collector and/or each other, and hence, becoming electrical disconnected as a result of tensile stresses developed due to the large volume expansion associated with the Li alloying of Sb.

5
Figure 2. First cycle discharge/charge curve for the Co0.95Pd0.05Te0.05Sb2.95 powders.
3.2 Structural
The x-ray diffractions patterns for the Co0.95Pd0.05Te0.05Sb2.95 powders at the beginning of first discharge (A) (same as figure 1) and at the end of the first charge cycle (B) are shown in figure 3. Prior to x-ray diffraction for sample B, the PVDF binder was removed from the electrode powders after discharge/charge cycling by extraction in NMP. Figure 3 shows that the Co0.95Pd0.05Te0.05Sb2.95 alloy has undergone a structural transformation from a crystalline material to an amorphous material. A selected electron diffraction pattern of the alloy after the first discharge/charge cycle is shown in figure 4. From figure 4, it can be seen that the material is mainly amorphous as shown by the diffuse rings. However, the electron diffraction image also reveals a few spots indicative of a crystalline material (12). From figures 3 and 4, it can be concluded that the Co0.95Pd0.05Te0.05Sb2.95 alloy has, indeed, undergone a structural transformation from a crystalline material to a quasi-amorphous material as a result of electrochemical insertion/extraction of Li into the alloy.
Nov10nSKD
0
0.5
1
1.5
2
2.5
3
3.5
0 100 200 300 400 500 600 700
mAh/g (at C/10)
pote
ntia
l (vo
lts)

6
Figure 3. X-ray diffraction pattern for the Co0.95Pd0.05Te0.05Sb2.95 alloy at the beginning of the first discharge (A) and the end of the first charge cycle (B).
Figure 4. Selected area electron diffraction pattern of the Co0.95Pd0.05Te0.05Sb2.95 alloy after the end of the first discharge/charge cycle.
3.3 Morphology
The Co0.95Pd0.05Te0.05Sb2.95 particle size of the starting powders was determined from the specific surface area, which was measured using nitrogen gas adsorption (Brunauer-Emmett-Teller [BET]). The powder surface area was 1.3 m2/g from the BET measurements, which gives an
0
200
400
600
800
1000
10 20 30 40 50 60 70
Inte
nsity
2Theta
A
B

7
average particle size of ∼800 nm, assuming spherical particles (13). The average particle size of the Co0.95Pd0.05Te0.05Sb2.95 powders after one discharge/charge cycle, determined using a linear intercept method on scanning electron photomicrographs, was ∼350 nm, as shown in figure 5. Thus, electrochemical insertion/extraction of Li has reduced the particle by a factor of ∼2.2. Notably, the average particle size of ∼400 nm is greater than the size typically considered nanoscale, <100 nm. We observed that if the starting particles were screened and given several cycles that a final particle size of less than 70 nm could be obtained. In summary, micron/crystalline Co0.95Pd0.05Te0.05Sb2.95 powders after subjected to an Li insertion/deinsertion by an electrochemical method yielded nanoscale-amorphous powders.
Figure 5. Scanning electron micrograph of the Co0.95Pd0.05Te0.05Sb2.95 powders after one discharge/charge cycle.
3.4 Thermal
In order to obtain a TE material with good electrical and mechanical properties, the powders must be consolidated into a dense material. Densification is usually accomplished by cold-pressing the powders into a shape followed by hot-pressing or sintering. Both hot-pressing and sintering require the material to be heated up to high temperature to allow diffusion, and hence, densification to occur. Thus, it is important to know how high to heat the Co0.95Pd0.05Te0.05Sb2.95
powders before crystallization of the amorphous material occurs. The crystallization temperature was determined using differential scanning calorimetry (DSC). The DSC curve of the amorphous Co0.95Pd0.05Te0.05Sb2.95 powders is shown in figure 6. Figure 6 shows that crystallization of the Co0.95Pd0.05Te0.05Sb2.95 powders occurs between 220–260 °C. X-ray diffraction of samples heated above 300 °C revealed that the Co0.95Pd0.05Te0.05Sb2.95 powders had transformed from amorphous to crystalline with a diffraction similar to that shown in figure 1, except with broader peaks.

8
Figure 6. DSC curve of the amorphous Co0.95Pd0.05Te0.05Sb2.95 powders.
4. Thermoelectric Properties
In order to compare the TE properties of the nanoscale-amorphous Co0.95Pd0.05Te0.05Sb2.95
material with that of the starting micron-crystalline (1 µm) scale material, it was decided, based on the results in figure 6, to compare the materials after cold-pressing without hot-pressing/sintering, so as to retain the amorphous character of the powders. Hence, a direct comparison between the two materials could be obtained. The electrical resistivity (4-point), Seebeck coefficient, and ZT as a function of temperature, obtained using a custom built apparatus at Michigan State University, for the micron-crystalline (1 µm) and nanoscale-amorphous (70 nm) materials are shown in figures 7–9. The materials were tested in the lower temperature, where boundary scattering is expected to dominate over phonon-phonon, which occurs at high temperatures (5).
Figure 7 shows that the electrical resistivity of the nanoscale-amorphous material is about three orders of magnitude higher than for the micron-crystalline material. Since conductivity is the inverse of resistivity, this means the electrical conductivity of the Co0.95Pd0.05Te0.05Sb2.95 material has been reduced by three orders of magnitude by going from a micron-crystalline to a nanoscale-amorphous material. Figure 8 shows that Seebeck coefficient of the Co0.95Pd0.05Te0.05Sb2.95 powders has also been reduced by transforming the micron-crystalline to a nanoscale-amorphous material. At room temperature, the Seebeck coefficient of the amorphous-nanoscale material is about a factor of 11 times lower than for the micron-crystalline material. From these two results, it is apparent that becoming a nanoscale-amorphous material lowered the electrical performance of the Co0.95Pd0.05Te0.05Sb2.95 material. Y. Lan et al. (5) suggested that the

9
mean free path for electrons in doped silicon (Si)-germanium (Ge) TE materials is about 5 nm. If a similar mean free path exists for the Co0.95Pd0.05Te0.05Sb2.95 material, then it would be expected that if the grain size of the nanoscale material is about 70 nm, and since the mean free path for the electrons is less than the grain’s dimensions, that reducing the grain size from a 1 µm to 70 nm would have no effect on the electrical properties. Hence, in a first approximation, this suggests that a decrease in electrical properties is related to the change in structure from crystalline to amorphous. The lattice thermal conductivity for the nanoscale-amorphous material was lower than for the micron-crystalline material. This is in agreement with predictions that reducing the grain size increases the number of interfaces for phonon scattering (2, 3, 5) and that an amorphous material has a lower thermal conductivity than a crystalline material (9).
0.01
0.1
1
10
100
50 100 150 200 250 300 350
Res
istiv
ity (o
hm-c
m)
T(K)
Micron/Crystalline
Nanoscale/Amorphous
Figure 7. Electrical resistivity versus temperature for the nanoscale-amorphous and micron-crystalline Co0.95Pd0.05Te0.05Sb2.95 powders after cold-pressing.

10
-140
-120
-100
-80
-60
-40
-20
0
50 100 150 200 250 300 350
Seeb
eck
Coe
ffici
ent (
mirc
o-V
olt/K
)
T (K)
Micron/Crystalline
Nanoscale/Amorphous
Figure 8. Seebeck coefficient versus temperature for the nanoscale-amorphous and micron-crystalline Co0.95Pd0.05Te0.05Sb2.95 powders after cold-pressing.
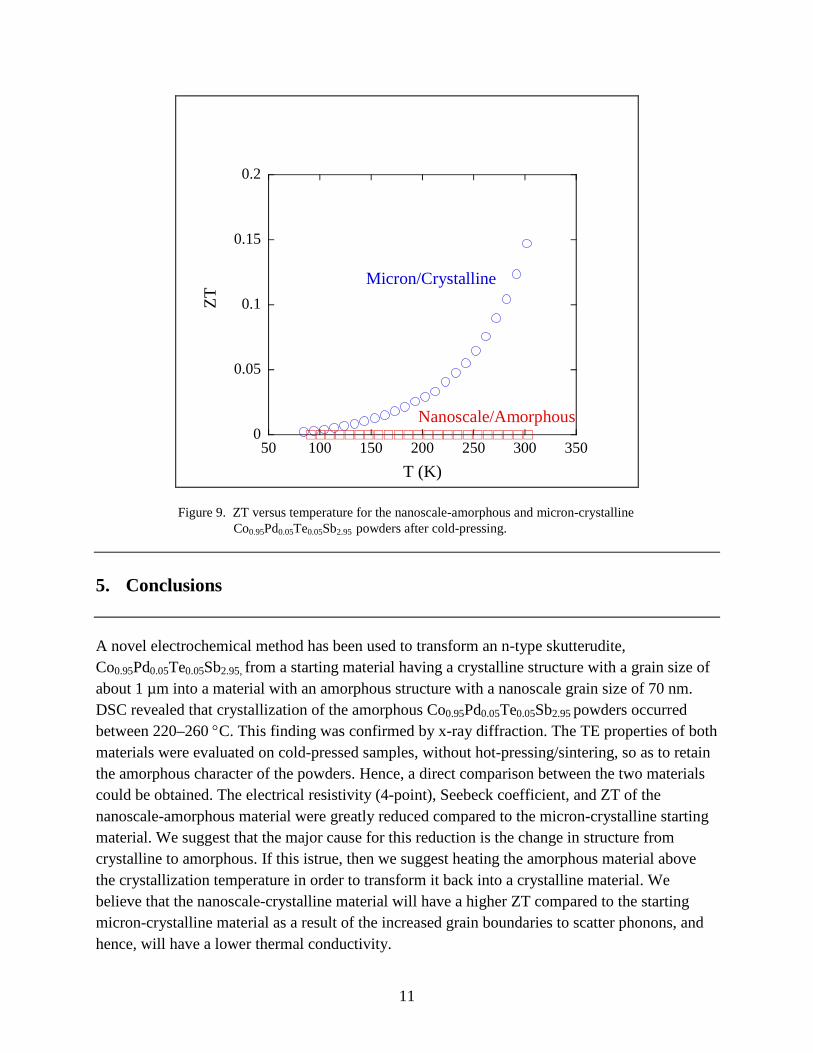
The dimensionless figure of merit (ZT) is plotted for the nanoscale-amorphous and micron-crystalline Co0.95Pd0.05Te0.05Sb2.95 materials in figure 9. Figure 9 shows that going from a micron-crystalline to a nanoscale-amorphous material drastically reduced the values of ZT. This is expected from equation 1―the large decrease in the electrical conductivity (figure 7) and Seebeck coefficient (figure 8) as the structure changed from micron-crystalline to nanoscale-amorphous and the corresponding decrease in thermal conductivity as the structure changed. This reduction in ZT is most likely due to the change in structure from crystalline to amorphous. The ZT results for the micron-crystalline material are in very good agreement with literature values for n-type CoSb3 (2, 3, 7, 8).
11
0
0.05
0.1
0.15
0.2
50 100 150 200 250 300 350
ZT
T (K)
Nanoscale/Amorphous
Micron/Crystalline
Figure 9. ZT versus temperature for the nanoscale-amorphous and micron-crystalline Co0.95Pd0.05Te0.05Sb2.95 powders after cold-pressing.
5. Conclusions
A novel electrochemical method has been used to transform an n-type skutterudite, Co0.95Pd0.05Te0.05Sb2.95, from a starting material having a crystalline structure with a grain size of about 1 µm into a material with an amorphous structure with a nanoscale grain size of 70 nm. DSC revealed that crystallization of the amorphous Co0.95Pd0.05Te0.05Sb2.95 powders occurred between 220–260 °C. This finding was confirmed by x-ray diffraction. The TE properties of both materials were evaluated on cold-pressed samples, without hot-pressing/sintering, so as to retain the amorphous character of the powders. Hence, a direct comparison between the two materials could be obtained. The electrical resistivity (4-point), Seebeck coefficient, and ZT of the nanoscale-amorphous material were greatly reduced compared to the micron-crystalline starting material. We suggest that the major cause for this reduction is the change in structure from crystalline to amorphous. If this istrue, then we suggest heating the amorphous material above the crystallization temperature in order to transform it back into a crystalline material. We believe that the nanoscale-crystalline material will have a higher ZT compared to the starting micron-crystalline material as a result of the increased grain boundaries to scatter phonons, and hence, will have a lower thermal conductivity.
12
6. References
1. Scales, B. C. Science 2002, 295, 1248.
2. Snyder, G. J.; Toberer, E. S. Nature Materials 2008, 7, 105.
3. Toprak, M. S.; Stiewe, C.; Platzek, D.; Williams, S.; Bertini, L.; Muller, E.; Gatti, C.; Zhang, Y.; Rowe, M.; Muhammed, M. Adv. Fun. Mater. 2004, 14, 1189.
4. DiSalvo, F. J. Science 1999, 285, 703.
5. Lan, Y.; Minnich, A. J.; Chen, G.; Ren, Z. Adv. Fun. Mater. 2009, 19, 1.
6. Dresslhaus, M. S.; Chen, G.; Tang, M. Y.; Yang, R.; Lee, H.; Wang, D.; Ren, Z.; Fleurial, J.-P.; Gonga, P. Adv. Mater. 2007, 19, 1043.
7. Kawaharada, Y.; Kurosaki, K.; Uno, M.; Yamanaka, S. J. Alloy and Compounds 2001, 315, 193.
8. Yang, L.; Wu, J. S.; Zhang, L. T. J. Alloy and Compounds 2004, 375, 114.
9. Cahill, D. G.; Watson, S. K.; Pohl, R. O. Phys. Rev 8 1992, 46, 6131.
10. Nolas, G. S.; Cohn, J. L.; Slack, G. A. Phys. Rev. B 1998, 58, 164.
11. Xie, J.; Gao, X.; Cao, G.; Zhong, Y.; Zhao, M. J. Electroanalytical Chem. 2001, 542, 1.
12. Williams, D. B.; Cater, B. C. Transmission Electron Microscopy 2nd Edition (Springer. New York, 2009).
13. Kalbac, M.; Zukalova, M.; Kavan, L. J. Solid State Electrochem. 2003, 8, 2.

13
List of Symbols, Abbreviations, and Acronyms
ARL U.S. Army Research Laboratory
BET Brunauer-Emmett-Teller
CoSb3 cobalt triantimonide
DME 1,2-dimethoxyethane
DSC differential scanning calorimetry
Ge germanium
Li lithium
LiBF4 lithium tetrafluoroborate
Ni nickel
NMP N-methylpyrrolidinone
PC propylene carbonate
Pd palladium
PVDF polyvinylidene fluoride
Sb antimony
SEI solid electrolyte interface
Si silicon
Te telluride
TE thermoelectric

14
NO. OF COPIES ORGANIZATION 1 ADMNSTR ELECT DEFNS TECHL INFO CTR ATTN DTIC OCP (ELECTRONIC ONLY) 8725 JOHN J KINGMAN RD STE 0944 FT BELVOIR VA 22060-6218 1 CD OFC OF THE SECY OF DEFNS ATTN ODDRE (R&AT) THE PENTAGON WASHINGTON DC 20301-3080 1 US ARMY RSRCH DEV AND ENGRG CMND ARMAMENT RSRCH DEV & ENGRG CTR ARMAMENT ENGRG & TECHNLGY CTR ATTN AMSRD AAR AEF T J MATTS BLDG 305 ABERDEEN PROVING GROUND MD 21005-5001 1 PM TIMS, PROFILER (MMS-P) AN/TMQ-52 ATTN B GRIFFIES BUILDING 563 FT MONMOUTH NJ 07703 1 US ARMY INFO SYS ENGRG CMND ATTN AMSEL IE TD A RIVERA FT HUACHUCA AZ 85613-5300
NO. OF COPIES ORGANIZATION 1 COMMANDER US ARMY RDECOM ATTN AMSRD AMR W C MCCORKLE 5400 FOWLER RD REDSTONE ARSENAL AL 35898-5000 1 US GOVERNMENT PRINT OFF DEPOSITORY RECEIVING SECTION ATTN MAIL STOP IDAD J TATE 732 NORTH CAPITOL ST NW WASHINGTON DC 20402 1 US ARMY RSRCH LAB ATTN RDRL CIM G T LANDFRIED BLDG 4600 ABERDEEN PROVING GROUND MD 21005-5066 18 US ARMY RSRCH LAB ATTN IMNE ALC HRR MAIL & RECORDS MGMT ATTN RDRL CIM L TECHL LIB ATTN RDRL CIM P TECHL PUB ATTN RDRL SED C J WOLFENSTINE (15 COPIES) ADELPHI MD 20783-1197 TOTAL: 26 (24 HCS, 1 CD, 1 ELECT)