,ti file -a 228 996 · ddst ouspefal idd form 1473, jun 86 (reverse) security classification of...
TRANSCRIPT

,TI FILE 'Form Approved
A D -A 228 996 lb RESTRIC71VE MARKINGSNA
2a SECURITY CLASSIFICATION AUTHOKI I 3 DISTRIBUTION AVAILABILITY OF REPORTNA
2b DECLASSIFICATION i DOWNGRADING SCHEDULENA Distribution unlimited
4 PERFORMING ORGANIZATION REPORT NUMBER(S) 5 MONITORING ORGANIZATION REPORT NUMBER(
Carnegie Mellon University NA
6a NAME OF PERFORMING ORGANIZATION I6b OFFICE SYMBOL 7a NAME OF MIONITORING ORGANZAT,Oq NtD
Carnegie Mellon University NIfA~lcb Office of Naval Research I
6c. ADDRESS (City, State, and ZIPCode) 7b ADDRESS (City, State. and ZIP Code) , - (Department of Psychology t'Carnegie Mellon University 800 No. Quincy StreetPittsburgh, PA 15213 Arlington, VA 22217-5
Ba NAME OF FUNDING/SPONSORING B~b OFFICE SYMBOL 9 PROCUREMENT INSTRUMENT IDENTIFICATION NUMBERORGANIZATION (If applicable)Office of Naval Research ONR N00014-88-K-0063
8. ADDRESS (City, State, and ZIP Code) 10 SOURCE OF FUNDING NUMBERS
800 N. Quincy Street PROGRAM PROjECT TA51e VORK UNIT
Arlington, VA 22217-5000 ELEMENT NO NO NO ACCESSION NO
61153N RR0410811 TITLE (Include Security Classification)
Behavior, Immunologic Response, and Upper Respiratory Infection
12 PERSONAL AUTHOR(S)Sheldon Cohen, Carnegie Mellon University
13a TYPE OF REPORT 13b TIME C VERED T14 DATE OF REPORT (Year, Month, Day) 75 PAGE COUNTFINAL FROM 1/88 TO 3/31/9C I September 1990
16 SUPPLEMENTARY NOTATION
17 COSATI CODES 18 SUBJECT TERMS (Continue on reverse if necessary and identify by block number)
FIELD GROUP SUB-GROUP Stress, social support, lymphocytes, antibody, smoking,infection, HSV-1, viral challenge, RV
19 ABST1T (Con-nue on reverse if necessary and identify by block number)A b ur study involves predicting infection and symptomatology in humans trom
psychological status, health behaviors, and immunologic measures taken prior to a viral
challenge (Rhinoviruses 2, or 9, or 14). Subjects in the viral challenge trials were 302volunteers kept In Isolation and monitored closely for viral shedding, and symptomatology
over nine-day trials. We also collected cross-sectional data on psychological and behavioral
characteristics and Immune status from an additional 385 volunteers (total of 687 for
analyses of these data). ONR funds were used to (a) examine the usefulness of antibody
levels to Herpes Simplex Virus I (HSV-1) as an indirect measure of cellular immune function
In this context; and (b) to examine the Influence of smoking status and rate (as assessed by
serum cotinine) on Immunity and susceptibility to infection. k,/ g20 DISTRIBUTION/AVAILABILITY OF ABSTRACT 21 ABSTRACT SECURITY CLASSIFICATION
&NCLASSIFIED/UNLIMITED 0 SAME AS RPT 0 DTIC USERS (u)
22a NAME OF RESPONSIBLE INDIVIDUAL 22b TELEPHONE (Include Area Code) 22c OFFICE SYMBOL
Joel Davis (202) 696-4055 ONR
D Form 1473, JUN 86 Previous editions are obsolete SECURITY CLASSIFICATION OF THIS PAGE
S/N 0102-LF-014-5603
8 r
SECURITY CLASSIFICATION OF THIS PAGE
19. HSV-1 antibody levels (IgA and IgG) as measured by ELISA were not correlated with
psychological measures In HSV-1 seropostive persons. Contrary to prediction, higher levels
of HSV-1 IgA were associated with less susceptibility among persons challenged with RV2,
but not associated with susceptibility for those challenged with RV9 or RV14. Smoking
status and rate (as assessed by cotinine) were associated with nonspecific (across cell
populations) Increases In numbers of peripheral white blood cells. This elevation is still
detectable one year post-quitting but is no longer detectable five years post-quitting.
Smoking status as verified by cotinine constitutes a four-fold Increased risk for clinical colds
for women but no increased risk for men. Although women smokers do not differ In rates
of infection, they are six-times more likely than women nonsmokers to manifest clinical
symptomatology If they are Infected. The Increased risk for women (but not men) smokers
is found whether the outcome is physician's clinical judgment, total upper respiratory
symptom scores, or total mucus weights.
Access91OD For
ETis ORA&IDTIC TAB
c'o,
Tustiftoto
DistrIbuti on/
Availability Codes
I IAva il and/or
DDst oUspeFal
IDD Form 1473, JUN 86 (Reverse) SECURITY CLASSIFICATION OF THIS PAGE
I II I IOIkI

2
ONR Final Report, January 1, 1988 - March 31, 1990
Overview of Purpose
This report focuses on measures funded by ONR in the context of a larger study
designed to determine the roles of psychosocial states, immunologic status, and health
practices in individual susceptibility to upper respiratory infection, and clinical colds. On
entrance to the study, 687 healthy volunteers between the ages of 18 and 55 completed
psychological and behavioral protocols and had blood drawn for immune assessments. This
sample Is used In this report to examine differences in pre-viral challenge Immunity based
on psychological states and on smoking status.
Subsequent to the collection of these data, 302 of the volunteers were challenged with
one of three rhinoviruses (Types 2, 9, and 14). This sample is used to evaluate the
influence of psychological and Immune measures assessed pre-challenge on susceptibility to
Infection and clinical disease. Volunteers in the challenge sample were kept in Isolation and
monitored closely for viral shedding, and symptomatology over nine-day trials. Serum
samples for determination of viral-specific antibody were collected prior to challenge and
approximately 28-days post-challenge. The primary outcomes were infection (viral shedding
and/or increase in viral-specific antibody) and clinical colds (infection + clinician diagnosis of
cold). The primary purpose of the study was to predict Infection and clinical colds from
measures of psychological states, health practices and immune status taken prior to viral
challenge.
This report focuses on two ONR funded aspects of the larger project: (1) examination
of the possible usefulness of HSV-1 antibody levels as an indirect measure of cellular
Immune function, and (2) examination of the effects of smoking status and rate (as
biochemically assessed by serum cotinine) on immunity and susceptibility to infection.
HSV as an Indirect Measure of Cellular Immune Function
This work was stimulated by Glaser's argument (e.g., Glaser & Gotlieb-Stematsky, 1982)
that latent herpes viruses are held in check by cellular immune function and hence virus
activation among persons infected with herpes viruses suggests a suppression of cellular
Immune competence. Glaser and his colleagues have used increases in herpes antibody
levels among seropositive persons as indicators of viral activation. In our study, we use
HSV-1 antibody levels assessed prior to viral challenge. Serum samples were assayed for
both HSV-1 IgG and HSV-1 IgA. HSV-1 antibody levels from HSV seropositive persons were
(a) correlated with various psychological measures; (b) compared with nonspecific antibody
levels, and with enumerations of peripheral white t'!cod cell populations including lymphocyte

3
subsets; and (c) evaluated as a predictor of susceptibility to infection and clinical disease.
HSV Assays
To assay Immunoglobulin against whole virus antigen an accredited HSV-1 strain was
obtained (strain 10798 from the Centre for Applied Microbiological Research) and a pool of
viral antigen prepared after growing the virus in human diploid fibroblasts. A control antigen
pool was prepared from uninfected cell cultures. A pool of IgG-positive sera was also
selected for use as a positive standard in the IgG assays. The format for the IgG ELISAs
is similar to the protocol we employ for antirhinovirus antibody assays. One half of the
microtitre plates are coated with viral antigen and the other half with control antigen. Atitration of the positive serum standard and duplicate samples of each test serum (at a
single dilution) are added to each half of the plate. After reading the final optical densities
from the assays, the control antigen values are subtracted from the viral antigen values.
The positive serum standard is assigned an arbitrary value of 1 x 10⁵ units so the corrected
optical densities from the test samples can be equated with a point on the standard dilution
curve and allocated a value. We calibrate the positive serum standards against commercial
sera of known Immunoglobulin content, thus enabling the specific antibody content of the
test-sera to be expressed in ng/ml.
The protocol adopted for HSV-1 IgA measurement utilized an indirect ELISA and test-
sera pre-absorbed with protein-A. A suitable pool of IgA-positive sera was selected for use
as a standard.
Of the 664 persons (with HSV assays), 82.7% were seropostive as assessed by HSV-IgA and 64.0% were serpositive as assessed by HSV-IgG. One hundred forty-two persons
were seropositive on IgA but not on IgG. Conversely only 18 persons were seropositive on
IgG but not on IgA. [Apparently there were differences in the sensitivity of our two assays).
As a consequence, seropositivity was defined as seropositive on either of the two measures;
resulting in 569 [86%1 seropositive persons.
Because increased antibody production to HSV-1 could reflect a general activation of
humoral Immunity as opposed to cellular immune suppression, we used anti-rubella antibody
In test sera to control for this alternative Interpretation. Necessary antigens were purchased
from the Central Public Health Laboratory and their standard protocol adopted. Of the 569
.,racn seropositive on HSV-1, 96.0% were seropostive on Rubella.
HSV, Psychologic State, Immunity, and Susceptibility
Correlations with Psychologic Variables. Because we were concerned with associations
between detectable HSV antibody levels and psychological variables, the following analysesincluded only those 569 persons who were seropositive on at least one of the two HSV
4
antibody measures.
Recall that serum samples for HSV antibody determination and psychological measures
were both collected during the two day period prior to viral challenge. Cross-sectional
correlations were calculated between HSV antibody levels (both IgA and IgG) and each of
the following psychological measures: stressful life events, perceived stress, negative affect,
personal control, self-esteem, role involvement in social networks (# of social roles),
introversion-extroversion (I-E), and psychological distress. There were significant correlations
between introversion-extroversion and IgA (.13, p<.002) and IgG (.12, p<.003). However,
there was a similar correlation between Rubella antibodies and I-E (.14, p<.001) suggesting
a general influence on antibody level rather than a specific influence on herpes antibodies.
Similarly, there were significant correlations between number of social roles and IgA (.09,
p<.03) and IgG (.08, p<.05), with a simliar correlation between Rubella antibodies and
social roles (.08, p<.06).
Correlations with Immune Measures. Correlations of HSV antibodies and immune
measures (humoral Immunity and cell enummerations) indicated HSV-IgA was correlated with
serum IgA total (.09, p<.03), nasal IgA total (.12, p<.01), nasal protein total (.10, p<.02),
and percent CD8+ cells (-.16, p<.04). HSV-IgG correlated only with percent CD8+ cells
(-.18, p<.02). There were no correlations between Rubella antibody levels and any of these
measures.
HSV antibodies as predictors of clinical colds. These analyses included the 249
subjects who were challenged with RV2, RV9, or RV14, were not administered a drug, andwere seropositive on either HSV IgA or IgG. To control for virus, serostatus on the
challenge virus, age, gender, education, allergy-status (allergic to something or not) and
general (represented by Rubella) antibody level, each equation Included each of these
variables as well as the respective HSV antibody. The initial equations also included all
possible interactions between the HSV antibody measure and control variables.
Nonsignificant Interactions were then dropped from the equation. There were interactions
between virus type and IgG (coefficient of -.41, SE .19, t=-2.20, p<.028) and between virus
type and IgA (coeff. of -.92, SE .40, t=-2.31, p<.02). Separate regressions within each
virus indicate greater HSV-1 IgA antibody levels are associated with less risk for RV2 colds
(coefficient -.66, SE .33, t=-2.01, p<.04), but not for RV9 or RV14 colds. In the case of
volunteers exposed to RV2, 9.1% of those above the median developed colds, while 34 .8%
of those below the median developed colds. HSV-1 IgG was not associated with cold
outcomes in any of the three viruses when examined separately.
Conclusion. We found no evidence for HSV antibody modulation by psychological
variables. Although HSV-IgA antlhndy levels were rc!ated to stisceptibil!ty tor RV2 colds, it
was in the opposite direction than predicted. That is, persons with higher HSV-IgA levels
were less susceptible to colds. We are, at this point, unable to explain why HSV antibody

5
levels would be negatively related to RV2 susceptibility and not related to susceptibility to
RV9 or RV14. Both HSV-lgA and -IgG also demonstrated a small negative relation to the
number of suppressor-cytotoxic cells (CD8+) In peripheral blood. Not surprisingly, HSV-IgA
also demonstrated small positive correlations with measures of total Ig and total protein.
It is important that earlier studies demonstrated herpes antibody change between
stressful and nonstressful situations. In our study, however, we were limited to cross-
sectional correlations between a single measure of antibody and self-reported psychological
variables. Individual variability in antibody production may overshadow any relation with
psychosocial variables or with susceptibility to Infection. Clearly, studies of herpes antibody
changes In response to environmental stressors (e.g., medical school exams) provide a better
test of this hypothesis.
The decreased risk for RV2 colds among persons with elevated HSV-IgA found in this
study is puzzling. This may indicate that herpes antibody changes serve as a marker for
more complex processes than a suppression of cellular immune function. Alternatively, it
may suggest that the components of cellular function that are suppressed may have different
Implications in the face of different Infectious agents.
Smoking, Immunity and Susceptibility to Colds
Most existing studies of smoking and infectious respiratory illness focus on influenza.
For example, studies of the Incidence of biologically verfied Influenza during epidemics
suggest greater risk of clinical Illness among cigarette smokers (more than 1 pack/day:
Finklea, Sandifer & Smith, 1969; at least 1/2 pack/day: Waldman et al., 1969). One study
found that increased risk for smokers only occurred among those with little or no pre-
epidemic antibody to the epidemic viruses (MacKenzie et al., 1976). However, the sole
epidemiologic study of serologically verified rhinovirus colds (Gwaltney et al., 1966) failed to
find a relation between smoking and disease risk. Finally, although data from the Tecumseh
study (Monto et al., 1975) support greater incidence of a range of respiratory Infections for
smokers, effects of smoking on serologically verified illness rates varied with initial health
status. Only the healthiest (no baseline symptoms of cough or sputum) group of smokers
showed Increased Illness rates.
Although provocative, these studies suffer from several methodological weaknesses.
First, smoking status and rate are based on self-report. Because smokers are often poor
estimators of their smoking rates, vary In the way they smoke (e.g., deepth of inhaling,
amount of the cigarette smoked) and sometimes bias reports made to health professionals, a
biochemical assessment of rate and status is preferable. Second, exposure to the Infectious
agent Is not controlled for In these studies. Smokers may be more (or less) likely to come
in contact with Infected persons. For example, smokers may have more children than

6
nonsmokers. Third, in most of these studies, the definition of 3n illness episode is
dependent on persons seeking medical care (the exception is the Tecumseh study).Smokers may be more likely to seek medical care when bothered by mild symptomsbecause of their elevated risk for serious respiratory disease. Alternatively, they may be lesslikely to seek care because they fail to recognize mild respiratory symptoms as disease
related.
In the study reported here, volunteer smoking status and rates are determined byserum cotinine--a metabolite of nicotine. Volunteers are expose%. to one of three rhinovirusesand the onset and course of infection and symptoms are closely monitored during the study.Finally, diagnosis of clinical disease includes verification of infection as well as characteristic
symptomatology.
We also examine the relationship between enumerations of peripheral white blood cell
populations and smoking status and rate. We attempt to replicate earlier results indicatingelevations across cell populations for smokers (see review by Holt, 1987) and examine thepossibility that these changes predict susceptibility to rhinovirus colds.
Assessing Smoking Status and Rate
Serum cotinine. Cotinine, a metabolite of nicotine, was used to provide a biochemicalassessment of smoking status and smoking rate. To obtain a representative and stablemeasure, we averaged cotinine levels from two serum samples taken four weeks apart. Thefirst sample was collected at the Common Cold Unit at study intake and the second byvolunteers' own physicians. Cotinine levels were measured in serum by gas chromatography(Feyerabend & Russell, 1990).
Smoking status. Persons with average cotinine levels of 15 ng/ml or more were
defined as smokers, while those with less than 15 ng/ml were defined as nonsmokers(Jarvis, Tunstall-Pedoe, Feyerabend, Vesey & Saloojee, 1987). This cutoff is closely relatedto self-reports of smoking status when smokers are defined as persons smoking at least onecigarette per day. The use of a cotinine cutoff provides an objective means of classifyingthose whose self-reported rates are close to the criterion as well as those who may
misrepresent their smoking status. Based on the 15 ng/ml coutoff, 9 persons (3% of thesample) who reported smoking less than one cigarette per day were defined as smokers,and 4 persons (1% of the sample) who reported smoking at least one cigarette per daywere defined as nonsmokers.
Smoking rate. We use log average cotinine levels as an indicator of smoking rate.Cotinine is used because it provides an objective measure of nicotine intake that is notsubject to self-report bias. Cotinine also provides a comparable measure for cigar and pipesmokers. The correlation between log average cotinine and the log self-reported number ofcigarettes smoked per day (including nonsmokers) was .96 (p<.001, N=302). The samecorrelation for smokers only Is .54 (p<.001, N=83).

7
Smoking and Enumerations of Peripheral White Blood CellPopulations
Table I presents the mean enumerations of peripheral leukocyte population by smoking
status: never smokers, 5 years or less ago, current light (230 ng/ml or less) and heavy
(more than 230 ng/ml) smokers. The 230 ng/ml cutoff is based on the median average
cotinine level for 211 smokers included in total white blood cell analysis and is equivalent to
smoking about 15 cigarettes per day. The probabilities in the table are derived from
analyses of covariance in which the independent variable was smoking status (5 levels); the
dependent variables were the loglo transformed enumerations of cell populations; and the
covariates (control var!ables) were sex, age, education, and allergy status. For interpretability,
the table reports observed mean cell enumberatlons rather than their logs.
Table 1. Mean enumerations of peripheral white blood cell populations by smoking status. All
values are 106/ml.
Never- Ex-Smoker Ex-Smoker Current CurrentSmokers >5 years <5 years light heavy p<
Total WBC 5.56 5.74 6.32 6.43 7.65 .001Monocytes .45 .48 .51 .53 .60 .001Neutrophils 3.20 3.32 3.80 3.71 4.59 .001Lymphocytes 1.90 1.94 2.01 2.19 2.45 .001T-cells 1.39 1.36 1.72 1.60 1.96 .004B-cells .30 .29 .34 .35 .38 NSHelpers .68 .68 .84 .76 1.05 .037Supp.-Cytot. .31 .27 .34 .33 .46 .093
Sample sizes for monocytes, lymphocytes and neutrophils are approximately 348 for never-
smokers, 74 for ex-smokers who quit more than 5 years ago, 54 for ex-smokers who quit 5
years or less ago, 102 for current smokers with average cotinine levels of 230 ng/ml or less,
and 109 for current smokers with average cotinine levels of more than 230 ng/ml. Sample
sizes for T, B, helper and suppressor-cytotoxic cells are approximately 88, 22, 17, 22, and
21.
There is a clear pattern across cell populations with smokers having more cells than
nonsmokers and heavy smokers having the greatest number of cells. Although the patternslook similar, the differences do not reach significance among B-cells and suppressor-cytotoxlc
Ts. In both of these cases the sample sizes are considerably smaller than those available
for WBC, monocytes, neutrophIls, and lymphocytes and hence statistical power Is much
attenuated. These data are consistent with those reported earlier by a number of
Investigators (see review by Holt, 1987).
Tollerud et al. (1989) report that elevated numbers of white blood cells among smokers
8
are reversible with persons quitting one-year or more prior to the study having counts like
nonsmokers. Our own data Indicate that persons quit for less than five years have mean
cell numbers similar to those of light smokers. Only after five years off cigarettes do theirmeans resemble those of never smokers.
Smoking and Susceptibility to Rhinovirus Colds
Regression Equations Testing the Effects of Smoking on Susceptibility to Colds
The primary outcome In these analyses is whether or not persons exposed to viruses
developed clinical colds (verified infection + clinician diagnosis of a cold). In each case,we also conduct additional analyses to determine whether effects on clinical colds are
attributable to increased Infection or to an increase in clinical colds among infected persons.Logistic regression is used to predict all of these binary outcomes. Multiple regression is
used in supplementary analyses in which we predict total mucus weights and total symptomscores.
Predictors in the prototypic regression included smoking (status or rate) as well as
control variables that might provide alternative explanations for the effect of smoking. Thecontrols included age, gender, education, allergies, virus, and serostatus. The categoricalvariables, virus (RV2, RV9, RV14), serostatus, allergies (yes or no) and gender were enteredas dummy variables, while age and education (no schooling 101 to higher degree 181) wereentered as continuous variables. Preliminary analyses were conducted to determine whetherthere were interactions between any of the control variables and smoking in predicting the
outcome under consideration (see Hosmer & Lemeshow, 1989). As discussed later, asmoking by gender interaction was detected in all of the analyses; there were no significantInteractions between smoking and any other control variable. There were also no three-wayInteractions of control variables, gender and smoking. The lack of interactions with other
control variables indicate that reported effects are similar across different viruses, and levelsof serostatus, age, ierg status, and education. Hence the final (reported) equationsincluded all of the control variables, smoking (either status or rate), and the smoking bygender Interaction. As a result, regression coefficients for smoking and smoking by genderare adjusted for possible effects of the control variables.
All reported rates of Infections and colds are adjusted (predicted rates) for all variables
in an equation. In the case of Interactions between smoking and gender, predicted rates,
adjusted coefficients, and odds ratios were derived from separate equations in which theeffects of smoking were examined separately for males and females.
Smoking as a Predictor of Clinical Colds
Smoking status was entered as dichotomized variables in the initial equation predicting
clinical colds. There was a significant coefficient for the smoking by gender interaction
(coefficient of 1.25, standard error of .61, t=2.05, p<.04). To accurately estimate the
nature of the interaction, we calculated separate regression equations for men and for
women. Coefficients and odds ratios for smoking status and adjusted (predicted) clinical
cold rates were derived from these regressions. For women, 31.7% of nonsmokers and
56.2% of smokers developed clinical colds. The coefficient for smoking status was 1.47,
standard error .51, t=2.89, p<.004; the odds ratio was 4.33. The odds ratio of 4.33
Indicates that women smokers were 4.33 times more likely to develop colds than women
who did not smoke. For men, 31.2% of smokers and 29.4% of nonsmokers developed
colds. This difference was not statistically reliable.
One explanation for smoking status influencing risk of colds for women but not for
men would be that smoking rate differed between men and women smokers. For example,
one might hypothesize that women smokers smoked more and that higher smoking rates
were associated with higher risk. However, t test comparing mean self-reported rates (16.1
for men and 15.2 for women) and mean log averaged cotinines (2.27 for men and 2.27 for
women) Indicate no differences between men and women. Hence increased risk of
developing colds for women smokers is not attributable to their being heavier (or lighter)
smokers.
A second series of analyses was designed to determine the possibility of a dose-
response relation between smoking rate and incidence of colds. In these analyses, smoking
rate (continuous log average cotinine levels) was entered Into the standard logistic model in
place of smoking status. The analysis indicated a significant coefficient for the smoking rate
by gender interaction (.69, standard error of .30, t=2.27, p<.02). The nature of this
relation is depicted in Figure 1. Three cotinine le -91s are used to depict rate in the figure:
nonsmokers (15 ng/ml or less), and light (15.01 to 203.17 ng/ml) and heavy (203.18 or
higher ng/ml) smokers. The light and heavy smoker categories are based on a median split
of average cotinine for the 83 smokers in the sample of 302 persons used in these
analyses and correspond to 14 or fewer cigarettes per day and more than 14 cigarettes per
day respectively. Standard errors of each of these rates are also depicted in the figure.
As apparent from the figure, women smokers are at higher risk for developing colds than
women nonsmokers and that risk Increases with increased smoking rate. However, smoking
does not increase risk for men.

10
70
65Females
60
55 -
50Co 45
d 40S3o
30 Males
25
Nol.4.oem Light Ssokws H Soe,
Sr"oking Rate
Figure 1. Smoking rate (based on average cotinine) and gender as predictors of the
percent of persons developing a clinical cold.
Infection. Additional analyses were conducted to determine whether the previously
described effects were attributable to the influence of smoking on increased infections or on
Increased clinical colds among infected persons. In predicting infection, smoking status,
gender, and the smoking status by gender Interaction all failed to reach levels of
significance. A similar analysis using smoking rate (log average cotinine) also failed to
Indicate any significant effects.
Predicting clinical colds for infected persons. A regression predicting clinical colds for
Infected persons (N=246) produced a significant coefficient for the smoking status by gender
Interaction (1.69, .68, t=2.49, p<.01). Separate regressions models for men and women
Indicated a significant coefficient for smoking status for women (1.81, .59, t=3.04, p<.002)
but not for men. The odds ratio was 6.10 Indicating that infected women who smoked were
more than six times as likely to develop clinical colds than infected women who did not
smoke. A similar analysis using smoking rate (average cotinine) also Indicated a rate by
gender Interaction (.88, .33, t-2.66, p<.008). The effect, depicted In Figure 2, mapped
perfectly on to the modifying Influence of smoking status on clinical colds for women.
11
(Infeded S ony)
75 Females
70
65
% 60
055C s
0 50
d 4S 40
35 -Makes
30
25
N onrmfolors Light mW.o Heavy Smok.,
Smoking Rate
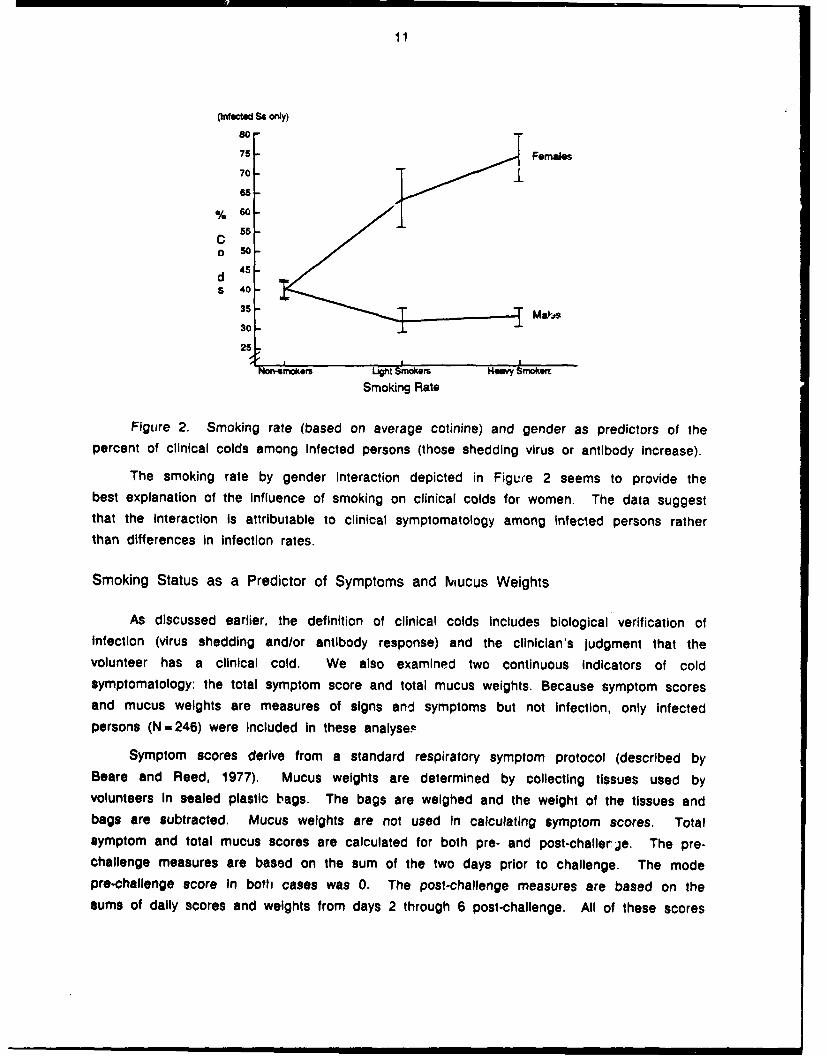
Figure 2. Smoking rate (based on average cotinine) and gender as predictors of thepercent of clinical colds among Infected persons (those shedding virus or antibody increase).
The smoking rate by gender interaction depicted in Figure 2 seems to provide thebest explanation of the influence of smoking on clinical colds for women. The data suggestthat the Interaction Is attributable to clinical symptomatology among infected persons ratherthan differences in infection rates.
Smoking Status as a Predictor of Symptoms and Mucus Weights
As discussed earlier, the definition of clinical colds Includes biological verification ofInfection (virus shedding and/or antibody response) and the clinician's judgment that thevolunteer has a clinical cold. We also examined two continuous Indicators of coldsymptomatology: the total symptom score and total mucus weights. Because symptom scoresand mucus weights are measures of signs and symptoms but not infection, only infected
persons (N=246) were Included in these analyse,
Symptom scores derive from a standard respiratory symptom protocol (described byBeare and Reed, 1977). Mucus weights are determined by collecting tissues used byvolunteers in sealed plastic bags. The bags are weighed and the weight of the tissues and
bags are subtracted. Mucus weights are not used In calculating symptom scores. Totalsymptom and total mucus scores are calculated for both pre- and post-challerje. The pre-challenge measures are based on the sum of the two days prior to challenge. The modepro-challenge score In both cases was 0. The post-challenge measures are based on thesums of daily scores and weights from days 2 through 6 post-challenge. All of these scores

12
were lOglo transformed to normalize the distributions.
A linear multiple regression model was used in analyzing these continuous data.Procedures and models are the same as those described earlier. First, we examined thepossibility of a relation between smoking and pre-challenge (baseline) symptom scores andmucus weights. There were no relations of smoking, gender or their Interaction and eitherpre-challenge score. Second, we examined the relations of smoking, gender and their
Interaction In predicting five-day post-challenge symptoms and mucus weights. In the case of
total symptoms, there was a smoking status X gender Interaction (F[1,236]=9.28, p<.003).The smoking rate analysis Indicated a similar interaction (F[1,2361=10.23, p<.002). As
apparent from Figure 3, these data are consistent with the clinical cold data based oninfection and clinician judgment.
(hinected Se only)
L 1Females09 1
S 0.9ym 0.8p
0.70m 0.6
SC
0.5 -0 Malesr 0.40
lght SnVWqS Heay Smowim
Smoking Rate
Figure 3. Smoking rate (based on average cotinine) and gender as predictors of log
total symptom scores among infected persons.
As apparent from Figure 4, virtually Identical results were found for mucus weights. Inthis case, there was a main effect for smoking status (F[1,2371-4.49, p<.035) and asmoking status by gender interaction similar to that found in the earlier analyses
(F[1,2361-9.63, p<.002). For smoking rate, there was similarly an effect for rate(F[1,2371-4.02, p<.046) and a rate by gender interaction (F[1,2361=10.59, p<.001).

13
(IrNected Ss only)
1.3
L 12- Females0g 1.1
Mu 1C
W o.8
i 0.7 - Males
9 0.6t
Non-smokors Light Smokemr H.avy Smoke.
Smoking Rate
Figure 4. Smoking rate (based on average cotinine) and gender as predictors of total
mucus weights among Infected persons.
Pathways through which Smoking may Influence Susceptibility
Our data indicate that smoking puts women but not men at higher risk for the
development of clinical colds when exposed to a rhinovirus. Moreover, the influence of
smoking on increased susceptibility in women primarily occurs at the level of symptom
development for infected persons. We also find Increased numbers of peripheral bloodleukocytes among smokers. Although we found no smoking by gender interactions in
predicting leukocyte numbers, mean increases under smoking tend to be slightly higher for
fam"les than males (cf. Burton et al., 1983). Even so, these two effects seem to be
Independent of one another since adding leucocyte numbers to the equation predicting
susceptibility to colds has only a trivial influence on the outcome.
Smoking and susceptibility to Illness. The increased risk of clinical Illness for women
smokers is generally consistent with the epidemiologic data reviewed earlier in this report.
What is puzzling Is why women but not men are affected. Because we assess smoking
status and rate biochemically, gender differences in the manner In which cigarettes are
smoked do not provide an explanation. Our data are, however, consistent with accumulating
evidence that females are more sensitive to nicotine than males (Grunberg, in press;
Silverstein et al., 1980). For example, there is evidence from human studies that the first
experience with cigarette smoke Is more aversive for women than men (e.g., Silverstein,
1980) and from animal studies that there are greater effects of nicotine on eating behaviors
and body weights of female rats (Grunberg, Bowen & Winders, 1986). More closely tied to
14
the issue of smoker risk for infectious respiratory illness is evidence for sex-related
differences in effects of smoking on lung function. Although the data are not entirely
consistent (USDHHS, 1984), women smokers (but not nonsmokers) may have higherprevalence of abnormalities in small airways response than men (e.g., Buist & Ross, 1973a;
1973b; Buist et al., 1973; 1979a). These responses are thought to be irritative.
Smoking and symptom mediators. We can only speculate on why women smokers are
at higher risk for colds and men are not. However, whatever the gender difference
contributing to this effect, it must influence symptom production for infected persons.
Symptom manifestation may be influenced by a variety of mechanisms. The production ofmore virus may Itself account for increased symptomatology may trigger the release of
symptom mediators. A rough measure of viral replication, n,.nber of days shedding virus,
did not however map onto the gender by smoking effect. Alternatively, differences between
male and female smokers in the production and/or binding of symptom mediators such askinins or histamines may be responsible. Rhinovirus infections are presumed to trigger aprocess that results in the production of inflammatory mediators (Naclerio et al, 1988).These mediators Interact with the local environment in the nose and throat to cause
rhinorrhea, nasal congestion and other cold symptoms (Gwaltney et al., 1984). Recent
evidence indicates that kinins are a probable mediator with increased kinins found in thenasal secretions of persons developing experimentally induced colds (Naclerio et al., 1988)ane nasal obstruction, sore throats and rhinorrhea found among human volunteers challengedwith bradykinin (Proud et al., 1987). Enzymes with arginine esterase activity (probably
plasma kallikrein) are responsible for generating kinins (Naclerio et al., 1988). Although
Gwaltney and his colleagues (e.g., Naclerio et al., 1900) have been unable to detecthistamines release In persons with rhinovirus colds, evidence for symptom suppression in
response to nedocromil (Barrow et al., 1990), a drug that inhibits mast cell degranulation,
suggests that histamines and leukotrienes may also be involved in symptom mediation.Finally, the direct Irritation of effected membranes (see discussion of small airways above)
may lower the threshold for or aggravate existing symtomatology.
Acute versus chronic effects. Volunteers were allowed to smoke during the trials. As
a result, it is unclear whether the effects we report are acute effects on host resistance
during viral challenge or chronic effects of smoking.
15
References
Barrow, G. I., Higgins, P. G., AI-Nakib, W., Smith, A. P., Wenham, R. B. M., & Tyrrell,D. A. J. (1990). The effect of intranasal nedocromil sodium on viral upper respiratorytract infection in human volunteers. Clinical and Experimental A 20, 45-51.
Beare, A. & Reed, S. E. (1977). The study of antiviral compounds in volunteers. InJ. S. Oxford (Ed.), Chemoprophylaxis and virus infections, Vol 2. Cleveland: CRCPress.
Bulst, A. S. & Ross, B. B. (1973a). Predicted values for closing volumes using a modifiedsingle breath nitrogen test. American Review of Respiratory Disease, 107, 744-752.
Buist, A. S. & Ross, B. B. (1973b). Quantitative analysis of the alveolar plateau In thediagnosis of early airway obstruction. American Review of Respiratory Disease, 108,1078-1087.
Buist, A. S., Ghezzo, H., Anthonisen, N. R., Cherniack, A. M., Ducic, S., Macklem, P. T.,Manfreda, J., Martin, R. R., McCarthey, D., & Ross, B. B. (1979). American Reviewof Respiratory Disease, 120, 305-318.
Buist, A. S., Van Fleet, D. L., & Ross, B. B. (1973). A comparison of conventionalspirometric tests and the test of closing volume in an emphysema screening center.
American Review of Respiratory Disease, 107, 735-743.
Burton, R. C., Feguson, P., Gray, J., Hall, M. Hayes, M. & Smart, Y. C. (1983). DiagnosticImmunology, 1, 216-223.
Couch, R. B. (1985). Rhinovirus. In B. N. Fields, D. M. Knipes, R. M. Chanock et al.(Eds), Virology (pp795-816). New York: Raven Press.
Feyerabend, C., & Russell, M. A. H. (1990). A rapid gas-liquid chromatographic method forthe determination of cotinine and nicotine in biological fluids. Journal ofPharmocology, 42, 450-452.
Finklea, J. F., Sandifer, S. H., & Smith, D. D. (1969). Cigarette smoking and epidemicInfluenza. American Journal of Epidemiology, 90, 390-399.
Glaser, R., & Gotlleb-Stematsky, T. (Eds.) (1982). Human herpesvirus infections: Clinical
aspects. New York: Marcel Dekker.
Grunberg, N. E. (in press). Gender differences in tobacco use. Health Psychology.
Grunberg, N. E., Bowen, D. J., & Winders, S. E. (1986). Effects of nicotine on body weightand food consumption If female rats. Psychopharmacology, 90, 101-105.
Gwaltney, J. M., Jr., Hendley, J. 0. & Mygind, N. (1984). Summary. Acta Otolaryngol, 413(Stockh) (suppl), 43-45.

16
Gwaltney, J. M., Jr., Hendley, J. 0., Simon, G., & Jordan, W. S. (1966). RhinovirusInfections in an industrial population. The New England Journal of Medicine, 275,1261-1268.
Holt, P. G. (1987). Immune and inflammatory function in cegarette smokers. Thorax, 42,
241-249.
Hosmer, D. W., & Lemeshow, S. (1989). Applied logisti regression. New York: Wiley.
Jarvis, M. J., Tunstall-Pedo, H., Feyerabend, C., Vesey, C., & Saloojee, Y. (1987).Comparison of tests used to distinguish smokers from nonsmokers. American Journalof Public Health, 77, 1435-1438.
MacKenzie, J. S., MacKenzie, I. H., & Holt, P. G. (1976). The effect of cigarette smokingon susceptibility to epidemic influenza and on serological responses to live attenuatedand killed subunit Influenza vaccines. Journal of Hygiene, Cambridge, 77, 409-417.
Monto, A. S., Higgins, M. W., & Ross, H. W. (1975). The Tecumseh study of respiratoryillness: VIII. Acute infection in chronic respiratory disease and comparison groups.Annual Review of Respirator Disease, 111, 27-36.
Naclerio, R. M., Proud, D., Kagey-Sobotka, A. K., Lichtenstein, L. M., Hendley, J. 0., &Gwaltney, J. (1988). Pediatr Infect Dis J, 7, 215-242.
Proud, D., Reynolds, C. J., LaCapra, S., et al. (1987). The response to nasal provocationwith bradykinin. Journal of Allergy and Clinical Immunology, 79, 254.
Silverstein, B., Feld, S., & Kozolowski, L. T. (1980). The availability of low-nicotine cigarettesas a cause of cigarette smoking among teenage females. Journal of Health andSocial Behavior 21, 383-388.
Tollerud, D. J., Clark, J. W., Brown, L. M., Neuland, C. Y., Mann, D. L., Pankiw-trost, L. K.,Blattner, W. A., & Hoover, R. N. (1989). The effects of cigarette smoking on T cellsubsets. American Review of Respiratory Disease, 139, 1446-1451.
Waldman, R. H., Bond, J. 0., Levitt, L. P., Hartwig, E. C., Prather, E. C., Baratta, R. L.,Neill, J. S., & Small, P. A., Jr. (1969). An evaluation of influenza immunization.Bulletin of the World Health Organization, 41, 543-548.
United States Department of Health and Human Services (1984). The Health Consequencesof Smoking: Chronic Obstructive Lung Disease. A Report of the Surgeon General.Washington, DC: U.S. Government Printing Office.