tools and processes › downloads › toolkit-for... · unmanned aerial vehicle (uav) imagery. oam...
TRANSCRIPT
Page 18
TOOLS AND PROCESSES
FieldMapping
RemoteMapping
MapCreation
QualityAssurance
Community
iD EditorTasking Manager
OpenAerialMap
Export ToolHDX
Overpass TurboQGIS
JOSMOSMCha
ODKOMKKoboMaps.meOSMAndPOSM
iD
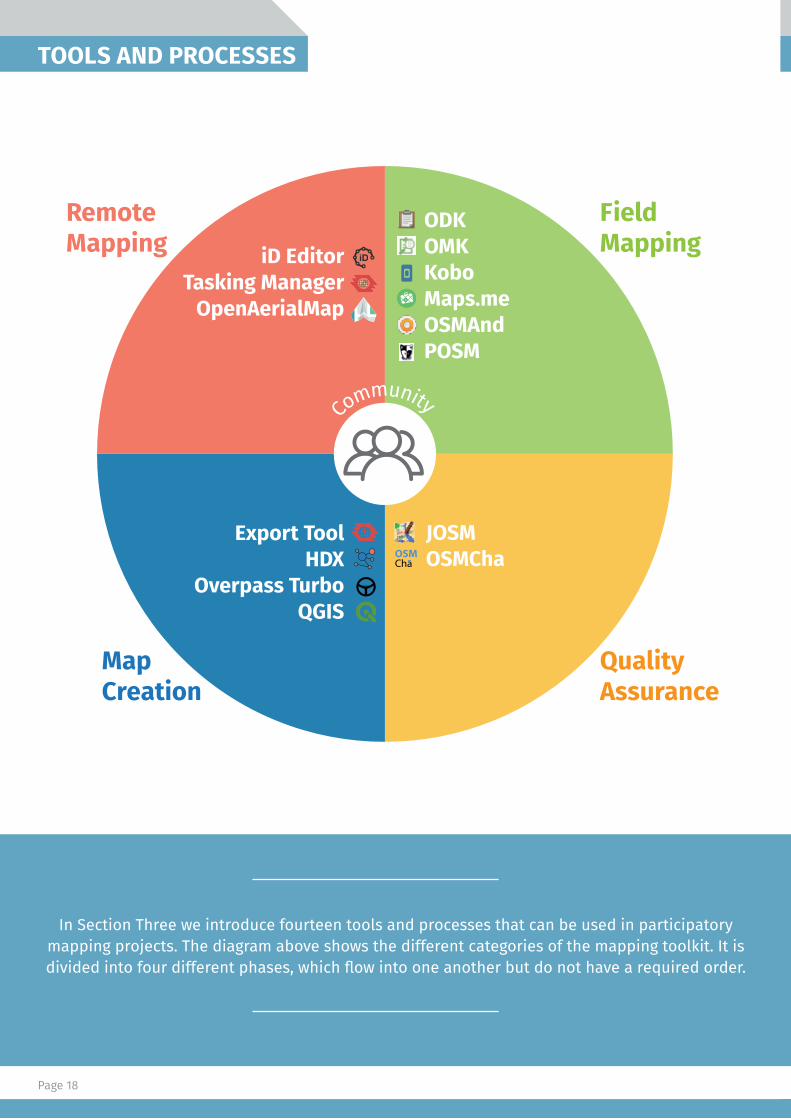
In Section Three we introduce fourteen tools and processes that can be used in participatory mapping projects. The diagram above shows the different categories of the mapping toolkit. It is divided into four different phases, which flow into one another but do not have a required order.

Page 19
REMOTE MAPPING (DIGITIZATION & EDITING)
Remote mapping is the process of modifying or adding in new data to areas from a distance. Usually it involves the use of a software program, tracing information from satellite imagery, and then uploading the results so that it can form part of the map data. Using imagery to draw points, lines and shapes on the ground is also called digitizing. Some people also simply call this process ‘armchair mapping’ because you can contribute without leaving your chair.
The objective of remote mapping is to cover a large area quickly, obtaining a high-level overview of what is actually on the ground. It allows people to directly contribute to a humanitarian project even if they cannot be physically present in the field. This also means that it is an entirely safe process, since it can be conducted from any location with the necessary technology.
In general, the first step is often identifying an area that needs to be mapped. Then it is important to determine if there is suitable imagery. A project can be created covering a certain area, and the level of detail required and urgency should be specified. The work is divided by remote mappers who each map a part of the overall area. This is checked by a second remote mapper who makes sure it is correct – a process called validation.
While there are many advantages of remote mapping, there are also some disadvantages. Data accuracy tends to be less when users do not physically visit the places they are mapping, favoring quantity over quality. If you are contributing to an area where data already exists in OpenStreetMap, and where local people have been contributing, you can even undo the hard work of field mappers if you do not follow instructions. The last problem is mitigated by following some basic guidelines:
For more details:Remote Mapping at LearnOSM (http://learnosm.org/en/coordination/remote)
Learn to recognize valuable data – figure out who has done what, and avoid changing data that is accurate
Specify what sources you are using – you can do this by adding the proper source=* tag in the changeset comment
Remember imagery can be wrong – it can either be misaligned from reality in one particular direction. Rather than moving the data, realign your background imagery layer to match
You can leave a fixme=* tab on elements, or a note=* tab to make a comment for validation
When in doubt, assume that existing data has been mapped by local people on the ground
In general, you can be more relaxed about remote mapping in areas of the world which are more remote, or otherwise have less pre-existing data
There are no perfect mappers and although you – and everybody else – will do your best to avoid mistakes, mistakes are inevitable.
“ “

Page 20
01 iD EDITORA simple in-browsereditor for OpenStreetMap
Key Steps For Using iD Editor:
Short Summary:
Skills and TechnologyNeeded:
The iD editor is a user-friendly tool that allows you to directly make changes in OpenStreetMap.
Computer
Internet connection
OSM account
The iD editor can be used in most situations. One area of concern, however, is making sure not to enter any information which could be potentially harmful to refugees. For example, sensitive information about nationality, religion, or gender should not be uploaded into OSM.
1. Open your Internet browser, and go to the OpenStreetMap website athttp://www.openstreetmap.org
2. Log in using your OSM accountclick the button the top right corner
3. Go to the place you want to edit – either by entering the location in the search box, or by panning and zooming to the area you wish to edit. You can pan by holding the left mouse button and dragging the map to your desired area.
4. Click on the small arrow next toThen click Edit with iD (in-browser editor)
a. For first-time users there will be a prompt for a walkthrough that begins inside the editor – it is helpful practice for learning the basics, and learning new words and concepts (it is always accessible through the Help icon)
5. You can add points, for example, placing a well or latrine in your area entering in relevant known details. You can draw lines, for example adding a road that hasn’t been drawn. Or you can draw areas, for example tracing a building that hasn’t been digitized.
6. Note: nothing will be uploaded to OSM until you click the Save button. You can enter any comments about your edits, and if you are uncertain there is also the option “I would like someone to review my edits” for extra validation.
7. Now you are ready to edit the map!
For more details:
Learn iD Editor (https://learnosm.org/en/beginner/id-editor/)
iD Editor Wiki (https://wiki.openstreetmap.org/wiki/ID)
Contextual Factors:
Page 21
02 MAPATHON
Short Summary:
Skills and Technology Needed:
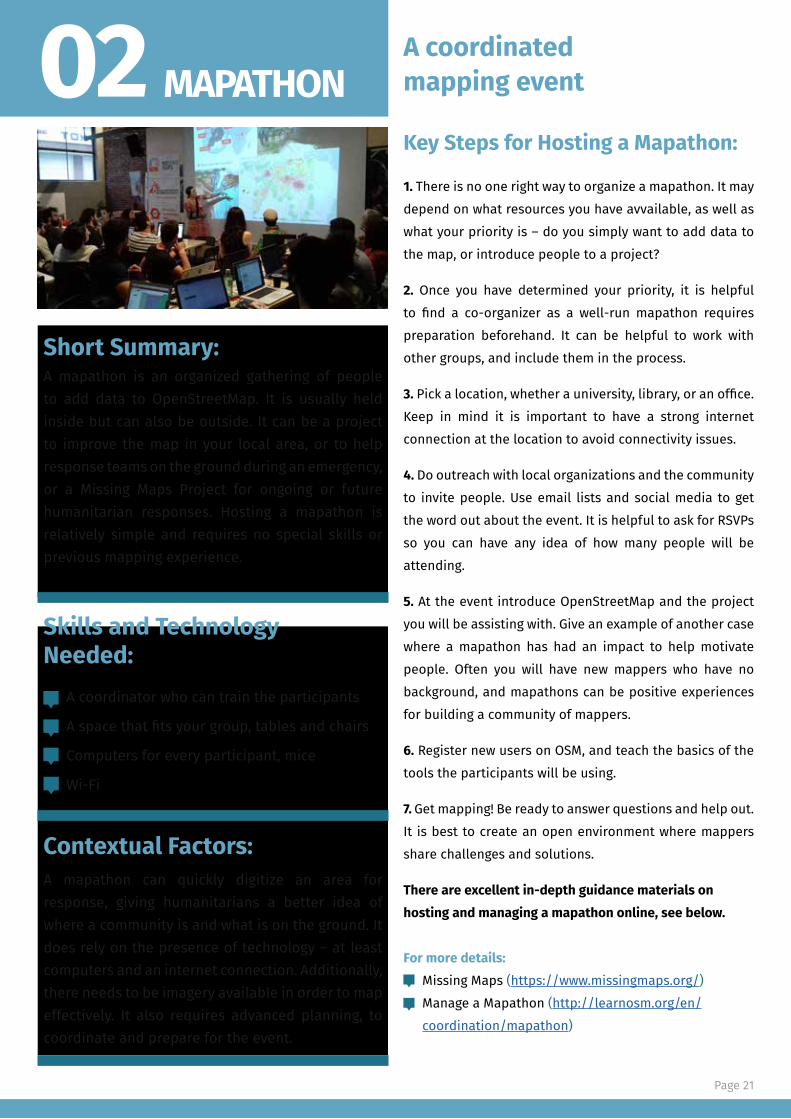
A mapathon is an organized gathering of people to add data to OpenStreetMap. It is usually held inside but can also be outside. It can be a project to improve the map in your local area, or to help response teams on the ground during an emergency, or a Missing Maps Project for ongoing or future humanitarian responses. Hosting a mapathon is relatively simple and requires no special skills or previous mapping experience.
A mapathon can quickly digitize an area for response, giving humanitarians a better idea of where a community is and what is on the ground. It does rely on the presence of technology – at least computers and an internet connection. Additionally, there needs to be imagery available in order to map effectively. It also requires advanced planning, to coordinate and prepare for the event.
A coordinator who can train the participants
A space that fits your group, tables and chairs
Computers for every participant, mice
Wi-Fi
1. There is no one right way to organize a mapathon. It may depend on what resources you have avvailable, as well as what your priority is – do you simply want to add data to the map, or introduce people to a project?
2. Once you have determined your priority, it is helpful to find a co-organizer as a well-run mapathon requires preparation beforehand. It can be helpful to work with other groups, and include them in the process.
3. Pick a location, whether a university, library, or an office. Keep in mind it is important to have a strong internet connection at the location to avoid connectivity issues.
4. Do outreach with local organizations and the community to invite people. Use email lists and social media to get the word out about the event. It is helpful to ask for RSVPs so you can have any idea of how many people will be attending.
5. At the event introduce OpenStreetMap and the project you will be assisting with. Give an example of another case where a mapathon has had an impact to help motivate people. Often you will have new mappers who have no background, and mapathons can be positive experiences for building a community of mappers.
6. Register new users on OSM, and teach the basics of the tools the participants will be using.
7. Get mapping! Be ready to answer questions and help out. It is best to create an open environment where mappers share challenges and solutions.
There are excellent in-depth guidance materials on hosting and managing a mapathon online, see below. For more details:
Missing Maps (https://www.missingmaps.org/)Manage a Mapathon (http://learnosm.org/en/coordination/mapathon)
Key Steps for Hosting a Mapathon:
A coordinatedmapping event
Contextual Factors:

Page 22
03 AERIALIMAGERY
Short Summary:
Contextual Factors:
Aerial imagery is a term used to describe photographs that are taken from the sky. This can be done from airplanes, drones, helicopters, or even kites and balloons, but the most common source of imagery comes from satellites orbiting the Earth. These photos can then be manipulated so that they can be used in GIS software.
One of the most basic questions to ask in a humanitarian context is what is the state of the available imagery? Do you need up-to-date imagery? If there has been a rapid evolution of the situation on the ground, for instance with the emergence of refugee camps, new imagery needs to be obtained. If there is not satellite imagery available, does the host country have legislation allowing UAVs, and what permissions are required?
OpenAerialMap is a set of tools for searching, sharing, and using openly licensed satellite and unmanned aerial vehicle (UAV) imagery. OAM offers a worldwide “canvas” on which various organizations can contribute to a patchwork of imagery. Open imagery can be critical for responding to crises – OAM makes it easy to host and access imagery for humanitarian response, which is custom and up-to-date.
Aerial Imagery at LearnOSM (http://learnosm.org/en/josm/aerial-imagery)Discover by DigitalGlobe (https://discover.digitalglobe.com) OpenAerialMap (https://map.openaerialmap.org)GEOSS Portal (http://www.geoportal.org)USGS Earth Explorer (https://earthexplorer.usgs.gov)Map Compare (https://tools.geofabrik.de/mc/ or https://mc.bbbike.org)
Assessing: It is important to assess what is the best imagery for your purposes. Experiment between imagery to see which is better, some may be out of date and not reflective of the current situation on the ground. You need to use your own personal judgement to determine which sources best match your needs.
Using: There are many different ways you can use imagery, as well as different tools that rely on imagery. For instance, in Cox’s Bazar humanitarians are using drones to assist with site planning and management.
Finding: The easiest starting point is to check for imagery in iD Editor. Simply click on Background Settings to see what imagery is available. The imagery is provided for free and is licensed. Another option is to look at Discover, DigitalGlobe’s imagery search tool. If you need other sources of imagery another option is to either capture it yourself using a drone, or by finding aerial imagery uploaded by others.
Common Sources of Aerial Imagery:Bing Aerial ImageryDigitalGlobe ImageryEsri World ImageryCustom (drones)
For more details:
Finding, assesing and using imagery
Satellite imagery highlighting the differences of urban and rural settings, from Istanbul, Turkey; PTP Camp, Liberia; Mvepti, Uganda and Cox’s Bazaar, Bangladesh.Satellite imagery highlighting the differences of urban and rural settings, from Istanbul, Turkey; PTP Camp, Liberia; Mvepti, Uganda and Cox’s Bazaar, Bangladesh.

Page 23
04 TASKINGMANAGER
Short Summary:
Contextual Factors:
Skills and Technology Needed:
The Tasking Manager is a mapping tool designed to divide up a mapping project into smaller tasks that can be completed rapidly with many people working on the same overall area. This also avoids conflicts or duplication of people working on the same project. It shows which areas need to be mapped and which areas need to be validated. The tool allows monitoring of the overall progress and helps improve the consistency of mapping. It can be used either by an administrator who manages a project, or by mappers working to complete an area.
Here we are specifically referring to the HOT Tasking Manager, which is only used for emergency situations that are in the preparedness or acute phases. The goal of this is to focus on the most urgent crises, most of which involve displacement. The steps below describe what to do if you are an administrator managing a task.
Note: To request project manager permissions, send an email to either [email protected] or [email protected] and they will make sure you get set up.
Computer, Internet connection, OSM account
How to create a GeoJOSN (optional)
How to create a JOSM Preset (optional)
1. Open your Internet browser, and go to the Tasking Manager at https://tasks.hotosm.org
2. Log in using your OSM account – click the Login button the top right corner, which will ask you to authorize access to your OSM account – click Grant Access
3. Now that you have logged in click on the arrow next to your username and select Create new project
4. Define your Area of Interest on the map, either by drawing it, importing a file, or using an OSM file; you should be familiar with the geographical area of the task
5. Choose Tasks Type – either select a square grid or arbitrary tasks
6. Set Task Sizes – split the area into larger or smaller tasks. You will need to decide an appropriate size, depending on the amount of features that need to be mapped.
7. Trim Project – cut the task grid to only the Area of Interest, this is optional
8. Review – here you will be able to see what your project looks like and how many tasks you have created
9. Now you have created a project! You can now enter a detailed description and instructions and then publish
For more details:OSM Tasking Manager Wiki (https://wiki.openstreetmap.org/wiki/OSM_Tasking_Manager)Learn How to Use the Tasking Manager(https://tasks.hotosm.org/learn)
Key Steps for Creating a Task:
A tool for collaborative mapping
Page 24
FIELD MAPPING (DATA COLLECTION)
There are a variety of tools to use for field mapping, including GPS and even paper-based methods. In the toolkit we focus on using smartphones. We prefer OpenDataKit, OpenMapKit, and KoBoCollect for data collection, and recommend Maps.me and OSMAnd for navigation.
Decide what data you plan to collect. What data do you need to solve or improve the problem you’re working on?Define the area for your field mapping. If applicable, divide it between mapping teams. Prepare materials for the field: reference map, GPS or mobile phone and mobile data collection tools, notepad and pen.Go to the target area and collect the data you need.Return to your computer and input the data into OSM. In the Field Data Collection process, we will go into more specific steps and details to consider for mapping fieldwork.
1.
2.3.
4.5.
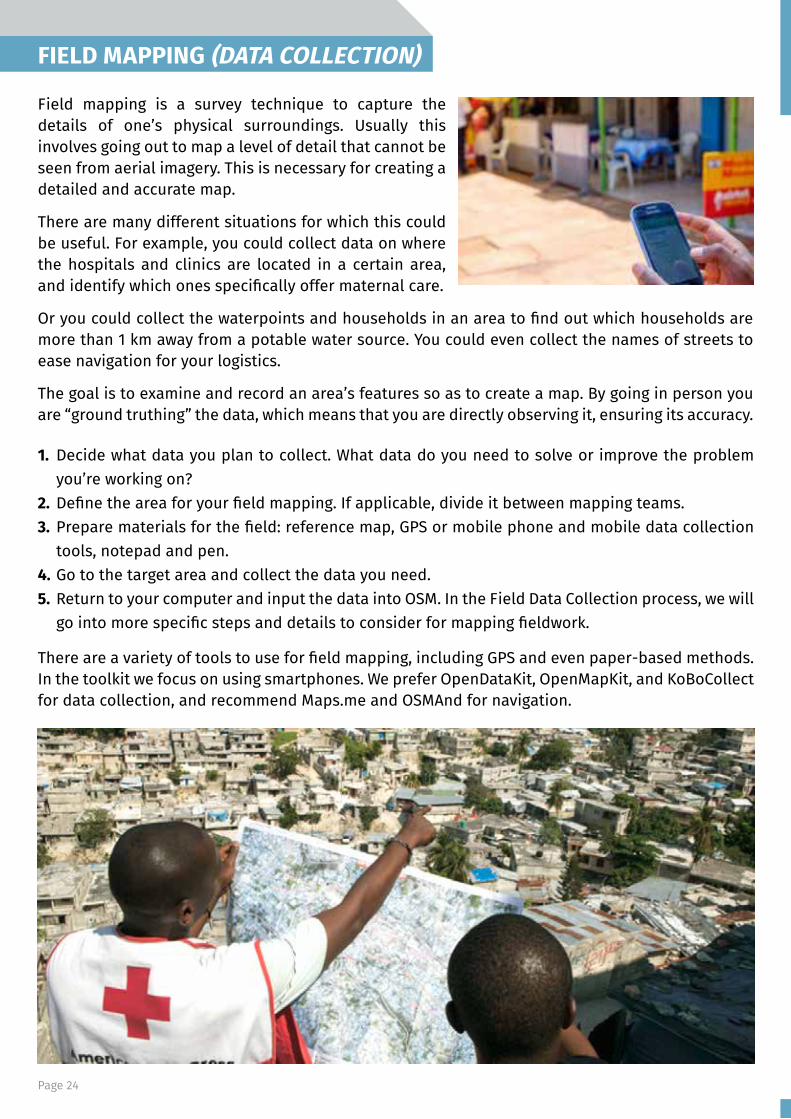
Field mapping is a survey technique to capture the details of one’s physical surroundings. Usually this involves going out to map a level of detail that cannot be seen from aerial imagery. This is necessary for creating a detailed and accurate map.
There are many different situations for which this could be useful. For example, you could collect data on where the hospitals and clinics are located in a certain area, and identify which ones specifically offer maternal care.
Or you could collect the waterpoints and households in an area to find out which households are more than 1 km away from a potable water source. You could even collect the names of streets to ease navigation for your logistics.
The goal is to examine and record an area’s features so as to create a map. By going in person you are “ground truthing” the data, which means that you are directly observing it, ensuring its accuracy.

Page 25
05OPEN DATA KITOPEN MAP KITKOBO COLLECT
Mobile tools for field data collection
Contextual Factors:
Key Steps to Setting up ODK:
Short Summaries:Open Data Kit (ODK) is a free an open-source set of tools which help organizations author, field, and manage mobile data collection solutions. ODK Collect is part of ODK and is an Android app that replaces paper forms used in survey-based data gathering. It supports a wide range of question and answer types, and is designed to work well without network connectivity.
OpenMapKit is an extension that launches directly from within ODK Collect when the OSM question type is enabled in a standard survey. It is what allows you to browse OSM features, and to create and edit OSM tags.
Finally, KoBoCollect is in almost all ways similar to ODK Collect, and is built on top of the ODK platform. Kobo also has prebuilt analysis tools and is another popular option.
ODK Collect can be used in almost any setting, it is very versatile. Once forms have been downloaded it does not depend on the internet until uploading.
1. Install the ODK Collect on your phone – it can be downloaded from the Google Play Store*(For OSM compatibility, install OpenMapKit from the Google Play Store)
2. Generally organizations first fill out a form and then upload it to a server.*One way to do this is by creating a form online with ODK Build, though you can
also build a form in Excel.
3. To download the form, open ODK on your phone and go to General Settings, then click Server.
4. Enter in your server information, return to the home screen and select Get Blank Form, then select your form.
5. In order to begin taking a survey select Fill Blank Form - now you’re ready to collect data!
Skills and Technology Needed:ComputerInternet ConnectionOSM AccountServer
For more details:OpenDataKit (https://opendatakit.org)ODK Guide (https://docs.opendatakit.org/collect-intro) ODK Build (https://build.opendatakit.org) Another Option for Building ODK Forms(http://xlsform.org/en) OpenMapKit (http://openmapkit.org)KoBo Collect (https://www.kobotoolbox.org)

Page 26
06FIELD DATACOLLECTION
1. Coordinate with the local administration of the area you will be mapping
This entails identifying and contacting partner organisations working locally in the area that you are planning to map.Contacting these can be done via email, however, a letter or document detailing your intent weighs much more.
2. Obtain authorization from district and other officials
It’s important to inform and get authorization from district officials. Write to the appropriate local official, copying relevant district-level authorities.Once you receive a letter of authorization, copy it to have on hand and distribute to higher-level authorities to make them aware of your project.
3. Prepare relevant field data collection tools and guides
To collect good data you need to employ a well-defined data model. A data model reflects the information you want to capture. After establishing a solid data model, it is important to create logical Field Data Collection Forms that capture the data you are looking for in the best way.
4. Recruit mappers
Mappers will in most cases be drawn from community members, refugees, students or partner organisation staff.
5. Train mappers
It is useful to create a training schedule. Usually two days are enough time to cover data collection and discuss the community’s needs. This is also an opportunity to select your field mappers.
There is no one way to collect data in the field and it will vary by context – but the following steps cover the essential steps you should take.
6. Find transportation This can also be an opportunity to match the refugee and host community together. In Uganda motorbike riders provide a much-needed element of local knowledge, complementing the actual field mappers. Work with mappers or local partners and stakeholders to recruit motorbike riders.
7. Field Mapping map guides (maps production)
Strategically organize and subdivide the area to be mapped.Using QGIS, prepare relevant guide maps that mappers will use in the field.
8. Field mapping – guide participants during data collection
Mappers should be well equipped with mobile phones having all the relevant tools and accessories to facilitate field mapping.Mappers move to the field with a mission order for their safety and comfort operating in these communities.Mapped data is sent to the server.
9. Field Data Cleaning and upload to OSM
Following the field data cleaning workflow, all collected data is cleaned and uploaded to OSM. Reviewing the data before upload ensures that the quality is good before it is shared.
10. Schedule follow-up at a later date
It is good to meet after field data collection activities to review the challenges faced in the field. This could take the form of a mapathon.
Your Field MappingPlaybook

Page 27
07 MAPS.ME &OSMAND
Key Steps for Maps.me:
1. First download Maps.me from the Google Play Store
2. Maps.me has maps for every country in the world. There are at least three different ways you can download these
Zoom in to the area you are interested in until a Download button appears. Tap the country/city name on the world map and then tap the download icon Find a map in the list of countries (Menu → Download Maps)
3. Now you have access to this map offline. To zoom in, use your fingers or double tap the screen. To see information about a feature simply tap its icon. If the map is upside down just tap the compass icon. To determine your current location, tap the geolocation button in the lower left corner (make sure location services are enabled on your device first)
4. To search for something on the map simply tap the search icon and then type the name into the search bar. You can also search by keyword or even by typing in the exact coordinates (Ex. 43.9775, 15.3854)
5. To create a route choose your destination then tap the route icon at the bottom of the screen. You can select either a pedestrian route or a car route and then select Start.
6. Perhaps one of the most useful features of Maps.me is the built-in map editor. You can add new places to the map or edit existing ones. In order to have these changes available to others you should open the app settings, go to Profile, and log in with your OSM account.
7. To add a new place to the map you can go to the menu and then press Add a place to the map. Select the correct location of the object and then press Done in the top right-hand corner. You can then fill in other details. These will then be automatically uploaded to OSM within a few hours.
Offline maps andnavigational tools
Short Summary:These are two open source mobile applications that can be used with iOS and Android devices that provide offline maps, especially useful for navigation. They get their data from OpenStreetMap. The beauty of both apps is that the maps work with no connectivity– all they need is your phone’s GPS.
Skills and Technology Needed:
Mobile phone
Internet Connection (for initial download)
OSM Account
Contextual Factors:In situations with low levels of internet these can be especially useful offline maps. The simple interface also means they are easy for anyone to learn and use. Because they are user-friendly they can be used for crowdsourced data collection, expanding humanitarian mapping beyond the staff of any project into the wider community.
Key Steps for OSMAnd:The app can also be downloaded from the Google Play Store. When opened it will determine your location and suggest a map to download. As with Maps.me, you can zoom in, search for points of interest, and use the GPS to find your location. One of the most useful features of OSMAnd is recording tracks. To enable this, go to the menu, then Maps & Resources, then Plugins at the bottom, make sure Trip recording is active. To start recording your tracks, press the GPX button in the top right corner.
For more details:Maps.me Support https://support.maps.me/hc/en-us
OSMAnd Help Pages http://osmand.net/help/HowToArticles.html

Page 28
08 MANAGING DATA
After collecting data, you’ll need to get the data from the devices. Sometimes, it works to simply collect and process data directly from the data collection devices. However, this does not scale well when you get more people collecting data, and also means your data is not backed up - if you lose the device, you can lose the data. Prior to data collection, it is important to have a data management strategy that is suited for your operations.
Server ManagementA server is a central repository that manages access to data in a physical (offline) or cloud (online) location. Servers can ease operations with higher numbers of data collectors and to reduce the risk of losing data. Using a data collection server allows for much better management of forms and deployments, collection and aggregation of responses, and can offer additional features for viewing, analysing and exporting data. Use of a server may be restricted by available resources (cost of a physical server) and/or internet connection (access to cloud server). The most used options are:
Server-less ManagementIf the use of a server is not available to you, it is still possible and crucial to store backups of data. In this case, data will need to be downloaded or otherwise shared with a central location, such as a laptop computer, and cloned to a secondary location such as a hard-drive or second computer. For more information about a server-less data management workflow, visit: https://github.com/hotosm/toolbox/wiki
Data Security
If collecting personally identifiable information (PII) or other sensitive data, especially when working with refugees, it is crucial to take additional steps for data security. All data collection and storage devices (i.e. mobile phones, laptops, servers) should be password protected to prevent unauthorized users from accessing data. Data should only be transferred across private and secure networks, and cleared from devices after data back-up.
POSM is a physical server that contains a set of OpenStreetMap tools, including OpenMapKit server. POSMs allow multiple users to connect and upload data from data collection devices to a central location without the need for internet access. This data can then be aggregated using the OMK Server and synced with OSM directly or downloaded for analysis and processing. More information about acquiring and using POSM can be found here:
http://posm.io/
An online application that allows users to build Kobo/ODK surveys as well as store, aggregate, and perform analysis of Kobo/ODK data. Several organizations offer hosted instances for humanitarian use, such as UN OCHA at
https://kobo.humanitarianresponse.info
ODK Aggregate is an online application (local options possible) that stores, aggregates, and allows users to perform basic analysis on ODK data. More information on ODK Aggregate can be found at:
https://docs.opendatakit.org/aggregate-intro/
OpenMapKit server / POSM
ODK Aggregate KoBo Toolbox
Organizing and Maintaining Data Processes

Page 29
QUALITY ASSURANCE (DATA CLEANING)
Quality assurance is the maintenance of a desired level of quality in a product. The higher quality your data is the more useful it is, so it is essential to manage the process along the way. OpenStreetMap is often more up-to-date and of a higher quality than other commercial maps, but this requires mappers to be actively cleaning the data.
In refugee contexts, having high quality data is even
For more details:https://wiki.openstreetmap.org/wiki/Quality_assurance
more important as it can mean the difference between being able to access a service or not. It is also extremely important when dealing with personally identifiable or sensitive information - as OpenStreetMap is publicly available, not all data that is collected may be appropriate for upload. This process can ensure that only data meant for OpenStreetMap is uploaded.
While validation and quality control can be and should be performed at all stages of mapping, the main objective is to catch any mistakes in the data before uploading it or using it for any maps. As there are many different possible workflows for data collection, there is no one way to perform validation and quality control. There are several tools that assist with this process following field data collection as well as tools for monitoring data after upload. These tools help validators find and fix common issues such as misspelled or improperly formatted place names and incorrect tag usage.
There are many tools to help you achieve better quality OSM data. Some report bugs or errors, and some allow you to spot inaccurate changes and edits. Here we will go into more detail on Java OpenStreetMap, a great tool for editing OSM data. We will also introduce OSMCha which can help team managers monitor uploaded data for quality and monitor progress of data cleaning.
One of the simplest ways to report errors is using the Notes feature on the OpenStreetMap website. Just press the “Add a note to the map” button, and then you can let other mappers know about any mistakes or missing information.

Page 30
09 JOSM
Short Summary:
Skills and Technology Needed:
JOSM (Java OpenStreetMap Editor) is an open source editor for OpenStreetMap data. JOSM allows you to create new data and edit existing data for OSM. To edit existing data in OSM, you will need to download data first with an internet connection. After downloading an area, users can work offline to edit data before re-uploading the data to OpenStreetMap.
While there are several ways to edit OpenStreetMap, JOSM allows users to work offline as well as make higher quantity and more detailed edits in a single sitting. While JOSM can be more intimidating to low-tech and new users, the program is best suited for field operations and areas where internet is unreliable.
We highly recommend that installation files for Java and JOSM are downloaded before operating in areas of low-internet accessibility if possible. These files can then be shared and installed offline.
As with iD editor, it is important to not to allow any information which could be potentially harmful to refugees be uploaded to OSM. For example, sensitive information about nationality, religion, or gender should not be uploaded into OSM.
ComputerInstallation files for JOSM & JavaInternet Connection (for download and upload)OSM AccountRecommended: computer mouse
1. Open your Internet browser, and go to the installation websites for Java and JOSM
Java - https://java.com/en/download/
JOSM - https://josm.openstreetmap.de/
2. Once download and installation is complete, open JOSM. You will need to connect JOSM to your OSM account to enable data uploads. To do so, access the preferences window by clicking the ‘Edit’ menu and selecting ‘Preferences’. Click the Connection Settings sub-menu, enter your OSM credentials (username and password) and select authenticate.
3. You can download data from OSM by clicking on the download button and selecting an area of interest.
4. You can add aerial imagery as a background (if your internet connection is strong enough) by clicking on the ‘Imagery’ menu and selecting an option such as “Bing”.
5. Just like in iD Editor, you can add points, lines, and areas using the add node tool . The difference is that these edits can be made while offline.
6. You can also use JOSM to edit GPS, field papers, or data collected in the field (i.e. ODK/OMK data) before uploading to OSM.
7. You should go through all data individually to check for spelling mistakes, incorrect tagging, and PII. To assist with the data cleaning process, you can use the validation tool, filters, and JOSM plug-ins including todo list.
8. When you’re done, you can either save your work for later upload or for review, or immediately upload changes to OSM by clicking on the upload button.
9. Recommended: Have an experienced JOSM user serve as data quality manager, reviewing all data prior to upload.
For more details:LearnOSM - Getting Started with JOSM:https://learnosm.org/en/josm/start-josm/
JOSM Wiki Guide:https://wiki.openstreetmap.org/wiki/JOSM/Guide
Key Steps for Setting up JOSM:
A feature-richeditor
Contextual Factors:

Page 31
10 OSMCha
Short Summary:
Contextual Factors:
Skills and Technology Needed:
OSMCha, or the OpenStreetMap Changeset Analyzer, is a tool designed to review uploads and changes to OSM data, largely to prevent bad edits and vandalism to map data. This tool allows users to filter by username, location, dates of upload, and other metadata features. OSMCha is useful for monitoring the progress of data cleaning and upload teams.
While errors and bad data should be caught prior to uploading to OSM, these mistakes happen. OSMCha allows managers to check the contributions of others for any missed errors and to provide feedback on their data quality checks. This feedback is especially important for mappers new to using JOSM so that mistakes are caught early and mappers can improve their quality assurance skills. OSMCha provides an additional opportunity to ensure no sensitive information is wrongly uploaded to OSM.
Computer
Internet Connection
1. Open your Internet browser, and go tohttps://osmcha.mapbox.com/
2. Click on ‘Filters’ in the left-hand menu.
3. Set a filter specific to your mapping project to sort data. Common filters for monitoring include setting:
a. Datesb. Comment c. Locationd. OSM Username
4. Click ‘Apply’.
5. OSM changes (or changesets) meet your filter requirements will appear in the left-hand menu.
6. Click on any changeset to view it on the map as well as learn details such as data changes (added, modified, removed), user information, and any flags, or suspected errors, associated with the upload.
For more details:OSMCha Guide - https://osmcha.mapbox.com/about
Mapbox: Using OSMCha for Inspecting Changes in OSMhttps://github.com/mapbox/mapping/wiki/Using-OSMCha-for-inspecting-changes-in-OpenStreetMap
Key Steps for Viewing Changesets:
Visualizing andanalyzing edits

Page 32
MAP CREATION (DATA USE AND ANALYSIS)
Geospatial information collected or gathered in previous processes can help create maps that assist with resource management, operations, decision-making, advocacy, and communication. Examples of maps that might be useful include locations of services in a district, known WaSH facilities in a refugee camp, and average distance to educational facilities.
As a participatory mapping process, it is crucial that final products are presented to and accessible by the community that participated in and facilitated the mapping. One of the best ways to do this is to present communities with maps in community centers, clinics, or other areas that are useful for refugees and host community members.
There are several tools that can turn geospatial information into final map products, both static and dynamic. In most cases, geographic information system (GIS) programs are the most robust tool for analyzing, managing, displaying, and creating maps. In this toolkit, we’ll cover downloading data from OpenStreetMap using the HOT Export Tool, Humanitarian Data Exchange, and QGIS Plug-ins; QGIS for analyzing data and creating static maps; and Overpass Turbo for creating and displaying dynamic maps.
Static Maps
Dynamic Maps
Traditional maps that are either printed or displayed digitally as image files. These maps can show specific topics (i.e. educational facilities, WaSH) and geographic focuses (i.e. camp, district). Static maps are best for displaying no more than a few topics, information that has temporal stability, and for users with low-access to technology and internet.
Interactive, digital maps allow users able to pan and zoom as well as change what information is displayed depending on preferences and functionality. Dynamic maps are best for displaying several types of information, information that is best viewed across different scales, and most importantly, for users with access to technology and strong internet.

Page 33
11 DOWNLOADING DATA
Different waysto get the data
Contextual Factors:
Key Steps for HDX:
Key Steps for QGIS Plug-insand QuickOSM:
Short Summaries:The Humanitarian Data Exchange (HDX) is a platform designed for humanitarian organizations and actors to easily share and use humanitarian data for analysis. The growing platform, managed by UN OCHA, contains datasets for over 200 countries and territories. Humanitarian OpenStreetMap data, such as buildings and roads, are regularly exported and uploaded to the database.
QGIS is an open source GIS program discussed in Section 13, and has several ways to download and use OpenStreetMap data in data analysis and map creation. Several plug-ins, such as QuickOSM, allow users to download OSM data by area and by specific tags or attributions.
The Export Tool is an online-based tool for downloading OSM data for use offline. It allows you to create customized extracts of up-to-date OSM data in various file formats. See Section 12 for more information about the Export Tool.
The correct tool to use depends on what data you need and how you plan on using it. HDX allows users to download data outside of OSM data and non-geospatial data. The HOT Export Tool is useful for downloading specific data, such as matching a data model using YAML, and allows users to download OSM data for use in various geospatial applications. QuickOSM and other QGIS plug-ins are best for users working in QGIS with more general needs for OSM data.
1. Open your internet browser and go to
https://data.humdata.org/
2. Start by searching for data around a key term or location (i.e. refugee, WaSH, Bangladesh) or click on ‘Data’ to browse through all existing datasets.
3. Each dataset will have a title, uploading organization (i.e UNHCR, Red Cross), upload date, dataset date, description, and available file types.
4. Once you’ve selected a dataset that you would like to download, click on the appropriate file type and begin the download process.
1. First, if you are unfamiliar with QGIS, read Section 13 - QGIS.
2. Open QGIS on your computer.
3. To download the QGIS Plug-ins, you will need internet access.
4. Click on the ‘Plug-ins’ menu and select ‘Manage and Install Plug-ins’.
5. Search for ‘QuickOSM’, click on the option in the menu and select ‘Install’.
6. Once installed, to use the Quick OSM Plugin, go to the ‘Vector' menu, open 'Quick OSM', select 'Dock’, and click 'Quick Query'.
7. Enter a key and value, such as ‘place’ and ‘town’ respectively.
8. Select an extent - either the extent of a map layer or extent of the map canvas.
9. Click ‘Run Query’.
Note: if the query is unsuccessful and does not download data, it is likely that either there is an issue with the key/value or the extent is too large for the download capacity.
Skills and Technology Needed:ComputerInternet ConnectionOSM Account (HOT Export Tool only)

Page 34
EXPORTTOOL12
5.
6.
7.
8.
For more details:Export Tool Guidehttps://export.hotosm.org/en/v3/learnLearnOSMhttp://learnosm.org/en/osm-data/geofabrik-and-hot-export
1.
2.
3.
Key Steps for Downloading Data:
Go to the Export Tool (https://export.hotosm.org). Start by logging in using your OSM username and password, by clicking the red “Log In” button in the top right-hand corner. Then you will need to confirm your email address.
After logging in, click “Create” or “Start Exporting” to begin working on your first export.
On the map to the right define your Area of Interest (AOI). You can do this by selecting the area you wish to export data from. You can search, draw a box or polygon around your AOI, or simply export everything you are currently viewing. You can also upload a GeoJSON file by pressing Import.
The size of an export is limited by the amount of data in your area of interest, too many features will cause our server to fail.
4. On the left-hand side will be a number of tabs, use these to create the parameters of your export.
Describe Fill out a name and description of the project
Format Choose your GIS file format. Shapefile is the default option though Geopackage is becoming more commonly used and has certain advantages
Data Select which features you want to query and include in your download package
Summary Download your files by clicking “Create Export” - your export may take some time to run depending on the size of your area and how many feature types are in your query.
Download your file by clicking on the highlighted link, it should be the name of your project and the format you decided. This appears as a .zip in your computer’s downloads folder. (It will also automatically send a link to the file in your email.)
Import – Browse to your computer’s downloads folder, right click and “Cut” the .zip file. Browse to the location where you want to keep your files and paste. Right click .zip file and extract the file.
Using data
If you downloaded shapefiles, common applications to work with the data are JOSM (which needs a plugin to import shapefiles) or
QGIS, which you then import via the Add Vector button. You should be able to view exported data within the map. See QGIS tool for more details.
Now you have your data!
Short Summary: The Export Tool is an online-based tool for downloading OSM data for use offline. It allows you to create customized extracts of up-to-date OSM data in various file formats.
How to download the data
Tools and Technology Needed:ComputerInternet ConnectionOSM Account

Page 35
13 QGIS
Short Summary:
Contextual Factors:
QGIS (or Quantum GIS) is a free and open source geographic information system (GIS) program. GIS programs allow users to display, manage, and analyze geospatial information on the computer, and create map products. Data that can be used in GIS includes aerial imagery, GPS data, and spatial datasets.
QGIS allows for the transformation of data collected in the field into maps that can assist with field operations, resource distribution and management, and communications to name a few applications. As a free and open source program, QGIS allows organizations and users to create map products and analyze geospatial data without the heavy costs of proprietary programs.
Using: Any GIS file type can be used in QGIS (i.e. shapefiles, geoTIFF, geoJSON). Files can also be downloaded from the Humanitarian Data Exchange and OpenStreetMap using the HOT Export Tool or the QuickOSM plug-in in QGIS.
Analyzing: Users can use QGIS to analyze data for particular needs such as finding water points within walking distance of camps or the density of educational facilities in target areas. Many plug-ins have been created to help users assist with analyzing geospatial data such as InaSAFE, which helps users assess, plan, and mitigate for disasters using GIS.
Producing: Maps and atlases can be produced using the QGIS Print Composer. Atlases allow for a large number of maps to be generated for areas of interest, such as districts, wards, and other administrative areas, with the same style and layout. An example of an atlas created in QGIS for the purpose of assessing flood risk can be found at: http://ramanihuria.org/data/
Downloading: QGIS can be downloaded and installed offline using a previously downloaded installer or directly from the QGIS website (https://www.qgis.org). It is highly recommended to download software directly from the QGIS website whenever possible. This ensures that you have the most up-to-date version of the program. The QGIS file is larger than 300MB and may take a long time to download, depending on your internet connection.
Plug-ins are tools created by QGIS users that extend the functionality of QGIS. These are downloaded from an online repository.
Using the data to analyze & create maps
Tools and Technology Needed:Computer with
Windows, Mac, or Linux operating systemSufficient free disk space (approx 10GB) and administrator rights to install software
Geospatial data (see Section 12 - Downloading Data)Recommended: computer mouse
For more details:QGIS Training Manual: https://docs.qgis.org/2.18/en/docs/training_manual/ QGIS Tutorials:https://www.qgistutorials.com/en/docs/learning_resources.htmland-hot-export

Page 36
14 OVERPASSTURBO
Short Summary:
Contextual Factors:
Overpass Turbo is an online application that allows users to query, download, and visualize OpenStreetMap interactively. Some data can be difficult to represent in a static map due to distance, type of data, or the need to compare data at various scales. Overpass Turbo solves this issue by allowing users to query data and create a map that can be panned and zoomed to better communicate a dynamic context.
As Overpass Turbo requires strong internet connection to run queries and visualize data, it is less intended for field operations and better suited for presenting data and progress to partners, donors, and other stakeholders in situations that allow for internet connection.
Querying andVisualizing
Tools and Technology Needed:ComputerInternet Connection
For more details:Overpass Turbo Wiki: https://wiki.openstreetmap.org/wiki/Overpass_turbo Overpass Query Language Wiki: https://wiki.openstreetmap.org/wiki/Overpass_API/Overpass_QL
MapCSS Wiki or styling: https://wiki.openstreetmap.org/wiki/Overpass_turbo/MapCSS
Key Steps for Overpass Turbo:1. Open your Internet browser, and go to http://overpass-turbo.eu/
2. On the right-hand side is the map view. Locate your area of interest by zooming and panning or search for the area in the map search bar. This will be the bounding box for your query.
3. On the left-hand side is the query builder. You can build a query manually using the query guides below, or use the Wizard tool in the top menu.
4. When your query is built, click ‘Run’ in the top menu. This process will take time dependent on the amount of features in your query result.
5. This query can then be exported as data files, maps, or as a standalone query. Click on ‘Export’ in the top menu. To download the query data, select ‘Data’ and the file type. To export as a map, select ‘Map’ and then select either a .png (image file) or interactive map.
6. The interactive map option creates an unique url that can be shared with other users to view and interact with the query that you generated, as well as embed into websites and other applications.
Another great free tool for visualizing is uMap, which lets you create online interactive maps with OpenStreetMap layers within a minute! https://umap.openstreetmap.fr/en