toward a holistic sustainable intensification strategy in ......toward a holistic sustainable...
TRANSCRIPT

Toward a Holistic Sustainable Intensification Strategy in
Sub-Saharan Africa
T.S. Jayne, Michigan State University
Panelist remarksInvited session on “Sustainable Intensification in Africa: How to
make it happen”Global Food Security Conference,
3 December 2017Cape Town, South Africa
1

Objectives:
1. To explore options for sustainably raising inorganic fertilizer use
2. To consider the role of input subsidy programs (ISPs) in an effective / comprehensive program of sustainable productivity growth?
• What would such a holistic program look like?
• How to achieve it?2

Three sections:
1. To understand the socio-political context of FSPs
• Why has technical analysis had such limited impact?
2. Evidence on “smart” subsidy programs
3. Given that FSPs will continue, how to raise their benefits?
3

Section 1: socio-political context
1. How did we get from 1995 to 2015?
• over $1.05 billion per year in 7 countries alone?
4

Expenditures of Input Subsidy Programs
Country Annual Program Cost (USD million)
% of Ag Budget
Malawi 152 to 275 47 to 71%
Tanzania 92 to 135 39 to 46%
Zambia 101 to 135 21 to 40%
Senegal 36 to 42 26 to 31%
Ghana 53 to 112 20 to 31%
Nigeria 108 to 190?? ?? (officially 26%)
Kenya 22 to 81 9 to 26%
5

I. How did we get to where we are now in 2015?
1. Budget constraint relaxed
• HIPC / shift from conditionality to budget support
2. Multi-party democracies / populist ag policies
3. “Malawi miracle”
• NYT David and Goliath story
• Effective PR by the advocates
4. Rise in global food prices since 2007
5. Shift in WB position – support for “smart” subsidy programs
• WB and other basket donors financed many African countries with the biggest FSPs
6

Perceptions of FSPs among international researchers
1. There is a role for ISPs in most SSA countries: true or false?
7

1. There is a role for ISPs in most SSA countries:
true: 69%
8

2. Do you feel that ISPs in most SSA countries need:
A: no changes to design
B: small tweaks
C: major reforms/improvements
D: should be discontinued
9

2. Do you feel that ISPs in most SSA countries need:
A: no changes to design: 0%
B: small tweaks: 4%
C: major reforms/improvements: 81%
D: should be discontinued: 15%
10

3. What should be the primary rationale for input subsidy programs:
A: Increasing food supplies / food self-sufficiency
B: Poverty reduction
C: Dynamic economic growth
D: Others
11

3. What should be the primary rationale for input subsidy programs:
A: Increasing food supplies / self-sufficiency: 27%
B: Poverty reduction: 12%
C: Dynamic economic growth: 38%
D: Other: 23%
12
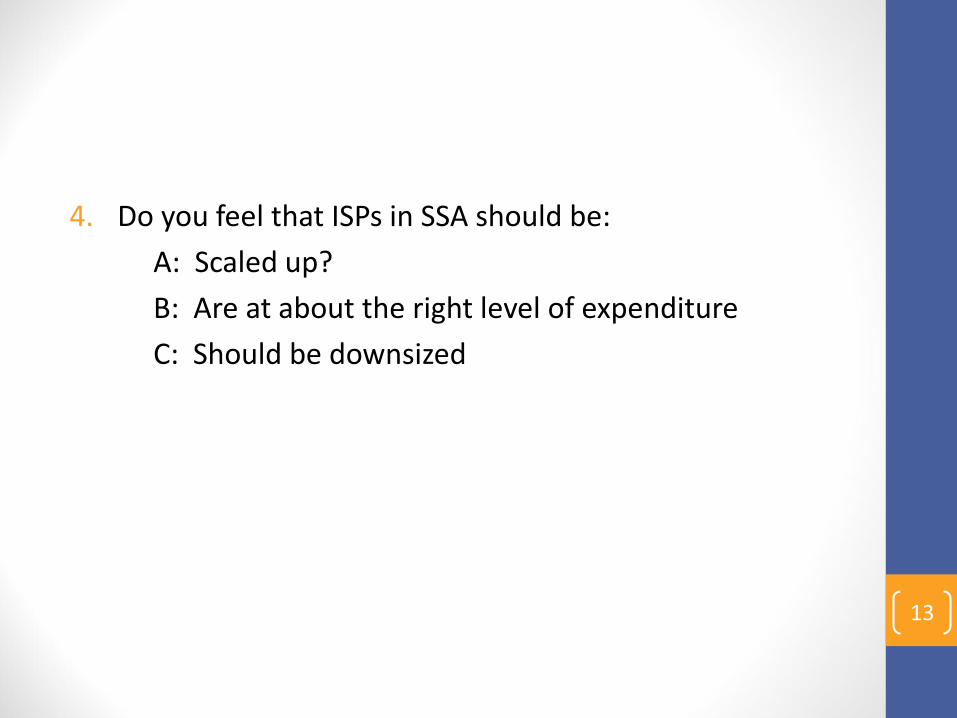
4. Do you feel that ISPs in SSA should be:
A: Scaled up?
B: Are at about the right level of expenditure
C: Should be downsized
13

4. Do you feel that ISPs in SSA should be:
A: Scaled up? 8%
B: Are at about the right level of expenditure: 0%
C: Should be downsized: 92%
14

Summary of evidence:
Conclusion #1:
• Highly variable achievement of targeting criteria: often not superior to random targeting

Summary of evidence:
Conclusion #2:
• Crowding out of commercial distribution:
• Of the total quantity of fertilizers distributed through FSPs, the increase in national fertilizer was between 40-70% of this
• In two cases, Nigeria and areas of Zambia where private firms did not operate, evidence of “crowding in”

• FSPs will contribute more to additional fertilizer use if targeted:
1. To households that are not already purchasing fertilizer and using at relatively high intensity• Relatively poor households
• Female-headed households
2. where private sector presence is low
3. where APfert > Pfert for most farmers17

Summary of evidence:
Conclusion #3:
• Significant effects on food production

Summary of evidence:
Conclusion #4:
• Small / transitory effects on hh incomes
• Effects tend to decay after farmers graduate

Summary of evidence:
Conclusion #5:
• Little effect on food price levels
• Malawi
• Zambia
• Nigeria

Summary of evidence:
1. Highly variable achievement of targeting criteria: often not superior to random targeting
2. Crowding out -- a problem
3. Significant effects on food production
4. Small / transitory effects on hhincomes
5. Little effect on food prices

Section 3: What to do?
• FSPs are likely to continue – how can they be made more effective.
• Targeting differently
22

Maize/fertilizer price ratios, Kenya, 1985-2014
23
.2
.3
.4
.5
.6
.7
1985 1990 1995 2000 2005 2010
ratio, 1kg maize wholesale Eldoret / 1kg DAP, Nakuru
ratio, 1kg maize wholesale, Kitale / 1kg DAP, Nakuru
pri
ce
ra
tio
, 1
kg
wh
ole
sa
le m
aiz
e /
1kg
wh
ole
sa
le D
AP

Maize/fertilizer price ratios, Zambia, 1994-2014
24
.15
.20
.25
.30
.35
.40
.45
.50
.55
1996 2000 2004 2008 2012
maize/D compound, Choma maize/D compound, Chipata
maize/urea, Choma maize/urea, Choma
pri
ce
ra
tio
of
1kg
ma
ize
wh
ole
sa
le /
1kg
fe
rtiliz
er

Five conclusions:
1. Population growth leading to land scarcity smaller farm sizes for most rural people
2. Fallows slowly being eliminated in areas of high population density
3. Continuous cultivation with limited nutrient recycling “soil mining”
25

26

Five conclusions:
1. Population growth leading to land scarcity smaller farm sizes for most rural people
2. Fallows slowly being eliminated in areas of high population density
3. Continuous cultivation with limited nutrient recycling leading to “soil mining”
4. Soil degradation
27

• Soil and land degradation a huge concern
Major conclusion of Montpellier Panel report
Extent of already damaged land:
65% of arable land
30% of grazing land
20% of forests
Burden disproportionately carried by smallholders
28

Five conclusions
1. Population growth leading to land scarcity smaller farm sizes for most rural people
2. Fallows slowly being eliminated in areas of high population density
3. Continuous cultivation with limited nutrient recycling “soil mining”
4. Soil degradation
5. Evidence of low and declining crop response rates to inorganic fertilizer application 29

Review of maize-fertilizer response rates on farmer-managed fields
Study country Agronomic response rate (kgs maize per kg N)
Morris et al (2007) W/E/S Africa 10-14
Sheahan et al (2013) Kenya 14-21
Marenya and Barrett (2009) Kenya 17.6
Liverpool-Tasie (2015) Nigeria 8.0
Burke (2012) Zambia 9.6
Snapp et al (2013) Malawi 7.1 to 11.0
Holden and Lunduka (2011) Malawi 11.3
Pan and Christiaensen (2012) Tanzania 8.5 to 25.5
Minten et al (2013) Ethiopia 11.7
30

Highly variable crop response rates – even among farmers in same areas in same seasons
31

Variation in farmers’ efficiency of fertilizer use on maize, Agroecological Zone IIa, Zambia
0
1
2
3
4
5
0 5 10 15 20 25 30 35
Marginal product (kgs / kg nitrogen)
Perc
en
t o
f fa
rms
Note: Zone IIa is a relatively high-potential zone suitable for intensive maize production;
mean national NUE = 9.6 kgs maize per kg nitrogen (Burke, 2012).

African farming systems in densely settled areas commonly display 4 forms of unsustainable land intensification
1. Soil mining
2. Inadequate recycling of organic matter loss of SOC
3. Demise of fallows
4. Limited profitability of using fertilizer at full market prices 33
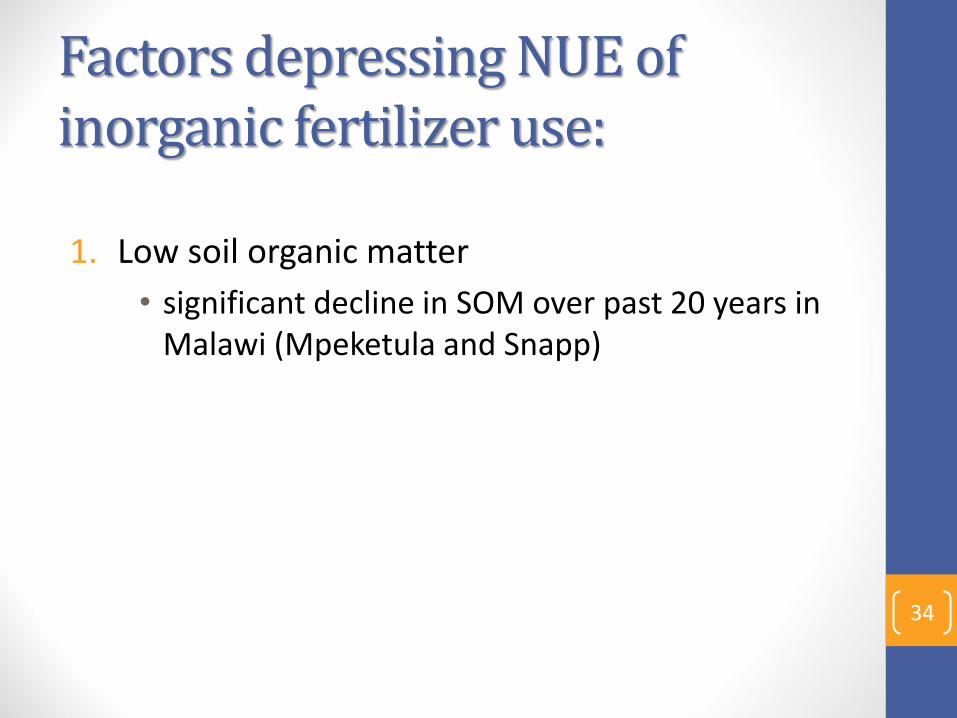
Factors depressing NUE of inorganic fertilizer use:
1. Low soil organic matter
• significant decline in SOM over past 20 years in Malawi (Mpeketula and Snapp)
34

Fertilizer response rates in degraded areas
35
Source: Marenya & Barrett 2009
Plot carbon content (%)
Maize yields as a function of plot soil carbon content
Kg/ha

Fertilizer response rates in degraded areas
36
Source: Marenya & Barrett 2009
Plot carbon content (%)
Estimated marginal value product of nitrogen fertilizer conditional on plot soil carbon content
Ksh/kg N

Factors depressing NUE of inorganic fertilizer use:
1. Low soil organic matter
• significant decline in SOM over past 20 years in Malawi (Mpeketula and Snapp)
2. Acidification
37

38
From Larson and Oldham, Mississippi State University Extension Service, 2008.
Source: Burke, 2012

39Photo courtesy of Dingi Banda, Lusaka Province, Zambia

Factors depressing NUE of inorganic fertilizer use:
1. Low soil organic matter
• significant decline in SOM over past 20 years in Malawi (Mpeketula and Snapp)
2. Acidification
3. Micro-nutrient deficiencies
40

Everyone agrees that inorganic fertilizer use must go up – why isn’t it happening?
41
Population growth
Land pressures / incentives to
intensify
Reduced fallows / increased
fertilizer use
Deficiencies in SOC and
micronutrients / acidification
Low crop response rates
to N
dkdkdk
m

Everyone agrees that inorganic fertilizer use must go up – why isn’t it happening?
42
Population growth
Land pressures / incentives to
intensify
Reduced fallows / increased
fertilizer use
Deficiencies in SOC and
micronutrients / acidification
Low crop response rates
to N
dkdkdk
m
Depressed profitability of fertilizer use

Cumulative distribution of average product of fertilizer used in Zambia (2004,2008)
Avera
ge p
rodu
ct
of
fert
ilizer
(maiz
e k
g/k
g)
profitable return
43Source: Burke, 2012

Factors affecting N use efficiency
1. Soil organic carbon
2. Acidification (pH) – mainly affects basal
3. Micronutrients
4. Soil moisture – N response on irrigated > rainfed fields
5. Timing of fertilizer application
6. Timely and sufficient weeding
7. Rotation of crops on a given plot
8. Contours / ridging to prevent erosion on sloped fields
• Fixation with N
• ISPs need to be part of a more holistic approach so that N can get sufficiently high crop response

Focus on making inputs profitable effective demand
Profitable use (main drivers):
output price
input prices
crop response rates

Elements of a holistic strategy:
1. R&D (national ag research systems)
2. Extension programs / soil testing
3. Programs to help farmers restore soil quality
4. Conservation agricultural practices
5. Physical infrastructure
6. Reducing costs in input supply chains
7. More appropriate fertilizer use recommendations
46

Oft-asked policy question:
• Given that ISPs will continue, what concrete guidance can be identified to improve their effectiveness?
• We identify 3 proposals: 1. Holistic approach that regards ISP as one component of
an integrated sustainable intensification campaign
2. Target poor farmers to achieve more equitable development impacts
3. Redouble political will to reduce corruption 47

Proposal 1: Raise public investment in agronomic research and extension programs to enable farmers to use fertilizer more efficiently

Proposal 2: Reconsider targeting guidelines to achieve more equitable development impacts
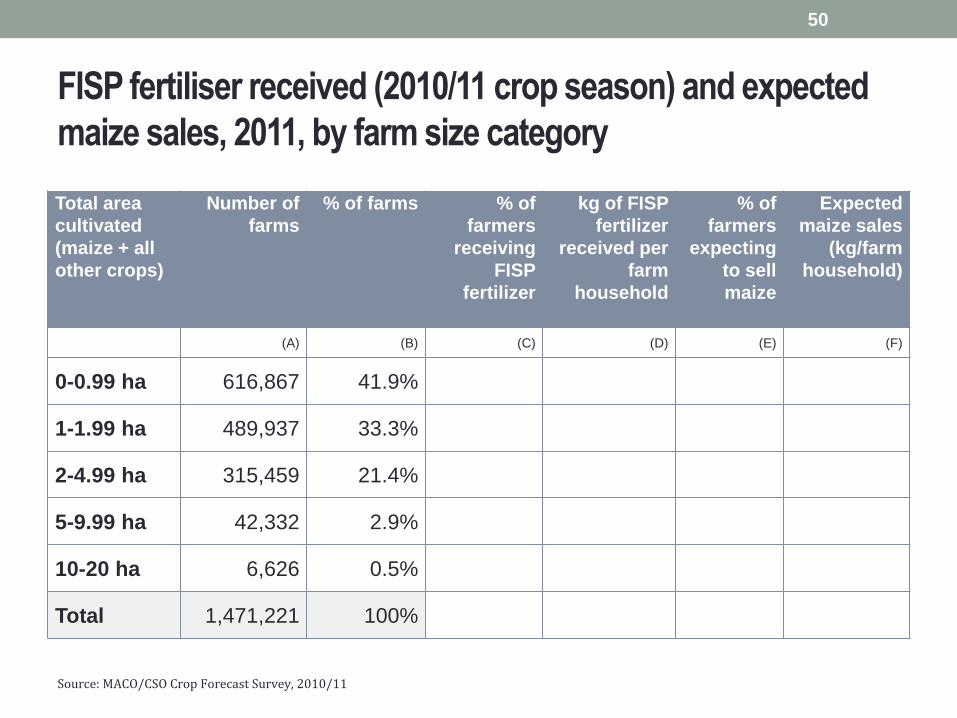
FISP fertiliser received (2010/11 crop season) and expected
maize sales, 2011, by farm size category
50
Total area
cultivated
(maize + all
other crops)
Number of
farms
% of farms % of
farmers
receiving
FISP
fertilizer
kg of FISP
fertilizer
received per
farm
household
% of
farmers
expecting
to sell
maize
Expected
maize sales
(kg/farm
household)
(A) (B) (C) (D) (E) (F)
0-0.99 ha 616,867 41.9%
1-1.99 ha 489,937 33.3%
2-4.99 ha 315,459 21.4%
5-9.99 ha 42,332 2.9%
10-20 ha 6,626 0.5%
Total 1,471,221 100%
Source: MACO/CSO Crop Forecast Survey, 2010/11

FISP fertiliser received (2010/11 crop season) and expected
maize sales, 2011, by farm size category
51
Total area
cultivated
(maize + all
other crops)
Number of
farms
% of farms % of
farmers
receiving
FISP
fertilizer
kg of FISP
fertilizer
received per
farm
household
% of
farmers
expecting
to sell
maize
Expected
maize sales
(kg/farm
household)
(A) (B) (C) (D) (E) (F)
0-0.99 ha 616,867 41.9% 14.3%
1-1.99 ha 489,937 33.3% 30.6%
2-4.99 ha 315,459 21.4% 45.1%
5-9.99 ha 42,332 2.9% 58.5%
10-20 ha 6,626 0.5% 52.6%
Total 1,471,221 100% 28.6%
Source: MACO/CSO Crop Forecast Survey, 2010/11

FISP fertiliser received (2010/11 crop season) and expected
maize sales, 2011, by farm size category
52
Total area
cultivated
(maize + all
other crops)
Number of
farms
% of farms % of
farmers
receiving
FISP
fertilizer
kg of FISP
fertilizer
received per
farm
household
% of
farmers
expecting
to sell
maize
Expected
maize sales
(kg/farm
household)
(A) (B) (C) (D) (E) (F)
0-0.99 ha 616,867 41.9% 14.3% 24.1
1-1.99 ha 489,937 33.3% 30.6% 69.3
2-4.99 ha 315,459 21.4% 45.1% 139.7
5-9.99 ha 42,332 2.9% 58.5% 309.7
10-20 ha 6,626 0.5% 52.6% 345.6
Total 1,471,221 100% 28.6% 77.1
Source: MACO/CSO Crop Forecast Survey, 2010/11

FISP fertiliser received (2010/11 crop season) and expected
maize sales, 2011, by farm size category
53
Total area
cultivated
(maize + all
other crops)
Number of
farms
% of farms % of
farmers
receiving
FISP
fertilizer
kg of FISP
fertilizer
received per
farm
household
% of
farmers
expecting
to sell
maize
Expected
maize sales
(kg/farm
household)
(A) (B) (C) (D) (E) (F)
0-0.99 ha 616,867 41.9% 14.3% 24.1
1-1.99 ha 489,937 33.3% 30.6% 69.3
2-4.99 ha 315,459 21.4% 45.1% 139.7
5-9.99 ha 42,332 2.9% 58.5% 309.7
10-20 ha 6,626 0.5% 52.6% 345.6
Total 1,471,221 100% 28.6% 77.1
Source: MACO/CSO Crop Forecast Survey, 2010/11

Proposal 3: greater political will for ensuring that the subsidies go to the intended beneficiaries
• Currently 1/3 of state resources for ISPs are diverted (Malawi and Zambia), more in other cases (pre-2011 Nigeria)

Ranking of Alternative Investments: Meta-Study Evidence from Asia and Africa
The Economist IFPRI study
Policies
Infrastructure
investment
Agricultural R&D
Agricultural
extension services
Credit subsidies
Fertilizer subsidies
Irrigation

Ranking with respect to agricultural growth: Evidence from Asia
The Economist IFPRI
Policies 1
Infrastructure
investment3 1
Agricultural R&D 2 2
Agricultural
extension services5
Credit subsidies 7 3
Fertilizer subsidies 6 4
Irrigation 4 5

Ranking with respect to poverty reduction: Evidence from Asia
The Economist IFPRI
Policies 1
Infrastructure
investment2 1
Agricultural R&D 3 2
Agricultural
extension services4 3
Credit subsidies 7 4
Fertilizer subsidies 5 6
Irrigation 5 5

Conclusions
1. ISPs are a powerful tool to quickly raise food production….
2. But if they account for too large a share of agricultural spending, they can crowd out other public investments required for sustainable development
3. Spending a large share of the ag budget on ISPs may not be the most effective way to promote the welfare of it citizens, but it is a highly demonstrable way to do so. 58

Conclusions
4. ISPs would be more effective if adequate resources were allocated to complementary public investments
5. More balanced public expenditure patterns could more effectively promote national policy objectives
6. There are concrete steps for improving ISP effectiveness – related to
• governance and political commitment to target effectively and reduce diversion
• More holistic approach to sustainable intensification
59

III. Why are policy makers not more interested in the research evidence?
1. Mistrust of foreign technical assistance
• USA / EU countries heavily subsidize…why shouldn’t we?
2. Local policy analysts can be accused of being “unpatriotic”
• Self-censorship?60

Bottom line for this symposium:
• Limited incentive so far for governments to agree to governance reforms
• Very different ag policy environment between 1995 and 2015
• Where will the impetus for governance reform come from?
1. Well educated local polity
2. Promote mainstream debate
3. Strengthen African policy analysis units / civil society
61

Indaba Agricultural Policy Research Institute 62Thank you
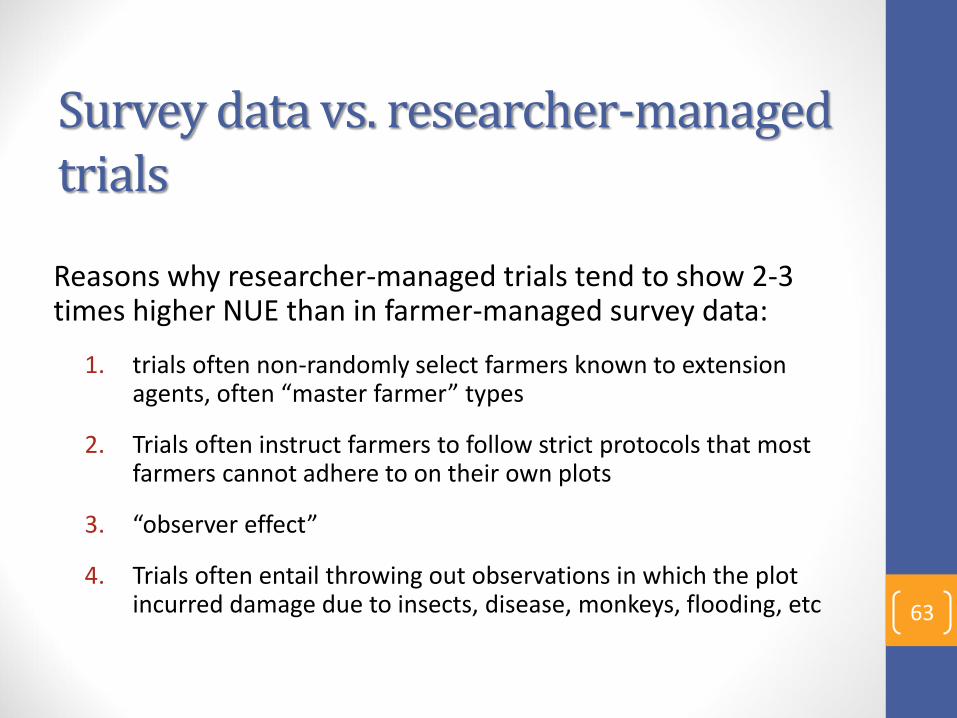
Survey data vs. researcher-managed trials
Reasons why researcher-managed trials tend to show 2-3 times higher NUE than in farmer-managed survey data:
1. trials often non-randomly select farmers known to extension agents, often “master farmer” types
2. Trials often instruct farmers to follow strict protocols that most farmers cannot adhere to on their own plots
3. “observer effect”
4. Trials often entail throwing out observations in which the plot incurred damage due to insects, disease, monkeys, flooding, etc 63