towards an open ecosystem model for smart mobility ... · towards an open ecosystem model for smart...
TRANSCRIPT

Towards an open ecosystem model for smart mobility services The case of Finland
ISBN 978-951-38-8408-6 (URL: http://www.vttresearch.com/impact/publications) ISSN-L 2242-1211 ISSN 2242-122X (Online) http://urn.fi/URN:ISBN:978-951-38-8408-6
VT
T T
EC
HN
OL
OG
Y 2
55
Tow
ard
s an
op
en
ec
osyste
m m
od
el fo
r...
•VISIONS•S
CIE
NC
E•T
ECHNOLOGY•R
ES
EA
RC
HHIGHLIGHTS
255
Towards an open ecosystem model for smart mobility services The case of Finland Thomas Casey | Ville Valovirta

VTT TECHNOLOGY 255
Towards an open ecosystem model for smart mobility services The case of Finland
Thomas Casey & Ville Valovirta
ISBN 978-951-38-8408-6 (URL: http://www.vttresearch.com/impact/publications)
VTT Technology 255
ISSN-L 2242-1211 ISSN 2242-122X (Online) http://urn.fi/URN:ISBN:978-951-38-8408-6
Copyright © VTT 2016
JULKAISIJA – UTGIVARE – PUBLISHER
Teknologian tutkimuskeskus VTT Oy PL 1000 (Tekniikantie 4 A, Espoo) 02044 VTT Puh. 020 722 111, faksi 020 722 7001
Teknologiska forskningscentralen VTT Ab PB 1000 (Teknikvägen 4 A, Esbo) FI-02044 VTT Tfn +358 20 722 111, telefax +358 20 722 7001
VTT Technical Research Centre of Finland Ltd P.O. Box 1000 (Tekniikantie 4 A, Espoo) FI-02044 VTT, Finland Tel. +358 20 722 111, fax +358 20 722 7001

3
Preface
This research study has been conducted within the context of the Ministry of Transport and Communica-
tions’ Traffic Lab program. The study has received funding from The Ministry of Transport and Communi-
cations, Finnish Transport Agency, the Finnish Transport Safety Agency and Tekes – the Finnish Funding
Agency for Innovation.

4
Contents
Preface ...................................................................................................................... 3
1. Introduction ........................................................................................................ 5
2. Value system modelling frameworks ............................................................... 8
2.1 Four value system states.............................................................................. 8 2.2 Example value system transitions ................................................................ 9
3. Ecosystem model big picture.......................................................................... 12
3.1 Centralized and decentralized structures ................................................... 12 3.2 Historical states .......................................................................................... 15 3.3 Possible future states ................................................................................. 17
4. Centralized structures ..................................................................................... 20
4.1 Basic infrastructure and vehicle services ................................................... 20 4.1.1 Public road infrastructure ................................................................ 20 4.1.2 Basic vehicle services ..................................................................... 22
4.2 Public transportation ................................................................................... 24 4.2.1 Long distance and local public transportation ................................. 24 4.2.2 Transportation for special groups and taxis..................................... 28
5. Decentralized structures ................................................................................. 32
5.1 Private infrastructure and traffic .................................................................. 32 5.1.1 Private infrastructure ....................................................................... 32 5.1.2 Private traffic ................................................................................... 33
5.2 Vehicle and end-user services ................................................................... 35 5.2.1 Vehicle services .............................................................................. 35 5.2.2 End-user services and MaaS .......................................................... 36
6. Systemic transition towards smart mobility .................................................. 38
6.1 Sociotechnical system transition framework ............................................... 38 6.2 System transition in mobility ....................................................................... 40
7. Ecosystem dynamics ....................................................................................... 43
7.1 Dynamic model ........................................................................................... 43 7.2 Synthesized ecosystem model ................................................................... 45
8. Policy recommendations ................................................................................. 46
8.1 First phase of Traffic Lab ............................................................................ 46 8.2 Policy recommendations for the next phases ............................................. 47
9. Summary ........................................................................................................... 49
References.............................................................................................................. 50
5
1. Introduction
The markets around transport and mobility are undergoing significant changes. One of the central drivers
for these changes is the deployment of Information and Communication Technologies (ICT) throughout the
transportation system. Infrastructure, vehicles and end-user handsets are becoming increasingly intelligent
and instrumented with sensors and broadband connectivity. This in turn enables a wide range of smart
mobility services, e.g. from usage-based vehicle insurance to multimodal trip planning and to seamless
door-to-door mobility services.
Overall, mobility plays a significant role in society. It is typically the second largest cost item for house-
holds and also a significant cost for enterprises. The annual market for mobility services in Finland alone is
valued at roughly 50 billion euros1 of which households spend annually roughly 16 billion and companies
33 billion euros. The public sector (both the central government and municipalities) subsidizes mobility
services (e.g. public transportation and transportation for special groups such as patients) with 1 billion
euros. Furthermore, on an annual level the government invests 1.5 billion euros and cities and municipali-
ties 1.4 billion euros in transportation infrastructure.
Many ICT driven trends are reshaping the current structures around the mobility market (i.e. related in-
frastructure, vehicles and services). Broadband connectivity and satellite position technologies enable real-
time smart mobility services, and also new business models that could also reshape the way many manda-
tory services – such as those related to vehicle insurance and vehicle taxation (or road charging) – could
be organized. Such trends are also challenging the public sector to come up with new ways to organize
services and regulate the market.
Furthermore, the Internet is fuelling the emergence of services such as Uber that work on a sharing
economy principle. Statistics show that the utilization rates of vehicles are currently rather low, and ride-
sharing services such as Uber (also Lyft and Zipcar) could enable a better utilization of this vehicle capaci-
ty. The market is also becoming a global one with e.g. Uber expanding aggressively on an international
level (also to Finland)2.
More broadly, we are also witnessing an overall ICT fuelled evolution trend towards service-based busi-
ness models, i.e. from owning products to buying services. This is also expected to shape the mobility
sector with the emergence of concepts like Mobility-as-a-Service (MaaS) (Heikkilä, 2014), which envisions
a seamless door-to-door mobility service for end-users combining several modes of transportation (e.g.
local and long-distance buses, trams, taxis, demand-responsive public transportation and shared private
vehicles) and offering it as an integrated simple package for the end-user. The evolution towards such a
new paradigm is driven by many trends such as urbanization and by the fact that young people are not
acquiring driver’s licences as often as before; they i.e. do not necessarily want to own a vehicle but would
instead like to have access to a better supply of transport services.
Evolution towards horizontal and open ICT systems
Overall, it seems clear that ICT will be a key force shaping the transport and mobility system. The applica-
tion of ICT has the potential to increase the effectiveness of the transport systems and can disrupt many of
1 Marko Forsblom, Liikennelabra 2.0 – Building Blocks for MaaS, 8th of December, 2014. http://its-
finland.fi/images/itsfinland/tapahtumat/heureka08122014/Trafficlab_08122014_Marko_Forsblom_LVM.pdf. All web-sites in this report have been accessed 19th of January, 2016.
2 Uber, for example, has been valued at more than $18 billion (http://www.wsj.com/articles/uber-gets-uber-valuation-of-
18-2-billion-1402073876).

6
the existing operating and business models and restructure how revenue is distributed. ICT can also intro-
duce new services and provide means to change the transport system itself.
However, at the moment smart mobility services are rather fragmented and work in isolated silos. Frag-
mentation is observable both in government driven Intelligent Transport Systems (ITS) and market driven
services such as the in-vehicle infotainment systems provided by vehicle manufacturers. A key issue in
future development is how these isolated systems will become interconnected and in general become
more open.
A challenge for the future success and scalability of these services therefore is how the network of ac-
tors providing the services, i.e. the value system, can evolve from a closed vertically integrated state to an
open horizontal state. Two possible paths can be recognized:
Firstly, a more centralized path where centrally controlled public services are gradually liberalized
following possibly a similar evolutionary path to what took place in the evolution of 1st and 2nd
generation mobile communications, and
Secondly, a more decentralized path where fragmented and isolated solutions are loosely coupled
similar to the evolution of the Internet.
Finnish market background for smart mobility
Finland has been at the forefront in developing horizontal and open service architectures for smart mobili-
ty. A notable example is the so-called multi-service-model concept (Heino et al., 2013) that has emerged
from the ITS Finland community and led to several development projects such as Pastori, SUNTIO and
PANDA. On a European level the multi-service model is being further developed in the MOBiNET project.
The Finnish ITS community has also played a key role in promoting the MaaS concept.
Many public sector actors have also been actively promoting and developing open interfaces for smart
mobility services. For example, the Finnish Transport Agency (FTA) has created open interfaces to its
Digitraffic real-time traffic information service, the Finnish Transport Safety Agency (Trafi) has been open-
ing data related to the central vehicle registry, and Helsinki Region Transport has opened developer APIs
to its journey planner. Furthermore, the ITS Factory has been actively promoting the creation of public
transportation services in the Tampere region area.
More recently, the Ministry of Transport and Communications launched a new development program
Traffic Lab3, which aims to catalyse the emergence of a market for smart mobility services and which also
provides a context for this research. In the first phase of the initiative, the goal has been to test usage-
based road taxation (as suggested by the Ollila report [Ollila et al., 2013]), and at the same time catalyse
the emergence of new smart mobility services. In the next phases the scope will be widened with e.g. the
development of MaaS playing an important role.
Scope and structure of this report
The purpose of this study is to model how a transition from a closed model to an open one could occur for
smart mobility services in Finland4. Data for the study is gathered from different public sources (prior publi-
cations, market reports, internet websites etc.) and with semi-structured expert interviews of public and
private sector actors.
This research applies existing modelling frameworks and draws examples from other industries, namely
the emergence of GSM based mobile networks and the Internet, where the former has followed a more
centralized path and the latter a more decentralized path (discussed in detail in Sections 2, 3, 4 and 5).
Research on how new technologies become adopted and diffused, and how entire sociotechnical systems
transition from one system to another is also reviewed (Section 6). Furthermore, the ecosystem dynamics
are described using dedicated modelling frameworks (Section 7).
3 http://trafficlab.fi/
4 As a disclaimer, it should be stated that value system modeling can be conducted in many ways, and that alternative
interpretations exist. The models presented here are in part the interpretations of the authors and subject to change and further development. For many cases the goal is to represent value system configurations and scenarios (that can sometimes be extreme representations) as a basis for discussion. Furthermore, the modeling conducted here is not exhaustive and some relevant issues might be overlooked.

7
Overall, this report analyses the current and possible future value system structure of different mobility
and transport related services, especially as it relates to the utilization of ICT5. In the first part of the study
the value system around mobility services is roughly divided into two categories:
1. Centralized services with a strong public interest, i.e. where the public sector and regulated ser-
vices play an important role, and
2. Decentralized services operated by private actors with a larger degree of freedom to operate.
The centralized services with a strong public interest cover e.g. basic transportation infrastructure (e.g.
roads, public parking spaces etc.) and the actors governing these (e.g. Finnish Transport Agency (FTA),
The Centres for Economic Development, Transport and the Environment (ELY Centres) and municipali-
ties). The category also covers basic vehicle services such as vehicle taxation, insurance, registration,
inspection and permits, and the involved actors (e.g. ELY Centres, Trafi [Finnish Transport Safety Agency]
and the related companies providing the services). Furthermore, another centralized service with a strong
public interest is public transportation both in terms of long distance (buses and trains) and local transport
(buses, trains, trams and taxis) and the related actors regulating and operating the services.
Decentralized services refer to services operated by private actors such as households and enterprises
operating their vehicles and mobility service providers operating services such as vehicle maintenance,
driver assistance, navigation and journey planners etc.
The structure of the report is as follows: In Section 2 we introduce the value system modelling frame-
work applied. In Section 3 we go through the big picture related to the value system around transportation
in terms of what the current structure is and how the transition from closed to open model could occur both
with a more centralized and decentralized path. In Section 4 we analyse in more detail the existing and
possible value system structure of centralized services with a strong public interest. In Section 5 we ana-
lyse the existing and possible value system structure of more decentralized services operated by private
actors. In Section 6 we analyse the possible system level transitions more broadly using a framework for
systemic transitions. In Section 7 we create a dynamic model and gather the results into a synthesized
value system model. In Section 8 we give a short overview of the first phase of the Traffic Lab program
and give some recommendations for the next phase. Finally, in Section 9 we draw conclusions.
5 In terms of scope, the report focuses on the question of how ICT is shaping the Finnish mobility market. The time
frame of the study is medium (with e.g. automated vehicles out of the scope). Focus is also mainly on the utilization of motor vehicles (aspects from railways also included, but e.g. cycling, aviation and marine are out of scope, as are the specific characteristics of electric vehicles (e.g. charging networks). Furthermore, the main focus is on personnel mobility (henkilöliikenne), i.e. the logistics is mostly out of scope although it is discussed briefly.

8
2. Value system modelling frameworks
In this study we apply different modelling frameworks to depict how smart mobility services are evolving
from closed to more open structures: first a framework used to model the dynamics of value systems from
a techno-economic point of view (Ali-Vehmas & Casey, 2012; Casey, 2013) and to which we give a short
introduction in the following.
2.1 Four value system states
The value system modelling framework (Ali-Vehmas & Casey, 2012) describes how a given value system
can be configured to four different dynamic models as shown in Figure 1. First, there is a centralized and
closed model where the value system is dominated by one actor with vertically integrated closed technical
components, henceforth the monopoly model. In this state one actor controls the tools of service produc-
tion (e.g. information systems, vehicle dispatching and payment systems in the case of mobility) in the
value system. The value system is centrally optimized and thus has many rules and is slow to adapt to
changes coming from outside.
Second, there is a centralized and open model with few tightly coupled market actors and technical
components, henceforth the GSM model. Such a subsystem features a limited set of market actors co-
operating and competing (e.g. oligopoly competition between large operators). Harmonized and interoper-
able technologies are utilized, which in turn means that users can rather easily switch between service
providers (e.g. ITS operators) and platforms and thus induce some competition between the market actors.
Figure 1. Four value system states (adapted from Ali-Vehmas & Casey, 2012; Casey, 2013).
Fixed point
attractor
No
attractor
Strange
attractorLimit cycle
attractor
No
competition
Some
competition
Fierce competition
High
competition
Market
share
Market
share
Market
shareMarket
share
Actors in order of
market share
Actors in order of
market shareActors in order of
market share
Actors in order of
market share
Open
Closed
Dec
en
traliz
edC
en
tralized
GSM model
Monopoly model Fragmented model
Internet model

9
The third model is a decentralized and open model with many loosely coupled market actors and technical
components, henceforth the Internet model. Tools of service production and distribution are democratized
and used by all for all, corresponding to the so-called shared economy approach. It should be noted that
many of the current companies taking the shared economy approach, such as Uber, are utilizing the open
Internet but in fact operate closed platforms that do not permit end-users to switch between platforms and
e.g. take their data with them (e.g. end-users cannot take their usage data from Uber and use it as input in
other mobility services). With the internet model there is a great heterogeneity of actors, technologies and
services with plenty of local innovation and competition. However, actors also collaborate and services and
technologies are made interoperable so that valuable services in high demand are able to flexibly scale
bottom-up. Switching costs are low and end-users can freely switch and roam between services.
Fourth, there is a decentralized and closed model with many isolated market actors and proprietary in-
compatible technical systems, henceforth the fragmented model. Here, the actors are fiercely competing
against each other and no (or very limited) co-ordination exists. Isolation and intense competition lead to
the erosion of resources where nobody is able to scale services bottom-up.
Figure 2 presents a more detailed version of the modelling framework with which the value system can
be described with a more modular structure and with different parts of the system having different states
(i.e. the overall value system can be a combination of more centralized and decentralized elements). Fur-
thermore, the value system can be described using three layers: actors operating in the value system (e.g.
public transportation authority, bus operator etc.), the roles that the actors can take (e.g. operating a vehi-
cle or a service) and technical components related to the roles (e.g. back-end servers running the services
or on-board modules in buses and private vehicles).
Figure 2. Detailed value system modelling framework (adapted from Ali-Vehmas & Casey, 2012).
As depicted in Figure 2, business and technical interfaces can also be described with different strengths,
i.e. whether closed or open interfaces are used. The open interfaces can be divided into tightly coupled
interfaces corresponding to the GSM and loosely coupled interfaces corresponding to the Internet model.
2.2 Example value system transitions
Next, we describe two example transitions that have occurred during the evolution of GSM based mobile
networks and the Internet. In this study we examine how the evolution of Smart Mobility services in Finland
could follow similar development paths. Figure 3 shows a summary of these two transitions. It should,
however, be noted that other transitions are also possible. For example, many services that are delivered
over the Internet follow a ‘winner-takes-all’ dynamic where e.g. a market can begin in a very fragmented
Actor
Role
Actor
Role
Technical
component
Actor
Role
Actor
Role
Technical
component
Technical
component
Technical
component
Fixed point
attractor
No
attractor
Strange
attractorLimit cycle
attractor
No
competition
Some
competition
Fierce competition
High
competition
Market
share
Market
share
Market
shareMarket
share
Actors in order of
market share
Actors in order of
market shareActors in order of
market share
Actors in order of
market share
Technical interface
Business interface
Fixed Loosely coupled
Monopoly
model
GSM
model
Internet
model
Fragmented
model
Tightly coupled

10
state but eventually lead to a situation where one dominant actor emerges (e.g. Google in search, Face-
book in social media, i.e. a transition from the fragmented model to a monopoly model). For example Uber,
with its gradually emerging global dominance, is showing preliminary signs of becoming a closed de-facto
platform for ride sharing.
Example transition: From monopoly to GSM model
As it relates to the transition from a centralized and closed model to a centralized and open model, the
transition that has occurred in mobile communications can be used as an example (Ali-Vehmas & Casey,
2012), as shown on the left side of Figure 3. Originally, mobile communication services were provided with
a monopoly model where the government was in control of infrastructure and services (similarly to e.g.
municipalities in public transportation in their dedicated areas in Finland). End-users and other actors (e.g.
suppliers) remained in a passive role and each country had a dedicated system for mobile communications
that was not interoperable with other countries (similar to the current situation where there is very limited
interoperability e.g. in public transportation systems between municipalities).
In the Nordic countries and Europe, along with the deregulation of telecommunications markets and the
introduction of digital mobile communications, a new model was introduced first with the NMT system for
Nordic countries and later on a pan-European level with GSM, where governments granted radio spectrum
licences to market-driven GSM mobile operators. Governments were still able to regulate the markets with
radio spectrum licences, and overall the GSM model made it possible for operators to provide basic ser-
vices (e.g. mobile voice, SMS) with guaranteed quality of service (e.g. safety critical applications such as
emergency calls are also possible). In the new model, standardized interfaces were used which meant that
mobile operators were able to procure multi-vendor solutions, mobile operator networks were interopera-
ble, and end-users were able to switch between operators (i.e. switch the SIM card) and roam between
countries using the same handset. This modular structure has also enabled business models for separate
mobile service providers and mobile virtual network operators that do not have their own infrastructure (but
that mobile network operators do)6.
Figure 3. GSM mobile networks and the Internet as examples of transitions from a closed to an open model.
6 Furthermore, on a national level, e.g. mobile number portability and electronic SIM-based identification are examples
of collaboration based on the GSM model.
Open
Closed
Dec
en
traliz
edC
en
tra
lize
d
Monopoly model
• Government in control of infrastructure
and services
• Users and other actors (e.g. suppliers) in
a passive role
• Dedicated system for each country
GSM model
• Government regulated services (e.g.
with radio spectrum licences)
• Basic services (mobile voice, SMS) with
guaranteed quality of service
• Users can choose between few
operators and device vendors
• Multi-vendor solutions are possible
• Standardized systems across countries
• Interoperability between networks
Internet model
• A loosely coupled network of
decentralized actors
• Wide range of heterogeneous actors,
services and technologies
• Users and providers can pick and mix
devices and services
• Services scale on a global level
• Based on light standards
• Quality of service not guaranteed
Fragmented model
• Isolated local networks and platforms
• Devices, networks and services
integrated
• Services don’t scale but remain local
”GSM Mobile revolution” ”Internet revolution”
11
As it relates to the transportation system, a similar change has already partly occurred e.g. in private vehi-
cle inspections where vehicle owners can choose between a few companies providing vehicle inspection
services and thus induce competition between them.
Example transition: From fragmented to Internet model
As it relates to the transition from a decentralized and closed model to a decentralized and open model,
the transition that has occurred in the evolution of the Internet can be used as an example as shown on
the right side of Figure 3. Roughly put, before the globally interconnected Internet network, computers
were not connected to each other, packet switched networks and services over those networks worked
largely with a vertically integrated, fragmented model consisting of isolated local networks and platforms
where devices, networks and services were vertically integrated, no modularity existed, and services did
not scale but remained local.
The Internet brought about a new paradigm and created a loosely coupled network of decentralized ac-
tors. The new model led to a wide range of heterogeneous interconnected actors, services and technolo-
gies where users and providers were able to pick and mix devices and services in a modular manner.
Networks were connected on an international level and services were created using light weight standards
(e.g. HTML, TCP/IP) with a ‘narrow waist’ principle ensuring only minimum interoperability. Subsequently,
services developed over the network were able to scale on a global level7. On the other hand, the light-
weight standards mean that the model works with a best effort principle and that the quality of service
cannot be guaranteed. Therefore, the Internet model is not suitable for critical applications in all cases, e.g.
related to safety-critical operations.
7 A notable national level collaboration around the Internet model is the Finnish Communication and Internet Exchange
(Ficix) association, a non-profit organisation with currently 28 members, running the largest Internet exchange point (IXP) in Finland.

12
3. Ecosystem model big picture
Before going deeper into the details of the individual transport and mobility services and how ICT is shap-
ing them, we take an overall look at the transport system in its current state in Finland. Significant changes
to transportation can be envisioned (Linturi & Kuittinen, 2014). As discussed earlier, the Finnish market for
mobility services has been valued at 50 billion euros8. The Finnish ITS market, on the other hand, has
been estimated at 300 million euros (Leviäkangas et al., 2012), meaning that there is plenty of growth
potential for ITS and smart mobility services.
3.1 Centralized and decentralized structures
By applying the value system modelling framework introduced above, the current value system around
mobility services can be roughly divided into two categories (depicted in more detail in Figure 4):
1. Centralized services with a strong public interest, i.e. where public sector and legislation play an
important role and
2. Decentralized services operated by private actors with a larger degree of freedom to operate.
Figure 4. Centralized (public) and decentralized (private) activities related to the transportation system.
The division depicted in Figure 4 is also used to structure the analysis in Sections 4 and 5.
8 Marko Forsblom, Liikennelabra 2.0 – Building Blocks for MaaS, 8th of December, 2014. (http://its-
finland.fi/images/itsfinland/tapahtumat/heureka08122014/Trafficlab_08122014_Marko_Forsblom_LVM.pdf). All of the figures presented in this section related to the size of the market are based on this presentation and complementary information from the Ministry of Transport and Communications.
Centralized
Basic Infrastructure and vehicle services
Public road infrastructure
Ownership,
financing
Governance, planning
Construction, operation,
maintenance
Basic vehicle services
Road charging, vehicle
inspections
Traffic insurance
Public
transportation
Basic public transportation (buses etc.)
Long distance
Local
Other
Transportation for special groups
Taxis
Decentralized
Private infrastructure
and traffic
Private infrastructure
Private roads
Private parking spaces
Private traffic
Households
Enterprises
Vehicle and end-user services
Vehicle services
Maintenance, towing
Driver coaching, driving diary
Services by vehicle
manufacturers
End-user services
Journey planners, pedestrian navigation
Developer APIs

13
Centralized structures
Many of the current transportation services can be seen as being centralized around key public sector
actors responsible for infrastructure and services and also for regulation. Public road infrastructure and
activities related to its ownership, financing, governance, planning, construction, operation and mainte-
nance form an important part of the transportation system and are still rather tightly controlled by the public
sector. It has been estimated that the government spends roughly 1.5 billion euros and municipalities
roughly 1.4 billion euros on building and maintaining road infrastructure. Also some basic vehicle services
e.g. related to registration, taxes (and road charging), vehicle inspections and insurance have a rather
centralized structure and are strongly governed by legislation.
In addition to this, public transportation is also largely centrally planned e.g. in terms of local public
transportation routes and timetables and also as it relates to licences given to long distance buses and
taxis. The government and municipalities also organize and subsidize dedicated public transportation for
special groups (e.g. the elderly, people with disabilities, students and healthcare patients). Both the gov-
ernment and municipalities spend an estimated 1 billion euros in subsidies for public transportation. The
application of ICT technologies coupled with new legislation could gradually change these structures and
shape the transportation system towards a more open form that could follow the GSM model.
These centrally provided transportation services are typically ones with a strong public goods nature,
leading to restrictions on how well markets could deliver them. Public goods are goods which are indivisi-
ble and non-excludable, that is, their use cannot be effectively excluded from use and their use by one
user does not diminish the possibility of others from using it. Markets have traditionally been considered
failing in provision of these public goods services, which has led to centralised and monopoly-like provision
models. The currently available ICT together with modern management and accounting methods could
provide opportunities to overcome the traditional market failures by introducing more effective means of
divisibility and excludability.
Decentralized structures
On the other hand, a major part of the transportation system can also be seen as being decentralized, i.e.
controlled and operated largely by private actors (i.e. households and enterprises). Overall, companies and
households make up most of the total mobility market in Finland. Companies spend roughly 33 billion
euros on mobility services, with two thirds going to logistics and one third to personnel transport. House-
holds, on the other hand, spend roughly 16 billion euros on various forms of mobility.
A major part of relevant infrastructure is private, e.g. private roads, yards and parking facilities. Also
most of the actual traffic is operated by private companies and households9 with very limited regulation as
to how and where they can move.
Furthermore, a wide variety of services are available for drivers and vehicle owners such as vehicle
sales, rental, maintenance, towing, driver coaching, driver diary, navigation and dedicated infotainment
systems provided by vehicle manufacturers. Additionally, various services are available also for the end-
users (i.e. passengers) such as journey planners, pedestrian navigation and car sharing. Some actors
(such as Helsinki Region Transport (HRT)) have been active in opening Application Programming Interfac-
es (API) for developers to develop new end-user services (e.g. different journey planners). Many of these
services, however, work in isolation (e.g. are limited to a single city) where the application of open ICT
technologies and interfaces could help the isolated actors interconnect their systems and create networks
in a bottom-up manner following the Internet model.
9 For example, in 2014 in Finland there were roughly 3 200 000 passenger cars (out of which roughly 10 500 were
licence based, i.e. taxis), 410 000 vans (roughly 6 600 with licences), 140 000 trucks (roughly 41 000 with licences) and 16 400 buses (roughly 13 000 with licences) (http://www.trafi.fi/tietopalvelut/tilastot/tieliikenne).

14
Ecosystem currently locked into closed solutions
In summary, when analysing the current situation using the value system modelling framework, roughly put
it can be argued that currently the markets around ITS and smart mobility services are mostly locked on
one hand,
1. In a centralized and closed monopoly model where the public sector actors have tight control of the
systems (as depicted in the lower left corner of Figure 5), and on the other hand
2. In a decentralized and closed model where small actors are operating and developing fragmented
services without interoperability (as depicted in the lower right corner of Figure 5).
Figure 5. Current value system state around smart mobility services and possible value system transitions following the GSM and Internet models.
At the same time, evolution towards a more open model can be seen similar to what occurred in the more
centralised GSM transition and the more decentralized Internet transition. As it relates to smart mobility
services, and the transportation system in general, there are already examples following a more open,
market driven approach. Vehicle insurance, vehicle inspection, bus operation, and road construction and
maintenance can, for example, already be seen as following a centralized and open model resulting from
deregulation, market liberalization and decoupling of production activities from service provision (the so-
called purchaser-provider model). Furthermore, the opening of APIs, e.g. to journey planners, at least
partly, follows a decentralized and open model. These examples are discussed in greater detail in the
following sections where more detailed value system modelling is conducted.
Open
Closed
Decen
traliz
edC
en
tralized
Smart Mobility services with Monopoly
model
• Services: Public sector central role
providing services
• Vehicles: Vehicle (e.g. bus) fleets
controlled by public actors
• Infrastructure: Government and
municipality controlled infrastructure
Smart Mobility services with GSM model
• Services: Basic mobility services with
end-user choice provided by private
actors and regulated by the public sector
• Vehicles: Interoperable vehicle (e.g.
bus) fleets providing basic services
regulated by the public sector
• Infrastructure: Privately operated
infrastructure licenced by the public
sector for a given period of time
Smart Mobility services with Internet model
• Services: A loosely coupled network of
heterogeneous actors, services and
technologies
• Vehicles: Shared vehicles (car sharing,
ride sharing)
• Infrastructure: Shared infrastructure
(e.g. parking spaces)
Smart Mobility services with fragmented
model
• Services: Isolated services and
devices (vehicles manufacturers,
aftermarket devices, fleet management
systems)
• Vehicles: Isolated households and
enterprises
• Infrastructure: Isolated private
infrastructure (e.g. parking spaces)
Current
state
Possible
state
Possible
state
Current
stateMarkets around ITS and
Smart Mobility services
currently locked into closed
vertically integrated solutions

15
3.2 Historical states
As depicted earlier, the historical structure of smart mobility services and the transportation system in
general can be characterized as being a combination of a monopoly and a fragmented model. Figure 6
shows the state using the following three layers:
1. Services (e.g. vehicle services for vehicle owners and drivers, and mobility services for end-users
(i.e. passengers) including supplementary information services such as journey planning, reserva-
tions and ticketing etc.),
2. Vehicles (e.g. buses, taxis and private vehicles), and
3. Infrastructure (e.g. roads, streets, yards and parking spaces).
Figure 6 depicts how, roughly put, end-users currently have access to two types of transportation and
mobility services, i.e. ones that are organized around a monopoly model and a fragmented model. When
services are organized with a monopoly model one actor plays a central role in organizing and providing
access to a service. For example, local public transportation authorities (PTAs), such as Helsinki Region
Transport (HRT), are responsible for planning and procuring of public transportation in their areas as de-
fined in the Law for Public Transport. They also typically control key information systems such as ticketing,
timetables and journey planners. The Finnish Taxi Owners Federation (Taksiliitto) and Linja-autoliitto (the
association for bus companies) and their related organizations (such as local dispatch centres for taxis and
Matkahuolto for long distance buses) have traditionally had a key role in their service provisioning. Licenc-
es for taxis and long distance buses are granted by The Centres for Economic Development, Transport
and the Environment (ELY Centres). Private vehicles and related basic services are governed by the Finn-
ish Transport Safety Agency (Trafi).
As it relates to infrastructure, the Finnish Transport Agency (FTA) is responsible for planning, construc-
tion and maintenance of the national road network and related information services. Similarly, municipali-
ties are responsible for streets and related information services in their dedicated areas.
Although it can be argued that some parts of the transport system should continue to be operated with a
centralized and closed model, it can also be argued that especially given the increasing access to infor-
mation, in many cases resources are not optimally allocated without a more market driven approach where
end-users can make choices and are able to switch between service providers and stimulate competi-
tion10
.
On the other hand, as it relates to private services, drivers of vehicles and end-users are often locked
into dedicated islands. For example, households typically use vehicles mostly for themselves and do not
provide transportation services for others. Furthermore, most private parking spaces are used only by the
party that owns it and information systems that would make these available are not widely used.
For many private actors the corresponding information systems are also vertically integrated (e.g.
telematics solutions for vehicle services, dedicated in-vehicle infotainment systems provided by vehicle
manufacturers, or companies deploying integrated Enterprise Resource Planning (ERP) systems), leading
to a lock-in to dedicated solutions. This leads to a situation where end-users cannot access many of the
services and resources (e.g. parking spaces, vehicles, services) outside of their ‘island’ because they are
locked into isolated solutions.
10
It should be noted that Figure 6 represents a rather extreme view of the historical state, and that market-driven ap-proaches have been adopted e.g. in the procurement of local public transportation from bus companies and by using private contractors for road construction and maintenance (although here central public actors are still making the choices, not end-users). Another example is vehicle inspection, which is operated by market actors.

16
Figure 6. Rough depiction of the current state of the value system.
Infrastructure
(e.g. roads,
streets, yards,
and parking
spaces)
Vehicles
(busses, taxis
and private
vehicles)
Services
(e.g. journey
planning,
dispatching,
reservations and
ticketing, vehicle
services etc.)
Enterprises, households
Ownership and
governance of private
infrastructure (e.g.
parking spaces)
FTA,ELYs,municipalities
Public road
infrastructure
ownership and
governance
Enterprises, households
Operation of private
vehicles
Trafi, ELYs, PTAs
Licenses for buses
and taxis, governance
of private vehicles
Private service providers
Provisioning of Smart
Mobility services
Local PTAs, Unions
Public transportation
service provisioning
Fixed point
attractor
No
attractor
Strange
attractorLimit cycle
attractor
No
competition
Some
competition
Fierce competition
High
competition
Market
share
Market
share
Market
shareMarket
share
Actors in order of
market share
Actors in order of
market shareActors in order of
market share
Actors in order of
market share
Monopoly
model
Fragmented
model
End-users

17
3.3 Possible future states
The value system around ITS and Smart mobility services has already now taken steps towards more
open structures (with e.g. private bus companies operating local public transportation routes and private
construction companies being used for road construction and maintenance), but could in the future evolve
towards even more open structures and end-user choice. The services that still mostly follow a centralized
and closed monopoly model could evolve towards a centralized and open GSM model where the public
sector could still remain in control and regulate the private actors in a similar manner to what is done cur-
rently with mobile network operators. On the other hand, activities following the decentralized and closed,
i.e. fragmented, model could evolve towards more networked and open structures where end-users could
more easily gain access to different private services. Figure 7 gives an overall depiction of how the differ-
ent parts of the value system could be organized in the future state.
Towards the GSM model
In the future, a major part of the services provided earlier by a centralized public actor could be provided
by competing companies regulated by the public sector. The public sector would still remain in control and
could regulate the market actors and ensure that service quality is high enough, that open interfaces are
used and that competition is sufficient among the market actors. This could lead to well-functioning oligop-
oly markets where standardized, open interfaces are used where the service providers could build interop-
erable services, procure multi-vendor solutions and leverage economies of scale. Furthermore, in such
markets end-users could switch between service providers, thus inducing competition, and also roam
between cities.
Such a shift has already partly happened, e.g. with long distance buses where companies like Onni-
bus.com have challenged the centralized model and stimulated competition. At the same time there is a
threat that competition can lead to a situation where transportation services are not universally available
(e.g. in rural areas), meaning that appropriate regulation (e.g. service obligations) is still needed so that
rural areas are also served11
. Furthermore, many key activities and services would still be organized and
provided by the public sector and could also be a combination of a monopoly model and a GSM model
(e.g. local public transportation authorities procuring services from private bus companies).
As it relates to vehicles, e.g. vehicle inspection has already been largely deregulated and market-based
actors are providing the service (regulated by Trafi). Alternative models to road taxation could also be
introduced where usage-based road charging could be utilized (as suggested by Ollila et al. [2013] and
tested in the Traffic lab phase 1.0), where ITS operators could be in charge of collecting this information
and reporting it to Trafi12
.
Furthermore, as it relates to government (or municipality) road infrastructure, a transition to a model
could be envisioned where the government (or municipality) would grant a licence to a part of the road
infrastructure for a private actor who would be responsible for planning, building and operating that part of
the infrastructure13
. If road usage information were available from ITS operators, the road operators could
also charge the vehicles according to their use and make further investments based on demand. In the
future, a similar model could also be followed by intelligent corridor operators, i.e. market actors who would
be the ICT operators of a particular part of the intelligent road infrastructure.
A similar transition has already occurred with road construction in Finland, where the responsible gov-
ernment or municipality agency procures services from individual market contractors (e.g. YIT, Lem-
minkäinen, NCC or Destia). Road construction and also road maintenance thus currently already follow a
rather market-driven oligopoly structure.
11
This could be done in a similar manner to radio spectrum licences granted to mobile network operators, which are obligated to cover a certain part of the population and geographical area.
12 As a service this is very similar to e.g. a mandatory service for mobile network operators who need to provide access
to a subscriber if requested by the police (i.e. legal interception of calls). 13
Public-private partnerships that are already taking steps towards this kind of model have already been tested (e.g. nelostie and ykköstie).

18
Figure 7. Example depiction of the possible future value system.
Infrastructure
(e.g. roads,
streets, yards
and parking
spaces)
Vehicles
(buses, taxis
and private
vehicles)
Enterprises, households
Ownership and
governance of private
infrastructure (e.g.
parking spaces)
FTA,ELYs,municipalities
Public road
infrastructure
ownership and
governance
Enterprises, households
Ownership and
governance of shared
private infrastructure
(e.g. parking spaces)
Private road operators
License based
operation of road
infrastructure
Enterprises, households
Operation of private
vehicles
Trafi, ELYs, PTAs
Licenses for buses
and taxis, governance
of private vehicles
Enterprises, households
Operation of shared
private vehicles
Vehicle fleet operators
Interoperable vehicle
(e.g. bus) fleets
regulated by the public
sector
Private service providers
Provisioning of smart
mobility services
Local PTAs, unions
Public transportation
service provisioning
Service providers
Provisioning of
interoperable smart
mobility services
Service providers
License based
provisioning of basic
services
Fixed point
attractor
No
attractor
Strange
attractorLimit cycle
attractor
No
competition
Some
competition
Fierce competition
High
competition
Market
share
Market
share
Market
shareMarket
share
Actors in order of
market share
Actors in order of
market shareActors in order of
market share
Actors in order of
market share
Monopoly
model
GSM
model
Internet
model
Fragmented
model
End-users
Services
(e.g. journey
planning,
dispatching,
reservations and
ticketing, vehicle
services etc.)

19
Towards the Internet model
Furthermore, in the future the decentralized and isolated private actors could interconnect their systems
and provide better access to different mobility services and unused resources (such as vehicles and park-
ing spaces). In this state the private actors could start interconnecting their systems with harmonized APIs
in an emergent manner. The new model could lead to a wide range of heterogeneous interconnected ac-
tors, services and technologies where users and providers are able to pick and mix services in a modular
manner. However, these applications typically do not provide any guaranteed service level or coverage
(e.g. availability in rural areas) but are purely market-based.
Such a loosely coupled architecture could also enable data exchange and roaming between services
and for end-users to own their data (i.e. MyData). Service aggregation and management could also be
conducted by intelligent context-aware autonomous agents working on users’ behalf (and in the final stage
of the evolution by automated vehicles).
Interoperability would be voluntary and no or very minimal regulation would be enforced by public au-
thorities, thus making it possible for all innovations to be freely explored. This would also mean that smaller
actors and even individual users could become value creators and contributors. We are already currently
witnessing the emergence of several so-called two-sided platforms that e.g. provide an easy way for end-
users in need of a ride to gain access to private drivers (ridesharing applications like Uber, Lyft etc.) or for
drivers to pay for publicly available parking spaces (applications like ParkMan, EasyPark).
However, these platforms are typically closed, meaning they are not interconnected to each other and
that end-users cannot switch between them. Furthermore, in many cases the platform that has gained a
dominant position takes over the entire market (a so-called “winner-takes-all” scenario). Therefore, to
reach a true Internet model these platforms need to be interconnected using common interfaces.

20
4. Centralized structures
Next, we move on to describing historical, current and possible future value system states of more central-
ized services that have a strong public interest with detailed value system models.
4.1 Basic infrastructure and vehicle services
4.1.1 Public road infrastructure
The Finnish road network consists of state-owned roads and municipality-owned streets (as well as private
roads). The Finnish Transport Agency (FTA) is responsible for the development and maintenance of the
state-owned road network and operates under the guidance of the Ministry of Transport and Communica-
tions. The Centres for Economic Development, Transport and the Environment (ELY Centres) are respon-
sible for the regional implementation and development of transport and infrastructure and are supervised
by FTA. Municipally-owned and maintained streets complement the road network mainly in urban and
municipal centres, as well as in residential and industrial areas. The road infrastructure is financed from
state and municipal budgets (i.e. through state and municipal taxes).
Figure 8. Historical model for the provisioning of public road infrastructure.
State, municipalities
Taxation
Enterprises, households
Vehicle operation
VehicleVehicle taxes
State, municipalities
Public road
infrastructure
ownership and finance
Public road
infrastructure planning
and governance
Public road
infrastructure
construction
Public road
infrastructure
maintenanceInfrastructure
Vehicles
Services
End-users
Technical interface
Business interface
Fixed Loosely coupledTightly coupled

21
As it relates to road network construction and maintenance, as shown in Figure 8 historically the state and
municipalities constructed and maintained the road network themselves. However, more recently a sub-
scriber-producer model (tilaaja-tuottajamalli) has been adopted where the road construction and mainte-
nance is performed by private actors, i.e. the value system has evolved towards a centralized and open
model as shown in Figure 9.
In terms of governance and planning, many information systems are used to model the road infrastruc-
ture on a state and municipality level. Digiroad is a national information system that combines the location
information and other main characteristics of the Finnish road and street network into a common data-
base14
. The Finnish Transport Agency maintains and updates the data in the Digiroad system, and pro-
vides data services and is currently upgrading the system. Digiroad is based on a law on road and street
network information system15
.
Figure 9. Current model for provisioning of public road infrastructure.
Data is also collected of traffic flows and used e.g. in road investment and traffic planning and traffic man-
agement. This information is also publicly available to 3rd
parties, providing services for end-users, through
the Digitraffic16
service provided by FTA.
Information about traffic flows is collected to FTA’s centralized database with fixed stations, but also ve-
hicle fleets (Floating Car Data) and mobile phones (Floating Mobile Data) have been used as a source of
information. Road weather measurement stations are also utilized and many cameras have been installed
throughout the infrastructure17
. As it relates to Finnish cities, Tampere and Helsinki (Helsingin kau-
punkisuunnitteluvirasto, 2013) have been active in developing real time traffic information solutions.
Public road infrastructure could evolve into a new public-private partnership model where FTA (and
possibly also cities) would only grant a licence to a road operator that would plan, construct and maintain
the road network for a given time, but where the government would still maintain ownership of the road
14
http://www.digiroad.fi/en_GB/ 15
https://www.finlex.fi/fi/laki/ajantasa/2003/20030991 16
http://portal.liikennevirasto.fi/sivu/www/f/aineistopalvelut/verkkopalvelut/digitraffic#.Vgpb5_mqqkq 17
All the information sources have been collected into a portal service (Liikennetilanne –palvelu, http://liikennetilanne.liikennevirasto.fi/).
State, municipalities
Taxation
Enterprises, households
Vehicle operation
VehicleVehicle taxes
FTA, municipalities
Public road
infrastructure
ownership and finance
Public road infrastructure
planning and governance
Private contractor
Public road
infrastructure
maintenance
Private contractor
Public road
infrastructure
constructionRoad info
databases
(e.g. traffic
flows)
Technical interface
Business interface
Fixed Loosely coupledTightly coupled
Infrastructure
Vehicles
Services
End-users

22
(similar to spectrum licences in mobile communications)18
. This could further evolve into a model where
the road operator would also collect road charges as depicted in Figure 12 and described in more detail in
the following section. This would ensure that investments are made based on demand and could lead to
the road operator providing also other services (i.e. leading to so-called intelligent corridors).
4.1.2 Basic vehicle services
Deployment of broadband connectivity and satellite positioning technologies to vehicles could change the
way basic vehicle services such as vehicle taxation, insurance, registration and inspection are provided in
the future. A central actor for many of these services is the Trafi, which issues permits, regulations, ap-
provals, and handles transport sector taxation and registration for individual vehicles. Trafi is also in charge
of a centralized database (ajoneuvorekisteri) of all vehicles in Finland, which is utilized e.g. in vehicle in-
spection and insurance services.
As discussed earlier, vehicle registration and inspection is already conducted by market actors and
therefore follows currently a centralized and open model as depicted in Figure 10. Earlier, vehicle inspec-
tion was a government monopoly but was later opened to competition (A-Katsastus and K1-Katsastajat
now being the largest market actors). In the future, inspection could also be done remotely, facilitated by
ITS operators (discussed in more detail later) that would provide different vehicle services to vehicle own-
ers (e.g. driver coaching, breakdown calls etc.).
Figure 10. Examples of basic vehicle services.
According to the traffic insurance law, each motor vehicle has to obtain a traffic insurance19
. A central actor
is the Finnish Motor Insurers' Centre (whose role is defined in the law). All insurance companies are legally
obligated to be members of the centre, which they fund according to their market shares. The centre main-
tains an insurance history database (vahinko- ja vakuutushistoria VVH, insurance and damage history) of
all vehicles. This means that vehicle owners can rather easily switch between insurance companies and
take their vehicle’s insurance profiles (so-called bonuses, “bonukset”) with them (i.e. can be seen as fol-
lowing the GSM dynamics). In the future, insurance could also evolve towards more real-time services
where insurance would be paid based on how a vehicle is used (so-called Pay-as-You-Drive [PAYD] or
usage-based insurance [UBI]) (which again could be facilitated by an ITS operator).
Another basic service that could be provided with a new model is vehicle taxation (or road charging).
Currently vehicle taxation is divided to three parts: a tax collected when a car is purchased (autovero), a
tax collected for the usage of a vehicle (ajoneuvovero), and a fuel tax. Recent discussion has called for
new models that would emphasize the actual usage of the vehicle (Ollila et al., 2013) and in general a
model where the focus would be moved from taxation of purchase to taxation of usage.
18
E.g. Tieyhtiö Nelostie Oy, Tieyhtiö Ykköstie Oy are examples of first steps taken towards this kind of model. 19
Liikennevakuutuslaki, http://www.finlex.fi/fi/laki/ajantasa/1959/19590279
Enterprises, households
Vehicle operation
Trafi
Vehicle supervision
Centralized
vehicle
database
Insurance companies
Traffic insurance
provisioning
Vehicle OBD
Databases
for traffic
insurance
Vehicle inspection comp.
Vehicle inspection
Databases
for vehicle
inspection
Fin. Motor Insurers Cent.
Motor insurance
governance
Insurance
history
database
Vehicles
Services
23
At the moment, tax revenues from fuel tax are falling due to more fuel-efficient vehicles and electric ve-
hicles becoming more common. Also, many argue that it would be more equal if taxes were based on how
much a given vehicle is used. New road charging schemes could also enable congestion control in crowd-
ed parts of cities (although not a particularly large problem in Finland).
Figure 11. New model for road charging enabled by ITS operators.
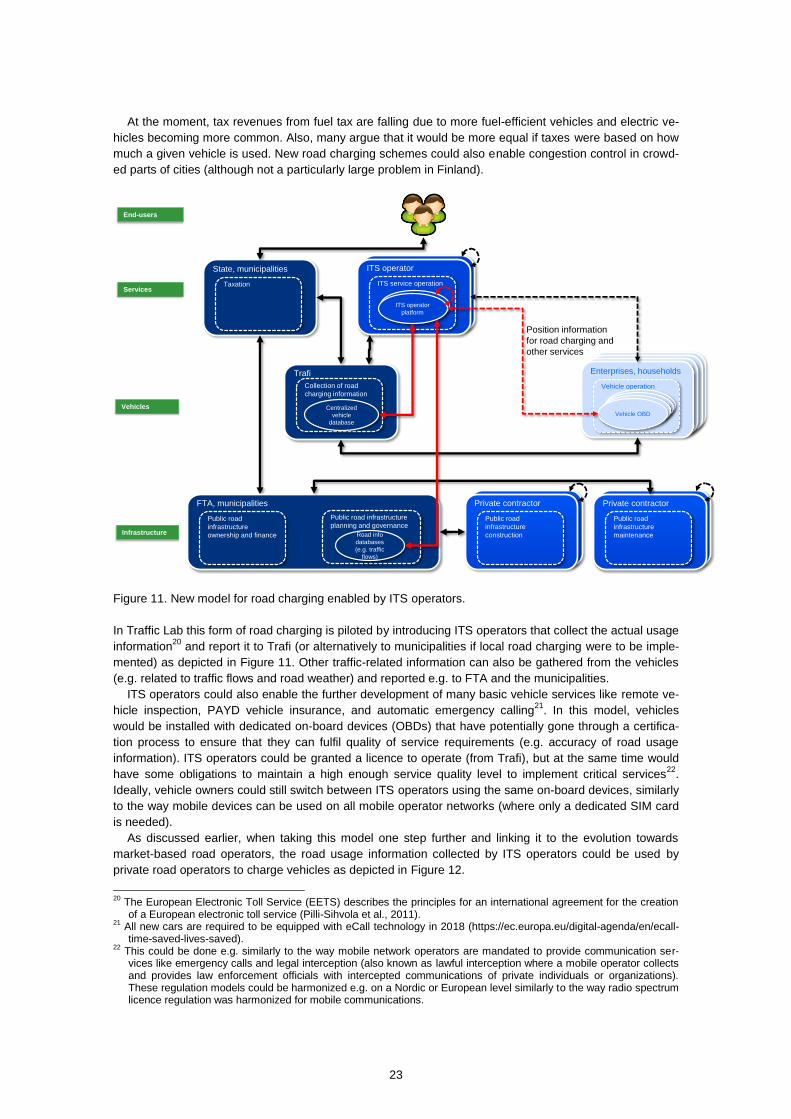
In Traffic Lab this form of road charging is piloted by introducing ITS operators that collect the actual usage
information20
and report it to Trafi (or alternatively to municipalities if local road charging were to be imple-
mented) as depicted in Figure 11. Other traffic-related information can also be gathered from the vehicles
(e.g. related to traffic flows and road weather) and reported e.g. to FTA and the municipalities.
ITS operators could also enable the further development of many basic vehicle services like remote ve-
hicle inspection, PAYD vehicle insurance, and automatic emergency calling21
. In this model, vehicles
would be installed with dedicated on-board devices (OBDs) that have potentially gone through a certifica-
tion process to ensure that they can fulfil quality of service requirements (e.g. accuracy of road usage
information). ITS operators could be granted a licence to operate (from Trafi), but at the same time would
have some obligations to maintain a high enough service quality level to implement critical services22
.
Ideally, vehicle owners could still switch between ITS operators using the same on-board devices, similarly
to the way mobile devices can be used on all mobile operator networks (where only a dedicated SIM card
is needed).
As discussed earlier, when taking this model one step further and linking it to the evolution towards
market-based road operators, the road usage information collected by ITS operators could be used by
private road operators to charge vehicles as depicted in Figure 12.
20
The European Electronic Toll Service (EETS) describes the principles for an international agreement for the creation of a European electronic toll service (Pilli-Sihvola et al., 2011).
21 All new cars are required to be equipped with eCall technology in 2018 (https://ec.europa.eu/digital-agenda/en/ecall-
time-saved-lives-saved). 22
This could be done e.g. similarly to the way mobile network operators are mandated to provide communication ser-vices like emergency calls and legal interception (also known as lawful interception where a mobile operator collects and provides law enforcement officials with intercepted communications of private individuals or organizations). These regulation models could be harmonized e.g. on a Nordic or European level similarly to the way radio spectrum licence regulation was harmonized for mobile communications.
State, municipalities
Taxation
Enterprises, households
Vehicle operation
Vehicle OBD
Position information
for road charging and
other services
FTA, municipalities
Public road
infrastructure
ownership and finance
Public road infrastructure
planning and governance
Private contractor
Public road
infrastructure
maintenance
Private contractor
Public road
infrastructure
construction
ITS operator
ITS service operation
ITS operator
platform
Trafi
Collection of road
charging information
Centralized
vehicle
database
Road info
databases
(e.g. traffic
flows)
Infrastructure
Vehicles
Services
End-users

24
Figure 12. Potential future model for public road infrastructure and basic vehicle services.
4.2 Public transportation
4.2.1 Long distance and local public transportation
FTA is responsible for the overall national-level development of public transportation. FTA, together with
ELY centres, operate databases that contain public transportation related licences (e.g. for buses and
taxis) and also a database (koontikanta) that gathers information from the different transport operators and
local public transportation authorities (e.g. related to timetables)23
. The latter database is based on an XML
representation of the timetable data of different transport modes defined in Kalkati.net24
.
Long distance public transportation
Licences for public transportation routes outside of cities and for taxis are issued by ELY Centres on a
regional basis. Bus transportation across cities and the corresponding services have historically been
centred around Linja-autoliitto,25
an association for bus companies operating the routes, and Matkahuol-
to,26
a service and marketing company owned by Linja-autoliitto which has been a central actor providing
information services for the member companies of Linja-autoliitto. The historical model can be character-
ized as centralized and closed as depicted in Figure 13, since rather limited competition existed between
the bus companies.
23
http://www2.liikennevirasto.fi/julkaisut/pdf3/lts_2012-32_joukkoliikenteen_tietojarjestelmat_web.pdf 24
http://www.kalkati.net/ 25
http://www.linja-autoliitto.fi/fi/ 26
https://www.matkahuolto.fi/en/good-know/company-information/#.VdwNz_mqpBd
Enterprises, households
Vehicle operation
Vehicle OBD
ITS operator
ITS service operation
ITS operator
platform
FTA, municipalities
Public road
infrastructure
ownership
Private contractor
Public road
infrastructure
maintenance
Private contractor
Public road
infrastructure
construction
Private road operator
Road infra planning
and governance
License
Position information
for road charging and
other services
Road info
databases
(e.g. traffic
flows)
Trafi
Governance of private
vehicles
Centralized
vehicle
database
Service providers
Service operation
Service
provider
server
License
Infrastructure
Vehicles
Services

25
Figure 13. Historical model for long distance public transportation.
More recently, competition has also emerged driven mainly by new EU legislation (markkinaehtoinen reit-
tiliikennelupamalli), with companies like Onnibus.com entering the market. This evolution could eventually
lead to a GSM model structure where there would be many companies acting as service operators (i.e. in
addition to Matkahuolto) with interoperable ticketing and information systems between bus companies and
service providers as depicted in Figure 14.
Figure 14. Possible future open model for long distance public transportation.
ELY-centres
Issuing of licences
Bus companies
Long distance public
transportation operation
Back-end &
on-board
systems
Matkahuolto (LAL)
Public transportation
service provider
Info systems
(ticketing
etc.)
LicencesVehicles
Services
End-users
Licence and
timetable
database
ELY centres
Issuing of licences
Bus companies
Long distance public
transportation operation
Back-end &
on-board
systems
Licences
Licence and
timetable
database
Mobility service provider
Public transportation
service provider
Info systems
(ticketing
etc.)
Vehicles
Services
End-users

26
Here the licences granted by ELY centres could mandate interoperable systems that would enable end-
users to switch between service providers27
.
In parallel to this, another central actor for public transportation between cities is the state-owned rail-
way company VR,28
which operates train routes across cities. VR can already be seen as part of the oli-
gopoly structure and is competing directly against the bus companies. Recently there has been discussion
on opening up railway operation to competition, which could naturally link to the GSM model.
Local public transportation
As it relates to local public transportation, local public transportation authorities (PTAs) (e.g. Helsinki Re-
gion Transport and Tampereen Joukkoliikenne in their regions) can be seen as local regulators, since they
centrally plan the timetables and routes of the buses in their regions and procure the transportation opera-
tion from bus companies. According to the current law for public transportation29
the PTAs are in charge of
defining service levels for their areas, issuing licences for routes (and also for demand-based public trans-
portation) and procuring the corresponding transportation services (palvelusopimusasetusliikenne, PSA)
from bus companies. In the current model, municipalities subsidize public transportation from their budg-
ets. Overall, the model is mostly a centralized and closed one (on a regional level), i.e. Monopoly model.
Some collaboration across the public transportation authorities does, however, exist. The local public
transportation authorities have a central association, Suomen Paikallisliikenneliitto,30
and many of the large
municipalities (excluding Helsinki Region Transport, HRT) are currently developing a common ticketing
system, Waltti.
In the model presented in Figure 15, HRT is used as a case example. Helsinki Region Transport Author-
ity31
is responsible for the planning and procuring of public transportation, for marketing and passenger
information, and for the public transportation ticketing system in the Greater Helsinki area. Their central
system is the public transportation register (joukkoliikennerekisteri, JORE) which maintains information
about routes, timetables and stops, and which is also used to provide journey planning services to end-
users.
Figure 15. Current model for local public transportation (case HRT).
27
In the long run this could also be harmonized on an international (e.g. first Nordic) level. 28
http://www.vrgroup.fi/en/vrgroup/ 29
https://www.finlex.fi/fi/laki/ajantasa/2009/20090869#L3P13 (13.11.2009/869) 30
http://www.paikallisliikenneliitto.com/ 31
https://www.hsl.fi/en
HRT (Kutsuplus)
HKL, VR
Operation of trams
and trains
Train, tram
OBDs
Bus operators
Bus operation
Bus OBDs
HRT
Public transportation
service provisioning
Info systems:
timetables,
ticketing etc.
Minibus operation
Minibus OBDs
DRPT service
provisioning
Dispatching
and ticketing
system
Vehicles
Services
End-users

27
An in-house agency, Helsinki City Transport HKL32
is responsible for running the trams and the metro and
VR for operating local trains. HRT procures bus transportation from companies such as Helsingin Bus-
siliikenne, Nobina, Transdev Finland and Pohjolan Liikenne.
As it relates to ICT systems operated by HRT, one notable one is the ticketing system which is currently
being renewed. The IT system provider, Tieto, has had a strong role in the development, is the main ven-
dor both for the old and new system,33
and both implements and operates the system. The journey planner
is also a notable ICT system for HRT. The original journey planner has been developed and operated by
CGI, another central IT system provider. Many steps have been taken towards a more open approach with
the opening of APIs for developers,34
which has led to a wide range of mobile journey-planning applica-
tions for different operating systems (the API approach is discussed in more detail in Section 5.2.235
).
In relation to more dynamic demand-based public transportation, HRT ran a pilot called Kutsuplus36
.
The system was not integrated into HRT’s main ticketing system but used separate payment mechanisms
(i.e. the HRT travel card could not be used in the Kutsuplus service). Although this has been a notable step
towards more dynamic public transportation, the model was still rather closed, with HRT defining the ser-
vice area and having a dedicated fleet of minibuses, i.e. that the service area and number of vehicles did
not scale based on demand. The service was also heavily subsidized by the member municipalities of HRT
and the service did not reach sufficient viability during the pilot.
The demand-based transportation model could, however, in the future evolve into a more market-driven
model as depicted in Figure 16, with many companies acting as minibus operators (Demand Responsive
Public Transport (DRPT) operators) and also with many service companies. These service companies
could also aggregate other local public transportation services into a larger mobility package.
Figure 16. New model for local public transportation with mobility service providers that aggregate different transport services into a single package.
32
http://www.hel.fi/www/hkl/en 33
http://www.tieto.fi/uutiset/tieto-ja-hsl-allekirjoittivat-sopimuksen-uuden-lippu-ja-informaatiojarjestelman-toimittamisesta, Tieto is also the vendor for the Waltti system for cities outside the Helsinki Region (except for Turku), and thus will have a dominant role in the Finnish market in the foreseeable future. (http://www.tieto.fi/news/suomessa-kayttoon-uudenlainen-joukkoliikenteen-matkakortti-tieto-lippujarjestelman-toimittajaksi)
34 http://dev.hsl.fi/
35 More recently HRT has decided to utilize a fully open source approach in building the next version of the official jour-
ney planner. HRT is doing this development jointly with FTA, which is upgrading the nationwide journey-planning service (matka.fi). HRT and FTA plan to share the source code publicly so that other actors can use it and tailor ser-vices for specific needs. http://liikennelabra.fi/avoin-reittiopas-ottaa-askeleen-eteenpain/
36 https://kutsuplus.fi/home. The service was developed by a Finnish start-up, Ajelo, later acquired by Split. The service
was heavily subsidized by HRT, did not become viable and has now been ended.
Mobility service provider
Mobility service prov..
Dispatching
and ticketing
system
HKL, VR
Operation of trams
and trains
Train, tram
OBDs
Bus operators
Bus operation
Bus OBDs
HRT
Public transportation
service provisioning
Info systems:
timetables,
ticketing etc.
DRPT service operator
Minibus operation
Minibus
OBDs
Vehicles
Services
End-users

28
Also, as it relates to public transportation, operators of the buses e.g. in the case of HRT are private com-
panies, meaning that an oligopoly market structure is being followed already (the information systems,
however, are still controlled by HRT). Such a model could gain even more momentum when demand-
responsive public transportation becomes more common where several market actors can become
transport operators, leading to a situation where less static bus routes are needed.
Here HRT (or another local public authority) could still regulate the demand-based public transportation
market in its area with public transportation licences, and enforce service obligations and interoperability
requirements for the information systems.
In the very long term (Figure 17), local public transportation could evolve into a model where HRT would
mostly regulate and grant licences for transport operators, but give them the freedom to organize the
routes based on market demand;37
they would still somehow need to report to HRT that service quality
levels are being met. HRT could still remain in control of critical central routes (such as trains), but public
transportation services would be provided by dedicated operators with their own ticketing and information
systems that are interconnected with the systems of transport operators following a GSM model.
Figure 17. Potential future model for local public transportation.
Here, regulation by local public transportation authorities could be harmonized on a national level e.g. to
ensure that ticketing systems are interoperable across regions where FTA could act as an enabler38
(this
could be also conducted more broadly e.g. on the level of the Nordic countries).
4.2.2 Transportation for special groups and taxis
As it relates to other public forms of transportation, municipal and state transportation services for special
groups (e.g. people with disabilities, patients and students) that are not able to access regular public
transportation but need dedicated services can be considered as a notable example. The city of Helsinki,
for example, serves special groups with a Travel Service Centre (Matkapalvelukeskus). Both dedicated
minibuses and taxis are used to provide demand-based services for the groups. Travel Service Centres
often try to combine trips for customers heading to roughly the same destination at the same time using
dedicated information systems (provided e.g. by Mobisoft and Ecolane). Dedicated public transportation
37
This is again similar to radio spectrum licence regulation, where e.g. the regulator (Ficora) does not specify the exact places where base stations should be placed; these are deployed based on market demand, while at the same time making sure that access is available in rural areas as required by the licence.
38 This harmonization across regions could be linked to the future evolution of the national databases for public transpor-
tation licences and timetable databases and to the Waltti ticketing system.
Mobility service provider
Mobility service
provisioning
Dispatching
and ticketing
system
HKL, VR
Operation of trams
and trains
Train, tram
OBDs
Bus operators
Bus operation
Bus OBDs
FTA
Harmonization of local
PTA regulation
DRPT service operator
Minibus operation
Minibus
OBDs
Licences
HRT & other local PTAs
Local public
transportation service
regulation
Vehicles
Services
End-users

29
subsidized by the Social Insurance Institution of Finland (Kela) on a national level also forms a major part
of the transportation for these special groups.
Taxis that serve the larger public locally also form an important part of publicly available transportation
services. In Finland, according to the law on taxi transport, taxi operations are subject to licence for which
permission is granted by the ELY Centres based on local quotas39
. The annual turnover of the taxi market
is roughly 1 billion euros with the share of publicly subsidized rides being approximately 40%40
. The ser-
vice obligations for taxi permits are very high, which means that the taxi service has very good coverage
and availability and is also very reliable and able to serve special groups (such as patients and the elderly).
Taxi entrepreneurs are mostly self-employed and members of the Finnish Taxi Owners Federation,41
which is a central actor. A taxi is generally obtained via a local dispatch centre as depicted in Figure 18.
Dispatch centres have central information systems locally and are typically directly linked to the local taxi
association and its members (e.g. Helsingin Taksi-Data Oy HTD42
in Helsinki). Dispatch centres need to
notify the local ELY centre of their operations. They are also often directly linked to the systems of Kela
covering mobility needs for some social services.
Recently, new services have emerged that are disrupting the current state of affairs. For example, in the
Oulu region the local taxi association has been experimenting with a solution from Taxify43
that provides a
service to connect end-users with taxis. Taxify is essentially a closed mediating platform (i.e. working with
a technical level monopoly model) that is not interconnected with the dispatch centre, but drivers and also
end-users need separate applications to access Taxify services.
Figure 18. Current model for taxis and some notable new entrants shaping current structures.
Furthermore, Uber has recently entered the Finnish market and is currently operating in the Helsinki region
(even though the legality of the service is unclear since the drivers are operating without taxi licences). The
end-user demand for community services like Uber is rather high, with many end-users saying that they do
not necessarily need the service levels that the current taxi system offers (e.g. in terms of service availabil-
ity for special groups) but could cope with a best-effort quality level.
39
Taksiliikennelaki (https://www.finlex.fi/fi/laki/ajantasa/2007/20070217) 40
http://www.taksiliitto.fi/taksiliikenne/yleista/ 41
http://www.taksiliitto.fi/en/ 42
http://www.taksihelsinki.fi/en 43
http://taxify.eu/
ELY centres
Issuing of licences
Local Taxi Association
Taxi dispatching
Taxi dispatch
centre
Licence
Taxi entrepreneur
Taxi operation
Taxi OBDs
End-user
Mobility service usage
Smartphone
application
Taxify
Taxi dispatching
Taxi dispatch
cloud
Uber
Ride dispatching
Ride
dispatching
cloud
Private vehicle operator
Vehicle operation
Vehicle
operator’s
smartphone
Licence and
timetable
databaseVehicles
Services
End-users

30
An issue that has been under discussion recently has been the renewal of current taxi permit legislation,
the need for which has been highlighted by e.g. the Finnish Competition and Consumer Authority. With the
emergence of Uber and other community-based ride sharing services and concepts like Mobility-as-a-
Service, the Ministry of Transport and Communications is currently considering the possibility of making
changes to the current legislation in order to make it more flexible to acquire taxi permits and also combine
personnel transportation and logistics. If such new legislation were to become available, it would make it
possible for individual households and end-users to provide taxi-like services for each other, which could
lead to a more decentralized and open ecosystem following the Internet model as depicted in Figure 19.
Here, there would be many service operators providing dispatch and payment services to the taxis and
also to ride sharing communities, and this could also be combined with other modes of transport (e.g.
public transportation), leading to a MaaS service model. The dispatch centres would be interconnected
using open interfaces. Interoperability between the dispatch centres could be mandated by the ELY cen-
tres (and Trafi) also, as it relates to the modules used in the vehicles.
Figure 19. Possible future model for dispatching with many mobility service providers.
Here, also the historical data of the movements and mobility preferences of end-users could be utilized to
provide better services. This so-called mobility-related MyData (Poikola et al., 2015) is typically lost or
locked to the fragmented systems of individual transport providers and could be a key ingredient when
providing user-tailored MaaS services. Dedicated MyData operators using open interfaces could be intro-
duced that would maintain this personal data, which could be used as input for the MaaS services and
prevent the end-user from being locked into a specific service provider.
Although there is room for market-based services, in the future services should also be available for
special end-user groups and rural areas that would not be served with purely market-based models.
Therefore, different regulation models (i.e. heavier and lighter) are needed.
Appropriate regulation is also important to ensure that one platform (possibly a global one) does not
gain dominance and monopolise the market. Figure 20 presents a depiction of such a scenario where one
market-based actor gains a gatekeeper role and controls the dispatch centre and the mobility related My-
Data.
End-user
Mobility service usage
Smartphone
application
Mobility service provider
Dispatching
Dispatch and
payment
cloud
MyData operator
MyData service
provisioning
MyData
server
Taxi entrepreneur
Taxi operation
Taxi OBDs
Private vehicle operator
Vehicle operation
Vehicle
operator’s
smartphone
HRT, VR
Public transportation
service provisioning
Info systems:
timetables,
ticketing etc.
Vehicles
Services
End-users
ELY centres, Trafi
Issuing of licences
Licence and
timetable
database

31
Figure 20. Possible future scenario where a global platform gains dominance.
End-user
Mobility service usage
Smartphone
application
Mobility service provider
Dispatch-
ing
Dispatch and
payment
cloud
MyData service
provisioning
MyData
server
Taxi entrepreneur
Taxi operation
Taxi OBDs
Private vehicle operator
Vehicle operation
Vehicle
operator’s
smartphone
HRT, VR
Public transportation
service provisioning
Info systems:
timetables,
ticketing etc.
Vehicles
Services
End-users

32
5. Decentralized structures
Next, we move on to describe current and possible future value system states of more decentralized ser-
vices operated by private actors with detailed value system models.
5.1 Private infrastructure and traffic
5.1.1 Private infrastructure
Private infrastructure consists of e.g. private roads, yards and parking spaces that are owned and main-
tained by private actors such as enterprises and households. For example, private roads in Finland form
an important part of the road infrastructure. If a road is not intended to be used by anyone but a particular
group, a typical model is to form local road co-operatives where the partners of the consortium have the
right to exclude others from using the road, especially if it causes harm or road maintenance costs. Co-
operation between public authorities and private actors is also common, and it is possible to receive state
aid for private roads. If public subsidies are given to road maintenance, outside usage cannot be denied. In
principle, satellite-based road charging could also provide a solution to cases where maintenance costs
could be more evenly distributed between the users of the road (although privacy and trust might become
an issue).
Private parking spaces are another important part of infrastructure which can in many cases be un-
derutilized. It has, for example, been estimated that a significant part of vehicles moving in the downtown
areas of cities are looking for parking spaces. Information related to the availability of parking spaces, e.g.
in large parking halls (hosted e.g. by enterprises for their own workers) is often isolated to fragmented
localized information systems as depicted on the right side of Figure 21. The payment solutions related to
parking are also typically dedicated to specific locations and facilities.
At the same time, new applications like Parkman and Easypark are emerging that provide a payment
platform connecting parking space owners with drivers of vehicles. The service is also provided in many
public parking spaces owned and maintained by municipalities.
The platforms, however, are still closed in the sense that they are not interconnected, i.e. that an end-
user of e.g. Parkman cannot use parking spaces served only by Easypark. Having many dedicated appli-
cations for each platform results in high multi-homing costs for both end-users and parking space owners.

33
Figure 21. From fragmented to open Internet (shared) model for private parking spaces.
In the future, with the emergence of sharing economy paradigms, new platforms could be created that give
access to individual unused private parking spaces of companies and households. Furthermore, these
mediating platforms could potentially be interconnected as described on the left side of Figure 21 and thus
move to an Internet model. However, the interconnection here would have to be largely voluntary44
and
cannot be mandated solely with regulation45
.
5.1.2 Private traffic
Private transportation by households and companies forms the majority of traffic in Finland. Overall, the
utilization rates of private vehicles, in terms of personnel traffic, are rather low where e.g. households typi-
cally use vehicles mostly for themselves and do not provide transportation services for others (largely not
possible due to current legislation), meaning that the current model is rather fragmented. Enterprise traffic
consists mostly of logistics (roughly two thirds), but a major part is also personnel transport (roughly one
third). Information about the availability of these resources is also rather limited, i.e. locked to fragmented
vehicle or fleet specific systems.
At the same time, satellite positioning technologies and real-time broadband connectivity to vehicles and
also via smartphones to drivers is enabling the emergence of various ride sharing services. Two-sided
platforms mediating the connection between drivers driving empty vehicles (i.e. unused resources) and
end-users in need of rides are gradually emerging, which indicates a transition towards the Internet model.
For example, it is legal to share gas costs e.g. related to longer trips, and examples of such ride sharing
platforms already exist, including applications like Tziip and Ridefy and dedicated websites such as Green-
44
Similarly to how e.g. internet service providers in Finland have created Ficix association to interconnect their net-works.
45 The public sector (i.e. municipalities in this case) could, however, be leading partners of these voluntary communities,
with e.g. cities mandating that the platforms facilitating access to their parking spaces are interconnected to other payment platforms.
Enterprises, households
Private parking space
ownership
Private
parking
space
Private parking space
service provisioning
Closed
platform
Enterprises, households
Private parking space
ownership
Private
parking
space
Parking service provider
Private parking space
service provisioning
Modular
platform
Fragmented modelInternet model
Vehicle operation
Vehicle
Infrastructure
Services
Vehicle owners
Enterprises, households
Vehicle operation
Vehicle

34
riders, Kimppakyyti.fi and kyydit.net46
. Another relevant activity is the emergence of car sharing communi-
ties such as Kortteliauto and City Car Club47
.
On an international level, the dispatching of users in need of transportation to drivers of private vehicles
has become a strong development trend driven especially by Uber, but also by services such as Lyft and
Sidecar48
. Uber has also entered the Finnish market but the legality of the service is unclear, since the
drivers do not have taxi licences.
Figure 22. Shift from fragmented model to open Internet model for ride and vehicle sharing.
Although all of these vehicle or ride sharing platforms are based on open two-sided business models and
utilize the open Internet, interoperability between them does not exist and end-users need to use separate
clients to access the different service providers. Thus, the next evolution step could be the interconnection
of the ride sharing platforms according to the Internet model as depicted on the left side of Figure 22. The
challenge is that platform providers do not necessarily have incentives to interconnect their platforms since
this will, at least in the short term, increase competition. On the other hand, interconnecting the platforms
creates a broader market. If light regulation models could be used for drivers providing the services (i.e. a
lighter version than the current taxi licence), they could be coupled with requirements or recommendations
that the platforms should be made interoperable.
46
https://www.facebook.com/tziip, http://www.ridefy.com/fi/, http://www.greenriders.fi/, http://www.kimppakyyti.fi/, http://www.kyydit.net/
47 https://kortteliauto.fi/, https://citycarclub.fi/
48 https://www.uber.com/, https://www.lyft.com/
Enterprises, households
Vehicle operation
Vehicle
Enterprises, households
Vehicle operation
Vehicle
Ride sharing provider
Ride sharing service
provisioning
Modular
platform for
ride sharing
Fragmented modelInternet model
Mobility service usage
End-user
device
Vehicles
Services
End-users
End-users
Mobility service usage
End-user
device

35
5.2 Vehicle and end-user services
A wide range of digital services is also available to vehicle owners and end-users of mobility services.
5.2.1 Vehicle services
Satellite positioning technologies and real-time broadband connection to vehicles have enabled many
digital services that are dedicated for vehicle owners and users, such as real-time navigation, remote diag-
nostics for vehicle maintenance, automatic emergency calls, automatic breakdown calls (bCall) that alert
towing, driver coaching and driving diaries. Remote diagnostics-based maintenance, for example, enables
more flexible services where e.g. a fault code can be sent to a maintenance company real-time and the
corresponding spare part can be automatically ordered and a maintenance appointment scheduled. Driver
coaching can lead to more economical driving habits and considerable savings in fuel consumption, and
driver diaries to more flexible and efficient company bookkeeping.
However, the information systems enabling these services are largely fragmented, where each service
provider works as an isolated silo without any common technical architecture, thus corresponding to the
fragmented model depicted on the right side of Figure 23. For example, automotive manufacturers have
provided their own integrated and isolated in-vehicle platform solutions such as Volvo On Call, BMW Assist
and GM Onstar that provide call centre support and other value-added services mentioned earlier. Fur-
thermore, large vehicle fleets for companies are, for example, typically controlled with dedicated fleet man-
agement systems integrated into company-specific tailored Enterprise Resource Planning systems, and
cannot easily be interconnected with other systems.
Figure 23. From fragmented to open Internet multi-service model for vehicle services.
Aftermarket services are also available where aftermarket on-board modules are installed in vehicles.
Many services can be provided with an aftermarket model, such as driver coaching and driving diaries for
companies and individual vehicle users provided by companies like Helpten (e.g. Autoasi service), EC-
tools (Drivecon), Sonera (Matkalainen) and Vedia in Finland49
. Thus far, the business environment has
49
http://www.helpten.fi/fi/, http://eco.driveco.fi/www/, which is partnering with e.g. the Autoasi maintenance chain to enable remote diagnostics for vehicle maintenance. http://www.autoasi.fi/alya
Enterprises, households
Vehicle operation
Vehicle
ITS operator
Multi-service
facilitation
ITS operator
platform
Fragmented modelInternet model
Vehicles
Services
Maintenance company
Remote diagnostics
Service
provider
cloud
Enterprises, households
Vehicle operation
Vehicle
Vehicle service
providers
Service operation (e.g.
remote diagnostics,
driver coaching, driving
diaries, towing)
Service
provider
cloud
Vehicle telematics
Driver coaching, diary
Service
provider
cloud
Towing company
Breakdown call
Service
provider
cloud

36
been immature, mostly due to lack of wide scale demand, and just a few commercially viable services
have emerged in Finland. One core goal of the first phase of the Traffic Lab program has been to stimulate
these kinds of market-driven services where such companies could potentially become ITS operators that
would also provide basic vehicle services (i.e. road charging, usage based insurance etc.).
Overall, the market can be seen as being dominated by incompatible solutions where the end-users are
locked into specific service providers. When switching costs are high and there is no support for data ex-
change and data roaming between service providers (i.e. switching from one service provider to another
without losing data), the market is not able to scale up and grow.
A transition from a fragmented model to an Internet model where vehicle owners and users can pick-
and-mix services can also be envisioned as depicted on the left side of Figure 23. Steps towards more
open models have been taken in the context of the multi-service concept development in Finland, where
for example an open service architecture has been proposed (Heino et al., 2013). Open in-vehicle info-
tainment platforms are also emerging, such as GENIVI Alliance and Open Automotive Alliance50
.
5.2.2 End-user services and MaaS
The end-users of mobility services (i.e. public transportation, taxis, shared vehicles, bicycles, private vehi-
cles of households) fall roughly into three groups:
1. Consumers and households,
2. Enterprises (i.e. their workforce), and
3. Municipalities (acting on behalf of e.g. special citizen groups).
The end-users of different mobility services already have access to a wide range of services that help them
organize their mobility needs, such as local public transportation journey planners and trip reservation and
payment systems. However, from an end-user perspective these services are fragmented. Dedicated
information systems have historically been used for different forms of transportation and also for different
regions, e.g. for vehicle dispatching, reservation, and ticketing and payment, and thus the end-user ser-
vices have followed a fragmented model as depicted on the right side of Figure 24.
Some steps have been taken towards a more open Internet-oriented approach, e.g. by opening APIs
from these isolated systems for developers. HRT for example has been actively providing APIs for devel-
opers, which has led to a wide range of mobile journey planning applications for different operating sys-
tems. However, these APIs are not harmonized with those of other cities, meaning that developers need to
tailor their applications to each city. The Finnish Taxi Owners Federation has also been active in develop-
ing a mobile application, Valopilkku, with which one would be able to order a Taxi anywhere in Finland,
and which would provide a similar user experience to that of Uber and Taxify. VR is also working on an
open API to its information system. These APIs could be gradually harmonized, which in turn could lead to
an Internet model depicted on the left side of Figure 24, where it would be easy to access different trans-
portation services through a single application.
50
http://www.genivi.org/, http://www.openautoalliance.net/#about
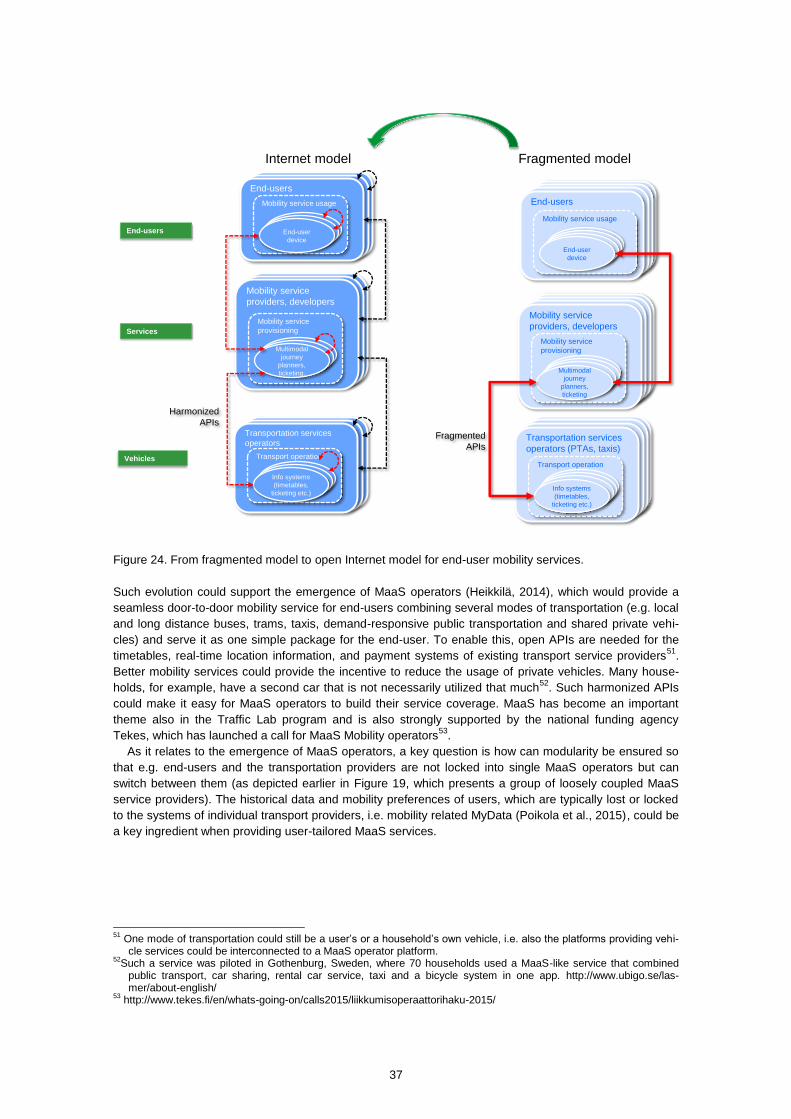
37
Figure 24. From fragmented model to open Internet model for end-user mobility services.
Such evolution could support the emergence of MaaS operators (Heikkilä, 2014), which would provide a
seamless door-to-door mobility service for end-users combining several modes of transportation (e.g. local
and long distance buses, trams, taxis, demand-responsive public transportation and shared private vehi-
cles) and serve it as one simple package for the end-user. To enable this, open APIs are needed for the
timetables, real-time location information, and payment systems of existing transport service providers51
.
Better mobility services could provide the incentive to reduce the usage of private vehicles. Many house-
holds, for example, have a second car that is not necessarily utilized that much52
. Such harmonized APIs
could make it easy for MaaS operators to build their service coverage. MaaS has become an important
theme also in the Traffic Lab program and is also strongly supported by the national funding agency
Tekes, which has launched a call for MaaS Mobility operators53
.
As it relates to the emergence of MaaS operators, a key question is how can modularity be ensured so
that e.g. end-users and the transportation providers are not locked into single MaaS operators but can
switch between them (as depicted earlier in Figure 19, which presents a group of loosely coupled MaaS
service providers). The historical data and mobility preferences of users, which are typically lost or locked
to the systems of individual transport providers, i.e. mobility related MyData (Poikola et al., 2015), could be
a key ingredient when providing user-tailored MaaS services.
51
One mode of transportation could still be a user’s or a household’s own vehicle, i.e. also the platforms providing vehi-cle services could be interconnected to a MaaS operator platform.
52Such a service was piloted in Gothenburg, Sweden, where 70 households used a MaaS-like service that combined
public transport, car sharing, rental car service, taxi and a bicycle system in one app. http://www.ubigo.se/las-mer/about-english/
53 http://www.tekes.fi/en/whats-going-on/calls2015/liikkumisoperaattorihaku-2015/
Transportation services
operators
Transport operation
Info systems
(timetables,
ticketing etc.)
Mobility service
providers, developers
Mobility service
provisioning
Multimodal
journey
planners,
ticketing.
Fragmented modelInternet model
Vehicles
Services
End-users
End-users
Mobility service usage
End-user
device
Mobility service
providers, developers
Mobility service
provisioning
Multimodal
journey
planners,
ticketing
End-users
Mobility service usage
End-user
device
Transportation services
operators (PTAs, taxis)
Transport operation
Info systems
(timetables,
ticketing etc.)
Fragmented
APIs
Harmonized
APIs

38
6. Systemic transition towards smart mobility
Next, we move on to describe ongoing transitions from the point of view of a broader framework for soci-
otechnical systemic transitions.
6.1 Sociotechnical system transition framework
How social and technical systems change and transform is a critical issue for firms, policy-makers, and
interest groups with ambitions to develop and uptake new innovations. Adoption and diffusion of many new
products and services are dependent on various characteristics in the surrounding sociotechnical system.
For instance, the introduction of electric vehicles does not depend solely on consumers’ perceptions of the
merits of the electrically powered vehicle over the conventional combustion engine, but also on the availa-
bility of a network of charging stations, compatibility of various charging plug standards, and treatment of
electric vehicles in regulations and taxation. An entire sociotechnical system with road and fuelling infra-
structure, user practices, regulation and standards has evolved over time around combustion engine vehi-
cles. The electric vehicle, as an innovative technological product, is not supported by the same fabric of
technical infrastructure and social institutions. It is challenging to change existing structures and establish
new ones more favourable to this environmentally more sustainable mode of transportation.
How sociotechnical systems transition from one configuration to another one is thus a matter of great in-
terest for policy-makers, business strategists, and social groups. One of the most ambitious attempts to
characterise the dynamics of these changes is the sociotechnical system transition approach. This line of
research, most actively developed in the Netherlands and the UK, is an approach to conceptualise struc-
tural change in the economy and the role of innovation within the evolution. An important feature of the
model is to perceive sociotechnical change taking place through the interaction of processes at multiple
levels. Uptake of innovation is not triggered by any single factor but through processes at various levels. In
the standard model of the approach three levels are distinguished: niche, regime and landscape (Geels,
2002).
New technological products are created in ‘niche’ contexts. In the beginning they are crude products
with low technical performance, cumbersome to use and more expensive than established products on the
market (Geels, 2002). Also, evidence of their feasibility and impacts are not yet very robust. In order to
take innovation forward, protected niche environments, actor networks and support activities are often
required. An example of a protected space for innovation is military technology development, where vari-
ous radical innovations (e.g. digital computer, jet engines, and radars) have been developed and incubat-
ed by the army (Geels, 2002). Another example is the early stage of steam ships, which initially were used
only in inland waterways, where many of their immature features did not become obstacles because of
less stringent use requirements (Geels, 2002). New technologies enter the market via narrow application
domains in which the particular merits of the new technology are appreciated, while the deficiencies are
not problematic enough to prevent their use (Sushandoyo & Magnusson, 2014).
The second level is the prevailing ‘regime’ which consists of production structures, markets, user needs,
demand, professional practices, scientific knowledge, established technology, standards, regulation and
associated cultural meanings. These elements are linked together, forming a stable structure in which
linkages are maintained and reproduced by the alignment and coordination of different actor groups
(Geels, 2002). The regime is thus occupied with optimizing and improving existing technologies and social
arrangements rather than interested in adopting radical innovation. Therefore, change at the regime level
is typically slow. Its prevalence is sustained by established actors, their relationships and regulation. In-
cumbent actors aim to develop their activities and the whole system, but typically only through small steps

39
and without challenging the mainstream setup (Kivisaari et al., 2004). A number of institutional mecha-
nisms that sustain the status quo have been identified: established systems are stabilized by legally bind-
ing contracts; firms have sunk investments in machines, skills and knowledge which they do not want to
lose; change is constrained by institutional arrangements and regulation; and existing technology and
social practices are supported by a specific type of infrastructure (Geels, 2005).
The third and most extensive level is the sociotechnical landscape. Global events, economic cycles and
general cultural values are important factors in the landscape. Changes occurring in the landscape create
pressure to change the sociotechnical regime. These can be major global events, economic cycles and
shifts in political priorities. The actors operating within the sociotechnical system typically have limited
influence on the landscape evolution. However, these external forces may open up new windows of oppor-
tunity for innovations incubated in niches to enter the mainstream by destabilizing the existing regime
(Geels, 2002; Geels, 2005).
Figure 25. A dynamic multi-level perspective to technological transitions (Geels, 2002).
A transition can be described as ‘major, long-term technological changes in the way societal functions are
fulfilled’ (Geels, 2002). They comprise changes which are connected and reinforce each other, but take
place in various domains, such as technology, the economy, institutions, behaviour, culture, ecology and
belief systems (Rotmans et al., 2001). In transition, there are multiple patterns of causality and co-
evolution creating reinforcing patterns of development.
The transition model assumes dynamics of change whereby niche level experiments do not have a line-
ar pathway to the regime and landscape level change. Rather, there are different kinds of interactions and
translations between niches and regimes. Four archetypical transition pathways have been described
(Smith et al., 2005): transformation, technological substitution, reconfiguration, and de-alignment / re-
alignment.
Radical innovations which initially have a lot of variation may gradually stabilise into new dominant de-
sign. The general pattern how radical innovation breaks through is by a gradual process of cumulation of
niches (Geels, 2002). New user and market niches are established in response to changes in the soci-
otechnical landscape developments. New reconfiguration of the regime elements takes place gradually.

40
Adoption and diffusion of innovation requires often multiple changes in legislation, infrastructure, user
conventions, technical standards, work practices etc. Different actor groups including firms, universities
and research institutes, public authorities, public interest groups and users play significant roles in these
transformation processes. Their activities reproduce the elements and linkages of sociotechnical systems
(Geels, 2005).
What determines which radical innovation has the potential to become a new dominant design? One
key observation from historical case studies has been that a window of opportunity is opened up by ten-
sions in the sociotechnical regime or by shifts in the landscape (Geels, 2002). New technologies break out
from niches by riding along with growth in particular markets. However, often the new technology is adopt-
ed in parallel with the old one, leading to technological add-ons and hybridisation. Moreover, there are
specific periods of transition in which the downswing and depression is characterised by structural change
in the economy leading to transformation of the institutional and social framework (Freeman & Perez,
1988).
6.2 System transition in mobility
Traditionally, the drivers for transition in the transport sector have been most pressing with sustainability
challenges: reduction of carbon emissions, congestion, and noise, and health issues related to air quality.
From a technical point of view, there are various alternative technologies available (e.g. bio-based fuels,
electric vehicles) to enable transition from a system dominated by fossil fuel powered automobiles. How-
ever, major hurdlers have been experienced when diffusing these novel technologies. Also, various digital
technologies could enable more seamless travels, multi-modal transport, and more optimized use of
transport assets. Optimized multi-modal transport has the potential to contribute to improved service quali-
ty and reduction of the environmental footprint. However, initiating system level change has proved chal-
lenging. The transport system with its strong reliance on fixed physical infrastructure (roads, fuelling sta-
tions, rail network, ports etc.) and strong regulation is considered a relatively stable environment where
change is difficult to realize (Geerlings et al., 2009). The prevailing regime has powerful mechanisms to
sustain continuity, as exemplified by the case of the automotive industry (Wells & Nieuwenhuis, 2012).
The system transition approach has been used to analyse various historical shifts in the transportation
domain: from sailing ships to steamships, from horse-drawn carriages to automobiles, and from piston
engine aircraft to jetliners in aviation (Geels, 2002; Geels, 2005). Ongoing transformations towards ecolog-
ically sustainable transportation have also been modelled, such as the transition towards more sustainable
transportation with biogas energy (Fallde & Eklund, 2015). More general transition patterns towards sus-
tainable and low-carbon transportation have been presented by Geerlings et al. (2009) and Geels (2012).
Other interesting analysis of transitions in the transport domain – although not explicitly employing the
transition model as a framework – includes the emergence of a dominant global standard for shipping
containers, thus creating the modern maritime transport system (Levinson, 2006).
Sociotechnical systems consist of a cluster of elements including technology, regulation, user practices,
markets, cultural meanings, infrastructure, maintenance networks and supply chains (Geels, 2005). The
current sociotechnical system in personal transportation has been described by Geels (2002) in Figure 26.
Based on these studies, several interesting transition patterns have been observed in the transport sec-
tor. First, in the historic transition case from horse carriages to gasoline powered automobiles there was a
wider sociotechnical context which was more favourable to gasoline cars than to electric and steam pow-
ered automobiles. These context factors included fuel infrastructure, cultural values and maintenance
network (Geels, 2005). The transition did not take place in a uniform way in all market segments. Rather,
different types of automobiles were used for different niches and were not directly competing (Geels,
2005). Novelties thus emerge in niches, but their widespread diffusion depends on external circumstances.

41
Figure 26. Elements from the sociotechnical configuration in transportation (Geels, 2002).
More detailed dynamics have been observed for more recent transitions. In the case of the emergence of
hybrid and electric vehicles there were several waves of attempts to introduce the new hybrid-electric
powertrains on the market. Earlier attempts did not reach a critical size in order to be viable (Dijk & Yarime,
2010). For instance, the efforts of Renault and Peugeot did not attract a large enough volume to set rein-
forcing feedback mechanisms in place: increasing returns to scale, market learning and network effects
(Dijk & Yarime, 2010). It was only the initiatives of Toyota and Honda with their hybrid-electric engines that
were successful in scaling up the market niche to set these mechanisms in place. These examples high-
light the system dynamics of transition with reinforcing feedback mechanisms through economic scaling
and learning. Similar niche creation dynamics have been studied in the case of heavy hybrid-electric vehi-
cles, particularly by Volvo and Scania (Berggren et al., 2015; Sushandoyou & Magnusson, 2014).
A number of potential policy measures to trigger and orchestrate system transition toward desirable di-
rections have been identified. Early studies have emphasised the need to create compelling visions to
activate innovation as well as create arenas for adjusting interests and aligning expectations (Rotmans et
al., 2001). Policymakers can play a key role. Also, providing policy support for specific niche experiments
has been suggested (Schot & Geels, 2008; Sandén & Hillman, 2011). Providing protected spaces from
exposure to full market rules would allow for maturing of the technology and co-evolution with user practic-
es and regulatory structures.
More recently, borrowing from innovation policy studies, a variety of other policy instruments have been
suggested including demand side policies (public procurement, regulation, standardisation), supply side
policies (e.g. R&D grants, tax reliefs) as well as systemic policies (e.g. innovation platforms, knowledge
diffusion, foresight). Use of specific policy instruments should be sensitive to the stage of evolution in the
transition (Kivimaa & Kern, 2016).
The sociotechnical system transitions approach has mainly focused on technologies related to vehicle
engines and power. A principal motivator in these studies has been to understand how the current
transport system could be directed towards more environmentally sustainable technologies. Due to a
strong emphasis on environmental sustainability, there has been relatively little attention given to applica-

42
tion of information and communication technologies (with a brief analysis of the evolution of the vehicle
multi-service model (Pelkonen & Valovirta, 2011) being one exception). Nevertheless, the approach and its
key findings can be applied to study also the emergent transition of the transport sector towards digitally
enabled intelligent transport systems (ITS) and smart mobility. Particularly the system dynamic notions of
reinforcing mechanisms through feedback, learning, and economies of scale are important. One can as-
sume that these system characteristics are even more influential factors in the nascent ICT-driven trans-
formation towards smart mobility and ITS with their interlocking digital technologies and system interde-
pendencies.
While in this study it has not been possible to conduct a full scale review of all possible ways to influ-
ence the shaping of smart mobility markets, some observations can be made by applying the sociotech-
nical transition approach to the smart mobility domain. The following factors can be leveraged to acceler-
ate transition in the context of Finland: a strong skills-based business ecosystem related to ICT and mobile
communications technology; absence of powerful incumbent transport equipment industry such as auto-
motive manufacturing; public sector imperative to improve productivity under conditions of financial austeri-
ty; local demand conditions such as harsh winter to create new niche applications; emergence of disrupt-
ing players (e.g. Uber) to shake the regime status quo; product development aiming to respond early to
externally imposed regulation/deregulation (e.g. liberalization of bus traffic market by EU legislation); or
changing user preferences (e.g. decreasing interest in own private car and possessing a driving licence
among the younger generations).
These are examples of factors which can create momentum for change in the prevailing sociotechnical
regime, thus opening avenues for innovation, new niche applications, diffusion and eventually transition to
a new sociotechnical system configuration based on smart mobility. None of these factors is likely to be
sufficient to initiate a transition to smart mobility, but sensitivity to their importance and the ability to lever-
age them strategically can increase the likelihood of any transition occurring.

43
7. Ecosystem dynamics
Next, we move on to modelling the ecosystem dynamics and create an overall level synthesis of the eco-
system.
7.1 Dynamic model
In order to understand the underlying reasons for the possible transitions, it is important to understand the
dynamic nature of the ecosystem. System dynamics is a tool which can be used to describe and model
basic feedback structures that cause dynamic behaviour in a system. System dynamic diagrams depict the
feedback structure of a system with positive and negative causal links. A positive causal link indicates that
two variables change in the same direction (e.g. the more valuable a vehicle service is the more adoption),
whereas a negative causal link indicates that two variables change in opposite directions (e.g. the more
cost the less adoption). The causal links create feedback loops that can be either reinforcing (depicted by
the letter R) or balancing (depicted by the letter B in the following figures). Reinforcing loops have an even
number of negative links and create positive feedback that results in exponential increase or decrease.
Balancing loops in turn have an uneven number of negative links and create negative feedback that results
in goal seeking and balancing behaviour.
In order to create a growing ITS ecosystem, a critical mass of actors must be reached that leads to self-
sustaining growth. This chicken-and-egg problem can for example be observed for the ITS operators me-
diating the interaction between vehicle owners and service providers (e.g. usage based insurance, remote
diagnostics etc.).
Figure 27. Key dynamic loops for ITS operator platforms.
Figure 27 presents key reinforcing loops for ITS operator platforms. The reinforcing loop ‘Cross-side net-
work effect between vehicle owners and service providers’ shows how an increase in the number of veh i-
Number of serviceproviders using ITSoperator platform
Number of vehicle owners
using ITS operator platform
+
+
R
Word-of-mouthbetween service
providers
+
+
R
Value of ITS operator
platform for vehicle owners
+
Value of ITS operatorplatform for service
providers
+
Word-of-mouth
between vehicle owners
+
+
Word-of-mouth -
service providers
Cross-side network effectbetween vehicle owners and
service providers
Word-of-mouth -
vehicle owners
RPotential number of
service providers
-
+
Market saturation -
service providers
B
Potential number of
vehicle owners
-
+
B
Market saturation -
vehicle owners
Interoperability of ITS
operator platforms
Interoperability of ITS
operator platforms,
+
+

44
cle owners using the ITS operator platform leads to an increase in value of ITS operators for service pro-
viders. This in turn leads to an increase in the number of service providers using the ITS operator platform,
which leads to an increase in the value of the ITS operator platform for vehicle owners, which in turn leads
to an increased number of vehicle owners using the ITS operator platform and to a reinforcing process.
This reinforcing growth is also supported by word-of-mouth reinforcing (‘Word-of-mouth – vehicle own-
ers’ and ‘Word-of-mouth – service providers’) loops on both sides of the platform. Key balancing loops on
both sides that restrict growth are ‘Market saturation – vehicle owners’ and ‘Market saturation – service
providers’. The strength of these loops is reduced if interoperability between the ITS operators exists (e.g.
enforced with regulation), making it possible to create a larger market of interconnected rather than isolat-
ed platforms.
Figure 28 describes similar key reinforcing loops for MaaS operator platforms mediating the interaction
between end-users and transportation providers. The reinforcing loop ‘Cross-side network effect between
end-users and transportation providers’ shows how an increase in the number of end-users using the
MaaS operator platform leads to an increase in the value of the platform for transportation providers. This
in turn leads to an increase in the number of transportation providers using the MaaS operator platform,
leading to an increase in the value of the platform for end-users, which in turn leads to an increased num-
ber of end-users using the platform and to a reinforcing process.
Figure 28. Key dynamic loops for MaaS operator platforms.
This is also supported by word-of-mouth reinforcing loops on both sides of the platform (‘Word-of-mouth –
end-users’ and ‘Word-of-mouth – transportation providers’). Key balancing loops on both sides that restrict
growth are ‘Market saturation – vehicle owners’ and ‘Market saturation – service providers’. The strength of
these loops is reduced if interoperability between the MaaS operators exists (e.g. enforced with regula-
tion), making it possible to create a larger market of interconnected rather than isolated platforms.
Platform theory suggests that it is important to get positive momentum between user groups on both
sides of the platform. Regulators and large user groups (e.g. FTA, Trafi, and cities) can play a key role and
make the loops stronger by enforcing harmonization in regulation. The public sector can also become a
lead user and catalyse the market e.g. with public procurements.
Number of transportationproviders using MaaS
operator platform
Number of end-usersusing MaaS operator
platform
+
+
R
Word-of-mouth between
transportation providers
+
+
R
Value of MaaS operator
platform for end-users
+
Value of MaaS operatorplatform for transportation
providers
+
Word-of-mouth
between end-users
+
+
Word-of-mouth -transportation
providers
Cross-side network effectbetween end-users andtransportation providers
Word-of-mouth -
end-users
RPotential number of
transportation providers
-
+
Market saturation -
transportation providers
B
Potential number of
end-users
-
+
B
Market saturation -
end-users
Interoperability of MaaS
operator platforms
Interoperability of MaaS
operator platforms,
+
+

45
7.2 Synthesized ecosystem model
Finally, we present an overall level synthesis of the open ecosystem for smart mobility services. When
analysing different parts of the transport infrastructure and services, one can observe that the development
cycles vary considerably and that in some cases a more centralized approach is needed where the public
sector has a stronger role, whereas in others cases a decentralized approach is better.
Although it seems clear that there is a possibility to move towards more open structures with smart mo-
bility services, it can be argued that a large part of the transportation infrastructure and many of the corre-
sponding services still need to be produced in a more closed and centralised environment. One question is
to what degree should each of the four value system models be utilized and in which contexts.
A central question thus is how can these four models co-exist and interact? As a synthesis here we try
to conceptualize the above findings as a layered model, depicted in Figure 29. At the bottom are services
and infrastructure where significant economies of scale can be leveraged, and where it makes sense to
organize the service in a centralized manner by the public sector. Going upwards, as the lifecycle of the
infrastructure and services becomes shorter and the number of potential service providers increases, a
regulated oligopoly model or a network of smaller actors (e.g. SMEs) could be more efficient and create a
larger market of buyers and sellers (similar to the Internet). Finally, some services need to be specifically
tailored for individual citizens, households and enterprises.
Figure 29. From a closed model to a layered ecosystem model.
Thus, as a whole, it is very important to look at the bigger picture and to align activities with similar devel-
opment cycles, i.e. use a so-called systems thinking approach where one examines the linkages and inter-
actions of elements of the transportation system rather than individual details.

46
8. Policy recommendations
The role of public authorities in the transportation system is gradually shifting from controlling and operat-
ing key activities towards becoming an enabler for market-based services. The Traffic Lab program is
trying to stimulate the emergence of such open, market-based operating models. An important question is
what could be the role of Traffic Lab in the process of building such an open ecosystem (be it with a GSM
or an Internet model), and in particular, what kind of policies could be implemented by the public sector in
order to enable a transition towards more open operating models. Next, we give a short overview of the
first phase of the Traffic Lab program and make some recommendations for the next phase.
8.1 First phase of Traffic Lab
The first phase of traffic lab has focused on testing a new model for road charging for vehicles, at the same
time promoting market-based ITS operators that would provide services for vehicle owners and end-users.
The goal has been to test a model where the ITS operators could provide road charging data to the re-
sponsible public authority, in this case Trafi, on behalf of their customers (i.e. vehicle owners). During the
pilot, Trafi procured this information from actors that took on the role of ITS operators. In parallel to this,
FTA also procured data related to real-time traffic information (e.g. congestion and road weather condi-
tions). In addition to testing how road charging could work in practice, the goal has been to stimulate the
market, help ITS operators provide service packages with more attractive pricing, and in general catalyse
the market for end-user smart mobility services. The pilot has been implemented with a scalable model
where data can be procured from up to 60 000 vehicles.
Overall, the first phase of Traffic Lab and the first pilot have been successful in bringing many different
market actors together and in providing a new kind of discussion forum. Many events have been organized
where information has been disseminated, actors have been able to learn from each other, pose questions
and discuss potential solutions.
Although the number of actors that participated in the pilot was lower than expected, some actors that
actively took part in the road charging pilot have signed agreements with Trafi and FTA. What has also
been positive is that the tested road-charging model (i.e. where commercial ITS operators would collect
usage information) has proven to be technically feasible.
One reason for the low participation number could be that the services and overall market are still quite
immature, and there is rather limited market demand for the services (even at reduced prices). Also, the
schedule of the pilot was rather tight and many actors could not react within the given time frame. Fur-
thermore, uncertainty over the length of the road-charging pilot might have made some actors cautious,
since it was uncertain whether they could have grown their user bases and created commercially viable
services during this time frame. Privacy has also been an issue in some cases, with some actors not will-
ing to give out information about their customers. Some actors also stated that the costs of implementing
the required changes in their fleets outweighed the benefits.
In parallel to the road-charging pilot, other topics such as the development of public transportation, ac-
quirement of personal data on mobility patterns (so-called MyData) and Mobility-as-a-Service (MaaS) have
become important themes, and Traffic Lab has also facilitated discussion related to the development of
these topics. Especially MaaS has become an important issue, and the first phase of the Traffic Lab pro-
gram has provided a good framework for developing the MaaS operator model on a conceptual level.
MaaS is also likely to be a key issue in the next phase of the program.

47
8.2 Policy recommendations for the next phases
As it relates to the future phases of Traffic Lab, three core tools for market orchestration can be identified:
1. Stimulation of the market with public procurement,
2. New regulation models, and
3. Promotion of open interfaces and data.
Stimulation of the market with public procurement
Public procurements to stimulate the market have been the key tool in the first phase of Traffic Lab, and
could also be utilized in the next phase. In addition to road charging, public procurements could also be
used when stimulating the market around MaaS. For example, the government (e.g. Kela) and the munici-
palities could act as lead users of MaaS services, if dedicated transportation organized by the government
and municipalities (e.g. patient and school transportation) were to use the services of MaaS operators.
Overall, public procurement can be used in three principal ways. First, public authorities can trigger
market development by creating demand for new traffic data. Direct purchase of traffic data can trigger
production of new data sources and related technologies and delivery services. The viability of this ap-
proach is framed by the information needs of the public authority, and has limited scaling opportunities for
wider market creation. The second approach is to embed data interoperability requirements in major public
tenders (e.g. in contracted-out transport service provision) in order to promote emergence of open mar-
kets. While this is an effective instrument to shape the market, its application is constrained by market
readiness to provide interoperable solutions. Often a third option is needed, which is to execute pre-
commercial procurement in order to proactively influence development of new products and services
among suppliers on the market. This is the most strategic approach to public procurement, and should be
typically used in tandem with R&D projects, commercial stage procurements and other innovation support
measures.
New regulation models
New regulation models could also promote the transition to more open markets. Many services that are
currently organized with a centralized public sector driven model could gradually move towards a model
where the services are liberalized and provided by market actors, but where the public actors still regulate
the market and put conditions on market actors. Examples of such regulations could be obligations related
to service coverage and quality, or obligations to use open and harmonized technologies and interfaces in
order to enable the transmission of data between market actors and end-user choice.
These new regulation models could be developed and tested in the Traffic Lab program. Regulators of
the transportation system could utilize similar market-based regulation tools that e.g. the Finnish Commu-
nications Regulatory Authority (Ficora) is using in the mobile communications market. Legislation related
e.g. to mobile number portability could be a good reference point. Well-functioning oligopolies where com-
peting companies provide standardised basic services to end-users (similarly to e.g. mobile network opera-
tors) could also be benchmarked.
This could relate to new regulation models on a national level (e.g. by FTA and Trafi), but also on a local
level where the local public transportation authorities could take on the role of market regulator in their
areas (in addition to ELY centres). The regulation could also be harmonized across regions and even on
an international level, e.g. first with neighbouring countries in the Nordic-Baltic area (similarly to the way
radio spectrum regulation was harmonized throughout Europe and the Nordic countries, enabling the
emergence of the GSM ecosystem).
Furthermore, in many cases the existing strength of regulation could be lowered. The utilization of ICT
technologies enables market-based operating models that call for imposing looser regulation to some
permits. There are many cases where regulation could be made more flexible, and steps towards this are
already being taken. New regulation models could also be tested regionally. Overall, it is of major im-
portance to consider what the appropriate degree of regulation is for different services. Room for experi-
mentation is required for new solutions and service production models to emerge, and less rigid regulatory
boundaries can assist in conducting effective trials.

48
Promotion of open interfaces and data
Also the promotion and usage of open interfaces (APIs) and data can be a key tool in orchestrating an
open ecosystem. Promotion of the bottom-up type of operating models where also small actors such as
SMEs and end-users are able to quickly develop and test new services (so-called minimum viable prod-
ucts) is needed. Many public actors have already opened interfaces to key public sector controlled data-
bases, such as e.g. FTA providing open interfaces to road information and real-time traffic information,
Trafi providing information to vehicle data and the vehicle registry, and e.g. HRT providing APIs to its jour-
ney planner service.
Other resources for service creation could also be provided, such as financial support (e.g. together with
Tekes) and catalysing public procurements. Encouraging private actors to form voluntary interoperability
arrangements (e.g. form communities such as Ficix for Internet traffic exchange) and acting as a leading
partner in these arrangements could also be one way to stimulate markets. The public sector can also
provide support for developing, agreeing and deploying open standards that enable the development of
scalable new services and solutions also for international markets.

49
9. Summary
The deployment of Information and Communication Technologies (ICT) throughout the transportation
system is expected to significantly shape the current structures and operating models. Infrastructure, vehi-
cles and end-user handsets are becoming increasingly intelligent and instrumented with sensors and
broadband connectivity, which in turn enables a wide range of smart mobility services. This evolution trend
is also challenging the public sector to renew itself and create new policies and new ways to organize
services and regulate the market. In relation to this evolution trend, the Ministry of Transport and Commu-
nications has launched the Traffic Lab development program, the goal of which is to enable the creation of
an ecosystem of smart mobility services, and which has also provided a context for this study.
In this study we have used different modelling frameworks to analyse how the evolution towards an
open ecosystem model for smart mobility services could occur in Finland. Two evolution paths in particular
have been described, the first being a more centralized path where centrally controlled public services are
gradually liberalized, following possibly a similar evolutionary path to what took place in the evolution of 1st
and 2nd
generation mobile communications. The second is a more decentralized path, where fragmented
and isolated solutions are loosely coupled in a similar way to what occurred in the evolution of the Internet.
The role of the public sector in facilitating transformation towards smart mobility is manifold. It can direct
and accelerate the transition in multiple ways that need to be coordinated: regulation and de-regulation,
public procurement, provision of open traffic data and programming interfaces, support for standardisation,
offering demonstration and test sites, as well as financial support for innovation development, adoption
and diffusion. Innovative smart mobility services are eventually commercialised by firms, but the public
sector plays a significant role in shaping and accelerating it, thus providing the Finnish firms with a first
mover advantage in the fast developing global markets. Export-oriented companies need home market
references to be credible overseas.
What can be concluded is that in order for the smart mobility services to reach their full potential, many
changes are needed in current organizational structures and legislation. New collaboration models are
needed between the public and private sectors and between existing sub-sectors of the transport system
(e.g. public transport in terms of local public transport, long distance transport and private traffic). While it
remains uncertain how quickly these changes will eventually occur in full scale, it is evident that in such a
complex technical, economic, and social field as transportation the upscaling of smart mobility solutions
requires multiple points of intervention and is not likely to emerge by market forces alone.

50
References
Ali-Vehmas, T. and Casey, T.R. (2012). Evolution of wireless access provisioning: A systems thinking
approach. Competition and Regulation in Network Industries 13 (4), 333–361.
Berggren, C., Magnusson, T. and Sushandoyo, D. (2015). Transition pathways revisited: established firms
as multi-level actors in the heavy vehicle industry. Research Policy 44, 1017–1028.
Casey, T.R. (2013). Evolution of wireless access provisioning: Understanding and managing value system
structures and dynamics. Aalto University.
Dijk, M. and Yarime, M. (2010). The emergence of hybrid-electric cars: innovation path creation through
co-evolution of supply and demand. Technological Forecasting & Social Change 77, 1371–1390.
Fallde, M. and Eklund, M. (2015). Towards a sustainable socio-technical system of biogas for transport:
the case of the city of Linköping in Sweden. Journal of Cleaner Production 98, 17-28.
Freeman, C. and Perez, C. (1988). Structural crises of adjustment, business cycles and investment behav-
iour. In Dosi, G., Freeman, C., Nelson, R., Silverberg, G., Soete, L. (eds.) Technical change and
economic theory. Pinter Publishers, London & New York. pp. 38-66.
Gee, S. and Uyarra, E. (2013). A role for public procurement in system innovation: the transformation of
the Greater Manchester (UK) waste system. Technology Analysis & Strategic Management 25
(10), 1175–1188.
Geels, F. (2002). Technological transitions as evolutionary configuration processes: a multi-level perspec-
tive and a case study. Research Policy 31, 1257–1274.
Geels, F. (2005). The dynamics of transitions in sociotechnical systems: A multi-level analysis of the transi-
tion pathway from horse-drawn carriages to automobiles (1860–1930). Technology Analysis &
Strategic Management 17 (4), 445–476.
Geels, F. (2012). A sociotechnical analysis of low-carbon transitions: introducing the multi-level perspec-
tive into transport studies. Journal of Transport Geography 24, 471–482.
Geels, F.W. and Schot, J. (2007). Typology of sociotechnical transition pathways. Research Policy 36,
399–417.
Geerlings, H., Lohuis, J., Wiegmans, B. and Willemsen, A. (2009). A renaissance in understanding tech-
nology dynamics? The emerging concept of transition management in transportation. Transporta-
tion Planning and Technology 23 (5), 401–422.
Heikkilä, S. (2014). Mobility as a Service – A Proposal for Action for the Public Administration Case Hel-
sinki. Master’s Thesis, Aalto University. (Available from:
https://aaltodoc.aalto.fi/bitstream/handle/123456789/13133/master_Heikkil%C3%A4_Sonja_2014
.pdf?sequence=1)

51
Heino, I., Pihlajamaa, O. and Vilkman, A. (2013). Multi-Service Architecture for mobility services. Project
report. (Available from: http://www.vtt.fi/inf/pdf/technology/2013/T142.pdf)
Helsingin kaupunkisuunnitteluvirasto (2013). Älyliikenne Helsingissä. Helsingin kaupunkisuunnitteluviras-
ton liikennesuunnitteluosaston selvityksiä 2013:3. (Available from:
http://www.hel.fi/hel2/ksv/julkaisut/los_2013-3.pdf)
Kivimaa, P. and Kern, F. (2016). Creative destruction or mere niche support? Innovation policy mixes for
sustainability transitions. Research Policy 45, 205–217.
Kivisaari, S., Lovio, R. and Väyrynen, E. (2004). Managing experiments for transition: examples of societal
embedding in energy and health care sectors. In Elzen, B., Geels, F. and Green, K. (eds.) Sys-
tem innovation and the transition to sustainability: theory, evidence and policy. Cornwall: Edward
Elgar.
Kwon, T. (2012). Strategic niche management of alternative fuel vehicles: A system dynamics model of the
policy effect. Technological Forecasting and Social Change 79 (9), 1672–1680.
Levinson, M. (2006). The box: how the shipping container made the world smaller and the world economy
bigger. Princeton, N.J.: Princeton University Press.
Leviäkangas, P. (2011). Building value in ITS services by analysing information service supply chains and
value attributes. International Journal of Intelligent Transportation Systems Research 9 (2), 47–
54.
Leviäkangas, P., Zulkarnain, Z. and Roine, M. (2012). The Finnish ITS market size and structure – a mi-
croeconomic approach. 19th ITS World Congress 2012, Vienna Austria, 22–26 Oct. 2012.
Linturi, R. and Kuittinen, O. (2014). Liikennetiedon visiot. Liikenneviraston tutkimuksia ja selvityksiä
42/2014. (Available from: http://www2.liikennevirasto.fi/julkaisut/pdf8/lts_2014-
42_liikennetiedon_visiot_web.pdf)
Ollila, J., Murto, R. and Suvanto, T. (2013). Oikeudenmukaista ja älykästä liikennettä. Työryhmän loppura-
portti. Liikenne- ja viestintäministeriön julkaisuja 37/2013. (Available from:
https://www.lvm.fi/docs/fi/2497123_DLFE-22565.pdf)
Pelkonen, A. and Valovirta, V. (2011). Älyliikenteen monipalvelumalli systeemisen innovaation aihiona. In
Valovirta, V., Nieminen, M., Pelkonen, A., Turkama, P., Heikura, T., Lindman, J., Inkinen, S. and
Kaivo-oja, J. Systeemisen muutoksen haasteet ja innovaatiotoiminnan mahdollisuudet (Finnish,
summary in English). Helsinki: Tekes.
Pilli-Sihvola, E., Vilkman, A. and Hautala, R. (2011). The future of commercial location-based services in
ITS – on-line on the move. In Proceedings 18th ITS World Congress, Orlando.
Poikola, A., Kuikkaniemi, K. and Honko, H. (2015). MyData – A Nordic Model for human-centered personal data
management and processing, Publications of Ministry of Transport and Communications, 03/2015.
(Available from: http://www.lvm.fi/c/document_library/get_file?folderId=3759139&name=DLFE-
27119.pdf&title=MyData-nordic-model)
Rotmans, J., Kemp, R. and van Asselt, M. (2001). More evolution than revolution: transition management in
public policy. Foresight 3 (1), 1-17.
Sandén, B. and Hillman, K. (2011). A framework for analysis of multi-mode interaction among technologies
with examples from the history of alternative transport fuels in Sweden. Research Policy 40, 403–
414.

52
Schot, J. and Geels, F. (2008). Strategic niche management and sustainable innovation journeys: theory,
findings, research agenda, and policy. Technology Analysis & Strategic Management 20 (5),
537–554.
Smith, A., Stirling, A. and Berkhout, F. (2005). The governance of sustainable sociotechnical transitions.
Research Policy 34, 1491–1510.
Sushandoyou, D. and Magnusson, T. (2014). Strategic niche management from a business perspective:
taking cleaner vehicles from prototype to series production. Journal of Cleaner Production 74,
17–26.
Wells, P. and Nieuwenhuis, P. (2012). Transition failure: understanding continuity in the automotive indus-
try. Technological Forecasting & Social Change 79, 1681–1692.
Series title and number
VTT Technology 255
Title Towards an open ecosystem model for smart mobility services The case of Finland
Author(s) Thomas Casey & Ville Valovirta
Abstract The deployment of Information and Communication Technologies (ICT) throughout the transportation system is expected to significantly shape the current structures and operating models. Infrastructure, vehicles and end-user handsets are becoming increasingly intelligent and instrumented with sensors and broadband connectivity, which in turn enables a wide range of smart mobility services. This evolution trend is also challenging the public sector to renew itself and create new policies, new ways to organize services and regulate the market. In relation to this evolution trend, the Ministry of Transport and Communications has launched the Traffic Lab development program the goal of which is to enable the creation of an ecosystem of smart mobility services, and which also provides a context for this study. In this study we use different modelling frameworks to analyse how the evolution towards an open ecosystem model for smart mobility services could occur in Finland. Two evolution paths in particular are described, the first being a more centralized path where centrally controlled public services are gradually liberalized, following possibly a similar evolutionary path what took place in the evolution of 1st and 2nd generation mobile communications. The second is a more decentralized path, where fragmented and isolated solutions are loosely coupled in a similar manner to that which occurred in the evolution of the Internet. In order for smart mobility services to reach their full potential, many changes are needed in current organizational structures and legislation. New collaboration models are needed between the public and private sectors and between existing sub-sectors of the transport system. While it remains uncertain how quickly these changes will eventually occur in full scale, it is evident that the upscaling of smart mobility solutions requires multiple points of intervention and is not likely to emerge by market forces alone.
ISBN, ISSN, URN ISBN 978-951-38-8408-6 (URL: http://www.vttresearch.com/impact/publications) ISSN-L 2242-1211 ISSN 2242-122X (Online) http://urn.fi/URN:ISBN:978-951-38-8408-6
Date March 2016
Language English, Finnish abstract
Pages 52 p.
Name of the project Liikenteen sähköiset palvelut -tutkimus
Commissioned by Tekes, FTA, Trafi, MinTC
Keywords Smart mobility, value network, systemic transition
Publisher VTT Technical Research Centre of Finland Ltd P.O. Box 1000, FI-02044 VTT, Finland, Tel. 020 722 111

Julkaisun sarja ja numero
VTT Technology 255
Nimeke Kohti avointa älykkään liikkumisen ekosysteemiä Tekijä(t) Thomas Casey & Ville Valovirta
Tiivistelmä Tieto- ja viestintätekniikan hyödyntäminen lisääntyy kiihtyvää vauhtia koko liikennejärjestelmässä, ja sen odotetaan tulevaisuudessa muokkaavan merkittävästi nykyisiä rakenteita ja toimintamalleja. Liikenneinfrastruktuurin ja ajoneuvojen digitalisoituminen mahdollistaa uudenlaisia älykkään liikkumisen palveluja ja luo pohjan uudelle liiketoiminnalle. Kehitys haastaa myös julkista sektoria uudistumaan ja luomaan uusia tapoja järjestää palveluja ja edistää markkinoiden syntymistä. Tähän muutokseen liittyen liikenne- ja viestintäministeriö on käynnistänyt Liikennelabra-ohjelman, jossa tavoitteena on mahdollistaa älykkäiden liikkumispalveluiden ekosysteemin syntyminen. Tässä raportissa hyödynnetään erilaisia mallinnusmenetelmiä ja pyritään kuvaamaan sitä, miten kehitys kohti avointa älykkäiden liikkumispalveluiden ekosysteemiä voisi tapahtua Suomessa. Raportissa kuvataan erityisesti kaksi kehityspolkua, joista ensimmäinen on keskitetympi ja jälkimmäinen hajautetumpi. Keskitetymmässä kehityspolussa julkisia liikennepalveluja vapautetaan asteittain samaan tapaan kuin 1. ja 2. sukupolven matkapuhelinverkoissa. Hajautetummassa kehityspolussa eristyksissä olevista, sirpaloituneista palveluista muodostuu löyhästi kytkeytynyt avoin verkosto, jossa mallina käytetään avoimen internetin kehittymistä. Jotta älykkään liikkumisen palvelut saavuttaisivat täyden potentiaalinsa, tarvitaan useita muutoksia nykyisiin organisaatiorakenteisiin sekä lainsäädäntöön, mm. yhteistyömalleja julkisen ja yksityisen sektorin välille.
ISBN, ISSN, URN ISBN 978-951-38-8408-6 (URL: http://www.vtt.fi/julkaisut) ISSN-L 2242-1211 ISSN 2242-122X (Verkkojulkaisu) http://urn.fi/URN:ISBN:978-951-38-8408-6
Julkaisuaika Maaliskuu 2016
Kieli Englanti, suomenkielinen tiivistelmä
Sivumäärä 52 s.
Projektin nimi Liikenteen sähköiset palvelut -tutkimus
Rahoittajat Tekes, Liikennevirasto, Trafi, LVM
Avainsanat Älyliikenne, arvoverkko, systeeminen muutos
Julkaisija Teknologian tutkimuskeskus VTT Oy PL 1000, 02044 VTT, puh. 020 722 111

Towards an open ecosystem model for smart mobility services The case of Finland
ISBN 978-951-38-8408-6 (URL: http://www.vttresearch.com/impact/publications) ISSN-L 2242-1211 ISSN 2242-122X (Online) http://urn.fi/URN:ISBN:978-951-38-8408-6
VT
T T
EC
HN
OL
OG
Y 2
55
Tow
ard
s an
op
en
ec
osyste
m m
od
el fo
r...
•VISIONS•S
CIE
NC
E•T
ECHNOLOGY•R
ES
EA
RC
HHIGHLIGHTS
255
Towards an open ecosystem model for smart mobility services The case of Finland Thomas Casey | Ville Valovirta