tractive effort of steam locomotives (locomotive ratios—ii)cybra.p.lodz.pl › content › 6334...
TRANSCRIPT
RR-56-6
T ractive E ffo rt of S team Locom otives (Locomotive R atios— II)
By A. I. LIPETZ,1 SCHENECTADY, N. Y.
In a p a p er ,2 p resen ted before t h e A .S .M .E ., D ecem b er , 1932, th e a u th o r develop ed c o n s ta n ts for a n ew m e th o d o f figurin g horsepow er a n d tra ctiv e effort o f s te a m lo c o m o tiv es based o n b o iler ev a p o ra tio n a n d n u m b e r o f r ev o lu t io n s o f th e driv in g w h ee ls for u se in c o n n e c t io n w ith m o d ern lo co m o tiv es . T h is m e th o d w a s verified o n a n u m b er o f lo co m o tiv es , for w h ic h i t gave a c cu ra te r e su lts in a ccord an ce w ith te s t d a ta .
I n th e p resen t p ap er t h e a u th o r d isc u sse s t h e in flu e n c e o f th e size o f cy lin d ers a n d sh o w s th a t for lo co m o tiv es w ith cer ta in p ro p o rtio n s b e tw e en b o iler a n d c y lin d er d im e n sio n s m o d ifica tio n s o f p rev io u sly r ec o m m en d e d fa c to rs are n ecessa ry . T h ese m o d ifica tio n s are verified fo r a n u m b er o f lo co m o tiv es w ith c o m p a ra tiv e ly large cy lin d ers. In c o n c lu s io n h e d ev e lo p s a c o n v e n ie n t fo r m u la b a sed o n b o th b o iler ev a p o ra tio n a n d c y lin d er d im e n s io n s , a p p lica b le to a ll m o d e r n lo co m o tiv es , w h eth er o f th e lo n g - or lim ite d c u t-o ff ty p e (w ith sm a ll or large cy lin d ers).
I n t r o d u c t io n a n d R e c a p it u l a t io n
IN HIS paper presented at the Annual Meeting, New York, N. Y., Dec. 5-9, 1932, of The American Society of Mechanical Engineers, the author of the present paper suggested a
method of evaluating horsepowers and tractive efforts of steam locomotives by means of certain moduli, which he designated
1 Consulting Engineer, American Locomotive Company. Nonresident professor, Purdue University. Mem. A.S.M.E. Mr. Lipetz was educated a t the Warsaw (Poland) Polytechnic Institu te, from which he received the degree of Engineer Technologist (mechanical engineer) of the first grade in 1902. In 1903 he entered railway service in Russia as an apprentice on the Moscow-Kiev- Voronesh Railway, later serving as fireman, locomotive driver, inspector, and assistant m aster mechanic. From 1906 to 1909 he was assistant professor of thermodynamics and railway mechanical engineering a t the Kiev Polytechnic Institu te , also passing examinations preliminary to degree of Doctor of Engineering. For three years he held administrative positions on the Tashkent Railway, and for the three years following was chief of the locomotive departm ent, Ministry of Railways, Russia. From 1915 to 1920 he served the Russian Railways in the United States, first as representative of the Russian Ministry of Railways and then as assistant chief and, later, chief of the Russian Mission of W ays of Communications in the United States. Since 1920 he has been connected with the American Locomotive Company, first as European representative a t Paris, and since 1925 as consulting engineer a t Schenectady, N. Y. Since 1927 he has also been non-resident professor of locomotive engineering a t Purdue University. He was granted a num ber of early patents on Diesel locomotives and was the designer of the Russian Decapod locomotives of the war period. He is the author of m any papers on steam and Diesel locomotives, and was the reporter for America on locomotives of new type3 a t the International Railway Congress held a t M adrid, Spain, in 1930.
2 A.S.M.E. Trans., vol. 55, 1933, paper RR-55-2.Contributed by the Railroad Division and presented a t the An
nual Meeting, New York, N. Y., December 3 to 7 , 1934, of T h e A m e r i c a n S o c i e t y o f M e c h a n i c a l E n g i n e e r s .
Discussion of this paper should be addressed to the Secretary, A.S.M.E., 29 W est 39th Street, New York, N. Y., and will be accepted until February 11, 1935, for publication in a later issue of Transactions.
N ote: Statem ents and opinions advanced in papers are to be understood as individual expressions of their authors, and not those of the Society.
in whichEc = the Cole boiler evaporation determined by the Ameri
can Locomotive Company’s Handbook, Edition of 1917, p. 59, with additions as given in Tables 8 and 9 of the 1932 paper
D = the diameter of driving wheels, in inches Mi — a modulus, the values of which can be taken from a
table given in the paper and reproduced here (Table 1).T A B L E 1
Revolutions per minute (w)............... 50 100 150 200 250Locomotives with feedwater heaters:
Modulus Mp X 1000...................... 26.0 43.1 52.0 54.0 51.0Modulus Mt .................................... 65.6 54.4 43.7 34.1 25.7
Locomotives without feedwater heaters:Modulus Mp X 1000...................... 24.3 40.3 48.6 50.5 47.7Modulus Mt .................................... 61.3 50.8 40.8 31.8 24.0
For horsepower P% a corresponding formula was: proposed,
in whichn = the number of revolutions per minuteS = the train speed of the locomotive in miles per hour.
In the present paper only tractive efforts will be considered for the reason that horsepowers can always be figured on the basis of formula [3], if tractive efforts are known, or on the basis of formulas [2] and [4].3
The discussion which followed the presentation and publication of the paper was, on the one hand, gratifying in that it showed the interest of railroad engineers in the subject, and, on the other hand, was interesting from the point of view of the practicability of the recommended method. A number of discussers agreed that the new method was practical and was giving reliable results, although some thought that it was losing the simplicity of the Cole method.
Especially interesting was the contribution made by H. S. Vincent, which was to the effect that an algebraic formula, representing a modification of the formula previously suggested by W. P. Kiesel, would give more accurate results in application to certain types of locomotives which the author did not consider
3 For speeds n no t given in Table 1, moduli M t and M v can be figured on the basis of formulas [14] and [15], and Figs. 3 and 5, of the 1932 paper.
923
as the method of 1932. It was recommended that for indicated tractive effort T> the following formula be used:
namely
with modulus Mp, also given in a table of the paper. (See Table 1.) The latter formula was necessarily dependent upon formula [1 ] in accordance with the known relation
which meant that moduli Mt and Mp were interconnected by a formula

924 TRANSACTIONS OF THE AMERICAN SOCIETY OF MECHANICAL ENGINEERS
in his paper for the reason that he had no information on these locomotives.*
In analyzing this question the author found that the fact that the 1932 method had given such good coincidence in a great number of cases, while in some enumerated by Mr. Vincent, it did not, was due to two reasons: First, to the fact that in the latter cases, when comparisons between locomotives were made, the rates of the utilization of the boiler, commonly known as “boiler forcing,” and the locomotive efficiencies were different from what they were supposed to be according to the 1932 method; and second, to the difference in the ratios between boiler and cylinder dimensions. It turned out that the modern locomotives for which data were available and which the author took as a basis for his theory all had a rather high ratio of heating surface in square feet to the total volume of all simple-expansion cylinders in cubic feet, varying from 240 to 280, while the locomotives analyzed by Mr. Vincent had comparatively large cylinders (some of the locomotives being of the so-called “limited cut-off type”) and low ratios of heating surface to cylinder volume, which fluctuated between 170 and 220. Therefore, the author found it necessary to consider a new variable—that of the cylinder volume—if all types of locomotives are to be covered by one method for figuring tractive effort.
The influence of these two causes will be discussed in the present paper, the necessary conclusions will be drawn, and new recommendations, designated as those of 1934, made. In the 1932 paper the soundness of the method was verified by applying it to six modern locomotives for which test data were available. The locomotives were the following:
New York Central, 4-6-4 (Class J-la)New York Central, 4-8-2 (Class L-2)Lehigh Valley, 4-8-4 (Class 5100)Lehigh Valley, 4-8-4 (Class 5200)Timken locomotive, 4-8-4 (No. 1111)Boston & Albany, 2-8-4 (Class A-l)
The curves according to the method, in comparison with the test curves, called performance curves, were shown on pages 14, 15, and 34 of the paper and printed discussions.2 The curves were plotted on the basis of data obtained from road tests, which, in the opinion of the author, better represent every-day locomotive performance. It will be shown in this paper that the new (1934) recommendations do not alter materially the 1932 curves and do not disturb the agreement between them and the per- formance-test curves. On the other hand, all the large-size- cylinder locomotives, reviewed by Mr. Vincent in his discussion of the author’s 1932 paper, as well as in his subsequent article in the Railway Mechanical Engineer, will be examined in the present paper together with other locomotives on which data had become available lately. These locomotives are:
Missouri Pacific, 2-8-2 (3-cylinder)Texas & Pacific, 2-10-4 (Class 1-1)Texas & Pacific, 2-10-2 (Class G-lb)Atchison, Topeka & Santa Fe, 2-10-4 (No. 5000) Pennsylvania R.R., 2-10-0 (Class I-ls)German State Railways, 4-6-2 (No. 01021)German State Railways, 2-8-0 (No. 562131)German State Railways, 2-10-0 (No. 43001)
It was also shown in the 1932 paper that it is practically impossible to offer a theoretical formula for the tractive effort of a locomotive based on scientific premises. Even if a theory
4 Subsequently, Mr. Vincent published an article in the November and December, 1933, issues of the Railway Mechanical Engineer, pp. 390 and 429, in which further examples of the application of his formula were given.
could embrace satisfactorily all relations between various phenomena that take place in a locomotive, the formula would have to be adjusted afterward on the basis of test data; in other words, the formula must necessarily be empirical. The author, in his previous paper, pointed out the reasons for an empirical method based on boiler evaporation, rather than cylinder dimensions. The modifications which are offered in this paper still have the underlying basis of boiler evaporation as the source of locomotive power. However, it will be shown that, if desired, an empirical formula for the locomotive tractive effort can be devised, which, although not quite accurate, may be useful for practical purposes and satisfy the tastes of engineers who prefer formulas to charts.
R o a d a n d S t a t io n a r y L o c o m o t iv e T e s t s
It was brought out during the discussions of the 1932 paper and in the author’s closure that the performance tractive effort according to the suggested method should not be considered as the maximum possible tractive effort. When the locomotive is in perfect condition and is tested under constant conditions of work—cut-off, speed, load—the test will show higher figures than when the regular road locomotive is tested with a commercial train on an undulated profile and at variable conditions of work. This is especially true for this country, where locomotives are tested with regular revenue trains, although it is not true that under no conditions can road tests yield accurate data. In other countries methods have been worked out with the object of holding the load and speed constant on an undulated profile. In this country no special methods are in use, except only that inaccuracies introduced by acceleration and grade resistance are taken into account and proper corrections are made. Furthermore, in some cases, a more or less uniform profile is chosen, at least for a considerable portion of the test run, and observations at intervals as short as possible are usually made.
Especially, the American methods of testing locomotives can-, not be used for figuring water consumption per unit of work, or locomotive efficiencies, because the figures which are obtained for water or coal consumption are known only for the whole run and necessarily must be of an average character. However, in so far as the average tractive efforts and speeds during the short intervals referred to are concerned, the American road methods are fairly accurate, if the necessary corrections for grade and acceleration are made, although necessarily they are lower than the stationary-plant test data. The average tractive efforts and speeds obtained during these short intervals, ordinarily of five-minute duration, form the basis of the performance tractive- effort curve.
In stationary tests, on the other hand, higher figures are being obtained for the reason that the tests are made under constant load and speed conditions and under the supervision of skilful engineers specially trained for testing locomotives at a stationary plant. The limit of power can, under these conditions, be easily reached, which is not always possible to get from the average crew under every-day operating conditions in regular road service. Therefore, it is natural that stationary tests will show higher figures than road performance tests. They will approach the so-called capacity test figures, which are usually about 20 to 25 per cent higher than performance figures, as can be seen from Figs. 10 and 11, pages 14 and 34, of the 1932 paper.* Consequently, when locomotives are compared, either one method of testing (stationary plant), or the other method (road tests), should be used. When data from both stationary and road tests are compared and conclusions are drawn, only confusion can result.
A very good illustration of the difference between the tractive- effort curve according to the 1932 method and the corresponding
RAILROADS RR-56-6 925
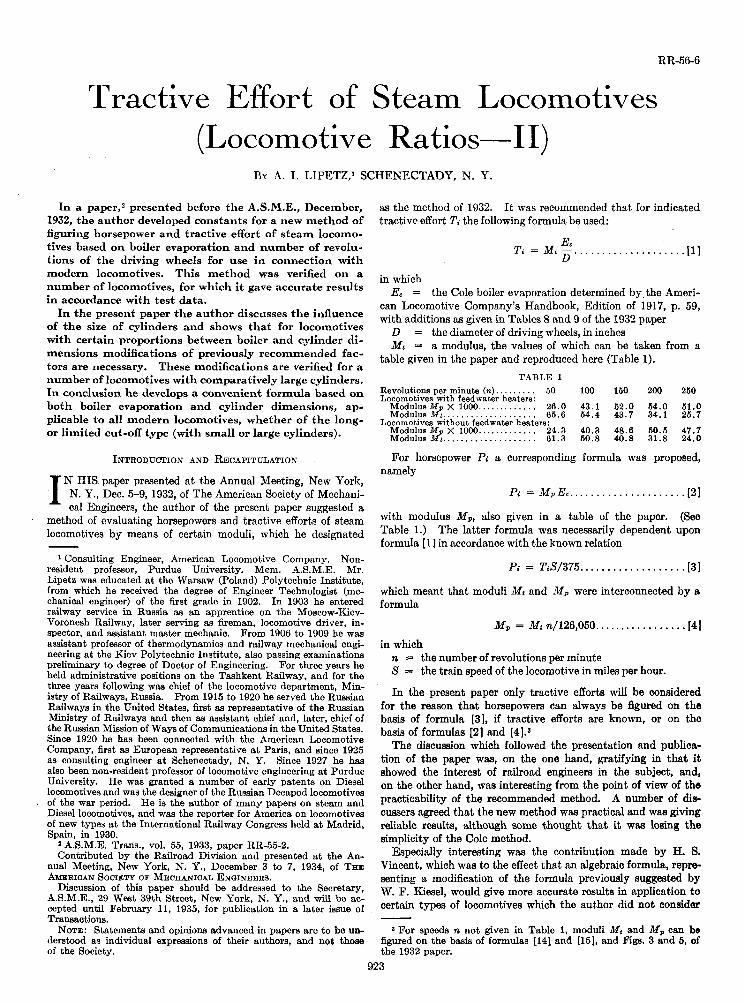
test curve is offered by the Pennsylvania Railroad 4-8-4 locomotive, Class M. The first engine of this class built (No. 4700), had two 27 by 30-in. cylinders, 72-in. driving wheels, 250-lb working pressure, a boiler with 114 2V4-in. tubes and 200 3lA-in. flues, type E superheater, and a feedwater heater. The evaporative heating surface of the locomotive (water side) was 4904 sq ft. The locomotive was thoroughly tested at the Altoona testing plant in 1924 and the tests were not all that the railroad desired. The boiler was redesigned and the number of tubes was changed; 120 2 y 4-in. tubes and 170 3Virin. flues were applied, the steam space was raised, and the total evaporative heating surface (water side) was reduced to 4696 sq ft. The machinery remained substantially the same. I t became known as the M-l class. A locomotive of this class, No. 6872, was tested at the Altoona stationary plant in 1929. The highest tractive effort figures obtained at these tests are shown in Fig. 1 by dots, with corresponding test numbers.5 The test dots are connected in one continuous line marked A. The 1932 curve is also drawn in Fig. 1.
The discrepancy between these two curves is very pronounced: At low speeds it amounts to 21 per cent; a t high speeds to 36 per cent. However, it would not be fair to compare these two curves and to blame the 1932 method, because the two curves are of different character. The 1932 curve is the 'performance curve which would be safe to expect in ordinary road service of this locomotive, while the Altoona curve is the maximum test curve which can be obtained when the locomotive is working at its limit of capacity, under the best possible test conditions and under the supervision of specially trained skilled experimenters. The main difference between these two curves will be clearer if the efficiencies are considered.
The 1932 curves were based on the performance data of the New York Central J-l and L-2 locomotives and on similar data of other locomotives, already enumerated. Under the more or less constant conditions of work the New York Central test reports showed fuel consumptions which correspond to an overall thermal efficiency of about 6 per cent. This represents a normal locomotive utilization when the power is not pushed to the limit. The high points obtained during stationary tests indicate different conditions. The overall thermal efficiencies of the M -l locomotive from the Altoona tests are shown in Fig. 1 for every test separately. They are also repeated in Table 2, which shows that the average overall efficiency of the locomotive, when worked at the highest tractive-effort curve, is only 4.16 per cent. This figure is underlined in Fig. 1. The corresponding boiler efficiencies, when the locomotive is worked very hard and the boiler is forced, are also given in Table 2.
TABLE 2 EFFICIENCIES, LOCOMOTIVE M-l, NO. 6872Overall efficiency, Boiler efficiency,
Test No. per cent per cent161-A 3.8 52.5181-A 4.2 51.3157-A 3.7 46.6167-A 3.7 42.1151-A 4.3 48.1178-A 4.8 50.7173-A 4.6 51.5Average 4.16 49.0
In order to verify whether the 1932 curve corresponds to a higher efficiency, all the remaining tests, outside of the high- point tests of the locomotive, were analyzed. Tests with tractive efforts of values close to those represented by the 1932 curve gave efficiencies from 4.7 to 6.1 per cent. In Fig. 1 the averages
* The test report on locomotive M-l has not yet been made public, and the data given in this paper became available through the courtesy of W. F. Kiesel, mechanical engineer of The Pennsylvania Railroad. They are published here by his special permission, for which the author is grateful.
of all tractive efforts, except the highest, for every speed used at the tests, are represented by dots in circles. The underlined figures a t these points represent the averages of overall efficiencies in per cent for these tests (i.e., all tests at a certain speed except that with the highest tractive effort). I t can be seen that these averages vary from 4.5 to 5.8 per cent. The 1932 curve corresponds probably to a 5.5 per cent efficiency, as compared with the 4.16 per cent efficiency of the test curve. This accounts for the difference between the curves.
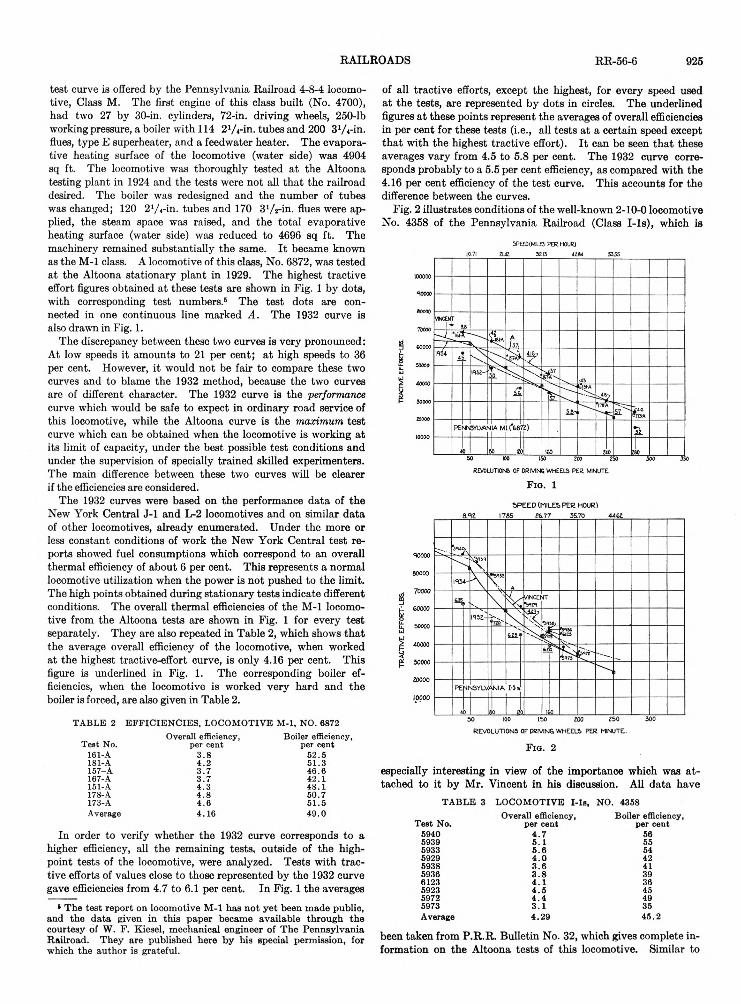
Fig. 2 illustrates conditions of the well-known 2-10-0 locomotive No. 4358 of the Pennsylvania Railroad (Class I-ls), which is
especially interesting in view of the importance which was a ttached to it by Mr. Vincent in his discussion. All data have
TABLE 3 LOCOMOTIVE I-ls, NO. 4358
Test No.Overall efficiency,
per centBoiler efficiency,
per cent5940 4.7 565939 5.1 555933 5.6 545929 4.0 425938 3.6 415936 3.8 396123 4.1 365923 4.5 455972 4.4 495973 3.1 35Average 4.29 45.2
been taken from P.R.R. Bulletin No. 32, which gives complete information on the Altoona tests of this locomotive. Similar to

926 TRANSACTIONS OF THE AMERICAN SOCIETY OF MECHANICAL ENGINEERS
Fig. 1, the highest points have been connected by a continuous dotted line A. The numbers on the chart a t the various points represent the test numbers. The average overall efficiency of the locomotive is only 4.29 per cent. The individual test values of overall efficiency and boiler efficiency were given in the author’s closure to his 1932 paper2 (Table 19, p. 36). They are repeated here in Table 3.
I t is interesting to note how close the averages of overall and boiler efficiencies of locomotives M -l and I-ls (Tables 2 and 3) are. Both locomotives were tested at Altoona at an interval of about fifteen years.
On the same chart the 1932 curve is shown. The points marked by dots in circles represent, as in the previous case, the
average tractive efforts of all tests, except the highest, at a certain speed, recorded at the Altoona tests. The underlined figures are the average efficiencies of all the tests represented by the corresponding tractive-effort point. I t can be seen that these efficiencies vary from 6.20 to 7.20 per cent, as compared with 4.29 per cent for the maximum tractive-effort curve.
In order to make the charts complete, the Vincent curves are also plotted.
In addition to the two main reasons, namely, the extreme forcing of the boiler to its limit, and the advantages of stationary tests, the differences between road and stationary plant tractive efforts are also sometimes due to the difference in locomotive design in general, and in the drafting arrangements in particular, but the two reasons cited are the most important and can explain the disagreements which are found between tractive-effort curves when a comparison of curves of different nature is made.
This does not mean, however, that high tractive efforts with forcing of the boiler and low efficiencies cannot be obtained during road tests and even regular road performance. If the necessity arises, the engineer will be able to force his boiler to the limit and get high tractive efforts. In other words, in many cases points between the 1932 curve and a curve lying from 25 to 35 per cent higher can be obtained if needed, and any curve lying between these two curves may in these cases represent a tractive-effort curve of the locomotive. However, it would not be wise to figure the performance of a locomotive on the basis of such a curve, just as the rated horsepower of a stationary steam engine or Diesel engine is never considered to be the possible overload capacity. For comparing locomotives it is, therefore, more advisable to accept as a basis a performance curve corresponding to about 6 per cent overall efficiency, rather than a curve with points of 4 per cent efficiency and less.
These considerations are forcibly brought out in the question
of tractive efforts at very low speeds. On Fig. 3 a tractive- effort chart of a modern locomotive with sufficient boiler capacity is shown. As an illustration, the Lehigh Valley locomotive No. 5100 has been taken, and the 1932 curve the performance curve found from road tests, and the Cole curve have been plotted. The chart is identical with Figs. 14 and 14-A of the author’s previous paper. I t can be seen that for this locomotive all three curves intersect the rated-tractive-effort (horizontal) line at a rotative speed of 50 rpm, or a piston speed of 250 ft per min, or a track speed of about 10 mph. The Cole curve intersects the rated tractive effort at a piston speed of exactly 250 ft per min because the construction of this curve insures that. In other charts, which were shown in the author’s 1932 paper, the intersections of these curves were approximately the same, although in some cases they were slightly switched to the left or to the right.
I t is the opinion of the author that a locomotive has sufficient boiler capacity if the 1932 tractive-effort curve, plotted on the basis of boiler evaporation Ec, intersects the horizontal rated- tractive-effort line at 50 rpm, and that, if the intersection lies at a lower speed, the boiler has insufficient capacity. The author would suggest calling a boiler assuring such an intersection, a 100-per cent boiler. Later he will indicate how to figure a boiler percentage in cases where the intersection is not exactly as just stipulated.
In locomotives with insufficient boilers, the 1932 point at 50 rpm lies below the rated tractive effort, as it can be seen on Figs. 1 and 2, illustrating locomotives with large cylinders. The Pennsylvania I-ls locomotive is the best example of such a case, because the ratio of boiler heating surface to cylinder volume is 176.4, compared with 240-280, as in many modern locomotives (in the Lehigh Valley locomotive No. 5100, referred to above as having a 100-per cent boiler, this ratio is 272.7). These figures are given here only as an illustration, because the proper relation between boiler capacity and cylinder volume will be discussed later in a more detailed way.
When a locomotive of this large-size-cjdinder type starts out with a train at very low speeds, with the maximum cylinder tractive effort, which ordinarily is very close to the rated and to the adhesion tractive effort, as it has been pointed out by the author in his 1932 paper2 (p. 6), there is sufficient steam in the boiler to develop these speeds, even in a locomotive with a comparatively small boiler capacity. More steam at low boiler efficiency will be generated, and consequently, there will be no difficulty in following the horizontal line up to 50 rpm. As soon as the speed goes up to more than 50 rpm, the tractive- effort curve, of course, will not drop suddenly to that which is called for by the 6-per cent efficiency curve (1932 curve), but the engineer, having enough steam available, will continue realizing the highest possible tractive efforts by following closely to what the locomotive had been developing before the speed of 50 rpm was reached. Consequently, higher points than what the 1932 curve would indicate, will be developed, as it has been pointed out by the author in his discussion of the previous paper* in connection with Fig. 28, p. 36. In order to obtain these points, the boiler will necessarily be stressed, and if these points are at all possible, they will be obtained in reality. This will depend entirely upon the size of the cylinders, which are responsible for the rated-tractive-effort curve obtained at starting and, consequently, lower overall locomotive efficiencies will be realized, corresponding to the maximum limit of forcing the boiler.
Following this line of reasoning, it is evident that for locomotives with the small ratio of boiler capacity to cylinder sizes, a certain heightening of the 1932 curve will have to be allowed in order to make possible the linking of the 1932 curve with the rated-tractive-effort curve.
RAILROADS RR-56-6 927
B o i l e r A d e q u a c y
One of the most important proportions in a locomotive is the ratio between boiler dimensions and cylinder volume. This was recognized long ago, and in 1897 the American Railroad Master Mechanics’ Association recommended that for bituminous coal the ratio of the evaporative heating surface in square feet to the volume of two cylinders in cubic feet be 200.6 With the advent of superheated steam, the size of cylinders has necessarily increased. At the same time, boilers became more powerful in relation to cylinders, so that at present the ratio in modern locomotives, as has been stated, sometimes reaches 280.
On the other hand, about fifteen years ago the idea of large cylinders and shorter cut-offs attracted some railroad engineers in this country to the extent that, as we saw in the I-ls locomotive, this ratio went back to 176.4.
Mr. Cole introduced the term “boiler percentage,” which represents a ratio of boiler capacity measured in horsepower to cylinder horsepower, the first being equal to boiler evaporation per hour divided by steam consumption of 28.0 lb per hp-hr for saturated steam, and 20.8 lb for superheated steam, and the second representing the cylinder horsepower according to his method figured at a piston speed of 1000 ft per min, at which speed the maximum Cole horsepower is obtained.
It is very difficult to defend this conception of boiler percentage for the reason that neither one nor the other horsepower represents correct figures. The steam consumption of 20.8 lb per hp- hr is too high for modern locomotives with superheated steam and feedwater heaters; but more important than this is the fact that the cylinder horsepower, apart from the boiler evaporation, is a very indefinite term. If, a t the speed of 1000 ft per min, corresponding approximately to 200 rpm, or, with 70-in. driving wheels, to a track speed of 41.7 mph, the horsepower reaches a certain figure, corresponding to a cut-off of, say, 25 per cent, there is no reason why the cut-off cannot be increased within certain limits, provided the boiler evaporation permits; in other words, the term “cylinder horsepower,” apart from the boiler horsepower, is a misconception. The former depends upon the latter and, therefore, an independent ratio between the two cannot be obtained.
In the author’s opinion, it would be more logical to compare cylinder and boiler tractive efforts a t a speed at which both terms have definite meanings, and his recommendation would be to make that comparison at a speed close to the point where the maximum cylinder, or rated, tractive effort intersects the boiler tractive effort, as defined in his first paper.
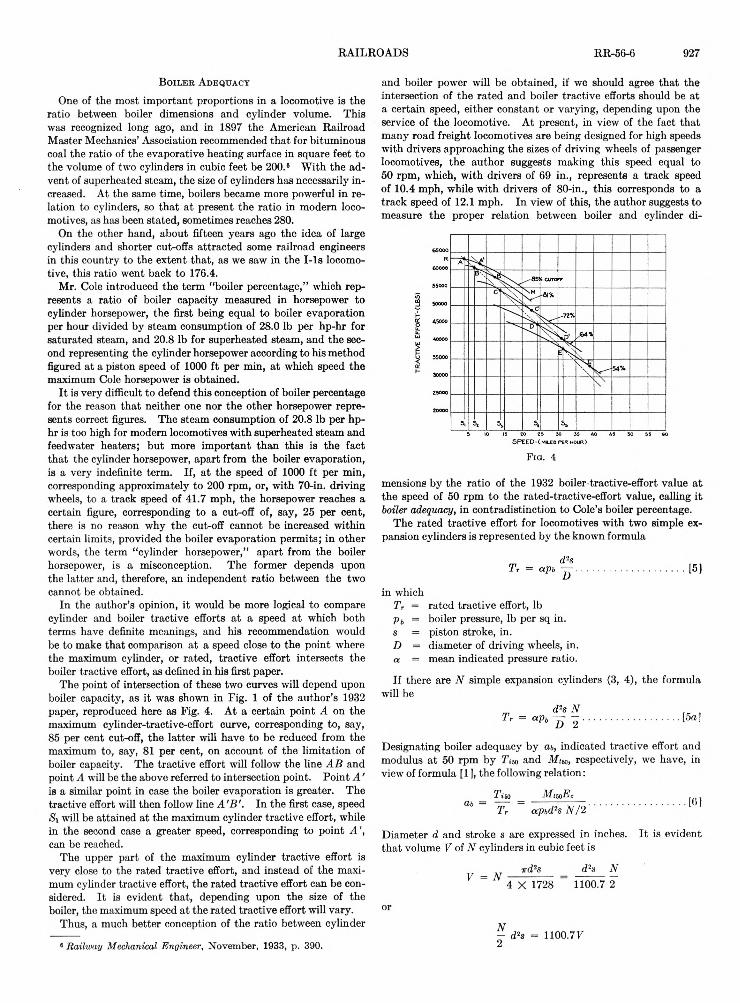
The point of intersection of these two curves will depend upon boiler capacity, as it was shown in Fig. 1 of the author’s 1932 paper, reproduced here as Fig. 4. At a certain point A on the maximum cylinder-tractive-effort curve, corresponding to, say, 85 per cent cut-off, the latter will have to be reduced from the maximum to, say, 81 per cent, on account of the limitation of boiler capacity. The tractive effort will follow the line A B and point A will be the above referred to intersection point. Point A ' is a similar point in case the boiler evaporation is greater. The tractive effort will then follow line A 'B '. In the first case, speed S\ will be attained at the maximum cylinder tractive effort, while in the second case a greater speed, corresponding to point A can be reached.
The upper part of the maximum cylinder tractive effort is very close to the rated tractive effort, and instead of the maximum cylinder tractive effort, the rated tractive effort can be considered. I t is evident that, depending upon the size of the boiler, the maximum speed at the rated tractive effort will vary.
Thus, a much better conception of the ratio between cylinder
• Railway Mechanical Engineer, November, 1933, p. 390.
and boiler power will be obtained, if we should agree that the intersection of the rated and boiler tractive efforts should be at a certain speed, either constant or varying, depending upon the service of the locomotive. At present, in view of the fact that many road freight locomotives are being designed for high speeds with drivers approaching the sizes of driving wheels of passenger locomotives, the author suggests making this speed equal to 50 rpm, which, with drivers of 69 in., represents a track speed of 10.4 mph, while with drivers of 80-in., this corresponds to a track speed of 12.1 mph. In view of this, the author suggests to measure the proper relation between boiler and cylinder di-
F ig . 4
mensions by the ratio of the 1932 boiler-tractive-effort value at the speed of 50 rpm to the rated-tractive-effort value, calling it boiler adequacy, in contradistinction to Cole’s boiler percentage.
The rated tractive effort for locomotives with two simple expansion cylinders is represented by the known formula
in whichTr = rated tractive effort, lb ■pb = boiler pressure, lb per sq in. s = piston stroke, in.D = diameter of driving wheels, in. a = mean indicated pressure ratio.
If there are N simple expansion cylinders (3, 4), the formula will be
Designating boiler adequacy by a&, indicated tractive effort and modulus at 50 rpm by TiM and M m , respectively, we have, in view of formula [1), the following relation:
Diameter d and stroke s are expressed in inches. I t is evident that volume V of N cylinders in cubic feet is
or
028 TRANSACTIONS OF THE AMERICAN SOCIETY OF MECHANICAL ENGINEERS
In a well-proportioned locomotive with at = 1, K depends only upon the maximum mean indicated pressure ratio a. For long cut-off locomotives with aw* = 0.85, K will thus be 14.26. For locomotives with shorter cut-offs, K will be slightly smaller in proportion to a.
It should not be thought, however, that K must be an absolutely rigid figure. The variation in this figure means, as it was shown above, a variation in the highest speed at which the locomotive can run with its maximum cylinder tractive effort (close to its adhesion limit). For passenger locomotives, this ratio should
be higher (more boiler capacity), while for freight locomotives this ratio may be slightly lower. For what are called at present high-speed freight engines, this ratio should be about 14.26.
It is interesting to note that the very successful modem long cut-off locomotives have the following characteristics K:
New York Central, 4-6-4 (Class J-la)..............................15.28New York Central, 4-8-2 (ClassL-2)............................... 13.25Lehigh Valley, 4-8-4 (Class 5100).....................................14.2Lehigh Valley, 4-8-4 (Class 5200).....................................14.3
For the Boston & Albany 2-8-4 (class A-l) locomotive with a maximum cut-off of 60 per cent, for which amax = 0.78, K = 12.27, which is not so far off from the ideal K, in accordance with formula [9a], namely K = 0.78/0.0596 = 13.09. In other
ords, this locomotive, although of the limited cut-off type, with large cylinders, has not been greatly different from the conventional locomotive, and the cylinder sizes were very well chosen. This explains why in the author’s first paper the tractive effort of locomotive A-l was shown to be in accordance with the 1932 method, just like any long cut-off locomotive.
As to other limited cut-off locomotives, the cylinders were not made in proportion to the boiler; they were further enlarged beyond the size required for the limited cut-off feature, although sometimes it is being stated that “when the maximum cut-off is shortened, the cylinder is correspondingly increased in diameter.”7 Very often it is being increased much more than correspondingly and than necessary. So, for instance, the Texas & Pacific 1-1 locomotive, with a maximum cut-off of 60 per cent, has a K of only 10.97. The Atchison, Topeka & Santa Fe No. 5000, with similar 60 per cent maximum cut-off, has a K of only 9.92, and the Pennsylvania I-ls locomotive, with a maximum cut-off of 55 per cent, has a still smaller K, namely, 8.53. These Ks have been made much smaller than what the relatively small change in atmrtx would require, as it is reflected in the values of boiler adequacy.
In Table 4 some principal dimensions and locomotive ratios are given for all locomotives which have been discussed in the author’s previous paper, in Mr. Vincent’s article in the Railway Mechanical Engineer, November and December, 1933, and in the present paper. The locomotives are listed in descending order of K (in last column). From this table it can be seen that begin-
7 Railway Mechanical Engineer, December, 1933, p. 432.
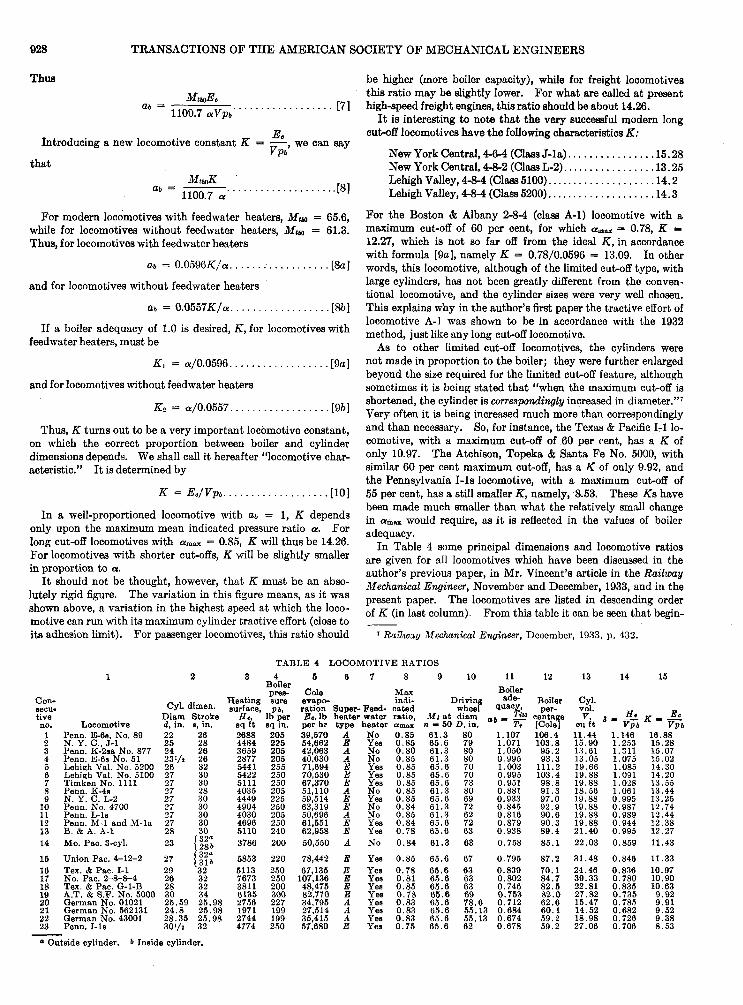
TABLE 4 LOCOMOTIVE RATIOS1 2 3 4 5 6 7 8 9 10 11 12 13 14 15
Boilerpres Cole Max Boiler
Con- Heating sure evapo indi Driving ade Boiler Cyl.aecu« uyi. aimen. surface, Pb, ration Super- Feed- cated wheel quacy, per vol.tive Diam Stroke H e , lb per Ec, lb heater water ratio, Mi at diam centage i K -no. Locomotive d, in. in. sq ft sq m. per hr type heater amax n *■ 50 D, in. TV [Cole] cu ft " Vpb Vpb
1 Penn. E-6s, No. 89 22 26 2688 205 39,570 A No 0.85 61.3 80 1.107 106.4 11.44 1.146 16.882 N. Y. C., J-l 25 28 4484 225 54,662 E Yes 0.85 65.6 79 1.071 103.8 15.90 1.253 15.283 Penn. K-2sa No. 877 24 26 3659 205 42,063 A No 0.80 61.3 80 1.050 95.2 13.61 1.311 15.074 Penn. E-6s No. 51 2 3 i/ i 26 2877 205 40.630 A No 0.85 61.3 80 0.995 93.3 13.05 1.075 15.025 Lehigh Val. No. 5200 26 32 5441 255 71,694 E Yes 0.85 65.6 70 1.003 111.2 19.66 1.085 14.306 Lehigh Val, No. 5100 27 30 5422 250 70,530 E Yes 0.85 65.6 70 0.995 103.4 19.88 1.091 14.207 Timken No. 1111 27 30 5111 250 67,370 E Yes 0.85 65.6 73 0.951 98.8 19.88 1.028 13.558 Penn. K-4s 27 28 4035 205 51,110 A No 0.85 61.3 80 0.881 91.3 18.56 1.061 13.449 N. Y. C. L-2 27 30 4449 225 59,514 E Yes 0.85 65.6 69 0.933 97.0 19.88 0.995 13.25
10 Penn. No. 4700 27 30 4904 250 63,319 E No 0.84 61.3 72 0.845 92.9 19.88 0.987 12.7411 Penn. L-ls 27 30 4030 205 50,696 A No 0.85 61.3 62 0.816 90.6 19.88 0.989 12.4412 Penn. M-l and M-la 27 30 4696 250 61,551 E Yes 0.84 65.6 72 0.879 90.3 19.88 0.944 12.3813 B. & A. A-l 28 30 5110 240 62,958 E Yes 0.78 65.6 63 0.938 89.4 21.40 0.995 12.2714 Mo. Pac. 3-cyl. 23 f 32°
1 28& 3786 200 50,550 A No 0.84 61.3 63 0.758 85.1 22.03 0.859 11.4315 Union Pac. 4-12-2 27 (32°
(316 5853 220 78,442 E Yes 0.85 65.6 67 0.795 87.2 31.48 0.846 11.3316 Tex. & Pac. 1-1 29 32 5113 250 67,135 E Yes 0.78 65.6 63 0.839 70.1 24.46 0.836 10.9717 No. Pac. 2-8-8-4 26 32 7673 250 107,136 E Yes 0.81 65.6 63 0.802 84.7 39.33 0.780 10.9018 Tex. & Pac. G-l-B 28 32 3811 200 48,475 E Yes 0.85 65.6 63 0.746 82.5 22.81 0.835 10.6319 A.T. & S.F. No. 5000 30 34 6135 300 82,770 E Yes 0.78 65.6 69 0.753 82.0 27.82 0.735 9.9220 German No. 01021 25.59 25.98 2756 227 34,795 A Yes 0.83 65.6 78.6 0.712 62.6 15.47 0.785 9.9121 German No. 562131 24.8 25.98 1971 199 27,514 A Yes 0.83 65.6 55.13 0.684 60.1 14.52 0.682 9.5222 German No. 43001 28.35 25.98 2744 199 35,415 A Yes 0.83 65.6 55.13 0.674 59.2 18.98 0.726 9.3823 Penn. I-le 3oy« 32 4774 250 57,680 E Yes 0.75 65.6 62 0.678 59.2 27.06 0.706 8.53
• Outside oylinder. h Inside cylinder.
Thus, K turns out to be a very important locomotive constant, on which the correct proportion between boiler and cylinder dimensions depends. We shall call it hereafter “locomotive characteristic.” It is determined by
and for locomotives without feedwater heaters
If a boiler adequacy of 1.0 is desired, K, for locomotives with feedwater heaters, must be
and for locomotives without feedwater heaters
For modern locomotives with feedwater heaters, Mtm — 65.6, while for locomotives without feedwater heaters, Mtia — 61.3. Thus, for locomotives with feedwater heaters
Introducing a new locomotive constant
that
we can say
RAILROADS RR-56-6 929
ning with the Pennsylvania E-6s locomotive, with a K of 16.88, down to the Pennsylvania I-ls locomotive, with K = 8.53, the range of variation in boiler adequacy is very wide—ratio between extreme values 1.63—more than could be expected, even if the difference in the kind of service of the locomotives is taken into consideration.
In addition to column 11 of Table 4, in which the boiler adequacy for each boiler is given, for comparative purposes Cole boiler percentages are also shown in column 12. Credit must be given to Mr. Cole for his conception of boiler percentage, which, although theoretically not quite correct, differs very little from the more accurate boiler adequacy, and has a close range variation with the latter—1.88 as compared with 1.63, as shown.
It is interesting to note that a constant very similar to K, in which the boiler evaporation in the numerator is replaced by
Hthe evaporative heating surface in square feet, namely, S = ---- ■,
Vpbmay be also very useful for comparative purposes. I t is given in column 14 of Table 4, and it can be seen that for the first thirteen locomotives, including the Pennsylvania M-l and the Boston & Albany A-l, S = 0.995, or more, while for all others, including limited cut-off locomotives (except Nos. 14 and 15, which are of the three-cylinder type and necessarily have a large cylinder volume), 5 is less than 0.86. There is a gap in 5 of these two groups, one having approximately S = 1.0 and more, while the other has S = 0.86 and less. When the boiler evaporation is not quite known, it might be advantageous for the first approximation to figure the cylinder volume V on the basis of evaporative heating surface, assuming 5 = 1.0, which is equivalent to
It should be later checked on the basis of K.
T r a c t iv e E f f o r t o f L a r g e - S iz e - C y l in d e r L o c o m o t iv e s
I t has been shown before that the 1932 method gives accurate results for certain locomotives of modern type. Here it has been pointed out that these locomotives are all of the large-boiler type, with locomotive characteristic K of about 12-16. I t was also found that when a boiler adequacy of 1.0 is required, K should be 14.26 for locomotives with feedwater heaters.
I t was also brought out in the foregoing discussion that when a locomotive has comparatively large cylinders and a small characteristic K, the boiler at low speeds is usually overstressed. This can be done because, as it will be remembered from the 1932 paper, the boiler evaporation was assumed to be, at low speeds, much below Ec—the Cole evaporation figure; at 50 rpm it was only 65 per cent of the Cole figure. Many investigators claim that the boiler evaporation is more or less constant and that its maximum, if there are any fluctuations, can be obtained almost, at any speed. This is true, if forcing of the boiler and low boiler efficiencies are permitted; in other words, the fact that it is possible to force the boiler at low speeds above the 1932 values is evident on the basis of premises used for the 1932 method.
There is not enough available information from tests to indicate the relation between the limit of forcing at low speeds and locomotive characteristic K. The author has, therefore, followed the same method which he pursued in his 1932 paper, namely, he investigated the test results of existing locomotives and tried to find whether there were any simple and consistent relations between the test data and the locomotive principal dimensions. He did find some, and he verified his findings on all locomotives for which information was available. Good coincidence was found; this permits the claim, with a sufficient degree of certainty, that the findings are correct.
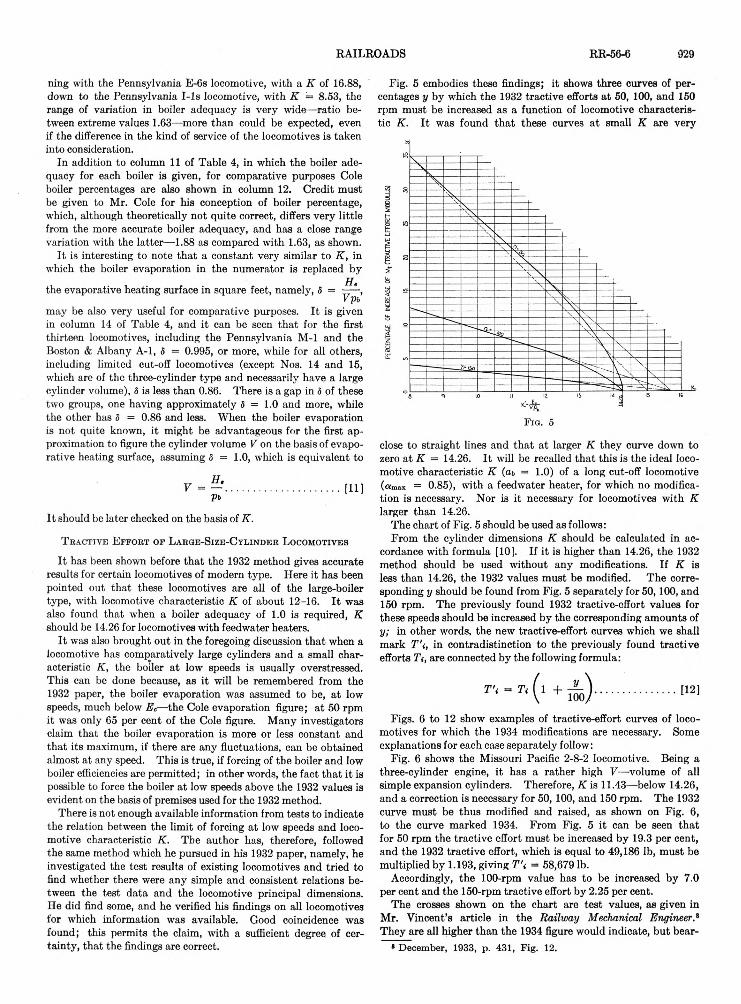
Fig. 5 embodies these findings; it shows three curves of percentages y by which the 1932 tractive efforts a t 50, 100, and 150 rpm must be increased as a function of locomotive characteristic K. I t was found that these curves at small K are very
close to straight lines and that at larger K they curve down to zero at K = 14.26. I t will be recalled that this is the ideal locomotive characteristic K (aj> = 1.0) of a long cut-off locomotive («max = 0 .8 5 ) , with a feedwater heater, for which no modification is necessary. Nor is it necessary for locomotives with K larger than 14.26.
The chart of Fig. 5 should be used as follows:From the cylinder dimensions K should be calculated in ac
cordance with formula [10]. If it is higher than 14.26, the 1932 method should be used without any modifications. If K is less than 14.26, the 1932 values must be modified. The corresponding y should be found from Fig. 5 separately for 50, 100, and 150 rpm. The previously found 1932 tractive-effort values for these speeds should be increased by the corresponding amounts of y; in other words, the new tractive-effort curves which we shall mark T'i, in contradistinction to the previously found tractive efforts Ti, are connected by the following formula:
Figs. 6 to 12 show examples of tractive-effort curves of locomotives for which the 1934 modifications are necessary. Some explanations for each case separately follow:
Fig. 6 shows the Missouri Pacific 2-8-2 locomotive. Being a three-cylinder engine, it has a rather high V—volume of all simple expansion cylinders. Therefore, K is 11.43—below 14.26, and a correction is necessary for 50, 100, and 150 rpm. The 1932 curve must be thus modified and raised, as shown on Fig. 6, to the curve marked 1934. From Fig. 5 it can be seen that for 50 rpm the tractive effort must be increased by 19.3 per cent, and the 1932 tractive effort, which is equal to 49,186 lb, must be multiplied by 1.193, giving T'i = 58,679 lb.
Accordingly, the 100-rpm value has to be increased by 7.0 per cent and the 150-rpm tractive effort by 2.25 per cent.
The crosses shown on the chart are test values, as given in Mr. Vincent’s article in the Railway Mechanical Engineer* They are all higher than the 1934 figure would indicate, but bear-
# December, 1933, p. 431, Fig. 12.
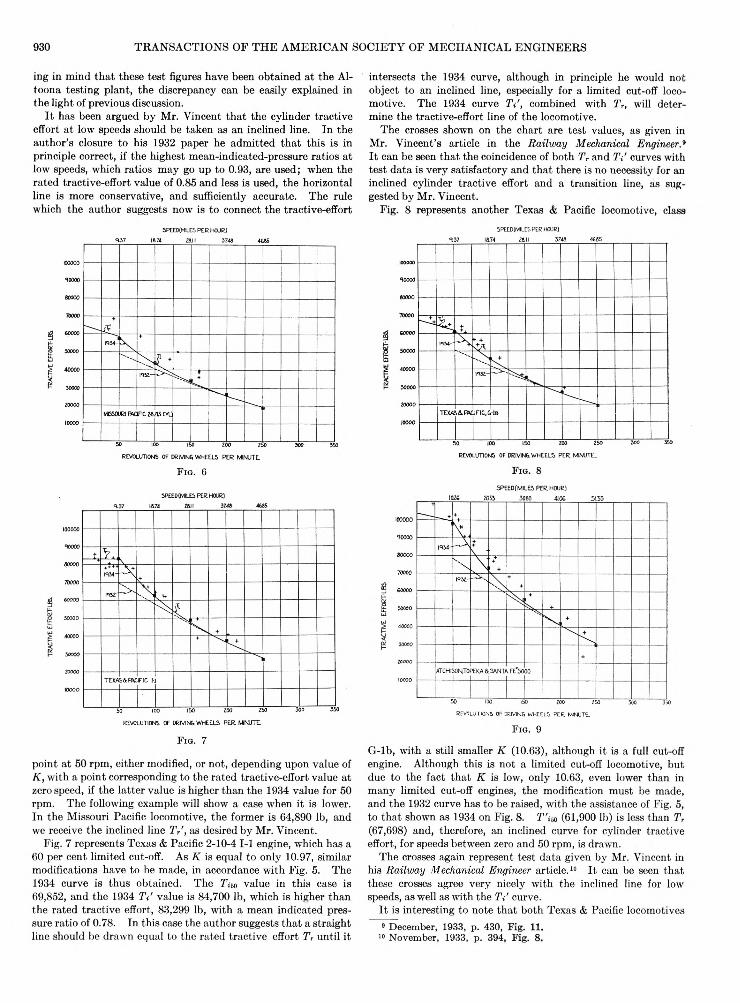
930 TRANSACTIONS OF THE AMERICAN SOCIETY OF MECHANICAL ENGINEERS
ing in mind that these test figures have been obtained at the Altoona testing plant, the discrepancy can be easily explained in the light of previous discussion.
I t has been argued by Mr. Vincent that the cylinder tractive effort at low speeds should be taken as an inclined line. In the author’s closure to his 1932 paper he admitted that this is in principle correct, if the highest mean-indicated-pressure ratios at low speeds, which ratios may go up to 0.93, are used; when the rated tractive-effort value of 0.85 and less is used, the horizontal line is more conservative, and sufficiently accurate. The rule which the author suggests now is to connect the tractive-effort
F ig . 6
F ig . 7
point at 50 rpm, either modified, or not, depending upon value of K, with a point corresponding to the rated tractive-effort value at zero speed, if the latter value is higher than the 1934 value for 50 rpm. The following example will show a case when it is lower. In the Missouri Pacific locomotive, the former is 64,890 lb, and we receive the inclined line TV, as desired by Mr. Vincent.
Fig. 7 represents Texas & Pacific 2-10-4 1-1 engine, which has a 60 per cent limited cut-off. As K is equal to only 10.97, similar modifications have to be made, in accordance with Fig. 5. The 1934 curve is thus obtained. The T,m value in this case is 69,852, and the 1934 TV value is 84,700 lb, which is higher than the rated tractive effort, 83,299 lb, with a mean indicated pressure ratio of 0.78. In this case the author suggests that a straight line should be drawn equal to the rated tractive effort T, until it
intersects the 1934 curve, although in principle he would not object to an inclined line, especially for a limited cut-off locomotive. The 1934 curve TV, combined with 1\, will determine the tractive-effort line of the locomotive.
The crosses shown on the chart are test values, as given in Mr. Vincent’s article in the Railway Mechanical Engineer* I t can be seen that the coincidence of both Tr and TV curves with test data is very satisfactory and that there is no necessity for an inclined cylinder tractive effort and a transition line, as suggested by Mr. Vincent.
Fig. 8 represents another Texas & Pacific locomotive, class
F ig . 9
G-lb, with a still smaller K (10.63), although it is a full cut-off engine. Although this is not a limited cut-off locomotive, but due to the fact that K is low, only 10.63, even lower than in many limited cut-off engines, the modification must be made, and the 1932 curve has to be raised, with the assistance of Fig. 5, to that shown as 1934 on Fig. 8. T ’iw (61,900 lb) is less than T, (67,698) and, therefore, an inclined curve for cylinder tractive effort, for speeds between zero and 50 rpm, is drawn.
The crosses again represent test data given by Mr. Vincent in his Railway Mechanical Engineer article.10 It can be seen that these crosses agree very nicely with the inclined line for low speeds, as well as with the 7V curve.
I t is interesting to note that both Texas & Pacific locomotives8 December, 1933, p. 430, Fig. 11.
10 November, 1933, p. 394, Fig. 8.
RAILROADS RIW56-6 931
SpEED (MILES PER HOUR)
F ig . 10
F ig . 11
F ig . 12
are oil-burners, and that no substantially increased powers had been obtained with oil compared with coal.
Fig. 9 pertains to the Atchison, Topeka & Santa Fe limited cutoff, 2-10-4, locomotive No. 5000, for which K is 9.92. The modified tractive effort is marked 1934, and the crosses, representing test values, are taken from Mr. Vincent’s article in the Railway
Mechanical Engineer.11 They lie higher than the 1934 curve, which, in the opinion of the author, is probably due to the fact that the locomotive had been stressed to the capacity limit. If all data, and especially the efficiencies of the locomotive for the high points, were given, this could be proved definitely.
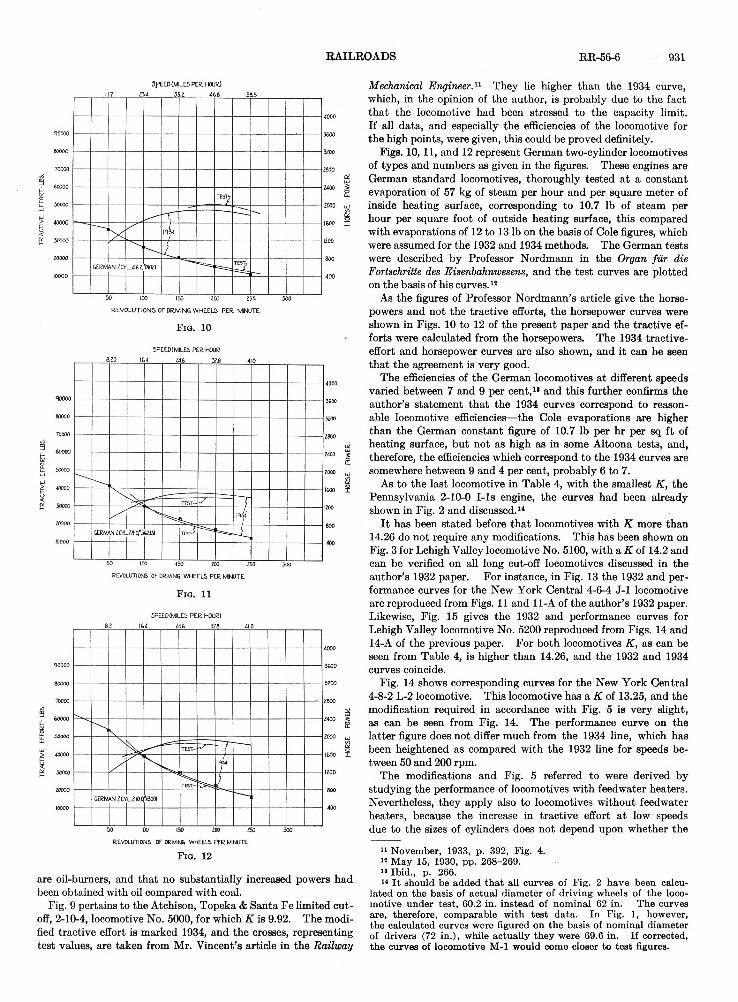
Pigs. 10, 11, and 12 represent German two-cylinder locomotives of types and numbers as given in the figures. These engines are German standard locomotives, thoroughly tested at a constant evaporation of 57 kg of steam per hour and per square meter of inside heating surface, corresponding to 10.7 lb of steam per hour per square foot of outside heating surface, this compared with evaporations of 12 to 13 lb on the basis of Cole figures, which were assumed for the 1932 and 1934 methods. The German tests were described by Professor Nordmann in the Organ fur die Fortschritte des Eisenbahnwesens, and the test curves are plotted on the basis of his curves.12
As the figures of Professor Nordmann’s article give the horsepowers and not the tractive efforts, the horsepower curves were shown in Figs. 10 to 12 of the present paper and the tractive efforts were calculated from the horsepowers. The 1934 tractive- effort and horsepower curves are also shown, and it can be seen that the agreement is very good.
The efficiencies of the German locomotives at different speeds varied between 7 and 9 per cent,1' and this further confirms the author’s statement that the 1934 curves correspond to reasonable locomotive efficiencies—the Cole evaporations are higher than the German constant figure of 10.7 lb per hr per sq ft of heating surface, but not as high as in some Altoona tests, and, therefore, the efficiencies which correspond to the 1934 curves are somewhere between 9 and 4 per cent, probably 6 to 7.
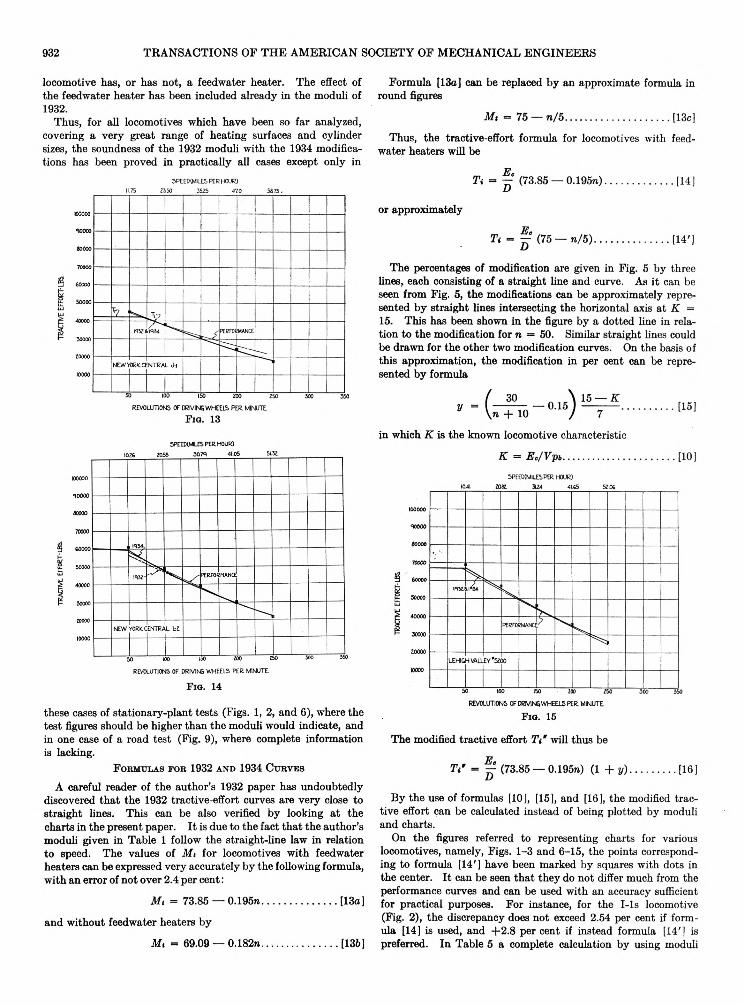
As to the last locomotive in Table 4, with the smallest K, the Pennsylvania 2-10-0 I-ls engine, the curves had been already shown in Fig. 2 and discussed.14
I t has been stated before that locomotives with K more than 14.26 do not require any modifications. This has been shown on Fig. 3 for Lehigh Valley locomotive No. 5100, with a K of 14.2 and can be verified on all long cut-off locomotives discussed in the author’s 1932 paper. For instance, in Fig. 13 the 1932 and performance curves for the New York Central 4-6-4 J-l locomotive are reproduced from Figs. 11 and 11-A of the author’s 1932 paper. Likewise, Fig. 15 gives the 1932 and performance curves for Lehigh Valley locomotive No. 5200 reproduced from Figs. 14 and 14-A of the previous paper. For both locomotives K, as can be seen from Table 4, is higher than 14.26, and the 1932 and 1934 curves coincide.
Fig. 14 shows corresponding curves for the New York Central 4-8-2 L-2 locomotive. This locomotive has a K of 13.25, and the modification required in accordance with Fig. 5 is very slight, as can be seen from Fig. 14. The performance curve on the latter figure does not differ much from the 1934 line, which has been heightened as compared with the 1932 line for speeds between 50 and 200 rpm.
The modifications and Fig. 5 referred to were derived by studying the performance of locomotives with feedwater heaters. Nevertheless, they apply also to locomotives without feedwater heaters, because the increase in tractive effort a t low speeds due to the sizes of cylinders does not depend upon whether the
11 November, 1933, p. 392, Fig. 4.12 M ay 15, 1930, pp. 268-269.13 Ibid., p . 266.14 I t should be added th a t all curves of Fig. 2 have been calcu
lated on the basis of actual diam eter of driving wheels of the locom otive under test, 60.2 in. instead of nominal 62 in. The curves are, therefore, comparable w ith test data. In Fig. 1, however, the calculated curves were figured on the basis of nominal diameter of drivers (72 in.), while actually they were 69.6 in. If corrected, the curves of locomotive M -l would come closer to test figures.
932 TRANSACTIONS OF THE AMERICAN SOCIETY OF MECHANICAL ENGINEERS
locomotive has, or has not, a feedwater heater. The effect of the feedwater heater has been included already in the moduli of 1932.
Thus, for all locomotives which have been so far analyzed, covering a very great range of heating surfaces and cylinder sizes, the soundness of the 1932 moduli with the 1934 modifications has been proved in practically all cases except only in
x IQ. 13
Fio. 14
these cases of stationary-plant tests (Figs. 1, 2, and 6), where the test figures should be higher than the moduli would indicate, and in one case of a road test (Fig. 9), where complete information is lacking.
F o r m u l a s f o b 1932 a n d 1934 C u r v e s
A careful reader of the author’s 1932 paper has undoubtedly discovered that the 1932 tractive-effort curves are very close to straight lines. This can be also verified by looking at the charts in the present paper. I t is due to the fact that the author’s moduli given in Table 1 follow the straight-line law in relation to speed. The values of Mt for locomotives with feedwater heaters can be expressed very accurately by the following formula, with fl.n error of not over 2.4 ner cent:
Formula [13a] can be replaced by an approximate formula in round figures
By the use of formulas [10], [15], and [16], the modified tractive effort can be calculated instead of being plotted by moduli and charts.
On the figures referred to representing charts for various locomotives, namely, Figs. 1-3 and 6-15, the points corresponding to formula [14'] have been marked by squares with dots in the center. I t can be seen that they do not differ much from the performance curves and can be used with an accuracy sufficient for practical purposes. For instance, for the I-ls locomotive (Fig. 2), the discrepancy does not exceed 2.54 per cent if formula [14] is used, and +2.8 per cent if instead formula [14'] is preferred. In Table 5 a complete calculation by using moduli
Thus, the tractive-effort formula for locomotives with feedwater heaters will be
or approximately
The percentages of modification are given in Fig. 5 by three lines, each consisting of a straight line and curve. As it can be seen from Fig. 5, the modifications can be approximately represented by straight lines intersecting the horizontal axis at K — 15. This has been shown in the figure by a dotted line in relation to the modification for n = 50. Similar straight lines could be drawn for the other two modification curves. On the basis of this approximation, the modification in per cent can be represented by formula
in which K is the known locomotive characteristic
Fio. 15
The modified tractive effort T i' will thus be
md without feedwater heaters by
RAILROADS RR-56-6 933
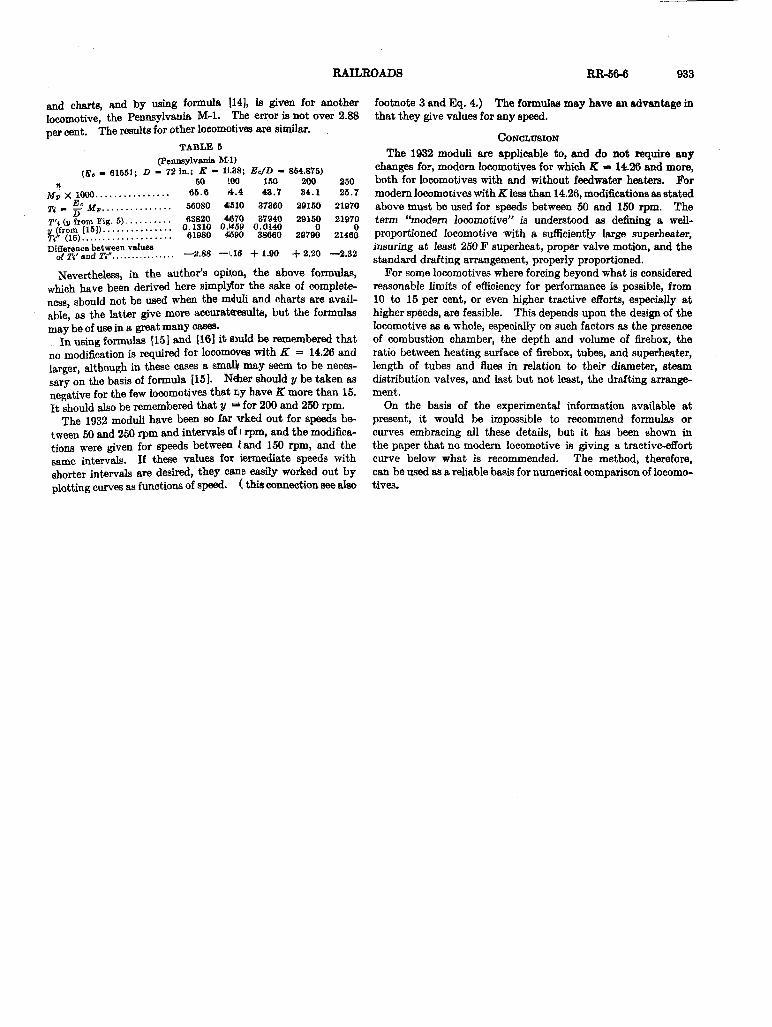
and charts, and by using formula [14], is given for another locomotive, the Pennsylvania M-l. The error is not over 2.88 per cent. The results for other locomotives are similar.
TABLE 5 (Pennsylvania M l)
(Ec - 61551; D - 72 in.; K - 11.38; E c / D - 864.875) n 60 100 160 200 250
M p X 1000............................. 65.6 4 .4 43.7 34.1 25.7T i - M v ........................... 56080 41510 37360 28150 21970T'i (v from Fig. 5 ) ................. 63820 4670 37940 29150 21970!, (from [151)........................... 0.1310 0.1459 0.0140 0 0T? (16).................................... 61980 4590 38660 29790 21460Difference between values
of Ti' and Ti"........................ — 2.88 — 118 + 1.90 + 2.20 —2.32
Nevertheless, in the author’s opiton, the above formulas, which have been derived here simplyfor the sake of completeness, should not be used when the miuli and charts are available, as the latter give more accuratttesults, but the formulas may be of use in a great many cases.
In using formulas [15] and [16] it simld be remembered that no modification is required for locomoves with K = 14.26 and larger, although in these cases a smalV may seem to be necessary on the basis of formula [15]. N«faer should y be taken as negative for the few locomotives that ny have K more than 15. It should also be remembered that y =* for 200 and 250 rpm.
The 1932 moduli have been so far irked out for speeds between 50 and 250 rpm and intervals of I rpm, and the modifications were given for speeds between land 150 rpm, and the same intervals. If these values for iermediate speeds with shorter intervals are desired, they cane easily worked out by plotting curves as functions of speed. ( this connection see also
footnote 3 and Eq. 4.) The formulas may have an advantage in that they give values for any speed.
C o n c l u sio n
The 1932 moduli are applicable to, and do not require any changes for, modem locomotives for which K =» 14.26 and more, both for locomotives with and without feedwater heaters. For modem locomotives with K less than 14.26, modifications as stated above must be used for speeds between 50 and 150 rpm. The term “modem locomotive” is understood as defining a well- proportioned locomotive with a sufficiently large superheater, insuring at least 250 F superheat, proper valve motion, and the standard drafting arrangement, properly proportioned.
For some locomotives where forcing beyond what is considered reasonable limits of efficiency for performance is possible, from 10 to 15 per cent, or even higher tractive efforts, especially at higher speeds, are feasible. This depends upon the design of the locomotive as a whole, especially on such factors as the presence of combustion chamber, the depth and volume of firebox, the ratio between heating surface of firebox, tubes, and superheater, length of tubes and flues in relation to their diameter, steam distribution valves, and last but not least, the drafting arrangement.
On the basis of the experimental information available at present, it would be impossible to recommend formulas or curves embracing all these details, but it has been shown in the paper that no modem locomotive is giving a tractive-effort curve below what is recommended. The method, therefore, can be used as a reliable basis for numerical comparison of locomotives.