tradable green certi cates as a means of environmen- tal
TRANSCRIPT

Tradable Green Certificates as a Means of Environmen-tal Policy? Theoretical Consideration and Evidence fromPoland and Romania
Christoph Heinzel† and Thomas Winkler‡,∗
† Centre for Energy and Environmental Markets (CEEM)School of Economics, Australian School of BusinessUniversity of New South WalesSydney NSW 2052, Australia
Phone: +61 2 9385 3313, fax: +61 2 9313 6337Email: c.heinzel[at]unsw.edu.au (corresponding author)‡ WSB Neue Energien GmbH
PO Box 32 01 0401013 Dresden, Germany
Phone: +49 171 21183 24, fax: +49 315 21183 44Email: t.winkler[at]wsb.de
February 2009
Preliminary version — please, do not cite. Comments welcome.
Abstract: Quota obligation schemes based on tradable green certificates have become apopular policy instrument to expand power generation from renewable energy sources.However, their application cannot be justified on environmental-economics grounds, ifan emissions trading system is available that fully covers the energy industry and mar-kets are liberalized. We study the recently introduced schemes in Poland and Romaniain detail. We show that massive over-investments in renewable technologies, along withexcessive power prices but no additional emissions reduction, are likely for years to come.The two cases particularly illustrate the misleading nature of these schemes.
Keywords: tradable green certificates, environmental policy, renewable energy sources,Poland, Romania
JEL classification: Q28, H23, Q42
∗ This research was supported financially through the Environmental Economics Research Hub which isfunded by the Australian Commonwealth Environmental Research Facilities (CERF) programme andthe Australian Research Council (ARC) project DP0878580. Thomas Winkler acknowledges financialsupport by WSB Neue Energien GmbH, whose views or opinions are not necessarily reflected.

1 Introduction
Policies for the promotion of the deployment of renewable-energy technologies, such as
feed-in tariffs or quota obligation schemes based on tradable green certificates (TGC),
constitute a phenomenon. Though from an environmental-economics perspective (at
best) second-best, thus inefficient, instruments, they are today applied in a majority of
OECD countries (e.g. Australian Government 2009, EU Commission 2008b, Wiser et
al. 2007). In this paper we focus on the case of TGC-based quota obligation schemes.
Our aim is twofold. First, we review of the major arguments put forward in their favor
and discuss them against the knowledge of current environmental economics. Second,
we study in detail the systems recently introduced in Poland and Romania with respect
to their design, recent development, prospects, and the incentives they offer for wind-
power investments in particular. As a result of our theoretical consideration, we find no
in general compelling argument in favor of the schemes as currently implemented. Also
our judgment of the Polish and Romanian systems is ambivalent. While they perform
well to support RES expansion, they display the same distortionary features as recently
stated by Frondel et al. (2008) for the German PV subsidization: no additional emissions
reductions, excessive power prices, over-investment, and, in addition, a negatively biased
carbon price.
The literature on TGC-based quota obligation schemes has covered diverse aspects.1
Apart from numerous studies on regional systems, the effectiveness and efficiency of such
schemes have been compared especially to those of feed-in tariffs (e.g. Menanteau et al.
2003, Finon and Menanteau 2004, Palmer and Butraw 2005, Finon 2006, Finon and Perez
2007) and their interaction with emissions trading schemes (ETS) has been analyzed
(e.g. Morthorst 2001, Amundsen and Mortensen 2001, 2002, Jensen and Skytte 2002,
Del Rio 2007, Gillenwater 2008b). Further contributions have focused particular aspects,
such as the relationship between wind supply volatility and TGC price (Lemming 2003),
certificate banking and TGC price volatility (Amundsen et al. 2006), market power in
TGC markets and power prices (Amundsen and Bergman 2008) and the role of long-term
contracts for TGC-market efficiency (Kildegaard 2008).
What is surprising to us is that, as far as we see, no contribution has raised the question
of what the application of a TGC-based quota obligation scheme actually justifies as a
fundamental issue. Rader and Norgaard (1996), who introduced TGC-based quota obli-
gation schemes to scientific debate, put forward a number of favorable arguments. They
1 See, e.g., Agnolucci (2007) for a survey, and Gillenwater (2008a,b), Wiser et al. (2005) for fairlyencompassing discussions of definition and different aspects.
2

were mostly rephrased by Menanteau et al. (2003), who point in addition to the possible
inducement of technological progress. However, Palmer and Butraw (2005) showed in
a simulation study that an ETS is much more cost-effective to reduce emissions than
supporting renewable energy sources (RES). Frondel et al. (2008) have critically studied
the effects of the German feed-in tariff system with respect to PV. In addition, Blasi
(2006) examined learning-curve effects in the wind-turbine industry, which have also
been cited as a justification for feed-in tariff schemes. He could not verify them, in part
for methodological reasons. The Polish and Romanian quota obligation systems in turn
have, to the best of our knowledge, not been examined in the scientific literature yet.2
In section 2, we review the environmental economics of TGC-based quota obligation
schemes with respect to their justification. Section 3 describes the specific designs, re-
cent development, and prospects of the schemes in Poland and Romania implemented,
respectively, in 2006 and 2005. Section 4 analyzes, based on a cash-flow model, the con-
ditions for wind-power investments in the two countries. In section 5, we discuss the
performance and design issues of the two systems and relate our results back to TGC
literature and the justification question. Section 6 concludes.
2 TGC as a means of environmental policy: a critical assessment
TGC-based quota obligation schemes typically require consumers, or energy suppliers
on their behalf, to prove a certain proportion (quota) of their electricity used, or sold, is
generated from renewable energy sources (RES).3 The schemes can thus be categorized
as a quota instrument, technically similar to cap-and-trade systems. Green certificates
are issued by a regulatory authority. One certificate usually refers to one MWh of RES
electricity. It has an indefinite maturity. The authority distributes them to generators
according to their amount of RES electricity produced. RE generators may sell certifi-
cates either on the TGC market or via long-term contracts to consumers or retailers. The
latter prove their quota fulfillment by submitting certificates to the regulatory authority.
Decisive is the number of TGC submitted, not whether RES electricity has really been
consumed according to the quota. By submission to the authority the TGC vanish. If a
retailer does not, or cannot, have enough certificates to comply with the quota, a fine is
to be paid to the authority for the missing amount of certificates. For the TGC market,
2 A few – rather early or survey – papers or studies have covered aspects of RES policies in the regionsof the two countries, e.g., Barbu (2007), Hindsberger et al. (2003), Koroneos and Nanaki (2007),Paska et al. (2009), Ragwitz et al. (2007), Reiche (2006).
3 See for detailed descriptions, e.g., Lemming (2003), Menanteau et al. (2003).
3

this fine introduces an upper price limit, the so-called buy-out price.
2.1 Justification of TGC as an environmental-policy instrument
In contrast to other well established market-based environmental-policy instruments,
such as environmental taxes and cap-and-trade systems for emission permits, which
prior to their introduction had been discussed for decades in the economics literature,
TGC-based quota obligation schemes have taken a peculiar path. Their first detailed
discussion is usually associated with the electricity industry restructuring debates in the
U.S., and California in particular, in the mid-1990s (e.g. Gillenwater 2008a, Wiser et al.
2007). They received their first scientific description, to the best of our knowledge, by
Rader and Norgaard (1996). They justified their application on the one hand by pointing
to the public-good character of RES use due to implied risk reductions both with respect
to power price volatility – due to enhanced diversity of generation technologies – and to
regulatory changes – as they are not targeted by other emission-reduction policies (p.
40). On the other hand, they stressed their general potential to ‘correct market failures,
overcome market barriers and achieve sustainability’ (p. 44). Menanteau et al. (2003)
pointed in addition to the possible inducement of technological progress. However, a
debate on the justification of RES promotion policies has never been led on scientific
level.4 As a policy instrument, TGC-based quota obligation schemes have had an amazing
success. They are now applied in many North American states, European countries as
well as Australia (Australian Government 2009, Ragwitz et al. 2007, Wiser et al. 2007).
Green electricity constitutes an example of a green product, having the characteristics
of an impure public good, with both private and environmental-public traits (Kotchen
2005, 2006). Therefore, at first glance a potential for policy intervention may relate to
RES per se. However, at a closer look, in general, none of the mentioned reasons by Rader
and Norgaard (1996) for TGC-based RES support schemes actually applies. Thus, en-
hanced technological diversity does not automatically imply better hedging possibilities,
especially if a portfolio of RES technologies is added to the set of conventional generation
technologies. Rather, as long as power can hardly be stored, the volatile availability of
wind and sunlight, for example, tends to increase power-price volatility. Moreover, as
designer markets, TGC markets are particularly subject to the risk of policy changes.
Therefore, in both respects the risk-reduction argument is not likely to apply.
The introduction of RES is, further, in general not directly related to market failures
regarding the environment, justifying a policy response. As agreed among economists,
4 Policy documents, such as EU Commission (2008b), follow the favorable arguments in the literature.
4

a (first-best) policy intervention should always target at the source of the distortion.
In the context of anthropogenic climate change these are the greenhouse-gas (GHG)
emissions from economic activity, and power generation in particular. The first-best
response for this case is not only available, in form of emission taxes or cap-and-trade
systems with emission permits. Especially emissions trading schemes (ETS) today also
constitute a standard instrument, implemented not only in the European Union with
the EU ETS since 2005, but since 2009 also in 10 U.S. states and from 2010 in Australia
(e.g. Australian Government 2008, Ellerman and Buchner 2007, RGGI 2008).
The availability and existence of ETS have two implications important for the justifi-
cation of policies supporting the deployment of RES technologies. First, they introduce
a cap on the emissions from the covered sectors in the region of application, which will
be met irrespective of the composition of the portfolio of technologies used. Second, the
power sector can fully be covered. As a consequence, if both points are fulfilled, successful
RES-support policies do not lead to additional abatement below the regional emissions
cap. They have rather two – distortionary – economic effects. On the one hand, they
create, from the theoretical point of view, ‘too favorable’ conditions for the deployment
of RES technologies, implying excessive power generation costs and, in tendency, an
excessive power price and excessive rents to green-electricity generators. On the other
hand, the carbon price will be negatively distorted, alleviating abatement pressure from
polluting technologies.5
The only case in which economists could recommend particular support schemes for
low-emission technologies, as auxiliary measures to reduce emissions, is, if, for inevitable
reasons, an ETS is unavailable or not applicable to the energy industry. They could then
implement, at best, a second-best optimum.6 Historically, this seeming unavailability
was the context in which RES-support policies were conceived. The rationale developed
leads to the classification of policies supporting the deployment of RES technologies as
(at best) second-best instruments.
It is to be noted that in liberalized energy markets there are neither particular barri-
5 Frondel et al. (2008) recently calculated that under the – structurally in these respects equivalent –regime of feed-in tariffs in Germany the average household has, due to the RES support, additionalannual power costs of about ¤31.5. For the particular case of photovoltaics (PV), they found thatthe cumulated subsidies since the introduction of the scheme in 2000 amounted to about ¤26.5bn,to which by only 2010 another ¤27bn will add. The abatement of 1 tonne CO2 with PV costs about¤760 (compared to, thus far, less than ¤30 under the EU ETS). While the additional emissionsreductions from the scheme are zero, its domestic net employment effect tends to be negative.
6 For example, policies supporting energy efficiency measures can be justified along these lines, as thecarbon-price signal is in general not immediately transmitted to, and thus perceived at, e.g., the finalconsumption of electricity.
5

ers for the installation of RES technologies nor to reveal preferences for RES electricity.
Kotchen (2005, 2006) shows, moreover, that the expansion of green-product markets need
neither improve environmental quality nor social welfare, and that the characterization
of RES electricity as a green product does not imply the need for a policy interven-
tion. Thus, the attempt to reduce market barriers for RES via RES-support policies, as
maintained by Rader and Norgaard (1996), will even tend to be counterproductive from
an environmental point of view. Their further criterion of ‘sustainability,’ finally, could
not establish as a normative goal of environmental economics due to various conceptual
issues, also occurring in attempts of its measurement (e.g. Bohringer and Jochem 2007).
2.2 TGC and technology policy
This critical assessment of TGC-based quota obligation schemes as an instrument of
environmental policy does, of course, not reflect the whole environmental-economics
judgment of RES-support policies. Rather, it is well recognized that in the transition to
low-carbon production typically market failures related to environmental externalities
interact with market failures accompanying the innovation and diffusion of new technolo-
gies (Jaffe et al. 2002, 2005). Examples comprise knowledge spillovers as related to the
public-good nature of new knowledge, dynamic increasing returns as generated, e.g., by
learning by doing, learning by using, or network externalities, and informational asym-
metries. They may induce different kinds of technology policy and are complementary
to environmental policy, if the environmental externality occurs in addition.
Here again, however, it must be considered which sources of market failure actually
apply in the case of RES and which policies can target them directly. For example, a
major argument in support of the German feed-in-tariff scheme has been that the RES
technology producers cannot appropriate all rents they generate by the development
and refinement of new technologies (BMU 2004). They should be rewarded for foregone
rents which others appropriate when using the newly generated knowledge for their own
production. In theory, this can be done, e.g., by payment of a Pigou subsidy, or giving
a respective credit, to the inventing firm to raise its R&D investments. To implement
the social optimum moreover the payment of an entry premium for companies newly
joining the RES technology industry may be necessary. It cannot be done, however, by a
subsidy that facilitates the supply of RES electricity and thus the deployment of certain
generation technologies in their current state of development.7 Blasi (2006) scrutinized,
furthermore, whether the learning-curve argument holds in the case of the wind-turbine
7 See Blasi and Requate (2005, 2007) for a detailed theoretical analysis.
6

industry. Based on a meta-analysis and a self-compiled data set he could not verify the
learning effects based on cumulative output, in part for methodological reasons.
In the following, we study two recently implemented national RES quota obligation
schemes in countries in transition and the incentives for wind-power investments they
provide in detail.
3 The Polish and the Romanian TGC systems
Poland and Romania have introduced promotion systems for renewable energy sources
to meet their respective obligations agreed upon in the EU Accession Treaties. Both use
TGC-based quota obligation schemes.
3.1 The Polish TGC system
Poland had in 2007 a population of about 38m (EU no. 6) and a nominal GDP of¤308bn
(EU no. 7). It generated in that year 3% of its power from RES, 60% from hard coal, 35%
from brown coal and 2% from gas (URE 2008c, Table 1). With carbon emissions of 209.6
Mt it was the fourth biggest polluter in the EU (EU Commission 2008a). As agreed in
the Accession Treaty, Poland aims at an indicative target of 7,5% RES contribution to
gross electricity consumption by 2010 (European Parliament 2003). The Polish Energy
Law Act (Sejm 2006) is the basis for the national RES promotion. It was amended in
early 2006 to set up the TGC-based quota obligation scheme. Its framework is as follows:
• Promotion is given to energy generation from hydropower, wind, biomass, biogas,
photovoltaics, solar and geothermal energy.
• Energy distributors have to fulfill an RES quota defined by the Ministry of Eco-
nomics. In Table 2 it is shown for the years 2008-2014.
• Green certificates are traded at the Polish Power Exchange (POLPX). There exist
no legally defined upper and lower price limits in certificate trading. Alternatively,
an RES generator may sell TGC and electricity to a retailer at fixed prices via a
bilateral contract.
• A retailer who fails to fulfill his RES quota is obliged to pay a penalty for the
unfulfilled part. It is set annually by the Polish energy regulatory office URE. In
7

2006 it was at ¤61.60 (PLN 240)8 for each missing green certificate, in 2007 at
¤64.06 (PLN 242.40) (URE 2007a), in 2008 at¤70.74 (PLN 248.46) (URE 2008a).
• Retailers are obliged to grant grid access to RES producers. The fed-in power
is remunerated to the producer with the average market price of ‘conventionally
produced’ power. The level is determined by URE.
3.1.1 Development of prices and RES production in the Polish TGC system
In 2006 power generation from RES reached 4.2 TWh leading to the issuance of 4.2m
TGC. Table 1 indicates the quantities of electricity generated from different RES in 2006.
For a gross electricity consumption of 150.87 TWh and an RES quota of 3.6% (Paska
Table 1: Electricity from different RES in 2006 in GWh (Paska et al. 2009: 147).
Hydro Biomass Wind Biogas Sum2,035 1,821 253 94 4,203
et al. 2009), 5.43m green certificates would have been necessary to fulfill the obligation
in 2006. In 2007 the RES quota rose to 5.1% of gross electricity consumption. If one
forecasts the rise of gross electricity consumption with the help of GDP growth and an
average growth factor for power demand with reference to the GDP increase, electric-
ity consumption would have reached 158.7 TWh in 2007,9 the corresponding demand
for green certificates 8.09m. To satisfy this demand nearly doubling of the 2006 RES
production of 4.2 TWh would have been necessary. That realizing this production devel-
opment was not realistic can also be seen at the price trend for TGC, which touched the
level of the penalty payment for missing TGC of ¤61.60 (PLN 240) in mid-2006. Beside
TGC trading at POLPX it is also possible to sell certificates directly to distributors on
a bilateral market. In 2007 74.4% of all certificates have been traded this way. The price
for these transactions ranged in a span of ¤39.64-63.43 (PLN 150-240). The remuner-
ation for RES power fed into the grid, which is based on the price of conventionally
produced power, amounted in 2006 to ¤30.72 (PLN 119.7) (URE 2007b) and in 2007
8 The trading is in Polish Zloty (PLN), as have been our calculations. We indicate prices in nominalEuro values, converted with the annual average exchange rate as given by ECB (2009). In 2006, thelatter was PLN 3.8959/¤, in 2007 PLN 3.7837/¤, in 2008 PLN 3.5121/¤.
9 The figure derives as 150.87 TWh*(1+(0.065*0.8))=158.4 TWh, where 150.87 TWh is the grosselectricity consumption 2006, 6.5% the increase in real GDP in 2007, 0.8 the real GDP-growth factorfor power demand (Eurostat, Ministry of the Environment 2007).
8

Figure 1: OZEX (green certificate price index at POLPX) (data: POLPX 2008).
¤34.04 (PLN 128.8) (URE 2008b). According to these prices RES producers could have
realized in 2007 a combined revenue from TGC and electricity of up to ¤97.47 (PLN
368.8) per MWh electricity generated.
3.1.2 Development forecast for the Polish TGC market
For a clear view of the possible development of the Polish TGC market in near future it is
first necessary to estimate the demand for green certificates. Therefore, we first estimate
the gross electricity consumption of the years 2008–2014 by the expected future growth
of the Polish GDP and the corresponding power demand factor. In a second step we
apply the announced RES quotas to these values to estimate TGC demand. The results
are listed in Table 2.
Table 2: TGC demand estimation for Poland
2008 2009 2010 2011 2012 2013 2014Power cons. (TWh) 165.83 172.73 179.78 188.41 197.45 206.93 216.86RES quota (%) 7.0 8.7 10.4 10.4 10.4 10.4 10.4TGC demand (m) 11.61 15.03 18.70 19.59 20.53 21.52 22.55
The development of hydropower is limited as the government wants to avoid the
further intrusions into ecological systems linked to this technology. Under these cir-
cumstances only a slight increase in small hydropower has been expected (Paska et al.
9

2009). Therefore energy production from hydropower will not exceed 2.1 TWh in the
near future.
Further available technologies to increase RES production in Poland are biomass and
biogas. The power production from these energy sources reached 1.9 TWh in 2006. That
has been an increase of 0.5 TWh compared to 2005 (Paska et al. 2009). The German
Ministry of the Environment estimates a span of ¤80–210 for the power production cost
of biomass and biogas (BMU 2007). In view of the maximum revenue expectation from
electricity generation and TGC for 2007 of about ¤97.47/MWh, as calculated above,
the development opportunities of biogas and biomass seem to be limited due to the high
risk for such projects to become unprofitable when the TGC price decreases.
For an annual growth rate of 0.5 TWh for biomass until 2014 and a 2014 hydropower
production of 2.1 TWh, there is still a production gap of 14.535 TWh to fulfill the RES
quota shown in Table 2. This gap could possibly be filled by electricity from wind power
plants. At the end of 2007 their capacity amounted to 267 MW (EWEA 2008a). PWEA
(2008) estimates the load factor for wind energy plants in Poland in a range of 20–35%.
It can be assumed that projects with the highest load factors will get realized first. An
average load factor of 30% then implies the need of 5.531 MW of wind power capacity10
to fulfill the RES quota of 10.4% in 2014. This value implies the need for an annual
capacity growth of about 750 MW until 2014. In 2007 only wind power plants with a
capacity of 123 MW have been erected. A rapid increase in the annually erected capacity
will thus be required to fulfill the targets. EWEA (2008b) estimates that the Polish wind
power production capacity will only meet 1,000 MW in 2010.
As the RES quotas set by the Polish government will hardly be achieved, the TGC
price is likely to remain high in the short and medium terms. Whether the quota could
be fulfilled until 2014 depends on further biomass growth and accelerated wind power
plant construction. The TGC demand will exceed the supply, if the RES quota is not
fulfilled in 2014. This should lead to a TGC spot market price near the actual penalty
payment of ¤70.74 (PLN 248.46).
3.2 The Romanian TGC system
Romania, with a population of about 21.5m (EU no. 7) and a nominal GDP of ¤121bn
(EU no. 17), generated in 2007 28% of its power from RES (hydropower), 40% from
coal, 17% from gas, 13% from nuclear and 2% from oil (ANRE 2007c). With carbon
emissions of 69.6 Mt it was the tenth biggest polluter in the EU (EU Commission
10 The figure derives as 14,535,000 MWh = 5,531 MW * 24 h * 365 days * 0.30 LF.
10

2008a). Romania became a full member of the European Union in 2007. In order to
fulfill its obligations related to the EU Directive 2001/77/EC and the Kyoto Protocol
the Romanian parliament set up conditions for the RES support in 2003. The basis for
RES promotion is the Electricity Law No. 13/2007 (Parliament of Romania 2007). In
2004 the government decided by decision no. 1892/2004 to introduce a TGC system for
RES promotion (Government of Romania 2004). After a revision in 2005 by government
decision 958/2005 (Government of Romania 2005) its framework is as follows:
• Promotion is given to power generation from small hydropower (< 10 MW), wind,
biomass, biogas, photovoltaics, solar and geothermal power.
• Energy distributors have to fulfill an RES quota defined by the government. In
Table 3 it is shown for the years 2008-2012.11 Note that the Romanian RES-
support policies totally disregard the pre-installed hydropower plants with nominal
production capacities above 10MW.
• RES electricity is traded with priority at the energy exchange OPCOM. For the
years 2005-2012 there is an upper price limit of ¤42 and a lower price limit of ¤24
in certificate trading defined by the national energy regulatory authority ANRE
(ANRE 2007a).12 Alternatively, an RES generator may sell TGC and electricity
to a retailer at fixed prices via a bilateral contract.
• An energy distributor who fails to fulfill his RES quota is obliged to pay a penalty
of twice the upper price limit for every missing green certificate. The penalty thus
currently amounts to ¤84.
• The green certificates are issued by Transelectrica, the owner of the national trans-
mission grid, not by ANRE. Unsold certificates are bought back by Transelectrica.
The resulting price sets the effective lower price limit for TGC.
On 3 November 2008 the Romanian parliament amended the RES promotion scheme,
extending it until 2030 (Parliament of Romania 2008). The RES quotas were slightly
decreased for the time until 2012. They increase thereafter. In order to create more
equal deployment conditions for the different RES, the number of TGC per MWh is
now technology-specific. As our analysis was done before the new legislation came into
11 In 2005 the RES quota amounted to 0.7%, in 2006 to 2.22%, in 2007 to 3.74% (Government ofRomania 2005).
12 Despite the Lei as local currency, the price limits are fixed in ¤ and adjusted annually based onexchange rate developments.
11

force and its consideration does not change our results in substance, we stick to the set
out previous framework.
3.2.1 Development of prices and RES production in the Romanian TGC system
In 2007 46,299 TGC were issued to RES producers, 41,364 (89.34%) of them were traded
at OPCOM (OPCOM 2008b). In order to fulfill the 2007 RES quota of 3.74%, given an
electricity consumption of 58.49m MWh (CIA 2008), however, the issuance of 2.187m
green certificates would have been necessary. This difference between supply and demand
explains why the TGC price in Romania has been remaining at the upper price limit
in the past (Figure 2). The reason for the weak emission of TGCs in 2007 were the
Figure 2: TGC price development – Romania (data: OPCOM 2008c)
missing RES capacities. Only 47 MW were registered at Transelectrica, 40 MW of which
were small hydropower and 7 MW wind energy (Transelectrica 2008a). To avoid high
penalty payments of energy distributors ANRE cut the RES quota in December 2007
from 3.74% to 0.098%. The new value represented 57,320 TGC. 2007 was the last year
in which ANRE had the possibility to cut RES quotas (ANRE 2007b).
3.2.2 Development forecast for the Romanian TGC market
As shown in Table 3, the demand for TGC will rapidly increase in Romania in the next
years. In the short term demand could be met by supply as RES capacities will remain
low. At the end of April 2008 the registered RES production capacity was still at 47
MW. Because of the high TGC prices a rise in RES capacities can be expected in the
mid and long term. The estimations for the Romanian RES potential range between 23–
26.075 TWh for wind power and 3.08–3.6 TWh for small hydropower (Barbu 2007: 300,
12

Table 3: TGC demand estimation for Romania (Source - energy consumption: Minis-terul Economiei (2007))
2008 2009 2010 2011 2012Electricity demand (TWh) 62.5 64.2 66.1 67.7 69.5RES quota (%) 5.2 6.78 8.3 8.3 8.3TGC demand (m) 3.25 4.35 5.49 5.62 5.77
305, Ministerul Economiei 2007). The implementation degree of this potential cannot be
estimated at the moment. Transelectrica (2008b) reports that only wind farms with a
nominal production capacity of 4,000 MW have been scheduled. It points out that due
to a shortage of backup capacities only 1,000–1,500 MW of wind power can be connected
to the grid in a first step.
Barbu (2007) estimates the load factor to amount to 34% in the best wind regions in
Romania. If new wind farms with an output of 1,500 MW are connected to the grid, given
this load factor 4.476 m TGC would be issued.13 This hypothetical TGC supply would
only meet the 2009 demand (Table 3). When 1,500 MW of wind energy will be realized,
cannot clearly be foreseen today. EWEA (2008b) assumes that only 50 MW of wind
power will be erected in Romania until 2010. This estimation seems relatively low given
the potential available in Romania. States in comparable situations have realized higher
growth rates.14 Even if wind farms with a cumulated capacity of 1,500 MW are built
until 2012, the issued 4.5 m TGC would not meet the demand of 5.77 Mio certificates
shown in Table 3. The remaining gap could perhaps be closed by small hydropower
plants, but this requires at least the realization of 41% or 320 MW of the estimated
small hydro potential. Therefore Romania cannot be expected to fulfill its RES quota
in the near future. Due to the excess demand for TGC their price should remain near
its upper limit of ¤42 until 2012.
This reveals another issue of the Romanian TGC system. As the penalty payment
for an electricity distributor is twice the upper trading limit of a TGC, it is to be
expected that the larger TGC amount will be traded in bilateral contracts, while the
trade at the certificate exchange will dry up. The reason for this development is the RES
producers’ possibility to sell certificates to distributors at a price above ¤42. As long as
the price stays below ¤84, retailers will agree, as they can avoid the penalty payment
13 This amount is calculated as: 4,467,600 MWh = 1,500 MW * 24 h * 365 days * 0.34 LF.14 For example, in 2007 in Bulgaria 34 MW, in Greece 125 MW, in Poland 123 MW and in Turkey 97
MW of new wind turbines have been erected (EWEA 2008a).
13

of ¤84. ANRE tries to avoid these complications by getting informed of all bilateral
contracts. But market actors should be able to use methods of “creative contract design”
to overcome the restriction. The issue could be solved by equalizing buy-out price and
upper price limit.
Besides selling certificates trading electricity is the second revenue source for RES
producers. The average spot market price for power traded at the OPCOM day-ahead
market was ¤47.89/MWh in 2007. There also exists an OPCOM platform for bilateral
power contracts. The average price of these contracts was¤48.35/MWh in 2007, the first
contracts for 2008 reached prices up to ¤50/MWh (OPCOM 2008a). With an income
from selling power with ¤48–50/MWh and ¤24–42 for TGC, an RES producer could
receive ¤72–92/MWh. If market actors are able to bypass the upper price limit for TGC,
a combined income of up to ¤134 may be expected.
4 Conditions for wind-power investments in Poland and Romania
In order to further evaluate the TGC schemes implemented in Poland and Romania,
we adopt an investor’s perspective. Only if RES investments are profitable, an increase
in RES production will occur under the chosen promotion systems. We determine the
internal rates of return of reference projects based on a cash-flow model and compare
them to an alternative financial investment.
4.1 RES project finance
RES projects are typically realized by companies which, by selling the power generated
to a retailer, do not have direct access to consumers. Often such companies are founded
for a specific project only.15 Their financing therefore generally differs from standard
corporate financing. The project financing means that granted loans have to be repaid
by the cash flow of the specific project. Because losses in one division cannot be coun-
terbalanced by profits in another, this implies a higher risk sensitivity than for other
power-plant investments. Risks in the area of RES can be divided into three categories
(Barbu 2007: 194-199):16
• Market risks sum up all risks concerning the market structure. Examples include
uncertainty about the development of electricity and certificate prices, and interest
and exchange rates.
15 Bottcher and Blattner (2006), Wiser and Pickle (1998) discuss the specifics of RES project finance.16 Yescombe (2002: chs. 8–10) provides a general treatment of risk factors important for real investments.
14

• Political risks concern the uncertainty concerning the future development of the
political framework. Examples include an adaption of the promotion system or
changes in the approval process of RES.
• Technical risks sum up all risks concerning the erection and operation of RES
power plants. Uncertainties about the resulting volume of investments, operational
costs, earnings forecasts and technical availability constitute examples.
As the project revenues in a TGC scheme derive from two sources, companies are par-
ticularly exposed to price changes. Thus, price volatilities, which in the middle and long
term also mediate political risks, generally constitute the most important source of un-
certainty. While investors are mainly interested in achieving high returns with low equity
input, lenders focus on the security of their loans. High debt ratios are only possible, if
investors are able to ensure stable cash flows (Wiser and Pickle 1998: 365). A cash-flow
forecast requires the fine projection of development of electricity and TGC prices. As
power demand can quite exactly be estimated, a reliable short-term to mid-term forecast
of power markets is relatively easy to realize. Of course, unexpected events can still lead
to a high short-run price volatility. To hedge against these short-term risks RES produc-
ers can sell forward their power generated. A price forecast for TGC is more difficult.
TGC price development primarily depends on when the RES quota is fulfilled. The TGC
price will remain at its upper limit as long as the quota is not fulfilled. If the quota is
fulfilled, it will equal the costs of the marginal RES producer. But these marginal costs
are not fixed, as RES often face input variations. A solution for the problem of TGC
price volatility may be the signing of long-term bilateral contracts between RES produc-
ers and retailers, fixing the price for electricity and TGC for 10-25 years. Nevertheless,
lenders tend to assume a worst-case scenario of low TGC prices and demand more equity
from investors, which decreases profitability (Bottcher and Blattner 2006: 79).
4.2 Cash-flow model
In order to evaluate the profitability of wind-power investments under the implemented
TGC schemes, we determine the internal rates of return (IRR) of a Polish and a Ro-
manian reference project based on a usual cash-flow model.17 The IRR are calculated
based on the dividends paid to shareholders. The dividend for a specific period derives
as indicated in Table 4.
17 See, e.g., Perridon and Steiner (2003: 610) for an exposition.
15

Table 4: Dividend payment calculation.
sales+ interest received- operational costs- amortization- interest paid= earnings before taxes- taxes= earnings after taxes
earnings after taxes+ amortization- loan redemption- dividend payout for the previous period= cash flow of the period+ cash on hand at beginning of the year- debt service fund= dividend payment of the period
The cash-flow model also accounts for the lenders’ perspective. As lenders are con-
cerned about the security of the money provided, they expect a project cash flow suffi-
cient to serve debt service and to handle risks, such as price volatility. To enforce these
characteristics for RES projects banks use different instruments. We consider two of
them: the debt service fund and the debt service cover ratio (DSCR). The debt service
fund obliges the debitor to hold back a specific amount of cash for bad periods in which
the cash flow is not sufficient for debt service. Dividend payments are only allowed, if
the debt service fund contains cash. In our model dividend payments are only feasible,
if the debt service fund reaches 50% of the debt service of the following period, a typical
value in practice.
The DSCR gives an indication of the project’s capability of serving the debt service
of the period. It is calculated as follows:
DSCR =operating cash flow + debt service fund
debt service of the period
The formula shows that DSCR < 1 implies the project lacks capability to serve debt
service. Therefore, banks always want a project to fulfill DSCR >1. Wind farms are
often required to fulfill DSCR > 1.3 (Bottcher and Blattner 2006: 104).
Our cash-flow model uses DSCR = 1.3 as the benchmark to balance debt and equity.
In a projection for the whole project duration it has to fulfill DSCR = 1.3 in every
period. If it fails, the initial equity-ratio in period 0 has to be increased. If the project
achieves DSCR > 1.3 in every period, the equity-ratio has to be decreased until any
period reaches DSCR = 1.3. This makes the simultaneous integration of investor’s and
lender’s perspectives in the determination of equity and debt ratios possible in the model.
Within the framework of the analyzed reference models the redeemable loans will face
16

a duration of 13 years, shall be free of redemption in year one and get a fixed coupon.
4.3 Analysis of a Polish and a Romanian reference project
In order to analyze the profitability of hypothetical wind-farm projects in Poland and
Romania, we analyze two possible strategies of investors.
Option one represents the approach of selling TGC and power at the relevant ex-
changes. This divides the analysis into two steps. In the so-called banking case we ex-
amine the maximum debt-capital quota, if the lender assumes a worst-case scenario
concerning the price development to secure his money. In the second step, the base-
case scenario, the IRR of the project is computed with the assumptions of an investor.
The base-case scenario uses the debt ratio of the banking case and considers a price
development which could be realistically assumed by investors.
Option two represents the conclusion of bilateral long-term contracts to sell TGC and
power directly to distributors. The intention is to see how IRR and debt ratio change
as compared to Option one. The results lead to a conclusion about profitability and
strategy approach for wind farms in Poland and Romania.
The hypothetical reference wind-farm projects have the following framework data:
Table 5: Framework data of the Polish and Romanian reference models.
Poland Romania
launch of wind farm 01/01/2009 01/01/2009
project duration 20 years 20 years
nominal output 20 MW 20 MW
load factor 30% 30%
annual electricity output 52,560 MWh 52,560 MWh
investment volume18 ¤31.094m ¤30.36m
operational costs year 1 ¤0.902m ¤0.9m
increase operational costs 3.5% years 1-10, 2% p.a.
2% years 11-20
debt duration 13 years 13 years
redemption free year 1 year 1
coupon 7.4% 5.5%
18 Investment volume and operational costs in the first year in Poland include a premium of 1% forexchange-rate risks. The increase in operational costs of 3.5% in the first ten years corresponds to theaverage inflation rate in Poland in the last years. It may then join the European Currency Union.
17

DSCR >1.3 >1.3
debt service fund19 50% 50%
return on deposits 3% 3%
tax rate 19% 16%
4.3.1 Option 1: sale of TGC and electricity on the market
Banking case: Banks want the project to be able to repay its debts even under the con-
ditions of a worst-case scenario. As argued above the risks for price variance is especially
high, if the project company sales power and TGC at an exchange.
Poland. We assume that the estimated electricity income will not be increased by
the regulatory authority URE, but remain at the 2007 level of ¤37.22/MWh (PLN
128.8/MWh) (URE 2008b) during the 20-year duration of the forecast. The demand for
TGC is likely to exceed supply in Poland in the next years (section 3.1.2). This implies
TGC prices at the upper limit of ¤70.74 (PLN 240) at least until 2014. As the develop-
ment of the Polish RES scheme past 2014 cannot be foreseen, we consider an income of
¤0 per TGC for the period of 2015–2028. Table 6 summarizes these assumptions:
Table 6: Income banking case – Poland.
2009–2014 2015–2028
Power income (¤/MWh) 37.22 37.22
Income per TGC (¤) 69.36 0
Based on these worst-case assumptions the reference wind farm needs an equity ratio
of 70.1%, or ¤22.100m (PLN 76.500m) equity to ensure a DSCR > 1.3 for the whole
duration. The IRR is even under this scenario positive, amounting to 0.51%. The IRR
relevant for investors is calculated in the base case.
Romania. In 2007 electricity has been traded at the Romanian day-ahead market at
an average price of ¤47.89/MWh (OPCOM 2008a). To simplify we assume a value of
¤48/MWh in the banking case. This price is not index-linked to the inflation rate for
reasons of caution. As mentioned in section 3.2.2 the demand for TGC in Romania will
exceed the supply at least until 2012. For this reason one can expect the price of a
certificate to stay at the upper limit of ¤42, which we assume also here. In 2013-2020
the RES quota may be fulfilled. Hence we assume a TGC price at the lower limit of
19 The figure indicates the required share of debt service in the following period.
18

¤24 for this period. Past 2020 the promotion of TGC will become fully canceled in this
scenario. The resulting price development of the banking-case is shown in Table 7:
Table 7: Income banking case – Romania.
2009–2012 2013–2020 2021–2028
Power income (¤/MWh) 48 48 48
Income per TGC (¤) 42 24 0
Based on these assumptions the project requires an equity ratio of 31.3% or ¤9.5m
equity to fulfill the condition of DSCR > 1.3. The resulting IRR of this worst-case-
scenario amounts to 6.02%.
Base case: The base-case scenario uses the specified equity ratio of the banking case
to calculate the project IRR under the assumptions of an investor.
Poland. In this scenario the power income is increased with the inflation rate, as the
regulatory authority URE links the RES-power remuneration determined to the average
market price of conventionally generated power. Because of the expectation of increasing
prices for fossil fuels, we increase the RES-power remuneration in the base case by 3.5%
p.a. for the years 2009-2018 and by 2% p.a. beginning in 2019. The TGC price forecast
is more difficult. In concordance with the banking case, we assume that until 2014 the
TGC price will remain at its upper limit of ¤69.35 (PLN 240). As we do not know, when
the RES quota will be fulfilled we decrease the TGC income in the forecast annually
by 20% beginning in 2015. Figure 3 illustrates the price development in the base case.
Based on these assumptions and under consideration of an banking-case equity ratio of
70.1%, we calculate an IRR of 9.49% for a Polish 20-MW reference project.
Romania. In 2009 the basic value for the power income in this scenario amounts to
¤48/MWh. It is index-linked to the ECB inflation target of 2%. An adequate assumption
for the TGC-price development is again more difficult. Although the upper price limit
in 2008 was set at ¤42, we use a value of ¤46 to appoint the TGC income for the years
2009-2012. The reason for this is the announced increase of the upper price limit up to
¤50. As it is not fixed, we take a haircut on the assumed income. From 2010 the TGC
income decreases annually by 10%. This rate is smaller than the one chosen for Poland,
because one can expect it takes more time to fulfill the RES quota as the Romanian
market is less developed. Nevertheless the lower price limit of ¤24 remains valid. As
it is not clear how the Romanian RES scheme will develop past 2020 we assume from
that year an annual TGC-price decrease of 20%. The lower price limit looses its validity.
19

Figure 3: Illustration of price development in base case – Poland.
Figure 4 illustrates this development. Using the banking-case equity ratio of 31.3%, the
base case leads to an IRR of 13.26% for a 20-MW reference project in Romania.
4.3.2 Option 2: bilateral contracts
Bilateral contracts are an opportunity to avoid the risks of price variance as RES power
producer and retailer agree to trade electricity and certificates at fixed prices during the
time of the contract. A banking case is no longer necessary, as the banks accept the
incomes of the project as secured by the contract. As a consequence the price agreed in
the bilateral contract has direct influence on the level of debt ratio.
Poland. The hypothetical bilateral contract for this project shall comprise agreed
prices for power and TGC. The benchmark for the power-price component is the 2007
RES remuneration of ¤37.22 (PLN 128.8) set by URE (URE 2008b). To simplify we use
a value of 130 PLN/MWh in the contract. OTC prices for TGCs ranged between ¤43.35
(PLN 150) and ¤69.35 (PLN 240) in 2008 (POLPX 2008). With ¤56.35 (PLN 195) per
TGC the average of this range shall be used for the TGC component of the contract.
This implies the project facing a combined income of ¤93.92 (PLN 325) per MWh of
power generated and leads to an annual project income of ¤4.936m (PLN 17.082m).
Under consideration of the bilateral contract above the project requires an equity ratio
of 11.4% or ¤3.612m (PLN 12.5m) to fulfill the requirement of DSCR > 1.3. The IRR
of Option 2 is 14.07%. A sensitivity analysis shows how tightly IRR, equity ratio and
20

Figure 4: Illustration of price development in base case – Romania.
negotiated prices are linked (Table 8).
Table 8: Sensitivity analysis bilateral contracts – Poland.
Combined income (¤) 76.58 80.92 85.25 89.58 93.91 98.25 102.59
Combined income (PLN) 265 280 295 310 325 340 355
Equity ratio (%) 30.0 25.4 20.7 16.1 11.4 6.9 2.2
IRR (%) 5.10 6.78 8.70 11.02 14.07 18.64 29.25
Romania. The conclusion of bilateral contracts is especially interesting in Romania
as the framework has an appeal to avoid market trading, which enables RES producers
to achieve a TGC income beyond the upper price limit of ¤42 (section 3.2.2). We first
analyze which IRR are possible, when the actors respect the price limit. In a second step
we have a closer look at the attractiveness of avoiding the price limit.
In 2007 the average power price at the Romanian day-ahead market was¤47.89/MWh
(OPCOM 2008a). We assume ¤48/MWh with regard to the agreed power component
of the bilateral contract. For the TGC component of the contract, RES producers are
in a favorable position to negotiate due to the high buy-out price of ¤84 a retailer
has to pay for a missing certificate. We assume a price of ¤40 as TGC component,
near the upper price limit. These values add up to a combined income of ¤88/MWh of
RES power generated. Under consideration of this contract the cash-flow model gives
an equity ratio of 2.7% (¤0.81m) and an IRR of 25.47%. The sensitivity analysis shows
again how tightly linked IRR, equity ratio and negotiated prices are (Table 9).
Table 9: Sensitivity analysis bilateral contracts – Romania.
Combined income (¤) 70 73 76 79 82 85 88Equity ratio (%) 26.0 22.1 18.1 14.5 10.5 6.6 2.7IRR (%) 5.71 7.19 8.92 10.94 13.62 17.57 25.47
We now consider the case of certificate trading beyond the upper price limit of ¤42 in
bilateral contracts. The power component remains at ¤48/MWh. For the TGC part, we
distinguish two periods. The TGC price will reach ¤63 during 2009-2012. RES producer
and retailer thereby share the advantage from the difference of bay-out payment and
upper price limit of ¤42. Retailers suggest that the RES quota may be fulfilled after
2012. So they set a TGC price of ¤36 for the second period of 2013-2028. Table 10
summarizes these assumptions. This kind of contract enables investors to use 100% debt
21
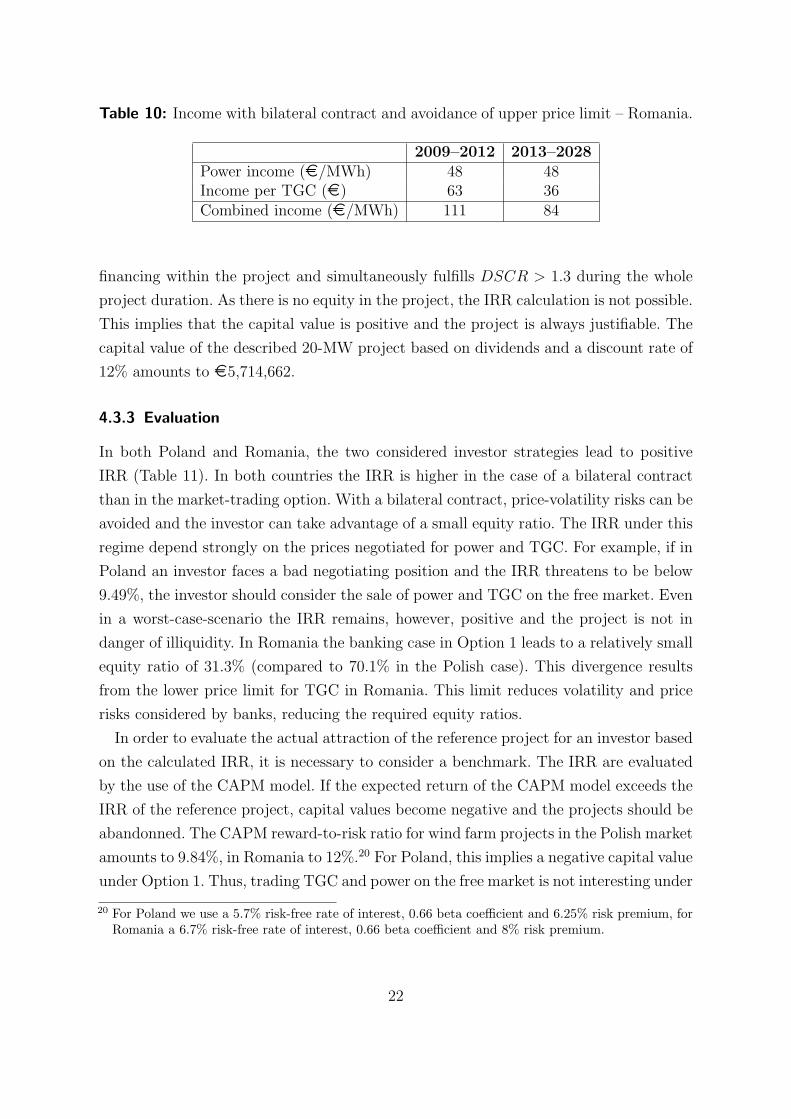
Table 10: Income with bilateral contract and avoidance of upper price limit – Romania.
2009–2012 2013–2028Power income (¤/MWh) 48 48Income per TGC (¤) 63 36Combined income (¤/MWh) 111 84
financing within the project and simultaneously fulfills DSCR > 1.3 during the whole
project duration. As there is no equity in the project, the IRR calculation is not possible.
This implies that the capital value is positive and the project is always justifiable. The
capital value of the described 20-MW project based on dividends and a discount rate of
12% amounts to ¤5,714,662.
4.3.3 Evaluation
In both Poland and Romania, the two considered investor strategies lead to positive
IRR (Table 11). In both countries the IRR is higher in the case of a bilateral contract
than in the market-trading option. With a bilateral contract, price-volatility risks can be
avoided and the investor can take advantage of a small equity ratio. The IRR under this
regime depend strongly on the prices negotiated for power and TGC. For example, if in
Poland an investor faces a bad negotiating position and the IRR threatens to be below
9.49%, the investor should consider the sale of power and TGC on the free market. Even
in a worst-case-scenario the IRR remains, however, positive and the project is not in
danger of illiquidity. In Romania the banking case in Option 1 leads to a relatively small
equity ratio of 31.3% (compared to 70.1% in the Polish case). This divergence results
from the lower price limit for TGC in Romania. This limit reduces volatility and price
risks considered by banks, reducing the required equity ratios.
In order to evaluate the actual attraction of the reference project for an investor based
on the calculated IRR, it is necessary to consider a benchmark. The IRR are evaluated
by the use of the CAPM model. If the expected return of the CAPM model exceeds the
IRR of the reference project, capital values become negative and the projects should be
abandonned. The CAPM reward-to-risk ratio for wind farm projects in the Polish market
amounts to 9.84%, in Romania to 12%.20 For Poland, this implies a negative capital value
under Option 1. Thus, trading TGC and power on the free market is not interesting under
20 For Poland we use a 5.7% risk-free rate of interest, 0.66 beta coefficient and 6.25% risk premium, forRomania a 6.7% risk-free rate of interest, 0.66 beta coefficient and 8% risk premium.
22

the Polish TGC scheme. To be successful the conclusion of a bilateral contract with a
contract volume over ¤85.25 (PLN 295) is necessary. Another conclusion is that TGC
trading at the local certificate exchange will dry up. In line with this observation, in
2007 already only 74.4% of the certificate trades have been OTC. Due to the possibility
of high returns, nevertheless an increase of RES generation capacity can be expected for
the next years. In Romania, the IRR exceeds the reward-to-risk ratio under both investor
strategies, implying positive capital values and that the reference project is marketable
in both cases. The bilateral-contract approach is, however, still more favorable. Hence
a high share of bilateral contracts can be expected in the Romanian market. Moreover,
due to the expected high investor returns further increases in the RES volume seem
likely in the near future.
Table 11: IRR and CAPM reward-to-risk ratios of different investment options (%).
Poland Romania
IRR Option 1 9.49 13.26IRR Option 2 14.07 25.47
CAPM r-t-r ratio 9.84 12.00
5 Discussion
In this section, we discuss our results first with respect to the performance of the two
systems to promote the new installation of RES and particular design issues. We then
relate them back to the TGC literature and address again the justification question.
5.1 Incentives for RES expansion
Our analysis shows that both the Polish and the Romanian system set clear incentives for
investors to expand the wind-power generation capacity. While the IRR of the reference
projects are positive in any case, compared to financial investment options the real
investment is profitable only in Romania under both investor strategies. In Poland,
profitability is restricted to the case of a bilateral contract with a combined income from
electricity and TGC above a certain moderate threshold. As a consequence, substantial
investments can be expected in both countries in the next years.
23

In both countries the schemes already led to considerable expansions of RES deploy-
ment since their implementation. Both countries have been setting relatively ambitious
targets. In fact, in both cases it seems unlikely, if not impossible, that the RES quotas
as currently specified for the next years can be fulfilled. The TGC spot market price
should, hence, remain near its effective upper bound.
5.2 Specific design issues
As in both systems the bilateral-contract option is more profitable than reliance on the
TGC and power markets, high investment activities may imply a drying up of the ex-
change trading of TGC. A peculiar feature of the Romanian system is moreover the split
between the set upper TGC price limit and the twice-as-high fine for non-compliance.
As argued above, this opens, though illegal, the discretion for contracts with an effective
TGC price above its official upper limit.
Striking about the Romanian system is more generally that the country pursues, or
was urged to do so, a massive RES-expansion policy although it had already previously
been generating almost one third of its electricity from RES. While the high quota
requirements will imply persistently high TGC prices, making them better predictable,
they also enhance uncertainty as to how the systems will develop in the next decade.
The different official claim to the contrary this also applies to the Romanian system
whose complexity the recent amendment has further increased.
5.3 Illustrative contribution of the two case studies
There exists a relatively well-developed theory of the functioning of TGC markets (e.g.
Amundsen and Mortensen 2001, 2002, Amundsen et al. 2006, Lemming 2003, Menanteau
et al. 2003, Kildegaard 2008). We focused on wind-power investments and mentioned a
possible shift to bilateral contracts, as the more profitable strategy for the considered ref-
erence projects. As wind power is relatively capital-intensive with low operational costs,
our findings fit Kildegaard’s (2008) prediction that such technologies will typically find a
more profitable financing via contracts than by way of the TGC exchange trading. This
weakens, interestingy, substantially the TGC market as the central element suggesting
the efficiency of such systems. It moves them effectively close to feed-in-tariff systems,
with their garanteed prices at the busbar for green electricity.
24

5.4 Environmental-economics objection
While the RES-support policies in both Poland and Romania have been successful in
the past with respect to the additional deployment of RES installations and can be pre-
dicted to persist so in the next years, they are confronted with the more fundamental
justification issue discussed in section 2. Thus far, there are not sufficient data or studies
available to quantify the net benefits of theses policies for consumers and on social level.
However, all additional costs will ultimately be charged from final power consumers.
Especially in Romania massive over-investments can be expected. Losses in purchasing
power per capita similar to those calculated by Frondel et al. (2008) cannot be excluded.
As both countries are subject to the EU ETS, additional greenhouse-gas emissions re-
ductions beyond those specified under the EU burden sharing can be excluded. Only the
net employment effect is difficult to judge without a detailed analysis.
6 Conclusion
Quota obligation schemes based on tradable green certificates have become a popular
policy instrument to expand power generation from renewable energy sources. However,
a justification for policies supporting the deployment of RES technologies cannot be
identified on environmental-economics grounds. We study in detail the systems recently
implemented in Poland and Romania. Apart from successfully fostering the deployment
of RES in their first years of implementation, they can be expected to persist to set such
incentives also in the next years. The RES quotas are even set that it is unlikely they be
fulfilled. RES stimulation is expected to be more vigorous in Romania than in Poland.
Although too early for a quantitative judgment, TGC-based quota obligation systems
underlie, however, the same shortcomings as feed-in tariff schemes with respect to (zero)
additionality in emission reductions, if implemented in parallel with an emissions trading
scheme, such as here the EU ETS. They drag purchasing power by large implicit RES
subsidies and, in tendency, negatively distort the carbon price, reducing the abatement
pressure on polluting technologies.
Based on these arguments, a fundamental reconsideration of current RES support
policies seems necessary, on both national and regional levels as well as the suprana-
tional EU level. At the same time, as the ecological transformation of energy production
and use is particularly cost-intensive and RES constitute a necessary part of a viable
solution of the problem of anthropogenic climate change, further research into the in-
tertemporally efficient allocation of the available resources is particularly important.
25

References
Agnolucci, P., 2007. The effect of financial constraints, technological progress and long-
term contracts on tradable green certificates. Energy Policy 35, 3347–3359.
Amundsen, E.S., Baldursson, F.M. and J.B. Mortensen, 2006. Price Volatility and Bank-
ing in Green Certificate Markets. Environmental and Resource Economics 35, 259–287.
Amundsen, E.S. and L. Bergman, 2008. Green Certificates and Market Power on the
Nordic Power Market. Paper at the EAERE conference, Gothenburg, Sweden.
Amundsen, E.S. and J.B. Mortensen, 2001. The Danish Green Certificate System: some
simple analytical results. Energy Economics 23, 489-509.
Amundsen, E.S. and J.B. Mortensen, 2002. Erratum to “The Danish Green Certificate
System: some simple analytical results” [Energy Economics 23(2001) 489-509]. Energy
Economics 24, 523-524.
[ANRE] Autoritatea Nationala de Reglementare in domeniul Energiei (Romanian energy
regulatory authority), 2007a. Guidelines for the Producer of Electricity from Renew-
able Energy Sources (ERES). URL: http://www.anre.ro/documente.php?id=394.
[ANRE] Autoritatea Nationala de Reglementare in domeniul Energiei (Romanian en-
ergy regulatory authority), 2007b. Ord. 63/2007 - modificarea cotei obligatorii de
achizitie de certificate verzi de catre furnizorii de energie electrica pentru 2007. URL:
http://www.anre.ro/documente.php?id=390.
[ANRE] Autoritatea Nationala de Reglementare in domeniul Energiei (Roma-
nian energy regulatory authority), 2007c. Raport anual ANRE 2007. URL:
http://www.anre.ro/download.php?id=2022.
Australian Government, 2008. Carbon Pollution Reduction Scheme. Australia’s Low
Pollution Future. White Paper. 2 Vols. URL: http://www.climatechange.gov.au/
whitepaper/report/index.html
Australian Government, 2009. Australia’s Renewable Energy Target. URL:
http://www.climatechange.gov.au/renewabletarget/
26

Barbu, A.-D., 2007. Investing in Renewable Energy Sources. An Assessment of Non-
Technological Issues in Central and Eastern Europe. Dr. Kovac, Hamburg.
Blasi, A., 2006. Lerneffekte mit Spillover - Optimale Regulierung, Marktevolution
und empirische Evidenz. Mit einer theoretischen und empirischen Untersuchung des
Windenergiesektors (Learning effects with spillover. Optimal regulation, market evo-
lution and empirical evidence. With a theoretical and empirical investigation of the
wind power sector). PhD thesis. Kiel University.
Blasi, A. and T. Requate, 2005. Learning-by-Doing with Spillovers in Competitive In-
dustries, Free Entry, and Regulatory Policy. Economics Working Paper No 2005-09,
Department of Economics, Kiel University.
Blasi, A. and T. Requate, 2007. Subsidies for Wind Power: Surfing Down the Learn-
ing Curve? Economics Working Paper No 2007-28, Department of Economics, Kiel
University.
[BMU] Bundesministerium fur Umwelt, Naturschutz und Reaktorsicherheit (Federal
ministry of the environment), 2004. Konsolidierte Fassung der Begrundung zu dem
Gesetz fur den Vorrang Erneuerbarer Energien (Consolidated version of the justifica-
tion of the law for primacy of renewable energy sources). URL: http://www.erneuerbar
e-energien.de/files/pdfs/allgemein/application/pdf/eeg begruendung.pdf.
[BMU] Bundesministerium fur Umwelt, Naturschutz und Reaktorsicherheit (Federal
ministry of the environment), 2007. Renewable Energy Sources Act (EEG) Progress
Report 2007. Available online.
Bohringer, C. and P.E. Jochem, 2007. Measuring the immeasurable – A survey of sus-
tainability indices. Ecological Economics 63, 1-8.
Bottcher, J. and P. Blattner, 2006. Projektfinanzierung (Project finance). Oldenbourg,
Munich.
[CIA] Central Intelligence Agency, 2008. The World Factbook. URL:
https://www.cia.gov/library/publications/the-world-factbook/geos/ro.html.
Del Rio, P., 2007. The interaction between emissions trading and renewable electricity
support schemes. An overview of the literature. Mitigation and Adaptation Strategies
for Global Change 12(8), 1363–1390.
27

[ECB] European Central Bank, 2009. ECB reference exchange rate, annual develop-
ment of Polish zloty. URL: http://sdw.ecb.europa.eu/quickview.do?SERIES KEY=
120.EXR.A.PLN.EUR.SP00.A&.
Ellerman, A.D. and B.K. Buchner, 2007. The European Union Emissions Trading
Scheme: Origins, Allocation, and Early Results. Review of Environmental Economics
and Policy 1(1), 66-87.
EU Commission, 2008a. Emissions trading: 2007 verified emissions from EU ETS busi-
nesses. IP/08/787. URL: http://europa.eu/rapid/pressReleasesAction.do?reference=
IP/08/787&format=PDF&aged=0&language=EN&guiLanguage=en.
EU Commission, 2008b. The support of electricity from renewable energy sources. Com-
mission staff working document, SEC(2008) 57. URL: http://ec.europa.eu/energy/
climate actions/doc/2008 res working document en.pdf.
European Parliament, 2003. Treaty of Accession. Annex II Chapter 12(A) 8 - amendment
of Directive 2001/77/EC. URL: http://www.europarl.europa.eu/enlargement new/
treaty/doc en/aa00019en03.doc
[EWEA] European Wind Energy Association, 2008. Delivering Energy and Climate So-
lutions. EWEA 2007 Annual Report. Available online.
[EWEA] European Wind Energy Association, 2008. Pure Power – Wind Energy Scenar-
ios up to 2030. Available online.
Finon, D., 2006. The Social Efficiency of Instruments for the Promotion of Renewable
Energies in the Liberalised Power Industry. Annals of Public and Cooperative Eco-
nomics 77(3), 309-343.
Finon, D. and P. Menanteau, 2004. The static and dynamic efficiency of instruments of
promotion of renewables. Energy Studies Review 12(1), 53-81.
Finon, D. and Y. Perez, 2007. The social efficiency of instruments of promotion of re-
newable energies: A transaction-cost perspective. Ecological Economics 62, 77-92.
Frondel, M., Ritter N. and C.M. Schmidt, 2008. Germany’s solar cell promotion: Dark
clouds on the horizon. Energy Policy 36, 4198–4204.
Gan, L., Eskeland, G.S. and H.H. Kolshus, 2007. Green electricity market development:
Lessons from Europe and the US. Energy Policy 35, 144-155.
28

Gillenwater, M., 2008a. Redefining RECs—Part 1: Untangling attributes and offsets.
Energy Policy 36, 2109–2119.
Gillenwater, M., 2008b. Redefining RECs—Part 2: Untangling certificates and emission
markets. Energy Policy 36, 2120–2129
Government of Romania, 2004. Government Decision no 1892/2004 establishing the
promotion system for electricity produced from renewable energy sources. Monitorul
Oficial nr. 1056 din 2004.
Government of Romania, 2005. Government Decision no 958/2005 amending Govern-
ment Decision no 443/2003 on the promotion of electricity produced from renewable
energy sources and amending and completing Government Decision no 1892/2004
establishing the promotion system for electricity produced from renewable energy
sources. Monitorul Oficial nr. 0809 din 2005.
Hindsberger, M., Nybroe, M.H., Ravn, H.F. and R. Schmidt, 2003. Co-existence of elec-
tricity, TEP, and TGC markets in the Baltic Sea Region. Energy Policy 31, 85-96.
Jaffe, A.B., Newell, R.G. and R.N. Stavins, 2002. Environmental Policy and Technolog-
ical Change. Environmental and Resource Economics 22, 41–69.
Jaffe, A. B., Newell, R. G. and R. N. Stavins, 2005. A tale of two market failures: tech-
nology and environmental policy. Ecological Economics 54, 164-174.
Jensen, S.G. and K. Skytte, 2002. Interactions between the power and green certificate
markets. Energy Policy 30, 425–435.
Kildegaard, A., 2008. Green certificate markets, the risk of over-investment, and the role
of long-term contracts. Energy Policy 36, 3413–3421.
Koroneos, C.J. and E.A. Nanaki, 2007. Electric energy sustainability in the Eastern
Balkans. Energy Policy 35, 3826-3842.
Kotchen, M.J., 2005. Impure Public Goods and the Comparative Statics of Environmen-
tally Friendly Consumption. Journal of Environmental Economics and Management
49, 281–300.
Kotchen, M.J., 2006. Green Markets and Private Provision of Public Goods. Journal of
Political Economy 114(4), 816-834.
29

Lemming, J., 2003. Financial risks for green electricity investors and producers in a
tradable green certificate market. Energy Policy 31, 21–32.
Menanteau, P., Finon, D. and M.-L. Lamy, 2003. Price versus quantities: choosing poli-
cies for promoting the development of renewable energy. Energy Policy 31(8), 799–812.
Ministerul Economiei (Ministry of economics), 2007. Strategia Energetica A Romaniei
Pentru Perioada 2007-2020 (Energy strategy in Romania in 2007-2020). URL:
http://www.minind.ro/presa 2007/septembrie/strategia energetica romania.pdf.
Ministry of Economy, 2006. Dziennik Ustaw z 15 listopada 2006 Nr 205 poz. 1510 (Jour-
nal of Laws of the Republic of Poland of 15 November 2006 no. 205 item 1510).
URL: http://www.infor.pl/dziennik-ustaw,rok,2006,nr,205/poz,1510,rozporzadzenie-
ministra-gospodarki-zmieniajace-rozporzadzenie-w-sprawie.html.
Ministry of the Environment, 2007. Krajowy Plan Rozdzialu Uprawnien Do Emisji
CO2 na lata 2008 – 2012 (Domestic plan of distribution of entitlement to CO2 emis-
sions for years 2008-2012). URL: http://www.mos.gov.pl/she/prace nad kpru/kpru/
KPRU II projekt 2007 18052007.pdf.
Morthorst, P.E., 2001. Interactions of a tradable green certificate market with a tradable
permits market. Energy Policy 29, 345-353.
[OPCOM] Operatorul Pietei de Energie Electrica din Rumania (Romanian power market
operator), 2008a. Press Release January 10th, 2008. URL: http://www.opcom.ro/
portal/Uploads/doc/Comunicate/20080110 EN.pdf.
[OPCOM] Operatorul Pietei de Energie Electrica din Rumania (Romanian power market
operator), 2008b. Press release, 3rd March 2008. URL: http://www.opcom.ro/portal/
Uploads/doc/Comunicate/20080303 EN.pdf.
[OPCOM] Operatorul Pietei de Energie Electrica din Rumania (Romanian power market
operator), 2008c. Aggregated Curves Archive. URL: http://www.opcom.ro/portal/
content.aspx?lang=EN&item=2165.
Palmer, K. and D. Butraw, 2005. Cost-effectiveness of renewable energy policies. Energy
Economics 27, 873-894.
Parliament of Romania, 2007. The Electricity Law No. 13/2007. URL: http://www.
minind.ro/domenii sectoare/leg armonizata/energie/EnergyLAW13 2007 27 07.pdf.
30

Parliament of Romania, 2008. Lege pentru stabilirea sistemului de promovare a produc-
erii ernergiei di surse regenerabile de energie (Law regarding the determination of the
promotion system of power generation from renewable energy sources). Monitorul
Oficial Nr. 743/3.XI.2008
Paska, J., Salek, M. and T. Surma, 2009. Current status and perspectives of renewable
energy sources in Poland. Renewable and Sustainable Energy Reviews 13, 142–154.
Perridon, L. and M. Steiner, 2003. Finanzwirtschaft der Unternehmung (Corporate fi-
nance). 12th ed. Vahlen, Munich.
[POLPX] Towarowa Gielda Energii (Polish power exchange), 2008. Historical data for the
green certificate market. URL: http://www.polpx.pl/main.php?index=223&show=
38&lang=en.
[PWEA] Polish Wind Energy Association, 2008. Assessment of wind en-
ergy development opportunities and potential in Poland until 2020. URL:
http://www.pwea.pl/files/assessment of wind energy development opportunities and
potential in poland until 2020.pdf
Rader, N. and R. Norgaard, 1996. Effciency and Sustainability in Restructured Elec-
tricity Markets: The Renewables Portfolio Standard. The Electricity Journal 9(6),
37-49.
Ragwitz, M., Held, A., Resch, G., Faber, T., Haas, R., Huber, C., Coenraads, R., Voogt,
M., Reece, G., Morthorst, P.E., Jensen, S.G., Konstantinaviciute, I., and B. Heyder,
2007. OPTRES. Assessment and optimisation of renewable energy support schemes in
the European electricity market. URL: http://www.optres.fhg.de/OPTRES FINAL
REPORT.pdf.
Reiche, D., 2006. Renewable energies in the EU-Accession States. Energy Policy 34,
365–375.
[RGGI] Regional Greenhouse Gas Initiative, 2008. RGGI Fact Sheet. URL:
http://www.rggi.org/about/documents
Sejm (Polish Parliament), 2006. The Act of 10 April 1997 - The Energy Law (with later
changes). Journal of Laws of 2006 No. 89, Item 625. URL: http://www.erranet.org/
index.php?name=OE-eLibrary&file=download&id=3691&keret=N&showheader=N
31

Transelectrica (Romanian power grid company), 2008a. Certificate Verzi emise produca-
torilor de E-SRE pentru energia produsa in 2007 (Overview of number of certificates
issued in 2007). URL: http://transelectrica.ro/documente/dc/Emise dc 2007.htm
Transelectrica (Romanian power grid company), 2008b. Transelectrica presents a few
aspects of electricity generation from renewable sources - wind energy. URL:
http://transelectrica.ro/6en.php.
[URE] Urzad Regulacij Energetyki (Energy regulatory office), 2007a. Penalty payment
announcement 2007. URL: http://www.ure.gov.pl/portal.php?serwis=pl&dzial=15&
id=2210.
[URE] Urzad Regulacij Energetyki (Energy regulatory office), 2007b. Press release
concerning the 2006 power remuneration. URL: http://www.ure.gov.pl/portal/
pl/271/1178/Informacja w sprawie sredniej ceny sprzedazy energii elektrycznej
wytworzonej w .html.
[URE] Urzad Regulacij Energetyki (Energy regulatory office), 2008a. Penalty payment
announcement 2008. URL: http://www.ure.gov.pl/portal/pl/15/2551.
[URE] Urzad Regulacij Energetyki (Energy regulatory office), 2008b. Press release con-
cerning the 2007 power remuneration. URL: http://www.ure.gov.pl/portal/pl/44/
2593/.
[URE] Urzad Regulacij Energetyki (Energy regulatory office), 2008c. Activity Report
2007.
Wiser, R., Namovicz, C., Gielecki, M. and R. Smith, 2007. The Experience with Renew-
able Portfolio Standards in the United States. The Electricity Journal 20(4), 8-20.
Wiser, R.H. and S.J. Pickle, 1998. Financing investments in renewable energy - the
impacts of policy design. Renewable and Sustainable Energy Reviews 2, 361–386.
Wiser, R., Porter, K. and R. Grace, 2005. Evaluating Experience With Renewables
Portfolio Standards in the United States. Mitigation and Adaptation Strategies for
Global Change 10(2), 237–263.
Yescombe, E.R., 2002. Principles of Project Finance. Academic Press, San Diego, CA.
32