trade liberalization and price-cost margin in indian industries bishwanath goldar suresh chand...
TRANSCRIPT
TRADE LIBERALIZATION AND PRICE-COSTMARGIN IN INDIAN INDUSTRIES
BISHWANATH GOLDARSURESH CHAND AGGARWAL
First version received June 2004; final version accepted May 2005
Using panel data for 137 three-digit industries for 1980/81 to 1997/98, the paper exam-ines the effect of trade liberalization on price-cost margins in Indian industries. An econo-metric model is estimated to explain variations in price-cost margins, taking tariff andnontariff barriers among the explanatory variables. The results indicate that the loweringof tariffs and removal of quantitative restrictions on imports of manufactures in the 1990shad a significant pro-competitive effect on Indian industries, particularly concentratedindustries, tending to reduce the price-cost margins. The paper notes that despite thepro-competitive effects of trade liberalization reinforced by domestic industrial deregu-lation, the price-cost margin increased in the post-reform period in most industries andaggregate manufacturing, which is attributed to a marked fall in the growth rate of realwages and a significant reduction in labor’s income share in value added in the post-reform period, reflecting perhaps a weakening of industrial labor’s bargaining power.
Keywords: Trade liberalization; Price-cost margin; Indian industry
I. INTRODUCTION
A NUMBER of studies for developing countries have found that increased ex-posure to import competition causes markups or profit margins in indus-tries to fall, with the largest effect being in the highly concentrated indus-
tries and in large plants.1 These include studies undertaken for Chile, Columbia,Mexico, Morocco, and Turkey. That import competition reduces markups has beenfound also in two recent cross-country studies covering both developed and devel-oping countries (Hoekman, Kee, and Olarreaga 2001; Kee and Hoekman 2003).
Two approaches have been taken to examine the effect of increased import com-
The Developing Economies, XLIII-3 (September 2005): 346–73
––––––––––––––––––––––––––This paper was prepared when the first author was International Finance Corporation of India (IFCI) /Industrial Development Bank of India (IDBI) Chair Professor at the Indian Council for Research onInternational Economic Relations, New Delhi. The authors are grateful to Professor K. L. Krishnaand three anonymous referees of the journal for their comments on earlier versions of the paper.
1 See, for instance, Roberts and Tybout (1996) and Currie and Harrison (1997). For a review of theliterature, see Tybout (2001) and Epifani (2003).
347TRADE LIBERALIZATION AND PRICE-COST MARGIN
petition on markups in industries. In one approach, the price-cost margin (PCM)(defined as the ratio of sales net of expenditure on labor and intermediate inputsover sales) is used as an indicator of the markup, and it is regressed on a set ofexplanatory variables including variables representing the level of import competi-tion. In the other approach, the methodology developed by Hall (1988) is used. Itinvolves regression of output growth rate on a share-weighted growth rate of in-puts, the regression yielding the markup as the slope coefficient. By allowing thecoefficient to vary over time, one can test whether import competition affectsmarkup.2 The empirical results that have been obtained by the two approaches largelypoint in the same direction, and a general conclusion that may be drawn from theeconometric evidence is that increased exposure to import competition leads to areduction in PCM or markup in imperfectly competitive industries. In other words,import competition disciplines domestic firms in imperfectly competitive indus-tries.
A theoretical explanation for the observed phenomenon can be provided by link-ing the removal/reduction of import barriers to the elasticity of demand for prod-ucts of domestic firms (Tybout 2001). Under the assumption of static profit maxi-mization, the price set by a firm operating in an imperfectly competitive market asa ratio to marginal cost is a decreasing function of the elasticity of demand. Let pdenote price, c marginal cost, and η elasticity of demand, then the relationshipbetween markup and elasticity of demand may be written as:
p = η. (1)c η − 1
As import barriers are removed/reduced, the elasticity of demand would increasebecause of increased availability of imported goods, fall in the tariff-inclusive priceof such goods to domestic consumers, and enlargement of product variety, and thiswould in turn lead to a fall in the markup.
If one considers instead a theoretical framework typified by a collusive equilib-rium rather than static profit maximization, then a theoretical argument for expect-ing import liberalization to make markups fall is that cooperative behavior maybecome unsustainable in such an environment (Tybout 2001). Maintaining collu-sive equilibrium may become difficult after imports are liberalized because importliberalization changes the pay-off to defecting, or changes firms’ ability to punishdefectors or makes defection hard to detect.
2 Hoekman, Kee, and Olarreaga (2001) apply the structural regression approach of Hall to estimatethe average industry markup for different countries, which are then used in a regression analysisrelating markup to import penetration and other explanatory variables. Currie and Harrison (1997)regress output growth on input growth, the tariff and nontariff barriers, and interaction terms in-volving input growth and the import barriers, thereby estimating jointly the markups and the effectof trade barriers on productivity and markups.
348 THE DEVELOPING ECONOMIES
It should be pointed out here that even though import liberalization leads to greatercompetition, it need not always have an adverse effect on profitability (PCM) ofindustrial firms (there is such a possibility at least in the short run). The reasons arethat the firms may increase efficiency (through introduction of advanced technol-ogy or restructuring into the areas of their core competence) or the firms may un-dertake more R&D and advertisement in the changed environment, all of whichshould have a favorable effect on profitability. Further, increase in import penetra-tion may lead to mergers among the foreign and domestic firms in concentratedmarkets. Evidently, though there are strong theoretical arguments for expectingtrade liberalization to lead to lower profit margins in concentrated industries, andthe proposition also has good empirical support, this need not happen in all cases.For instance, in a study of the effect of trade liberalization on profitability in theTurkish manufacturing industry, Yalçin (2000) finds that import penetration led to adecrease in the PCM in private sector firms in general, but the PCM in highly con-centrated private sector industries increased instead of going down.
The object of this paper is to analyze the effect of post-1991 trade liberalizationin India on PCMs in Indian industries.3 India has undertaken a major reform oftrade policies since 1991 with large reductions made in tariff and nontariff barrierson imports of industrial products,4 and accordingly a study of the pro-competitiveeffects of these reforms would be useful and interesting. There is a growing body ofempirical economic literature on the effects of post-1991 industrial and trade re-forms in India on the performance of industrial firms, especially on industrial pro-ductivity.5 By comparison, there has been relatively much less research on the ef-fect of the reforms on markups or PCMs in Indian industries. The present papermakes an attempt to fill this gap in the literature. To this end, an econometric analy-sis of the effect of trade liberalization on PCM in Indian industries is undertakenusing panel data for 137 three-digit industries covering the period 1980/81 to 1997/98.
The rest of the paper is organized as follows. Section II discusses briefly thefindings of some recent studies on markups or profitability in Indian industries.Section III discusses the model applied for the analysis, the estimation technique,
3 The analysis is confined to the organized industrial sector comprising industrial units that employ10 or more workers with power or 20 or more workers without power.
4 For a discussion on India’s economic reforms since 1991, see Joshi and Little (1996), among oth-ers.
5 Balakrishnan, Pushpangadan, and Suresh Babu (2000) and Topalova (2003) have studied the effectof trade liberalization on industrial productivity using firm-level data for Indian manufacturing.Epifani (2003) has recently reviewed the studies on the effect of economic reforms on the perfor-mance of Indian industries based on firm-level data. Apart from these, there have been a number ofstudies which have used industry-level data to examine the effects of industrial and trade reformson industrial performance in India (for example, Das 2001, 2003a; Aghion et al. 2003; Goldar andKumari 2003; Pattnayak and Thangavelu 2003).
349TRADE LIBERALIZATION AND PRICE-COST MARGIN
the data sources, and the construction of variables used for this study. The empiricalresults are presented in Section IV, which begins with an analysis of trends in PCMand labor income in Indian industries in the 1980s and 1990s, followed by theestimates of the model. Section V summarizes the main findings of the study andpresents our conclusion.
II. FINDINGS OF EARLIER STUDIES
Krishna and Mitra (1998) in their study covering four Indian industries found thatin the post-reform period markup declined significantly in three of the four indus-tries. The decrease was to such a level that the markup parameter for firms droppedto a value of less than one, i.e., firms would incur losses. They rationalize thisfinding on the grounds that “in the presence of adjustment and sunk costs a firmmay lose money while it adapts to a new trading environment.”6
In contrast, the study undertaken by Srivastava, Gupta, and Datta (2001), basedon company-level data for the period 1980 to 1997, found that the markup increasedin the post-reform period in publishing and printing, leather products, food prod-ucts, rubber and plastic products, motor vehicles, and electrical machinery. Theirexplanation was that these are generally consumer goods and consumer durablesproducing sectors that faced very limited foreign competition during the periodstudied. The markup declined in nonmetallic mineral products, basic metals, andpaper products. The squeeze in the markup for metals and nonmetallic mineralproducts was attributed to increased domestic and foreign competition. For textiles,machinery, and fabricated metal products, no change in markup was found. Thus,the results of the study indicate that despite large reductions in tariff and nontariffbarriers on imports of industrial products, a reduction in markups did not take placein the post-reform period in most Indian industries. However, in certain industries,import liberalization did have a significant adverse effect on the profitability ofIndian firms.
Balakrishnan, Pushpangadan, and Suresh Babu (2002) applied Hall’s methodol-ogy to study the effect of economic reforms on markup and scale efficiency inIndian industries. They used the Prowess database of the CMIE (Centre for Moni-toring Indian Economy, Mumbai). Data for 3,596 firms for the period 1988/89 to1997/98 was used for their analysis. They found that the economic reforms reducedthe markup in certain industries (e.g., rubber, plastic and petroleum products, ma-chinery, and transport equipment), while it raised the markup in certain other indus-tries (e.g., food products, chemicals, basic metals, metal products, and nonmetallic
6 In industries marked by large sunk entry cost, unexpected foreign competition may cut into therevenues that firms had expected to earn to cover their entry cost (rather than merely squeezingmonopoly profits), making them sorry ex-post that they had entered (Tybout 2001).
350 THE DEVELOPING ECONOMIES
metal products). The regression equation estimated of all manufacturing firms takentogether suggested that in general economic reforms caused markup in Indian in-dustries to increase.
While Krishna and Mitra (1998), Srivastava, Gupta, and Datta (2001), andBalakrishnan, Pushpangadan, and Suresh Babu (2002) used the structural regres-sion approach of Hall to study the effect of economic reforms on markups in Indianindustries, Kambhampati and Parikh (2003) took the other approach, i.e., estimat-ing a regression equation in which PCM is taken as the dependent variable. Theyused data for 281 firms for the period 1980 to 1998. Analyzing trends in profit(price-cost) margins, they found that in firms with above average export intensity(exports to sales ratio over 4.5 percent), the profit margin increased during 1992–98as compared to 1980–90, but in relatively less export-oriented firms the profit mar-gin went down. The fall was from 20 percent during 1980–90 to 9 percent during1992–98.
For their regression analysis, Kambhampati and Parikh used a dummy variableto capture the effect of trade reforms (the dummy variable being based on time-periods, pre- and post-reform, captured the effects of industrial and other policyreforms as well). Export intensity, import intensity, R&D intensity, capital-outputratio, and market share were among the explanatory variables used. The dummyvariable entered the regression equation separately as well as in interaction withother explanatory variables. The results indicate that the effect of liberalization onprofitability was mainly through its impact on other firm variables, particularlymarket share, advertising, R&D, and exports. While exports had a pro-competitiveeffect, advertising and R&D caused profitability to increase. The results of the analy-sis thus suggest that while trade liberalization per se had a pro-competitive effect, itchanged the impact of exports, R&D, and advertisement on profitability and thusthe overall effect on PCMs may have been positive for certain sections of domesticindustry.
Compared with the above three studies, the study of profitability of Indian indus-tries undertaken by Rao (2001) is more detailed. Rao’s work, like Srivastava, Gupta,and Datta (2001) and Balakrishnan, Pushpangadan, and Suresh Babu (2002), isbased on company-level data taken from the Prowess database of the CMIE. In heranalysis of profitability of industrial companies, she included variables like con-centration ratio, market share, advertising-sales ratio, growth rate of industry, ex-port-sales ratio, import-sales ratio, etc. Panel data for a total of 1,458 companiesbelonging to six industries (three producer goods industries and three consumergoods industries) for the period 1990/91 to 1998/99 were used for her analysis. Forthe selected industries, she found dismal profitability performance by firms in thepost-reform period. Her econometric results show that growth of industry outputand industrial concentration are statistically significant determinants of firm profit-ability in India. External trade is found to be playing a significant role only in pro-
351TRADE LIBERALIZATION AND PRICE-COST MARGIN
ducer goods industries where reduction in import duties has been relatively higher.One limitation common to the five studies discussed above is that the tariff and
nontariff barriers have not been directly included in the analysis as variables affect-ing markups or profitability. In this paper, we use tariff rates and nontariff barriersas explanatory variables in the regression equations estimated to explain PCM,thereby employing inter-temporal and across-industry variation in trade protectionmeasures to identify the effect of trade policies. This is, needless to say, far moresatisfactory than employing a post-reform dummy variable as Krishna-Mitra,Kambhampati-Parikh, Srivastava et al., and Balakrishnan et al. have done.7
III. MODEL, DATA, AND VARIABLES
A. The Model
As mentioned earlier, we use an industry-level panel data set for the econometricanalysis (discussed further in Subsection C). The variable of interest is PCM, andthe aim of the analysis is to find out whether trade liberalization had a significantpro-competitive effect, reducing PCMs in Indian industries.
If it is assumed that unit expenditures on labor and intermediate inputs are con-stant with respect to output, then the PCM is a monotonic transformation of themarkup. It can also be shown that the PCM is current economic profit over salesplus the competitive return to capital over revenue (Tybout 2001). Thus, the PCMof jth industry in period t, denoted by PCMjt, may be written as:
PCMjt = + , (2)
where π denotes profits, r market return on capital, δ depreciation rate, K capital, pprice, and q quantity produced. In industries where competition drives economicprofits to zero, the variables representing import competition should contribute noth-ing to the explanation of variations in PCM after controlling for the ratio of capitalstock to output. On the other hand, if economic profits are present, then increasedimport competition should lower PCM by increasing price elasticity or by destroy-ing collusive equilibria (Tybout 2001). Accordingly, the basic model used in stud-ies on the effect of import competition on PCM based on industry-level data typi-cally takes the following form (Epifani 2003):
PCMjt = f (Hjt, IMPjt, Hjt · IMPjt, Kjt /qjt, Ij, Tt). (3)
Here, Hjt is the Herfindahl index (HI, an index of industry structure that is inverselyrelated to the degree of competition) and IMPjt is the import penetration ratio
π jt (rt + δ)Kjt
pjtqjt pjtqjt
7 The advantage of including tariff and nontariff barriers in the analysis, rather than using a dummyof the post-reform period, has been noted by Goldar and Kumari (2003) and Topalova (2003).
352 THE DEVELOPING ECONOMIES
(reflecting import competition). The pro-competitive effect of trade liberalizationshould show up in a negative coefficient of the import penetration variable. Theinteraction term Hjt · IMPjt allows one to test the hypothesis that if highly concen-trated industries enjoy above normal profits because of market power, the adverseeffect of import competition on profitability should be greater for such industries.Thus, the coefficient of the interaction term should be negative. The capital-outputratio controls for inter-industry differences in capital intensity, while Ij and Tt areindustry and time dummies capturing industry-specific and time-specific effects.
The model we use for our analysis is somewhat different from the one in equa-tion (3) above though the underlying relationships between variables are the same.The model may be written as:
PCMjt = f (DCONj, MBjt, DCONj · MBjt, KQjt, Xjt), (4)
where MB denotes import barriers, KQ denotes capital-output ratio, and DCON is adummy variable representing industrial concentration (taking value one for highlyconcentrated industries, zero otherwise). X is the vector of other variables used inthe estimated model, which are expected to influence PCM in industries.
Since the analysis is undertaken at the three-digit industry level, and given thatno estimates of industrial concentration (e.g., Herfindahl index) are readily avail-able at that level of industrial disaggregation for the period considered in the study(1980/81 to 1997/98), we have used a dummy variable, DCON, in the model tocapture the effect of market power on profitability. Based on the Prowess databasefor Indian firms, we have calculated the HI for 132 product categories for the early1990s, i.e., from 1991 to 1995. The average value of HI has been used as the basisof classifying Indian industries into highly concentrated ones and other industries.After matching the 132 product categories into a Annual Survey of Industries (ASI)three-digit classification, we have identified highly concentrated industries as thosewhose value of HI is above 1,800 (as per the practice followed in the United States).A dummy variable has accordingly been formed. For 45 industries identified ashighly concentrated, the dummy variable DCON has been assigned the value ofone, and for the remaining it has been given the value of zero. It would have beenbetter if we had used the HI directly as an explanatory variable in the estimatedequation. However, we could not do that because the Prowess database we used didnot have company balance-sheet data for the 1980s.
To capture the effect of import competition, tariff rates and nontariff barriers(import coverage ratio) have been used. This makes our study somewhat differentfrom most earlier studies, which have used the import penetration ratio to representimport competition. Two studies that have used tariff and nontariff barriers to studythe effect of import competition on markup are Grether (1996) and Currie andHarrison (1997).
Besides the three variables mentioned above, we have used two other explana-

353TRADE LIBERALIZATION AND PRICE-COST MARGIN
tory variables. These are the growth rate of the industry (in terms of real output) andthe deviation of income share of labor from estimated elasticity of real value addedwith respect to labor (based on an estimated production function).
Following Ghosh (1975), Kambhampati (1996), and Rao (2001), we have in-cluded the growth rate of the industry as an explanatory variable in the model.Similar to the arguments given by Kambhampati (1996), who included lagged growthrate as an explanatory variable, Rao (2001) has argued that higher growth rate mightresult in increased efficiency leading to increased profit margins for the firm. Shehas found a strong positive relationship between output growth and profitability forIndian industries in the 1990s. However, Ghosh (1975) found strong empirical sup-port for the Baumol (1962) assertion that fast growth of an industry attracts newentrants because barriers to entry are less in an expanding market which reduces thelevel of concentration and thus the profitability of firms. Higher growth rate in anindustry may also depress profitability either through a fall in product prices orthrough a rise in input prices. It seems to us that in the context of the industrialpolicy reforms undertaken in the 1990s, high growth rates for industries might re-flect to some extent the easing of policy induced entry barrier prevailing in the pre-reform period. This is expected to increase competition and thus reduce profitability.
As regards the deviation of income share of labor from estimated elasticity ofreal value added with respect to labor, this variable, in our opinion, reflects howinter-temporal changes in labor’s income share in value added may influence PCMs.In his study of the effect of trade liberalization on PCM in the Turkish manufactur-ing industry, Yalçin (2000) points out that the effect of import competition on thePCM may be clouded by the influence of several other factors. In particular, henotes that a fall in labor’s income share may cause the PCM to go up. Indeed, theeconometric results of Yalçin’s study show that a decline in labor’s income sharecaused PCM in Turkish manufacturing to increase. In the present study, instead oftaking wage share as an explanatory variable, the deviation of labor’s income sharefrom estimated elasticity is used. The rationale for constructing the explanatoryvariable in this manner is that capital-labor substitution may lead to changes in theincome share of labor and this effect needs to be netted out since capital intensity(represented by capital-output ratio) is already included in the model.
To provide some further explanation, note that the deviation of labor’s incomeshare (SL) from the elasticity of value added with respect to labor (αL) may beinterpreted as the gap between wage rate (w) and marginal product of labor (∂V/∂L,where V is real value added and L denotes labor) normalized by the average productof labor (V/L).
SL − αL = (w · L/V) − (∂V/∂L) (L/V) = (w)/(V/L) − (∂V/∂L)/(V/L)= (w − ∂V/∂L)/(V/L).
Under the assumption that production technology is characterized by a two-
354 THE DEVELOPING ECONOMIES
input value added function and markets are competitive, the marginal product oflabor will be equal to wage rate (as follows from the marginal productivity theory)and hence the income share of labor in value added will be equal to the elasticity ofvalue added with respect to labor. Thus, the deviation of the income share of laborfrom the estimated elasticity may be treated as an indicator of market imperfection(since it is caused by the wage rate being not equal to the marginal productivity oflabor). It is reasonable to assume that trade unions are a major source of marketimperfection.8 There is a view that in the post-reform period there has been a weak-ening of industrial trade union power in India (Goldar 2004; Tendulkar 2004). Thisprobably was responsible for a marked fall in the income share of labor. By taking(SL − α L) as an explanatory variable, this aspect is incorporated into the regressionanalysis. Thus, this variable captures to a certain extent the effect of unionizationon profitability.
One must hasten to add here that if labor demand is competitive in the sense thatthe firms have no market power in the labor market, wage rate will be equal to thevalue of marginal product even if labor unions have market power. A weakening oflabor union strength under such circumstances may reduce wage rate, but it will notlead to any change in the difference between SL and αL, which remains at zero.9
Thus, the use of the variable (SL − αL) as a proxy variable for trade union strengthwill be justified if labor demand is imperfectly competitive. To derive a positiverelationship between (SL − αL) and strength of labor unions, some additional as-sumptions are needed. This aspect is discussed further in Appendix.
It may be mentioned in this context that there is a complex relationship betweenprotection to domestic industry and the income of labor employed in the industry.An important issue is how the rents associated with the protected trade/industrialregime are distributed between laborers and producers. Needless to say that tradeunion strength should be an important determinant of the portion of the rent accru-ing to labor.10 Inasmuch as trade liberalization reduces or eliminates the rent accru-ing to labor, it would have a depressing effect on the wage rate.11 A reduction inlabor’s share in the rent (shift of rent from laborers to producers), say caused by aweakening of the bargaining power of trade unions, would have a favorable effecton the profitability of firms in concentrated industries.12
8 A number of studies model wages as being determined in a process of bargaining between tradeunion and firm management; see, for instance, Bande, Fernández, and Montuenga (2000).
9 We are grateful to one of the reviewers of the paper for drawing our attention to this theoreticalpoint.
10 See Abowd and Lemieux (1993) and Borjas and Ramey (1995), among others.11 A number of studies have examined how trade liberalization affects wages in industries of develop-
ing countries through the elimination/reduction of rents accruing to labor. See, for instance, Revenga(1997). Goldar (2004) has examined this issue in the context of Indian manufacturing industries.
12 There have been several studies on the effect of union power on profitability (see, for instance,Freeman 1983; Dobbelaere 2005) and how trade liberalization may affect union power (see, forinstance, Dumont, Rayp, and Willemé 2004).
355TRADE LIBERALIZATION AND PRICE-COST MARGIN
Attention needs to be drawn here to the fact that unionization need not alwayshave an adverse effect on profitability. The negative influence may be offset or evenmore than offset by the productivity enhancing effects of unions, particularly theeffects on R&D (see Dobbelaere [2005] for a discussion and review of the litera-ture). Recent empirical evidence for the United States shows a positive relationshipbetween unionization and profitability. Recent empirical studies for the United King-dom find that by the end of the 1990s a negative relationship between unionizationand profitability ceased to exist. Evidently, questions can be raised about the simplecausal relationship between union power and PCM that we assume in our analysis.We feel, however, that in Indian industries the favorable effect of unionization oninnovative activity is likely to be a less important phenomenon than the effect ofunionization on sharing of rent by labor so that a weakening of trade unions in the1990s should have caused the PCMs to go up.
B. Model Estimation
Having discussed the model, we turn to the estimation. As mentioned earlier, forthe econometric analysis, we use panel data for 137 industries for 18 years. Twocommonly used panel data models are the fixed-effects model and the random-effects model. For this study, we have used the Kmenta model13 which is based ongeneralized least squares (GLS) and corrects for heteroscedasticity and auto-correlation, a feature of panel data sets. We have carried out the necessary tests(Hsiao 1986) and found that the application of the Kmenta model is justified.14
Since the final panel data set used is unbalanced, we have applied the unbalancedpanel data estimation method.
C. Data and Variables
The basic source of data for this study is the Annual Survey of Industries (ASI)published by the Central Statistical Organisation, Government of India. Data forthree-digit industries for the period 1980/81 to 1997/98 have been taken.15 Thoughthe data are available for 152 three-digit industrial groups, the study includes only137 groups. The remaining groups have been excluded because in these the valueof products is reported to be zero or very low in comparison with value added.Since these are service-oriented industries, their profitability might not have beenaffected by removal of import barriers on manufactured products. Accordingly, it
13 See Kmenta (1986).14 Note further that since industrial concentration is captured by a dummy variable (DCON) which
does not vary over time, the fixed-effects model cannot be applied.15 The Economic and Political Weekly has created a systematic, electronic database using ASI results
for the period 1973/74 to 1997/98. Concordance has been worked out between the industrialclassifications used till 1988/89 and that used thereafter (NIC-1970 and NIC-1987), and compa-rable series for various three- and two-digit industries have been prepared. We have used this data-base for our study.

356 THE DEVELOPING ECONOMIES
was felt that such industries should be excluded from the analysis. Thus, we had2,466 observations on 137 industries for 18 years. But, subsequently we dropped 6observations where the ratio of emoluments to value added is abnormally high(greater than 5) leaving us with 2,460 observations. One observation is also lost foreach industry when we use the variable output growth rate for econometric analy-sis.
The variable PCM is computed as gross value added minus emoluments dividedby the value of gross output. Capital-output ratio (KQ) is computed as total capitalstock (fixed plus working) divided by value of gross output. Growth rate of industry(GRI) is the annual growth rate in deflated value of gross output. For each industry,we have used as the deflator the best available wholesale price index series wecould obtain from the official series on Index Number of Wholesale Prices.
The main data source on tariff rates and nontariff barriers (percentage importcoverage by quantitative restrictions) is a research project undertaken at the IndianCouncil for Research on International Economic Relations (ICRIER), the results ofwhich are reported in Das (2003b). For a majority of three-digit industries, data onimport barriers could be obtained from this source. Since Das has not covered allthree-digit industries, it has been necessary to use other sources. Tariff rates andnontariff barriers at the level of industrial groups (66 sectors of the input-outputtable) have been taken from Goldar and Saleem (1992), NCAER (1999), and Nouroz(2001). In a number of cases, the estimate available for an input-output sector hasbeen applied to all three-digit industries belonging to that sector. It has also beennecessary to interpolate the tariff rates or import coverage ratios, as these are notavailable for all the years of the period under study. For some industries, the importcoverage ratio is not available for years prior to 1988/89. For such industries, thefigure for 1988/89 has been applied for all earlier years of the 1980s. This shouldnot introduce any serious error in the data on nontariff barriers, as quantitative re-strictions covered a very high proportion of imports of manufactures throughoutthe decade.16
To obtain the deviation of labor income share from the elasticity of value addedwith respect to labor, a translog production function has been estimated.17 Realgross value added is taken as the measure of output, number of employees as themeasure of labor input, and gross fixed capital stock at constant price as the mea-sure of capital input.18 Given the estimated production function, the logarithmic
16 For aggregate manufacturing, the proportion of imports covered by quantitative restrictions wasabout 90 percent in 1988/89.
17 The function is assumed to be homogeneous.18 Construction of real fixed capital stock series for each of the 137 industries would be an enormous
task. For a research project undertaken at the ICRIER, real fixed capital series were constructed for41 major industrial groups using the perpetual inventory method. We have taken the estimatedcapital stock series for each group and proportionately allocated the capital stock estimates amongthe constituent three-digit industries according to the book-value of fixed assets reported in the ASI.
357TRADE LIBERALIZATION AND PRICE-COST MARGIN
derivative of value added with respect to labor yields the required elasticity, whichvaries across observations (across industries and over time). The income share oflabor in gross value added is compared with this elasticity and the deviation iscomputed.
As mentioned earlier, we use a dummy variable, DCON, in the model to capturethe effect of market power on profitability. DCON is assigned the value one for 45industries out of the 137 for which the computed HI19 for the period 1991 to 1995indicates a high level of concentration (above 1,800 on average), otherwise it isassigned the value of zero.
IV. EMPIRICAL RESULTS
A. Changes in Tariff and Nontariff Barriers
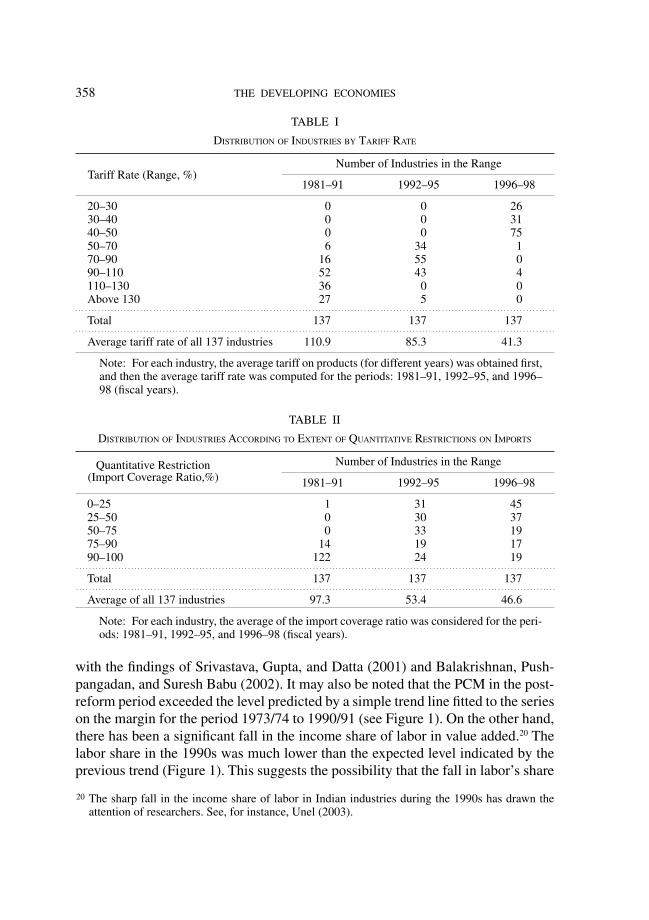
How tariff and nontariff barriers for Indian industries have changed in the 1980sand 1990s has been described at length in the studies of Das (2003b) and Nouroz(2001), among others. A detailed discussion on liberalization of trade in industrialproducts is therefore unnecessary. Some indication of the changes in tariff andnontariff barriers that took place in the 1990s for the 137 industries covered in thisstudy is given in Tables I and II.
Tables I and II clearly show that in the 1990s there was substantial decrease inboth tariff and quantitative restrictions for the 137 industries considered in thisstudy. The average tariff rate declined from 110.9 percent in the period 1981–91(fiscal years) to 85.3 during 1992–95 and further to 41.3 percent during 1996–98.In 131 out of the 137 industries, the average tariff rate was 70 percent or higherduring 1981–91. By contrast, in 132 industries out of the 137, the average tariff ratewas in the range of 20 to 50 percent during 1996–98.
During 1981–91, the average import-coverage ratio (proportion of imports cov-ered by quantitative restrictions) was 90 percent or more in 122 industries of the137. By contrast, during 1996–98, the average import coverage ratio was less than50 percent in 82 industries out of the 137. Taking all 137 industries together, theaverage import-coverage ratio declined from 97.3 percent during 1981–91 to 46.6percent during 1996–98.
B. Analysis of Trends in Price-Cost Margin and Labor Income
Analysis of PCM at the aggregate level reveals that there was no fall in the PCMafter 1991 when the process of trade and industrial reforms began. Rather, the mar-gin seems to have increased in the post-reform period. This is broadly in agreement
19 Mr. Prabhu Prasad Mishra of ICRIER computed the HI from the Prowess database, for which weare thankful.
358 THE DEVELOPING ECONOMIES
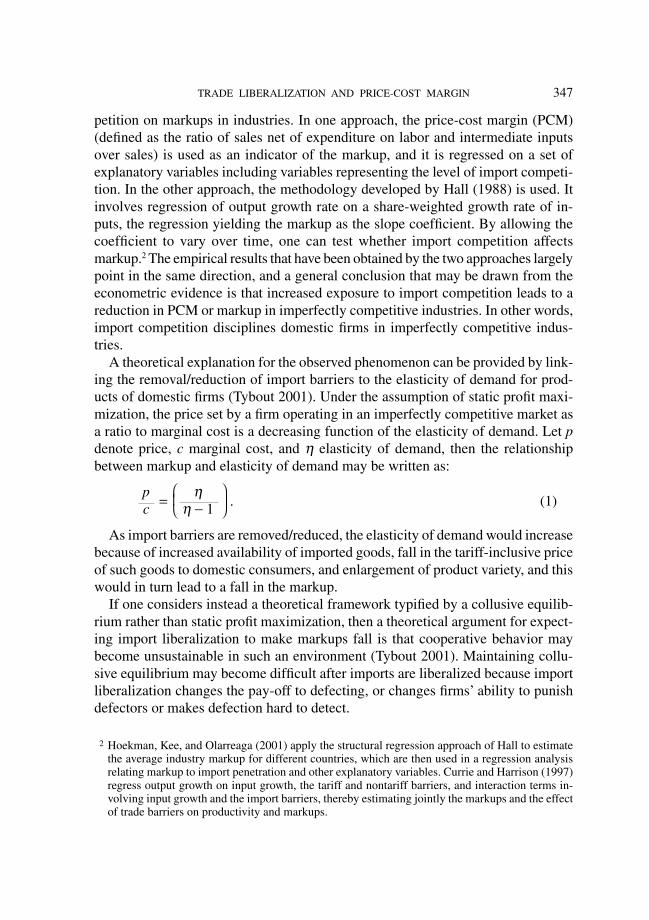
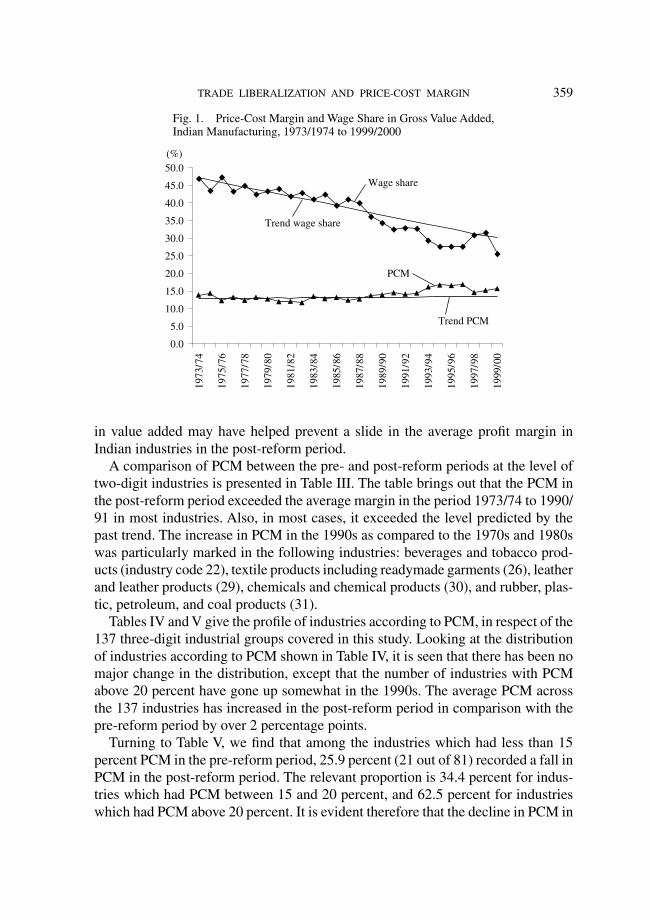
with the findings of Srivastava, Gupta, and Datta (2001) and Balakrishnan, Push-pangadan, and Suresh Babu (2002). It may also be noted that the PCM in the post-reform period exceeded the level predicted by a simple trend line fitted to the serieson the margin for the period 1973/74 to 1990/91 (see Figure 1). On the other hand,there has been a significant fall in the income share of labor in value added.20 Thelabor share in the 1990s was much lower than the expected level indicated by theprevious trend (Figure 1). This suggests the possibility that the fall in labor’s share
TABLE I
DISTRIBUTION OF INDUSTRIES BY TARIFF RATE
Number of Industries in the Range
1981–91 1992–95 1996–98
20–30 0 0 2630–40 0 0 3140–50 0 0 7550–70 6 34 170–90 16 55 090–110 52 43 4110–130 36 0 0Above 130 27 5 0
Total 137 137 137
Average tariff rate of all 137 industries 110.9 85.3 41.3
Note: For each industry, the average tariff on products (for different years) was obtained first,and then the average tariff rate was computed for the periods: 1981–91, 1992–95, and 1996–98 (fiscal years).
Tariff Rate (Range, %)
. . . . . . . . . . . . . . . . . . . . . . . . . . . . . . . . . . . . . . . . . . . . . . . . . . . . . . . . . . . . . . . . . . . . . . . . . . . . . . . . . . . . . . . . . . . . . . . . . . . . . . . . . . . . . . . . . . . . . . . . . . . . . . . . . . . . . . . . . . . . . . . . . . . .
. . . . . . . . . . . . . . . . . . . . . . . . . . . . . . . . . . . . . . . . . . . . . . . . . . . . . . . . . . . . . . . . . . . . . . . . . . . . . . . . . . . . . . . . . . . . . . . . . . . . . . . . . . . . . . . . . . . . . . . . . . . . . . . . . . . . . . . . . . . . . . . . . . . .
TABLE II
DISTRIBUTION OF INDUSTRIES ACCORDING TO EXTENT OF QUANTITATIVE RESTRICTIONS ON IMPORTS
Number of Industries in the Range
1981–91 1992–95 1996–98
0–25 1 31 4525–50 0 30 3750–75 0 33 1975–90 14 19 1790–100 122 24 19
Total 137 137 137
Average of all 137 industries 97.3 53.4 46.6
Note: For each industry, the average of the import coverage ratio was considered for the peri-ods: 1981–91, 1992–95, and 1996–98 (fiscal years).
. . . . . . . . . . . . . . . . . . . . . . . . . . . . . . . . . . . . . . . . . . . . . . . . . . . . . . . . . . . . . . . . . . . . . . . . . . . . . . . . . . . . . . . . . . . . . . . . . . . . . . . . . . . . . . . . . . . . . . . . . . . . . . . . . . . . . . . . . . . . . . . . . . . .
. . . . . . . . . . . . . . . . . . . . . . . . . . . . . . . . . . . . . . . . . . . . . . . . . . . . . . . . . . . . . . . . . . . . . . . . . . . . . . . . . . . . . . . . . . . . . . . . . . . . . . . . . . . . . . . . . . . . . . . . . . . . . . . . . . . . . . . . . . . . . . . . . . . .
Quantitative Restriction(Import Coverage Ratio,%)
20 The sharp fall in the income share of labor in Indian industries during the 1990s has drawn theattention of researchers. See, for instance, Unel (2003).
359TRADE LIBERALIZATION AND PRICE-COST MARGIN
in value added may have helped prevent a slide in the average profit margin inIndian industries in the post-reform period.
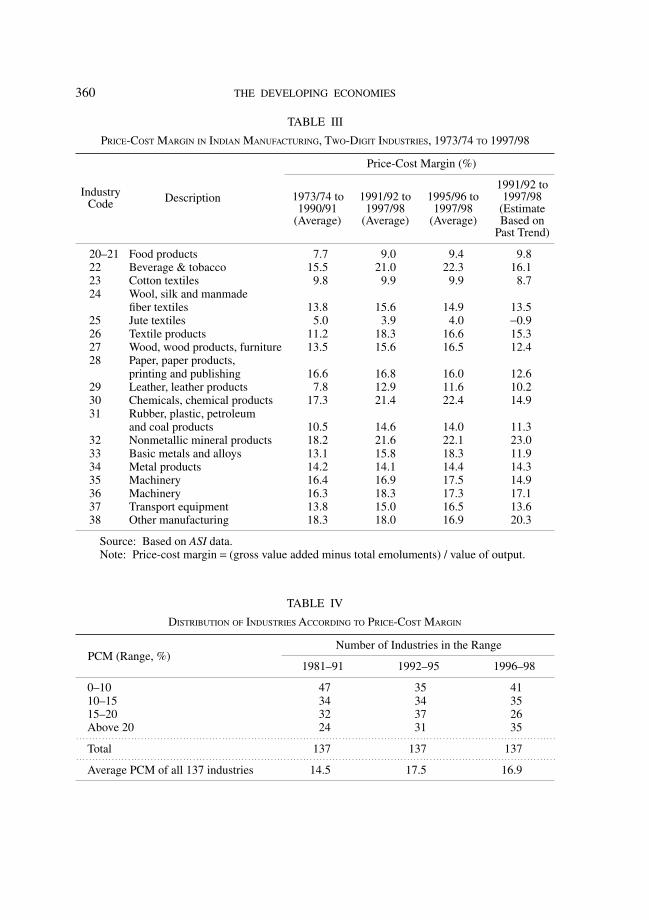
A comparison of PCM between the pre- and post-reform periods at the level oftwo-digit industries is presented in Table III. The table brings out that the PCM inthe post-reform period exceeded the average margin in the period 1973/74 to 1990/91 in most industries. Also, in most cases, it exceeded the level predicted by thepast trend. The increase in PCM in the 1990s as compared to the 1970s and 1980swas particularly marked in the following industries: beverages and tobacco prod-ucts (industry code 22), textile products including readymade garments (26), leatherand leather products (29), chemicals and chemical products (30), and rubber, plas-tic, petroleum, and coal products (31).
Tables IV and V give the profile of industries according to PCM, in respect of the137 three-digit industrial groups covered in this study. Looking at the distributionof industries according to PCM shown in Table IV, it is seen that there has been nomajor change in the distribution, except that the number of industries with PCMabove 20 percent have gone up somewhat in the 1990s. The average PCM acrossthe 137 industries has increased in the post-reform period in comparison with thepre-reform period by over 2 percentage points.
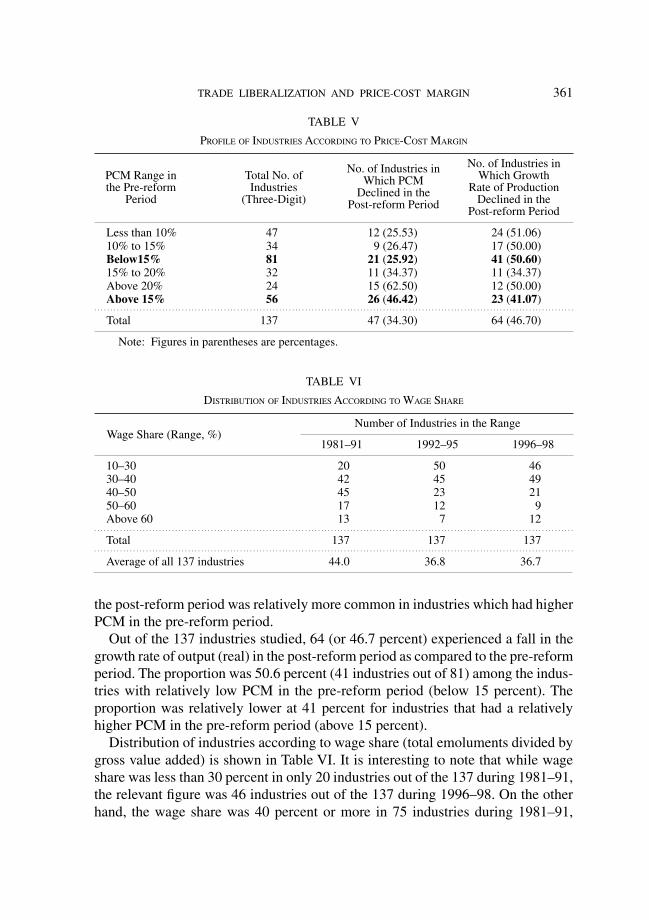
Turning to Table V, we find that among the industries which had less than 15percent PCM in the pre-reform period, 25.9 percent (21 out of 81) recorded a fall inPCM in the post-reform period. The relevant proportion is 34.4 percent for indus-tries which had PCM between 15 and 20 percent, and 62.5 percent for industrieswhich had PCM above 20 percent. It is evident therefore that the decline in PCM in
Fig. 1. Price-Cost Margin and Wage Share in Gross Value Added,Indian Manufacturing, 1973/1974 to 1999/2000
Wage share
0.0
5.0
10.0
15.0
20.0
25.0
30.0
35.0
40.0
45.0
50.0
1973
/ 74
1975
/ 76
1977
/ 78
1979
/ 80
1981
/ 82
1983
/ 84
1985
/ 86
1987
/ 88
1989
/ 90
1991
/ 92
1993
/ 94
1995
/ 96
1997
/ 98
1999
/ 00
Trend wage share
PCM
Trend PCM
(%)
360 THE DEVELOPING ECONOMIES
TABLE IV
DISTRIBUTION OF INDUSTRIES ACCORDING TO PRICE-COST MARGIN
Number of Industries in the Range
1981–91 1992–95 1996–98
0–10 47 35 4110–15 34 34 3515–20 32 37 26Above 20 24 31 35
Total 137 137 137
Average PCM of all 137 industries 14.5 17.5 16.9
. . . . . . . . . . . . . . . . . . . . . . . . . . . . . . . . . . . . . . . . . . . . . . . . . . . . . . . . . . . . . . . . . . . . . . . . . . . . . . . . . . . . . . . . . . . . . . . . . . . . . . . . . . . . . . . . . . . . . . . . . . . . . . . . . . . . . . . . . . . . . . . . . . . .
. . . . . . . . . . . . . . . . . . . . . . . . . . . . . . . . . . . . . . . . . . . . . . . . . . . . . . . . . . . . . . . . . . . . . . . . . . . . . . . . . . . . . . . . . . . . . . . . . . . . . . . . . . . . . . . . . . . . . . . . . . . . . . . . . . . . . . . . . . . . . . . . . . . .
PCM (Range, %)
TABLE III
PRICE-COST MARGIN IN INDIAN MANUFACTURING, TWO-DIGIT INDUSTRIES, 1973/74 TO 1997/98
Price-Cost Margin (%)
1991/92 to1973/74 to 1991/92 to 1995/96 to 1997/981990/91 1997/98 1997/98 (Estimate
(Average) (Average) (Average) Based onPast Trend)
IndustryCode Description
20–21 Food products 7.7 9.0 9.4 9.822 Beverage & tobacco 15.5 21.0 22.3 16.123 Cotton textiles 9.8 9.9 9.9 8.724 Wool, silk and manmade
fiber textiles 13.8 15.6 14.9 13.525 Jute textiles 5.0 3.9 4.0 −0.926 Textile products 11.2 18.3 16.6 15.327 Wood, wood products, furniture 13.5 15.6 16.5 12.428 Paper, paper products,
printing and publishing 16.6 16.8 16.0 12.629 Leather, leather products 7.8 12.9 11.6 10.230 Chemicals, chemical products 17.3 21.4 22.4 14.931 Rubber, plastic, petroleum
and coal products 10.5 14.6 14.0 11.332 Nonmetallic mineral products 18.2 21.6 22.1 23.033 Basic metals and alloys 13.1 15.8 18.3 11.934 Metal products 14.2 14.1 14.4 14.335 Machinery 16.4 16.9 17.5 14.936 Machinery 16.3 18.3 17.3 17.137 Transport equipment 13.8 15.0 16.5 13.638 Other manufacturing 18.3 18.0 16.9 20.3
Source: Based on ASI data.Note: Price-cost margin = (gross value added minus total emoluments) / value of output.
361TRADE LIBERALIZATION AND PRICE-COST MARGIN
the post-reform period was relatively more common in industries which had higherPCM in the pre-reform period.
Out of the 137 industries studied, 64 (or 46.7 percent) experienced a fall in thegrowth rate of output (real) in the post-reform period as compared to the pre-reformperiod. The proportion was 50.6 percent (41 industries out of 81) among the indus-tries with relatively low PCM in the pre-reform period (below 15 percent). Theproportion was relatively lower at 41 percent for industries that had a relativelyhigher PCM in the pre-reform period (above 15 percent).
Distribution of industries according to wage share (total emoluments divided bygross value added) is shown in Table VI. It is interesting to note that while wageshare was less than 30 percent in only 20 industries out of the 137 during 1981–91,the relevant figure was 46 industries out of the 137 during 1996–98. On the otherhand, the wage share was 40 percent or more in 75 industries during 1981–91,
TABLE VI
DISTRIBUTION OF INDUSTRIES ACCORDING TO WAGE SHARE
Number of Industries in the Range
1981–91 1992–95 1996–98
10–30 20 50 4630–40 42 45 4940–50 45 23 2150–60 17 12 9Above 60 13 7 12
Total 137 137 137
Average of all 137 industries 44.0 36.8 36.7
. . . . . . . . . . . . . . . . . . . . . . . . . . . . . . . . . . . . . . . . . . . . . . . . . . . . . . . . . . . . . . . . . . . . . . . . . . . . . . . . . . . . . . . . . . . . . . . . . . . . . . . . . . . . . . . . . . . . . . . . . . . . . . . . . . . . . . . . . . . . . . . . . . . .
. . . . . . . . . . . . . . . . . . . . . . . . . . . . . . . . . . . . . . . . . . . . . . . . . . . . . . . . . . . . . . . . . . . . . . . . . . . . . . . . . . . . . . . . . . . . . . . . . . . . . . . . . . . . . . . . . . . . . . . . . . . . . . . . . . . . . . . . . . . . . . . . . . . .
Wage Share (Range, %)
TABLE V
PROFILE OF INDUSTRIES ACCORDING TO PRICE-COST MARGIN
PCM Range inthe Pre-reform
Period
Total No. ofIndustries
(Three-Digit)
No. of Industries inWhich PCM
Declined in thePost-reform Period
No. of Industries inWhich Growth
Rate of ProductionDeclined in the
Post-reform Period
Less than 10% 47 12 (25.53) 24 (51.06)10% to 15% 34 9 (26.47) 17 (50.00)Below15% 81 21 (25.92) 41 (50.60)15% to 20% 32 11 (34.37) 11 (34.37)Above 20% 24 15 (62.50) 12 (50.00)Above 15% 56 26 (46.42) 23 (41.07)
Total 137 47 (34.30) 64 (46.70)
Note: Figures in parentheses are percentages.
. . . . . . . . . . . . . . . . . . . . . . . . . . . . . . . . . . . . . . . . . . . . . . . . . . . . . . . . . . . . . . . . . . . . . . . . . . . . . . . . . . . . . . . . . . . . . . . . . . . . . . . . . . . . . . . . . . . . . . . . . . . . . . . . . . . . . . . . . . . . . . . . . . . .

362 THE DEVELOPING ECONOMIES
which declined to 42 industries during 1996–98. The average wage share across the137 industries came down from 44.0 percent during 1981–90 to 36.7 percent dur-ing 1996–98.
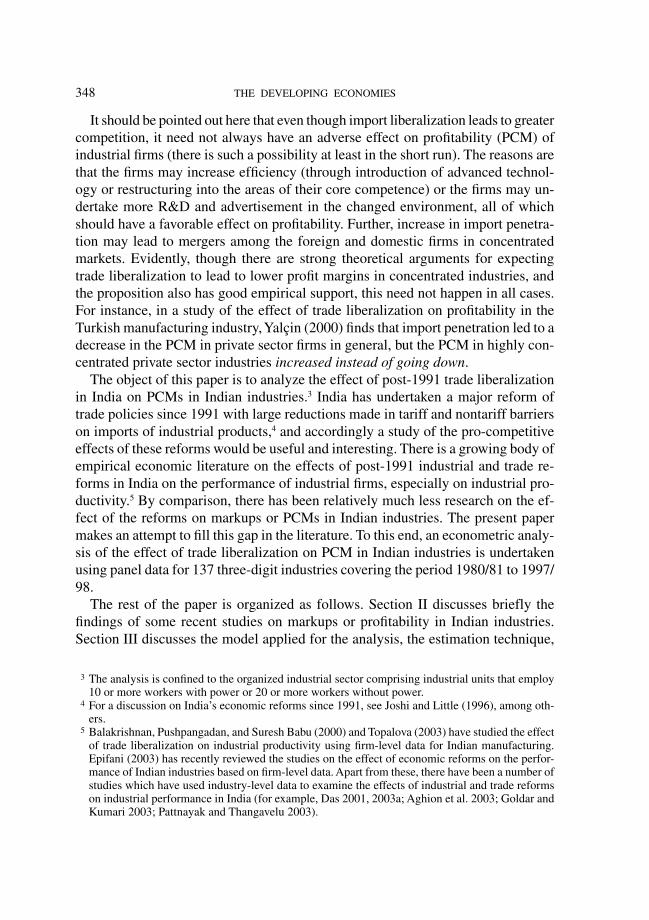
Figure 2 plots the change in labor share in gross value added against the changein PCM between 1989/90 and 1997/98 for three-digit industries. The correlationcoefficient is −0.67. It can be seen that in a large number of industries there was anincrease in the PCM between 1989/90 and 1997/98. In most cases, this was associ-ated with a fall in the income share of labor in value added. Thus, we find evidencethat provides some support to our conjecture that the observed increase in the PCMin Indian industries at the aggregate level in the 1990s is mainly due to a fall inlabor’s income share.
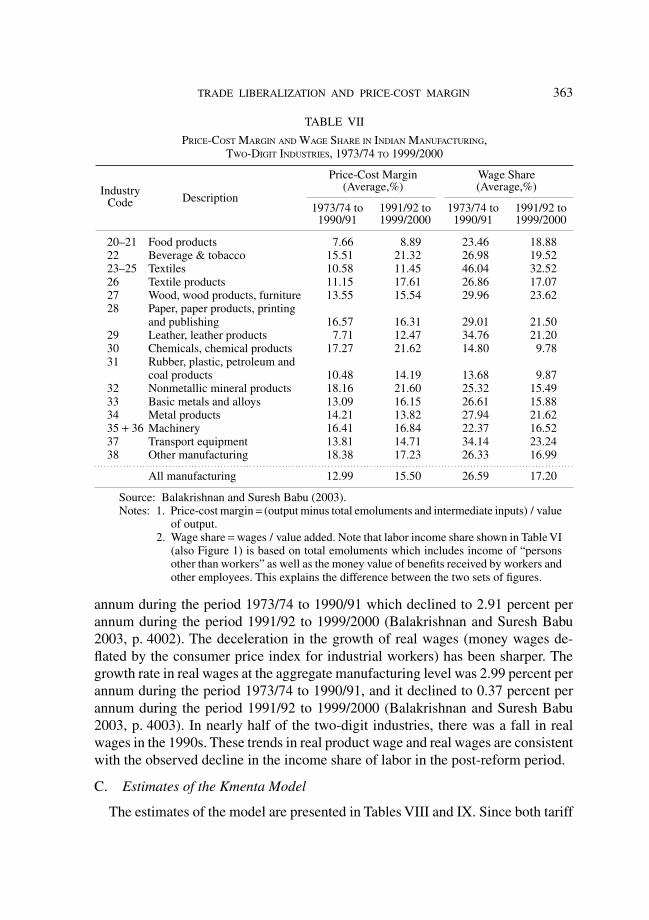
In a recent paper, Balakrishnan and Suresh Babu (2003) noted that in the post-reform period there has been an almost across-the-board increase in the PCM inIndian industries at the two-digit level (see Table VII which reproduces the ratioscomputed by them). They also note that the share of wages in value added hasdeclined in the post-reform period in all the two-digit industries and hence at theaggregate level. Accordingly, they conclude that there has been a relative shift ofincome away from workers towards profit earners. This is consistent with the trendsin PCM and labor share observed in Table III and Figure 1 above.
It is worth noting in this context that there has been a deceleration in the growthof real product wage of industrial workers in the post reform period.21 The growthrate in product wage at the aggregate manufacturing level was 3.52 percent per
Fig. 2. Changes in Wage Share and Price-Cost Margin, IndianManufacturing Industries (3-digit), 1989/90 to 1997/98
−0.3
−0.2
−0.1
0
0.1
0.2
0.3
0.4
−0.8 −0.6 −0.4 −0.2 0 0.2 0.4 0.6
Change in wage share
Cha
nge
in p
rice
-cos
t mar
gin
21 Goldar (2004) has examined the causes of the fall in the growth rate of real product wage in Indianindustries in the 1990s.
363TRADE LIBERALIZATION AND PRICE-COST MARGIN
annum during the period 1973/74 to 1990/91 which declined to 2.91 percent perannum during the period 1991/92 to 1999/2000 (Balakrishnan and Suresh Babu2003, p. 4002). The deceleration in the growth of real wages (money wages de-flated by the consumer price index for industrial workers) has been sharper. Thegrowth rate in real wages at the aggregate manufacturing level was 2.99 percent perannum during the period 1973/74 to 1990/91, and it declined to 0.37 percent perannum during the period 1991/92 to 1999/2000 (Balakrishnan and Suresh Babu2003, p. 4003). In nearly half of the two-digit industries, there was a fall in realwages in the 1990s. These trends in real product wage and real wages are consistentwith the observed decline in the income share of labor in the post-reform period.
C. Estimates of the Kmenta Model
The estimates of the model are presented in Tables VIII and IX. Since both tariff
TABLE VII
PRICE-COST MARGIN AND WAGE SHARE IN INDIAN MANUFACTURING,TWO-DIGIT INDUSTRIES, 1973/74 TO 1999/2000
IndustryCode Description
20–21 Food products 7.66 8.89 23.46 18.8822 Beverage & tobacco 15.51 21.32 26.98 19.5223–25 Textiles 10.58 11.45 46.04 32.5226 Textile products 11.15 17.61 26.86 17.0727 Wood, wood products, furniture 13.55 15.54 29.96 23.6228 Paper, paper products, printing
and publishing 16.57 16.31 29.01 21.5029 Leather, leather products 7.71 12.47 34.76 21.2030 Chemicals, chemical products 17.27 21.62 14.80 9.7831 Rubber, plastic, petroleum and
coal products 10.48 14.19 13.68 9.8732 Nonmetallic mineral products 18.16 21.60 25.32 15.4933 Basic metals and alloys 13.09 16.15 26.61 15.8834 Metal products 14.21 13.82 27.94 21.6235 + 36 Machinery 16.41 16.84 22.37 16.5237 Transport equipment 13.81 14.71 34.14 23.2438 Other manufacturing 18.38 17.23 26.33 16.99
All manufacturing 12.99 15.50 26.59 17.20
Source: Balakrishnan and Suresh Babu (2003).Notes: 1. Price-cost margin = (output minus total emoluments and intermediate inputs) / value
of output.2. Wage share = wages / value added. Note that labor income share shown in Table VI
(also Figure 1) is based on total emoluments which includes income of “personsother than workers” as well as the money value of benefits received by workers andother employees. This explains the difference between the two sets of figures.
Price-Cost Margin(Average,%)
Wage Share(Average,%)
1973/74 to 1991/92 to 1973/74 to 1991/92 to1990/91 1999/2000 1990/91 1999/2000
. . . . . . . . . . . . . . . . . . . . . . . . . . . . . . . . . . . . . . . . . . . . . . . . . . . . . . . . . . . . . . . . . . . . . . . . . . . . . . . . . . . . . . . . . . . . . . . . . . . . . . . . . . . . . . . . . . . . . . . . . . . . . . . . . . . . . . . . . . . . . . . . . . . .
364 THE DEVELOPING ECONOMIES
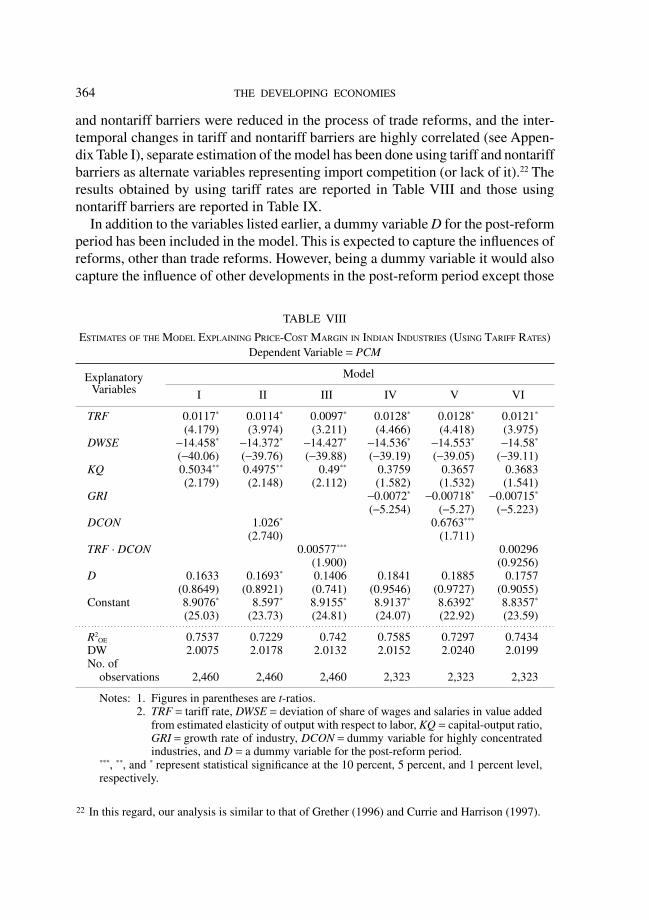
and nontariff barriers were reduced in the process of trade reforms, and the inter-temporal changes in tariff and nontariff barriers are highly correlated (see Appen-dix Table I), separate estimation of the model has been done using tariff and nontariffbarriers as alternate variables representing import competition (or lack of it).22 Theresults obtained by using tariff rates are reported in Table VIII and those usingnontariff barriers are reported in Table IX.
In addition to the variables listed earlier, a dummy variable D for the post-reformperiod has been included in the model. This is expected to capture the influences ofreforms, other than trade reforms. However, being a dummy variable it would alsocapture the influence of other developments in the post-reform period except those
TABLE VIII
ESTIMATES OF THE MODEL EXPLAINING PRICE-COST MARGIN IN INDIAN INDUSTRIES (USING TARIFF RATES)Dependent Variable = PCM
Model
I II III IV V VI
TRF 0.0117* 0.0114* 0.0097* 0.0128* 0.0128* 0.0121*
(4.179) (3.974) (3.211) (4.466) (4.418) (3.975)DWSE −14.458* −14.372* −14.427* −14.536* −14.553* −14.58*
(−40.06) (−39.76) (−39.88) (−39.19) (−39.05) (−39.11)KQ 0.5034** 0.4975** 0.49** 0.3759 0.3657 0.3683
(2.179) (2.148) (2.112) (1.582) (1.532) (1.541)GRI −0.0072* −0.00718* −0.00715*
(−5.254) (−5.27) (−5.223)DCON 1.026* 0.6763***
(2.740) (1.711)TRF · DCON 0.00577*** 0.00296
(1.900) (0.9256)D 0.1633 0.1693* 0.1406 0.1841 0.1885 0.1757
(0.8649) (0.8921) (0.741) (0.9546) (0.9727) (0.9055)Constant 8.9076* 8.597* 8.9155* 8.9137* 8.6392* 8.8357*
(25.03) (23.73) (24.81) (24.07) (22.92) (23.59)
R2OE 0.7537 0.7229 0.742 0.7585 0.7297 0.7434
DW 2.0075 2.0178 2.0132 2.0152 2.0240 2.0199No. of
observations 2,460 2,460 2,460 2,323 2,323 2,323
Notes: 1. Figures in parentheses are t-ratios.2. TRF = tariff rate, DWSE = deviation of share of wages and salaries in value added
from estimated elasticity of output with respect to labor, KQ = capital-output ratio,GRI = growth rate of industry, DCON = dummy variable for highly concentratedindustries, and D = a dummy variable for the post-reform period.
***, **, and * represent statistical significance at the 10 percent, 5 percent, and 1 percent level,respectively.
ExplanatoryVariables
. . . . . . . . . . . . . . . . . . . . . . . . . . . . . . . . . . . . . . . . . . . . . . . . . . . . . . . . . . . . . . . . . . . . . . . . . . . . . . . . . . . . . . . . . . . . . . . . . . . . . . . . . . . . . . . . . . . . . . . . . . . . . . . . . . . . . . . . . . . . . . . . . . . .
22 In this regard, our analysis is similar to that of Grether (1996) and Currie and Harrison (1997).
365TRADE LIBERALIZATION AND PRICE-COST MARGIN
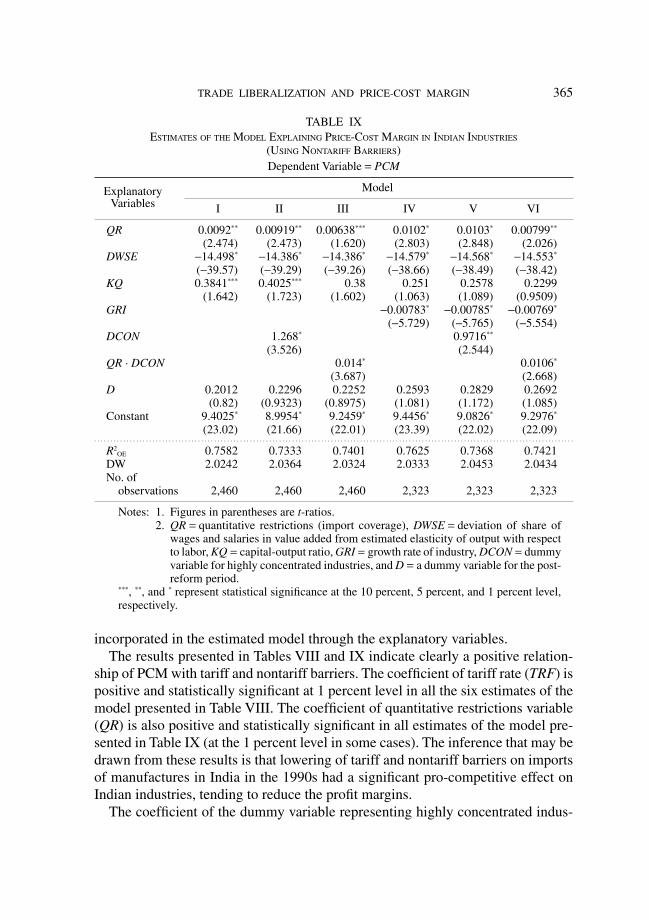
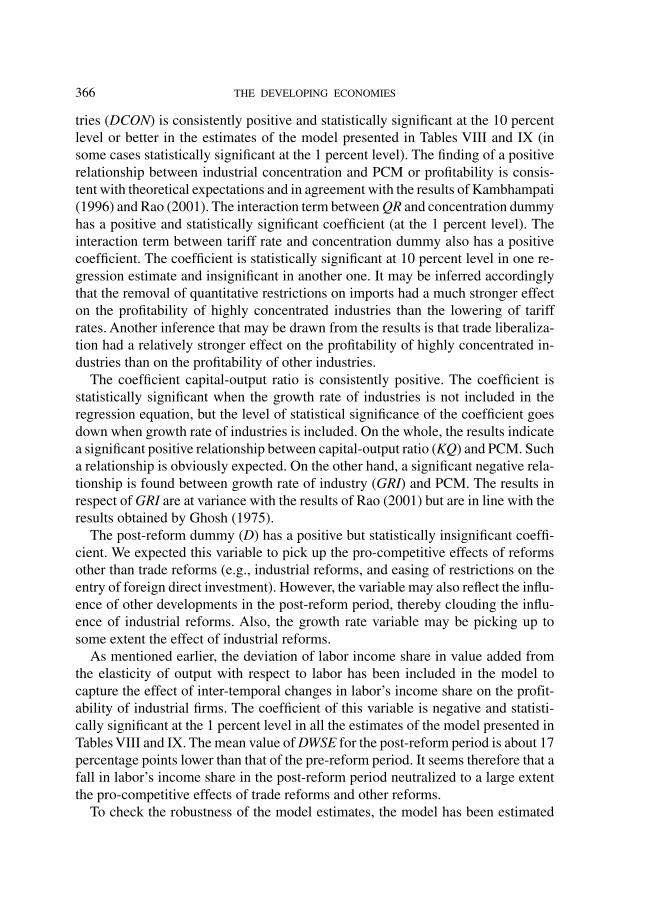
incorporated in the estimated model through the explanatory variables.The results presented in Tables VIII and IX indicate clearly a positive relation-
ship of PCM with tariff and nontariff barriers. The coefficient of tariff rate (TRF) ispositive and statistically significant at 1 percent level in all the six estimates of themodel presented in Table VIII. The coefficient of quantitative restrictions variable(QR) is also positive and statistically significant in all estimates of the model pre-sented in Table IX (at the 1 percent level in some cases). The inference that may bedrawn from these results is that lowering of tariff and nontariff barriers on importsof manufactures in India in the 1990s had a significant pro-competitive effect onIndian industries, tending to reduce the profit margins.
The coefficient of the dummy variable representing highly concentrated indus-
TABLE IXESTIMATES OF THE MODEL EXPLAINING PRICE-COST MARGIN IN INDIAN INDUSTRIES
(USING NONTARIFF BARRIERS)Dependent Variable = PCM
Model
I II III IV V VI
QR 0.0092** 0.00919** 0.00638*** 0.0102* 0.0103* 0.00799**
(2.474) (2.473) (1.620) (2.803) (2.848) (2.026)DWSE −14.498* −14.386* −14.386* −14.579* −14.568* −14.553*
(−39.57) (−39.29) (−39.26) (−38.66) (−38.49) (−38.42)KQ 0.3841*** 0.4025*** 0.38 0.251 0.2578 0.2299
(1.642) (1.723) (1.602) (1.063) (1.089) (0.9509)GRI −0.00783* −0.00785* −0.00769*
(−5.729) (−5.765) (−5.554)DCON 1.268* 0.9716**
(3.526) (2.544)QR · DCON 0.014* 0.0106*
(3.687) (2.668)D 0.2012 0.2296 0.2252 0.2593 0.2829 0.2692
(0.82) (0.9323) (0.8975) (1.081) (1.172) (1.085)Constant 9.4025* 8.9954* 9.2459* 9.4456* 9.0826* 9.2976*
(23.02) (21.66) (22.01) (23.39) (22.02) (22.09)
R2OE 0.7582 0.7333 0.7401 0.7625 0.7368 0.7421
DW 2.0242 2.0364 2.0324 2.0333 2.0453 2.0434No. of
observations 2,460 2,460 2,460 2,323 2,323 2,323
Notes: 1. Figures in parentheses are t-ratios.2. QR = quantitative restrictions (import coverage), DWSE = deviation of share of
wages and salaries in value added from estimated elasticity of output with respectto labor, KQ = capital-output ratio, GRI = growth rate of industry, DCON = dummyvariable for highly concentrated industries, and D = a dummy variable for the post-reform period.
***, **, and * represent statistical significance at the 10 percent, 5 percent, and 1 percent level,respectively.
ExplanatoryVariables
. . . . . . . . . . . . . . . . . . . . . . . . . . . . . . . . . . . . . . . . . . . . . . . . . . . . . . . . . . . . . . . . . . . . . . . . . . . . . . . . . . . . . . . . . . . . . . . . . . . . . . . . . . . . . . . . . . . . . . . . . . . . . . . . . . . . . . . . . . . . . . . . . . . .
366 THE DEVELOPING ECONOMIES
tries (DCON) is consistently positive and statistically significant at the 10 percentlevel or better in the estimates of the model presented in Tables VIII and IX (insome cases statistically significant at the 1 percent level). The finding of a positiverelationship between industrial concentration and PCM or profitability is consis-tent with theoretical expectations and in agreement with the results of Kambhampati(1996) and Rao (2001). The interaction term between QR and concentration dummyhas a positive and statistically significant coefficient (at the 1 percent level). Theinteraction term between tariff rate and concentration dummy also has a positivecoefficient. The coefficient is statistically significant at 10 percent level in one re-gression estimate and insignificant in another one. It may be inferred accordinglythat the removal of quantitative restrictions on imports had a much stronger effecton the profitability of highly concentrated industries than the lowering of tariffrates. Another inference that may be drawn from the results is that trade liberaliza-tion had a relatively stronger effect on the profitability of highly concentrated in-dustries than on the profitability of other industries.
The coefficient capital-output ratio is consistently positive. The coefficient isstatistically significant when the growth rate of industries is not included in theregression equation, but the level of statistical significance of the coefficient goesdown when growth rate of industries is included. On the whole, the results indicatea significant positive relationship between capital-output ratio (KQ) and PCM. Sucha relationship is obviously expected. On the other hand, a significant negative rela-tionship is found between growth rate of industry (GRI) and PCM. The results inrespect of GRI are at variance with the results of Rao (2001) but are in line with theresults obtained by Ghosh (1975).
The post-reform dummy (D) has a positive but statistically insignificant coeffi-cient. We expected this variable to pick up the pro-competitive effects of reformsother than trade reforms (e.g., industrial reforms, and easing of restrictions on theentry of foreign direct investment). However, the variable may also reflect the influ-ence of other developments in the post-reform period, thereby clouding the influ-ence of industrial reforms. Also, the growth rate variable may be picking up tosome extent the effect of industrial reforms.
As mentioned earlier, the deviation of labor income share in value added fromthe elasticity of output with respect to labor has been included in the model tocapture the effect of inter-temporal changes in labor’s income share on the profit-ability of industrial firms. The coefficient of this variable is negative and statisti-cally significant at the 1 percent level in all the estimates of the model presented inTables VIII and IX. The mean value of DWSE for the post-reform period is about 17percentage points lower than that of the pre-reform period. It seems therefore that afall in labor’s income share in the post-reform period neutralized to a large extentthe pro-competitive effects of trade reforms and other reforms.
To check the robustness of the model estimates, the model has been estimated
367TRADE LIBERALIZATION AND PRICE-COST MARGIN
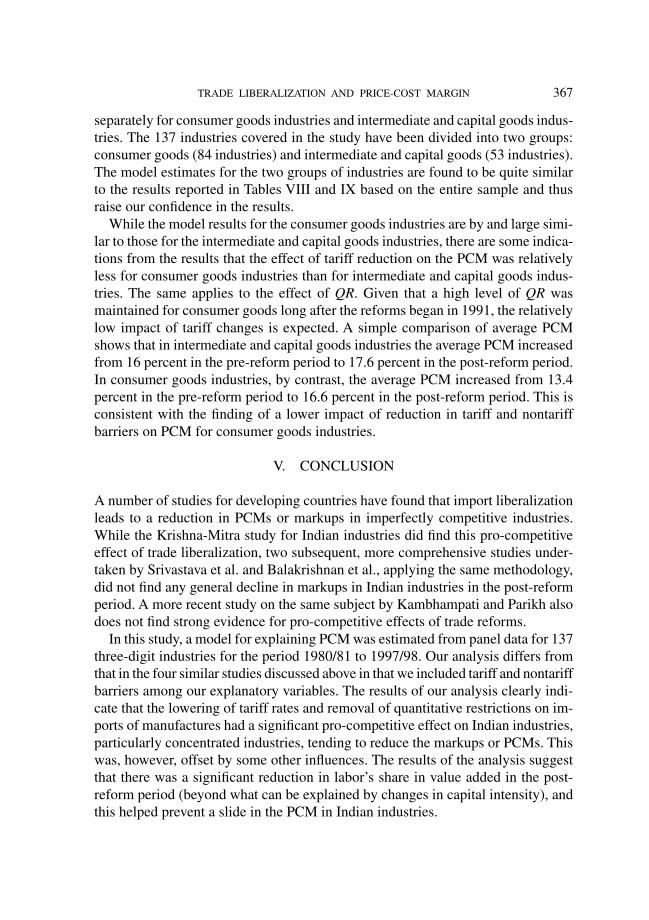
separately for consumer goods industries and intermediate and capital goods indus-tries. The 137 industries covered in the study have been divided into two groups:consumer goods (84 industries) and intermediate and capital goods (53 industries).The model estimates for the two groups of industries are found to be quite similarto the results reported in Tables VIII and IX based on the entire sample and thusraise our confidence in the results.
While the model results for the consumer goods industries are by and large simi-lar to those for the intermediate and capital goods industries, there are some indica-tions from the results that the effect of tariff reduction on the PCM was relativelyless for consumer goods industries than for intermediate and capital goods indus-tries. The same applies to the effect of QR. Given that a high level of QR wasmaintained for consumer goods long after the reforms began in 1991, the relativelylow impact of tariff changes is expected. A simple comparison of average PCMshows that in intermediate and capital goods industries the average PCM increasedfrom 16 percent in the pre-reform period to 17.6 percent in the post-reform period.In consumer goods industries, by contrast, the average PCM increased from 13.4percent in the pre-reform period to 16.6 percent in the post-reform period. This isconsistent with the finding of a lower impact of reduction in tariff and nontariffbarriers on PCM for consumer goods industries.
V. CONCLUSION
A number of studies for developing countries have found that import liberalizationleads to a reduction in PCMs or markups in imperfectly competitive industries.While the Krishna-Mitra study for Indian industries did find this pro-competitiveeffect of trade liberalization, two subsequent, more comprehensive studies under-taken by Srivastava et al. and Balakrishnan et al., applying the same methodology,did not find any general decline in markups in Indian industries in the post-reformperiod. A more recent study on the same subject by Kambhampati and Parikh alsodoes not find strong evidence for pro-competitive effects of trade reforms.
In this study, a model for explaining PCM was estimated from panel data for 137three-digit industries for the period 1980/81 to 1997/98. Our analysis differs fromthat in the four similar studies discussed above in that we included tariff and nontariffbarriers among our explanatory variables. The results of our analysis clearly indi-cate that the lowering of tariff rates and removal of quantitative restrictions on im-ports of manufactures had a significant pro-competitive effect on Indian industries,particularly concentrated industries, tending to reduce the markups or PCMs. Thiswas, however, offset by some other influences. The results of the analysis suggestthat there was a significant reduction in labor’s share in value added in the post-reform period (beyond what can be explained by changes in capital intensity), andthis helped prevent a slide in the PCM in Indian industries.
368 THE DEVELOPING ECONOMIES
What caused an accelerated fall in the income share of labor in manufacturing inthe post-reform period is a moot question. It seems this may have an importantconnection with the bargaining power of unions. Goldar (2004) has presented em-pirical evidence to argue that the unions have become weaker in the post-reformperiod and this is one of the reasons for a slowdown in the growth rate of realproduct wage in organized manufacturing in the 1990s. Tendulkar (2004) pointsout that the organized labor market has been in a state of flux during the post-reform period. While the formal rules incorporated into protective labor legislationremain in effect, the intensification of domestic and external competition is forcingthe existing industrial units to seek out informal avenues of flexibility in labor allo-cation (including recourse to the outsourcing of jobs and allowing flexi-time).Tendulkar notes further that with the opening up of the economy and rising fiscaldeficits of the states, public investment has been declining along with central sup-port for state capital expenditures. The state governments have thus been forced toseek out private domestic and foreign investment for employment generation aswell as revenues. This has probably made state governments take a softer stand inthe matter of labor regulation. Certain state governments have become more liberalin granting permission for the restructuring and retrenchment of labor and closureof factories.
REFERENCES
Abowd, John A., and Thomas Lemieux. 1993. “The Effects of Product Market Competitionon Collective Bargaining Agreements: The Case of Foreign Competition in Canada.”Quarterly Journal of Economics 108, no. 4: 983–1014.
Aghion, Philippe; Robin Burgess; Stephen Redding; and Fabrizio Zilibotti. 2003. “The Un-equal Effects of Liberalization: Theory and Evidence from India.” Working Paper (prelimi-nary draft). Available from http://econ.lse.ac.uk/staff/rburgess/wp/abrz031002.pdf.
Balakrishnan, Pulapre, and M. Suresh Babu. 2003. “Growth and Distribution in Indian In-dustry in the Nineties.” Economic and Political Weekly 38, no. 38: 3997–4005.
Balakrishnan, Pulapre; K. Pushpangadan; and M. Suresh Babu. 2000. “Trade Liberalisationand Productivity Growth in Manufacturing: Evidence from Firm-Level Panel Data.”Economic and Political Weekly 35, no. 41: 3679–82.
———. 2002. “Trade Liberalisation, Market Power and Scale Efficiency in Indian Indus-try.” Working Paper no. 336. Trivandrum: Centre for Development Studies. Availablefrom http://www.cds.edu/download_files/336.pdf.
Bande, Roberto; Melchor Fernández; and Víctor M. Montuenga. 2000. “The Role of Pro-ductivity in Wage Setting: Differences across the Spanish Regions.” Paper presented atthe 40th ERSA Congress, Barcelona, August 29–September 1. Available from http://www.ersa.org/ersaconfs/ersa00/pdf-ersa/pdf/146.pdf.
Baumol, William. 1962. “On the Theory of Expansion of the Firm.” American EconomicReview 52, no. 5: 1078–87.
Borjas, George J., and Valerie A. Ramey. 1995. “Foreign Competition, Market Power, andWage Inequality.” Quarterly Journal of Economics 110, no. 4: 1075–1110.
369TRADE LIBERALIZATION AND PRICE-COST MARGIN
Currie, Janet, and Ann E. Harrison. 1997. “Sharing the Costs: The Impact of Trade Reformon Capital and Labor in Morocco.” Journal of Labor Economics 15, no. 3: S44–S71.
Das, Deb Kusum. 2001. “Some Aspects of Productivity Growth and Trade in Indian Indus-try.” Ph.D. diss., Delhi School of Economics, University of Delhi.
———. 2003a. “Manufacturing Productivity under Varying Trade Regimes: India in the1980s and 1990s.” Working Paper no. 107. New Delhi: Indian Council for Research onInternational Economic Relations.
———. 2003b. “Quantifying Trade Barriers: Has Protection Declined Substantially in In-dian Manufacturing?” Working Paper no. 105. New Delhi: Indian Council for Researchon International Economic Relations.
Dobbelaere, Sabien. 2005. “Joint Estimation of Price-Cost Margins and Union BargainingPower for Belgian Manufacturing.” IZA Discussion Paper no. 1466. Bonn: Institute forthe Study of Labor.
Dumont, Michel; Glenn Rayp; and Peter Willemé. 2004. “Does Internationalization AffectUnion Bargaining Power? An Empirical Study for Five EU-Countries.” Paper presentedat the European Economic Association Congress, Madrid, August 19–24. Available fromhttp://www.eea-esem.com/papers/eea-esem/2004/2105/BarpowR2b.PDF.
Epifani, Paolo. 2003. “Trade Liberalization, Firm Performance, and Labor Market Out-comes in the Developing World: What Can We Learn from Micro-Level Data?” WorldBank Policy Research Working Paper no. 3063. Washington, D.C.: World Bank.
Freeman, Richard B. 1983. “Unionism, Price-Cost Margins, and the Return to Capital.”NBER Working Paper no. 1164. Cambridge, Mass.: National Bureau of Economic Re-search.
Ghosh, Arabinda. 1975. “Concentration and Growth of Indian Industries, 1948–68.” Jour-nal of Industrial Economics 23, no. 3: 203–22.
Goldar, Bishwanath. 2004. “Trade Liberalisation and Real Wages in Organised Manufac-turing Industries in India.” In Economic Policies and the Emerging Scenario: Chal-lenges to Government and Industry, ed. Ajit Karnik and L. G. Burange. Mumbai:Himalaya Publishing House.
Goldar, Bishwanath, and Anita Kumari. 2003. “Import Liberalization and ProductivityGrowth in Indian Manufacturing Industries in the 1990s.” Developing Economies 41,no. 4: 436–60.
Goldar, Bishwanath, and H. N. Saleem. 1992. “India’s Tariff Structure: Effective Rates ofProtection of Indian Industries.” Studies in Industrial Development, Paper no. 5. NewDelhi: Ministry of Industry, Government of India.
Grether, Jean-Marie. 1996. “Mexico, 1985–90: Trade Liberalization, Market Structure, andManufacturing Performance.” In Industrial Evolution in Developing Countries: MicroPatterns of Turnover, Productivity, and Market Structure, ed. Mark J. Roberts and JamesR. Tybout. New York: Oxford University Press for the World Bank.
Hall, Robert E. 1988. “The Relation between Price and Marginal Cost in U.S. Industry.”Journal of Political Economy 96, no. 5: 921–47.
Hoekman, Bernard; Hiau Looi Kee; and Marcelo Olarreaga. 2001. “Markups, Entry Regu-lation, and Trade: Does Country Size Matter?” World Bank Policy Research WorkingPaper no. 2662. Washington, D.C.: World Bank.
Hoffman, Saul D. 1986. Labor Market Economics. Englewood Cliffs, N.J.: Prentice Hall.Hsiao, Cheng. 1986. Analysis of Panel Data. Cambridge: Cambridge University Press.Joshi, Vijay, and I. M. D. Little. 1996. India’s Economic Reforms 1991–2001. Oxford:
Clarendon Press.
370 THE DEVELOPING ECONOMIES
Kambhampati, Uma S. 1996. Industrial Concentration and Performance: A Study of theStructure, Conduct and Performance of Indian Industry. Delhi: Oxford University Press.
Kambhampati, Uma S., and Ashok Parikh. 2003. “Disciplining Firms: The Impact of TradeReforms on Profit Margins in Indian Industry.” Applied Economics 35, no. 4: 461–70.
Kee, Hiau Looi, and Bernard Hoekman. 2003. “Imports, Entry, and Competition Law asMarket Disciplines.” World Bank Policy Research Working Paper no. 3031. Washing-ton, D.C.: World Bank.
Kmenta, Jan. 1986. Elements of Econometrics. 2nd ed. London: Macmillan.Krishna, Pravin, and Devashish Mitra. 1998. “Trade Liberalization, Market Discipline and
Productivity Growth: New Evidence from India.” Journal of Development Economics56, no. 2: 447–62.
National Council of Applied Economic Research (NCAER). 1999. “Protection in IndianIndustry.” Industry and Infrastructure, Project Report no. PJ010180. New Delhi: NCAER.
Nouroz, Hasheem. 2001. Protection in Indian Manufacturing: An Empirical Study. NewDelhi: Macmillan.
Pattnayak, Sanja S., and S. M. Thangavelu. 2003. “Economic Reform and ProductivityGrowth in Indian Manufacturing Industries: An Interaction of Technical Change andScale Economies.” NUS Working Paper no. 0307. Singapore: Department of Econom-ics, National University of Singapore.
Rao, Padma Arti. 2001. “A Study of the Determinants of Firm Profitability in SelectedIndustries in Post-reform India.” M.Phil. diss., Delhi School of Economics, Universityof Delhi.
Revenga, Ana. 1997. “Employment and Wage Effects of Trade Liberalization: The Case ofMexican Manufacturing.” Journal of Labor Economics 15, no. 3, part 2: S20–S43.
Roberts, Mark J., and James R. Tybout, eds. 1996. Industrial Evolution in Developing Coun-tries: Micro Patterns of Turnover, Productivity, and Market Structure. New York: Ox-ford University Press for the World Bank.
Seth, Vijay K., and Suresh Chand Aggarwal. 2004. The Economics of Labour Markets. NewDelhi: Ane Books.
Srivastava, Vivek; Pooja Gupta; and Arindam Datta. 2001. “The Impact of India’s Eco-nomic Reforms on Industrial Productivity, Efficiency and Competitiveness: A PanelStudy of Indian Companies (1980–1997).” Industry and Infrastructure, Project Reportno. PJ010176. New Delhi: National Council of Applied Economic Research.
Tendulkar, Suresh D. 2004. “Organised Labour Market in India: Pre and Post Reform.”Paper presented at the conference on Anti Poverty and Social Policy in India, Alwar,January 2–4.
Topalova, Petia. 2003. “Trade Liberalization and Firm Productivity: The Case of India.”New Haven, Conn.: Department of Economics, Yale University. Available from http://www.econ.yale.edu/seminars/NEUDC03/topaloval.pdf.
Tybout, James R. 2001. “Plant- and Firm-Level Evidence on ‘New’ Trade Theories.” InHandbook of International Trade, ed. E. Kwan Choi and James Harrigan. Malden, Mass.:Blackwell.
Unel, Bulent. 2003. “Productivity Trends in India’s Manufacturing Sectors in the Last TwoDecades.” IMF Working Paper no. WP/03/22. Washington, D.C.: International Mon-etary Fund.
Yalçin, Cihan. 2000. “Price-Cost Margins and Trade Liberalization in Turkish Manufactur-ing Industry: A Panel Data Analysis.” Discussion Paper. Ankara: Central Bank of theRepublic of Turkey.
371TRADE LIBERALIZATION AND PRICE-COST MARGIN
APPENDIX
LABOR MARKET EFFECT OF TRADE UNIONS
In the econometric analysis of PCM presented in this paper, the gap between in-come share of labor (denoted by SL) and the elasticity of output with respect tolabor (denoted by αL) has been taken as an explanatory variable, and treated as aproxy for trade union strength. Certain theoretical issues concerning the effect ofunions on wages and employment are briefly discussed here to explain the justifica-tion for choosing the proxy variable.
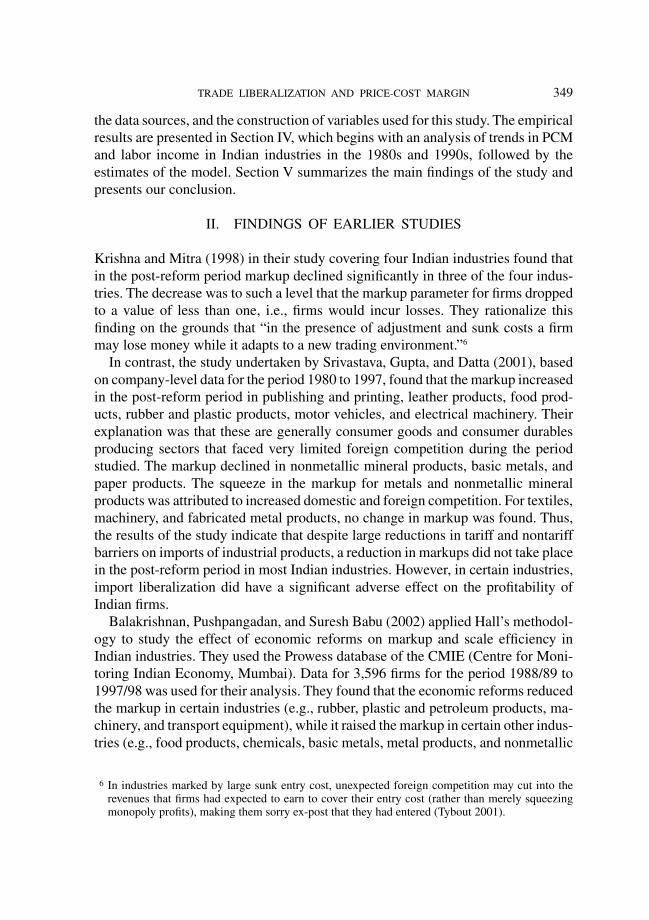
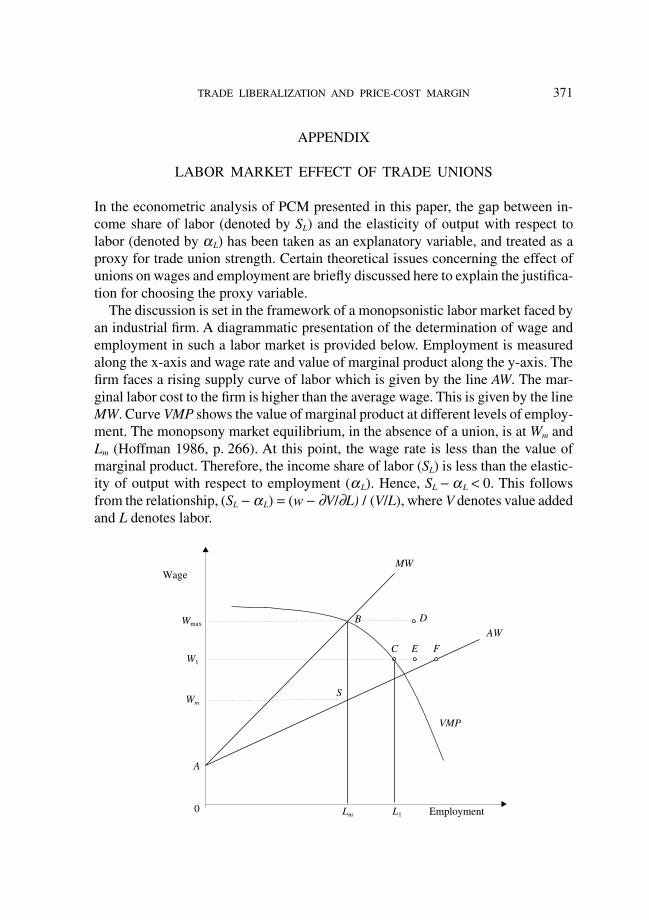
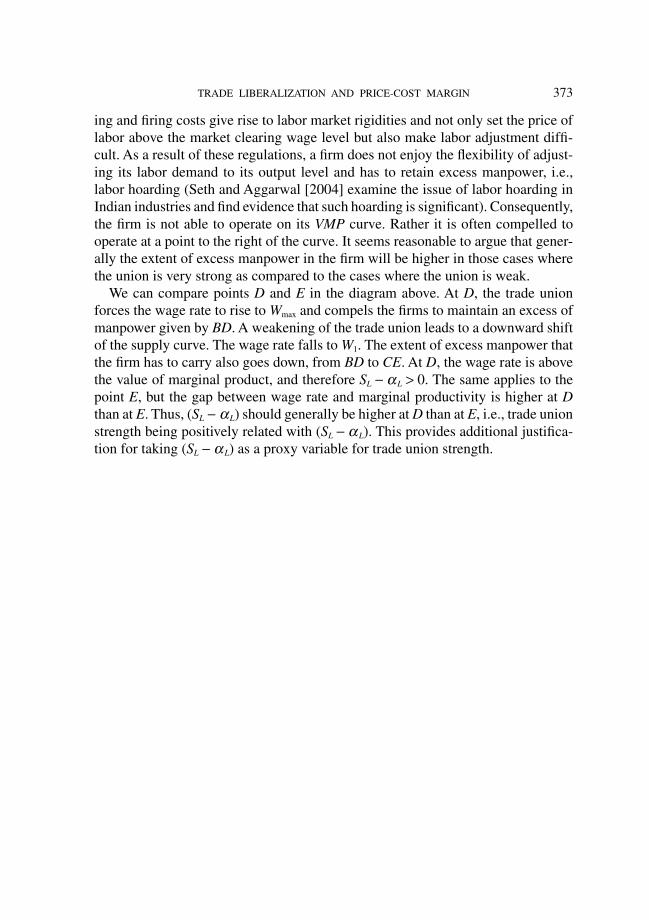
The discussion is set in the framework of a monopsonistic labor market faced byan industrial firm. A diagrammatic presentation of the determination of wage andemployment in such a labor market is provided below. Employment is measuredalong the x-axis and wage rate and value of marginal product along the y-axis. Thefirm faces a rising supply curve of labor which is given by the line AW. The mar-ginal labor cost to the firm is higher than the average wage. This is given by the lineMW. Curve VMP shows the value of marginal product at different levels of employ-ment. The monopsony market equilibrium, in the absence of a union, is at Wm andLm (Hoffman 1986, p. 266). At this point, the wage rate is less than the value ofmarginal product. Therefore, the income share of labor (SL) is less than the elastic-ity of output with respect to employment (αL). Hence, SL − αL < 0. This followsfrom the relationship, (SL − αL) = (w − ∂V/∂L) / (V/L), where V denotes value addedand L denotes labor.
Wage
Wmax
W1
Wm
A
MW
B D
C E F
S
VMP
AW
Lm L1 Employment0
372 THE DEVELOPING ECONOMIES
One must, however, allow for the possibility that the weakening of trade unionsdoes not affect the shape of the supply curve but causes the height of the flat portionof the curve to go down. The interpretation is that a weak trade union is unable topush up the wage as much as a strong union can, but it still has the power to ensurethat the firm pays the minimum wage rate negotiated by the union with the firm.The implication is that the equilibrium point will move along the VMP curve, theequilibrium shifting, for example, from B to C. The wage rate is equal to the valueof marginal productivity at both points, and therefore (SL − αL) will not fall.
At this stage, it would be useful to bring in the issue of labor market rigidities.Different labor market institutions such as: (a) collective bargaining agreements,(b) employment security regulations, (c) minimum wage legislations, and (d) hir-
APPENDIX TABLE I
INTERCORRELATION MATRIX AMONG VARIABLES
PCM TRF QR GRI KQ DWSE DCON
PCM 1TRF −0.0139 1QR −0.04862 0.4839 1GRI −0.02752 0.000133 −0.00895 1KQ 0.0649 −0.1704 −0.0738 0.0465 1DWSE −0.1018 0.11089 0.17024 −0.02477 −0.0957 1DCON 0.0016 0.0564 0.00396 −0.0187 −0.0238 −0.048 1
Note: PCM = price-cost margin, TRF = tariff rate, QR = quantitative restrictions (import cov-erage), GRI = growth rate of industry, KQ = capital-output ratio, DWSE = deviation of shareof wages and salaries in value added from estimated elasticity of output with respect to labor,and DCON = dummy variable for highly concentrated industries.
Let us now consider the effect of unionization. This typically raises the wageabove Wm, and it provides the firm with a new supply curve of labor which is per-fectly elastic over most of its range (Hoffman 1986). Suppose the wage is set at W1.The new supply curve is W1F in the segment up to F and the line AW thereafter. Theequilibrium in this situation is given by W1 and L1. In the equilibrium, the wage rateis equal to the value of marginal product, and therefore SL − αL = 0. Note furtherthat the union may be able to push the wage rate to Wmax without reducing employ-ment below the original level Lm. At this point, again, SL − α L = 0. It follows there-fore that as compared to a situation of no union, the presence of a union raises (SL − αL).
The weakening of trade unions in their bargaining strength may render themincapable of enforcing on the firm the minimum wage set by the unions. This wouldlead to a shift in the equilibrium point from B to S or C to S in the diagram above,which would cause (SL − αL) to decrease from zero to a negative value, and hencethere is some justification for taking (SL − αL) as a proxy variable for representingtrade union strength in the econometric analysis.
373TRADE LIBERALIZATION AND PRICE-COST MARGIN
ing and firing costs give rise to labor market rigidities and not only set the price oflabor above the market clearing wage level but also make labor adjustment diffi-cult. As a result of these regulations, a firm does not enjoy the flexibility of adjust-ing its labor demand to its output level and has to retain excess manpower, i.e.,labor hoarding (Seth and Aggarwal [2004] examine the issue of labor hoarding inIndian industries and find evidence that such hoarding is significant). Consequently,the firm is not able to operate on its VMP curve. Rather it is often compelled tooperate at a point to the right of the curve. It seems reasonable to argue that gener-ally the extent of excess manpower in the firm will be higher in those cases wherethe union is very strong as compared to the cases where the union is weak.
We can compare points D and E in the diagram above. At D, the trade unionforces the wage rate to rise to Wmax and compels the firms to maintain an excess ofmanpower given by BD. A weakening of the trade union leads to a downward shiftof the supply curve. The wage rate falls to W1. The extent of excess manpower thatthe firm has to carry also goes down, from BD to CE. At D, the wage rate is abovethe value of marginal product, and therefore SL − αL > 0. The same applies to thepoint E, but the gap between wage rate and marginal productivity is higher at Dthan at E. Thus, (SL − αL) should generally be higher at D than at E, i.e., trade unionstrength being positively related with (SL − α L). This provides additional justifica-tion for taking (SL − α L) as a proxy variable for trade union strength.