trans mountain pipeline – financial and economic
TRANSCRIPT
December 08, 2020
TRANS MOUNTAIN PIPELINE –FINANCIAL AND ECONOMICCONSIDERATIONS – UPDATE
Powered by TCPDF (www.tcpdf.org)

The Parliamentary Budget Officer (PBO) supports Parliament by providing
economic and financial analysis for the purposes of raising the quality of
parliamentary debate and promoting greater budget transparency and
accountability.
In January 2019, PBO released a report assessing the Government of
Canada’s 2018 decision to acquire, expand, operate, and eventually divest of
the Trans Mountain Pipeline system.
This report provides an updated financial valuation of the purchased assets,
estimates the valuation’s sensitivity to several key factors, and projects the
economic impact of the Expansion Project’s construction activities.
PBO wishes to acknowledge officials from the Canada Energy Regulator
(CER), who provided prompt, ample, and extensive insight into projections of
oil production and transportation in Canada. PBO also thanks officials from
Trans Mountain Corporation, who provided valuable technical clarifications
of financial data provided to PBO.
Lead Analysts:
Nigel Wodrich, Analyst
Jason Stanton, Senior Analyst
Contributor:
Chris Matier, Director General
This report was prepared under the direction of:
Jason Jacques, Director General
Nancy Beauchamp, Carol Faucher, Jocelyne Scrim and Rémy Vanherweghem
assisted with the preparation of the report for publication.
For further information, please contact [email protected]
Yves Giroux
Parliamentary Budget Officer
RP-2021-035-S_e
Table of Contents
Executive Summary 4
1. Introduction 7
1.1. Since 2019, developments have occurred that impact the
financial valuation of Trans Mountain 7
1.2. PBO re-assessed Trans Mountain with new data, updated
assumptions 8
2. Financial valuation 9
2.1. Discount rate 9
2.2. Trans Mountain continues to be a profitable undertaking
under current climate policy framework 10
3. Sensitivity analysis 11
3.1. Risks to Trans Mountain’s financial valuation 11
3.2. With different assumptions, Trans Mountain’s value may be
higher, lower, or even negative 14
4. Economic impact 17
4.1. TMEP’s construction will impact real GDP, employment 17
4.2. TMEP’s operation could increase optionality 18
Conceptual Accounting Impact of the Trans
Mountain Purchase, Expansion, and Divestiture 19
Alternative scenario 22
Notes 23
Trans Mountain Pipeline – Financial and Economic Considerations – Update
4
Executive Summary
Parliamentarians continue to have interest in the Government of Canada’s
2018 decision to acquire, expand, operate, and eventually divest of the Trans
Mountain Pipeline system. In response, PBO has proactively undertaken a
follow-up to his January 2019 report to provide updated financial analysis of
the Trans Mountain assets.
Since January 2019, there have been several developments that alter the
underlying assumptions of the previous model:
- The Trans Mountain Expansion Project (TMEP) has resumed
construction (August 2019), but with a higher construction budget
($12.6 billion) and a later in-service date (December 2022);
- TMEP’s construction progress and favourable legal decisions have
lowered the risk associated with the project; and
- New energy production forecasts have led to the development of
scenarios with increasing action on climate change and a lower
supply of Western Canadian crude oil available for export.
The Government provided PBO with projected future cash flows for the Trans
Mountain Pipeline system. PBO reviewed these data in conjunction with
relevant publicly available information and determined that they were
reasonable projections given the current climate policy framework.
PBO then made certain assumptions on pipeline utilization, the long-term
discount rate, as well as the service and tolling framework after the 20-year
shippers’ contracts expire. These assumptions formed the basis of PBO’s
“reference case” for the value of the Trans Mountain assets, which considers
that future climate policy actions are limited to only the measures that are
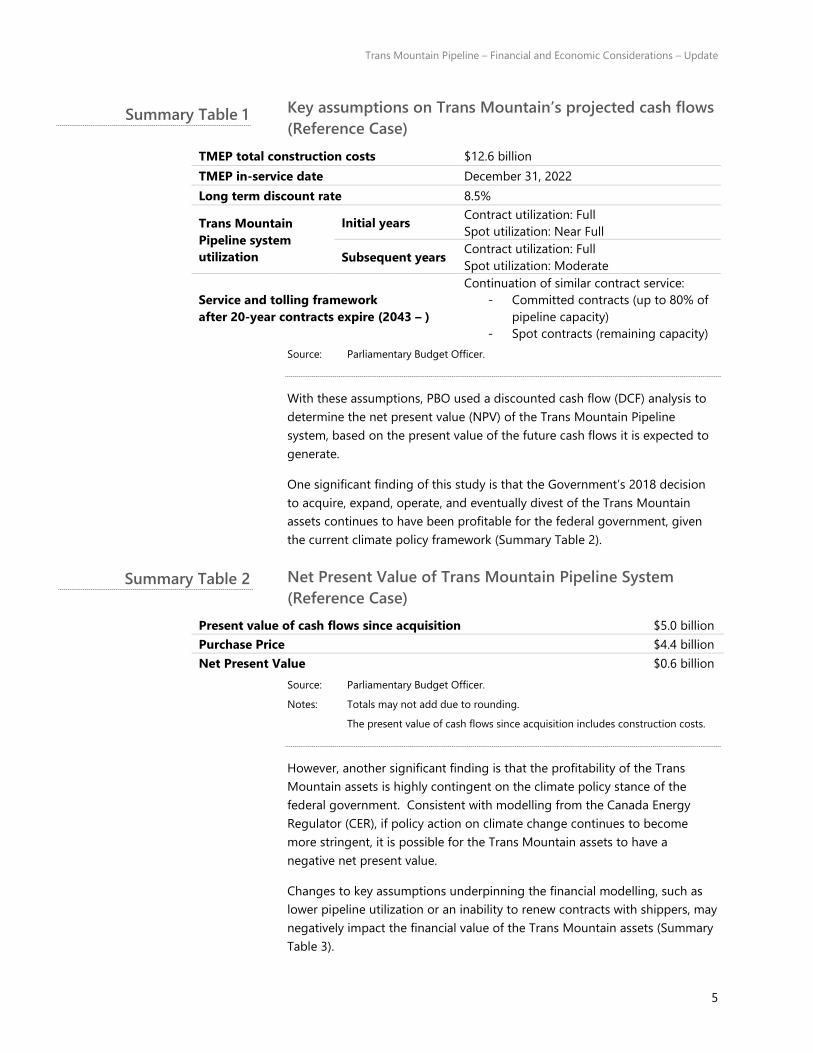
currently in place (Summary Table 1).
Trans Mountain Pipeline – Financial and Economic Considerations – Update
5
Key assumptions on Trans Mountain’s projected cash flows
(Reference Case)
TMEP total construction costs $12.6 billion
TMEP in-service date December 31, 2022
Long term discount rate 8.5%
Trans Mountain
Pipeline system
utilization
Initial years Contract utilization: Full
Spot utilization: Near Full
Subsequent years Contract utilization: Full
Spot utilization: Moderate
Service and tolling framework
after 20-year contracts expire (2043 – )
Continuation of similar contract service:
- Committed contracts (up to 80% of
pipeline capacity)
- Spot contracts (remaining capacity)
Source: Parliamentary Budget Officer.
With these assumptions, PBO used a discounted cash flow (DCF) analysis to
determine the net present value (NPV) of the Trans Mountain Pipeline
system, based on the present value of the future cash flows it is expected to
generate.
One significant finding of this study is that the Government’s 2018 decision
to acquire, expand, operate, and eventually divest of the Trans Mountain
assets continues to have been profitable for the federal government, given
the current climate policy framework (Summary Table 2).
Net Present Value of Trans Mountain Pipeline System
(Reference Case)
Present value of cash flows since acquisition $5.0 billion
Purchase Price $4.4 billion
Net Present Value $0.6 billion
Source: Parliamentary Budget Officer.
Notes: Totals may not add due to rounding.
The present value of cash flows since acquisition includes construction costs.
However, another significant finding is that the profitability of the Trans
Mountain assets is highly contingent on the climate policy stance of the
federal government. Consistent with modelling from the Canada Energy
Regulator (CER), if policy action on climate change continues to become
more stringent, it is possible for the Trans Mountain assets to have a
negative net present value.
Changes to key assumptions underpinning the financial modelling, such as
lower pipeline utilization or an inability to renew contracts with shippers, may
negatively impact the financial value of the Trans Mountain assets (Summary
Table 3).
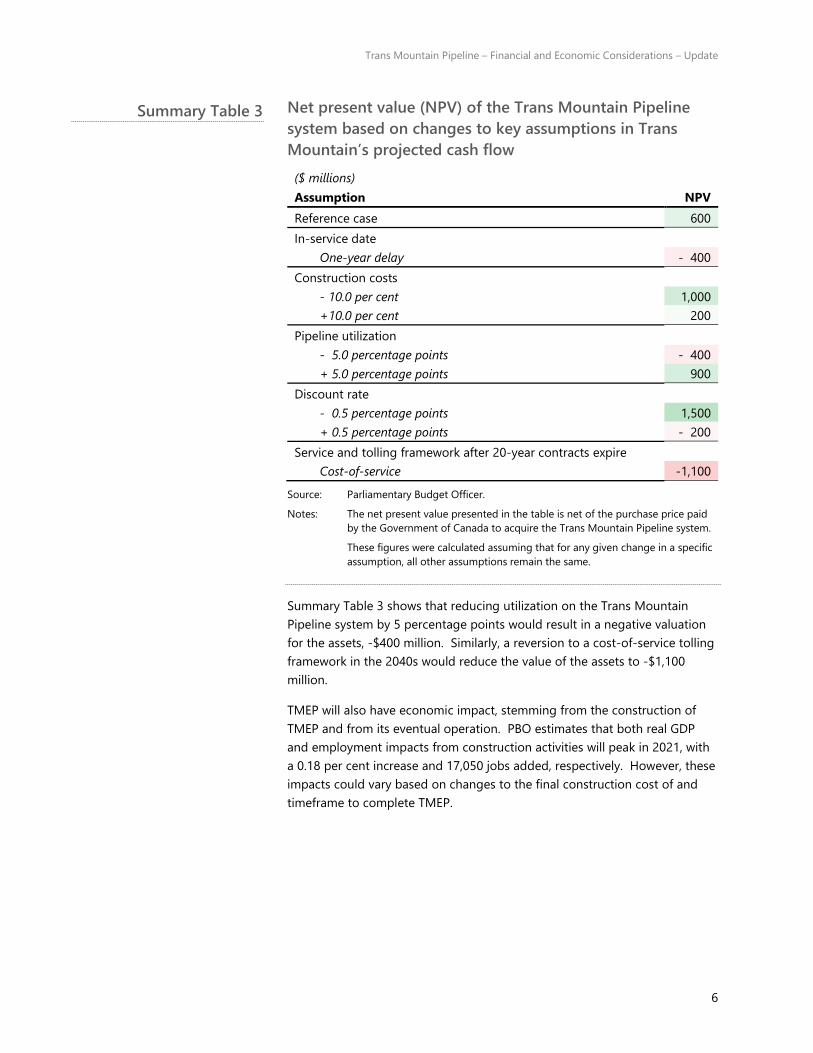
Summary Table 1
Summary Table 2
Trans Mountain Pipeline – Financial and Economic Considerations – Update
6
Net present value (NPV) of the Trans Mountain Pipeline
system based on changes to key assumptions in Trans
Mountain’s projected cash flow
($ millions)
Assumption NPV
Reference case 600
In-service date
One-year delay - 400
Construction costs
- 10.0 per cent 1,000
+10.0 per cent 200
Pipeline utilization
- 5.0 percentage points - 400
+ 5.0 percentage points 900
Discount rate
- 0.5 percentage points 1,500
+ 0.5 percentage points - 200
Service and tolling framework after 20-year contracts expire
Cost-of-service -1,100
Source: Parliamentary Budget Officer.
Notes: The net present value presented in the table is net of the purchase price paid
by the Government of Canada to acquire the Trans Mountain Pipeline system.
These figures were calculated assuming that for any given change in a specific
assumption, all other assumptions remain the same.
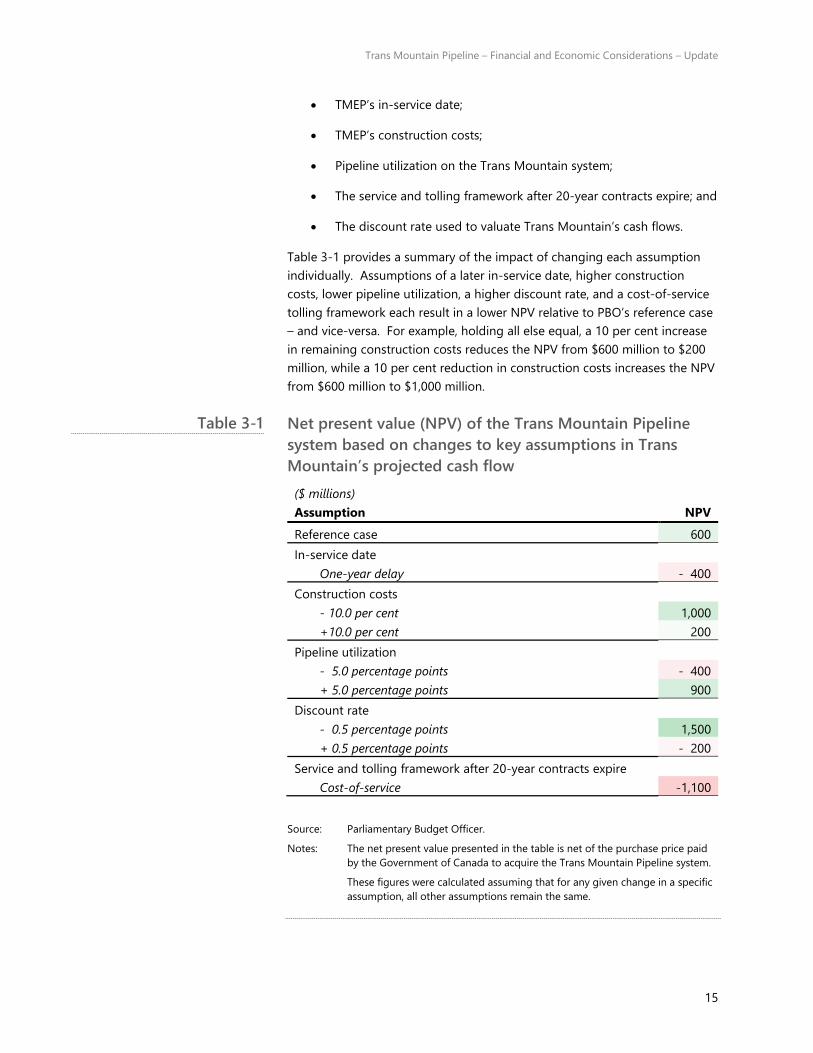
Summary Table 3 shows that reducing utilization on the Trans Mountain
Pipeline system by 5 percentage points would result in a negative valuation
for the assets, -$400 million. Similarly, a reversion to a cost-of-service tolling
framework in the 2040s would reduce the value of the assets to -$1,100
million.
TMEP will also have economic impact, stemming from the construction of
TMEP and from its eventual operation. PBO estimates that both real GDP
and employment impacts from construction activities will peak in 2021, with
a 0.18 per cent increase and 17,050 jobs added, respectively. However, these
impacts could vary based on changes to the final construction cost of and
timeframe to complete TMEP.
Summary Table 3

Trans Mountain Pipeline – Financial and Economic Considerations – Update
7
1. Introduction
1.1. Since 2019, developments have occurred that impact the
financial valuation of Trans Mountain
On August 31, 2018, the Government of Canada acquired the entities
controlling the Trans Mountain Pipeline system for $4.4 billion, net of
adjustments.1 The system consists of the existing Trans Mountain Pipeline
(TMP), the Trans Mountain Expansion Project (TMEP), and related assets.
Since the Government’s purchase, PBO has provided parliamentarians with
financial analysis and ongoing monitoring of financial reporting on the Trans
Mountain assets.2 PBO’s January 2019 report (Initial Report) presents an
overview of the assets’ capacity, purchase, ownership structure, and
regulatory progress and setbacks up until that point.
Building on our Initial Report, this report provides an updated financial
assessment of the Government of Canada’s 2018 decision to acquire, expand,
operate, and eventually divest of the Trans Mountain assets.3 This updated
analysis is motivated by continued parliamentarian interest in the topic, as
well as several developments following our Initial Report that may have
potential financial implications for the Trans Mountain assets and the federal
government. These include:
• The re-approval of TMEP by the Governor in Council (June 2019)4 and
the subsequent resumption of TMEP construction activities (August
2019)5;
• The confirmation of a higher construction cost estimate ($12.6 billion)
and a later expected in-service date (December 2022) for TMEP than we
assumed in our Initial Report6;
• The reduction of risk associated with TMEP in light of favourable
decisions in several legal challenges and construction progress;
• The reduction of benchmark interest rates due to the COVID-19
recession; and,
• The emergence of new scenarios in energy production forecasts that
incorporate assumptions of increasing action on climate change and
project a lower supply of Western Canadian crude oil available for
export.

Trans Mountain Pipeline – Financial and Economic Considerations – Update
8
1.2. PBO re-assessed Trans Mountain with new data, updated
assumptions
PBO requested information from the Canada Development Investment
Corporation (CDEV), the crown corporation holding the Trans Mountain
assets, regarding financial analyses and projections for the Trans Mountain
Pipeline system.7 CDEV provided all of the information that was requested to
PBO, but the information was classified as commercially confidential.8 The
data’s confidentiality did not inhibit PBO’s work to model the data, assess the
value of the Trans Mountain assets, or publish analytical results in this report.
PBO’s financial modelling was based primarily on CDEV-provided data of
projected cash flows for Trans Mountain Corporation (TMC) through 2062.
Using these projected cash flows, PBO made several key assumptions to the
model, as detailed in Table 1-1.
Key assumptions on Trans Mountain’s projected cash flows
(Reference Case)
TMEP total construction costs $12.6 billion
TMEP in-service date December 31, 2022
Trans Mountain
Pipeline system
utilization
Initial years Contract utilization: Full
Spot utilization: Near Full
Subsequent years Contract utilization: Full
Spot utilization: Moderate
Service and tolling framework
after 20-year contracts expire (2043 – )
Continuation of similar contract service:
- Committed contracts (up to 80% of
pipeline capacity)
- Spot contracts (remaining capacity)
Source: Parliamentary Budget Officer.
As described above, CDEV provided PBO with projected future cash flows for
the Trans Mountain Pipeline system. PBO reviewed these data in conjunction
with relevant publicly available information and determined that they were
reasonable projections given the current climate policy framework.
PBO then made certain assumptions on pipeline utilization, assumed
discount rate, as well as the service and tolling framework after the 20-year
shippers’ contracts expire. These assumptions informed the base for PBO’s
calculation of the Trans Mountain assets’ financial value (Section 2).
PBO’s “reference case” considers that future climate policy actions are limited
to only the measures that are currently in place. PBO assumed in its reference
case that shippers will recontract after their existing 20-year contracts expire.
All assumptions have a high degree of uncertainty, most notably the service
and tolling framework in 20 years. Therefore, PBO developed a sensitivity
Table 1-1
Trans Mountain Pipeline – Financial and Economic Considerations – Update
9
analysis to show the impact of changes to these variables on the overall net
present value of the assets (Section 3).
2. Financial valuation
To determine the impact of certain changes to key variables, the first step is
to calculate the overall value of Trans Mountain and its related assets in a
reference case. To that end, PBO used a discounted cash flow (DCF) analysis,
assessing the value to Trans Mountain Pipeline system based on the present
value of the future cash flows it is expected to generate.
As discussed in the previous section, PBO’s model is based on CDEV’s
projections. These were then adjusted based on feedback from a range of
stakeholders and industry analysts. One of the most notable adjustments
related to the discount rate.
2.1. Discount rate
The discount rate is an essential variable when calculating the net present
value (NPV) of any investment or business activity. When determining if an
asset will add value in comparison to the initial investment made, it is key to
discount the projected future cash flows to the same point in time. It
accounts for the time value of money, which at a high-level is that money
received now is preferred to money received in the future as it can be
invested and reap a return.
The discount rate also reflects the riskiness of an asset; the riskier the asset,
or projected future cash flows, the higher the discount rate. Any change to
the rate, both positive and negative, can result in a significant variation to the
overall valuation of an asset.
For the calculation of the discount rate, PBO used a weighted average cost of
capital (WACC). This includes both the cost of equity and after-tax cost of
debt, which is then weighted based on the optimal capital debt structure of
the company.9 To calculate this, PBO used data and information from
various sources, including Capital IQ, PBO’s Fiscal Sustainability Report 2020
and data provided by CDEV.10
One key variable in the calculation of the cost of equity is the risk-free rate.
For this analysis, PBO used its own projection of the Government of Canada’s
long-term benchmark bond yield. This rate is projected to remain relatively
low in the short-term and increase to 3.25 per cent over the long-term. As
this variable changes in the short term, the annual discount rate used by PBO
Trans Mountain Pipeline – Financial and Economic Considerations – Update
10
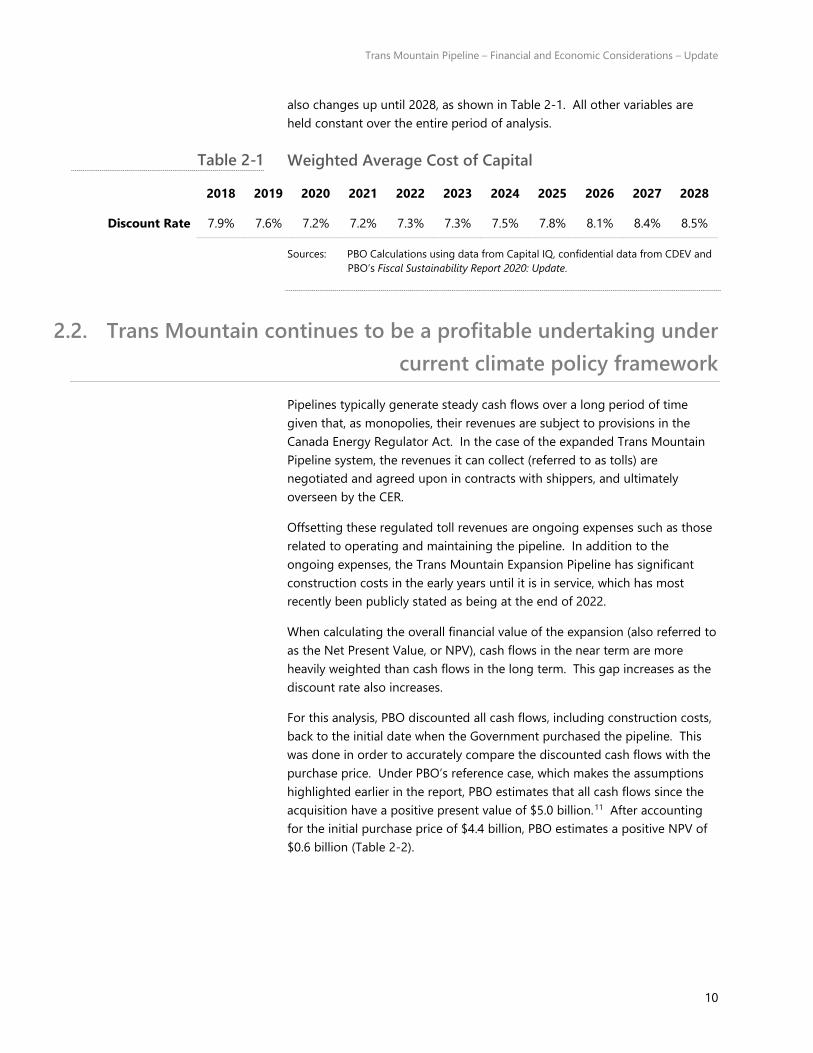
also changes up until 2028, as shown in Table 2-1. All other variables are
held constant over the entire period of analysis.
Weighted Average Cost of Capital
2018 2019 2020 2021 2022 2023 2024 2025 2026 2027 2028
Discount Rate 7.9% 7.6% 7.2% 7.2% 7.3% 7.3% 7.5% 7.8% 8.1% 8.4% 8.5%
Sources: PBO Calculations using data from Capital IQ, confidential data from CDEV and
PBO’s Fiscal Sustainability Report 2020: Update.
2.2. Trans Mountain continues to be a profitable undertaking under
current climate policy framework
Pipelines typically generate steady cash flows over a long period of time
given that, as monopolies, their revenues are subject to provisions in the
Canada Energy Regulator Act. In the case of the expanded Trans Mountain
Pipeline system, the revenues it can collect (referred to as tolls) are
negotiated and agreed upon in contracts with shippers, and ultimately
overseen by the CER.
Offsetting these regulated toll revenues are ongoing expenses such as those
related to operating and maintaining the pipeline. In addition to the
ongoing expenses, the Trans Mountain Expansion Pipeline has significant
construction costs in the early years until it is in service, which has most
recently been publicly stated as being at the end of 2022.
When calculating the overall financial value of the expansion (also referred to
as the Net Present Value, or NPV), cash flows in the near term are more
heavily weighted than cash flows in the long term. This gap increases as the
discount rate also increases.
For this analysis, PBO discounted all cash flows, including construction costs,
back to the initial date when the Government purchased the pipeline. This
was done in order to accurately compare the discounted cash flows with the
purchase price. Under PBO’s reference case, which makes the assumptions
highlighted earlier in the report, PBO estimates that all cash flows since the
acquisition have a positive present value of $5.0 billion.11 After accounting
for the initial purchase price of $4.4 billion, PBO estimates a positive NPV of
$0.6 billion (Table 2-2).
Table 2-1
Trans Mountain Pipeline – Financial and Economic Considerations – Update
11
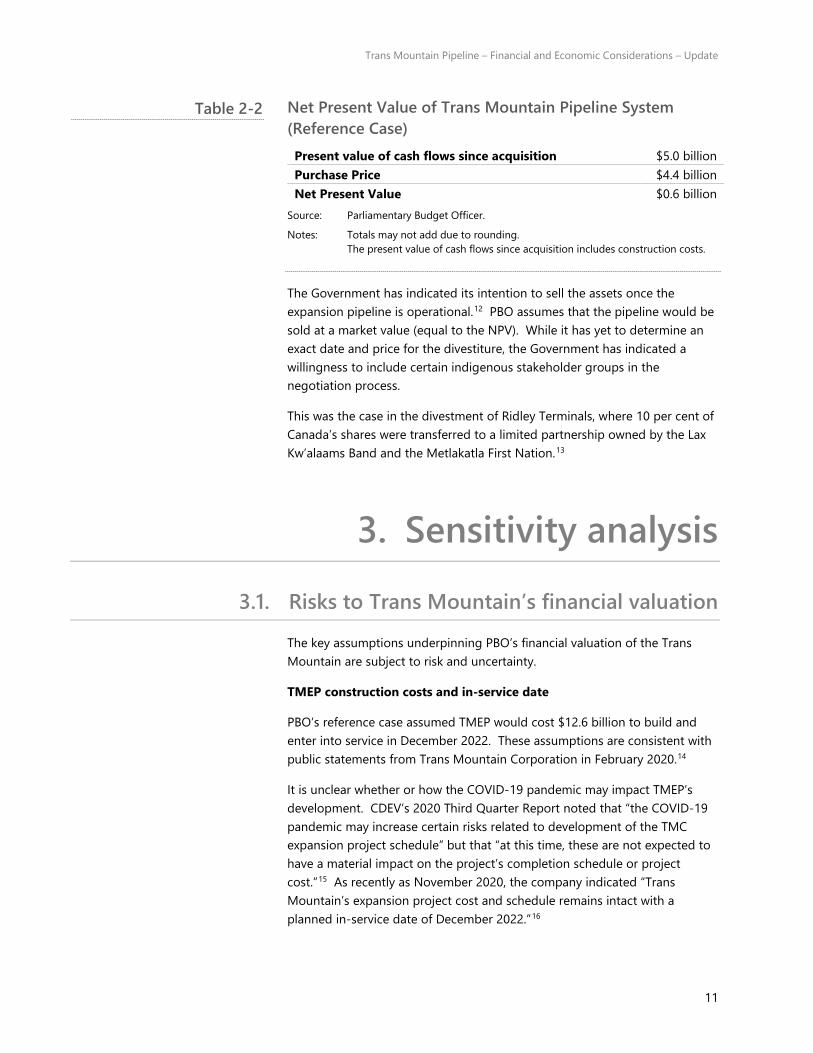
Net Present Value of Trans Mountain Pipeline System
(Reference Case)
Present value of cash flows since acquisition $5.0 billion
Purchase Price $4.4 billion
Net Present Value $0.6 billion
Source: Parliamentary Budget Officer.
Notes: Totals may not add due to rounding.
The present value of cash flows since acquisition includes construction costs.
The Government has indicated its intention to sell the assets once the
expansion pipeline is operational.12 PBO assumes that the pipeline would be
sold at a market value (equal to the NPV). While it has yet to determine an
exact date and price for the divestiture, the Government has indicated a
willingness to include certain indigenous stakeholder groups in the
negotiation process.
This was the case in the divestment of Ridley Terminals, where 10 per cent of
Canada’s shares were transferred to a limited partnership owned by the Lax
Kw’alaams Band and the Metlakatla First Nation.13
3. Sensitivity analysis
3.1. Risks to Trans Mountain’s financial valuation
The key assumptions underpinning PBO’s financial valuation of the Trans
Mountain are subject to risk and uncertainty.
TMEP construction costs and in-service date
PBO’s reference case assumed TMEP would cost $12.6 billion to build and
enter into service in December 2022. These assumptions are consistent with
public statements from Trans Mountain Corporation in February 2020.14
It is unclear whether or how the COVID-19 pandemic may impact TMEP’s
development. CDEV’s 2020 Third Quarter Report noted that “the COVID-19
pandemic may increase certain risks related to development of the TMC
expansion project schedule” but that “at this time, these are not expected to
have a material impact on the project’s completion schedule or project
cost.”15 As recently as November 2020, the company indicated “Trans
Mountain’s expansion project cost and schedule remains intact with a
planned in-service date of December 2022.”16
Table 2-2

Trans Mountain Pipeline – Financial and Economic Considerations – Update
12
There are additional risks to TMEP’s costs and schedule. Trans Mountain
Corporation has “recommended to the Government of Canada in its capacity
as owner and lender, a further $600 million in reserve for cost impacts
beyond the control of Trans Mountain.”17 TMEP also continues to face legal
and regulatory challenges.18
Since Trans Mountain first submitted applications to build TMEP, the
estimated construction costs and in-service date have deteriorated several
times (Figure 3-1).
There is a risk of further increases in construction costs and
delays to the in-service date for the Trans Mountain
Expansion Project
Sources: PBO interpretation of news reporting, earnings call transcripts, and public
documentation from Trans Mountain Corporation.19
Pipeline system utilization
During TMEP’s first couple of decades of operation, the Trans Mountain
Pipeline system is almost assured to garner regulated tolls for most of its 890
kbpd of pipeline capacity. 80 per cent (708 kbpd) of the pipeline system’s
capacity is locked into 15- and 20-year committed contracts. These contracts
require shippers to transport a certain volume of petroleum on the pipeline,
and if not, to still pay for the capacity to which they committed.
There is uncertainty around how much of the remaining 20 per cent capacity
of the expanded pipeline system will be used. The tolls charged for this
“spot” capacity are higher than for the committed contracts, but shippers
have no obligation to use it. Spot utilization will depend on oil supply
available for export, the availability of other takeaway capacity, and the
relative netbacks shippers receive from different pipeline options, among
other factors.
$12.6 billion
December 2022
$7.4 billion
September 2020
$6.8 billion
December 2019
$5.4 billion
December 2019
Date of estimate
February 2020
November 2017
October 2015
December 2013
2012 2014 2016 2018 2020 2022 2024
Estimated construction costs
Estimated in-service date
Figure 3-1
Trans Mountain Pipeline – Financial and Economic Considerations – Update
13
Service and tolling framework
As noted above, during TMEP’s first 15 to 20 years of operation, most of the
Trans Mountain Pipeline system’s capacity is earmarked toward committed
contracts. Once those contracts expire in the late 2030s – early 2040s, it is
uncertain what kind of service and tolling framework will prevail. PBO’s
reference case assumes a continuation of the contract framework after 20
years of operation, in which shippers re-enter into committed contracts.
However, in light of certain scenarios for oil supply in recent energy market
projections, there is a risk that shippers will choose to not re-enter into
committed contracts in the 2040s. The Canada Energy Regulator’s recent
Energy Futures 2020 presents two scenarios for projected oil supply available
for export from Western Canada: A “reference scenario” in which climate
change actions are limited to only the measures currently in place; and an
“evolving scenario” that continues the historical trend of increasing policy
action on climate change throughout the projection.
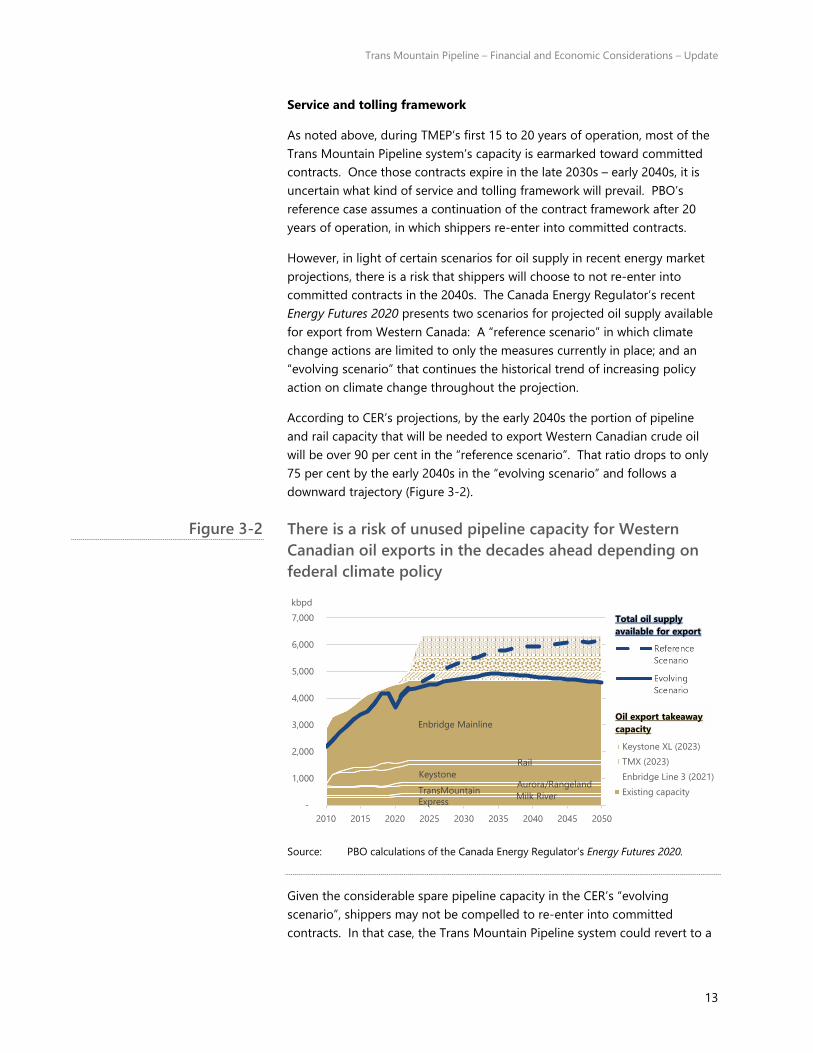
According to CER’s projections, by the early 2040s the portion of pipeline
and rail capacity that will be needed to export Western Canadian crude oil
will be over 90 per cent in the “reference scenario”. That ratio drops to only
75 per cent by the early 2040s in the “evolving scenario” and follows a
downward trajectory (Figure 3-2).
There is a risk of unused pipeline capacity for Western
Canadian oil exports in the decades ahead depending on
federal climate policy
Source: PBO calculations of the Canada Energy Regulator’s Energy Futures 2020.
Given the considerable spare pipeline capacity in the CER’s “evolving
scenario”, shippers may not be compelled to re-enter into committed
contracts. In that case, the Trans Mountain Pipeline system could revert to a
ExpressMilk River
TransMountainAurora/Rangeland
Keystone
Rail
Enbridge Mainline
-
1,000
2,000
3,000
4,000
5,000
6,000
7,000
2010 2015 2020 2025 2030 2035 2040 2045 2050
kbpd
Keystone XL (2023)
TMX (2023)
Enbridge Line 3 (2021)
Existing capacity
Total oil supply
available for export
Oil export takeaway
capacity
Figure 3-2
Trans Mountain Pipeline – Financial and Economic Considerations – Update
14
cost-of-service tolling framework.20 In such an outcome, the total tolls
charged to shippers would equal the total cost to Trans Mountain to provide
service, including a regulated return on the base rate. A reversion to a cost-
of-service toll framework in the 2040s would be less lucrative for Trans
Mountain Corporation and lower the assets’ net present value accordingly.
There is additional uncertainty around future oil export takeaway capacity. In
the CER’s current projections, by the early 2040s there will be 4,660 kbpd of
takeaway capacity from existing pipelines and another 1,700 kbpd of
takeaway capacity from pipelines that are currently under construction:
Enbridge Line 3 (330 kbpd), TMEP (540 kbpd), and Keystone XL (830 kbpd).
However, the in-coming US administration may block Keystone XL given
campaign commitments by the President-elect.21 Other pipeline capacity
may come online or go offline based on political and business decisions over
the next decades.
Discount rate
As described in a previous section, the discount rate is the rate used to
determine the present value of future cash flows. The discount rate also
incorporates risk and can therefore change based on the perceived risk and
the cost for firms to obtain financing to undertake investments.
In its 2018 Annual Report, CDEV stated that the discount rate is
approximately 9%, while its 2019 Annual Report reduced the rate to 8.6%.22
This decrease is consistent with the reduction in the perceived riskiness of
the project, given that many of the court challenges have been resolved.
Another key factor in calculating the discount rate is the risk-free rate. This
generally refers to the interest rate that the Government pays on its long-
term bonds. With the recent decline in interest rates, the overall discount
rate has also declined.
While these changes provide an understanding of where things stand today,
there remains uncertainty around many of the elements which factor into
future discount rates. While PBO has used its own projection of the
Government of Canada (GoC) long-term benchmark bond yield, it is not a
guarantee. Therefore, given this uncertainty, and since the discount rate has
a significant impact on the NPV, we have also performed a sensitivity analysis
with changes to the discount rate.
3.2. With different assumptions, Trans Mountain’s value may be
higher, lower, or even negative
PBO considered how the value of the Trans Mountain Pipeline system is
impacted by changes to five key assumptions from the financial valuation
discussed above:
Trans Mountain Pipeline – Financial and Economic Considerations – Update
15
• TMEP’s in-service date;
• TMEP’s construction costs;
• Pipeline utilization on the Trans Mountain system;
• The service and tolling framework after 20-year contracts expire; and
• The discount rate used to valuate Trans Mountain’s cash flows.
Table 3-1 provides a summary of the impact of changing each assumption
individually. Assumptions of a later in-service date, higher construction
costs, lower pipeline utilization, a higher discount rate, and a cost-of-service
tolling framework each result in a lower NPV relative to PBO’s reference case
– and vice-versa. For example, holding all else equal, a 10 per cent increase
in remaining construction costs reduces the NPV from $600 million to $200
million, while a 10 per cent reduction in construction costs increases the NPV
from $600 million to $1,000 million.
Net present value (NPV) of the Trans Mountain Pipeline
system based on changes to key assumptions in Trans
Mountain’s projected cash flow
($ millions)
Assumption NPV
Reference case 600
In-service date
One-year delay - 400
Construction costs
- 10.0 per cent 1,000
+10.0 per cent 200
Pipeline utilization
- 5.0 percentage points - 400
+ 5.0 percentage points 900
Discount rate
- 0.5 percentage points 1,500
+ 0.5 percentage points - 200
Service and tolling framework after 20-year contracts expire
Cost-of-service -1,100
Source: Parliamentary Budget Officer.
Notes: The net present value presented in the table is net of the purchase price paid
by the Government of Canada to acquire the Trans Mountain Pipeline system.
These figures were calculated assuming that for any given change in a specific
assumption, all other assumptions remain the same.
Table 3-1
Trans Mountain Pipeline – Financial and Economic Considerations – Update
16
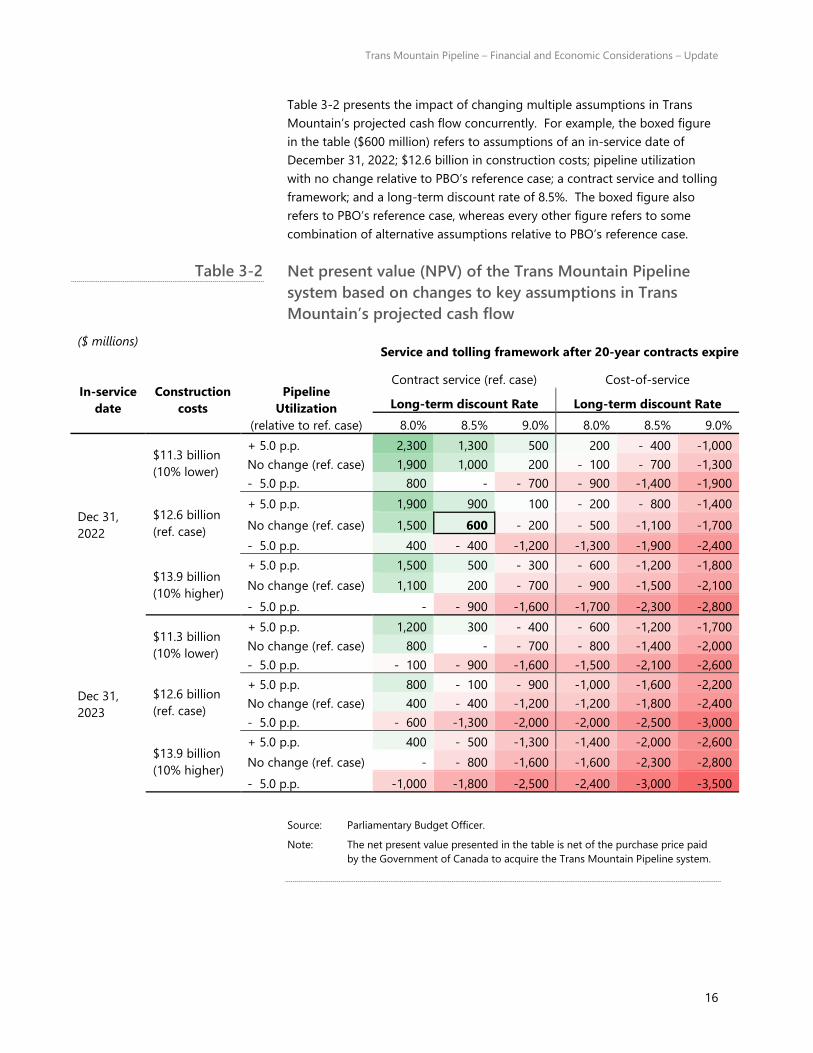
Table 3-2 presents the impact of changing multiple assumptions in Trans
Mountain’s projected cash flow concurrently. For example, the boxed figure
in the table ($600 million) refers to assumptions of an in-service date of
December 31, 2022; $12.6 billion in construction costs; pipeline utilization
with no change relative to PBO’s reference case; a contract service and tolling
framework; and a long-term discount rate of 8.5%. The boxed figure also
refers to PBO’s reference case, whereas every other figure refers to some
combination of alternative assumptions relative to PBO’s reference case.
Net present value (NPV) of the Trans Mountain Pipeline
system based on changes to key assumptions in Trans
Mountain’s projected cash flow
($ millions)
In-service
date
Construction
costs
Pipeline
Utilization
(relative to ref. case)
Service and tolling framework after 20-year contracts expire
Contract service (ref. case) Cost-of-service
Long-term discount Rate Long-term discount Rate
8.0% 8.5% 9.0% 8.0% 8.5% 9.0%
Dec 31,
2022
$11.3 billion
(10% lower)
+ 5.0 p.p. 2,300 1,300 500 200 - 400 -1,000
No change (ref. case) 1,900 1,000 200 - 100 - 700 -1,300
- 5.0 p.p. 800 - - 700 - 900 -1,400 -1,900
$12.6 billion
(ref. case)
+ 5.0 p.p. 1,900 900 100 - 200 - 800 -1,400
No change (ref. case) 1,500 600 - 200 - 500 -1,100 -1,700
- 5.0 p.p. 400 - 400 -1,200 -1,300 -1,900 -2,400
$13.9 billion
(10% higher)
+ 5.0 p.p. 1,500 500 - 300 - 600 -1,200 -1,800
No change (ref. case) 1,100 200 - 700 - 900 -1,500 -2,100
- 5.0 p.p. - - 900 -1,600 -1,700 -2,300 -2,800
Dec 31,
2023
$11.3 billion
(10% lower)
+ 5.0 p.p. 1,200 300 - 400 - 600 -1,200 -1,700
No change (ref. case) 800 - - 700 - 800 -1,400 -2,000
- 5.0 p.p. - 100 - 900 -1,600 -1,500 -2,100 -2,600
$12.6 billion
(ref. case)
+ 5.0 p.p. 800 - 100 - 900 -1,000 -1,600 -2,200
No change (ref. case) 400 - 400 -1,200 -1,200 -1,800 -2,400
- 5.0 p.p. - 600 -1,300 -2,000 -2,000 -2,500 -3,000
$13.9 billion
(10% higher)
+ 5.0 p.p. 400 - 500 -1,300 -1,400 -2,000 -2,600
No change (ref. case) - - 800 -1,600 -1,600 -2,300 -2,800
- 5.0 p.p. -1,000 -1,800 -2,500 -2,400 -3,000 -3,500
Source: Parliamentary Budget Officer.
Note: The net present value presented in the table is net of the purchase price paid
by the Government of Canada to acquire the Trans Mountain Pipeline system.
Table 3-2
Trans Mountain Pipeline – Financial and Economic Considerations – Update
17
4. Economic impact
TMEP will have economic impacts, stemming from the construction of the
asset itself and from its eventual operation.
4.1. TMEP’s construction will impact real GDP, employment
Construction impacts include the money spent to build the pipeline, the
multiplier effect from that economic activity and jobs created during
construction.
PBO assumed a total project cost $12.6 billion and an in-service date of
December 31, 2022 for TMEP. PBO deducted $1.7 billion of financial carrying
costs included in the $12.6 billion cost estimate to arrive at $10.9 billion in
spending on construction activities with a direct economic impact.23
Projected spending outlays were inputted to PBO’s macroeconomic model.
Based on this model, the multiplier associated with non-residential
construction over the construction period is estimated to average 1.4.24 That
is, for every $100 spent on constructing the pipeline in a given year,
approximately $140 in real GDP would be generated.
Funds related to construction activities that occurred prior to 2018 were not
included in PBO’s economic impact calculations. The results are presented in
Table 4-1.
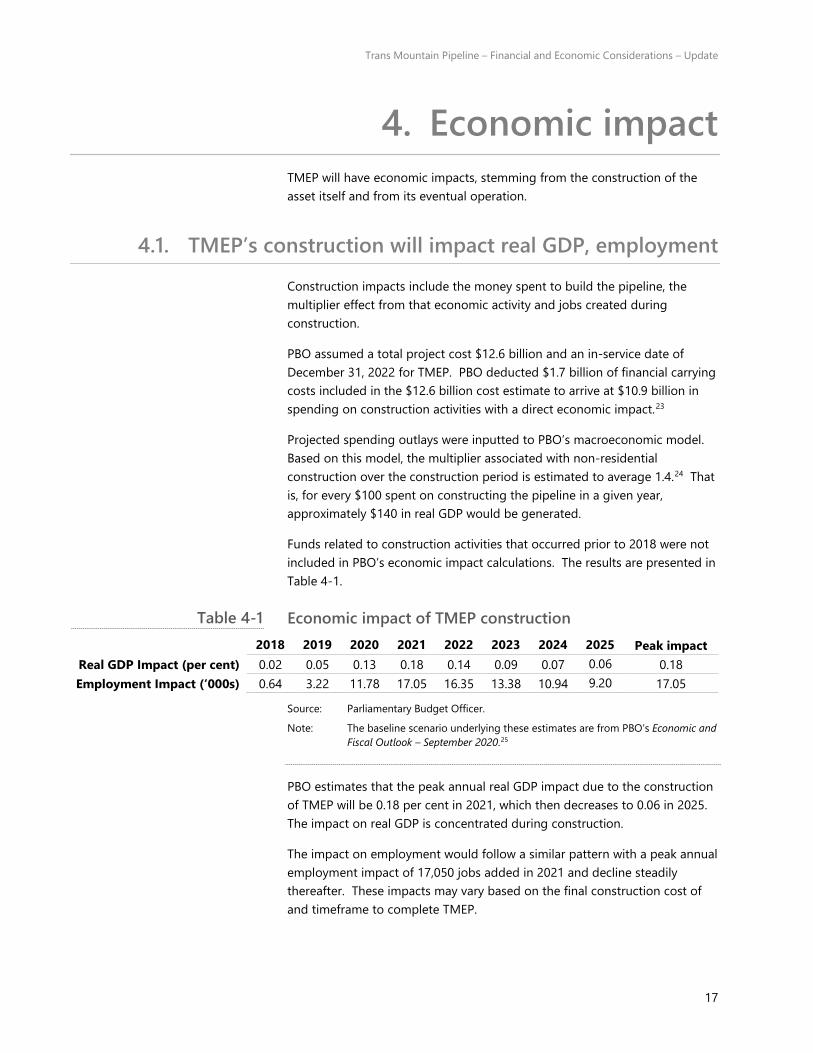
Economic impact of TMEP construction
2018 2019 2020 2021 2022 2023 2024 2025 Peak impact
Real GDP Impact (per cent) 0.02 0.05 0.13 0.18 0.14 0.09 0.07 0.06 0.18
Employment Impact (‘000s) 0.64 3.22 11.78 17.05 16.35 13.38 10.94 9.20 17.05
Source: Parliamentary Budget Officer.
Note: The baseline scenario underlying these estimates are from PBO’s Economic and
Fiscal Outlook – September 2020.25
PBO estimates that the peak annual real GDP impact due to the construction
of TMEP will be 0.18 per cent in 2021, which then decreases to 0.06 in 2025.
The impact on real GDP is concentrated during construction.
The impact on employment would follow a similar pattern with a peak annual
employment impact of 17,050 jobs added in 2021 and decline steadily
thereafter. These impacts may vary based on the final construction cost of
and timeframe to complete TMEP.
Table 4-1
Trans Mountain Pipeline – Financial and Economic Considerations – Update
18
4.2. TMEP’s operation could increase optionality
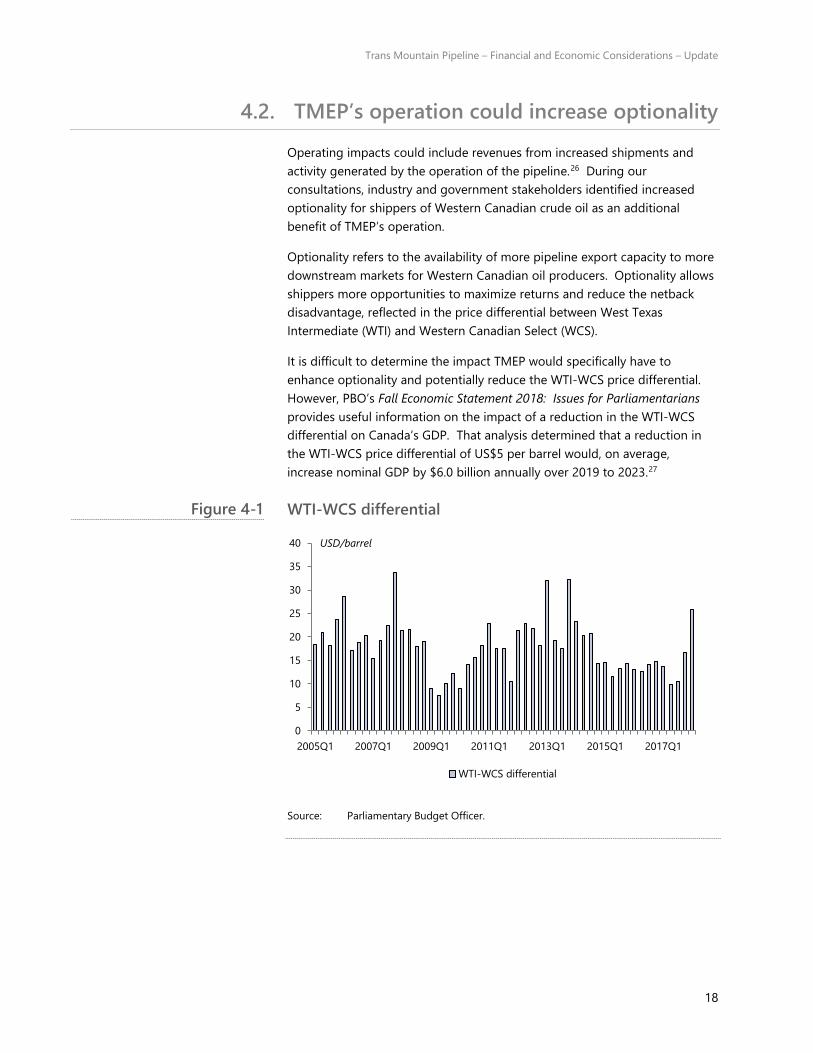
Operating impacts could include revenues from increased shipments and
activity generated by the operation of the pipeline.26 During our
consultations, industry and government stakeholders identified increased
optionality for shippers of Western Canadian crude oil as an additional
benefit of TMEP’s operation.
Optionality refers to the availability of more pipeline export capacity to more
downstream markets for Western Canadian oil producers. Optionality allows
shippers more opportunities to maximize returns and reduce the netback
disadvantage, reflected in the price differential between West Texas
Intermediate (WTI) and Western Canadian Select (WCS).
It is difficult to determine the impact TMEP would specifically have to
enhance optionality and potentially reduce the WTI-WCS price differential.
However, PBO’s Fall Economic Statement 2018: Issues for Parliamentarians
provides useful information on the impact of a reduction in the WTI-WCS
differential on Canada’s GDP. That analysis determined that a reduction in
the WTI-WCS price differential of US$5 per barrel would, on average,
increase nominal GDP by $6.0 billion annually over 2019 to 2023.27
WTI-WCS differential
Source: Parliamentary Budget Officer.
0
5
10
15
20
25
30
35
40
2005Q1 2007Q1 2009Q1 2011Q1 2013Q1 2015Q1 2017Q1
USD/barrel
WTI-WCS differential
Figure 4-1

Trans Mountain Pipeline – Financial and Economic Considerations – Update
19
Conceptual Accounting
Impact of the Trans
Mountain Purchase,
Expansion, and Divestiture
The purchase, operation and ultimate sale of the Trans Mountain
Corporation impacts various aspects of the government’s financial
statements. This appendix outlines the conceptual linkages between these
three stages and the line items in the government’s operating statement and
balance sheets. This approach, while accurate, is stylized in nature and leaves
out some non-material details.
Stage 1: Purchase of Trans Mountain Corporation by the government
This stage encompasses the purchase of Trans Mountain Corporation by the
Government of Canada.
Balance Sheet Impacts
(i) The Government of Canada issued new debt (a liability) to
obtain cash (an asset) to finance the purchase of Trans
Mountain Corporation.
(ii) The cash was then transferred to the Export Development
Corporation (EDC). For the Government, this decreased its cash
(an asset) but increased its equity in EDC (an asset) by the same
amount. For EDC, this increased its cash (an asset) and its
equity value ( an asset).
(iii) EDC in turn lent the money to another federal Crown
Corporation – the Canada Investment Development Corporation
(CDEV) to purchase Trans Mountain Corporation. For EDC, this
reduced its cash (an asset), which was fully offset by loans
receivable (an asset). For CDEV, this increased its cash (an
asset), which was fully offset by loans payable (a liability).
(iv) Finally, CDEV purchased Trans Mountain Corporation. This
reduced its cash (an asset) and increased its capital (an asset)
and goodwill (an asset; the difference between the purchase
price and the value of assets), offset by other acquired liabilities.
Trans Mountain Pipeline – Financial and Economic Considerations – Update
20
Stage 2: Pipeline Expansion
During this stage Trans Mountain Corporation continues to operate existing
assets and completes the pipeline expansion.
Operating Statement Impacts
(v) As Trans Mountain Corporation continues operations, it
generates revenues and expenses from existing assets that are
consolidated on CDEV’s operating statement.
(vi) CDEV, in turn, will incur ongoing and growing interest expenses
associated with its borrowing from EDC to finance the original
purchase of Trans Mountain Corporation and pipeline
expansion.
(vii) EDC will receive the interest revenues identified in (vi) from
CDEV.
(viii) The Government of Canada will continue to pay interest on the
debt incurred to purchase Trans Mountain and expand the
pipeline (PBO estimates these payments to be roughly $100
million in 2019). In addition, it will also report changes in the
value of EDC and CDEV through other revenues.
(ix) The Government of Canada will also generate additional
personal income tax (PIT) and corporate income tax (CIT)
revenue arising from the additional economic activity associated
with the pipeline expansion. In 2019, PBO estimates the
additional PIT, CIT, and GST revenues were approximately $60
million, $10 million, and $6 million, respectively.
Balance Sheet Impacts
(x) As in steps (i) to (iii), additional debt must be issued by the
Government, transferred to EDC and then lent to CDEV to pay
for construction costs.
(xi) As construction costs are incurred, CDEV’s cash (an asset)
balance falls, offset by increases in the value of capital assets.
Stage 3: Divestiture of Trans Mountain Corporation
During this stage, it is assumed that the government divests Trans Mountain
Corporation following completion of the expansion in December 2022.
Trans Mountain Pipeline – Financial and Economic Considerations – Update
21
Operating Statement Impacts
(xii) The ongoing operations of Trans Mountain Corporation will
continue to generate federal PIT and CIT revenues.
(xiii) Depending on the ultimate sale price of Trans Mountain
Corporation, CDEV will either recognize a gain or a loss on the
sale of the firm.
Balance Sheet Impacts
(xiv) Steps (i) to (iv) are reversed.
CDEV sells Trans Mountain Corporation (an asset) for
cash (an asset).
The cash (an asset) is then used to repay outstanding
debt owed to EDC (a liability).
After extinguishing its loans (an asset) to CDEV, EDC will
either use its cash (an asset) balance to engage in
further lending or remit the cash back to the
Government of Canada.
If the latter, the Government of Canada can decide to
maintain a higher cash balance (an asset) or extinguish
the debt originally issued to finance the purchase of
Trans Mountain Corporation (a liability).
Trans Mountain Pipeline – Financial and Economic Considerations – Update
22
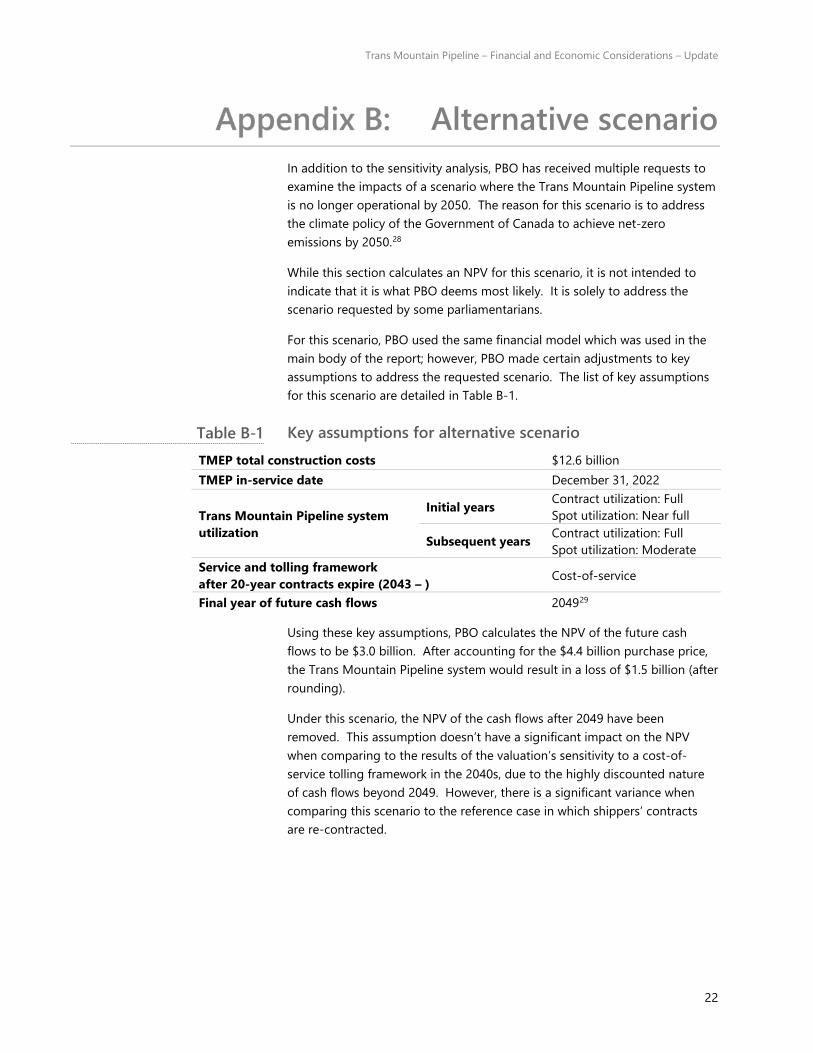
Alternative scenario
In addition to the sensitivity analysis, PBO has received multiple requests to
examine the impacts of a scenario where the Trans Mountain Pipeline system
is no longer operational by 2050. The reason for this scenario is to address
the climate policy of the Government of Canada to achieve net-zero
emissions by 2050.28
While this section calculates an NPV for this scenario, it is not intended to
indicate that it is what PBO deems most likely. It is solely to address the
scenario requested by some parliamentarians.
For this scenario, PBO used the same financial model which was used in the
main body of the report; however, PBO made certain adjustments to key
assumptions to address the requested scenario. The list of key assumptions
for this scenario are detailed in Table B-1.
Key assumptions for alternative scenario
TMEP total construction costs $12.6 billion
TMEP in-service date December 31, 2022
Trans Mountain Pipeline system
utilization
Initial years Contract utilization: Full
Spot utilization: Near full
Subsequent years Contract utilization: Full
Spot utilization: Moderate
Service and tolling framework
after 20-year contracts expire (2043 – ) Cost-of-service
Final year of future cash flows 204929
Using these key assumptions, PBO calculates the NPV of the future cash
flows to be $3.0 billion. After accounting for the $4.4 billion purchase price,
the Trans Mountain Pipeline system would result in a loss of $1.5 billion (after
rounding).
Under this scenario, the NPV of the cash flows after 2049 have been
removed. This assumption doesn’t have a significant impact on the NPV
when comparing to the results of the valuation’s sensitivity to a cost-of-
service tolling framework in the 2040s, due to the highly discounted nature
of cash flows beyond 2049. However, there is a significant variance when
comparing this scenario to the reference case in which shippers’ contracts
are re-contracted.
Table B-1
Trans Mountain Pipeline – Financial and Economic Considerations – Update
23
1. Canada Development Investment Corporation. (2020). 2019 Annual Report.
Retrieved from https://www.cdev.gc.ca/wp-content/uploads/2020/05/CDEV-
2019_Final-Art_English_03.31.2020_2.pdf
2. PBO previously published a financial analysis of the Government of Canada’s
purchase of the Trans Mountain Pipeline system in January 2019:
Parliamentary Budget Office. (2019). Canada’s purchase of the Trans
Mountain Pipeline – Financial and Economic Considerations. Retrieved
from https://www.pbo-
dpb.gc.ca/web/default/files/Documents/Reports/2019/Transmountain/T
rans_Mountain_Report_EN_FINAL2.pdf
Since the January 2019 publication, PBO has provided ongoing
monitoring of financial reporting on the Trans Mountain Pipeline system
via several blog posts:
Parliamentary Budget Office. (2019). Canada’s purchase of the Trans
Mountain Pipeline – Financial and Economic Considerations – Update.
Retrieved from https://www.pbo-
dpb.gc.ca/en/blog/news/Transmountain
Parliamentary Budget Office. (2019). Canada’s purchase of the Trans-
Mountain Pipeline: Financial and Economic Considerations – Updated
CDEV Financial Reporting. Retrieved from https://www.pbo-
dpb.gc.ca/en/blog/news/trans-mountain-pipeline-updated-cdev-
financial-reporting
Parliamentary Budget Office. (2019). Canada’s purchase of the Trans
Mountain Pipeline: Financial and Economic Considerations – Updated
CDEV Financial Reporting (November 2019). Retrieved from
https://www.pbo-dpb.gc.ca/en/blog/news/trans-mountain-pipeline-
updated-cdev--reseau-pipelinier-trans-mountain-mise-a-jour-cdev--
2019-12-10
Parliamentary Budget Office. (2020). Canada’s purchase of the Trans
Mountain Pipeline: Financial and Economic Considerations – Updated
CDEV Financial Reporting – July 2020. Retrieved from https://www.pbo-
dpb.gc.ca/en/blog/news/canada-purchase-trans-mountain-pipeline-
financial-economic-considerations-updated-cdev-financial-reporting-
july-2020--achat-pipeline-trans-mountain-canada-considerations-
economiques-financieres-mise-jour-information-financiere-cdev-juillet-
2020
3. Former Finance Minister Bill Morneau’s August 2018 letter to CDEV provides
more rationale for the Government of Canada’s decision to acquire, expand,
operate, and divest of the Trans Mountain assets.
Canada Development Investment Corporation. (2018). Minister’s Letter of
Expectations. Retrieved from https://www.cdev.gc.ca/wp-
content/uploads/2018/12/Ministers_Letter_August-27_-2018.pdf
Notes
Trans Mountain Pipeline – Financial and Economic Considerations – Update
24
4. Certificate of Public Convenience and Necessity OC-65 to Trans Mountain
Pipeline ULC in respect of the Trans Mountain Expansion Project; and Amending
Orders AO-004-OC-49, AO-005-OC-2, AO-002-OC-49 and AO-003OC-2. (2019).
Canada Gazette Part I, 153(25). Retrieved from http://www.gazette.gc.ca/rp-
pr/p1/2019/2019-06-22/html/sup1-eng.html
5. Trans Mountain Corporation. (2019). Trans Mountain Restarts Construction on
Expansion Projection. Retrieved from
https://www.transmountain.com/news/2019/trans-mountain-re-starts-
construction-on-expansion-project
6. By comparison, PBO’s Initial Report assumed a construction cost estimate of
$9.3 billion and an expected in-service date of December 2021.
Trans Mountain Corporation. (2019). Backgrounder: Trans Mountain Expansion
Projection Construction Accelerating. Retrieved from
https://www.transmountain.com/news/2020/backgrounder-trans-mountain-
expansion-project-construction-accelerating
7. Giroux, Y. (2020, July 29). [Letter to Mr. Stephen Swaffield, Chairman, CDEV].
Retrieved from https://www.pbo-
dpb.gc.ca/web/default/files/Documents/Info%20Requests/2020/IR0513_CDEV_T
MC_TMEP%20financial%20analyses_ltr_e.pdf
8. Stafl, A. (2020, August 12). [Letter to Yves Giroux, Parliamentary Budget Officer].
Retrieved from https://www.pbo-
dpb.gc.ca/web/default/files/Documents/Info%20Requests/2020/IR0513_response
_e.pdf
9. The weighted average cost of capital (WACC), which is the overall discount
rate, is calculated based on the following formula:
WACC = E
D+E×re+
D
D+E×rd×(1-t)
where E refers to the equity value, D refers to the value of debt, re refers to
the cost of equity, rd refers to the cost of debt and t refers to the corporate
tax rate.
10. Capital IQ data was retrieved on October 5, 2020.
11. In calculating the NPV, PBO assumed that all cash flows after the 20-year
contracts expire would grow by 2% (in line with inflation and CDEV’s
expectation, cited in its 2019 Annual Report, for long-term growth of Trans
Mountain cash flows). PBO’s analysis includes cash flows up until 2062. This
is consistent with the methodology used in PBO’s previous report, which
included cash flows for 40 years after TMEP’s in-service date.
Canada Development Investment Corporation. (2020). 2019 Annual Report.
Retrieved from https://www.cdev.gc.ca/wp-content/uploads/2020/05/CDEV-
2019_Final-Art_English_03.31.2020_2.pdf
12. Canada Development Investment Corporation. (2018). Minister’s Letter of
Expectations. Retrieved from https://www.cdev.gc.ca/wp-
content/uploads/2018/12/Ministers_Letter_August-27_-2018.pdf
13. Canada Development Investment Corporation. (2019). Divestment of Ridley
Terminals Inc. Closes. Retrieved from https://www.cdev.gc.ca/divestment-of-
ridley-terminals-inc-closes/
Trans Mountain Pipeline – Financial and Economic Considerations – Update
25
14. Trans Mountain Corporation. (2019). Backgrounder: Trans Mountain
Expansion Projection Construction Accelerating. Retrieved from
https://www.transmountain.com/news/2020/backgrounder-trans-mountain-
expansion-project-construction-accelerating
15. Canada Development and Investment Corporation. (2020). Third Quarter
Report – September 30, 2020. Retrieved from https://www.cdev.gc.ca/wp-
content/uploads/2020/11/CDEV-Q3-2020-Quarterly-Report-Final.pdf
16. Canada Development Investment Corporation. (2020). CDEV Annual Public
Meeting. Retrieved from https://www.cdev.gc.ca/cdev-annual-public-
meeting/
17. Trans Mountain Corporation. (2020). Backgrounder: Trans Mountain
Expansion Projection Construction Accelerating. Retrieved from
https://www.transmountain.com/news/2020/backgrounder-trans-mountain-
expansion-project-construction-accelerating
18. Canada Development Investment Corporation. (2020). Third Quarter Report –
September 30, 2020. Retrieved from https://www.cdev.gc.ca/wp-
content/uploads/2020/11/CDEV-Q3-2020-Quarterly-Report-Final.pdf
19. In December 2013, Kinder Morgan Canada submitted an application for the
Trans Mountain Expansion Project. The application estimated construction
costs of $5.4 billion and a December 2019 in-service date.
Global News. (2018). Timeline: Key dates in the history of the Trans Mountain
pipeline. Retrieved from https://globalnews.ca/news/4239520/trans-
mountain-pipeline-timeline/
In its 2015 Third Quarter earnings call, Kinder Morgan disclosed the Trans
Mountain Expansion Project construction costs had increased to $6.8 billion.
Financial Post. (2015). Trans Mountain pipeline costs rise to $6.8 billion, but
Kinder Morgan says project worth the price. Retrieved from
https://financialpost.com/commodities/energy/transcanada-pipeline-costs-
rise-to-6-8-billion-but-kinder-morgan-says-project-worth-the-price
In May 2017, Kinder Morgan estimated $7.4 billion in construction costs for
TMEP. In November 2017, the company’s master construction schedule
submitted to the National Energy Board projected TMEP would enter service
in September 2020.
Global News. (2018). Timeline: Key dates in the history of the Trans Mountain
pipeline. Retrieved from https://globalnews.ca/news/4239520/trans-
mountain-pipeline-timeline/
National Energy Board. (2017). TMEP Level 1 Master Schedule (Filing
A87461-3). Retrieved from https://docs2.cer-rec.gc.ca/ll-
eng/llisapi.dll/fetch/2000/90464/90552/548311/956726/2392873/2981674/3
347304/A87461-3_UPDATED_Nov_TMEP_Level_I_Schedule_-
_Sep_2020_In_Service_Condition_62_-
_A5W4T9.pdf?nodeid=3346865&vernum=-2
In February 2020, Trans Mountain Corporation and the federal government
estimated $12.6 billion in TMEP construction costs and a December 2022 in-
service date.
Trans Mountain Pipeline – Financial and Economic Considerations – Update
26
CTV News. (2020). Cost of Trans Mountain expansion jumps from $7.4B to at
least $12.6B. Retrieved from https://www.ctvnews.ca/politics/cost-of-trans-
mountain-expansion-jumps-from-7-4b-to-at-least-12-6b-1.4802172
20. A return to a cost-of-service tolling framework in the 2040s is one possibility.
Others include less than 80 per cent of the pipeline’s capacity committed to
similar contract service or an alternative negotiated settlement.
21. BNN Bloomberg. (2020). Joe Biden vows to block Keystone XL. Retrieved from
https://www.bnnbloomberg.ca/commodities/video/joe-biden-vows-to-
block-keystone-xl~1961076
22. Canada Development Investment Corporation. (2019). 2018 Annual Report.
Retrieved from https://www.cdev.gc.ca/wp-
content/uploads/2019/08/Canada-Development-Investment-
Corp_2018_FA_ENGLISH_REV_04.08.2019Final.pdf
Canada Development Investment Corporation. (2020). 2019 Annual Report.
Retrieved from https://www.cdev.gc.ca/wp-content/uploads/2020/05/CDEV-
2019_Final-Art_English_03.31.2020_2.pdf
23. This calculation accounts for an allowance for funds used during
construction (AFUDC), which consists of capitalized equity returns and
interest charges that do not have a direct economic impact during
construction.
Canada Development Investment Corporation. (2020). 2019 Annual Report.
Retrieved from https://www.cdev.gc.ca/wp-content/uploads/2020/05/CDEV-
2019_Final-Art_English_03.31.2020_2.pdf
24. PBO estimates the multiplier to vary between 0.9 to 1.8 over the entire
period, with an average of 1.4.
25. Parliamentary Budget Officer. (2020). Economic and Fiscal Outlook –
September 2020. Retrieved from https://www.pbo-
dpb.gc.ca/en/blog/news/RP-2021-027-S--economic-fiscal-outlook-
september-2020--perspectives-economiques-financieres-septembre-2020
26. By this claim, the increased oil export takeaway capacity that projects like
TMEP provide will encourage upstream oil producers to invest in more oil
production, creating knock-on economic impacts.
27. Parliamentary Budget Office. (2018). Fall Economic Statement 2018: Issues for
Parliamentarians. Retrieved from https://www.pbo-
dpb.gc.ca/web/default/files/Documents/Reports/2018/FES%202018/FES_201
8_EN_FINAL.pdf
28. https://www.canada.ca/en/environment-climate-
change/news/2019/12/government-of-canada-releases-emissions-
projections-showing-progress-towards-climate-target.html
29. PBO assumed that all cash flows after 2049 are equal to zero. In this scenario,
PBO does not scale down the projected cash flows leading up to 2050. While
it is unlikely that cash flows would end abruptly, it is highly uncertain how
the projected cash flows would wind down. Therefore, for the purpose of this
analysis, PBO assumed a less complicated scenario where the cash flows are
eliminated after 2049.