trans mountain pipeline expansion proposal (tmep) · 5/27/2015 · trans mountain pipeline...
TRANSCRIPT
Council Presentation 27 May 2015
Trans Mountain Pipeline Expansion Proposal (TMEP)
Summary of Evidence
• Background • Key findings
– Economic viability of the project – Risk and risk assessment – Spill impacts and preparedness
• Conclusion
2
Agenda

Background
3
• In 2013 City staff were directed by Council to seek intervenor status in the NEB hearings
• The City was granted intervenor status in April 2014 • Today (May 27) the City files final evidence with NEB
– Summary contains all the results of our research and analysis
Key review themes: 1. The economic viability of the pipeline expansion within a
climate constrained world 2. Risk of an oil spill from the expanded pipeline and
increase in tankers 3. Impacts of an oil spill on Vancouver
4
Background
5
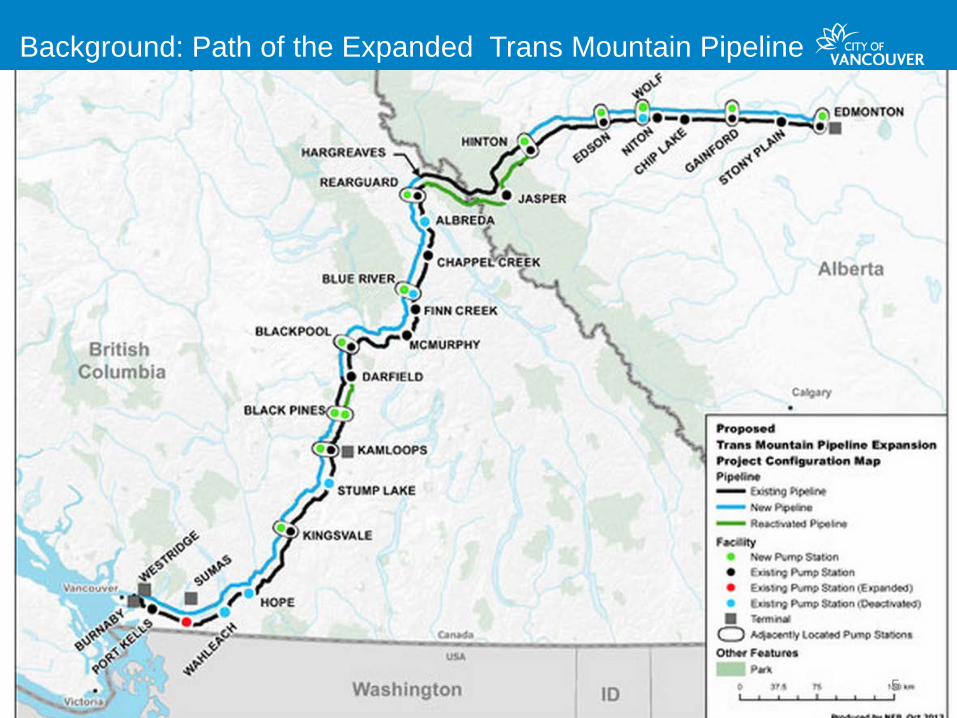
Background: Path of the Expanded Trans Mountain Pipeline
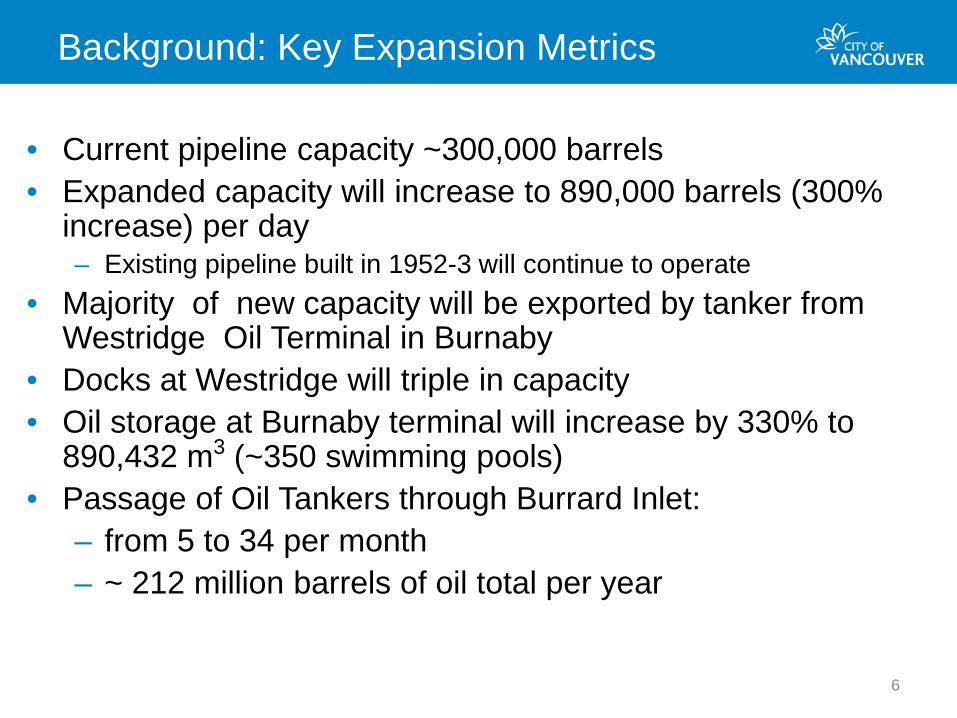
• Current pipeline capacity ~300,000 barrels • Expanded capacity will increase to 890,000 barrels (300%
increase) per day – Existing pipeline built in 1952-3 will continue to operate
• Majority of new capacity will be exported by tanker from Westridge Oil Terminal in Burnaby
• Docks at Westridge will triple in capacity • Oil storage at Burnaby terminal will increase by 330% to
890,432 m3 (~350 swimming pools) • Passage of Oil Tankers through Burrard Inlet:
– from 5 to 34 per month – ~ 212 million barrels of oil total per year
6
Background: Key Expansion Metrics

7
Background: Impact Considerations
People
• 25,000 people live within 300m of Vancouver’s waterfront
Economy
• Our coastline supports ~98,800 jobs per year and $9.7 billion in GDP
Environment
• Burrard Inlet and Fraser River estuary are some of the world’s most important ecosystems
• Combined areas are inhabited seasonally by over 1 million sea- and shorebirds
• Vancouver has 0.17 square kilometres of natural shoreline
The project could have a major impact on Vancouver, including our:

8
Background: Public Engagement To inform our position, we engaged with residents using the following tools: • Online TalkVancouver survey (4994
responses) • Public open space forum • Infographics • Driftcard oil spill experiment • Pop-up City Hall • City website and social media
81%
13% 6%
Public Opinion on Trans Mountain Expansion
Opposed
Support
Undecided or don'tknow

9
Public perception of risks

10
Background: NEB Timeline and Process
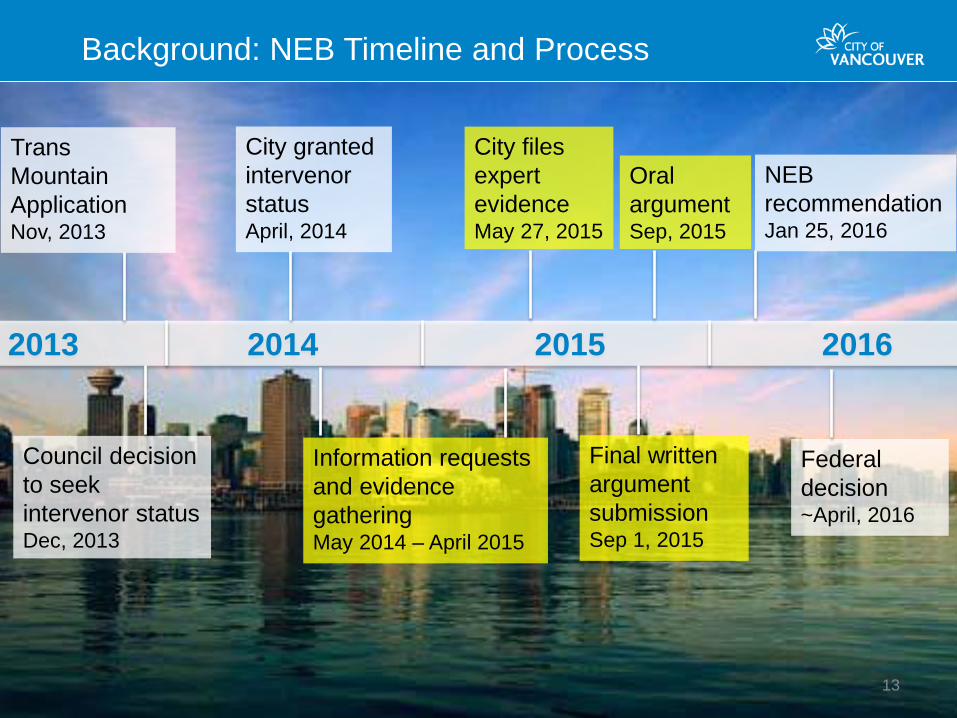
Trans Mountain Application Nov, 2013
Council decision to seek intervenor status Dec, 2013
Information requests and evidence gathering May 2014 – April 2015
City granted intervenor status April, 2014
City files expert evidence May 27, 2015
Final written argument submission Sep 1, 2015
Oral argument Sep, 2015
NEB recommendation Jan 25, 2016
Federal decision ~April, 2016
2013 2014 2015 2016
City assumptions: • Expertise from outside City staff necessary for many of
the key areas required • Other partners share concerns (First Nations,
neighboring Municipalities, Public Health officials, other key stakeholder organizations)
• Limited timeframe for development and submission of evidence
• Cost of developing submission significant • Legal issues complex • Goal: rigorous, evidence based submission to NEB City strategy: • Partner with others to prepare and fund evidence
based submissions 11
Background: Preparing our Evidence for NEB

Experts contributing to research, science and analysis of COV submission: • Economic viability of the project
– Prof. M. Jaccard (SFU) – Energy economist – Prof. K. Harrison (UBC) – Political scientist and chemical engineer
• Risk assessment and history
– Assoc. Prof. D. Etkin (York University) – Risk expert – Assoc. Prof. S. Kheraj (York University) – Historian
• Spill impacts and preparedness
– Genwest Systems Inc. – Spill model developers – Nuka research and planning – Oil spill response experts – Dr. J. Short (JWS consultants)– Chemist and ecological impact specialist – J. Stone (Recovery and Relief Services) – Post disaster recovery cost experts – Prof. R Sumaila (UBC) – Marine economist – E. Baum (Brand Finance) – Brand valuers – Karen MacWilliams – Risk transfer expert 12
Background: Research, Science, Analysis
13
Background: NEB Timeline and Process
Trans Mountain Application Nov, 2013
Council decision to seek intervenor status Dec, 2013
Information requests and evidence gathering May 2014 – April 2015
City granted intervenor status April, 2014
City files expert evidence May 27, 2015
Final written argument submission Sep 1, 2015
Oral argument Sep, 2015
NEB recommendation Jan 25, 2016
Federal decision ~April, 2016
2013 2014 2015 2016
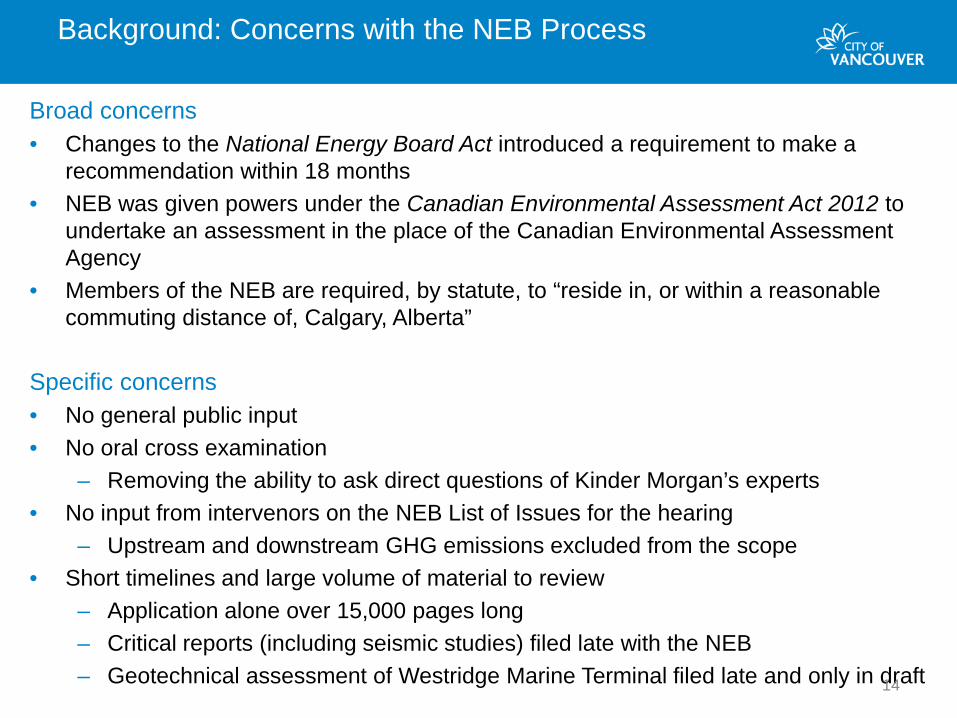
Broad concerns • Changes to the National Energy Board Act introduced a requirement to make a
recommendation within 18 months • NEB was given powers under the Canadian Environmental Assessment Act 2012 to
undertake an assessment in the place of the Canadian Environmental Assessment Agency
• Members of the NEB are required, by statute, to “reside in, or within a reasonable commuting distance of, Calgary, Alberta”
Specific concerns • No general public input • No oral cross examination
– Removing the ability to ask direct questions of Kinder Morgan’s experts • No input from intervenors on the NEB List of Issues for the hearing
– Upstream and downstream GHG emissions excluded from the scope • Short timelines and large volume of material to review
– Application alone over 15,000 pages long – Critical reports (including seismic studies) filed late with the NEB – Geotechnical assessment of Westridge Marine Terminal filed late and only in draft
14
Background: Concerns with the NEB Process
Information request process • Across two rounds of written information requests the City asked 1252 questions • Kinder Morgan provided written responses to the questions • In 40% of the City’s questions the answered were, in the view of the City,
unsatisfactory • The City filed notices of motion with the NEB to compel a full response • Despite City staff being of the view that Kinder Morgan’s responses were
inadequate the NEB ruled in its Kinder Morgan’s favor in nearly all of the cases • Any questions related to the existing line were ruled to be irrelevant including:
– The amount of taxes Kinder Morgan currently pays – The emergency management plans – The number of land slides and rock falls experienced
• When we asked the professional opinions of their experts many times it was ruled to be a “fishing expedition”
• Inadequate time was given to review responses – As little as a 48 hour turnaround (on the late filed geotechnical reports)
15
Background: Information Request Process
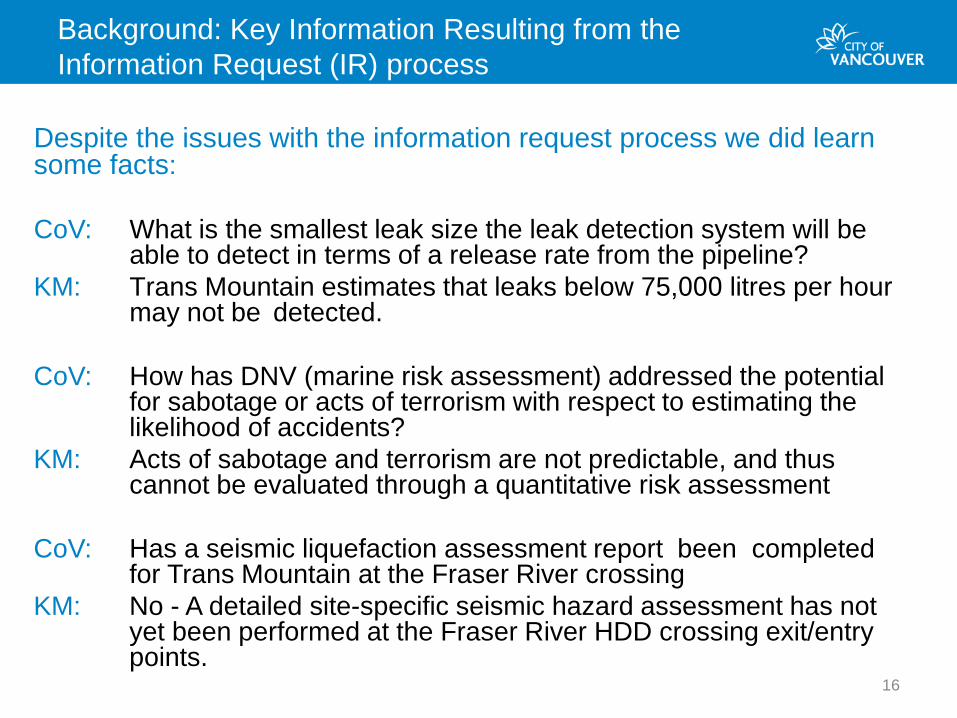
Despite the issues with the information request process we did learn some facts:
CoV: What is the smallest leak size the leak detection system will be able to detect in terms of a release rate from the pipeline?
KM: Trans Mountain estimates that leaks below 75,000 litres per hour may not be detected.
CoV: How has DNV (marine risk assessment) addressed the potential for sabotage or acts of terrorism with respect to estimating the likelihood of accidents?
KM: Acts of sabotage and terrorism are not predictable, and thus cannot be evaluated through a quantitative risk assessment
CoV: Has a seismic liquefaction assessment report been completed for Trans Mountain at the Fraser River crossing
KM: No - A detailed site-specific seismic hazard assessment has not yet been performed at the Fraser River HDD crossing exit/entry points.
16
Background: Key Information Resulting from the Information Request (IR) process
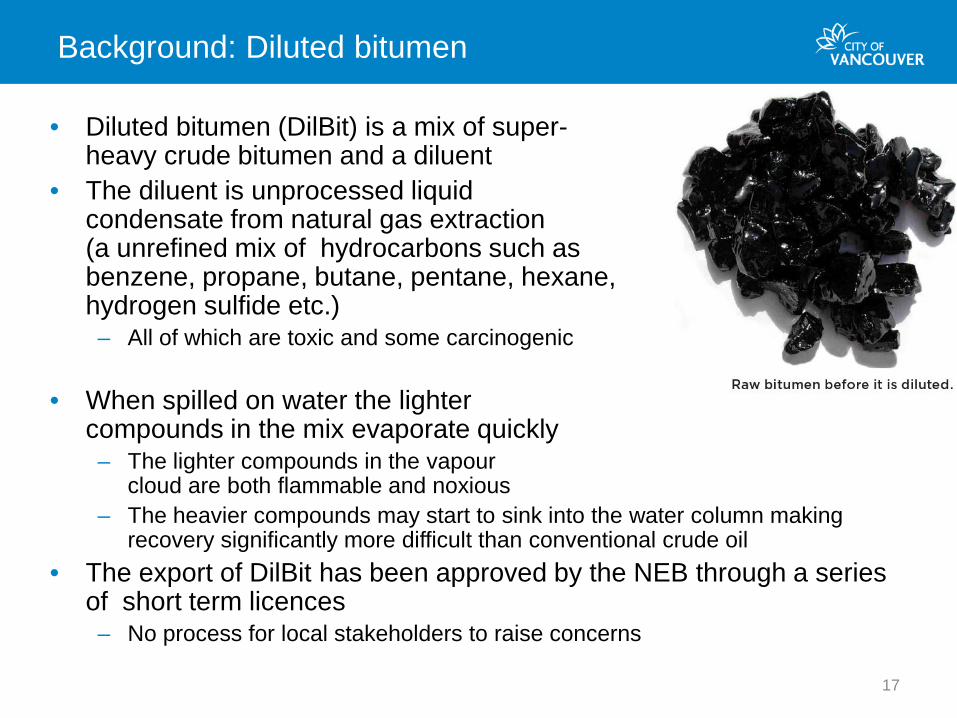
• Diluted bitumen (DilBit) is a mix of super- heavy crude bitumen and a diluent
• The diluent is unprocessed liquid condensate from natural gas extraction (a unrefined mix of hydrocarbons such as benzene, propane, butane, pentane, hexane, hydrogen sulfide etc.) – All of which are toxic and some carcinogenic
• When spilled on water the lighter
compounds in the mix evaporate quickly – The lighter compounds in the vapour
cloud are both flammable and noxious – The heavier compounds may start to sink into the water column making
recovery significantly more difficult than conventional crude oil • The export of DilBit has been approved by the NEB through a series
of short term licences – No process for local stakeholders to raise concerns
17
Background: Diluted bitumen
18
Background: Kinder Morgan Canada’s argument
• Economic viability of the project – The proposed expansion is economically viable based on future growth of
the oil sands
• Risk assessment and history – The history of spills and ruptures of the existing pipeline is not relevant – There is very low risk of a pipeline or a tanker spill – There is a good history of pipeline safety and the existing pipeline provides
the justification for the location of the expansion
• Spill impacts and preparedness – The negative impacts are reasonable and manageable – There is good preparedness for an emergency and improvements will
further enhance readiness – Diluted bitumen does not sink and is not different from conventional crudes
Kinder Morgan:
The benefits outweigh the costs and risks
19
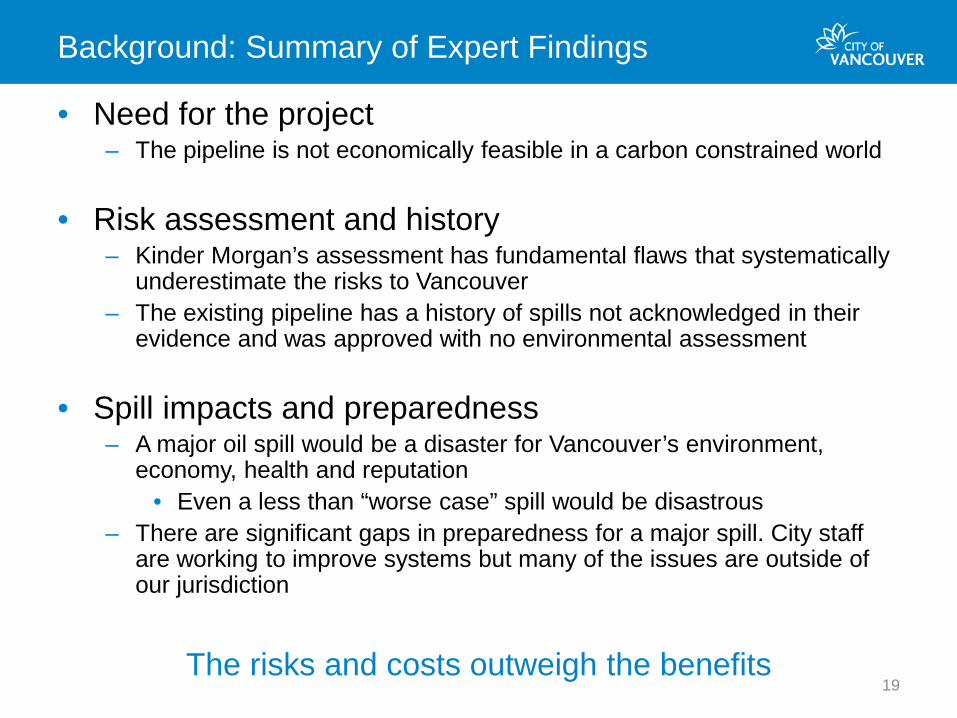
Background: Summary of Expert Findings
• Need for the project – The pipeline is not economically feasible in a carbon constrained world
• Risk assessment and history – Kinder Morgan’s assessment has fundamental flaws that systematically
underestimate the risks to Vancouver – The existing pipeline has a history of spills not acknowledged in their
evidence and was approved with no environmental assessment
• Spill impacts and preparedness – A major oil spill would be a disaster for Vancouver’s environment,
economy, health and reputation • Even a less than “worse case” spill would be disastrous
– There are significant gaps in preparedness for a major spill. City staff are working to improve systems but many of the issues are outside of our jurisdiction
The risks and costs outweigh the benefits

Economic Viability of the Project
20 Photo credit: Derek K Miller
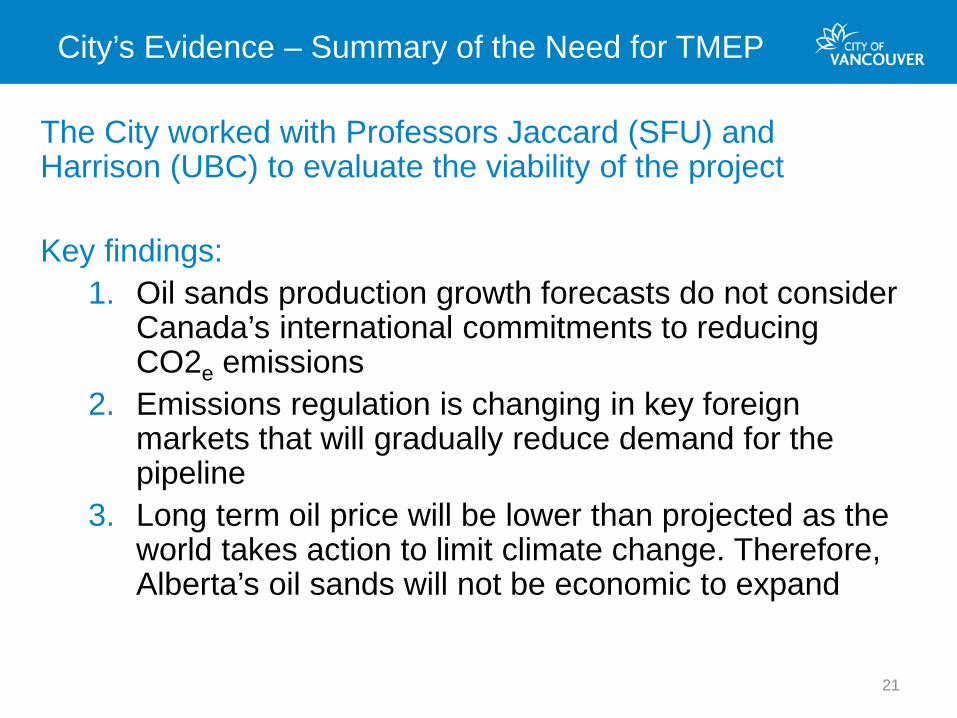
The City worked with Professors Jaccard (SFU) and Harrison (UBC) to evaluate the viability of the project Key findings:
1. Oil sands production growth forecasts do not consider Canada’s international commitments to reducing CO2e emissions
2. Emissions regulation is changing in key foreign markets that will gradually reduce demand for the pipeline
3. Long term oil price will be lower than projected as the world takes action to limit climate change. Therefore, Alberta’s oil sands will not be economic to expand
21
City’s Evidence – Summary of the Need for TMEP

• Oil sands are forecast to be the largest contributor to the growth in Canada’s GHG emissions
• Canada’s ability to meet these targets is challenged by the size of the impact from oil sand production
• Kinder Morgan’s business case does not consider policy and regulation changes needed to meet these targets 22
City Evidence: Oil Sands Growth and CO2 Targets (Jaccard)
30% by 2030
• Canada has set targets to reduce GHG emissions – Recently announced targets are less stringent
Canada’s climate change commitment path
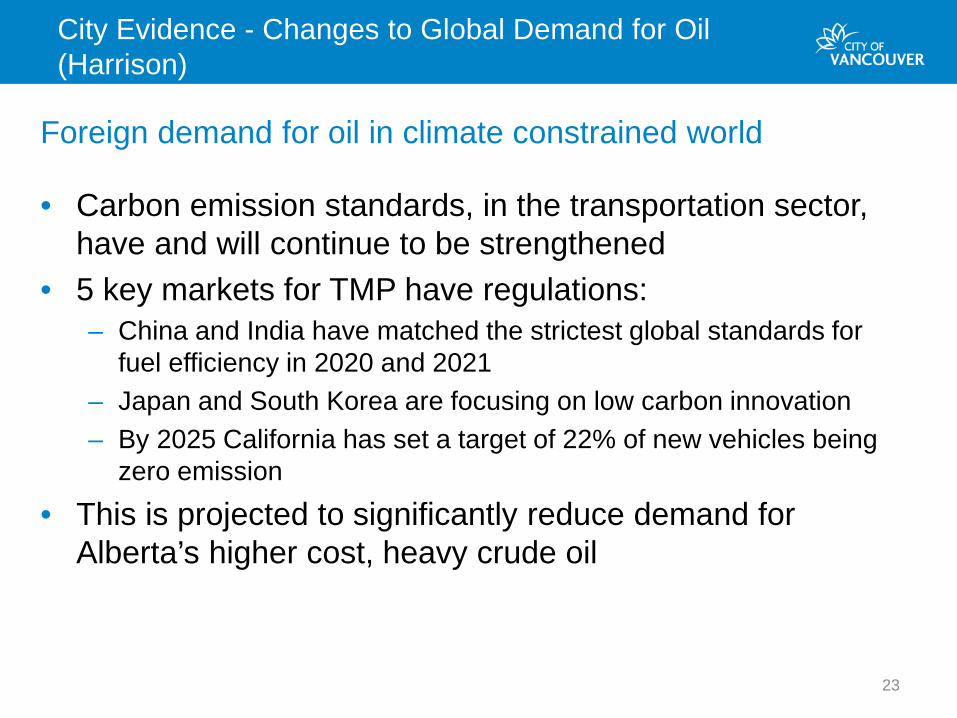
Foreign demand for oil in climate constrained world
• Carbon emission standards, in the transportation sector, have and will continue to be strengthened
• 5 key markets for TMP have regulations: – China and India have matched the strictest global standards for
fuel efficiency in 2020 and 2021 – Japan and South Korea are focusing on low carbon innovation – By 2025 California has set a target of 22% of new vehicles being
zero emission
• This is projected to significantly reduce demand for Alberta’s higher cost, heavy crude oil
23
City Evidence - Changes to Global Demand for Oil (Harrison)

NEB will not approve a pipeline if it is not going to be used and useful Kinder Morgan assumes a high price of oil • Kinder Morgan’s business case assumes long term average price of oil at $94
per barrel (current price: $59) • Countries are taking action to reduce the GHG emissions to limit climate change
to 2C • This will lead to a decrease in demand for oil • This declining demand creates a “buyers’ market” of downward price pressure
and zero profits for high cost producers • Projections through modelling: by 2020 the long term average will be $76 per
barrel; by 2050 it will be $39 per barrel • Soon after 2030, the falling price of oil will render uneconomic all oil sands
investments The price of oil will be far below the level necessary to expand the oil sands, and the
TMP expansion will not be “used and useful.” Expanded pipeline likely to be a “stranded asset”
24
City Evidence – Oil Price Assumption (Jaccard)
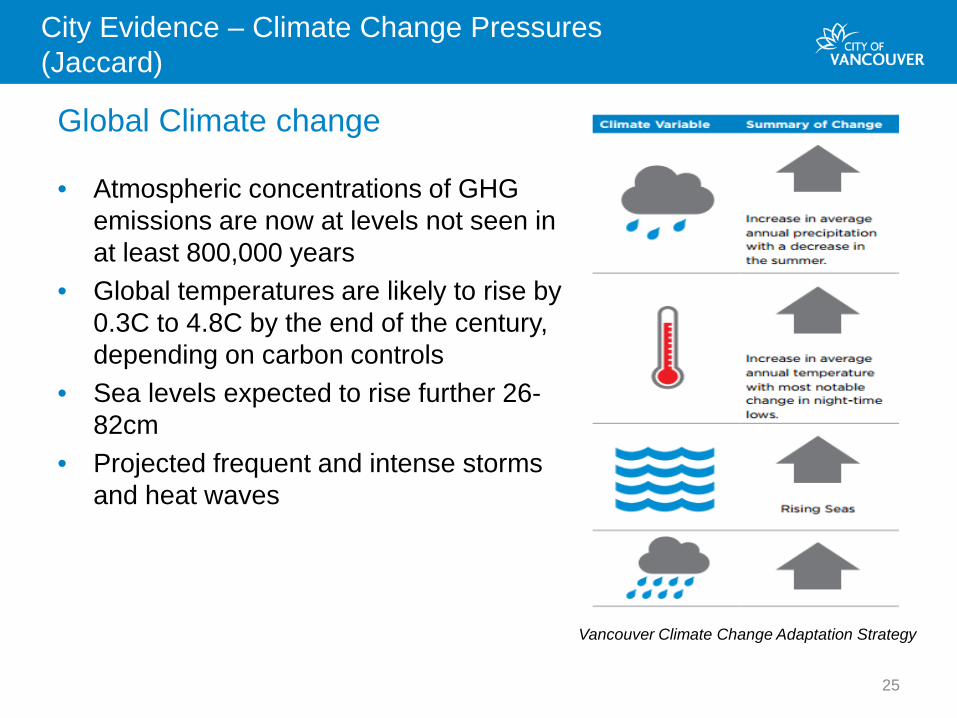
Global Climate change
• Atmospheric concentrations of GHG emissions are now at levels not seen in at least 800,000 years
• Global temperatures are likely to rise by 0.3C to 4.8C by the end of the century, depending on carbon controls
• Sea levels expected to rise further 26-82cm
• Projected frequent and intense storms and heat waves
25
City Evidence – Climate Change Pressures (Jaccard)
Vancouver Climate Change Adaptation Strategy

Risk Assessment
26
NEB required Kinder Morgan to assess the risk of a spill. Kinder Morgan created their own assessment methodology. Their reported findings: • There is very low risk of a pipeline or a tanker spill • There is a good history of pipeline safety and the existing
pipeline provides the justification for the location of the expansion
Expert findings (Assoc. Profs Etkin, Kheraj & Dr Short) • Kinder Morgan’s assessment has fundamental methodologic
flaws that systematically underestimate the risks to Vancouver • The existing pipeline has a history of spills not included in the
application and was approved in 1951 with no environmental assessment
27
Risk Assessment – Summary
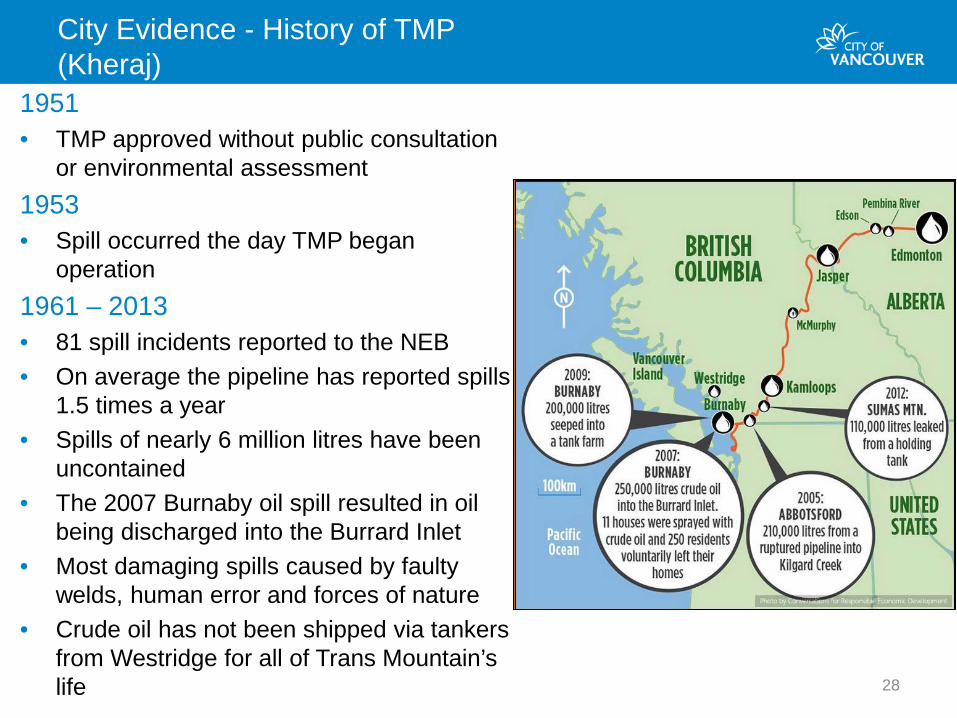
1951 • TMP approved without public consultation
or environmental assessment 1953 • Spill occurred the day TMP began
operation 1961 – 2013 • 81 spill incidents reported to the NEB • On average the pipeline has reported spills
1.5 times a year • Spills of nearly 6 million litres have been
uncontained • The 2007 Burnaby oil spill resulted in oil
being discharged into the Burrard Inlet • Most damaging spills caused by faulty
welds, human error and forces of nature • Crude oil has not been shipped via tankers
from Westridge for all of Trans Mountain’s life
28
City Evidence - History of TMP (Kheraj)

• International standards for risk assessment: – Assessment of both likelihood and consequence – For their analysis of risk in Burrard Inlet, Kinder Morgan did not
meet this standard for assessing risk • Kinder Morgan risk assessment methodology is flawed and
underestimates risk of oil spills by excluding high consequence events (such as a tanker spill in Burrard Inlet)
• A spill at the terminal or in the Inlet over any 50-year period has a 79 to 87 per cent likelihood
• Major gaps also identified in environmental risk assessment (ERA): – ERA considers environmental risk and consequences – Failed to adequately value the importance of the Fraser River
ecosystem – Failed to consider all the ways that organisms could be exposed
to oil
29
City Evidence - Risk Assessment (Etkin, Gunton, Broadbent and Short)

Spill Impact Assessment
30

Kinder Morgan’s impact assessment • “Spills represent low-probability events; the location and specifics of
these events cannot be predicted.” – Did not analyze or model the impacts of a tanker spill in Burrard Inlet
City’s experts addressed the following: • Where the oil would go in a Burrard Inlet spill (Genwest Systems) • What happens when diluted bitumen spills (Dr Short) • Assessment of the capacity to respond (Nuka research) • Air quality impacts (Metro Vancouver led) • Ecological impacts of a spill (Dr Short) • Municipal costs (Recovery and Relief Services) • Impact on marine industries (UBC Fisheries Economic Unit) • Impact on Vancouver’s brand (Brand Finance) • Alternative risk transfer mechanisms (Karen MacWilliams) • Lessons from Marathassa fuel spill (Nuka and City Staff)
31
Impact Assessment - Summary
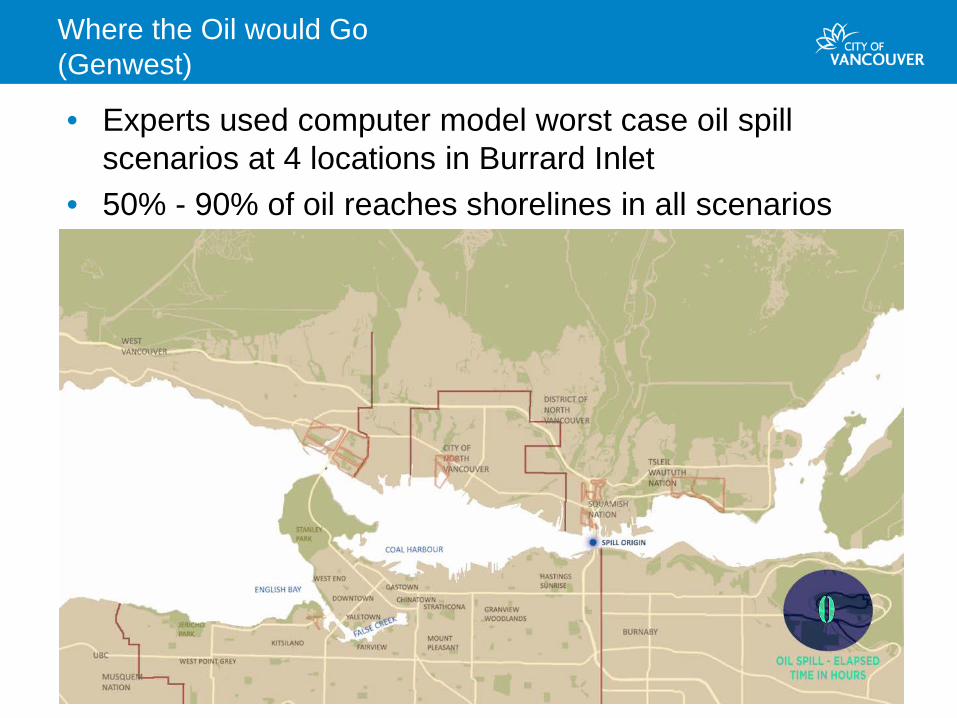
• Experts used computer model worst case oil spill scenarios at 4 locations in Burrard Inlet
• 50% - 90% of oil reaches shorelines in all scenarios
32
Where the Oil would Go (Genwest)
• Diluted bitumen, once spilled rapidly looses the high‐volatility components (benzene and others) which creates toxic vapour
• The bitumen component of diluted bitumen is naturally prone to submerging in fresh and brackish water – Burrard Inlet and Fraser River estuary surface water
often brackish • In warm summer temperatures and moderate winds,
when there is more likely to be brackish water and wave action, spilled diluted bitumen may begin to submerge after about 24 hours
33
The Results of a Diluted Bitumen Spill (Short)
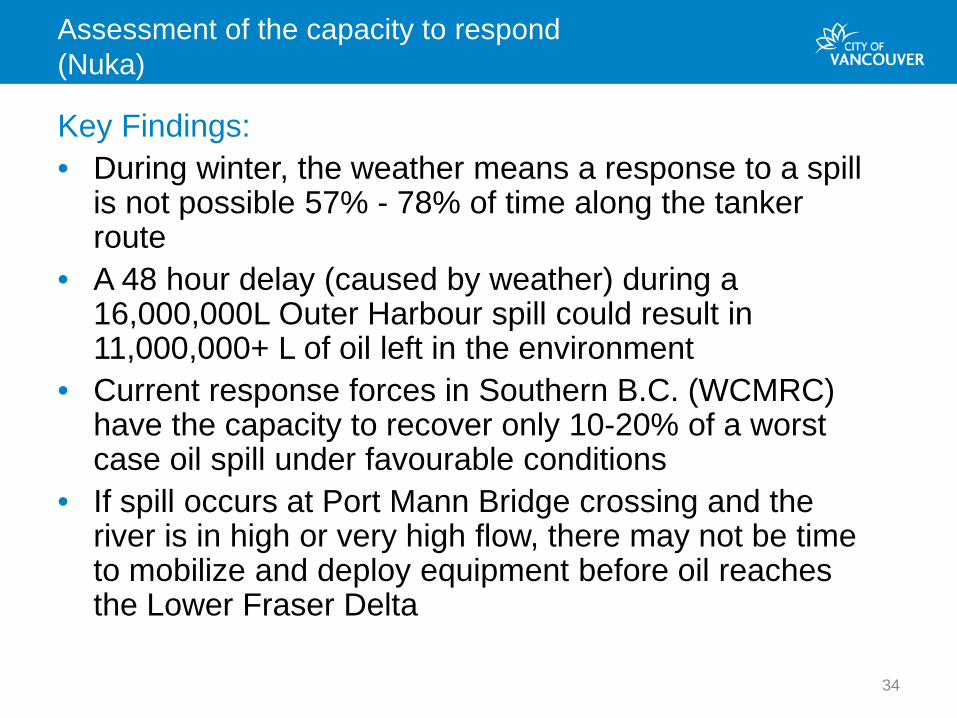
Key Findings: • During winter, the weather means a response to a spill
is not possible 57% - 78% of time along the tanker route
• A 48 hour delay (caused by weather) during a 16,000,000L Outer Harbour spill could result in 11,000,000+ L of oil left in the environment
• Current response forces in Southern B.C. (WCMRC) have the capacity to recover only 10-20% of a worst case oil spill under favourable conditions
• If spill occurs at Port Mann Bridge crossing and the river is in high or very high flow, there may not be time to mobilize and deploy equipment before oil reaches the Lower Fraser Delta 34
Assessment of the capacity to respond (Nuka)
35
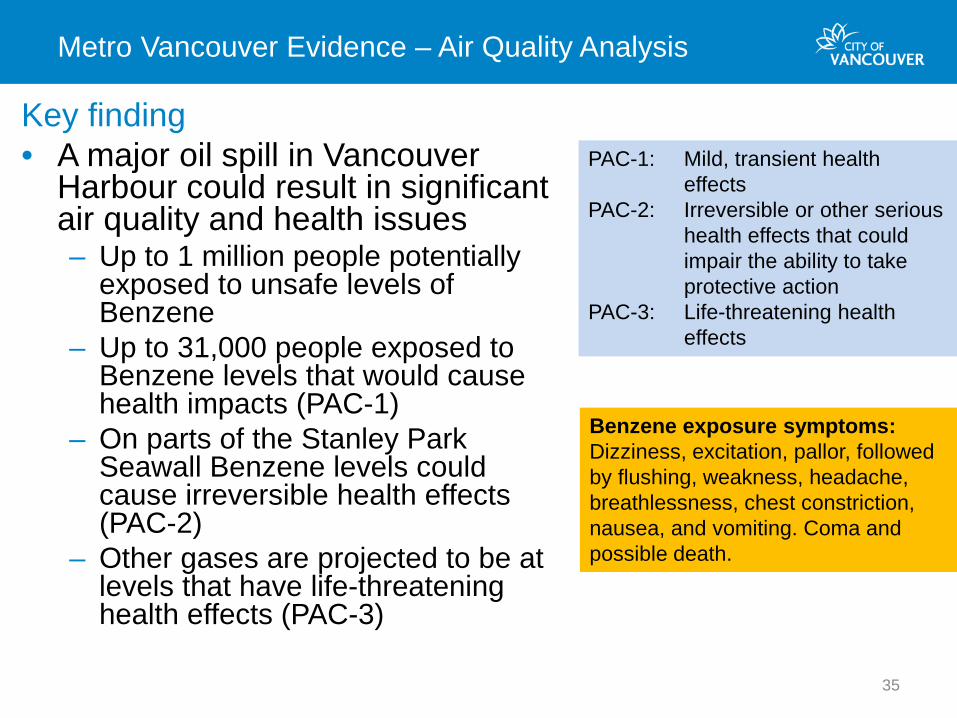
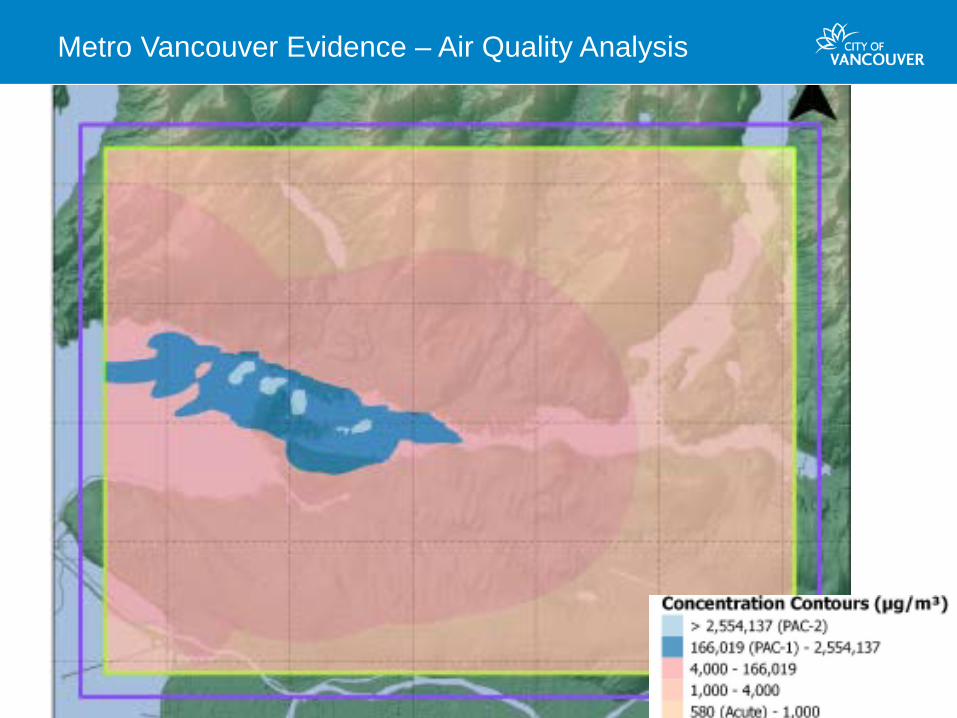
Metro Vancouver Evidence – Air Quality Analysis
Key finding • A major oil spill in Vancouver
Harbour could result in significant air quality and health issues – Up to 1 million people potentially
exposed to unsafe levels of Benzene
– Up to 31,000 people exposed to Benzene levels that would cause health impacts (PAC-1)
– On parts of the Stanley Park Seawall Benzene levels could cause irreversible health effects (PAC-2)
– Other gases are projected to be at levels that have life-threatening health effects (PAC-3)
PAC-1: Mild, transient health effects PAC-2: Irreversible or other serious health effects that could impair the ability to take protective action PAC-3: Life-threatening health effects
Benzene exposure symptoms: Dizziness, excitation, pallor, followed by flushing, weakness, headache, breathlessness, chest constriction, nausea, and vomiting. Coma and possible death.
36
Metro Vancouver Evidence – Air Quality Analysis

Potentially more than 100,000 birds dead
Marine mammals, especially Harbour seals and Harbour porpoises would perish
37
City Evidence: Ecological Impact (Short) Key findings: Salish Sea is one of the most ecologically important coastal marine habitats along the Pacific coast of North America Impacts of a large diluted bitumen spill near the Fraser River Estuary:
The already endangered southern resident killer whale population would be jeopardized
Adult sockeye salmon would ingest small droplets of diluted bitumen

Key Findings • “All spills are local” • In past spills municipalities have faced a range of costs
and losses – Costs are estimated to be higher than actually formally
documented to date by municipalities • Significant solid waste can be generated needing safe
disposal – Kalamazoo spill – 3,500 t of oil → 100,000t of waste
(major diluted bitument spill) • A catastrophic spill could present significant costs for the
City
38
City Evidence: Municipal Costs of a Spill (Recovery and Relief Services)

Key Findings • In 2013, Vancouver’s ocean-dependent events attracted
417,000 tourists • Local use of the beaches, seawall and waterfront
contributes $144-$170 million in total output value • Marine based industries employ 4% of Vancouverites • A spill in May could create losses of:
– $380-1,230 million in output value – $201-687 million in GDP – 3238-12881 PY of employment
39
City Evidence: Spill Impacts on Ocean-Based Activities (UBC, Fisheries Economics Unit)

40
City Evidence: Brand valuation and impact from a spill (Brand Finance)
Key findings: • Vancouver’s Brand is worth: $31bn • Vancouver has a strong reputation, a diverse and
growing economy – global brand is key to attracting business and investment in our city
• Our key differentiator to other cities is being seen as “green, clean and sustainable” – Vancouver’s brand is more susceptible to an oil spill
than comparator cities • Expert analysis: An oil spill could impair the brand value
by up to $3bn • Significant investment would be needed to rebuild the
brand

• The total funds available for a tanker spill are capped at ~$1.6B – spill impacts could be in tens of billions – The cap is the result of multiple components and accessing the $1.6B cap is
complex and not guaranteed
• The risk of a spill will be transferred to citizens and businesses – Risk expert commissioned to look at options to transfer some of Vancouver’s
financial risk to a third party
Key findings: • Financial instrument “catastrophe bond” (CatBond) is possible but
limited – CatBonds are issued to investors who receive an annual return if the
“triggering event” does not occur but may lose their investment if it does – For a CatBond of $1 B, the likelihood of placement success is estimated
at less than 20%. – The cost range will be 3.5% - 14% of the limit of coverage
• For a $1B bond: $35 - 140m per year
41
City Evidence: Risk Transfer Mechanisms (Karen MacWilliams)
42
Conclusion
• Need – The pipeline is not needed in a carbon constrained world
• Risk – The risks are very real and Kinder Morgan’s assessment has
fundamental flaws that systematically underestimate the risks to Vancouver
• Impact – A major oil spill would be a disaster for Vancouver’s
environment, economy, health and reputation • Even a less than “worse case” spill would be disastrous
– There are significant gaps in preparedness for a major spill. City staff are working to improve systems but many of the issues are outside of our jurisdiction
The risks and costs outweigh the benefits