tri - state region profile report - meric home
TRANSCRIPT
Missouri Department of Economic Development
Missouri Economic Research and Information Center
Illinois Department of Employment Security
Economic Information & Analysis Division
Iowa Department of Workforce Development
Labor Market and Workforce Information Division
Tri-State Region
Profile Report
Labor Market Information for the
Tri-State Development Summit Area

1
OVERVIEW The Tri-State Development Summit region consists of 8 counties in Iowa (Davis,
Des Moines, Henry, Jefferson, Lee, Louisa, Van Buren, Wapello), 14 counties in
Illinois (Adams, Brown, Cass, Fulton, Hancock, Henderson, Knox, McDonough,
Mercer, Morgan, Pike, Scott, Schuyler, Warren), and 13 counties in Missouri (Adair,
Clark, Knox, Lewis, Macon, Marion, Monroe, Pike, Ralls, Randolph, Schuyler,
Scotland, Shelby).
Within the Tri-State Region are the following Micropolitan Statistical Areas: Kirksville
MO, Moberly MO, Hannibal MO, Quincy IL-MO, Ottumwa IA, Muscatine IA,
Galesburg IL, Canton IL, Jacksonville IL, and Keokuk-Ft. Madison IA-MO. In
addition, the region shares one county with the Davenport-Moline-Rock Island IA-IL
Metropolitan Statistical Area.

2
0 50,000 100,000 150,000 200,000
No High School Diploma
High School Graduate
Associate Degree
Bachelors Degree
Graduate Degree
2000
2008
Educational Attainment
Between 2000 and 2008, the Tri-State Region’s population aged 25 and older
remained relatively steady at around 459,000.
The educational
attainment of the region’s
population in 2008
indicates that the region
has a higher percentage of
individuals with a less than
a high school diploma than
the national average and a
lower percentage of those
that have completed a
bachelor’s degree.
Per Capita Income
Other statistics from the U.S.
Bureau of Economic Analysis
show that the per capita
income for the region was
significantly lower in 2006
($26,602) than the US
($36,714) and each state in
the region (Missouri -
$32,789, Iowa - $33,038,
Illinois - $38,409).
Tri-State Region County Per Capita Income 2006

3
0.0 5.0 10.0 15.0 20.0
Tri-State Region
United States
Missouri
Ilinois
Iowa
2000
2007
Poverty Rate
U.S. Census Bureau
poverty figures
indicate that the
percentage of youth
(under age 18) in
poverty the region was
higher than the
national rate in 2007.
Tri-State Region County Poverty Rate 2007
Counties in the region
with the highest poverty
rates in 2007 include:
Adair (MO)
McDonough (IL)
Schuyler (MO)
Tri-State Region County Poverty Rate (Under Age 18) 2007
Overall, the poverty
rate for the region
exceeds that of each
state in the region
and that of the nation
in 2007.

4
Source: US Bureau of Labor Statistics, LAUS
0.00%
1.00%
2.00%
3.00%
4.00%
5.00%
6.00%
7.00%
Tri-State Unemployment Rate
Tri-State Region
US
Source: US Bureau of
Labor Statistics, LAUS
Unemployment
Rate
Statistics from the Local
Area Unemployment
Statistics (LAUS) program
indicate that the available
labor force in the Tri-State
Region in the third quarter
of 2008 was 359,235 with a
total number of employed
individuals at 337,596 and
the total number of
unemployed at 21,639.
Tri-State Region County Unemployment 3rd Quarter 2008
Unemployment rates for the area have either been in-line with or higher than the
national rate since the first quarter of 2007.

5
Source: US Bureau of Labor Statistics, QCEW
Industry Firms Employment Total Wages
Average
Annual Wage
11 - Agriculture 319 2,584 $67,619,881 $26,170
21 - Mining 52 1,087 $60,434,819 $55,598
22 - Utilities 141 2,148 $131,885,375 $61,392
23 - Construction 1,867 10,401 $391,316,112 $37,622
31-33 - Manufacturing 840 43,576 $1,793,579,789 $41,160
42 - Wholesale Trade 993 10,796 $388,482,227 $35,986
44-45 - Retail Trade 2,616 34,270 $676,889,035 $19,752
48-49 - Transportation and Warehousing 1,073 10,957 $399,797,534 $36,489
51 - Information 375 4,234 $118,393,909 $27,966
52 - Finance and Insurance 1,106 8,774 $322,851,651 $36,796
53 - Real Estate and Rental 464 1,997 $51,117,969 $25,592
54 - Professional, Scientific and Technical Services 1,090 6,078 $214,521,937 $35,295
55 - Management of Companies 68 1,224 $65,985,460 $53,910
56 - Administrative and Waste Mgmt Services 655 6,969 $157,249,113 $22,564
61 - Educational Services* 398 29,201 $891,197,581 $30,519
62 - Health Care and Social Assistance 1,546 40,985 $1,289,424,378 $31,461
71 - Arts, Entertainment and Recreation 304 3,437 $48,609,845 $14,141
72 - Accommodations and Food Services 1,433 19,865 $207,340,979 $10,437
81 - Other Services 1,955 8,364 $159,314,689 $19,048
92 - Public Administration 892 15,860 $525,929,561 $33,161
99 - Unclassified 38 30 $684,943 $23,023
TOTAL 18,223 262,836 $7,962,626,787 $30,295
Tri-State Region Industry Employment (2007Q3-2008Q2)
* Includes Public Education
Industry Employment
Employment figures from the Quarterly Census of Employment and Wages (QCEW) program
indicate that a little more than half (53.32%) of the employment in the Tri-State region is in the
following sectors:
Manufacturing
Health Care/Social Assistance
Retail Trade
Educational Services
Top paying industries in the region include Utilities, Mining, Management of Companies and
Manufacturing.

6
Commute Shed
The regional commute shed (where residents in the region go to work) indicates
that about 28% (77,329) of residents in the Tri-State region work in Adams-IL, Des
Moines-IA, Knox-IL, or Lee-IA County.
The commute shed map also indicates a significant population (12,344 or 5%) of
residents commuting to either Sangamon-IL or Peoria-IL counties for employment.
Commute shed patterns for residents in a community are important in terms of
focusing attention on specific locations where it is most likely for residents to find
future employment. Such patterns not only show where residents currently go to
work, but most importantly, the distance they are willing to commute for other
employment opportunities.
Source: Local Employment Dynamics, 2006, 2nd Quarter

7
Labor Shed
The regional labor shed (where workers in the region live) indicates that about 14%
(34,726) of the total workforce in the region work in Knox-IL, Marion-MO, or
Wapello-IA County.
The labor shed map also indicates a significant population of workers (9,947 or 4%)
commuting from Sangamon-IL, Rock Island-IL, Henry-IL, Muscatine-IA, Peoria-IL,
Boone-MO, Scott-IA, or Greene-IL County for employment in the Tri-State region.
Source: Local Employment Dynamics, 2006, 2nd Quarter
8
SOC Title 2006 2016
Numeric
Change % Change
Growth
Openings
Replacement
Openings
21-1011 Substnce Abuse/Bhvrl Dsrdr Counslrs 119 168 49 41.18 5 2
21-1023 Mental Hlth/Substnce Abuse Soc Wkrs 101 136 33 32.67 2 2
31-9011 Massage Therapists 121 159 38 31.40 2 0
31-1011 Home Health Aides 802 1,052 250 31.17 25 7
21-1093 Social & Human Service Assistants 308 396 90 29.22 7 3
31-9092 Medical Assistants 270 347 78 28.89 8 2
29-2052 Pharmacy Technicians 330 420 89 26.97 7 9
25-2041 Special Ed Teachers, Presch/Elmntry 291 360 70 24.05 5 5
11-9021 Construction Managers 265 329 63 23.77 4 2
19-3031 Clin./Counselng/Sch. Psychologists 251 309 59 23.51 5 2
Illinois - Tri-State Region Counties
SOC Title 2006 2016
Numeric
Change % Change
Growth
Openings
Replacement
Openings
29-2052 Pharmacy Technicians 202 255 53 26.24% 5 6
25-1199 Postsecondary Teachers, All Other 165 201 36 21.82% 4 3
15-1031 Computer Software Engineers, Apps 150 182 32 21.33% 3 2
31-9092 Medical Assistants 159 189 30 18.87% 3 2
31-1011 Home Health Aides 403 469 66 16.38% 7 4
41-3099 Sales Reps, Services, All Other 214 249 35 16.36% 4 5
43-4051 Customer Service Reps 902 1,040 138 15.30% 14 25
15-1051 Computer Systems Analysts 175 200 25 14.29% 3 5
25-3021 Self-Enrichment Education Teachers 120 135 15 12.50% 2 1
29-1051 Pharmacists 120 135 15 12.50% 2 2
Missouri - Northeast Workforce Investment Area
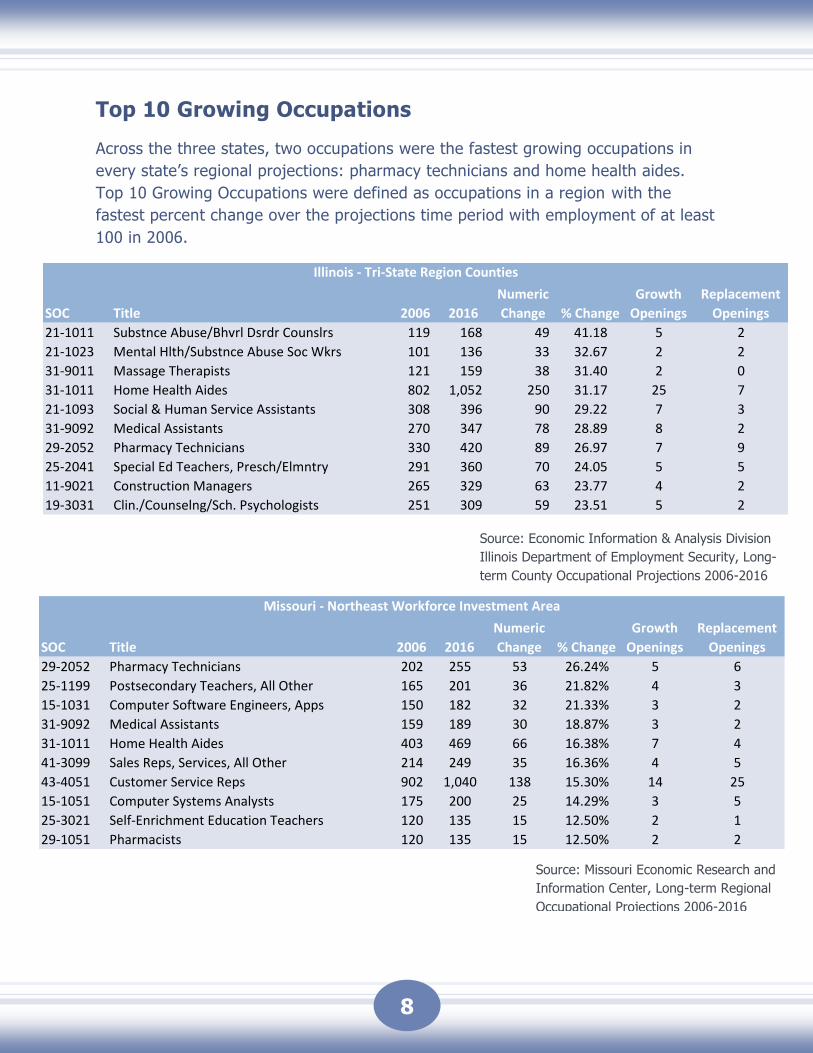
Top 10 Growing Occupations
Across the three states, two occupations were the fastest growing occupations in
every state’s regional projections: pharmacy technicians and home health aides.
Top 10 Growing Occupations were defined as occupations in a region with the
fastest percent change over the projections time period with employment of at least
100 in 2006.
Source: Missouri Economic Research and
Information Center, Long-term Regional
Occupational Projections 2006-2016
Source: Economic Information & Analysis Division
Illinois Department of Employment Security, Long-
term County Occupational Projections 2006-2016

9
SOC Title 2006 2016
Numeric
Change % Change
Growth
Openings
Replacement
Openings
21-1093 Social & Human Service Assistants 275 430 155 56.4 15 5
29-2052 Pharmacy Technicians 145 195 55 37.9 5 5
29-1111 Registered Nurses 1,280 1,565 280 21.9 30 20
43-4051 Customer Service Reps 500 595 100 20.0 10 15
13-1199 Business Operations Specialists, All Other 365 430 65 17.8 5 5
53-3032 Truck Drivers, Heavy & Tractor-Trailer 1,345 1,570 225 16.7 25 25
35-3021 Combined Food Prep & Serving Workers 865 1,000 135 15.6 15 15
41-3021 Insurance Sales Agents 470 540 70 14.9 5 10
31-1012 Nursing Aides, Orderlies, & Attendants 1,080 1,240 160 14.8 15 10
41-2031 Retail Salespersons 1,730 1,965 235 13.6 25 55
Iowa - Region 15
SOC Title 2006 2016
Numeric
Change % Change
Growth
Openings
Replacement
Openings
31-1011 Home Health Aides 390 555 160 41.0 15 5
53-6031 Service Station Attendants 110 155 40 36.4 5 5
29-1111 Registered Nurses 1,195 1,465 275 23.0 25 20
33-9032 Security Guards 435 535 100 23.0 10 10
43-4051 Customer Service Reps 350 430 80 22.9 10 10
35-3021 Combined Food Prep & Serving Workers 665 795 130 19.5 15 15
13-1199 Business Operations Specialists, All Other 440 525 85 19.3 10 5
53-3032 Truck Drivers, Heavy & Tractor-Trailer 1,695 2,015 320 18.9 30 30
39-3091 Amusement & Recreation Attendants 140 170 25 17.9 5 5
35-3011 Bartenders 185 220 30 16.2 5 5
Iowa - Region 16
Top 10 Growing Occupations (cont.)
Some of the fastest growing occupations across the region include those tied to the
Healthcare and Social Services industry as well as Retail Trade and Accommodation and
Food Services.
Source: Labor Force and Occupational Analysis
Bureau, Iowa Workforce Development, Long-term
Regional Occupational Projections 2006-2016
Source: Labor Force and Occupational Analysis
Bureau, Iowa Workforce Development, Long-term
Regional Occupational Projections 2006-2016
*Region 16 includes the following counties in
Iowa: Des Moines, Henry, Lee and Louisa County
*Region 15 includes the following counties in Iowa:
Appanoose, Davis, Jefferson, Keokuk, Lucas, Mahaska,
Monroe, Van Buren, Wapello and Wayne County

10
Name State County City WebsiteSoutheastern Community College Iowa Des Moines West Burlington www.scciowa.edu
Iowa Wesleyan College Iowa Henry Mount Pleasant www.iwc.edu
Maharishi University Of Management Iowa Jefferson Fairfield www.mum.edu
Indian Hills Community College Iowa Wapello Ottumwa www.ihcc.cc.ia.us
Vatterott College Illinois Adams Quincy www.vatterott-college.edu
John Wood Community College Illinois Adams Quincy www.jwcc.edu
Quincy University Illinois Adams Quincy www.quincy.edu
Blessing Hospital School Of Medical Lab Tech Illinois Adams Quincy NA
Blessing Hospital School Of Radiologic Technology Illinois Adams Quincy www.blessinghospital.org
Blessing Rieman College Of Nursing Illinois Adams Quincy www.brcn.edu
Graham Hospital School Of Nursing Illinois Fulton Canton grahamschoolofnursing.org
Spoon River College Illinois Fulton Canton spoonrivercollege.edu
Knox College Illinois Knox Galesburg www.knox.edu
Carl Sandburg College Illinois Knox Galesburg www.sandburg.edu
Western Illinois University Illinois McDonough Macomb www.wiu.edu
Macmurray College Illinois Morgan Jacksonville www.mac.edu
Illinois College Illinois Morgan Jacksonville www.ic.edu
Monmouth College Illinois Warren Monmouth www.monm.edu
Truman State University Missouri Adair Kirksville www.truman.edu
Kirksville Area Vocational Technical School Missouri Adair Kirksville NA
A T Still University Of Health Sciences Missouri Adair Kirksville www.atsu.edu
Culver-Stockton College Missouri Lewis Canton www.culver.edu
Hannibal Career And Technical Center Missouri Marion Hannibal www.hannibal.tec.mo.us
Hannibal-Lagrange College Missouri Marion Hannibal www.hlg.edu
Pike-Lincoln Technical Center Missouri Pike Eolia pltc.k12.mo.us
Moberly Area Community College Missouri Randolph Moberly www.macc.edu
Moberly Area Technical Center Missouri Randolph Moberly www.moberly.k12.mo.us
*NA: Information not available
Tri-State Region Post-Secondary Education/Training Providers
Regional Assets for Education Training
Education and training providers are critical for a region in terms of providing
employers with opportunities for training low-skilled workers for high-skill, in
demand occupations. In the same respect, business incubators and technology
centers are crucial for the development and growth of small businesses at a local
level.
The regional focus on training is due to the fact that impacted workers might need
to commute throughout the region in order to access training programs for a variety
of career paths. The Tri-State Region has 27 different regional providers of post-
secondary education and training within its borders.
Source: National Center for Education Statistics, Integrated
Postsecondary Education Data System, 2006
11
Contacts
Missouri Department of Economic Development
Missouri Economic Research and Information Center
www.missourieconomy.org
TEL: 1-866-225-8113
E-MAIL: [email protected]
Illinois Department of Employment Security
Economic Information & Analysis Division
www.ILWorkInfo.com
TEL: 1-866-663-7723
E-MAIL: [email protected]
Iowa Department of Workforce Development
Labor Market and Workforce Information Division