turkey water along the food chain - food and agriculture ... · turkey’s water resources 2...
TRANSCRIPT

Please address comments and inquiries to:Investment Centre DivisionFood and Agriculture Organization of the United Nations (FAO)Viale delle Terme di Caracalla – 00153 Rome, Italy [email protected]/investment/en
Report No. 27 – August 2016
Turkey – W
ater alon
g th
e foo
d ch
ainR
epo
rt No. 2
7
Turkey
Water along the food chain
I43
18
/1/0
1.1
5


Food and agriculture organization oF the united nationsrome, 2016
turkey
Water along the food chainTowards water-smart agrifood policies: the case of red meat processing
Nuno Santos economist, investment centre division, Fao
Prof. Dr. Sebastian Hessagricultural economist, christian-albrechts university Kiel
Dr. Tinoush Jamali JaghdaniWater Policy specialist, georg-august university göttingen, germany
with contributions from:
Prof. Dr. Harun Uçakeconomist, alaaddin Keykubat university, turkey
Arianna Caritaeconomist, investment centre division, Fao
Genevieve Theodorakiseconomist, investment centre division, Fao
Maria RicciProject Officer, Investment Centre Division, FAO
country highlightsprepared under the Fao/eBrd cooperation

The designations employed and the presentation of material in this information product do not imply the expression of any opinion whatsoever on the part of the Food and Agriculture Organization of the United Nations (FAO) or the European Bank for Reconstruction and Development (EBRD) concerning the legal or development status of any country, territory, city or area or of its authorities, or concerning the delimitation of its frontiers or boundaries. The mention of specific companies or products of manufacturers, whether or not these have been patented, does not imply that these have been endorsed or recommended by FAO or EBRD in preference to others of a similar nature that are not mentioned.
The views expressed in this information product are those of the author(s) and do not necessarily reflect the views or policies of FAO or EBRD.
ISBN 978-92-5-109360-3 (FAO)
© FAO 2016
FAO encourages the use, reproduction and dissemination of material in this information product. Except where otherwise indicated, material may be copied, downloaded and printed for private study, research and teaching purposes, or for use in non-commercial products or services, provided that appropriate acknowledgement of FAO as the source and copyright holder is given and that FAO’s endorsement of users’ views, products or services is not implied in any way.
All requests for translation and adaptation rights, and for resale and other commercial use rights should be made via www.fao.org/contact-us/licencerequest or addressed to [email protected].
FAO information products are available on the FAO website (www.fao.org/ publications) and can be purchased through [email protected].
Cover photo: © Photomyeye | Dreamstime.com

TABLE OF CONTENTS
Foreword v
acknowledgements vii
acronyms and abbreviations ix
executive summary xi
1 introduction 1Turkey’s water resources 2Structure of water use and water demand in Turkey 9The issue of groundwater depletion 13The predicted effect of climate change on water resources in Turkey 17
2 turkey’s agriculture sector and water use 21Turkey’s agriculture sector: the recent past and current trends 21Water use in agriculture in Turkey: Past evolution and trends 46Water saving technologies in Turkey’s food chains 60
3 Policy environment for food sector water use efficiency 75Turkish institutions for the management of water resources 75Water resource management policies 97A comparison of government support measures for Turkish agriculture 109
4 red meat case study 121Dynamics and efficiency of the red meat processing value chain 121Water use in the red meat processing value chain 143Policies and development of the red meat processing value chain in Turkey 150
5 Conclusions 157Main findings 157Key policy options and potential priorities for public-private policy dialogue 160
Annex 1 – The trade intensity index 165
References 167


v
Foreword
In 2013, the EBRD and FAO launched a multi-country project to improve water efficiency in selected agricultural value chains. The project aimed at providing analytical support to improve the environmental impact of EBRD agribusiness investments and inform policy-makers on sustainable paths for specific value chains in Turkey, Jordan, Ukraine and the Kyrgyz Republic.
Although Turkey has more water resources than many of its neighbors in the Middle East and North Africa, it is expected to face shortages in the near future. Climate change, rapidly rising demand and inefficient practices are contributing to the overexploitation of groundwater resources. This is particularly problematic for agriculture, an important sector in the Turkish economy that is also a major water consumer and highly sensitive to water shortages. By 2023, the agricultural use of water – especially for irrigation – is expected to be the single most important source of domestic water use, accounting for 64 percent of total national water consumption.
This study elaborates on current and projected trends – as well as institutional and policy issues – related to water use in Turkey’s agriculture sector. It builds on quantitative and qualitative evidence gathered through literature review, data analysis as well as substantial field work carried out during the course of 2014 and 2015. The objective of the latter was to gain a better understanding of water-related issues in the country and identify the most important food value chains in terms of water use and potential for improvement. The red meat value chain was selected for more in-depth analysis given its economic importance and also because it constituted an interesting example of the impact of policies on water use efficiency in the agrifood sector. The report provides a value chain and water-use efficiency analysis for the red meat sector, building on available research and secondary statistics. It also includes information on key market players as well as sector dynamics and structural characteristics. Finally, this review identifies key constraints and opportunities for a “water-smart” development of the red meat sector and suggestions in terms of policy.
As a result of heavy subsidization and growing purchasing power, domestic red meat demand and production in Turkey have grown steadily in the past decade. This trend is expected to continue, with an estimated 34 percent growth in total beef consumption between 2014 and 2024. Water consumption in the Turkish red meat production chain is significant, especially for irrigation purposes at the primary production level. Partly due to the provision of specific input subsidies for the production of forage crops, a significant share of irrigated land in the

vi
country - c. 24 percent - is dedicated to the production of maize silage used as fodder. With high production costs, red meat in Turkey ends up being a major water consumer while not being very competitive. Developing “water-smart” policies would therefore require Turkey to pay close attention to the appropriate design of incentives around water use, especially in primary agriculture.

vii
Acknowledgements
This review was conducted in the context of the cooperation between FAO and the EBRD. It was financed by FAO and EBRD’s Southern and Eastern Mediterranean Multi-Donor Account, supported by Australia, Finland, France, Germany, Italy, the Netherlands, Norway, Sweden, Taipei China and the United Kingdom.
The analysis was carried out by FAO’s Investment Centre, under the supervision of Nuno Santos, Economist, Europe, Central Asia, Near East, North Africa, Latin America and the Caribbean Service (TCIC), FAO. The main authors of the study are Sebastian Hess, Agricultural Economist, Christian Albrechts, University of Kiel, Tinoush Jamali Jaghdani, Water Policy Specialist, Georg-August, University of Göttingen, and Nuno Santos. Genevieve Theodorakis, Economist, Arianna Carita, Economist, and Maria Ricci, Project Officer, all from TCIC, also contributed to the report. Harun Uçak, Economist, carried out background research, data gathering and analysis and contributed to drafting sections of the report. Cuneyt and Nedret Okan, Water Sector Specialists, helped draft the scoping report through data gathering, research and analysis. Giovanni Muñoz, Land and Water Officer, TCIC, provided useful insights on water availability indicators.
Nadia Petkova, Regional Head of Agribusiness at EBRD’s Resident Office in Istanbul, and Iride Ceccacci, Principal Economist, EBRD, provided leadership and coordination on behalf of the Bank as well as comments on the draft version of the study.
The authors would like to thank Aysegul Akin, Assistant FAO Representative in Turkey, for the numerous interactions on the study and kind implementation support. The authors would finally like to thank Mohamed Manssouri, Chief, TCIC, and Emmanuel Hidier, Senior Economist, TCIC, for their overall support and guidance. The authors are also grateful to Claire Tarrin, Genevieve Joy and Adriana Brunetti for editing and formatting the report. They also wish to thank Sarah Mercadante, Project and Communications Officer, TCIC, for coordinating the publication process. Thanks are also extended to the entire TCIC General Service team for their assistance during the implementation of the study.


ix
ACrONymS ANd ABBrEviATiONS
BOD biochemical oxygen demand BOT Built Operate TransferBPAP basin protection action planCGE computable general equilibriumDSİ General Directorate of State Hydraulic Works EAC Environmental Acquis Communautaire (of the EU)EC electrical conductivityEU European UnionFAO Food and Agriculture Organization of the United NationsGIC groundwater irrigation cooperativeGDAR General Directorate of Agrarian Reform GDP gross domestic productGDRS General Directorate of Rural ServicesGDWM General Directorate of Water ManagementGSSE general services support estimateha hectares IC irrigation cooperativeIMT irrigation management transferIPCC Intergovernmental Panel on Climate ChangeMENA Middle East and North AfricaMFAL Ministry of Food, Agriculture and Livestock MFWA Ministry of Forestry and Water AffairsMOEF Ministry of Environment and ForestryMSIT Ministry of Science, Industry and TechnologyNRCA normalised revealed comparative advantageNRW nonrevenue waterOECD Organisation for Economic Co-operation and DevelopmentOSB organized industrial zonePPI public-private investmentPPP public-private partnership PSE producer support estimatePVA participatory vulnerability studiesR&D research and developmentRBPAP river basin protection action planSKI Suve Kanalizasyon Idaresi (water and sanitation company)SME small and medium-sized enterpriseSPA special provincial administrationSPO State Planning OrganisationSWAT soil and water assessment toolTIGEM State agricultural enterpriseTII trade intensity index

x
TL Turkish liraTOPRAKSU General Directorate for Soil and WaterTSE total support estimateTUIK Turkish statistical officeUÇES EU Integrated Environmental Approximation Strategy 2007-2023VAT value-added taxWEI water exploitation indexWMCC Water Management Coordination CommitteeWRI World Resource InstituteWUA water user associationWUO water user organization

Turkey - Water along the food chain
xi
ExECuTivE SummAry
Turkey’s water resourcesTurkey is not a severely water-stressed country. Yet severe water shortages already exist at a regional level -- and with trends of increasing water usage in recent decades, the situation is likely to deteriorate in the near future.
Turkey is an important agrifood trading partner for neighbouring countries in the Middle East and North Africa (MENA) and operates as a food hub for the region. Given the substantial water scarcity in most of these countries, sustainable water resource management in Turkey may therefore have implications for the long-term provision and security of food to the entire MENA region.
Despite constraints in natural water supply, unregistered and inefficient water use and management practices are widespread in Turkey, and groundwater resources are widely exploited. The result is that groundwater levels in some regions have reduced at alarming rates. The groundwater that remains is at risk to pollution through mining and other industries, and nitrate from agriculture is reported to be a serious problem in some regions. Seawater intrusion in coastal areas also poses a long-term threat to the productivity of agricultural soil up to several hundred metres inland.
Existing studies have used simulation models to estimate the effects of climate change scenarios on water available to Turkish agriculture. Their findings provide a summary of some of the knowledge and widely-accepted assumptions about water-related developments, even though such simulations have to be viewed with caution -- especially since they involve outlooks that are several decades into the future.
Nevertheless, these studies currently agree on the expected effects for Turkey overall: reduced availability of water and increased agricultural water demand due to rising temperatures in regions far away from coastal areas. The effect could intensify in the second half of the 21st century, resulting in declined agricultural production and exports.
Turkey’s agricultural sectorThe agricultural sector remains an important contributor to Turkey’s economy, both in terms of employment and value added, although income disparities between urban and rural Turkey highlight the need for rural development.
According to several trade indicators, Turkey is by far most competitive as an exporter of fruit and vegetable products and other crop-based processed

xii
products. Turkey is also a competitive exporter of poultry meat, eggs, fish and certain dairy products. However, it is relatively uncompetitive in exports of primary and processed products along the red meat chain.
Turkey’s primary agriculture has been dominated by small and medium-sized farms in both crop and livestock production, with a high proportion of land ownership by farmers. Structural change has also been fairly slow in the past However, in contrast to this rather traditional agricultural sector, Turkey hosts a dynamically growing food processing industry. This industry is an important sector in the economy and shows growth trends in high-value products such as functional foods (i.e. food providing health benefits) and organic production.
This important contribution of primary agriculture and food processing to the Turkish economy overall comes at the price of high pressure on domestic water resources because these sectors are among the largest water consumers. Indeed, primary agriculture is by far the largest water-consuming sector in Turkey, and it also accounts for the largest share in the use of groundwater as a valuable and only partly renewable resource. Thus agriculture is not only a major water consumer but it is also highly sensitive to water shortages due to its high dependence on water for food production.
Agricultural use of water is expected to continue to constitute the single most important source of domestic water demand, with 64 percent of total national water consumption in 2023 coming from agriculture -- primarily irrigation. Maize (silage) is the largest single crop coming from irrigated land, followed by cereals and cotton. In Turkey, the average blue water footprint of most products of animal origin is higher than the world average, suggesting that there is scope for improvement.
Ambitious goals in Turkey’s water governanceIn Turkey, there are organizations and institutions for water management at national, regional and local levels, therefore it has -- at least in theory -- successfully established the necessary structures for managing water resources. However, the frequent reorganization and restructuring of institutions may potentially distract from the long-term planning of programmes for sustainable water management, leading to an exacerbation of existing (and projected) water scarcity problems.
Turkey’s water agenda shows that political strategies and goals related to sustainable water use do indeed exist, and efficient irrigation in agriculture constitutes an important part of these strategies. Furthermore, alignment to the European Union (EU) water management framework as a precondition of potential EU accession has progressed relatively far. However, there is no coherent water law, and partly outdated partial laws govern aspects of groundwater use, management of irrigation systems and access to water for

Turkey - Water along the food chain
xiii
agricultural purposes1. This maintains inefficient economic incentives, despite the overall ambitious goals and strategies at a national level. For instance, nonrevenue water (NRW) use such as losses, leakage, etc. is a serious problem that needs to be addressed and taken into consideration in any approach to save water in Turkey.
Water pricing policies do not encourage efficiency or cost recovery, especially when it comes to irrigation. Irrigation water is not priced according to the quantity actually used because volumetric measures are largely not installed. Improvement of water-use efficiency in water user organizations (WUOs), e.g. irrigation cooperatives (ICs) and water user associations (WUAs), would be a suitable next objective after commencing the decentralisation of the water distribution system.
Another major issue in the context of NRW is the outdated and inefficient water distribution system in urban areas. More investment in this area is needed, which could be enabled and facilitated by public-private partnerships (PPPs). Although PPPs to modernise drinking water, wastewater and irrigation exist and are welcomed by the Turkish government, they have not yet begun to develop as dynamically in agriculture as in other sectors of the Turkish economy.
Possible side effects of policy measuresTurkey’s use of irrigation water is driven by direct measures and indirect agricultural policies that affect the incentives farmers have to produce water-intensive products. Specifically, national self-sufficiency of agrifood is an objective of policymakers and a widely held concern of the public, but is almost never justified from an economic perspective due to the typically high opportunity cost of substituting imports through support-grown domestic production.
For example, in order to promote domestic production, Turkey maintains comparably high agricultural subsidies relative to each unit of output for some products, even though Turkey’s agricultural producer support estimate (PSE) is in line with the average of other Organisation for Economic Co-operation and Development (OECD) countries. According to the OECD measure of single commodity transfer, beef and veal constitute the most heavily subsidised agricultural products in Turkey according to transfers per tonne of output. It is the second most heavily subsidised product group in terms of total transfers. Closely related to this, milk production attracts most of Turkey’s agricultural subsidies (as measured in terms of the OECD’s single commodity transfer), although the average amount per tonne of milk produced is much lower and in line with many other Turkish agrifood products. Consequently, high levels of
1 These laws are considered partial in the sense that they refer to specific aspects of water management, but do not cover the entire area of water management within one comprehensive law.

xiv
subsidies create strong incentives for farmers to increase the production of these agricultural products.
Despite the presence of subsidies, in terms of its blue water footprint Turkey has a comparative disadvantage in beef production relative to the global average of major beef-producing countries. For one tonne of domestically-produced beef, Turkey uses about 48 percent more blue water than is used under average global production conditions.
In this context, expressing total water consumption per unit value of export prices serves as a rough approximation of the opportunity cost of water in the production of different agrifood products in Turkey. For example, products such as poultry meat, eggs, tobacco, grapes and tomatoes receive a fairly small PSE and require a fairly low total amount of water per dollar export value. In contrast, beef and veal, sunflower seed and cottonseed are fairly heavily subsidised per unit of output and at the same time have among the highest water consumption per dollar export value.
Case study: Assessing water efficiency along the red meat chainAgricultural policy goals in Turkey are currently focused on supporting farm incomes through subsidies that incentivise the production of bovine animal-based products such as red meat. However, water usage is not directly taken into consideration in these policies. Therefore, conflicting goals arise with respect to the sustainable long-term management of water resources.
Moreover, water consumption in Turkish red meat production is significant, especially during the primary production stage. Agricultural and farm policies that do not directly target water consumption may therefore have a substantial negative impact on the use of domestic water resources, for instance on groundwater that is used for irrigation of maize for silage. At first glance, however, policy goals to encourage domestic red meat production appear to be a logical way for Turkish farmers to benefit from the rising domestic demand for red meat. Indeed, red meat demand in Turkey has grown steadily in the past decade and this trend is expected to continue.
The price of beef, the largest red meat category, has increased in Turkey and is comparatively high in relation to other countries. Also, more refined processing levels of fresh and chilled cuts have recently gained unit value compared to lower level processing.
An international comparison shows that the production cost of beef in Turkey is fairly high, pointing to limited international competitiveness in the sector. Moreover, Turkey has a comparative disadvantage in the export of live red meat-based animals, red meat and roughage compared to major global red meat exporters. This implies that these products could be imported at substantially lower world market prices than the marginal cost of domestic production.

Turkey - Water along the food chain
xv
Beyond primary production, a significant share of Turkish red meat slaughtering and processing still takes place in informal conditions, and the processes involved are largely hidden from process quality control and environmental monitoring. Water consumption in Turkish slaughterhouses is greater per tonne of processed carcass in larger plants than in small and medium-sized enterprises (SME) because large facilities typically obey stricter hygiene standards. Overall, cleaning tasks account for 10-30 percent of water consumption in red meat processing. In contrast, more traditional approaches to slaughter and meat processing tend to require less water, but have been observed to use water inefficiently at times. As a result, adhering to stricter international standards for red meat production may translate into even higher water use in Turkey compared to the rest of the world.
Saving water in red meat processing can be incentivised through the appropriate pricing of groundwater usage from company-owned wells and of tap water. The introduction of plant-based measures of water consumption could be a first step in this direction. Furthermore, the adoption of EU-type processing technologies will require awareness to be raised among companies and their employees about the importance of saving water. Changed incentives at the policy level are an important way to ensure that the modernisation of slaughterhouses does not lead to substantially higher water use.
Water-smart policy options and recommendationsMost of the water savings in absolute terms can be achieved by improving the efficiency of Turkey’s irrigation infrastructure and current irrigation practices among farmers. Besides the need for technical investment in this respect, two governance issues are also crucial, namely appropriate pricing of water and stricter control of informal groundwater extraction from unlicensed wells.
Water consumption in the food-processing industry varies widely by location and technology availability, but typically does not constitute a major share of the processing cost. The largest and most modern food processing firms in Turkey operate in line with international benchmark figures for water consumption per unit of output. Smaller and more traditional companies tend to use less water per unit of output, mainly due to cleaning and cooling practices that deviate from industry standards.
Modernisation of Turkey’s food-processing chains might imply slightly higher water consumption due to higher standards. It is therefore essential that reforms of the economic incentives around water consumption accompany such investments.
The reform of water use in small enterprises is particularly important because these entities often fail to see the link between water efficiency and energy efficiency, meaning they tend to consider only the price per unit of water. They therefore use low-cost water excessively, which compels them to pump water

xvi
from ever deeper wells. As a result, investments in water efficiency may in fact save companies money beyond the actual price that they pay per unit of water because they would see a reduction in electricity or fuel costs for pumping. Thus, improved production processes would probably still be more resource-efficient overall, even though water usage per tonne of processed food output might increase due to modernisation. By assessing total cost for water and energy jointly, small firms may adjust their current practices.
Water concerns should be reflected in Turkey’s agricultural policies because, as demonstrated in the case of red meat production, these policies are inherently linked to water resource use through the water footprint of each agricultural commodity. From an economic perspective, Turkey should therefore consider aligning its agricultural policies, which currently aim to increase productivity and efficiency in the red meat sector, more consistently with the sustainable long-term management of water resources.
In this context, the analysis undertaken in this report has shown that low self-sufficiency in beef production is likely to be beneficial for Turkey’s water resources unless more water saving production strategies can be introduced and implemented. Consequently, importing fodder from areas where it can grow under a higher proportion of green water usage is not a sign of sectoral weakness, but may in the medium- to long-term constitute substantial savings of water resources.
Therefore, Turkey should not continue to subsidise the use of blue water in beef production through the provision of special incentives to irrigate maize, which is the biggest water-consuming crop in the country. Instead, there should be incentives to increase “water-smart” productivity in primary beef production. Examples of such sustainable measures include the improvement of animal genetics toward high breed varieties (as currently in place under the 10th Development Plan), roughage production based on less water-demanding crops, or imports of roughage and beef carcasses.
Objectives and other considerationsThis report has reviewed available primary and secondary data, existing literature and official documents concerning water along the food chain in Turkey. In addition, extensive interviews were conducted with stakeholders in the private and public sectors.
In the private sector, companies in Turkish agrifood processing in particular were targeted. Furthermore, a case study on the Turkish red meat value chain focused on water use in slaughterhouses, meatpacking plants and related businesses. Representatives of related industry associations and specialist consultants were also interviewed.

Turkey - Water along the food chain
xvii
In the public sector, representatives of various institutions related to Turkey’s water administration were interviewed, along with representatives of the Turkish Ministry of Agriculture. Additional information was gathered by talking to individuals in person, over the telephone and in group discussions.
The aim was to obtain an overview of the role of water in Turkey’s powerful agrifood industry, and to assess potential needs for policy reforms and investment in future. One objective of this report was to assess water-use efficiency in the Turkish agrifood sector, largely relying on empirical evidence available in the country. Another objective was to analyse existing economic incentives in Turkey that have an effect on water usage along the food chain, and to investigate if and to what extent these incentives currently contribute to a “water-smart” policy framework around agricultural production and processing overall2.
Data constraintsDespite a wealth of available and readily accessible official data on water use in the country, including for agricultural purposes, it was a significant challenge to obtain systematic, up-to-date and representative data about the water usage of up and downstream agribusiness activities. Therefore, it was not possible to obtain representative sectoral assessments of the cost share of water in different production processes and corresponding tasks nor to assess the value added per unit of water in major agrifood value chains in Turkey. As a consequence, it was difficult to quantify the water saving potential of different production technologies.
In the absence of sufficient time to conduct a large-scale quantitative industry survey about water use in agrifood chains, priority was given to in-depth qualitative interviews with stakeholder organizations such as national associations of specific meat processors or unions. Typical companies for interviews were selected in line with recommendations from representatives of these umbrella organizations.
Qualitative evidence produced by the field interviews, however, does not suggest that water usage observed in red meat processing is extraordinarily inefficient. Instead, a comparison with available international benchmarking figures suggests that the qualitative findings from field studies in Turkey are in line overall with the water consumption figures of meat processors and meatpacking operations in other developed or upper middle-income countries.
However, while it may have been possible to overcome data constraints partly through field interviews with respect to typical average figures, it was not possible to gather sufficient data to place confidence intervals around these
2 For information on data constraints, see Appendix.

xviii
values. Even though representatives of national producer organizations assisted the study team in identifying companies for interviews that offered a fairly representative picture of the average role of water along the food chain in Turkey, the present analysis was unable to state the standard deviation that has to be taken into account with these values.
This implies that the difference between typical best practice processes, as presumably included in the field studies, and processes used by the least efficient water users in Turkey’s agrifood sector, might be substantial -- and overall water inefficiency could be more severe than that assessed by the present study.
Further data constraints arose from incomplete coverage of OECD PSE figures with respect to specific support provided to fodder crops. Comparisons of single commodity transfer values therefore have to be interpreted with care when comparing protection levels per unit of output between major agricultural commodities on the one hand and fodder crops on the other.
Furthermore, the available calculations of the blue water footprint of agricultural commodities in Turkey date back several years and may not have taken recent changes in the intensity of fodder from irrigated areas into account. Finally, for an in-depth evaluation of Turkish agricultural policies at a national and regional level, it might be desirable to establish water footprint data for beef and dairy production under different production systems, depending on the share of rain-fed pasture, stubble crops, irrigated fodder and imported compound feed.

Turkey - Water along the food chain
1
Chapter 1 – introduction
Turkey’s agrifood sector will be of tremendous importance in the decades to come. In 2013, in terms of its total gross agricultural production value (at 2004-06 constant prices), Turkey was ranked eighth in the world, just behind Argentina and closely followed by France and Mexico3 (FAOSTAT, 2015).
As well as being one of the top ten global producers of agricultural products (FAO, 2015), a major proportion of which are high-value crop products, the country also has a steadily growing food processing industry. For instance, the manufacture of food products is currently the largest single manufacturing industry sector in Turkey, contributing around 15 percent of the country’s production value, followed by basic metals (13 percent) and textile manufacturing (8 percent) (TUIK, 2015).
As a major exporter of agricultural and food products, Turkey is not just a trading partner of the European Union (EU), which is a large and demanding market for high-quality products, but it is also a major provider of imported food products to many of the net food-importing countries in the Middle East and North Africa (MENA).
Due to its strategic geographical location and cultural position between east and west, Turkey has unique potential to provide global agricultural markets with premium and special products (e.g. halal), while being a key provider of primary and processed food products for MENA countries in a region where agricultural production is often constrained by extreme water scarcity. For instance, in 2014, 65 percent of Turkey’s exports of poultry meat (in terms of value) went to Iraq, while in the same year, 22 percent of Turkey’s export value of cereal flour also went to Iraq and 9 percent to Syria, making them the largest single importing partners for this product category.
With fruits, vegetables and other special crops contributing significantly to the country’s agricultural output value, if Turkey is to maintain its economic competitiveness in agrifood chains in the long term, the availability of two main resources will be crucial: first, Turkey will continue to require a highly-skilled agricultural labour force with an ever-increasing proportion of staff having specialist knowledge and training. Second, Turkey has to ensure that its agricultural sector’s demand for water can be met, both now and in the future, which means that the sustainable management of water resources along the
3 According to FAOSTAT (FAO 2015), the top seven producers in 2013 were China, India, the US, Brazil, Indonesia, the Russian Federation and Argentina. France and Mexico were positioned 9th and 10th respectively behind Turkey.

2
agrifood value chains will be essential. Thus, given Turkey’s key role in the agrifood trade in the MENA region, it is necessary to evaluate the current situation and the prospects of efficiency gains in water usage along its agrifood chains, since there could be severe water shortages in the medium- to long-term.
The first objective of this report is to compile empirical evidence from official statistics on water usage in the Turkish agricultural sector and to combine this with available qualitative information and first-hand company-level and stakeholder information about water usage in typical processing steps along the Turkish food value chain.
This analysis was conducted while taking the perspectives of both the public and private sectors into account, and with a view toward the potential need for investment in order to maintain and increase the competitiveness of the Turkish agrifood industry in the long-term. The red meat chain in Turkey was therefore examined in detail as an example of a major sector with a dynamically growing domestic demand.
The second objective of this report is to analyse existing economic incentives in Turkey that have an effect on the use of water along the food chain, and to investigate if and to what extent these incentives currently contribute to an overall “water-smart” policy framework around agricultural production and processing.
Therefore, the overall purpose of the report is to determine whether potential changes to existing policies in Turkey might enable the country’s water resources to be used more efficiently and sustainably in future.
Turkey’s water resources
Key findings:
• Under the international definition of water stress, Turkey is not currently facing severe water stress, despite significant inter-regional variations. However, there has been growing pressure on water resources in recent decades and given the increasing trends of water usage, the situation may well deteriorate in the near future.
• There are severe water shortages in some parts of Turkey, making it a regional issue already.
• Unregistered and inefficient water-use practices are widespread in Turkey.
With an average annual precipitation of 593 mm per m2, Turkey is not water-rich compared to many European countries, like Germany with 700 mm per m2; nor is it an extremely water-stressed country, like many of its Middle Eastern neighbours - notably Syria, which receives 252 mm/m2 per year on average (World Bank Data, 2015).
Various climatic zones can be found in Turkey due to its size. Broadly, Turkey has three major climatic zones -- Mediterranean, sub-tropical and terrestrial -- each

Turkey - Water along the food chain
3
with distinct precipitation patterns: (i) convective rainfall in Central Anatolia during the spring and summer months, (ii) frontal rainfall in all regions, mainly in the winter and spring months, and (iii) orographic rainfall on the seaward slopes of the Black Sea and the Mediterranean.
Average annual precipitation ranges from 250 mm in Central Anatolia to over 2 500 mm in the north-eastern coastal area of the Black Sea (Figure 1). Across the country, approximately 70 percent of total precipitation falls between October and April, with little rainfall during the summer months (Turkish State Meteorological Service, 2015).
In this context, geographical longitude affects the level of precipitation in the different regions of Turkey. For instance, the Taurus Mountains in the southern part of the country are close to the Mediterranean coast and provide a natural barrier to the rain clouds heading towards Central Anatolia. The main precipitation from these clouds takes place in the coastal region, which explains the relative water scarcity of the Anatolian Plateau in the western half of the country. For comparison, average annual rainfall in the coastal region of Antalya in the south-western part of the Taurus Mountains is 1 064 mm, compared to 331 mm in Karaman in the northern part of the mountains (Sensoy et al., 2008).
Figure 1: Annual average precipitation in Turkey
Source: Sensoy et al. (2008).
Turkey has 25 river basins (Figure 2) in which annual precipitation, evapotranspiration and surface water flow vary significantly. The available inland

4
water body in these basins consists of 200 natural lakes, 806 dam reservoirs and 1 000 small dam reservoirs (Foreign Relation Office of DSİ, 2014).
Figure 2: River basins of Turkey
Source: Foreign Relation Office of DSİ (2014).
DSİ4 data from 2013 show that the volume of annual average precipitation is estimated to be 501 billion m3 water, of which about 55 percent is lost to evapotranspiration, 31 percent flows into water bodies (158 billion m3) and 14 percent feeds aquifers (69 billion m3) (Foreign Relation Office of DSİ, 2014). The Dicle-Fırat Basin in south-eastern Turkey is Turkey’s largest single volume of available exploitable freshwater resources, representing 28.5 percent.
In general, a country’s water resources are measured according to different concepts for which slightly different terminology is used:
• netwaterpotential or totalexploitablewaterresources(km3/year). In the official literature of the Turkish Government, the water potential (Foreign Relation Office of DSİ, 2014) is the term that is equivalent to total exploitable water resources. The latter term is used by other organizations including the Food and Agriculture Organization of the United Nations (FAO), for example (AQUASTAT, 2015);
• exploitablewaterresources (km3/year), manageablewaterresources or waterdevelopmentpotential. This is defined as the available water resources for development under specific economic and environmental
4 The General Directorate of State Hydraulic Works (in Turkish: Devlet Su İşleri [DSİ]) is Turkey’s primary executive state agency for planning, managing and operating the country’s water resources.

Turkey - Water along the food chain
5
conditions. The calculation of exploitable water resources considers factors such as the dependability of flow, extractable groundwater and the minimum flow required for non-consumptive use (FAO, 2003). Therefore, exploitable water resources tend to be lower than total annual water potential.
Figure 3 shows Turkey’s annual water potential. In this figure, the equivalent terms from AQUASTAT are given in parentheses for ease of comparison.
FAO estimates in the AQUASTAT database differ from official Turkish estimates. For instance, FAO estimated precipitation in Turkey to be equivalent to 464.7 km3 for both 2012 and 2014. Furthermore, the FAO data estimated total renewable surface water to be 171.81 km3, total renewable groundwater to be 67.8 km3, and groundwater recharge for feeding rivers to be 28 km3 (2012 and 2014 estimates).
In total, FAO estimates around 211 km3 of total renewable water resources for Turkey, which translates to 2 790 m3 of total renewable water resources per capita. In contrast, Turkey’s national water authority, the General Directorate of State Hydraulic Works (DSi), considers the amount to be 234 km3 for total renewable water resources, which is labelled “total water potential” in the corresponding literature.
Figure 3: Schematic diagram of Turkey’s water potential, 2013
Source: Foreign Relation Office of DSİ (2014).
Defined as a country’s total exploitable water, water potential per capita (m3/year/person) also varies significantly between the country’s regions (Figure 4). This is mainly due to uneven population distribution in Turkey. Figure 5 shows that
6
the most populated regions in Turkey are the areas with critical water shortages, mainly due to industrial and/or tourism activities. The population estimate shows that Turkey had 76 million inhabitants in 2013 (TUIK, 2015). In 2013, the per capita water potential was approximately 1 500 m3. By 2030, available exploitable water per capita is expected to decrease to about 1 100 m3 and Turkey may well face water scarcity (Ministry of Development, 2013, paragraph 1042)5.
It should be emphasised that the terms “water scarcity” or “water stress” are not defined by DSİ or in other official documents published by Turkey (FAO, 2008, p.7). Instead, “water stress” and “water scarcity” are international definitions based on the total available renewable freshwater resources per capita (FAO, 2008, p.7), which differs from the definition used in official Turkish documents where total exploitable water per capita is considered to be an indicator of water scarcity and stress.
The internationally accepted indicator normally used to assess national water scarcity is total renewable water resources per capita. Against this criterion, countries or regions are considered to be facing absolute water scarcity if renewable water resources are below 500 m3 per capita, a chronic water shortage if renewable water resources are between 500 and 1 000 m3 per capita, and regular water stress if renewable water resources are between 1 000 and 1 700 m3 per capita. Despite its widespread use, this indicator tends to be an oversimplification because it merely describes an average country situation and therefore overlooks regional variations such as local factors determining access to water. (FAO, 2008, p.7).
Meanwhile, the European Environment Agency (2010) uses the water exploitation index (WEI)6. This index is defined as follows:
WEI for country r in percent =mean annual total abstraction of freshwater
mean annual total renewable freshwater resource
According to the definition of this index, water stress begins if the index value exceeds 20 percent for a country in a certain year. Severe water scarcity is defined as starting from index values of 40 percent and above. Based on this, Turkey is not yet water stressed -- but the country’s index was around
5 It should also be noted that the 2030 water availability per capita is based on the assumption that Turkey’s population will reach 100 million by 2030. There are other scenarios developed by the Turkish statistical office (TUIK) that anticipate a smaller population of between 88 million and 92 million for 2030 (TurkStat, Population Projections, 2013-2075), which could imply more available water per capita if everything else remains constant.
6 The ratio between total water withdrawal by agriculture, cities and industries over total renewable water resources is also considered by FAO as an indicator which reflects the balance between supply and demand (FAO, 2008, p.8). The AQUASTAT (2015) shows that the estimated freshwater withdrawal as a percentage of total renewable water resources was 14.93 percent in 1992, 19.85 percent in 2000 and 18.93 percent in 2003 for Turkey.

Turkey - Water along the food chain
7
18 percent in 2002, up from about 15 percent in 1990. In contrast, over the same period, most European countries were able to reduce their WEI; see European Environment Agency (2010) for a comparison.
Total water withdrawal in Turkey reached 54 billion m3 in 2013, compared to 234 cubic kilometres (km3 ) of total renewable water resources (Figure 3). Thus, the WEI for Turkey in 2013 has already risen to 54 / 234 x 100 = 23 percent, which can be considered on the brink of water stress, according to the WEI definition.
However, considering the other internationally recognised definitions of water stress and water scarcity and the FAO statistics in AQUASTAT (2015), with 2 790 m3 of total renewable freshwater resources per capita, Turkey is neither a water-stressed nor a water-scarce country on average. Yet the AQUASTAT (2015) data set also shows that there has been a trend of declining annual water potential (total available water) since 1992, both in absolute terms and per capita7.
Nevertheless, there are strong regional differences in exploitable water resources per capita (Figure 4). Moreover, water availability is highly seasonal and not evenly distributed throughout the country, leading to local and regional water shortages. For instance, between 2005 and 2007, the water supplies of Istanbul, Ankara and Izmir were threatened by a severe drought that hit the entire Mediterranean Coast as well as Central Anatolia (Foreign Relation Office of DSİ, 2014).
Considering that some region already face water stress, which will be exacerbated by the estimated reduction of available water, efforts should be stepped up immediately to preserve Turkey’s water resources. Although this situation is primarily being caused by climatic conditions, human factors also play a significant role. According to the Turkish government (Ministry of Environment and Urbanisation, 2012), these factors include excessive water use for irrigation caused by:
• illegal groundwater use;• issues around the operation and management of existing water facilities;• leakages and loss of water within the water network;• administrative and institutional problems related to water usage;• delays in investments; and• water pollution.
In order to mitigate the potentially adverse effects of climate and climate change, these issues need to be addressed in order to minimise the water stress Turkey will face in the future.
7 The AQUASTAT (2015) data show that over the past three decades the total annual water potential (total available water) has reduced for Turkey as follows: 3 791 m3 per capita in 1992, 3 505 m3 per capita in 1997, 3 254 m3 per capita in 2002, 3 045 m3 per capita in 2007, 2 860 m3 per capita in 2012 and 2 790 m3 per capita in 2014.

8
Figure 4: Water potential (m3/year/capita) in each river basin in Turkey
Source: Muluk et al. (2013) with modifications.
Figure 5: A map of population density in Turkey
Source: European Environment Agency8.
8 European Environment Agency, Map 2 population density in Turkey, http://www.eea.europa.eu/soer/countries/tr/country-introduction-turkey/2.jpg/view (last online access 18.3.2015).

Turkey - Water along the food chain
9
Structure of water use and water demand in Turkey
Key findings:
• Agriculture is by far the most water-consuming sector in Turkey and also accounts for the largest use of groundwater, which is a potentially valuable and only partly renewable resource.
• Agriculture is expected to continue to be the single largest user of domestic water, with estimates attributing 64 percent of total national water consumption in 2023 to the sector.
• Among non-agricultural uses, municipalities are the largest single water users. However, this not only includes drinking water, but also water used by companies located in these municipalities.
• Thermal power plants constitute another major source of water consumption according to total volume. However, to a large extent this is seawater used for cooling purposes.
Pressure on water resources in Turkey comes from all sectors of the economy, with agriculture accounting for the greatest proportion of withdrawals. Total water withdrawal reached 54 billion m3 in total in 2013, of which 74 percent was used for irrigation, 13 percent for domestic purposes and 13 percent for industry (Foreign Relation Office of DSİ, 2014).
The European Environment Agency (2015)9 has found that from the early 1990s until 2013 Turkey’s water consumption for agricultural purposes more than doubled, while the demand for public purposes almost doubled, the demand for industrial purposes (excluding energy) increased by around 10 percent, and water usage for energy purposes increased by 46 percent. Over the same period, most European countries were able to reduce their total annual water extraction rather than increase it, and even in southern Europe (where most irrigation undertaken by European countries occurs) agricultural water consumption was brought down by about 7 percent.
As mentioned above, overall Turkey is not facing a state of acute water shortage at the moment; and although there are densely populated regions experiencing water shortages, other regions have sufficient exploitable water resources, such as the Fırat-Dicle Basin in south-eastern Turkey.
Turkey’s total agricultural land covers 28 million ha, with an estimated gross irrigation potential of 8.5 million ha. As of the end of 2013, 5.9 million ha, or 69 percent, of this potentially irrigable land was already being irrigated, while the remaining 31 percent (2.6 million ha) is currently under planning or development (Foreign Relation Office of DSİ, 2014).
9 Eurostat, as reported by the European Environment Agency.

10
DSİ is Turkey’s primary executive state agency for planning, managing and operating the country’s water resources. It is a legal entity and has a supplementary budget. Its role is described in more detail in chapter 3 of this report.
Figure 6: Actual and projected water use in Turkey, 2013 and 2023
74%
64%13%
16%
13%
20%
0
20
40
60
80
100
120
Estimated water use 2013 Projected water use 2023
billi
on m
3
Irrigation Domestic Industry
Source: Foreign Relation Office of DSİ (2014).
DSI has projected that Turkey will use its entire annual “total exploitable water”, estimated at 112 billion m3, by 2023 (Foreign Relation Office of DSİ, 2014). Figure 6 shows the proportion of water consumption by different sectors in 2013 (actual) and 2023 (projected).
The forecasted breakdown of water use by key economic activities suggests that agriculture will remain the major water consumer in Turkey, with 64 percent of total annual water consumption in 2023; followed by industry, which is expected to grow substantially, reaching 20 percent of total annual water use; and then domestic use, at a projected 16 percent (Foreign Relation Office of DSİ, 2014).
In particular, during the period 1995-2013, agricultural usage of groundwater increased by more than 90 percent (DSİ, 2015). Furthermore, DSİ statistics show that groundwater consumption for all non-agricultural uses increased by more than 25 percent for the same period.
As the organization responsible for drilling and monitoring wells, DSİ has only charged farmers sporadically for water use in the past (Mutlu, 2011, p.277),

Turkey - Water along the food chain
11
which is explained further in chapter 3. For example, DSİ just started to follow the metering policy for agricultural pumps as a pilot project in Konya in 2011 (Foreign Relation Office of DSİ, 2014, p.106).
The non-agricultural uses (and users) of water include direct withdrawal from municipalities and villages for domestic networks (drinking and utility), industrial enterprises, thermal power plants, OSBs and mining enterprises. In 2012, water withdrawals by these non-agricultural users reached 14.3 billion m3, or 22 percent more than in 2010 (TUIK, 2015). However, the most important source of water for the aforementioned users was the sea (mainly for manufacturers and thermal power plants), followed by reservoirs and wells.
In this context, Figure 7 shows the volume of water consumed by different non-agricultural users in Turkey (including fresh water and seawater) in 2010 and 2012. Table 1 further breaks down the data underlying Figure 7 by water sources. As can be seen from both Table 1 and Figure 7, water consumption by different non-agricultural users increased between 2010 and 2012.
Figure 7: Breakdown of different water users, 2010 and 2012
4 78
7.44
1 01
4.85
1 42
3.17
4 27
3.87
111.
86
53.5
2
4 93
0.73
1 03
6.74
1 66
8.76
6 39
6.06
120.
30
110.
05
0
1000
2000
3000
4000
5000
6000
7000
8000
Municipalities Villages Manufacturingindustry
establishments(incl. food
manufacturing)
Thermalpower plants
Organisedindustrial
zones
Miningestablishments
Mill
ion
m3
2010 2012
Source: TUIK (2015).
The figure shows that of the various non-agricultural sectors, municipalities were the largest consumers of water in 2010, largely relying on dams, immediately followed by thermal power plants. In this context it should be noted

12
that municipalities are responsible for potable water provision in their region, while in many instances they also provide water for local industries. Therefore, the term “municipal water” does not solely refer to drinking water. However, the Turkish statistical office (TUIK) (2015) does not provide a breakdown of these data according to the specific end purpose of municipal water use.
Table 1 shows that thermal power plants, the largest non-agricultural domestic water consumer in Turkey in 2012, use a large amount of seawater. This water is mainly used for cooling the system when the thermal plant is located near the coast (Akbal and Pınar, 2014).
Table 1: Major sources of water resources for different non-agricultural users, 2010 and 2012 (million m3)
source of water withdrawal
Year Municip-alities Villages
Manufacturing industry
establishments
thermal power plants
organized industrial
zones
Mining establishments
total withdrawal
Spring2010 1 015.9 674.0 39.0 34.5 23.9 2.7 1 789.9
2012 948.1 656.7 31.3 36.8 24.5 6.5 1 703.9
Sea2010 0.2 821.3 4 139.8 4 961.3
2012 0.3 1 169.6 6 254.1 7 424.0
Lake and artificial lake
2010 82.9 46.9 14.2 0.1 2.0 3.4 149.6
2012 97.7 51.5 12.3 3.3 5.0 169.7
River2010 159.5 17.6 64.2 40.4 23.5 19.4 324.6
2012 78.3 17.7 62.2 42.1 24.5 10.8 235.6
Dam2010 2 255.4 6.4 98.4 49.8 6.3 2 416.3
2012 2 410.7 12.8 86.8 52.1 7.2 2.0 2 571.6
Well2010 1 273.5 270.0 386.1 9.2 55.2 11.0 2 004.9
2012 1 395.7 298.0 305.6 10.5 60.9 69.9 2 140.5
Others2010 0.1 0.9 17.1 18.1
2012 0.9 0.5 0.0 15.8 17.2
Total2010 4 787.4 1 014.9 1 423.2 4 273.9 111.9 53.5 11 664.7
2012 4 930.7 1 036.7 1 668.8 6 396.1 120.3 110.0 14 262.6
Source: TUIK (2015).

Turkey - Water along the food chain
13
The issue of groundwater depletion
Key findings:
• Groundwater resources are widely exploited across Turkey, with levels reducing at alarming rates in some regions.
• Related to this is the problem of seawater intrusion in coastal areas, which poses severe long-term threats to the productivity of agricultural soil up to several hundred metres inland.
• Groundwater pollution through mining, other industries and agriculture (nitrate) is reported to be a severe problem in some regions; however, data broken down by region for the whole of Turkey are not publicly available.
Overexploitation of groundwater is widespread in Turkey, reaching alarming levels in some locations – although not all water basins and aquifers are currently endangered. Unfortunately, as data about water tables10 are not widely available, it is difficult to present a realistic and unbiased picture of the situation. It is estimated that 95 percent of exploitable groundwater resources is already being used in some way, so placing a greater demand on groundwater resources is not advised (Türker, 2013). Groundwater supplies water for irrigation, domestic and industrial usage.
In general, the following issues need to be considered in the context of overutilisation of groundwater in Turkey:
(i) groundwater depletion in the more central regions;
(ii) seawater intrusion into freshwater aquifers in coastal areas; and
(iii) water pollution:
Groundwater depletion
Groundwater depletion in central regions of Turkey presents a major threat. The Konya basin, for example, is one of the major water basins affected by groundwater overexploitation, but the issue is also being faced by the Asi, Akarçay, Susurluk, Marmara, Meriç-Ergene, Kuzey Ege and Küçük Menderes basins (Türker, 2013). Figure 8 depicts critical groundwater use in different water basins.
10 A “water table”, also called a “groundwater table”, is the upper level of an underground surface in which the soil or rocks are permanently saturated with water. The water table separates the groundwater zone that lies below it from the zone of aeration, which lies above it. The water table fluctuates both with the seasons and from year to year because it is affected by climatic variations and by the amount of precipitation used by vegetation. It is also affected by the withdrawal of excessive amounts of water from wells or by their artificial recharge (Britannica Online Encyclopedia).

14
Figure 8: The groundwater situation in different water basins in Turkey
Source: Türker (2013).
The Küçük Menderes Basin Protection Action Plan (TUBITAK Marmara Research Centre, 2010) shows a dramatic water table drop in almost all aquifers in the basin as a result of the expansion of wells in the area since 1995. More specifically, the Sandıklı (Afyonkarahisar) aquifer, part of the Büyük Menderes water basin in the southwest of Turkey, is an example of mismanagement of groundwater (Aksever et al., 2015).
In this important agricultural area, with 1 150 registered wells that extract water for different irrigation and domestic purposes, the groundwater level dropped during the period 2007-2009 from 2.43 m to 15 m in different parts of the aquifer. Furthermore, excessive industrial groundwater pumping reduced the groundwater level by five to eight metres over a 10 year period in the Nif valley area of the Gediz water basin (Svendsen et al., 2005).
In contrast, the Ulubey aquifer near the city of Uşak, which is a part of the Büyük Menderes water basin, shows different trends (Erdemli, 2008). This is an example of an aquifer where equilibrium exists. The groundwater level has not fallen since 1990 despite expansions in groundwater pumping for irrigation, industrial consumption and municipal withdrawal since 1960. The water depth changed from 50 metres to more than 150 metres around the aquifer, but it appears that the aquifer is being recharged by neighbouring aquifers.
These examples suggest that long-term groundwater pumping policies should be basin-aquifer specific in order to deal with overexploitation of groundwater. It should be added that although DSİ has recognised the importance of local aspects of groundwater management (World Bank, 2010, p.23), the primary

Turkey - Water along the food chain
15
focus of the main water management plans such as the River Basin Protection Action Plan11 (RBPAP) is surface water.
The difference between the focus on surface water management and groundwater management is potentially important because surface water needs comprehensive management plans at the geographical scale of the river basin, while aquifer-level plans are essential for sustainable groundwater management.
Seawater intrusion
According to anecdotal evidence12, seawater intrusion into freshwater aquifers in coastal areas is reported for many aquifers in Turkey. Turkey has extensive coastal ranges with the Mediterranean and the Black Sea. This problem is more severe in Mediterranean coastal areas, as agriculture and tourism demand more and more water. The problem of saltwater intrusion has been studied for several basins and aquifers13, but there is no general data available on this problem for Turkey overall. However, Demirel (2004) has studied the consequence of seawater intrusion in the Mersin-Kazanlı region in the Doğu Akdeniz basin on the Turkish Mediterranean coast.
Demirel (2004) used the data of an observatory well for the period 1974-2001. Mapping chloride ion contamination in the groundwater reservoir showed that the overexploitation of water by a local factory led to seawater contamination of the area up to 500 metres inland. Water in old wells can no longer be used and new wells can only be drilled at a distance of one kilometre from the coast14.
Seawater intrusion in coastal areas results in an increase in soil salinity and higher electrical conductivity (EC) of freshwater resources in groundwater reservoirs. The intrusion of seawater into freshwater reservoirs in coastal regions can stop economic activities in these regions altogether or adversely affect protected natural areas, such as the Göksu delta.
Seawater intrusion even occurs in the eastern part of the Anatolian region. Overexploitation of groundwater resources for industrial and irrigation usages in
11 The River Basin Protection Action Plan is explained in chapter 3.12 Field interviews conducted by the research team in January 2015.13 In hydrology, an aquifer is a rock layer that contains water and releases it in appreciable amounts.
The rock contains water-filled pore spaces and, when the spaces are connected, the water is able to flow through the matrix of the rock. An aquifer may also be called a water-bearing stratum, lens or zone (Britannica Online Encyclopedia).
14 Some of the aquifers affected from the east to the west side of Turkey’s Mediterranean coast are the Dörtyol-Erzin in Asi Basin (Günay, 2003), the Mersin-Berdan and Efrenk plains in Ceyhan Basin (Günay, 2003), the Göksu delta in the Doğu Akdeniz basin (Demirel, 2010), the Silifke-Ovacık plain in the Doğu Akdeniz basin (Günay, 2003), the Içel-Gilindire plain (consisting of the Gilindire, Sipahili and Büyükeceli plains) in the Doğu Akdeniz basin (Günay, 2003), the Gazipasa plain in the Antalya basin (Günay, 2003), the Finike-Kumluca plain in the Batı Akdeniz basin (Günay, 2003) and the Demre plain in the Batı Akdeniz basin (Günay, 2003).
16
the coastal areas of Lake Van and in coastal aquifers of the Van Gölü basin is an issue that threatens domestic freshwater supplies. Ozler (2003) found saltwater intrusion up to five kilometres from the lake.
Thus, seawater intrusion can be described as a regional problem, with varying degrees of severity. Regional protection plans should be designed for each of the contaminated aquifers to address their respective issues.
Water pollution
The contamination effect of economic activities on water quality is another considerable problem affecting aquifers. For instance, Tokatli et al. (2013) found that even in the Türkmen Mountains in the Susurluk basin, which is well away from pollutants and provides water for 250 000 citizens, there has been a downward trend in water quality due to an increase in arsenic and boron levels from regional mining and agricultural activities.
Furthermore, nitrate pollution in the important Şarkikaraağaç sub-basin between the Konya and Akarçay water basins has been examined by Varol and Davraz (2010). The lack of sewage systems in combination with agricultural activities has led to contamination of the aquifers in this region. Consequently, the authors advise using drip irrigation to reduce the nitrate being washed into the aquifer and Beysehir Lake. In addition, the use of septic tanks and cesspools should be stopped, and sewage systems should be installed in rural areas.
The above examples give an overview of the complexity and the challenges related to groundwater management in different parts of Turkey. Region-specific plans and policies should therefore be developed in order to meet the growing demand for water while preventing the qualitative and quantitative deterioration of valuable groundwater resources.

Turkey - Water along the food chain
17
The predicted effect of climate change on water resources in Turkey
Key findings:
• Existing studies based on simulation models about the effect of climate change scenarios on Turkish agriculture should be interpreted with care. However, simulations of this kind may provide a summary of the knowledge of and widely-accepted assumptions about future developments.
• There is general agreement across these studies about the expected effects of climate change in Turkey, with predictions of a negative impact on the availability of water and increasing demand for water in agriculture due to temperature increases in regions a long way from coastal areas.
• The effects could become severe in the second half of the 21st century and could result in a decline in agricultural exports from Turkey.
• Evidence from a participatory vulnerability assessment of climate change impacts shows that livestock producers may suffer relatively more than crop producers in Turkey, assuming that the current state of technology remains constant.
Although Turkey is not among the 36 countries suffering extremely high water stress according to the World Resource Institute (WRI) categorisation of the baseline water stress measure15 in 2013 (Gassert et al., 2013), it will likely be one of the countries facing extremely highly water stress by 2040 (Gassert et al., 2015). As mentioned in Turkey’s 10th Development Plan (Ministry of Development, 2013), available exploitable water per capita is expected to fall from 1 500 m3 in 2013 to just 1 100 m3 per capita in 2030. This is only one of the challenges facing water resources in future. Climate change is another issue that will affect Mediterranean countries in the 21st century, as mentioned in the latest report from the Intergovernmental Panel on Climate Change (IPCC) (Barros et al., 2014).
In order to have an idea of the possible effects of climate change in Turkey, it is useful to look at historical trends. Climate data for the period 1950 to 2010 shows a significant trend of warming across Turkey (Ministry of Environment and Urbanisation, 2013, p.158). However, the analysis of precipitation data for the same period shows different patterns in different parts of the country. Annual total precipitation decreased between 1950 and 2010 in the western and south-eastern regions of Turkey, but increased in the Tekirdağ and Istanbul districts of the Thrace sub-region and in the northern and eastern sub-regions of the central and eastern Anatolian region (Ministry of Environment and Urbanisation, 2013, p.159). Furthermore, a seawater level increase of 1.57 mm/year was recorded for the same period (Öztürk, 2011).
15 Baseline water stress measures the ratio of total annual water withdrawals to total available annual renewable supply, accounting for upstream consumptive use. Higher values indicate more competition among users (Gassert et al., 2015).

18
A review of climate change simulation models can provide insight on the current knowledge and estimates to be extrapolated to the future. Despite differences in magnitude, there is a consistency overall in the trends found in different climate change simulation models, which show rising temperatures in Turkey during the 21st century (Ministry of Environment and Urbanisation, 2013, p.168)16. The results of different simulations show that the average increase in temperatures is estimated to be around 2.5 °C – 4 °C. It reaches up to 5 °C in inner parts of Turkey and up to 4 °C in the Aegean and Eastern Anatolian regions (Ministry of Environment and Urbanisation, 2013, p.163).
Furthermore, the results of these simulations show a reduction in precipitation in the Mediterranean regions of Turkey, and an increase in precipitation in the Black Sea areas. Reductions in runoff are expected during spring in eastern Turkey, while an increase in runoff is expected during winter in the eastern Anatolian region (Ministry of Environment and Urbanisation, 2013, p.168).
Similar results are mentioned in a World Bank report (2014). In spite of controversies about the results of climate change simulations for coastal regions in Turkey, the summary of climate change simulations for the MENA region shows that on average Turkey will be a more arid country during the 21st century (World Bank Group, 2014, p.115). Furthermore, there will be reductions in precipitation in central and southern parts of Turkey, although this reduction will probably not be as extreme as in many other parts of the MENA region (World Bank Group, 2014, p.124).
Understanding the socio-economic effects of these expected changes presents a major challenge. Participatory vulnerability studies (PVA) have been conducted at a local level in order to identify the impact of climate change on vulnerable areas in the context of the UN joint programme on enhancing Turkey’s capacity to adapt to climate change. As expected, the results of this study show that farmers are the most vulnerable group to current and future climate variability as it will affect crop production, animal husbandry and fishing practices. However, according to the qualitative evidence presented in this report, people who rely on animal husbandry alone for their livelihood have been found to be more vulnerable than crop farmers. Farmers tend to be more flexible as they can change crop patterns and planting cycles or adopt other strategies. In contrast, after a severe climatic event or disaster, pastoralists tend to actually leave the sector altogether or take up alternative employment (Talu et al., 2011, p.42).
Projections of water stress levels in Turkey and the EU for 2030 suggest that Turkey will experience particularly strong water stress in its central and western regions, as well as significant stress in south-eastern and eastern
16 The results of different simulations on climate change were reviewed by the Ministry of Environment and Urbanisation in 2013 and can be found in section 6.1.2 of Turkey’s Fifth National Communication under UNFCCC.

Turkey - Water along the food chain
19
regions (Ministry of Environment and Urbanisation, 2013, p.17). However, other forecasts can be found in the literature.
Dudu & Cakmak (2011) used a computable general equilibrium (CGE) model to analyse climate change effects on agriculture in Turkey. They came up with different results by considering the 21st century in its entirety in their scenarios. The effect of climate change is considered to be a change in agricultural productivity and irrigation requirements. A crop water requirement model is used for estimates for the years 2010-2099.
Results of the climate model suggest that the effects of climate change will become significant after 2035. Average climatic conditions in the period 2035-2060 will worsen, primarily due to increasingly dry climatic conditions, with lower yields and higher irrigation requirements. The deterioration will continue after 2060 until the end of the century.
The authors conclude that the production of agricultural and food commodities will be severely affected by climate shocks and the price of these commodities can be expected to rise drastically. Increasing irrigation requirements will cause farmers to reduce irrigated production. Combined with a decline in yields, this will cause a significant deterioration in agricultural production and higher prices. The trade balance will worsen in all sectors except manufacturing, but the overall effect is estimated to be positive because growth and manufacturing will be able to compensate for losses in agriculture.
The results of these simulations show that the export and import of agricultural and food products will be severely affected. For the period 2035-2060, the export of agricultural products and food products will reduce by 5.76 percent and 3.89 percent respectively. For the period 2060-2099, the export of agricultural products and food products will fall by 19.8 percent and 10.97 percent respectively, while in the same period the import of agricultural products and food products will increase by 5.86 percent and 1.4 percent, respectively.
Furthermore, for the period 2060-2099, the import of agricultural products and food products will increase by 15.6 percent and 3.74 percent respectively. While recognising all the deficiencies inherent in such a model, the authors suggest that any climate change adaptation policy needs to be region-specific, and should also consider the interaction between regions.
At a micro level, Ertürk et al. (2014) used a simulation model to analyse the effects of climate change on groundwater resources in the Köyceğiz–Dalyan watershed, which is part of the Batı Akdeniz Basin in the coastal region of the Mediterranean Sea. In this study, a soil and water assessment tool (SWAT) model was used to calculate current and future climate change impacts on the water budget by considering the period between 1960 and 2100. For climate change scenarios, the SWAT was run in auto-irrigation mode, using only

20
groundwater sources for irrigation. The results of the simulations showed that available irrigation water will fall due to the reduction in groundwater resources, which in turn would cause a steady reduction in crop production.
The authors conclude that under these circumstances, water conservation should be considered the primary climate change adaptation strategy for the region. Since agriculture is the main sector placing heavy demands on water resources in this area, the authors recommend further investigations into the possibilities of switching to more efficient irrigation methods and to less water-intensive crops.

Turkey - Water along the food chain
21
Chapter 2 – Turkey’s agriculture sector and water use
The main objective of this section is to investigate growth patterns in Turkey’s agricultural sector and examine trends in water use in the country’s agrifood processing industry. Recent and past trends in the agricultural sector in general are therefore reviewed and the competitiveness of the sector analysed with an emphasis on trade patterns. Water use in agriculture and food processing is then assessed in detail, water saving technologies are investigated and finally the potential role of governance measures related to industrial water consumption is discussed.
Turkey’s agriculture sector: the recent past and current trends
Key findings:
• The agricultural sector remains an important contributor to Turkey’s economy, both in terms of employment and value added, while income disparities between urban and rural Turkey point to the need for rural development.
• Turkey’s primary agriculture is dominated by small and medium-sized farms in both crop and livestock production, with a high proportion of land ownership by farmers. Structural change has been fairly slow in the past.
• Turkey’s food processing industry is an important sector in the Turkish economy and also shows trends of growth in high-value products such as functional foods (i.e. food providing health benefits) and organic production.
• According to several indicators, Turkey’s trade patterns in agrifood products show that the country is by far most competitive when it comes to the export of fruit and vegetable products and other crop-based processed products.
• Turkey is an important agrifood trading partner for neighbouring countries in the MENA region and functions as a food hub for the region.
• Turkey also appears to be a competitive exporter of poultry meat, eggs, fish and certain dairy products.
• However, according to several indicators, Turkey is relatively uncompetitive in exports of primary and processed products along the red meat chain.
Agriculture in Turkey’s macroeconomy
According to the classification by the World Bank (2015), Turkey is one of the largest upper middle-income countries and has the 17th largest economy in the world. Turkey is a free market economy that has experienced solid economic growth in the past decade, posting 8-9 percent growth in gross domestic product (GDP) during 2010 and 2011 following the global financial crisis. Since the start of the millennium, the long-term average growth rate of GDP in Turkey

22
has been around 4 percent per year (OECD-FAO, 2015), contributing to Turkey’s growing per capita income that currently exceeds USD 10 500 per capita per annum on average. Indeed, the World Bank projects that per capita income in the country will triple in under a decade.
In this context, it is not surprising that agriculture’s contribution to Turkey’s GDP is gradually declining, falling by one-third from about 24 percent in 1980 to 8 percent in 2014; while other areas such as services, particularly the financial and insurance sector, have been increasing their contribution to Turkish GDP (TUIK, 2015).
In contrast, the manufacturing sector (including food processing as the biggest single subsector) contributes about one-quarter of total GDP, while wholesale and retail trade and administrative services and health constitute three additional major economic activities in Turkey. Water supply and wastewater management, considered a sector of its own in Figure 9, contributes about 0.5 percent to Turkish GDP.
Figure 9: Turkish GDP by main economic activities, 1998-2014
0%
10%
20%
30%
40%
50%
60%
70%
80%
90%
100%
1998
1999
2000
2001
2002
2003
2004
2005
2006
2007
2008
2009
2010
2011
2012
2013
2014
Arts, entertainment and recreationHuman health and social work activitiesEducationPublic administration and defence; social securityAdministrative and support service activitiesProfessional, scientific and technical activitiesReal estate activitiesFinancial and insurance activitiesInformation and communication
Accommodation and food service activitiesTransportation and storageWholesale and retail tradeConstructionWater supply, sewerage, waste managementElectricity, gas, steam and air conditioning supplyManufacturing Mining and quarryingAgriculture, forestry and fishing
Source: TUIK (2015).
The declining relative share of agriculture in Turkey’s GDP, however, does not imply that the sector in Turkey is shrinking. Figure 10 demonstrates that

Turkey - Water along the food chain
23
agriculture’s contribution to GDP growth has in fact still been positive in the past five years, at on average 3.75 percent, outstripping secondary and tertiary industries in both 2008 and 2009. Indeed, agriculture did not suffer from the 2008 global financial crisis as much as the industry and service sectors.
Figure 10: Annual growth rate of Turkey’s gross domestic product within main economic activities (constant prices), 1998-2013
-15
-10
-5
0
5
10
15
20
1998
1999
2000
2001
2002
2003
2004
2005
2006
2007
2008
2009
2010
2011
2012
2013
perc
ent
Agriculture Industry Services Gross domestic product (purchaser's price)
Source: TUIK (2015).
Given that many agricultural activities involve strong seasonal cycles, agriculture’s contribution to Turkish GDP also fluctuates throughout a typical year. Figure 11 demonstrates that agriculture, forestry and fishing’s greatest contribution by far to calendar-year adjusted Turkish GDP typically comes in the third quarter, mostly due to the harvest season, when more than three times as much value is generated than during the first quarter, which is the lowest contributor to agricultural GDP and thus to total Turkish GDP.

24
Figure 11: The seasonality of agricultural GDP by quarter, 2009-2013
0
5 000
10 000
15 000
20 000
25 000
30 000
35 000To
tal
Agr
icul
ture
Tota
l
Agr
icul
ture
Tota
l
Agr
icul
ture
Tota
l
Agr
icul
ture
Tota
l
Agr
icul
ture
2009 2009 2010 2010 2011 2011 2012 2012 2013 2013
thou
sand
TL
Quarter I Quarter II Quarter III Quarter IV
Source: TUIK (2015).
Despite agriculture being a robust contributor to economic growth in Turkey, it is important to note that substantial income disparities still exist between urban and rural areas. For instance, of all the people in Turkey classified by the World Bank as poor, about 74 percent live in rural areas (Figure 12).
Figure 12: Share of rural poverty in selected countries
Source: Authors based on data by World Bank Group (2014b).

Turkey - Water along the food chain
25
This figure shows that, compared to other transforming countries with a comparable share of agricultural GDP to the total, Turkey has one of the highest proportions of rural poverty. It would appear that rural areas in Turkey do not provide opportunities for income generation that would lift more people out of poverty and allow them to participate in overall economic growth.
Employment in Turkish agriculture
In terms of employment, Turkey’s agricultural sector is by far more important than its contribution to GDP would suggest. Figure 13 highlights this importance in terms of the number of people employed in the agricultural sector versus total national employment. Although it contributes less than 10 percent to Turkey’s GDP (see Figure 9), the agricultural sector employs more than 20 percent of the labour force, or about 6 million of the 25 million people employed in 2013 (Figure 13).
Figure 13: Annual employment by sector in thousands of persons, 2004-2013
0
1 000
2 000
3 000
4 000
5 000
6 000
7 000
0
5 000
10 000
15 000
20 000
25 000
30 000
2004 2005 2006 2007 2008 2009 2010 2011 2012 2013*
GD
P p
er w
orke
r, t
hous
and
TL
empl
oym
ent,
tho
usan
ds o
f pe
rson
s
Employment services (left axis)
Employment industry & construction (left axis)Employment agriculture (left axis)GDP/agricultural worker (right axis)
GDP/industrial and construction worker (right axis)
GDP/service worker (right axis)
Source: Results of the labour force survey, TUIK (2015).
Nevertheless, average labour productivity in Turkish agriculture is still substantially lower than in other industrial sectors and the service industry. Figure 13 shows levels of GDP in each subsector of the Turkish economy divided by the corresponding number of employees. For instance, in 2013 the average worker in agriculture generated around TL 1 900 000 to GDP, while

26
the corresponding ratio is around three times higher for the average worker in industry and services.
Furthermore, agricultural jobs in Turkey tend to fluctuate in accordance with seasonal patterns. While previous figures have indicated that agriculture contributes 9-10 percent to Turkish GDP and absorbs 20-25 percent of the labour force, Figure 14 highlights the strong effects of seasonal employment on agriculture in comparison to industrial employment within the country. From the month of April, employment in agriculture begins to rise until its peak in July. At that point, agricultural employment is about one-third higher than in January and February, when agricultural employment is at its lowest. Consequently, the value added to agriculture is highest during the third quarter of the year, as shown in Figure 11.
Figure 14: Monthly employment in agriculture and industry, 2012-2014
0
1 000
2 000
3 000
4 000
5 000
6 000
7 000
num
ber
empl
oyed
Agriculture Industry
Source: Results of the labour force survey, TUIK (2015).
Structure and trends in Turkey’s primary agriculture
The structure of agriculture holdings in Turkey reflects the typical pattern of fairly small-scale family farms, with a relatively high proportion of the land owned by the farmers themselves. For instance, official statistics in Turkey show that in 2012, the share of farmer-owned farms with 10-20 ha of land was around 73 percent, while 55 percent of farmer-owned farms were between 50-100 ha.
According to the OECD (2011), the average farm size in Turkey was estimated to be 6.1 ha in 2006 (for more recent years TUIK was only able to provide relative figures about the distribution of holdings and land). However, in 1991

Turkey - Water along the food chain
27
the average farm size was already 5.8 ha, implying that structural change in Turkish agriculture did not have a notable impact on average farm size, although the total number of agricultural holdings declined from 4 068 000 in 1991 to 3 022 000 in 2006 (OECD, 2011).
Figure 15 shows that farms of 5-10 ha, 10-20 ha and 20-50 ha each cover around 20 percent of Turkey’s agricultural land, and this has only changed slightly between 1991 and 2006. For instance, in 1991, farms of between 20 and 50 ha accounted for 4 percent of total agricultural holdings, and 6.6 percent in 2006. Similarly, their share of total agricultural land in Turkey rose from 20 percent in 1991 to 23.6 percent in 2006.
Figure 15: Number of holdings and their corresponding share of total agricultural land farmed in Turkey, 1991 and 2006
05
101520253035
shar
e of
tot
al
farm size, haHoldings 1991 Land 1991
05
101520253035
shar
e of
tot
al
farm size, haHoldings 2006 Land 2006
Source: Reproduced from OECD (2011, p.20).
Regarding the distribution of land types according to different farm characteristics, Figure 16 details the shares according to holding size in hectares. According to this figure, land under fruits or other permanent crops is mostly farmed by operations of up to 50 ha. Meanwhile cropland based on cereals or other temporary field crops is mostly in the hands of farms up to 5 000 ha, while extremely large farms with more than 5 000 ha tend to have a substantially larger share of permanent meadows and pasture than crop farms.

28
Figure 16: Land use by holding size, 2006
0% 20% 40% 60% 80% 100%
Total
-5
5- 9
10- 19
20- 49
50- 99
100- 199
200- 499
500- 999
1000-2499
2500-4999
5000+
Hol
ding
Siz
e in
Hec
tare
s
Area sownLand under vegetables and flowersLand under fruits, other permanent crops and beverage and spice crops
Poplar- willow groveUnused and undeveloped potentially productive land
Permanent meadow
Pasture
Woodland and forest
Non-agricultural land
Non-agricultural land
Source: TUIK (2015).
Between 2001 and 2014, however, the area used for agriculture declined by more than 5 percent, while land under permanent meadows and pastures as well as the area of fruit and vegetable gardens remained constant. Thus the decline has primarily affected the area used for cereals and other crop products (Figure 17).

Turkey - Water along the food chain
29
Figure 17: Agricultural land use in Turkey
36 500
37 000
37 500
38 000
38 500
39 000
39 500
40 000
40 500
41 000
41 500
0
2 000
4 000
6 000
8 000
10 000
12 000
14 000
16 000
18 000
20 000
2001 2002 2003 2004 2005 2006 2007 2008 2009 2010 2011 2012 2013 2014
tota
l util
ised
agr
icul
tura
l lan
d, t
hous
and
ha
thou
sand
ha
Area of cereals and other crop productsLand under permanent meadows and pasturesFallow land
Area of fruits, beverage and spice crops
Area of vegetable gardens and ornamental plants
Total utilised agricultural land (1 000 ha)
Source: General agricultural censuses, TUIK (2015) for land under permanent meadows and pastures; Ministry of Food, Agriculture and Livestock (2014) for all other.
Furthermore, FAOSTAT data show that the area under cereal crops diminished by 17 percent between 2001 and 2013 (no data for 2014), but in the same period, production rose by 27 percent, with yields experiencing growth of 53 percent. This can be explained by the conversion of less productive land to other purposes, while production intensity has risen through the increased use of variable inputs and improved plant genetics.

30
Figure 18: Number of farm animals by major category, 2011-14
Farmanimals
0
5
10
15
20
25
30
35
40
45
2011 2012 2013 2014
num
ber
of f
arm
ani
mal
s, m
illio
ns
Bovine animals Sheep and goats Others*
0
50
100
150
200
250
2011 2012 2013 2014nu
mbe
r of
far
m a
nim
als,
mill
ions
Laying hens Broilers Others
Source: TUIK (2015).
* Camels, pigs, horses, donkeys and mules, turkeys, geese, ducks.
In terms of the number of heads, Figure 18 shows that only four different types of farm animals feature significantly in Turkey, while the others only have a negligible role in the sector. The number of sheep, goats and broiler chickens is currently growing strongly, while the number of laying hens appears to be steadily increasing, albeit at a slower pace, and the number of bovine animals is either constant or moderately increasing.
Figure 19: Distribution of holdings with bovine animals and distribution of bovine animals by holding size, 2006
0
10
20
30
40
50
60
70
1-4 5-9 10-19 20-49 50-149 150-299 300 +
Sha
re o
f to
tal (
sum
s to
100
%)
Holding size according to number of bovine animals (head)
National distribution of holdings National distribution of bovine animals
Source: TUIK (2015).

Turkey - Water along the food chain
31
With regard to bovine animals, Figure 19 shows that almost 60 percent of farms with this type of animal have no more than four cows or head of cattle. Nevertheless, only 21.6 percent of all bovine animals can be found on this size of farm. In turn, 22.9 percent of all Turkish bovine animals can be found on farms with 20-49 head of cattle, even though this farm size category accounts for only 5-6 percent of the number of farms with animals in Turkey.
Similarly, although 7 percent of Turkish bovine animals can be found on farms with 50-149 head of cattle, this farm category accounts for less than 1 percent of the number of farms with bovine animals.
Figure 20: Fodder crop production, 2011-2014
12
5
3
2
0 0 0
13
4 4
2
10 0 0 0
0
2
4
6
8
10
12
14
16
100
000
ha
2011 2012 2013 2014
Source: TUIK (2015).
The most important fodder crops in Turkey according to the number of hectares planted are alfalfa, maize for silage and cow vetches, while other fodder crops play only a limited or marginal role. This is somewhat surprising given the country’s geographical and agro-climatic diversity. The areas planted with alfalfa and maize have steadily grown over the last three years, while the area of cow vetches appears to be slowly declining (Figure 20).

32
Figure 21: Fodder crop production, 2011-2014
0
2
4
6
8
10
12
14
16
18
20
mill
ion
tonn
es
2011 2012 2013 2014
Source: TUIK (2015).
Note: “Silage maize” = green maize as fodder, “Maize for silage” = green maize stored in a silo.
Figure 21 shows that maize for silage in Turkey is currently experiencing rapid productivity growth: the planted area has increased from 0.31 million to 0.41 million hectares (+32 percent), while the production volume in millions of tonnes has increased from 13.3 million to 18.6 million (+40 percent).
Given that the production volume has increased proportionately more than the expansion in acreage, the additional quantity can largely be explained by rising yields per hectare. These yield increases may be due to the adoption of better plant varieties or the intensification of input use such as fertiliser, pesticides or irrigation water.
Specific policies related to the expansion of maize production are discussed in chapter 4 of this report.
The role of the food processing sector in Turkey
In addition to primary agriculture, it is important to consider the economic role of food processing. The food processing sector in Turkey has experienced rapid growth due to: (i) the country’s vast agricultural potential, (ii) changing lifestyles and preferences as a result of urbanisation, (iii) increases in household income,

Turkey - Water along the food chain
33
and (iv) the availability of affordable, high-quality food-processing machinery manufactured domestically. For instance, in 2012 the manufacturing of food products accounted for around 15 percent of the total production value of Turkish enterprises (TUIK, 2015).
According to the Ministry of Economy (2014), technological advances and increased investment in recent years have increased the potential for the expansion of milling and pastry products, sugar confectionary, chocolate and cocoa products, pasta and biscuits, fishery products, poultry, and packaged water and alcoholic beverages sectors in Turkey’s agrifood processing industry.
Between 2008 and 2013, the Turkish food and beverage market also saw significant growth in the health products segment. The most remarkable growth occurred in natural products (foods contain no added colouring, artificial flavouring or synthetic substances) with a sales volume of TL 8 825 million, followed by functional foods17 (TL 2 469 million), diet products (TL 1 402 million), organic products (TL 163 million) and special food-intolerance products (TL 118 million) (Ministry of Economy, 2014).
The growth in natural products is reflected in the increase of land used for organic farming. Between 2002 and 2010, the agricultural area in Turkey under organic production, according to the Ministry of Agriculture’s definition, increased from 89 thousand hectares to about 510 thousand hectares, or 1.3 percent of the whole Turkish agricultural area (Food, Agriculture and Livestock, 2015). However, the organic agricultural area in Turkey remains small compared with more developed economies – for example Germany devoted 6.2 percent of its land to organic agriculture in 2012.
The existence of a competitive food industry is typically viewed as a precondition for the export of agrifood products at a higher level of processing. Therefore, trade flows are analysed in the following subsection in order to assess the relative export competitiveness of the Turkish agrifood industry across different product categories.
Analysis of Turkey’s trade in agrifood products
An assessment of the productivity and competitiveness of Turkey’s agricultural sector can either be undertaken by analysing structural characteristics and partial measures of productivity, as has partly been done in the previous part of this section, or by analysing corresponding trade patterns. This is because recent advances in theoretical and empirical trade analysis (e.g. literature following the seminal work by Melitz (2003)) have shown that only the most productive companies of each sector in a country will serve the export market, while less productive firms tend only to focus on domestic and regional markets.
17 Functional foods are given an additional function, often related to health promotion, by adding new ingredients or more of their existing ingredients, such as vitamins.

34
The trade patterns of a major agricultural player such as Turkey are difficult to assess due to a wide range of product specifications and export destinations. Obtaining a profile of Turkey’s trade competitiveness in agrifood therefore requires an assessment of exports as well as imports. The difficulty is compounded since trade flows fluctuate from year to year, while the group of trading partners does not necessarily remain constant over time.
For these reasons, the assessment of Turkey’s trade in agrifood products is based on the following indicators, for which more background definitions are provided in the appendix:
• Net trade balance – the difference between exports (X) and imports (M) of a certain product category of the Harmonized System (HS2002 data from Comtrade were used throughout this analysis). The net trade balance indicates the extent to which the production of a certain product is capable overall of satisfying the domestic demand for this product category.
• Trade intensity index (TII) – used to determine whether the value of trade between two countries in a certain product category is greater or smaller than would be expected from their relative importance in world trade. See the appendix for further explanations of this index.
• The share of Turkey’s export value of product category k that goes to destination j in total Turkish export value of k is compared against the TII.
• The normalised revealed comparative advantage (NRCA) index (Yu et al., 2009, 2010) is calculated as an unbiased measure of a country’s comparative advantage in the exports of product k. This index falls into a range from -1 to 1, where 0 indicates the comparative-advantage neutral reference point, and index values >0 (<0) correspond to a comparative advantage (disadvantage) of a certain commodity in comparison with all commodities exported by that country, and total world exports of all commodities (see the appendix for further explanations of this index). The index is solely based on observed trade flows and therefore contains all existing trade distortions and trade costs implicitly. This makes the index especially attractive for realistic assessments of revealed competitiveness; the index is less suitable for derivation of causal explanations about the determinants and sources of competitiveness within a specific sector or country.
The analysis of Turkey’s trade patterns in agrifood therefore begins with Figure 22, which presents the evolution in Turkey’s trade balance in total agrifood products (HS system categories 1-20 aggregated) by major trading partner regions.

Turkey - Water along the food chain
35
Figure 22: Evolution of Turkey’s trade balance in agrifood products according to major trading partner regions
2002
2002
2002
2002
2002
2002
2004
2004
2004
2004 20
04
2004
2006
2006
2006
2006 20
06
2006
2008
2008
2008
2008
2008
2008
2010
2010
2010
2010
2010
2010
2012
2012
2012
2012
2012
2012
2014
2014
2014
2014
2014
-100000
-50000
0
50000
100000
150000
200000
All countries EU27 LDCEastAsiaPacific
LDCEasternEurope
LDCMena LDCSouthAsia
Thou
sand
US
D, n
omin
al
2014
Source: Comtrade (2015).
Starting in 2002, Turkey’s net trade balance in agrifood products with all global regions combined grew rapidly, and was more than twice the 2002 level in 2005, 2006 and 2007. 2008 was the year of the global financial crisis and also saw the outbreak of avian flu in Turkey, and these are reflected in the temporary decline in Turkey’s trade balance. However, the net trade balance was quickly restored to pre-2008 levels and continued to grow, such that 2013 produced the highest agrifood trade surplus so far, which was more than three times higher than Turkish net agrifood exports in 2002.
Nevertheless, the breakdown by region shows highly uneven trade patterns. Figure 22 shows that since 2002 Turkey has always had a net trade deficit with developing countries in the East Asia and Pacific region, with this deficit becoming more pronounced since 2002. Furthermore, Turkey had a slight net trade surplus with the developing countries of Eastern Europe up until 2007, but since Romania and Bulgaria joined the EU this has turned into a deficit. Turkey’s trade deficit with South Asia has also turned from an almost balanced net trade level to a slight deficit since 2012.
In contrast, Turkey’s net trade balance with MENA countries has grown exponentially since 2002, and was even unaffected by the crises of 2008. Only in 2013 and 2014 were there signs of reduced export growth.

36
Finally, Turkey’s trade in agrifood products with EU-27 countries shows a positive net trade balance over the years, although without the dynamic growth seen in its trade with the MENA region. Instead, Turkey’s net trade with the EU seems to be constant at a substantially positive surplus level, but this trade balance is also showing temporary signs of weakness.
Turkey’s net trade patterns with the EU are further analysed in Table 2. The upper part of the table presents the most important traded items according to their share of total Turkish net trade with the EU. In 2002, edible fruits and nuts contributed 52 percent of the net trade surplus; in 2014, this was still the most important category for Turkey, accounting for one-half of its net trade surplus with the EU-27. The second and third largest product categories in 2002 were crop products. However, by 2014, fish ranked third while sugars and sugar confectionary appeared in fifth place, pushing general processed products of animal origin further down the ranking.
Furthermore, the table indicates that the top three traded categories consistently make up more than 85 percent of Turkey’s net trade with the EU. In contrast, in 2014 Turkey had the largest net trade deficit with the EU in the imports of oil seeds and cereals (used for feed and human consumption), together accounting for more than 35 percent of Turkey’s net trade deficit.

Turkey - Water along the food chain
37
Table 2: Turkey’s trade balance with the European Union
EU-27 share of 2002
net agrifood exports
share of 2014 net agrifood
exports
Edible fruit and nuts; peel of citrus 0.528 Edible fruit and nuts; peel
of citrus 0.502
Preparations of vegetable, fruit, nuts 0.246 Preparations of vegetable,
fruit, nuts 0.286
Edible vegetables and certain roots 0.091 Fish & crustacean,
mollusc & other 0.089
Fish & crustacean, mollusc & other 0.036 Edible vegetables and
certain roots 0.064
Products of animal origin, nes 0.022 Sugars and sugar
confectionery 0.032
sum 0.924 sum 0.973
share of 2002 net agrifood
imports
share of 2014 net agrifood
imports
Dairy products; birds’ eggs; natural honey 0.020 Dairy products; birds‘
eggs; natural honey 0.045
Live poultry, i.e. fowls 0.022 Animal/veg fats & oils & their cleavage 0.050
Cocoa and cocoa preparations 0.046 Live bovine animals 0.055
Oilseed, oleagi fruits 0.065 Beverages, spirits and vinegar 0.067
Animal/veg fats & oils & their cleavage 0.072 Cocoa and cocoa
preparations 0.075
Lac; gums, resins & other vegetables 0.084 Miscellaneous edible
preparations 0.115
Residues & waste from food industry 0.096 Residues & waste from
food industry 0.126
Miscellaneous edible preparations 0.287 Cereals 0.148
Cereals 0.303 Oilseed, oleagi fruits 0.217
sum 0.994 sum 0.897
Source: Authors’ data based on Comtrade.
Note: nes=’not elsewhere specified.
For comparison, Turkey’s net trade patterns with the Middle East and North Africa are shown in Table 3. The table shows that the composition of net export products has undergone more changes compared to the composition of the top net export products to the EU. In addition, the composition of products is much more diversified and also comprises processed products based on crops and

38
products of animal origin. This may point to the fact that it is somewhat easier for Turkish food processing firms to match the preferences and import quality standard requirements of countries in this region than those of the EU.
Between 2002 and 2014, Turkey’s net trade deficit with this group of countries also became more concentrated on products of animal origin and vegetable planting materials, while other products became less important.
Table 3: Turkey’s trade balance with the Middle East and North Africa
share of 2002 net agrifood exports
share of 2014 net agrifood exports
Animal/veg fats & oils & their cleavage 0.159 Animal/veg fats & oils &
their cleavage 0.178
Edible vegetables and certain roots 0.142 Preparations of cereal,
flour, starch/milk 0.152
Sheep 0.132 Products milling industry; malt; starches 0.139
Miscellaneous edible preparations 0.112 Dairy products; birds‘
eggs; natural honey 0.095
Preparations of cereal, flour, starch/milk 0.111 Meat and edible offal, of
the poultry 0.093
Edible fruit and nuts; peel of citrus 0.092 Edible fruit and nuts;
peel of citrus 0.085
Cocoa and cocoa preparations 0.067 Cocoa and cocoa
preparations 0.061
Products milling industry; malt; starches
0.064 Preparation of vegetable, fruit, nuts 0.051
Preparation of vegetable, fruit, nuts 0.026 Sugars and sugar
confectionery 0.038
Cereals 0.017 Miscellaneous edible preparations 0.034
sum 0.921 sum 0.925
share of 2002 net imports
share of 2014 net imports
Vegetable plaiting materials 0.013 Other live animals 0.024
Live tree & other plant; bulb, root 0.055 Coffee, tea, matï and
spices 0.024
Products of animal origin, nes 0.279 Vegetable plaiting
materials 0.169
Oilseed, oleagi fruits; miscall. 0.652 Products of animal
origin, nes 0.784
sum 1.000 sum 1.000
Source: Authors based on Comtrade.
Note: nes=’not elsewhere specified.

Turkey - Water along the food chain
39
In general, the net trade balance is an indicator of Turkey’s ability to satisfy domestic and foreign demand in a specific product category. However, this may overlook the fact that specific companies in Turkey can be very competitive at producing for export markets, while not focusing on the domestic Turkish market at all. In other words, looking at net trade alone may understate the export competitiveness of the best Turkish companies in a specific product category.
For this reason, Table 4 presents the TII for all crop-based products exported by Turkey in 2014. In addition, the right panel of the table presents the four countries that received the highest share of Turkey’s exports for each product category. For instance, for cereals, Turkey exported nine times more to Kazakhstan than the average country exported cereals to Kazakhstan, and it exported about 20 times more to Iraq and Syria each. For Palestine, Turkey exported 740 times more than the average grain-trading country typically exported to Palestine.
Thus Turkish exports of cereals are of tremendous importance for Palestine, Iraq and Syria, although these countries do not necessarily receive a major share of Turkey’s total export value in cereals. For example, even though Iraq receives about 22 percent of the Turkish cereal export value, it comes second to Italy in terms of the largest share of exports, and is then followed by the United States and France in third and fourth place respectively, which together receive about 17 percent of Turkey’s grain exports (in value terms).
Table 4: Trade intensity index and the top four partner countries for Turkey’s various crop-based agrifood exports, 2014
description (hs category) Partner name
trade intensity
indexPartner name
share of turkey‘s
exports in same hs category
Cereals
Occup. Palestinian Terr. 74 205.20 Italy 23.0 percent
Syrian Arab Republic 2 279.50 Iraq 21.9 percent
Iraq 2 109.78 United States 9.8 percent
Kazakhstan 934.41 France 7.4 percent
Cocoa and cocoa preparations
Niger 5 903.28 Iraq 16.8 percent
Iraq 5 805.80 Iran, Islamic Rep. 7.2 percent
Syrian Arab Republic 4 987.70 Saudi Arabia 5.3 percent
Somalia 4 898.74 Algeria 5.0 percent

40
description (hs category) Partner name
trade intensity
indexPartner name
share of turkey‘s
exports in same hs category
Coffee, tea, matï and spices
Turkmenistan 1 837.91 United States 14.1 percent
Peru 1 393.53 Germany 10.0 percent
Azerbaijan 981.85 Vietnam 8.3 percent
Equatorial Guinea 909.55 Belgium 6.1 percent
Edible fruit and nuts; peel of citrus fruit or melons
Turkmenistan 1 959.70 Italy 15.3 percent
Iraq 1 341.56 Russian Federation 14.4 percent
Azerbaijan 1 108.53 Germany 11.0 percent
Syrian Arab Republic 891.46 Iraq 6.9 percent
Edible vegetables and certain roots and tubers
Eritrea 4 961.39 Russian Federation 35.5 percent
Georgia 3 411.20 Iraq 8.0 percent
Moldova 2 906.98 Germany 7.0 percent
Turkmenistan 2 330.08 Bulgaria 4.2 percent
Lac; gums, resins & other vegetable saps & extracts
Turkmenistan 6 076.78 Germany 16.0 percent
Azerbaijan 4 102.45 Italy 14.1 percent
Libya 3 569.23 Philippines 7.6 percent
Greece 2 497.72 China 7.3 percent
Live tree & other plant; bulb, root; cut flowers
Turkmenistan 17 317.13 Netherlands 19.3 percent
Afghanistan 16 427.33 Turkmenistan 14.4 percent
Iraq 12 112.72 United Kingdom 13.4 percent
Azerbaijan 3 613.67 Germany 10.9 percent
Oilseed, oleagi fruits; miscellaneous grain, seed, fruit
India 7 742.96 Russian Federation 16.3 percent
Turkmenistan 7 274.57 India 16.0 percent
Azerbaijan 6 420.77 Germany 8.2 percent
Sudan 6 083.03 Ukraine 7.5 percent
Prep of vegetable, fruit, nuts or other parts of plants
Iraq 1 847.66 Germany 26.6 percent
Syrian Arab Republic 1 832.57 Iraq 8.8 percent
Turkmenistan 1 130.19 Netherlands 6.3 percent
Azerbaijan 970.45 United States 5.4 percent

Turkey - Water along the food chain
41
description (hs category) Partner name
trade intensity
indexPartner name
share of turkey‘s
exports in same hs category
Prep of cereal, flour, starch/milk
Syrian Arab Republic 3 354.45 Iraq 21.8 percent
Iraq 2 913.16 Syrian Arab Rep. 8.7 percent
Occup. Palestinian Terr. 2 340.74 Angola 4.5 percent
Benin 2 082.78 Saudi Arabia 4.3 percent
Prod.mill.indust; malt; starches; inulin; wheat gluten
Iraq 1 570.98 Iraq 48.9 percent
Syrian Arab Republic 1 377.82 Syrian Arab Republic 10.1 percent
Sierra Leone 1 223.72 Angola 4.6 percent
Sudan 1 169.43 Philippines 4.6 percent
Sugars and sugar confectionery
U.S. Minor Outlying 3 409.21 Iraq 13.3 percent
Iraq 2 174.03 United States 8.7 percent
Azerbaijan 1 380.92 Netherlands 5.1 percent
Tajikistan 1 143.67 Germany 4.5 percent
Source: Authors’ compilation based on Comtrade.
Note: an index value >100 indicates that Turkey is a more important trading partner than the average trading partner of country j with product x. Note also that Turkey’s free trading zones appear at times as top trading partners in the statistics, but these are not listed as reporters and have therefore been omitted here.
Discrepancies between the top trading partners according to the TII and share of exports in that category can point to the structure of Turkey’s network of trading partners: for most product categories displayed in Table 4, Turkey tends to be an extremely important supplier to neighbouring countries in the Middle East, North Africa and Caucasus regions. However, in many instances these countries do not absorb the largest shares of the total Turkish export value of those product categories. Instead, for most of product categories, the majority of Turkish exports go to high-income markets in Europe or North America or to the Russian Federation.
The same type of analysis is repeated for products of animal origin in Table 5. Again, Turkey appears as a major provider of almost all product categories in this table for neighbouring countries in the MENA and Caucasian regions. In contrast to crop products, however, the bulk of exports often go to a single country in one of these regions.
This implies that Turkish products of animal origin are geographically more concentrated and thus more dependent on demand fluctuations in the MENA

42
region than Turkish crop exports. The table also reveals that few high-income countries are among Turkey’s most important trading partners with regard to primary and processed products of animal origin.
This indicates that Turkey may have difficulties entering high-income markets (which are typically also markets with high quality standards), while at the same time it does not appear to be providing these products at such a low cost that it could competitively serve distant countries geographically.
Table 5: Trade intensity index and top four partner countries for different Turkey’s animal-based agrifood exports, 2014 (HS1-20)
description (hs category) Partner name trade intensity
indexPartner
name
share of turkey‘s exports
in same hs category
Animal/veg fats & oils & their cleavage products
Iraq 5 820.76 Iraq 51.5 percent
Syrian Arab Republic 5 380.67 Syrian Arab
Republic 18.1 percent
Occupied Palestinian
Territory2 242.15 Lebanon 2.9 percent
Chad 2 200.59 Iran, Islamic Rep. 1.8 percent
Dairy prod; birds‘ eggs; natural honey
Iraq 5 796.45 Iraq 55.4 percent
Syrian Arab Republic 4 194.30 Saudi Arabia 7.5 percent
Israel 2 155.06 Syrian Arab Republic 4.9 percent
Azerbaijan 1 728.00 Azerbaijan 3.6 percent
Edible offal of bovine animals, swine, sheep, goat
Saudi Arabia 1 113.72 Hong Kong, China 82.5 percent
Hong Kong, China 422.07 Vietnam 11.6 percent
Vietnam 243.34 Saudi Arabia 3.5 percent
Afghanistan 138.35 China 1.3 percent
Fish & crustacean, mollusc & other aquatic invertebrates
Iraq 13 212.40 Netherlands 21.0 percent
Syrian Arab Republic 11 049.21 Germany 11.8 percent
Libya 7 845.91 Italy 9.8 percent
Lebanon 5 628.81 Russian Federation 8.9 percent
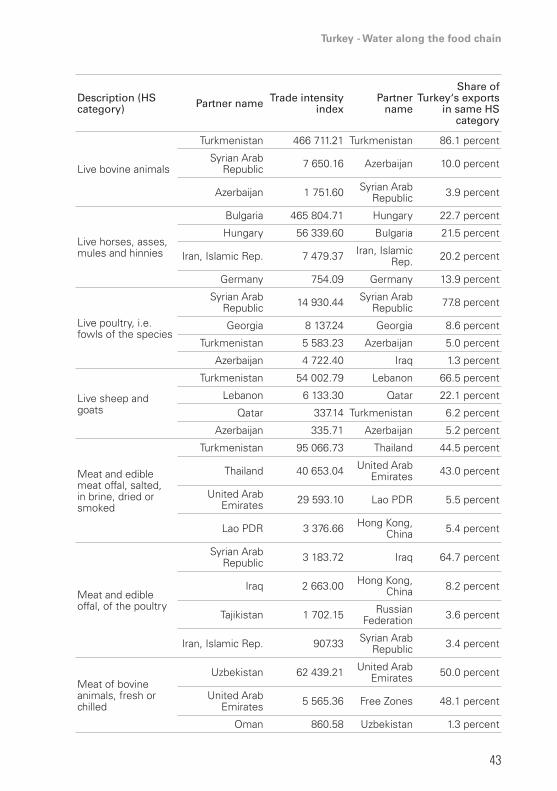
Turkey - Water along the food chain
43
description (hs category) Partner name trade intensity
indexPartner
name
share of turkey‘s exports
in same hs category
Live bovine animals
Turkmenistan 466 711.21 Turkmenistan 86.1 percent
Syrian Arab Republic 7 650.16 Azerbaijan 10.0 percent
Azerbaijan 1 751.60 Syrian Arab Republic 3.9 percent
Live horses, asses, mules and hinnies
Bulgaria 465 804.71 Hungary 22.7 percent
Hungary 56 339.60 Bulgaria 21.5 percent
Iran, Islamic Rep. 7 479.37 Iran, Islamic Rep. 20.2 percent
Germany 754.09 Germany 13.9 percent
Live poultry, i.e. fowls of the species
Syrian Arab Republic 14 930.44 Syrian Arab
Republic 77.8 percent
Georgia 8 137.24 Georgia 8.6 percent
Turkmenistan 5 583.23 Azerbaijan 5.0 percent
Azerbaijan 4 722.40 Iraq 1.3 percent
Live sheep and goats
Turkmenistan 54 002.79 Lebanon 66.5 percent
Lebanon 6 133.30 Qatar 22.1 percent
Qatar 337.14 Turkmenistan 6.2 percent
Azerbaijan 335.71 Azerbaijan 5.2 percent
Meat and edible meat offal, salted, in brine, dried or smoked
Turkmenistan 95 066.73 Thailand 44.5 percent
Thailand 40 653.04 United Arab Emirates 43.0 percent
United Arab Emirates 29 593.10 Lao PDR 5.5 percent
Lao PDR 3 376.66 Hong Kong, China 5.4 percent
Meat and edible offal, of the poultry
Syrian Arab Republic 3 183.72 Iraq 64.7 percent
Iraq 2 663.00 Hong Kong, China 8.2 percent
Tajikistan 1 702.15 Russian Federation 3.6 percent
Iran, Islamic Rep. 907.33 Syrian Arab Republic 3.4 percent
Meat of bovine animals, fresh or chilled
Uzbekistan 62 439.21 United Arab Emirates 50.0 percent
United Arab Emirates 5 565.36 Free Zones 48.1 percent
Oman 860.58 Uzbekistan 1.3 percent

44
description (hs category) Partner name trade intensity
indexPartner
name
share of turkey‘s exports
in same hs category
Meat of bovine animals, frozen
Afghanistan 237 755.52 Afghanistan 71.8 percent
Turkmenistan 5 299.15 Free Zones 16.0 percent
United Arab Emirates 39.67 Turkmenistan 11.9 percent
Meat of sheep or goats, fresh, chilled or frozen
Uzbekistan 13 517 835.53 Afghanistan 57.7 percent
Afghanistan 172 505.21 United Arab Emirates 32.7 percent
Oman 812.90 Oman 5.0 percent
United Arab Emirates 746.17 Free Zones 3.9 percent
Other live animals
Albania 26 121.20 France 22.0 percent
Azerbaijan 19 997.03 Albania 21.3 percent
Turkmenistan 7 382.01 Italy 20.4 percent
Syrian Arab Republic 2 072.28 Belgium 14.3 percent
Other meat and edible meat offal, fresh, chilled
Iraq 34 387.39 Italy 51.7 percent
Italy 1 472.55 France 41.6 percent
France 446.87 Switzerland 5.1 percent
Switzerland 77.93 Iraq 1.6 percent
Prep of meat, fish or crustaceans, molluscs etc
Iraq 15 166.60 Iraq 21.3 percent
Azerbaijan 6 361.53 Italy 16.8 percent
Syrian Arab Republic 4 277.81 France 7.7 percent
Afghanistan 3 516.68 Hong Kong, China 5.1 percent
Products of animal origin, nes or included
Syrian Arab Republic 4 010.63 Germany 44.9 percent
Azerbaijan 3 913.82 Denmark 9.1 percent
Mali 3 459.25 Austria 9.1 percent
Macedonia, FYR 2 994.91 France 7.5 percent
Source: Authors’ compilation based on Comtrade.
Note: Turkey’s free trading zones partly appear as top trading partners in the statistics, but these are not listed as reporters and have therefore been omitted unless no other categories were mentioned in the Comtrade statistics; nes: not elsewhere specified.
The findings from the previous analysis on net exports and trade intensity are also reflected in the comparative advantage of different agrifood products within Turkey’s overall export portfolio.

Turkey - Water along the food chain
45
Figure 23: Normalised revealed comparative advantage index, trend projected for 2015 based on the years 2007-2014
-0.04 -0.02 0.00 0.02 0.04 0.06 0.08 0.10 0.12
Food wastes and prepared animal feedSheep, live
Residues of starch manufactureMeat of bovine animals, frozen
Poultry, live (i.e. fowls)Meat of sheep, fresh/chilled
Meat of goats, fresh, chilled/frozenHay and fodder, green or dry
Coffee, tea, cocoa, spicesGoats, live
Cheese and curdBovine animals, live
Butter and other fats and oilsMeat of bovine animals, fresh or chilled
Fruit juices (including grape must)Live animals, n.e.s.
Edible offal of bovine animals, frozenBeverages and tobacco
Bran, sharps and other residuesMeat and edible meat offal, fresh
Meat and edible meat offal, preparedMilk and cream and milk products
Sugars, sugar preparations and honeyFruit, preserved, and fruit preps
Birds' eggs, in shell, fresh, preservedFish (not marine mammals), crustace
Meat and edible offal of the poultryVegetables, roots and tubers, prepared
Vegetables, fresh, chilled, frozenMiscellaneous edible products
Cereals and cereal preparationsFruit and nuts (not including oil)
Source: Authors’ compilation based on SITC rev. 4 nomenclature.
Note: all products are abbreviated categories or sub categories of this nomenclature and do not overlap. The following HS categories for which the NRCA is zero are not displayed: birds’ eggs, not in shell, and egg; edible offal of bovine animals, fresh; meat and edible meat offal, salted; oil-cake and other solid residues; egg albumin; meat of sheep, frozen; edible offal of sheep, goats, horse; flours, meals and pellets, of meat; horses, asses, mules & hinnies; edible offal of sheep, goats, horse; nes: not elsewhere specified.
Figure 23 shows the results of a linear trend extrapolation from computed NRCA indices for the years 2007 to 2014. Given the consistency of this index across time and products, a linear trend is more adequate for summarising the information over time than a simple average. For instance, just looking at the average may not indicate whether a product has been gaining or losing comparative advantage relative to others over time.
Figure 23 therefore presents the comparative advantage of each major product category anticipated for 2015, based on the corresponding trend over the past

46
seven years. This figure indicates a fairly clear overall picture about the relative strengths of Turkey’s agricultural exports.
The top five categories according to revealed comparative advantage all refer to high-value crop products. The sixth strongest category is poultry meat, followed by fish.
In contrast, the largest comparative disadvantages of all primary and processed agrifood products exported by Turkey appear to be for animal feed, starch residues (which are often used as feed ingredients), live sheep and the frozen meat of bovine animals. These product categories and the corresponding trade patterns and sources of comparative advantage are further analysed in the red meat case study in chapter 4.
Water use in agriculture in Turkey: Past evolution and trends
Key findings:
• Primary agriculture is a major consumer of water in Turkey, with irrigation by far the single most important issue in this respect.
• In terms of the production value generated from irrigation water, fruit and vegetables and other permanent cultures provide the highest gain in revenue.
• However, the largest single share of crops in all irrigated agricultural land in Turkey is currently maize (silage), followed by cereals and cotton.
• In terms of the blue water footprint per unit of output and total irrigation water consumption, cotton is the crop that consumes the most water in Turkey.
• With regard to the blue water footprint of products of animal origin, average figures for most product categories in Turkey are higher than world average figures. This indicates that these products tend to be produced in Turkey with a higher blue water consumption per tonne of output than the world average would suggest is necessary.
The structure and trends of agricultural water consumption in Turkey
In Turkey, about 25 percent of all agricultural land is irrigated. However, Figure 24 shows that the proportion of irrigated land varies widely according to the type of crop that is grown. In particular, more than 70 percent of the land used for vegetable and flower production is irrigated, followed by almost 60 percent of the land allocated to poplar-willow production. Permanent meadows and pasture lands have the third highest intensity of irrigated land, although less than 30 percent of the land used for permanent cultures and fruit plantations is irrigated in Turkey.
Figure 24 provides information about the proportion of land allocated to each type of irrigated crop. However, the figure does not contain information about the share of total irrigated land that each crop absorbs. Figure 25 shows these proportions for 2013. The total irrigated land area corresponding to this figure is equivalent to the proportion of irrigated land of Turkey’s total agricultural land

Turkey - Water along the food chain
47
in 2013. For comparison, Figure 24 shows that in 2006 this proportion was 25 percent.
Figure 25 reveals that in 2013, about 60 percent of Turkey’s total irrigated land was allocated to the four crops of cotton, cereals, sugar beet and maize. Within this, the largest single share -- with almost one-quarter of Turkey’s irrigated land surface -- was maize.
Figure 24: Irrigated and non-irrigated land by land use
0% 10% 20% 30% 40% 50% 60% 70% 80% 90% 100%
Total land
Area sown
Land under vegetables and flowers (including land under seedlings
and land under protective cover)
Land under fruits, other permanent crops and beverage and spice
crops (including land under nurseries and land under protective cover)
Poplar-willow grove
Unused and undeveloped potentially productive land
Permanent meadow
Other: fallow, pasture, woodland and forest, non-agricultural land
Irrigated land Non-irrigated land
Source: TUIK (2015).

48
Figure 25: Share of irrigated land use by crop type, 2013
Rice3%
Legume2% Sunflower
4%
Cotton16%
Cereals15%
Maize24%
Sugar beet5%
Vegetables5%
Fruits7%
Citrus3%
Forage crops5%
Pastures1%
Other crops10%
Source: DSİ Foreign Relation Office (2014, p.75).
The introduction of irrigation to these crops has had a tremendous impact on production quantities per hectare and consequently, depending on market prices, on the revenue that can be generated from one unit of land. For selected output prices, this is illustrated in Table 6, based on a sample of governmental irrigation projects: pre-irrigation yields are displayed in kilograms per decare, and are contrasted with average yields after the introduction of irrigation schemes. On the right-hand side of the table under the column for production value, these yields are multiplied by the assumed unit prices given in the first column.

Turkey - Water along the food chain
49
Table 6: Average yield and production increase in irrigation operated by DSİ (in terms of water management)
Plant Yield Production value (tl/da)
unit price (tl/kg)
Before the project (kg/
da)
Present situation:
yield under irrigation
scheme (kg/da)
Before the project (tl/da)
Present situation: yield
under irrigation scheme (tl/da)
Cereals 0.65 177 441 115.05 286.7
Cotton 1.51 128 500 193.28 755
Corn 0.63 199 1 185 125.37 746.6
Sugar beet 0.14 3 123 6 272 437.22 878.1
Fruit 0.9 1 053 2 521 947.7 2 268.9
Vegetables 0.52 1 488 4 104 773.76 1 937
Forage crops 0.44 476 1 352 209.44 541.6
Source: DSİ statistic website.
Note: No years are given in the source.
In Figure 26, the gains in output kilograms per unit of land and the corresponding gain in monetary production value are expressed as the percentage difference between the non-irrigated production scheme and the irrigation scheme. Yield growth rates in maize have been added to the figure based on data from TUIK (2015) about the average yield of maize from non-irrigated versus irrigated production systems.

50
Figure 26: Average increase in production quantity and value per hectare due to the adoption of irrigation
0
200
400
600
800
1 000
1 200
1 400
Cereals Maize Corn Sugar beet Fruit Vegetables Forage crops
perc
ent
Average yield growth rate Average production value growth rate (TL/da)
Source: DSİ (2015).
Figure 26 highlights that, because of the high-value nature of some crops (in particular fruit and vegetables), physical yield gains due to the adoption of irrigation schemes may provide an incomplete and biased picture of the value added of irrigation water in crop production.
Figure 26 indicates that in the case of fruit and vegetables, despite rather moderate percentage growth rates in yields, tremendous gains in total output value can be achieved through irrigation measures. In contrast, the additional value generated from irrigation water use in cereal and forage crop production is only a fraction per hectare of these high-value crops. In the case of cotton and sugar beet, gains in production value per hectare are higher than for cereals and forage crops, but not as high as for fruit and vegetables.
However, it should be mentioned that Table 6 and Figure 26 only show total effects per unit of land – the data do not take into account the water consumption per unit of land for different crops. This is potentially problematic because one hectare of fruit plantations may consume substantially more water than one hectare of cereals. Therefore, it is necessary to consider total water consumption and irrigation water consumption in terms of cubic metres per

Turkey - Water along the food chain
51
unit of agricultural output as well. For such assessments, the concept of water footprints is widely used.
Assessing agricultural water consumption: The water footprint
In order to determine the role of water in the agrifood industry, the definition of water footprint developed by Hoekstra (2003) is used in this section wherein the water footprint of an individual, a community or a business is defined as the total volume of freshwater used to produce the goods and services consumed by that individual, community or business. Water use is measured in terms of water volume consumed (evaporated or incorporated into a product) and/or polluted per unit of time. A water footprint can be calculated for a particular product, for any well-defined group of consumers (for example an individual, family, village, city, province, state or nation) or producers (for example a public organization, private enterprise or economic sector). The water footprint is a geographically explicit indicator, showing not only volumes of water use and pollution, but also the locations. A water footprint can be divided into three parts: the blue water footprint, green water footprint and grey water footprint.
The blue water footprint refers to the volume of surface and groundwater consumed as a result of the production of a good or service. Consumption refers to the volume of freshwater used and then evaporated or incorporated into a product. It also includes water abstracted from surface water or groundwater in a catchment and returned to another catchment or the sea. It is the amount of water abstracted from groundwater or surface water that does not return to the catchment from which it was withdrawn.
The green water footprint is the volume of rainwater consumed during the production process. This is particularly relevant for agricultural and forestry products (products based on crops or wood), where it refers to the total rainwater evapotranspiration (from fields and plantations) plus the water incorporated into the harvested crop or wood.
Finally, the grey water footprint is an indicator of freshwater pollution that can be associated with the production of a product along its entire supply chain. It is defined as the volume of freshwater that is required to assimilate the load of pollutants based on natural background concentrations and existing ambient water quality standards. It is calculated as the volume of water that is required to dilute pollutants to such an extent that the quality of the water remains above agreed water quality standards18.
18 Further detailed information about water footprints, their calculation and their assessment for different products in different countries can be found in Mekonnen and Hoekstra (2010).

52
Table 7: Blue water footprint of crops in Turkey: Top 20 water-consuming crops
top 20 water consumers according to total water usage in turkey
average world
footprint (m3/
tonne)
turkey footprint
(m3/tonne)
Water usage (km3)
turkey
top 20 water consumers
according to water
footprint per output unit (blue water
footprint)
average world
footprint (m3/
tonne)
turkey footprint
(m3/tonne)
Water usage (km3)
turkey
1 Seed cotton 1 306 2 330 6.01 Cotton lint 2 955 5 271 5.03
2 Cotton lint 2 955 5 271 5.03 Seed cotton 1 306 2 330 6.01
3 Wheat 342 130 2.83Anise, badian,
fennel, coriander
1 825 2 040 0.03
4 Sugar beet 26 88 1.42 Sesame seed 509 1 858 0.03
5 Cottonseed 432 771 1.18 Linseed 268 1 637 0.00
6 Maize 81 208 0.87 Kiwi fruit 168 1 326 0.04
7 Rice, paddy 341 885 0.80 Groundnuts, with shell 150 1 245 0.11
8 Tomatoes 63 56 0.62 Tobacco, unmanufactured 205 1 203 0.05
9 Other melons 74 326 0.54 Spices, nes 242 1 111 0.13
10 Olives 499 270 0.47 Mixed grain 33 1 023 0.00
11 Potatoes 33 76 0.35 Rice, paddy 341 885 0.80
12 Sunflower seed 148 260 0.35 Chestnuts 174 786 0.05
13 Hazelnuts, with shell 1 090 773 0.33 Hazelnuts, with
shell 1 090 773 0.33
14 Oranges 110 116 0.20 Cottonseed 432 771 1.18
15 Figs 1 544 752 0.20 Figs 1 544 752 0.20
16 Apples 133 71 0.19 Pistachios 7 602 744 0.08
17 Onions, dry 88 88 0.19 Tea 898 735 0.16
18Chillies and peppers, green
42 92 0.18 Asparagus 119 627 0.00
19 Tea 898 735 0.16 Walnuts, with shell 1 299 566 0.10
20 Lentils 489 373 0.15 Chillies and peppers, dry 1125 547 0.01
Source: Authors based on data by Hoekstra et al. (2011).
Note: nes: not elsewhere specified.

Turkey - Water along the food chain
53
Table 7 shows the blue water footprint for selected crop products in Turkey. Crops in this table have been selected based on the following procedure: first, the top 20 crops according to total water consumption in Turkey were listed and second, the top 20 crops according to the blue water footprint per cubic meter in Turkey were also listed. While the first group of crops gives the major water consumers according to current crop production patterns, the second group gives the most demanding water consumers per tonne of output. An expression per dollar value of output would perhaps be more meaningful in this context if domestic prices were not distorted (see chapter 3); however, several crops appear in both categories. These crops constitute the most water-intense crops overall in Turkey, namely cotton, cottonseed and tea.
The table also shows that wheat has one of the highest footprints in total, but as wheat and other cereals are mainly rain-fed in Turkey, the amount of blue water per hectare is low and is therefore excluded from the table. As indicated above, irrigated maize is one of the major crops to use irrigation water. Although the blue water per tonne of production does not place it among the top 20, maize turns out to be one of the major crops when considering total irrigation water consumption in Turkey.
Table 8: Water footprint of livestock and processed livestock products in Turkey and the world for different production systems
Product description (hs)
FootprintWorld
weighted average
turkey grazing
turkey mixed
turkey industrial
turkeyweighted
average
avg. world minus
avg. turkey
Bovine, live pure-bred breeding
Blue 256 316 330 650 369 -113
Green 7 002 10 596 7 318 5 690 8 383 -1 381
Grey 219 268 257 642 313 -94
Bovine carcasses and half carcasses, fresh or chilled
Blue 389 537 560 1 088 627 -238
Green 10 234 17 502 12 088 9 399 13 910 -3 676
Grey 320 443 425 1 061 519 -199
Bovine cuts boneless, frozen
Blue 550 759 792 1 536 886 -336
Green 14 414 24 650 17 025 13 239 19 591 -5 177
Grey 451 623 599 1 494 731 -280
Bovine meat and meat offal nes
Blue 660 810 845 1 639 942 -282
Green 17 388 26 311 18 172 14 131 20 817 -3 429
Grey 544 665 639 1 595 777 -233

54
Product description (hs)
FootprintWorld
weighted average
turkey grazing
turkey mixed
turkey industrial
turkeyweighted
average
avg. world minus
avg. turkey
Sheep, live
Blue 207 156 191 277 196 11
Green 4 278 5 510 2 920 1 540 3 750 528
Grey 33 17 34 129 47 -14
Sheep cuts, boneless, fresh or chilled
Blue 522 439 526 743 544 -22
Green 9 813 13 834 7 332 3 867 9 459 354
Grey 76 42 86 323 119 -43
Milk and cream powder sweetened exceeding 1.5% fat
Blue 408 670 544 0 550 -142
Green 4 011 6 558 4 100 0 4 233 -222
Grey 336 617 467 0 475 -139
Butter
Blue 465 772 625 0 632 -167
Green 4 695 7 675 4 799 0 4 954 -260
Grey 393 722 547 0 556 -163
Cheese, fresh (including whey cheese)
Blue 266 442 357 0 362 -95
Green 2 687 4 392 2 746 0 2 835 -149
Grey 225 413 313 0 318 -93
Cheese processed, not grated or powdered
Blue 439 718 583 0 590 -151
Green 4 264 6 972 4 359 0 4 500 -236
Grey 357 656 496 0 505 -148
Whey whether or not concentrated or sweetened
Blue 54 90 73 0 74 -19
Green 547 894 559 0 577 -30
Grey 46 84 64 0 65 -19
Dom. fowl, duck, goose & guinea fowl meat & meat offal
Blue 313 844 406 209 485 -172
Green 3 545 8 612 3 993 2 001 4 856 -1 310
Grey 467 894 415 208 504 -37
Eggs, bird, in shell, fresh, preserved or cooked
Blue 244 801 482 250 353 -109
Green 2 592 8 078 4 806 2 430 3 479 -887
Grey 429 861 512 259 371 58
Eggs, bird, not in shell, dried
Blue 375 1 201 728 385 537 -161
Green 3 840 11 968 7 121 3 601 5 155 -1 315
Grey 635 1 276 759 384 550 85
Source: Authors based on data by Hoekstra et al. (2011).

Turkey - Water along the food chain
55
The water footprints for livestock and processed products of animal origin in Table 8 show that milk has the highest water footprint, followed by meat. Specifically, the “green” water footprint is high for meat production due to the water intensity associated with maintaining meadows, residue fields and crop stubble. However, as these plots do not provide enough feed, fodder crops from irrigated areas are also used, which increases the “blue” water footprint.
Assessing water consumption in the Turkish agrifood processing industry
The Turkish agrifood industry is a major water consumer. Table 9 shows water consumption in the agrifood processing industry in comparison with all other manufacturing industries. Indeed, in 2008, all manufacturing industries in Turkey combined had a water consumption that amounted to just 3.8 percent of the irrigation water consumption for primary agriculture. In contrast, the agrifood processing industry consumes less than 1 percent of the water used in primary agriculture on irrigation.
Table 9: Water consumption in the agrifood industry compared to other industries, 2004 and 2008 (million m3)
sector 2004 2008saving 1% irrigation water in 2008 would
be equivalent to
Irrigation water for primary agriculture Not available 34 000 340 million m3
All manufacturing industries 1 215 1 312 25.9%
Agrifood industries (excluding primary agriculture) 132 117 290.6%
Agrifood industries x 100All manufacturing industries
10.8% 8.9%
Agrifood industries x 100Irrigation in primary agriculture 0.34%
All manufacturing industries x 100Irrigation in primary agriculture 3.86%
Source: TUIK (2015); DSİ (2009, p.17).
However, due to low irrigation efficiency, much of the agricultural irrigation water is returned to the ecological system, while water used for food processing may re-enter the environment in a substantially polluted condition. For this reason, water savings in the agrifood processing industry may be worth considering in detail to improve efficiency and reduce costs as well as waste.
Nevertheless, the role of water-related technologies in the food chain and the corresponding potential for more efficient water usage are less straightforward

56
to understand than in primary agriculture. This is because processing technologies typically involve many different tasks as well as different types of production technologies and processes, which may vary based on the size, scope and age of the operation.
Typical water-consuming industrial tasks in the agrifood and beverage processing industry are listed in Table 10. Some of these tasks, however, may not even apply when comparing two different production processes for one and the same type of output. Instead, it is necessary to investigate industrial water saving potentials based on case studies and through benchmarking relative to other firms and related industries.
Table 11 presents a selection from a wide range of food and beverage industry benchmark indicators related to water consumption for different tasks. These benchmark indicators have been collected from an extensive literature review by the IFC Food Processing Benchmark Tool (2015). Table 11 presents a random selection of reported values from this database. The only selection criteria were products that are potentially relevant for Turkey and measures that relate to average water consumption throughout the entire production process in order to facilitate approximate comparisons.
Table 10: Examples of key water using processes in the food and drink industry
Product preparation Processing Preservation Packing equipment
cleaning site utilities
WashingCleaningPeelingCutting
MixingSteaming
Pumping and transferring
Freezing Heating Boiling
CanningBottling
Cleaning in place
Rinsing Washing
Site maintenance
Vehicle washingStaff facilities
Source: AEA (2007).
The values in Table 11 should be interpreted with care and do not necessarily imply best practice values. Instead, the documentation accompanying the IFC Food Processing Benchmark Tool (2015) insists that case studies are necessary in every instance before conclusions are drawn between an industry’s water efficiency in certain production processes and tasks and a corresponding benchmarking value.

Turkey - Water along the food chain
57
Table 11: Water consumption in the food industry, averaged across the entire production process; selected values from the literature according to the IFC Food Processing Benchmarking Tool
subsector segment Value low
Value high Benchmark unit region/
country
Bakeries and pasta processing
Dry pasta 22 30 m³/t of pasta Not specified
Fruit and vegetables processing
Canned fruit 10.86 m³/t raw material USA
Canned tomatoes 6 8 m³/t of product Italy
Canned vegetables 22.91 m³/t raw material USA
Fruit and vegetable processing 11 23 m³/t of product Not specified
Olive oil 0.33 0.35 m³/t product Not specified
Rapeseed crude oil product 7 12 m³/m³ crude oil Not specified
Refined oil production 10 12 m³ wastewater /t rapeseed Not specified
Meat processing
Meat and poultry 10 25 m³/t of raw material Europe
Rendering 1 000 1 500 l/t raw material Germany
Slaughterhouses, cattle 1 623 9 000 l/t cattle carcass Not specified
Slaughterhouses, pig 1 600 6 000 l/t pig carcass Not specified
Slaughterhouses, sheep 5 556 8 333 l/t sheep carcass Not specified

58
subsector segment Value low
Value high Benchmark unit region/
country
Milk processing
Cheese 0.7 60 l/kg of product Europe
Cheese 300 m³/t Europe
Ice cream 10 325 l/kg prod. ice-cream Scandinavia
Ice cream 2.7 7.8 l/kg of product Europe
Market milk 0.6 1.8 l/l received milk Not specified
Market milk and yoghurt 0.9 25 l/kg of product Europe
Milk 1.3 2.5 l/kg of milk intake Europe
Milk and whey powder 0.4 60 l/kg of product Europe
Milk Powder 0.8 1.7 l/l received milk Not specified
Milk powder 0.5 m³/t product Germany
Milk powder 0.04 m³/t raw milk Germany
Sugar (beet)
0.53 1.1 m³/t beet processed Denmark
3.73 6.98 m³/t sugar produced Denmark
Source: IFC Food Processing Benchmark Tool (2015).
Note: selected values are from the literature according to the IFC Food Processing Benchmarking Tool.

Turkey - Water along the food chain
59
Box 1: Case study: Production capacity increase in a Turkish dairy plant
Subject: Planning water usage for an employment increase from 40 to 45 workers in a dairy product manufacturing facility (80 tonnes/day).
Water consumption in this operation is due to the drinking/service water needs of staff as well as the cleaning of the milk processing unit (boiler and washing water, floor cleaning) and irrigation processes. Recycled cooling water in a closed system also contributes to water usage.
Based on the assumption of a per capita water consumption totalling 190 litres/day, or the daily amount of water required for the staff’s drinking/cleaning needs during an eight-hour working day (Ministry of Environment and Urban Planning, 2015), the operating facility’s daily need for water is (0.190 m3 / person / day * 40 persons) / 24 / 8 = 2.53 m3.
As a result of the increase in the facility’s capacity, the amount of water needed for 45 people per day would be (0.190 m3 / person / day * 45 persons) / 24 / 8 = 2.85 m3.
Within the context of the activities performed there, the drinking water needs of the staff are met by water supply facilities, while service water needed for cleaning purposes is provided and will continue to be provided by the well available in the facility area. Regular cleaning will be required within the scope of their activities. Water usage will also include the washing process involved in cleaning tanks and vessels and floor cleaning. The amount of water required by the cleaning process in outlined in Table 12.
Table 12: Case study: Water in a dairy processing plant
task Water demand in m3/day
Milk reception 3
Cleaning the pasteurisation unit 3
White cheese manufacturing 8
Other cleaning operations 3
total 17 m3/day or 0.21 m3/tonne
Within the milk processing operation, water will also be used to cool the milk. This amount of water will be supplied from wells located directly within the boundaries of the establishment. Cooling water used in the closed system will be recycled and, if there is any decrease, more water will be added, amounting to less than 1 m3 per month. Thus, wastewater would be reused, thereby minimising cooling water usage.
When comparing the water consumption values in Table 12 per tonne of milk output against the benchmark values in Table 11, the values for the Turkish plant appear to be within the lower range of similar industries in Europe in terms of water intensity. Indeed, there is no evidence that the Turkish dairy processing technology would be substantially more water intensive than the typical benchmark values.
Source: Sütas (2013), Ministry of Environment and Urban Planning (2015).

60
Water saving technologies in Turkey’s food chains
Key findings:
• Most of the water savings by far in absolute terms can be achieved by improving the efficiency of Turkey’s irrigation infrastructure and current irrigation practices among farmers.
• Besides the need for technical investment, two governance issues are crucial, namely appropriate pricing of water and stricter control of informal groundwater extraction from unlicensed wells.
• Water consumption in the food processing industry varies widely by location and state of the technology, but typically does not constitute a major share of the processing cost.
• The largest and most modern food processing firms in Turkey operate in line with international benchmark figures for water consumption per unit of output.
• Smaller and more traditional companies tend to use less water per unit of output, mainly because of cleaning and cooling practices that deviate from industrial standards.
• Potential investments to modernise Turkey’s food processing chains might therefore imply slightly higher water consumption due to higher standards.
• However, if small enterprises fail to see the link between water efficiency and energy efficiency, improved production processes would probably still be more resource efficient overall.
This section aims to identify the role and potential of water saving technologies along Turkey’s food chains. For this purpose, both primary agriculture and food processing are considered. However, rather than presenting the issue of water savings exclusively as a technical problem, water and wastewater governance are included in the analysis in order to assess the role that appropriate economic incentives may play in water conservation along Turkey’s agrifood chains.
Water saving technologies in primary agriculture: A problem of irrigation infrastructure
For an irrigation-intensive country such as Turkey, aggregate water savings in primary agriculture will primarily be generated through more efficient irrigation techniques (see Table 9). According to interviews conducted with government officials in January 2015, water savings of approximately 10 percent in crop production would be equivalent to saving the entire water usage of the remaining agrifood industry. This argument is confirmed by the rule-of-thumb calculations in Table 9.
Major challenges presented by Turkey’s irrigation systems include:
(i) Widespread use of traditional irrigation techniques. The use of water saving irrigation techniques remains limited in Turkey. Surface gravity systems (flood, furrow or basin) are still prevalent. An evaluation conducted by DSİ in 2012

Turkey - Water along the food chain
61
on about 2 million ha of irrigation infrastructure constructed by the agency indicates that the proportion of irrigated area under surface gravity systems is as high as 97 percent. In the remaining 3 percent, pressurised systems (sprinkler and drip) are used. The agency also reports that of the 3.4 million ha of land irrigated by DSİ countrywide, drip irrigation is used on just 9 percent.
(ii) Outdated water conveyance systems. In Turkey, the majority of the main canals are open, concrete and trapezoidal in shape. The secondary and tertiary systems are concrete-lined canals or low-pressure pipes. For on-farm distribution, highly inefficient earth canals are still used on smaller holdings. Under these systems, water is transported without protection from immediate diffusion into the ground. The DSİ’s 2004 data revealed that 77 percent of the DSİ irrigation areas had the classic, open canal system with high share of evaporation. The 2013 data indicated that the area under classic canal system had reduced to 39 percent, while the areas under canalettes and pipes were 44 percent and 17 percent of the total, respectively. Despite increased efforts in the past decade, it is obvious that the water conveyance efficiency of the whole irrigation system in Turkey is still low.
(iii) Low irrigation ratio. The irrigation ratio is the ratio of the area actually irrigated to the area covered by the irrigation system. In DSİ irrigations, the average irrigation ratio is reported to be 65 percent on average. At first glance, a low irrigation ratio seems to imply a reduced demand for irrigation water and may signal water conservation. However, according to information provided by the General Directorate of Agrarian Reform (GDAR, 2014), 25 percent of farmers with a low irrigation ratio claim social and economic issues, while 15 percent report problems with an insufficient or poorly maintained irrigation infrastructure and a lack of water. The remaining 60 percent of cases under which actual irrigation is below the available irrigation area are mostly explained by perceived sufficient precipitation, an intention to leave land idle or other alternative land use reasons.
(iv) Low irrigation efficiency. Irrigation efficiency is the share of irrigation water that reaches the plant relative to the initial amount of irrigation water that has been disbursed. In Turkey, DSİ reports the average irrigation efficiency to be 45 percent. However, this rate may depend on regional conditions, and can therefore range from 30 percent to 95 percent. Furthermore, it has to be divided into distribution efficiency, which refers to losses during water transport to the field; and field application efficiency, which may vary according to the actual irrigation system in use. Common ranges for these types of efficiency are displayed in Table 13.
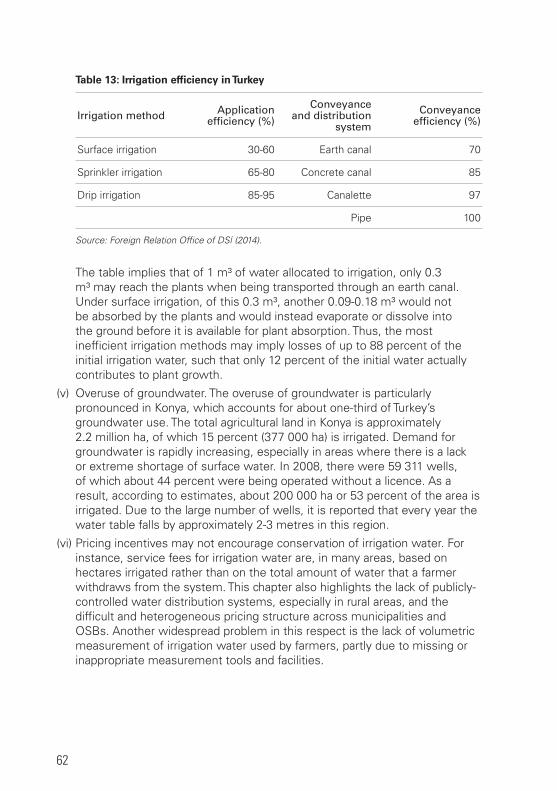
62
Table 13: Irrigation efficiency in Turkey
irrigation method application efficiency (%)
conveyance and distribution
system
conveyance efficiency (%)
Surface irrigation 30-60 Earth canal 70
Sprinkler irrigation 65-80 Concrete canal 85
Drip irrigation 85-95 Canalette 97
Pipe 100
Source: Foreign Relation Office of DSİ (2014).
The table implies that of 1 m³ of water allocated to irrigation, only 0.3 m³ may reach the plants when being transported through an earth canal. Under surface irrigation, of this 0.3 m³, another 0.09-0.18 m³ would not be absorbed by the plants and would instead evaporate or dissolve into the ground before it is available for plant absorption. Thus, the most inefficient irrigation methods may imply losses of up to 88 percent of the initial irrigation water, such that only 12 percent of the initial water actually contributes to plant growth.
(v) Overuse of groundwater. The overuse of groundwater is particularly pronounced in Konya, which accounts for about one-third of Turkey’s groundwater use. The total agricultural land in Konya is approximately 2.2 million ha, of which 15 percent (377 000 ha) is irrigated. Demand for groundwater is rapidly increasing, especially in areas where there is a lack or extreme shortage of surface water. In 2008, there were 59 311 wells, of which about 44 percent were being operated without a licence. As a result, according to estimates, about 200 000 ha or 53 percent of the area is irrigated. Due to the large number of wells, it is reported that every year the water table falls by approximately 2-3 metres in this region.
(vi) Pricing incentives may not encourage conservation of irrigation water. For instance, service fees for irrigation water are, in many areas, based on hectares irrigated rather than on the total amount of water that a farmer withdraws from the system. This chapter also highlights the lack of publicly-controlled water distribution systems, especially in rural areas, and the difficult and heterogeneous pricing structure across municipalities and OSBs. Another widespread problem in this respect is the lack of volumetric measurement of irrigation water used by farmers, partly due to missing or inappropriate measurement tools and facilities.
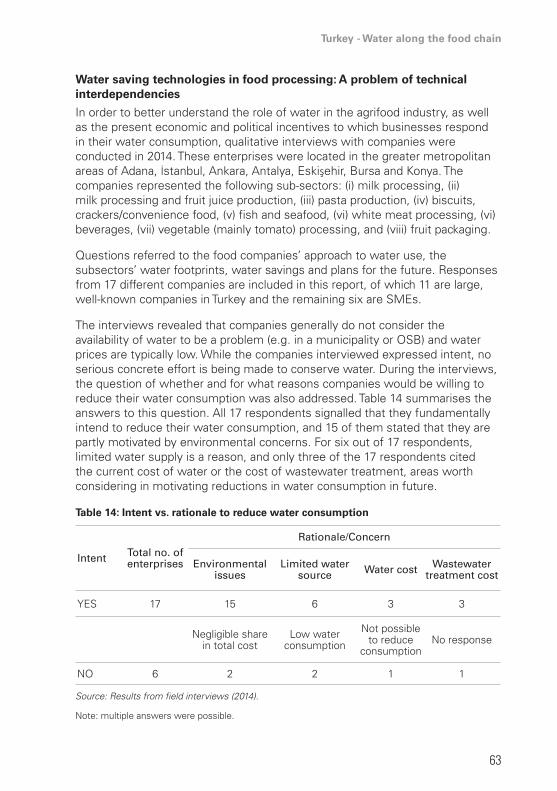
Turkey - Water along the food chain
63
Water saving technologies in food processing: A problem of technical interdependencies
In order to better understand the role of water in the agrifood industry, as well as the present economic and political incentives to which businesses respond in their water consumption, qualitative interviews with companies were conducted in 2014. These enterprises were located in the greater metropolitan areas of Adana, İstanbul, Ankara, Antalya, Eskişehir, Bursa and Konya. The companies represented the following sub-sectors: (i) milk processing, (ii) milk processing and fruit juice production, (iii) pasta production, (iv) biscuits, crackers/convenience food, (v) fish and seafood, (vi) white meat processing, (vi) beverages, (vii) vegetable (mainly tomato) processing, and (viii) fruit packaging.
Questions referred to the food companies’ approach to water use, the subsectors’ water footprints, water savings and plans for the future. Responses from 17 different companies are included in this report, of which 11 are large, well-known companies in Turkey and the remaining six are SMEs.
The interviews revealed that companies generally do not consider the availability of water to be a problem (e.g. in a municipality or OSB) and water prices are typically low. While the companies interviewed expressed intent, no serious concrete effort is being made to conserve water. During the interviews, the question of whether and for what reasons companies would be willing to reduce their water consumption was also addressed. Table 14 summarises the answers to this question. All 17 respondents signalled that they fundamentally intend to reduce their water consumption, and 15 of them stated that they are partly motivated by environmental concerns. For six out of 17 respondents, limited water supply is a reason, and only three of the 17 respondents cited the current cost of water or the cost of wastewater treatment, areas worth considering in motivating reductions in water consumption in future.
Table 14: Intent vs. rationale to reduce water consumption
intent total no. of enterprises
rationale/concern
environmental issues
limited water source Water cost Wastewater
treatment cost
YES 17 15 6 3 3
Negligible share in total cost
Low water consumption
Not possible to reduce
consumptionNo response
NO 6 2 2 1 1
Source: Results from field interviews (2014).
Note: multiple answers were possible.

64
In contrast, six survey respondents revealed that they do not intend to save water compared to their current consumption level. Of these six respondents, two mentioned the negligible share of water in their total costs, and two mentioned their already low level of water consumption. In relation to that, one respondent stated that it would not be possible to reduce the current water consumption level further.
In general, except for the larger companies that intend to be frontrunners in achieving considerable water savings, some companies might have claimed an interest in saving water because they are concerned about environmental degradation or for other reasons not captured by the answers. However, the data provided were not sufficient to support the claim of environmental concerns. Instead, the survey and interviews may have raised expectations that politically correct responses should be given, e.g. some respondents might have hoped that strategic answers would keep the doors open for financial support.
In the case of groundwater use, the fact that pumps consume large amounts of energy has to be taken into account. Looking at the global picture, pumps alone consume 10 percent of the world’s electrical energy, and most of them pump only water. Indeed, calculations show that if everyone in the world switched to higher efficiency pumps, global electricity consumption would decrease by as much as 4 percent (Rethink Water, 2013).
Furthermore, qualitative interviews with micro and small enterprises revealed that many managers fail to see the link between water efficiency and energy efficiency: the lower the volume of water that has to be transported, heated, cooled or treated, the less energy is required. Furthermore, in the absence of water monitoring (mainly from a lack of interest due to the low water prices), the water use efficiencies of different processing operations in a facility are usually not known.
This example points to the fact that the identification and adoption of effective water saving technologies often hinge upon the current efficiency level of other technologies within a company’s production process. Consequently, the actual measures that may apply to a specific agrifood processing company are therefore likely to be a function of the current technologies used, the state of maintenance of these technologies, and the relative cost of water, labour and technology investments required.
Further field interviews conducted in January 2015 with Turkish slaughterhouses and meat processing companies identified several potential measures for immediate implementation to improve water efficiency (Table 15):
• Meat processing after the slaughter process: washing of offal may or may not take place; if it does, a special washing machine may save 20-30 percent

Turkey - Water along the food chain
65
of the water used to rinse offal, but this is seldom used due to the initial fixed cost.
• SME slaughterhouses: hose nozzles to control running water are not commonly used, implying that water may run from a hose all day, even if no water is required. As a simple remedy, controllable hose nozzles could be implemented at a very low cost and would produce around 10-20 percent water savings during slaughtering in SME slaughterhouses.
• Training workers about good and often simple water conservation practices. Many food processing companies can achieve water efficiency through on-the-job training as part of a continued plan to increase resource efficiency rather than a one-off training session.
• Access to finance with favourable terms and conditions appears to be a problem in the SME sector, including the food sector. Responses during interviews suggested that a lack of finance curbs the appetite of SMEs to make water saving investments. Indeed, six out of eight respondents reported the need for finance, highlighting broader problems with access to credit.
Table 15: Water saving technologies
technology
estimated water saving potential
relative to 3.5 m3
water per tonne beef carcass*
reference situation
current obstacles to
adoption
source of information
Hose nozzle10-20%
or 0.55 m3 water / tonne
Compared to the condition of no
hose nozzle being used for washing and sanitation in slaughterhouse
In small-medium sized
slaughterhouses, there is not a
common attitude among workers to
use hose nozzle
Field observation in a slaughterhouse in
Ankara
Washing machine for offal
20-30%or 0.88 m3 water /
tonne
Compared to no washing machine
being used for offal
Many slaughterhouses do not care about this
part of the cattle and even give it away for
free to be washed and sold by others
Field observation in different
slaughterhouses
For comparison: Water savings potential from improved irrigation efficiency
Pipelines instead of open canal for water conveyance
10%1 000 m3 / ha
Compared to the open concrete
canals for water distribution,
assuming Irrigation at 10 000 m3/ha
The cost of transferring from
open canal to closed is USD 5 000/ha.
This is part of DSI’s future plans
DSİ
Source: Field interviews, January 2015. *Source: Ministry of Environment and Urban Planning (2015).

66
According to the table, avoiding the use of open canals translates into a water savings potential of 10 percent for irrigation water, which would save about 300 times the amount of water per hectare that a slaughterhouse would save per tonne of carcass.
The assumption that 1 hectare of irrigated pasture is necessary in order to sustain one beef cow with its calf for one year allows a rough expression to be generated of beef carcass production per hectare: cow + calf = 700 kg + 300 kg = 1 000 kg live weight cattle would result in circa 550 kg carcass weight/hectare after slaughter. Thus, taking the water savings potential for hose nozzles and washing machine for offal together yields about 0.3 + 0.5 = 0.8 m3 water savings per hectare carcass weight produced, in contrast to 100 m3
water savings that can be achieved for the same amount of carcass production through a corresponding 1 percent improvement in irrigation efficiency for the corresponding pasture.
It should be considered that slaughterhouses typically process thousands of tonnes of carcasses per year, while the corresponding measures proposed in Table 15 could fairly easily be implemented. Consequently, for a slaughterhouse that produces an annual carcass output of 50 000 tonnes, this could imply 40 000 m³ of water savings.
Water saving technologies in food processing: The role of wastewater
The majority of companies that responded to the qualitative interviews (18 out of n=25 valid answers for this question) indicated that their wastewater is classified as “industrial”, and therefore requires pre-treatment for safe disposal to the environment. The remaining n=7 firms reported that they generate wastewater of “domestic wastewater” quality, which implies that no further treatment is necessary. Depending on the companies’ location and related opportunities to treat wastewater, they use various methods of wastewater disposal (Table 16).
Table 16: Wastewater generated in different subsectors of the food industry
number of enterprises included in the
interviews (n=16)subsectors
Water used =wastewater 7 T;omato puree and fruit pulp; fish and
seafood flash freeze; fruit packaging
Wastewater is less than the water used 9
M;ilk processing and fruit juice production; vegetable processing;
convenience food; cookie, cakes and cracker production
Source: Field study interviews.

Turkey - Water along the food chain
67
As of 2012, 92 percent of the municipalities had closed (piped) sewerage networks and 68 percent of the municipalities had wastewater treatment facilities. After being treated in these facilities, the wastewater was disposed to: (i) the sea (53 percent); (ii) rivers/streams (39 percent); (iii) reservoirs (2 percent); (iv) other mediums (4 percent), and (v) land (less than 1 percent) (TÜİK, 2014). However, no statistics are available for rural areas.
In 2003-04, wastewater generated in OSBs presented a problem since only about 30 percent of the OSBs had treatment facilities (Topraksuenerji, 2011). By 2013, there had been no progress. Instead, the share of OSBs with a treatment facility had declined to 20 percent. About 4 percent of the remaining 80 percent had only pre-treatment facilities (biological treatment for both industrial and domestic wastewater) and 96 percent discharged the unprocessed wastewater directly into the environment19.
In addition, it should be emphasised that many enterprises – including food processing companies – do not operate their treatment facilities, mainly due to the operational costs of electricity.
Table 17: Wastewater disposal strategies of food processing companies
Methods for disposal
no. of enterprises that generate wastewater
(quality: industrial)
no. of enterprises that generate wastewater
(quality: domestic)
n=18 n=7
On-site treatment and disposal to a water body (lake or river) 8 -
On-site treatment and disposal to the OSB network 5 -
On-site treatment and disposal to municipal sewerage system 5 -
Recycle - 1
Disposal directly to an irrigation canal - 1
Directly to OSB system - 3
Directly into the municipal system - 2
Source: Results of field interviews.
19 Interview with the Chairman of the Ankara Chamber of Industry in 2013 based on 2012 data from the Ministry of Environment and Urbanisation regarding wastewater treatment facilities in OSBs.

68
Water saving technologies in food processing: A problem of price incentives
Water is often taken for granted when water prices are relatively low or if water can be obtained at a low cost from sources to which no regular pricing scheme applies.
In this respect, the location of a food processing enterprise can be more important for water consumption incentives than the actual state of the firm’s food processing technology. This is because in Turkey location crucially determines both the price of water and the cost of wastewater. In order to understand how location affects a company’s typical choice of water sources, Table 18 shows that food processing companies may face different options in this respect.
Table 18: Water sources in food processing enterprises
Firm location
Water source
Wells Municipality network+ well osB network total responses from
field interviews
Rural 6 - - 6
OSB 2 - 6 8
Municipality 7 3 - 10
total 15 3 6 24
Source: Field study interviews.
As shown in Table 18, it is important to distinguish between the following categories as regards the location of agrifood processing firms:
(i) agrifood processing firms in rural areas
(ii) agrifood processing firms in OSBs
(iii) agrifood processing firms in municipalities or greater metropolitan areas.
Water sources and site-specific price incentives to consume (or save) water are discussed below.
Agrifood processing firms in rural areas
All enterprises that were interviewed during the fieldwork carried out in rural areas (n=5) reported that they have their own wells. Due to the sensitivity of the issue, they were not asked in the interviews whether the wells were licensed or not, but it is likely that some were not. However, the number of firms interviewed was too small to draw conclusions as to whether this is representative of all rural areas in Turkey. Fees for wastewater disposal from these firms were reported as “negligible” or “none”.

Turkey - Water along the food chain
69
Agrifood processing firms in OSBs
Many OSBs are home to food and beverage companies. Of the OSBs presented in Table 19 the proportion of food processing companies out of the total number of companies varied widely at between 1-36 percent.
Agrifood processing firms in OSBs may comprise: (i) primary food processing, preparing food in a form other than fresh marketing of crops or animals and crops grown on the farm e.g. grading/packaging, and (ii) secondary processing that takes the food to a second and third stage of processing before it is marketed and consumed, e.g. milk processing or oilseed milling.
Interviews with the management at the Eskişehir and Antalya OSBs suggested that food processing is the highest water-consuming manufacturing industry among those operating in these OSBs. According to OSB records, in 2013 total water consumption of the Antalya OSB (where a total of 226 companies are located) was 6 166 248 m3, while 28 percent of this was consumed by the 29 food companies. Thus, 12 percent of the companies used 28 percent of the water.
Table 19: Ratio of food processing enterprises in selected OSBs by region
region osB number of companies
Food enterprises
no. Percent of total number
Eastern Anatolia Erzurum 44 16 36
Black Sea Trabzon 76 21 30
Southeastern Anatolia Ş.Urfa 184 54 29
Eastern Anatolia Malatya 132 32 24
Mediterranean Mersin 94 18 19
Marmara Balıkesir 110 17 15
Mediterranean Antalya 226 31 14
Black Sea Samsun 72 8 11
Mediterranean Adana 321 36 11
Aegean İzmir 572 47 8
Central Anatolia Çorum 132 8 6
Central Anatolia Kayseri 806 32 4
Marmara Bursa 209 2 1
Source: OSB websites (2014).

70
The water charges of the five OSBs included in the study varied between TL 0.29 and 1.6 per m3, with Antalya being the lowest. Although these prices were economically advantageous for the food enterprises as they were designed to support industry overall in Turkey, they appeared to impede water conservation.
The governing board of each OSB determines and collects the water fees based on: (i) the quantity of the water used by each enterprise, (ii) the type of enterprise and (iii) whether the enterprise/business has a license. Although the prices (TL/m3) were always lower than those charged by the municipalities, there were significant differences between the OSBs, e.g. the prices given by the OSBs were TL 0.29, 0.7, 1.65, 2.98 per m3 for Antalya, Kayseri, Çorum and Gebze/Istanbul, respectively (see OSB websites).
Agrifood processing firms in municipalities or greater metropolitan areas
In each municipality, water prices were calculated based on the “Regulation on Tariffs and Water Subscription” endorsed by the municipal councils. Therefore, each municipality applied different prices for water through their water and sanitation companies (SKIs) for their subscribers.
Table 20: Municipal charges for industrial water use
Water provider tl/m3 subscriber
Antalya Municipality 3.56 Various businesses within the municipality
Eskişehir Municipality 3.59 Various businesses within the municipality
İstanbul Municipality 6.00 Industrial use within the municipality
İzmir Municipality 3.66 Industrial use within the municipality
Gaziantep GASKI 0.46 Livestock OSB
Gaziantep GASKI 1.38 OSB
Gaziantep Municipality 4.60 Various businesses within the municipality
Source: Field study interviews.
However, the interviews revealed that it is also common practice to use water from the companies’ own wells in addition to water from the municipal network. There are two reasons why a company may use a well in addition to the municipal network: (i) the enterprise started with its own well(s) and, as water usage increased, the additional supply came from municipal water, or (ii) the enterprise using municipal water prefers to drill its own well when additional water needs arise, mainly due to the high cost of municipal water. Again, the respondents were not asked about the status of the wells (whether they have a license) due to the sensitive nature of this issue.

Turkey - Water along the food chain
71
Companies within municipal boundaries either do not pay for their wastewater or pay an annual amount that may be considered negligible (e.g. TL 40-60 per year) or an amount that is incorporated into the water fee (e.g. TL 4.5 per m3).
Apparently, the most expensive water is provided by the municipalities. Those firms that have only wells but still indicate a water cost during the interviews were referring to the energy cost used for pumping. Pumps are used for accessing water from the aquifer.
The variation in unit price for the wells mainly stems from the depth of an aquifer. Anecdotal evidence indicates that the depth of the well(s) to yield water of the required quantity and quality is increasing. In Konya, a dairy plant drew water from a depth of 16 m for its first well about 15 years ago. In recent years, the same company is now pumping from a depth of 80-100 m to obtain the same amount of water. A similar predicament applies to the Bursa province, which is a hub for a significant number of manufacturing industries, including the textile, food and automotive sectors.
Table 21: Water sources and price of water
responses
Water source and amount paid for unit of water
Wells tl/m3 osB network tl/m3
Municipality network+
wellstl/m3
Water at no cost 9 - - - - -
Mainly energy cost for pumping water 5 0.2-3.0 - - - -
Payment for OSB water - - 6 0.29-1.6 - -
Payment for water from the municipality - - - - 3 2.6-4.5
total 14 6 3
Source: Field study interviews.
Table 21 summarises the observed and stated ranges for water prices that the companies interviewed were paying in 2014. The rows of Table 21 correspond to different sources of water, while the number of entries refers to the number of companies that say they draw water from a corresponding source.

72
Table 22: Water consumption in food processing and the derived equivalent water cost in Turkey
Water cost per unit of product by water source, assuming inclusion of
wastewater charges
subsector segment high value
Benchmark unit
own well, just electricity tl 0.2-0.3/
m3
osB max
tl 1.6/m3
Municipality networks from TL 2.6-4.5/m3
Bakeries and pasta processing
Dry pasta 30 m³/t of pasta 6.0 9.0 48.0 78.0 135.0
Fruit and vegetables processing
Canned fruit 10.86 m³/t raw material 2.2 3.3 17.4 28.2 48.9
Canned tomatoes 8 m³/t of product 1.6 2.4 12.8 20.8 36.0
Canned vegetables 22.91 m³/t raw
material 4.6 6.9 36.7 59.6 103.1
Fruit and vegetable processing
23 m³/t of product 4.6 6.9 36.8 59.8 103.5
Olive oil 0.35 m³/t product 0.1 0.1 0.6 0.9 1.6
Rapeseed crude oil product 12 m³/m³
crude oil 2.4 3.6 19.2 31.2 54.0
Refined oil production 12
m³ wastewater /t rapeseed
2.4 3.6 19.2 31.2 54.0
Meat processing
Meat and poultry 25 m³/t of raw material 5.0 7.5 40.0 65.0 112.5
Rendering 1.5 m³/t raw material 0.3 0.5 2.4 3.9 6.8
Slaughterhouses, cattle 9 m³/t cattle
carcass 1.8 2.7 14.4 23.4 40.5
Slaughterhouses, pig 6 m³/t pig
carcass 1.2 1.8 9.6 15.6 27.0
Slaughterhouses, sheep 8.3 m³/t sheep
carcass 1.7 2.5 13.3 21.6 37.4

Turkey - Water along the food chain
73
Milk processing
Cheese 0.06 m³/kg of product 0.01 0.02 0.10 0.16 0.27
Cheese 300 m³/t 60.0 90.0 480.0 780.0 1350.0
Ice cream 0.3250 m³/kg prod. ice-cream 0.065 0.098 0.520 0.845 1.463
Ice cream 0.0078 m³/kg of product 0.002 0.002 0.012 0.020 0.035
Market milk 0.0018m³/l
received milk
0.000 0.001 0.003 0.005 0.008
Market milk and yoghurt 0.0250 m³/kg of
product 0.005 0.008 0.040 0.065 0.113
Milk 0.0025 m³/kg of milk intake 0.001 0.001 0.004 0.007 0.011
Milk and whey powder 0.0600 m³/kg of
product 0.012 0.018 0.096 0.156 0.270
Milk powder 0.0017m³/l
received milk
0.000 0.001 0.003 0.004 0.008
Milk powder 0.5 m³/t product 0.1 0.2 0.8 1.3 2.3
Milk powder 0.04 m³/t raw milk 0.0 0.0 0.1 0.1 0.2
Sugar (beet)
1.1 m³/t beet processed 0.2 0.3 1.8 2.9 5.0
6.98 m³/t sugar produced 1.4 2.1 11.2 18.1 31.4
Source: Authors’ calculations based on Tables 11, 20 and 21.
Table 22 takes the higher values of water consumption per tonne of output from Table 11 and presents the calculated cost of water consumption in Turkey, given the different price ranges of water sources at different locations as indicated in Table 21. Clearly, these computations assume that Turkish agrifood processing companies have water consumption levels per unit of output that are within the ranges of the benchmark figures given in Table 11. The analysis earlier in this chapter has shown that this assumption is realistic for large industrial plants in Turkey, while the smallest processors typically require only a fraction of the water per unit of output compared to the corresponding industrial process.
Thus, assuming that the computations in Table 22 are within a realistic range, the unit value of beef carcasses in 2013 may serve as an indication of the production cost per carcass of beef. This unit value amounted to TL 9 673/tonne, while the corresponding water cost according to Table 22 would be between TL 1.8/tonne and TL 40.5/tonne of carcass, depending on the slaughterhouse’s

74
location and water sources. Thus, according to these calculations, it is unlikely that water costs in the beef slaughtering process would be greater than 0.5 percent of the carcass unit value.
In milk production, the Turkish raw milk base price was TL 1.04/litre in April 2014 (Helix Management Consultants, 2014). The calculations in Table 22 give the corresponding water cost as ranging from TL 0.001/litre milk to TL 0.008/litre milk, which could be up to 0.7 percent of water costs relative to the raw milk base price for the highest charging municipality networks.
These examples show that, under the existing pricing schemes, water costs would not constitute a significant proportion of the costs for major processed food products in Turkey. For instance, Helix Management Consultants (2014) consider the cost of electricity in the processing of Turkish meat and dairy products, but do not even mention the cost of water as a separate item.

Turkey - Water along the food chain
75
Chapter 3 – Policy environment for food sector water use efficiency
The main objective of this section is to describe policy-driven incentives regarding water resource management and water use in Turkey, taking the country’s entire water-related governance structure into consideration. The first subsection therefore presents an overview of the structure and evolution of Turkish institutions involved in the management of water resources. It then focuses on policies concerning water usage and water management, while the last section analyses the effect that Turkey’s agricultural and farm policies that do not include water use as a key consideration may have on the country’s water consumption.
Turkish institutions for the management of water resources
Key findings:
• Turkey has fairly successfully established the necessary organizations and institutions for managing water resources at different levels (i.e. national, regional and local levels).
• However, the historical development of water-related institutions shows frequent reorganization and restructuring. This may potentially distract from the long-term planning of programmes for sustainable water management.
• Nonrevenue water use (NRW) refers to water that enters the distribution system without reappearing in any measure of consumption. NRW is a serious problem in Turkey that needs to be addressed and taken into consideration in any approach taken to save water.
• Since 1990, there has been an increase in the transfer of water distribution administration from DSİ to regional and local water user organizations (WUO), such as irrigation cooperatives (ICs) or water user associations (WUAs).
• Improving water use efficiency in WUOs would be a suitable objective to pursue once decentralisation of the water distribution system has been completed.
• A major issue for urban water management is the partly worn-out distribution system. More investment is needed in this area.
The Turkish Constitution considers water to be in the public domain, and central government plays a central role in water resource management. However, as water is required for many dimensions of human life, various organizations deal with water issues from differing perspectives. In Turkey, water management institutions can be identified at a national, regional or local level (e.g. municipalities or cooperatives).
Since 1960, various water management institutions at all levels have evolved, but in the meantime they have been subject to repeated reorganization and

76
restructuring. This section of the report focuses on the latest developments, while the evolution of the organizations since 1960 is briefly covered.
Institutions at a national level
As part of central government, numerous agencies and departments under several ministries are directly or indirectly involved in the management, protection and monitoring of water resources in Turkey. Figure 27 shows the principal government units that are all involved in the management of water resources.
In principle, prime responsibility for the administration and governance of water-related issues lies with the Ministry of Forestry and Water Affairs (MFWA). This Ministry was established in 2011 and its organization and duties were announced in Statutory Decree no. 645. One of the Ministry’s main duties is defined as developing policies concerning the protection and sustainable utilisation of water resources, and coordinating national water management (Çiçek et al., 2015).
Under this Ministry, two important institutions embrace most of the central government’s water-related tasks:
• the General Directorate of State Hydraulic Works (DSİ)
• the General Directorate of Water Management (GDWM)
In some instances, responsibilities and mandated functions may overlap. For example, policy development, policy decision making, and the design and administration of investment programmes are tasks performed by numerous institutions since these responsibilities fall within the domain of several major institutions at the same time.
For instance, the State Planning Organization (SPO) develops the country’s development plan and proposes major plans for water resources management. However, the GDWM is also responsible for long-term planning of water resources management. Another example is the Ministry of Development and its irrigation water expansion programme, which is similar to the duties of the DSİ which is responsible for the development of a modern irrigation network. These organizations will be explained in detail below.
The DSİ is “the main investing body responsible for the development and management of Turkey’s water resources20. It is active in the fields of the supply of water for agriculture, energy, services (supply of drinking water), as well as in matters relating to the environment and flood control” (Ministry of Forestry and Water Affairs, 2015, p.10). DSİ was established in 1954 based on Law No. 6200. Since its establishment, DSİ has been under the supervision of different ministries: initially, it was assigned to the Ministry of Public Works before being reassigned to the Ministry of Energy and Natural Resources, then the Ministry
20 Ministry of Forestry and Water Affairs (2015): http://www2.ormansu.gov.tr/osb/Dosya/did/B2.pdf.

Turkey - Water along the food chain
77
of Environment and Forestry (OECD, 2008; Burrell and Oskam, 2005), and finally, in 2011, it became part of the new MFWA.
At first glance, DSİ’s history might seem of little relevance to the efficiency of water management policies. However, as the major objectives of each of the above ministries were not necessarily DSİ’s objectives, in practice this may very well affect medium and long-term water resources management. For instance, the Ministry of Environment and Forestry (MOEF) had more specialised objectives for environmental management, which may not always have been compatible with the provision, distribution and management of water resources that constitute DSİ’s primary duties.
Figure 27: Current structure of water-related government institutions
Source: Adapted from the Ministry of Forestry and Water Affairs 2015, p.4; GDWM (2015); Zeldin (2015).

78
DSİ’s main tasks are:
• to supply water to communal organizations for domestic and industrial use
• to prevent flood hazards
• to equip all economically irrigable land with modern irrigation facilities
• to develop technically viable hydroelectric energy potential
In addition to DSİ, the GDWM was also established in 2011. Two major reasons drove the creation of this new institution. First, one of the requirements of the EU Water Framework Directive is the establishment of a GDWM as an organization that is separate from investment organizations, since DSİ was already responsible for water-related investments. The other reason was the need for coordination between different institutions dealing with different aspects of water resources management (SEMIDE/EMWIS, 2012). The following tasks were assigned to GDWM (Kinaci, 2013):
• to prepare basin protection action plans (BPAP), river basin management plans, and flood and drought management plans
• to determine sectoral water allocation, provisions for drinking water sources, water efficiency, water quality standards at basin level and the effects of climate change scenarios at basin level
• to establish an effective monitoring system for water quality control
• to constitute a database for water resources
• to develop a national and international water management policy
In addition to the MFWAs, other major central government agencies involved in overseeing water resources and irrigation are the Ministry of Environment and Urbanisation, responsible for control and inspection, as well as sanctions against unlawful discharges. This Ministry is also in charge of preparing environmental impact assessments and environment plans.
The Ministry of Food, Agriculture and Livestock (MFAL) is responsible for the bylaw on nitrates, and the Ministry of Health is responsible for water for human consumption (Zeldin, 2015). The SPO, under the direct supervision of the Prime Minister, develops the five-year development plan for the country and proposes major plans for water resources management and development projects (Kibarouglu and Baskan, 2011).
In addition to the institutions indicated in Figure 27, there is also the Water Management Coordination Committee (WMCC). Its mandate is “…to identify holistic measures for the protection of water resources, ensure coordination and collaboration among different sectors and the enhancement of water investments, ensure the implementation of objectives stated in national

Turkey - Water along the food chain
79
and international documents and the implementation of the institution’s responsibilities as described in the river basin management plans”.
The WMCC comprises representatives from the MFWA, the Ministry of Environment and Urbanisation, the Ministry of Internal Affairs, the Ministry of Foreign Affairs, the Ministry of Health, MFAL, the Ministry of Science, Industry and Technology (MSIT), the Ministry of Energy and Natural Resources, the Ministry of Culture and Tourism, the Ministry of Development, the Ministry of the European Union and the Turkish Water Institute.
The tasks of the WMCC, according to Kinaci (2013), are:
• to determine measures to conserve water resources within the framework of integrated river basin management
• to provide coordination and collaboration and facilitate investment in water provision
• to develop the strategy, policy and plan for the implementation of national policy objectives
• to evaluate the state of implementation of the plans and strategies that must be fulfilled by public institutions and organizations in the basin plan
Figure 28: Structure of the Water Management Coordination Committee
Minister of Forestryand Water Affairs
Minsitry of European UnionUndersecretary
Ministry of Science, Industryand Technology Undersecretary
Ministry of Environment andUrbanization Undersecretary
Ministry of Foreign AffairsUndersecretary
Ministry of Energy and NaturalResources Undersecretary
Food, Agriculture and LivestockUndersecretary
Ministry of Internal AffairsUndersecretary
Ministry of DevelopmentUndersecretary
Ministry of Culture and TourismUndersecretary
Ministry of HealthUndersecretary
State Hydraulic Works General Director
Water Management General Director
Nature Conservation and NationalParks General Director
Combating Desertification andErosion General Director
Meteorology General Director Head of Water Institute
Source: Kinaci (2013).

80
Figure 28 shows that the WMCC is designed to function as an organization that brings together higher-level governmental organizations with relevance for water resources management.
However, the frequent reorganization and restructuring of institutions may potentially distract from the long-term planning of programmes for sustainable water management. In this context, the government must certainly weigh up the necessary modernisation of institutions against continuity. However, any effect of such institutional reforms is typically difficult to quantify because of the multifactorial nature of the process and the limited availability of relevant indicators according to which the performance of institutions as a whole might be assessed.
Institutions at a regional and local level
Similar to the water management institutions at a national level, in recent decades “micro” level organizations have evolved at a regional and especially at a local level. In particular, many municipalities have had their boundaries redefined and have been restructured, but it remains unclear whether this has also had an impact on the provision of water to an increased number of people.
In this section, the institutions responsible for the provision of potable water and industrial water are explained first, before describing the institutions related to agricultural water management. In the latter case, it mostly refers to water usage for irrigation purposes.
The following institutions are considered below:
• local institutions for the management of non-agricultural water consumption
(i) municipalities
(ii) OSBs
• local institutions for the management of agricultural water consumption
(iii) WUAs
(iv) cooperatives
However, the current state and future path of local institutions related to the management of agricultural water consumption cannot be described without first providing an overview of the history of decentralisation of irrigation water administration from DSİ to local WUOs, which include WUAs and cooperatives.

Turkey - Water along the food chain
81
Localinstitutionsforthemanagementofnon-agriculturalwaterconsumption
Municipalities. Municipalities21 in Turkey have the obligation and mandate to provide water supply and sewerage services. In Turkey, “municipal water” covers potable water supplied by the local water authority. Private-public partnerships (PPPs), although in principle supported by the Turkish government, largely do not exist in the case of municipal water supply (Birpinar, 2014).
Municipalities are basic governmental structures in Turkey for the provision of local services. The definition of a municipality has been subject to changes over time. From 1984, municipalities were defined as settlements with 5 000 or more inhabitants, therefore province and district centres were municipalities regardless of their population. Additionally, and according to the Turkish Constitution, “metropolitan municipalities” were delegated the task of serving areas with larger populations. The metropolitan municipalities embraced both district municipalities and villages within their boundaries (Akman et al., 2015).
However, in 2014, Law No. 6360 changed the definition of a municipality profoundly. Within the framework of this law, municipalities are settlements with 2 000 or more inhabitants, which resulted in 49 percent of all Turkish villages being abolished as administrative units, and 77 percent of Turkey’s population becoming urban dwellers, and thus changing the rules and modalities under which they were given access to water. Table 23 shows these changes. According to TUIK (2012) statistics, about 84 percent of the population (about 63 million) benefited from municipal services prior to Law No. 6360.
Table 23: Comparison of the administrative changes before and after Law No. 6360
administration Previous situationsituation after
introduction of law no. 6360 in 2014
Metropolitan municipalities 16 30
Metropolitan district municipalities 143 500
Provincial municipalities 65 51
District municipalities 749 418
Town municipalities 1 977 393
Total municipalities 2 950 1 393
Special provincial administration (SPA) 81 51
Villages 34 283 18 201
Source: Akman et al. (2015, p.121).
21 Municipality Law No. 5393 (enactment date 10.7.2004) and Metropolitan Municipalities Law No. 5216 (enactment date 3.7.2005).

82
Table 23 shows that the law changed the geographical-political administration structure in Turkey profoundly, which may have effects on the provision of water and wastewater services. This has benefited metropolitan municipalities in particular since they have special laws, regulation and services.
Turkey’s 17 largest cities have legally separate and financially autonomous municipal water and sanitation “utility” companies called suve kanalizasyon idaresi (SKI) (Trenchless International, 2015). These utility companies manage water supply and wastewater collection and treatment in metropolitan municipalities. In other municipalities, the municipal administration is directly in charge of services. However, all municipalities are responsible for the construction, operation and maintenance of water and wastewater treatment plants and for the inspection of discharges of industrial wastewater into their sewerage systems. SKIs are managed by general managers and their boards, which are chaired by the mayor of the metropolitan municipality (OECD, 2008).
The latest municipality laws also authorise the metropolitan municipalities to develop and implement legislation for the most efficient management of municipal water and wastewater within their boundaries. Customers (e.g. in residential areas, commercial districts and institutional and recreational facilities) use water for drinking, washing, bathing, cooking, waste removal, cemeteries and landscape watering purposes, and other related tasks. Based on the stated purpose of their primary utilisation mode, customers are categorised as (i) domestic (household/residential), (ii) commercial/industrial, and (iii) public (Law No. 5393 and Law No. 5216).
In addition, public entities, mosques, municipal parks, cemeteries and fire departments use water free of charge. The amount of such public use was estimated to be 2 percent in the three case studies carried out between 2004 and 2007 (Burak, 2011. p.6). This result was also confirmed through the compilation of data issued by TUIK (industrial company survey 2006) for (i) the volume of water distributed (not necessarily paid for) and (ii) the volume of water sold/water fees collected (Burak, 2011).
Furthermore, NRW use, or water that is supplied but not charged for, remains a problem for most municipalities, despite efforts to take remedial action on technical, regulatory and financial fronts. Such NRW includes (Burak, 2011, p. 9; SWAN, 2011, p.1):
• losses due to overflow and/or leakage;
• inaccurate measurement;
• fire-fighting, mosques, cemeteries and other public uses that may not be measured; and
• use by non-subscribers (water theft).

Turkey - Water along the food chain
83
The SWAN (2011) report shows that the amount of NRW for three major cities in Turkey is as follows: Adana 69 percent, Diyarbak 51 percent and Istanbul 30 percent of the water initially provided for the local water distributing network. A reduction in NRW was one of the targets of the Municipal Service Project that has been financed by the World Bank since 2006. The results show that strengthening the technical and administrative capacity of the target municipalities was able to reduce NRW substantially. The project objective is defined as follows:
• the development of the municipal infrastructure to improve water, wastewater and solid waste management services;
• the strengthening of the financial position and operational efficiency of municipal utilities; and
• the institutional strengthening of Iller Bank (the provincial bank that acts as a financial intermediary and lends to eligible municipalities).
In Asat (Antalya), losses were reduced from 52 percent to 43 percent by the end of 2013; in Kutahya from 69 percent to 35.5 percent by the end of 2013; and in Elbistan from 65 percent to 32 percent by the end of 2012 (World Bank Group, 2015, p.35).
Potable water services by municipalities.TUIK data (2015) indicate that in the decade between 2002 and 2012, the total amount of water extracted increased only slightly (2 percent), despite an increase in urban population of about 22 percent22. Given that 99 percent of the population has access to potable water, the data imply improvements in water delivery and collection efficiency. The major reasons for these improvements in efficiency were:
(i) upgrading of conveyance/distribution systems for public water systems by municipalities; and
(ii) substantial capacity increase in recycling of wastewater at treatment plants by both municipalities and those who use municipal water, in particular industry.
Table 24 shows the sources of water used in municipalities.
22 This increase was partly caused by the reorganization of administrative zones.

84
Table 24: Municipal water indicators, 2002 and 2012
indicator 2002 2012
Total number of municipalities (differences due to administrative reforms) 3 227 2 950
No. of municipalities served by water supply network 3 140 (97%) 2 928 (99%)
Total water drawn (million m3/year) from: 4 815 4 936
reservoir (%) 37.3 48.9
well (%) 30.2 28.3
spring (%) 26.9 19.2
river (%) 2.7 1.6
lake/small reservoir (%) 2.8 2.0
Amount of water distributed via supply network (million m3/year) (no data) 2 802
Amount of water treated in water treatment plants 1 710 2 729
Average amount of water abstracted per capita per day (litres/capita/day) 255 216
1Urban population (2000 and 2010) 41.2 million 50.6 million
Source: TUIK (2015).
Wastewater discharge and treatment by municipalities.Over the years, progress has been made regarding the quantity of wastewater that is treated by municipalities. In 1994, when the municipalities were drawing 3.2 billion m3
water, only 31.25 percent of the wastewater was treated. In 2012, although withdrawal rates reached about 5 billion m3, this ratio reached 55 percent, up from 36 percent in 2002. This has occurred despite identical water extraction by municipalities between 2002 and 2012. Depending on a municipality’s size and managerial and financial capacity, most of them use different methods for wastewater treatment, with 95.3 percent using conventional methods that combine physical and chemical treatment. The remaining municipalities use either new technologies (3.1 percent) or simple physical treatment, which is primarily sludge removal (1.6 percent) (TUIK, 2015). Table 25 shows the wastewater management developments introduced by municipalities in 2002 and 2012.

Turkey - Water along the food chain
85
Table 25: Municipal wastewater indicators for 2002 and 2012
indicator 2002 2012
Total number of municipalities 3 227 2 950
No. of municipalities served by sewerage system 2 115 2 300
Rate of population served by sewerage systems in total municipal population (%) 83 92
Total amount of wastewater discharged (million m3/year) out of which: 2 498 4 073
sea (%) 35.5 45.2
lake and artificial lake (%) 1.5 1.8
river (%) 54.3 44.6
land (%) 1.5 0.9
dam (%) 3.8 2.8
other (%) 3.4 4.6
Amount of wastewater treated in wastewater plants (million m3/year) 1 312 3 257
Average amount of wastewater discharged per capita in municipalities (litre/capita-day) 154 190
Source: TUIK (2015).
The TUIK statistics in Table 25 show that, despite substantial achievements in wastewater treatment, approximately 0.9 billion m3 of wastewater is still produced each year by municipalities that should be treated before being returned to nature. There are many different reasons behind this, but these fall outside the scope of this report.
organized industrial zones (osBs). OSBs are production zones for goods and services. They are assigned by the MSIT through the allocation of large tracts of land for the purpose of development as industrial areas, including food and beverage production. However, there may also implications of this for water use in agrifood chains.
Since the 1960s, OSBs have played an important role in the development of Turkey’s manufacturing industry. OSBs are designed to allow each company within their area to operate within an investor-friendly environment with ready-to-use infrastructure. This infrastructure includes roads, water, natural gas, electricity, communications, waste treatment and other services (e.g. controlled access). In general, besides their economic importance in terms of new investments, job creation and regional development, OSBs are also

86
effective tools for executing policies for planned and organised industrialisation, urbanisation and the environment.
The first OSB was established in 1962 in Bursa in the Marmara Region. In addition to the investment incentive scheme in Turkey (general investment incentives, incentives for large-scale investments, region and sector-based incentives, employment incentives, research and development (R&D) supports, etc.), investors operating in OSBs can make use of several advantages: (i) no value-added tax (VAT) for land acquisitions, (ii) exemption from real estate tax for five years from the construction of the plant, (iii) low water, natural gas and telecommunication costs, (iv) no tax payable on the unification and/or separation of plots, (v) exemption from municipality tax for construction and usage of the plant, and (vi) exemption from the municipality tax on solid waste treatment if the OSB does not benefit from the municipality service23.
Interestingly, there are also “agriculture-based specialty OSBs” that integrate agriculture and associated manufacturing sectors. These are commodity and service provision areas where both crop and livestock production for raw materials (milk and meat) and agro-processing can be undertaken. There are currently ten agriculture-based specialty OSBs, which fall under the mandate of the MFAL. Although there are specialised OSBs, there is no legal obligation yet for food and beverage production to take place within or to relocate to such zones.
Article 20 of the Law on Industrial Zones No. 4562 gives the authority and responsibility for establishing and operating the infrastructure and general service facilities, including electricity, water, and wastewater treatment facilities, exclusively to OSB management. However, this article requires the construction of individual pre-treatment facilities as required at each production facility in order to improve the standards of wastewater to the minimum acceptable by the common wastewater facility.
The water sources for OSBs are (i) wells, (ii) springs, (iii) municipal networks, or (iv) any combination of these. For example, the Antalya OSB uses both wells and springs with six pumps that it owns and operates. The Konya, Samsun and Gaziantep OSBs source their water (for both drinking and utility) from the municipal networks. The OSB in Eskişehir provides water to enterprises from its own wells. If an enterprise in an OSB requires more water, it may drill and operate any licensed or unlicensed well(s), provided that the OSB management is duly informed. The OSB management is authorised to install a water meter, if deemed necessary, but it is not obliged to monitor whether the well is licensed.
23 Source: Investment Support and Promotion Agency (2015); Ministry of Science, Industry and Technology (2015).

Turkey - Water along the food chain
87
Water extraction and wastewater treatment by (agrifood and other) manufacturing firms within osBs.OSBs do not cover all industries in Turkey, since industrial companies are scattered and some of them are inside OSBs. Therefore, the Turkish Statistical Institute (TUIK) gathers water and wastewater data for companies through surveys. In the TUIK survey structure, the manufacturing industry establishment is a workplace with single ownership or controlling status and one type of economic activity (TUIK, 2001).
Manufacturing industry establishments partially use the municipality services and OSBs, but mainly have their own water extraction and wastewater management systems. The TUIK 2012 survey data show that manufacturing industry establishments extracted 1.8 billion m3 of water in 2012. Of this amount, only 1.8 percent was supplied from the municipal water supply network and 3.9 percent was supplied by OSB networks. Cooling purposes accounted for 72.9 percent of all extracted water. Accordingly, manufacturing industry establishments discharged 1.5 billion m3 of wastewater in 2012, of which 77.8 percent was cooling water.
Of the total discharged wastewater, 77.5 percent was discharged to the sea, 9.6 percent to a river, 7.3 percent to OSB sewerage, 3.9 percent to municipal sewerage, and 1.6 percent to other receiving bodies. Figure 29 shows the sources of water for manufacturing industry establishments in 2012.

88
Figure 29: Water sources for manufacturing industry establishments in Turkey, 2012
Source: TUIK (2012)24.
Localinstitutionsforthemanagementofagriculturalwaterconsumption
Water user associations (Wuas). Nearly 2 million ha of irrigated land are managed by WUAs, which must have at least 18 water users in order to establish a union and an assembly (or council). An assembly has a four year term and consists of local authority members (such as the head of village or mayor) and selected representatives from each village. The assembly members (or councillors) select the chairman and executive committee of the association. The WUA has to establish a correct audit system and employ technical staff. The obligations and command of the WUA are officially limited to irrigation area and irrigation facilities (Kadirbeyoğlu and Özertan, 2011; Law No. 6172). WUAs are defined as non-profit organizations and have the right to irrigate between 300 and 35 000 ha within their hydraulic boundary (Kerç, 2015).
At the initial stages of the process of transferring irrigation management to local organizations between 1993 and 1995, WUAs were shaped by the laws at that time: the Municipalities Act No: 1580, the Village Act No. 442 and the Provincial Act No. 5442. In 2005 and 2011, two other laws (Law No. 5355 and
24 TUIK has presented two different types of data on water abstraction by manufacturing industries. The data presented in Figure 29 are from the TUIK website on “Manufacturing Industry Establishments Water Wastewater and Waste Statistics, 2012” (last accessed 5.12.15; http://www.turkstat.gov.tr/PreHaberBultenleri.do?id=16172), In this website the amount of extracted water by the manufacturing industry, including agrifood processing, is 1.8 billion m3. The data presented in chapter 1 of this report are also from the TUIK website on “Sectoral Water and Wastewater Statistics, 2012” (last accessed 5.12.15; http://www.turkstat.gov.tr/PreHaberBultenleri.do?id=16175). Here the amount of extracted water by the manufacturing industry, including agrifood processing, is said to be 1.67 billion m3.

Turkey - Water along the food chain
89
Law No. 6172) were passed that specifically considered WUAs (Kadirbeyoğlu and Özertan, 2011; Ghazouani et al., 2012).
cooperatives. Cooperatives are the second major participatory organization in irrigation water management. They can be categorised as ICs and groundwater irrigation cooperatives (GICs) in official DSİ literature, and are based on the Cooperative Law No. 1163 (Foreign Relation Office of DSİ, 2014, p.104, p.107). The difference between the cooperatives and WUAs is their size and legal status. As explained below, the cooperatives are much smaller than WUAs, and they mainly concentrate on irrigation by groundwater resources.
Cooperatives tend to be more concentrated on groundwater use than on surface water. The ICs heavily depend on DSİ and this is rooted in groundwater law. The requirements for well drilling, electrification and planning of motor pumps for the IC are conducted by DSİ. However, development of the irrigation system fell under the remit of the General Directorate of Rural Services (GDRS) until 2005, before being transferred to SPAs (Foreign Relation Office of DSİ, 2014, p.105).
An IC (more specifically GIC) can be established by a minimum of seven farmers. They can submit their request for well drilling and, if the request is accepted, DSİ will drill the wells for them. It should be added that until 2005, GDRS had developed the irrigation networks on approximately 26 percent of Turkey’s irrigated land. Before being abolished, it transferred the schemes under its control to village authorities and ICs (Topcu, 2011, p.103).
Historical development of local irrigation water management institutions
Similar to the national organizations and urban-industrial water management organizations, agricultural water management institutions at a regional and local level have also undergone changes over the last few decades. In general, there has been a tendency towards more decentralised irrigation water management institutions in Turkey.
The General Directorate for Soil and Water (TOPRAKSU), created in 1964 as part of the Ministry of Agriculture, was a major organization for soil and water management at a local level until 1985 when the main duties of this organization in terms of soil-water management moved to the GDRS within the same Ministry. In 2005, GDRS was dismantled during the government’s decentralisation and cost-cutting programme. The decision to dismantle GDRS is still criticised by many experts in Turkey (Kibarouglu and Baskan, 2011) who believe that by demolishing GDRS, a large amount of the technical capacity developed in the water and soil management organization was no longer able to function as before.
The village support programme (KÖYDES) was started by the Ministry of Development in 2005. By including small-scale irrigation systems in the rural development programme in 2011, KÖYDES became a new institution involved in

90
water management from the perspective of a rural infrastructure development programme (Cagatay et al., 2015).
The decision to transfer duties to user associations has created a situation in which DSİ cooperates with irrigators. Therefore, in this section the role of DSİ at a regional and local level is reviewed, together with an analysis of the way in which DSİ cooperates with WUOs.
TransitionofdutiesfromDSİtoWUOs25
Since 1954, DSİ has been the major organization in Turkey responsible for investments in water resource development projects, such as dam-reservoir construction and pumping and irrigation networks. By 2012, there were 75 618 km of irrigation canals and 24 775 km of drainage canals available in Turkey that were mainly established by DSİ. DSİ also provided water to irrigate more than 2.8 million ha by the end of 2013 (Foreign Relation Office of DSİ, 2014, ch.4).
Table 26 presents an overview of the historical development of irrigated agricultural land in Turkey. The rising trend implied in the number of hectares irrigated suggests that in the near future, irrigated agriculture will absorb a significantly higher volume of water, although its share of total water consumption is declining relative to other sectors (see chapter 1 of this report as well: irrigation water consumption is set to decline from the current level of 74 percent to 64 percent by 2023, but still constitutes a major share with an increase in the absolute amount; see Figure 6). If the area of irrigated agricultural land increases as planned by DSİ, then by 2023 irrigated land will have increased by about around 35 percent compared to its 2013 level.
Table 26: Historical development of agricultural irrigation in Turkey, 1995-2023
dsİ planned dsİ planned
1995 2001 2004 2012 2013 2018 2023
Million ha 4.9 5.6 5.9 6.8 8
Developed by DSİ 1.9 2.3 2.4 2.8 2.85 no information 5
Source: Foreign Relation Office of DSİ (2014, p:73) and 10th National Development Plan by the Ministry of Development (2013).
The development of irrigation areas follows different paths (Figure 30): large-scale schemes have moderately increased since 1995 and mostly rely on surface water. Groundwater usage is the water source for less than 5 percent of the agricultural area covered and developed by the schemes. However, surface water is by far the major source of water for irrigation in Turkey.
25 Note that WUOs include municipalities, ICs and WUAs.

Turkey - Water along the food chain
91
Therefore, the major macro and micro water management plans are focused on surface water (such as RBPAPs).
Between 1995 and 2013, small irrigation schemes more than doubled in terms of hectares irrigated, reaching more than 0.24 million ha in 2013 (right panel in Figure 30). These irrigation schemes draw a larger proportion of groundwater than the large-scale irrigation projects because the surface water irrigation infrastructure (e.g. dams and canals) requires large economies of scale. This implies that small-scale irrigation networks can be set up more cost-efficiently in relative terms based on groundwater, simply because the surface water infrastructure would be too costly.
However, about ten times more irrigated land is covered by large-scale schemes (more than 2 million ha in 2013) than by small-scale schemes, such that in total in 2013 about 76 000 hectares were irrigated based on groundwater, of which 60 200 ha were part of large-scale schemes, and 15 700 hectares were part of small-scale schemes (Figure 30).

92
Figure 30: Irrigation areas built by DSİ (water supplied by DSİ) based on irrigation scheme and water source, 1995-2013
0 200 000 400 000 600 000 800 000
1 000 0001 200 0001 400 0001 600 0001 800 0002 000 0002 200 000
1995
1996
1997
1998
1999
2000
2001
2002
2003
2004
2005
2006
2007
2008
2009
2010
2011
2012
2013
ha
-10 00010 00030 00050 00070 00090 000
110 000130 000150 000170 000190 000210 000230 000250 000
1995
1996
1997
1998
1999
2000
2001
2002
2003
2004
2005
2006
2007
2008
2009
2010
2011
2012
2013
ha
Surface water Groundwater
Source: DSİ (2015).
When categorising irrigated agricultural land areas in Turkey developed by DSİ by type of operator (Figure 30), it becomes evident that DSİ is gradually withdrawing from actively operating irrigation areas, while a large and increasing share of operation is being transferred to various WUOs. Table 27 shows the different types of WUOs recognised by DSİ.

Turkey - Water along the food chain
93
Figure 31: Areas opened to irrigation built by DSİ and categorised by operator types, 1995-2013
0 200 400 600 800
1 0001 2001 4001 6001 8002 0002 2002 4002 6002 8003 000
1995
1996
1997
1998
1999
2000
2001
2002
2003
2004
2005
2006
2007
2008
2009
2010
2011
2012
2013
thou
sand
ha
Run by DSİ Transferred to various WUOs
Cost provision built (ha)
Operated by groundwater irrigation cooperation
Source: DSİ (2015).
The process of irrigation management transfers
Irrigation management transfers (IMT) from centralised institutions at a national level (e.g. DSİ) to user organizations have gained momentum in Turkey since 1993. At that time, DSİ decided to change the management pattern by involving farmers in the local management of irrigation networks in order to reduce the budget for operating and maintaining irrigation networks and to improve the distribution efficiency since farmers have better local knowledge (Foreign Relation Office of DSİ, 2014, p.101).
Although DSİ has had a policy of transferring irrigation management since the 1950s, only 72 000 ha of irrigation area under the control of DSİ were transferred by 1993, with DSİ operating the rest, i.e. 95.2 percent of all irrigation schemes (Topcu, 2011). After 1993, based on the recommendation of the World Bank and the EU, IMT was accelerated and the process of handing irrigation management over to local administrations and farmer organizations as WUAs increased dramatically (Mutlu, 2011).
Irrigation management is designed to transfer responsibilities and competencies to the legal persons that represent and manage villages, municipalities, WUAs and cooperatives. An irrigation facility is transferred to the legal person of a village if that facility serves only the agricultural land of that village. The same principle applies in the case of a municipality. A municipality takes over the

94
operation and management responsibilities only if the facility serves the agricultural land within the boundaries of that municipality.
When an irrigation facility serves the land falling within the administrative boundaries of several municipalities, the operation and management responsibilities are transferred to an “irrigation association” formed by these municipalities. Cooperatives, which are legal persons under private law, can take over operation and management responsibilities for irrigation facilities only if their bylaws explicitly empower them to do so, and only if their boards approve the transfers (Topcu, 2011, p.226).
IMT starts with a protocol concerning the terms of agreement between DSİ and the WUOs, clarifying the transfer of management responsibilities. Based on the regulations, the WUOs are responsible for distributing water below the secondary canal, maintaining the canal infrastructure and collecting fees in this zone. The ownership of the infrastructure, the maintenance machinery and the water rights remain with DSİ and the Turkish state.
When the transfer process is completed, DSİ manages the bulk water allocations and the primary canal infrastructure, while WUOs manage the secondary network up to the tertiary intakes. Additionally, WUOs informally organise groups of water users and control water distribution within the tertiary units (Ghazouani et al., 2012, p.26). Table 27 and Table 28 show how the area of the DSİ irrigation development is divided between different institutions in Turkey.
The latest statistics provided by DSİ in these two tables show that more than 2.68 million ha out of 2.85 million ha of the irrigation area under DSİ (based on both surface water and groundwater) have been transferred to WUOs as of 2013. Table 27 shows that WUAs are the major participatory institutions created under IMT.
Table 27: The structure of WUOs, 2013 estimates
type of Wuos no of operations units unit rates (%) area (ha) area (%)
Village authorities 231 24.8 40 095 1.8
Municipalities 168 18.0 78 365 3.5
WUAs 374 40.1 1 954 494 88.5
ICs 139 14.9 110 813 5.0
Rural services 14 1.5 20 909 0.9
Other 7 0.8 4 260 0.2
total 933 100 2 208 936 100
Source: Foreign Relation Office of DSİ (2014, p:73), 2013 estimates.

Turkey - Water along the food chain
95
Areas irrigated by wells and the operating institutions are presented in Table 28. It should be stated that the exploitation of groundwater for irrigation and other activities is reaching its limits (Türker, 2013). It is well known that there is significant use of groundwater through wells without DSİ licenses, particularly in the Konya Basin (Mutlu, 2011). In spite of these problems, specific institutions can be identified for groundwater exploitation for irrigation.
Table 28: The structure of groundwater users for irrigation developed by state or private users
type of Wuosno of
operations units
no. of wells area (ha)
developed by the state
DSİ groundwater irrigation 41 2 051 100 470
State agricultural enterprise (TIGEM) 32 2 161 84 335
GICs 1 426 11 700 482 275
state total 1 499 15 912 667 080
developed by the private sector
Groundwater irrigation licenses granted to individuals by DSİWells without license (estimated)
241 642
180 000
Source: Foreign Relation Office of DSİ (2014, p:110), 2013 estimates, DSİ (2014, p.8).
The transition of the operation and maintenance activities of irrigation systems to the WUOs, especially the WUAs, has a potentially positive side effect regarding social, technical and financial development. Although the WUAs are not able to cover all the rehabilitation costs of canal systems, the positive aspects of the IMT can be summarised as follows (Foreign Relation Office of DSİ, 2014, p.101):
• a sense of responsibility and awareness for the irrigation system is created among users. This may happen through the creation of a sense of ownership, which may lead to enhanced maintenance frequency and quality;
• more reliable and equitable water distribution among the upstream and downstream users of canal water;
• tariff collection rates have increased from 42 percent under DSİ to 90 percent under WUAs; and
• conflict settlement, e.g. in the case of water theft or violation of another farmer’s water rights, at a local level through the council of WUAs.
However, the WUAs show little improvement in term of water use efficiency and better cost recovery. Furthermore, there is weak collaboration between the

96
WUAs in the same irrigation schemes and there are inconsistencies between projected and actual irrigation water demand (Topcu, 2011, p.104).
Discussion: Assessment of water management institutions
This section has reviewed the present and past structure of Turkey’s major institutions related to the management of water resources in general, and primary agricultural irrigation in particular. The development of institutions involved in different aspects of water management in Turkey shows that the relevant institutions and organizations do exist. Although some overlap of duties and activities can be identified between these institutions, the various aspects of water management in Turkey have more or less one institution responsible for them.
The review of institutions in this section has also shown that many important institutions related to water management in Turkey have recently been subject to restructuring or are undergoing reform. It may therefore be appropriate to ask questions about the implications of these reforms on water consumption, whether irrigation water management is more efficient afterwards, whether institutions are able to make decisions more quickly, and whether these changes improve water conservation and the long-term sustainability of water use in Turkey. In this context, it seems evident that the Turkish government should carefully balance the cost of restructuring against the potential benefits.
However, an evaluation of the current state of institutions in terms of a comparative static efficiency analysis would be difficult, because one would first need to define the counterfactual scenario. Furthermore, an in-depth assessment of these questions in comparison with a counterfactual institutional set-up would require the identification of quantifiable indicators. As is commonly found in the economic evaluation of institutions or of partly qualitative policies, such indicators either fail to capture the complexity of the management processes involved or the multi-causal structure of the problem would require an excessively large number of quantitative indicators to be considered simultaneously. This is the main reason why an assessment of Turkey’s water management institutions should be undertaken with care.
Instead, the review of the current structure may be viewed as a description of the relative strengths and challenges of the current institutional set up; potential challenges are in this respect presented by (i) the coordination of multiple institutions that may all refer to the same water management issue and (ii) finding the optimal balance between centralised management (to reap economies of scale) and decentralised management (to address specific regional conditions efficiently).
The development and strengthening of WUOs has in this respect been a major step forward, and may also have contributed to a more equal distribution of water among farmers, while helping create social capital among farmer organizations.

Turkey - Water along the food chain
97
Water resource management policies
In the last section, the organizations and institutions responsible for water management in Turkey were reviewed and discussed. In this section, the focus is on the key laws, policies, plans and programmes that are used for water management within the framework of those institutions.
Key findings:
• Turkey’s water agenda shows that the country has political strategies and goals in place related to sustainable water, with efficient irrigation in agriculture constituting an important element of these strategies.
• Alignment with the EU water management framework as a precondition for potential EU accession has progressed relatively far.
• Inefficient economic incentives are still in place, despite generally ambitious goals and strategies at a national level regarding sustainable water management.
• Policies on water pricing do not encourage water efficiency or cost recovery, particularly in the case of irrigation water.
• Unlike water used for domestic and industrial purposes, irrigation water is not priced according to the quantity actually used because volumetric measures are not widely installed.
• The price charged for each cubic metre of water varies throughout Turkey in different water authorities, i.e. not only in terms of type of use but also according to region and distributing organization.
• Even though PPPs to modernise drinking water, wastewater and irrigation are in principle being considered and welcomed by the Turkish government, they have not yet begun to develop as dynamically for the management of agricultural and non-agricultural water resources in Turkey as they have in other sectors of the economy.
Turkey’s water agenda: Core strategies and laws for water along the food chain
government strategies, objectives and policies. There are several documents that articulate the government’s overall water agenda and related key strategies and policies. The following are the most significant in relation to water along the food chain:
(i) 10th Development Plan (2014-2018). This document addresses land and water management issues from several perspectives. The fundamental objectives of the plan regarding water include (i) the balanced preservation and development of the quantity and quality of water and land resources and (ii) the development of a management structure that provides for the sustainable use of water, especially in agriculture. Box 2 lists specific policy goals from this development plan that refer to water use and water management. However, it should be noted in this context that the 10th Development Plan should really be considered as a long-term agenda towards the goals to be achieved; it does not contain a list of priorities and

98
it does not take into account the extent to which any of these goals may be fulfilled during the time period of a particular development plan.
(ii) Medium-Term Plan (2015-2017). This strategy document has a three-year outlook and is prepared annually on a rolling basis, taking into consideration recent developments in domestic and foreign markets along with the 10th Development Plan’s perspectives (which provide the longer-term strategic orientation). However, goals tend to be formulated in a broad and general manner; and in the 2015-17 version, water is mentioned only once in relation to agriculture, stating that efficient water use in agriculture is still a priority (Ministry of Development, 2014, paragraph 89).
(iii) The National Climate Change Strategy and Action Plan (2011-2023) is a road map for dealing with climate change in Turkey (Ministry of Environment and Urbanisation, 2012). This document defines short- and long-term strategies to deal with water challenges in Turkey up to 2023 and contains one objective with regard to increasing the effectiveness of water management in agriculture (Ministry of Environment and Urbanisation, 2012). A summary of water resource management aspects of this plan in comparison to the similar policies in other OECD countries can be reviewed in OECD (2013).
(iv) Programmes and plans under the Turkey-EU expansion:
Turkey’s intention to join the EU has led to the stipulation of a set of institutional and legislative changes in water resources management policies since 1999. The most important of these programmes are:
a. EU Integrated Environmental Approximation Strategy 2007-2023 (UÇES) was prepared by the former MOEF in 2006. It contains information pertaining to the technical and institutional infrastructure and the environmental improvements that have to be implemented, as well as the mandatory arrangements that need to be established for complete harmonisation and compliance with the EU’s Environmental Acquis Communautaire (EAC) and the effective implementation of the legislation. These are the two preconditions for Turkey to join the European Community (Ministry of Environment and Forestry, 2006).
b. River basin protection action plans (RBPAPs). The EU Water Framework Directive is a key topic for Turkey’s alignment with the EU acquis. In order to comply with this directive, the Turkish Government has adopted a basin-level approach for water management by preparing river basin protection and management plans. 25 RBPAPs26 were finalised between
26 The final reports, which were prepared for each river basin within the framework of river basin protection action plans, can be reviewed in Turkish on the website of the General Directorate of Water Management: http://suyonetimi2.ormansu.gov.tr/su/AnaSayfa/Havza_Yonetimi_Planlamasi_Daire-Baskanligi/HavzaKoruma.aspx?sflang=tr.

Turkey - Water along the food chain
99
2009-2013, identifying short-, medium- and long-term objectives for the protection and proper use of water resources (GDWM, 2015).
c. River basin management plans. In February 2015, with the support of the EU, Turkey began converting RBPAPs to river basin management plans in order to transform the plans into EU-compliant river basin management plans27.
d. The Turkish government is also increasingly paying attention to the water quality issue: Under the Twinning Project completed in 2010 and funded by the Turkey-EU Financial Cooperation Programme “Capacity Building Support to the Water Sector”, Turkey’s surface water quality status was estimated. This was done by taking human pressure and hydro-morphological characteristics in five river basins into account28 (Ministry of Environment and Urbanisation, 2013, p.49).
The above list shows that ambitious goals concerning sustainable management of domestic water resources do indeed exist and are already part of the political agenda. More crucial than the formulation of broader and long-term policy goals, however, is the speed and efficiency with which these goals are approached in reality. In other words, long-term goals and strategies may not achieve true results unless the corresponding measures are taken and followed through, relevant indicators are identified and the degree of goal fulfilment is frequently evaluated.
Chapter 1 of this report has shown that administrative reforms have taken place or are underway regarding the harmonisation of the river basin water resource planning with EU legislation. Unfortunately, no Turkey-wide assessment regarding the degree of implementation of water-related goals of the 10th Development Plan (Box 2), for example, could be located. Evidence gathered during field study interviews in 2015 has revealed no significant progress with respect to irrigation efficiency, and countrywide implementation of volumetric measures has not yet moved beyond pilot regions.
27 Announcement by the EU delegation to Turkey, 3.2.2015, “EU support for water management in Turkey”, last accessed online on 22.04.2015: http://www.avrupa.info.tr/resource-centre/news-archive/news-single-view/article/eu-twinning-projects-meet-at-the-6th-world-water-forum-in-marseille.html.
28 More about the EU twinning project on water quality monitoring can be reviewed here: http://avrupa.info.tr/resource-centre/news-archive/news-single-view/article/eu-twinning-projects-
meet- at-the-6th-world-water-forum-in-marseille.html and http://www.monitoring.ormansu.gov.tr/.

100
Box 2: Broader policy goals regarding water in Turkey’s 10th Development Plan
• Shortcomings and uncertainties in the water management legislation will be eliminated; duties, powers and responsibilities of institutions will be clarified, and collaboration and coordination among all institutions involved in water management will be enhanced.
• A national water basin classification system will be developed enabling protection and sustainable use of water resources (at basin level).
• The quantity and quality of groundwater and surface water will be determined and monitored and a relevant information system will be established; protection and improvement of water resources and the prevention and control of water pollution will be ensured.
• Sustainable utilisation of all the national water potential according to requirements, and charging for its use on a tariff basis, will be ensured.
• By evaluating the effects of climate change and all activities in catchments on water quantity and quality, measures for saving water, combating drought and preventing pollution will be taken.
• For sustainability of irrigation from groundwater resources, policy alternatives such as quantity restrictions and variable pricing will be developed.
• The functioning mechanism of irrigation associations will be reviewed, and alternatives will be developed to improve the system.
Source: Kibaroglu and Baskan, 2011.
special programmes on water-use efficiency in agriculture. The Turkish government has established two special programmes for water use efficiency in agriculture.
The “Effective Use of Water in Agriculture” programme, which is included in the 25 primary transformation programmes under the 10th Development Plan (2014-18). This programme for the effective use of water29 in agriculture will be implemented through five components with 59 activities that address 16 different policies. It targets the improvements and modernisation of the existing irrigation infrastructure with regard to both surface water and groundwater. The programme budget is approximately TL 15 773 billion. The programme envisages:
– increasing drip and sprinkler irrigated areas from 20 to 25 percent – improving the irrigation ratio from 62 to 68 percent – increasing irrigation efficiency from 42 to 50 percent – expanding water efficient irrigation coverage by 10 percent in each of the five planning years
– reducing groundwater use by 5 percent in each of the five planning years
29 This targets efficiency of water use in both surface water and groundwater.

Turkey - Water along the food chain
101
The performance indicators that will be used to gauge progress also assess whether farmers are participating in training events, if irrigated areas are consolidated, if financial self-sufficiency of WUOs (e.g. municipalities, ICs and WUAs) has been achieved and if nitrate pollution constitutes a problem at a specific site. In addition, research projects relevant for one or several of these topics will also receive support (Ministry of Forestry and Water Affairs, 2014).
In the second programme, the MFAL has established contributory grants within the framework of the Rural Development Support programme that was announced in May 2014. The General Directorate of Agrarian Reform (GDAR) will implement the programme jointly with the Agricultural Bank. Under this, 50 percent matching grants will be provided for irrigation machinery and equipment (e.g. farm drips and sprinklers, including linear and centre pivot). In other words, the grants can sponsor up to 50 percent of such investments, which is a substantial reduction in fixed costs for farmers. The use of solar energy for pumping will also be supported. Individual farmers could access up to TL 100 000, and legal entities (e.g. WUOs or village administrations) up to TL 200 000 of the value of the equipment purchased (General Directorate of Agrarian Reform, 2014).
As with the long-term national goals, it has not been possible to identify any publicly available evaluation report about the degree to which these policies may have had an effect on water savings in irrigation. This is perhaps not surprising given that both projects are still ongoing and have been set up fairly recently.
However, given the importance of water savings in agriculture, namely irrigation, it might contribute further to the efficiency of these programmes if an assessment of goal fulfilment were commenced in parallel, rather than leaving it to a final programme impact evaluation after these programmes are concluded.
the legal framework that governs water use along the food chain. There is no single law that regulates water use in agriculture or water along the food processing chain. Instead, several laws, regulatory frameworks, official programmes and legal initiatives interact and have to be considered when establishing an overview of the legal framework within which water is used along the Turkish agrifood chain. The most important laws related to water resource management in Turkey are summarised below:
• DSİ’s Establishment Law (Law No. 6200) authorises the agency to develop, allocate, reallocate and cancel existing allocations of all public water from any source (i.e. rivers, streams, small and large lakes) if deemed necessary. In the case of allocation of water for public services, individual demands for compensation and claims based on kadim ownership rights (i.e. claimed traditional ownership rights without any formal historical record) are invalid. DSİ operates within the framework of Law No. 6200 and Law No. 167 on groundwater. It is not obliged to recognise kadim rights during

102
planning, surveying and feasibility processes and related calculations and assessments. Such rights are evaluated on a case-by-case basis.
• Groundwater falls under the control of central government and is utilised according to the Groundwater Law No. 167 (December 1960). The activities include groundwater exploration, use, protection and authorisation and are covered by the respective items of Law No. 167, where such activities can only be performed by DSİ. In order to implement the law more effectively, the “Groundwater Regulation” and “Groundwater Technical By-law” were prepared. Law No. 167 requires a license for any groundwater development and use. In practice, there are three types of licenses granted: (i) exploration licenses, which are needed prior to drilling or excavation for groundwater (infra)structures, (ii) utilisation licenses when groundwater is readily available in terms of quality and quantity, and (iii) modification licenses, which are granted if there is a need for modification of groundwater structures (Kibaroglu and Baskan, 2011).
In 2011, a temporary item was added to Law No. 167 introducing the following restrictions for the license holder of groundwater structures such as wells, galleries, tunnels and others: (i) license holders who acquired a license prior to the date when the law was enacted have a two year timeframe within which to install a measurement system; (ii) DSİ will cancel the licenses of those license holders who do not establish such measurement systems within this two year timeframe and (iii) DSİ obliges the beneficiary to abandon and close such wells with DSİ receiving the costs of sealing the well from the license holder. On 7 June 2011, the DSİ Regulation on Groundwater Measuring Systems was issued in the Official Gazette No. 27957, and enforces the control of the extraction of registered water uses through electric meter and water meter systems. This is expected to restrict license holders to extracting groundwater within the permitted limits to avoid reductions in groundwater levels (Kibaroglu and Baskan, 2011). Despite these ambitious goals being formulated within the law, however, it was not possible to implement and enforce this scheme within the desired two year period. Instead, tests with metering began in Konya and Ergene basins as pilot regions (Foreign Relation Office of DSİ (2014, p.117)) and this was still the situation during the field interviews in January 2015.
The legal process for defining WUOs, e.g. municipalities, ICs and WUAs, for IMT has evolved in the past 50 years. The transfer of small-scale and marginal irrigation systems was made possible under the Turkish Water Law of the 1950s. However, as explained earlier, IMT only gained momentum after 1993, and as no specific law was available for the WUAs, Village Law No. 442, Municipal Law No. 1580 and Provincial Government Law No. 5442 have been used to establish WUAs since 1995 (Kadirbeyoğlu and Özertan, 2011, p.7). Thereafter, Law No. 5355, which was enacted in 2005, considers WUAs to be local administration associations under the Ministry of Interior (Kadirbeyoğlu and Özertan, 2011, p.8). In 2011, a new Irrigation Associations Law (Law No. 6172) was enacted, which strengthened DSİ’s supervisory role over WUAs by redefining their status

Turkey - Water along the food chain
103
from “local administration associations” to “public legal entities”, subjecting them to an administrative and technical audit and opening up the possibility of their management being taken back into DSİ or being outsourced to the private sector (Ghazouani et al., 2012, p.27 and p.64).
The new Water Law, under preparation as a framework law, is expected to overcome the issues and bottlenecks listed in the above sections. The MFWA shared the draft of a new Water Law with the public in October 2012. The new draft law aims to remove inefficiencies, fragmentation and overlapping responsibilities in the current institutional organization and legal framework, and to remedy shortcomings regarding the implementation of the requirements of the EU Water Framework Directive, among other goals (Kinali, 2013). The draft law covers the following main concepts: (i) integrated river basin management, (ii) participatory framework for water management and (iii) full cost recovery. The draft has been amended based on consultations with a wide range of stakeholders. As of October 2015, the draft law was still under discussion.
Box 3: The legal status of water in Turkey
The Turkish Constitution is the primary legislation in the water sector. It sets the stage for all water use, including ownership and institutional responsibility across all sectors. It considers water as a natural wealth of the country to be used for the benefit of the public under the authority of the state. The Civil Code regulates only a small portion of water legislation and classifies water as either common or private.
Common water includes the sea, running water bodies (rivers which, depending on their size/flow, may be considered as common or private), and still water bodies (small or large lakes). Groundwater is also classified as common water. Therefore, development of common water resources generally comes under state responsibility.
Private water primarily includes the springs that are an inseparable part of the land from which they originate. Ownership of private land entitles ownership of the spring(s) on it. Articles 715 and 756 of the Civil Code, when evaluated together, indicate that, except for privately owned springs, surface and groundwater resources cannot be owned, but are subject to user rights which are granted for beneficial use only, such as domestic and agricultural purposes, fishing, hydropower generation, industry and mining, transportation and medicinal and thermal uses.
Source: Kibaroglu and Baskan, 2011.
As the list of selected water regulations and legal initiatives shows, Turkey has no comprehensive water law framework30. Instead, several laws regulate different aspects of water-related public sector activities (Kibaroglu and Baskan, 2011).
Overall, Turkey’s water management history is characterised by the enactment of various laws and regulations that authorise a number of different institutions
30 A review of specific water laws in Turkey can be found at http://www.loc.gov/law/help/water-law/turkey.php.

104
to manage the same water resources, with potential conflicts over tasks and responsibilities (Kinaci, 2013).
Closer examination of the characteristics of the prevailing legal framework for Turkey’s water management reveals that many of the water-specific laws are outdated and fall short of satisfying Turkey’s current and increasingly complex future water needs.
For instance, in the case of groundwater use, early laws had a “first come, first served” attitude for granting utilisation permits for groundwater. Kinaci (2013) argues that this was not a problem at the time of its enactment when the population of the country was only about 27 million, with almost no industry or large urban demand, and there were sufficient reserves available to comfortably meet needs. These laws, with their current coverage, do not reflect an integrated approach to water-as-a-resource (or commodity) management, although such an approach has been adopted in several official documents, including the five year development plans (Kinaci, 2013).
Clearly, the new Water Law, which was still in preparation when this report was written, constitutes a major opportunity for Turkey to remedy several of the existing inconsistencies in incentives for water usage and institutional inefficiencies regarding water management.
Water pricing policies in Turkey
Water-related issues in Turkey are often planned and managed based on measures of the quantity required, e.g. cubic metres of water. This view is appropriate with regard to the planning and construction of water infrastructures. Inefficiency in water use is also often expressed in terms of physical quantities of water that are lost, for instance during the irrigation process.
However, once the infrastructure is in place, the quantities of water that are used will ultimately be determined by the price per unit of water. In the case of missing market prices, this price will be determined by the shadow price of water, which is the opportunity cost of not using a given unit of water for a specific purpose.
For this reason, water pricing policies constitute an important component in the incentives that govern the use of water. In Turkey, water pricing schemes for irrigation water on the one hand and domestic-industrial water on the other follow two separate paths that are explained below.

Turkey - Water along the food chain
105
irrigation water pricing schemes.The official price of water for irrigation usually comes from using the irrigation service, but does not incorporate the price of water as a commodity. Thus the official irrigation water charge is likely to be very different from the shadow price of irrigation water that farmers are facing. This shadow price is determined by the foregone economic profit incurred by not irrigating crops, as well as further fixed and variable costs of using the irrigation infrastructure and technology.
Instead, the official irrigation water pricing system in Turkey is an area-based pricing scheme that differs by type of irrigation system, region, planted crop and pumping or gravity-based water extraction, but is not a pricing system that would reflect the full economic cost (or opportunity value) of irrigation water for Turkish society as a whole.
The pricing scheme is divided into two main categories, gravity-based irrigation and pumping-based irrigation (Ünver & Gupta, 2003; Cakmak, 2010). The latest decree of the irrigation water tariff for 2014 shows that cereals and meadow pastures employ gravity irrigation and enjoy the lowest tariff (TL 18.41/da in eastern Anatolia and TL 27.62/da in coastal regions) and rice and sugar cane have the highest tariff of all crops and regions respectively (TL 114.45/da in eastern Anatolia and TL 170.04/da in coastal regions) (General Directorate of State Hydraulic Works (DSİ) of Turkey, 2014).
In order to express these per-area tariffs as corresponding prices for irrigation water per 1 000 m3, the following calculation can be applied. A farm may choose to plant 1 000 m2 of any of the crops listed by DSİ (i.e. all major crops grown in Turkey) and may also have different categories of irrigation (e.g. gravity, pumping or both). Furthermore, each crop has an average water requirement per decare.
When averaging the water requirements of all crops listed in the DSİ crop list, and multiplying them by the average irrigation tariff per decare, a price can be determined that reflects the average price per unit of irrigation water in Turkey. According to this, the price for 1 000 m3 of irrigation water should be TL 30.93 and TL 123.72 for gravity and pumping, respectively. This is equivalent to TL 0.03/m3 and TL 0.12/m3 respectively, and thus is very small in comparison to the companies included in Table 21. Interviewed firms in OSBs pay TL 0.29-1.6/m3 and municipalities charge TL 2.6-4.5/m3.

106
Box 4: The status of formal water entitlements
The unavailability or non-existence of long-term formal water certificates (entitlements) for farmers in Turkey is an issue of potential importance on which little research exists. The availability of formal, tradable water entitlements to irrigators may constitute an important cornerstone for establishing a water resource management and regulatory water governance system for agriculture, with full power to license and enforce water extraction and discharge. Such entitlements are particularly important for irrigation WUOs that may be at risk of losing their access to water as a result of an agreement made between DSİ and a private company’s use of dams for generating hydroelectric power.
Source: Kibaroglu and Baskan (2011, p.20 and p.22).
Clearly, this comparison may at first glance appear problematic because water used for irrigation in primary agriculture is being compared with water paid for by agribusiness firms for food processing. From an economic perspective, however, it is irrelevant which sector is using a certain cubic metre of water, because each unit of the resource can only be used once. The comparison therefore indicates that primary agriculture is enjoying irrigation water at a much lower price than food processing, assuming comparable water quality.
domestic-industrial water pricing schemes. The available data from different water authorities in Turkey shows that the price charged for each cubic metre of water varies based on the region and the authority. Although the water pricing for domestic and industrial use is volumetric, the latest update provided by Turkey’s MFWM shows that different methods of pricing are being followed in different regions.
For instance, Bursa and Izmir are increasingly following block pricing for domestic uses, which is not the case all over Turkey (the majority of municipalities follow linear water pricing). Table 29 shows the summary of water prices for domestic and industrial use in Turkey in 2014. Water pricing by municipalities in Turkey targets full-cost recovery of their water provision (Sumer & Muluk, 2011). The lowest prices in the table are in this respect about 15-20 times higher than the DSİ charge of TL 0.12/m3 of pumped irrigation water.
Table 29: The summary of water prices for domestic and industrial use in Turkey, using the example of two different regional water authorities (Gaziantep and Bursa)
average price (tl/m3)
standard deviation of price (tl/m3)
Max. price and region
Min. price and region
Domestic 4.23 2.00TL 10.47/m3 for
more than 200 m3 in Gaziantep
TL 2.03/m3 in Erzurum
Industry 7.33 1.71 TL 10.43/m3 in Bursa
TL 4.51/m3
Erzurum
Source: Authors based on data from Turkey’s Ministry of Forest and Water Management (2015).

Turkey - Water along the food chain
107
However, it should be emphasised that the DSİ rate is only an inferred unit price per 1 000 m3 water, which can at best be used as an indication of the valuation of irrigation water in comparison to water charges by municipalities per unit of water. However, this rate does not constitute a “price” of irrigation water.
Furthermore, the amount of water that is actually used on a farm cannot be determined. Since volumetric measures are not installed on tertiary canals and the volume of water is not measured at farm gate level, the water that is delivered to the farm is not measurable and this is still the most common practice of irrigation water distribution in Turkish agriculture.
In other words, the DSİ tariffs may reflect fairly low irrigation water prices. However, if a farmer takes more water per hectare than the average water requirements per crop used for the calculations, then the unit price would drop even further because the farmer would not be charged for it.
Based on available international evidence, area-based water pricing is not successful in achieving water saving targets or in expanding water-efficient irrigation consumption practices (Tsur & Dinar, 1997). Furthermore, this price mainly covers the operational costs of the WUAs as they mainly collect the water charges, and capital cost recovery of the irrigation water facilities and water provision establishments is not a primary objective for DSİ (Cakmak, 2010b).
As mentioned by OECD (2010, p.84), the subsidised water charges and electricity for pumping do not stipulate sustainable irrigation water use, particularly not in the case of groundwater extraction, which is even more difficult to monitor. However, a missing or inappropriate pricing system for irrigation water may increase a farmer’s income and is thus similar to an income transfer. However, this transfer may be happening at the expense of Turkey’s future water resources. Additionally, its non-volumetric nature may cause overuse of water and therefore have a potentially negative impact on the yield of irrigated crops.
the dsİ cost recovery policy for groundwater development. Before it was abolished, the GDRS used to run the services and facilities of groundwater wells free of charge to farmers. This has changed under DSİ’s administration. For instance, the recovery cost for digging a well has been calculated free of interest, and facilities have been transferred to cooperatives in accordance with the transfer contract prepared by DSİ.
The transfer contract used to comprise an operational period of 30 years, the first five years of which were a grace period, and the following 25 contained a cost recovery schedule. During this 30 year period, operational groundwater wells would be renewed just once, but motor pumps used to be renewed twice. In June 1997, a prime ministerial decree reduced the grace period to three years, and payment to 12 equal annual instalments (Foreign Relation Office of DSİ, 2012, p.65; Mutlu, 2011, p.227). This shows that groundwater

108
development is still heavily subsidised overall. As the interest rate is calculated at zero, the beneficiary WUOs effectively do not fully reimburse the total amount of the cost to DSİ (Mutlu, 2011, p.234).
Thus, the current water pricing practice in Turkey is far from the full cost recovery principle defined by the EU Water Framework Directive (WFD, para. 38). In different sectors, such as agriculture, industry or private households, water pricing is determined in Turkey such that capital and service costs are fully or at least partially internalised (Kibaroglu et al., 2012, p. 31).
Due to Turkey’s ambition to comply with the EU’s Water Framework Directive, it is not unlikely that water pricing policies in Turkey will be revised sometime in the near future, such that capital and service costs will be covered and possible external environmental effects included in the pricing schemes (all of which are requirements of the EU directive).
Box 5: PPPs and water infrastructure in Turkey
Turkey’s medium-term and short-term development plans have emphasised the importance of PPPs for investment. Paragraph 590 of the 10th Development Plan has mentioned the extensive use of PPPs for different infrastructure investments such as water and wastewater. Their use in water infrastructure is also given priority in paragraph 130 of the Medium-Term Programme (2015-2017).
In Turkey, the Built Operate Transfer (BOT) is one of the major types of PPP (Kibaroglu and Ahmetova, 2015). The available statistics from the World Bank show that in 2013, for example, Turkey came second after Brazil in the world ranking for public-private investment (PPI).
This ranking demonstrates the large size of the investments, which stood at USD 17.1 billion and USD 12.5 billion in 2013 and 2014 respectively for Turkey (World Bank PPP, 2015). The electricity sector had attracted the greatest investment during this period and the water and wastewater sector the least.
PPPs in Turkey’s water sector have been implemented mainly at the level of municipalities (Kibaroglu and Ahmetova, 2015). One of the unsuccessful examples of PPPs in the water sector was in the Izmit municipality, where a BOT agreement between the Turkish government and the UK-based Thames Water company ended unsuccessfully in 1999. The project involved the construction of a water reservoir for the treatment and distribution of water. The project budget was USD 900 million and the water would be purchased over a 15 year period at negotiated prices. In the end, the municipality of Izmit and neighbouring municipalities refused to buy water from the plant as it was too expensive. The Turkish government was then expected to compensate for subsequent losses (Montfort et al., 2014, p.15).
Source: Kibaroglu and Ahmetova (2015); World Bank PPP (2015); Montfort et al. (2014).

Turkey - Water along the food chain
109
A comparison of government support measures for Turkish agriculture
Key findings:
• Turkey’s consumption of irrigation water is not only affected by policies that target irrigation water consumption directly, but also by other agricultural policies that determine incentives given to farmers to produce water-intensive products.
• National self-sufficiency in agrifood products is often desired by policymakers and a concerned public, but can almost never be justified from an economic perspective.
• Turkey’s agricultural PSE is in line with the average of other OECD countries. However, Turkey maintains a relatively high share of agricultural subsidies that are connected to units of output and therefore create strong incentives for farmers to increase the production of certain agricultural products.
• According to the OECD measure of single commodity transfer, beef/veal is the most heavily subsidised agricultural product in Turkey based on transfers per tonne of output. It is the second most heavily subsidised product group in terms of total transfers. Closely related to this, milk production attracts most of Turkey’s single commodity transfers, while the average amount per tonne of milk produced is much lower and in line with many other Turkish agrifood products.
• A review of Turkey’s blue water footprint for beef production shows that Turkey is at a comparative disadvantage for the various production systems compared to the blue water requirements used by the global average of countries to produce one tonne of beef. For example, if Turkey replaced one tonne of imported beef with domestic beef, this would require about 48 percent more blue water in Turkey for industrial feedlot-based beef production compared with the blue water consumption of the average global feedlot.
• Expressing total water consumption per unit value of export prices can serve as a rough approximation of the opportunity cost of water in the production of different agrifood products in Turkey. Products such as poultry meat, eggs, tobacco, grapes and tomatoes receive a fairly small PSE and require a relatively low total amount of water per dollar export value. In contrast, beef/veal, sunflower and cottonseed are fairly heavily subsidised per unit of output and at the same time have some of the highest water consumption per dollar export values.
• Unless more water-saving production strategies are developed and implemented, it would be beneficial to Turkey’s water resources to have low self-sufficiency in beef production.
One objective of Turkey’s 10th Development Plan is to develop a globally competitive and environmentally-friendly Turkish agricultural sector, while providing sufficient and balanced nutrition for the population in Turkey. The main emphasis is on more efficient use of water, although the first part of htis chapter lists several measures that the Turkish agrifood industry needs to adopt if this is to be achieved.
However, these measures and objectives largely do not take into account the potential effect that other agricultural policies, at first glance unrelated to water,

110
may have on the incentives farmers have to use irrigation water. This is because farming policies may encourage farmers to favour certain crops, products or techniques over others that greatly influence the allocation of water resources.
Designing truly “water-smart” economic incentives for Turkey’s agrifood value chains therefore requires a joint evaluation of farm policies and water consumption patterns of major agricultural crops and animal products. Given that water is widely used in Turkish agriculture, it is necessary to assess production and market incentives that come out of Turkish domestic economic policies, even if these do not explicitly target water consumption. For evaluations of this kind it is crucial to determine appropriate criteria and benchmarking values against which an analysis can be conducted.
For instance, agricultural policymakers sometimes declare “self-sufficiency ratios” as political targets. Self-sufficiency ratios measure the proportion of a country’s consumption of a certain product that is covered by domestic production. A high degree of self-sufficiency is often interpreted as a satisfactory level of domestic productivity with respect to a certain product, while self-sufficiency ratios significantly below one are typically interpreted as indications of structural weakness and a lack of competitiveness. For instance, Ocak, Ögün and Emsen (2013) argue that “[t]here is a real opportunity for Turkey to better utilize its rich water resources and become self sufficient for its animal production systems by adopting irrigated pasture improvement for grazing”.
Clearly, if self-sufficiency ratios are adopted as targets for agricultural policies, water resources should be directed at and made available to those sectors that currently demonstrate the lowest levels of self-sufficiency. However, economic theory suggests that targeting self-sufficiency ratios as political objectives is often questionable, for at least the following reasons:
(i) Demand may exceed supply even though production may be perfectly competitive.
(ii) Low degrees of self-sufficiency are typically not considered a problem for imported manufactured goods. Thus, as long as a country is in principle able to trade, it seems reasonable to fill the gaps between domestic supply and demand through imports, and this also applies to food products.
(iii) A relatively low degree of self-sufficiency may indeed indicate that a country does not have a comparative advantage in producing this specific product, while instead being internationally more competitive at producing other goods. Basic economic theory suggests that countries and companies should specialise in those sectors where they can achieve a comparative advantage.
Thus, economic theory suggests that Turkey should direct water resources primarily at those crops and livestock sectors where it enjoys a comparative

Turkey - Water along the food chain
111
advantage. In other words, Turkey’s water resources will be used most efficiently in agricultural sectors where the country would not be substantially better off by sourcing them from the global market. Such international competitiveness is empirically difficult to measure accurately.
However, the OECD monitors and compares the agricultural and trade policies of its member countries. Turkey is an OECD member country and a summary of OECD’s assessment of Turkish agricultural policies can be obtained from the OECD (2014).
One important measure in this context is the PSE, which is “an indicator of the annual monetary value of gross transfers from consumers and taxpayers to support agricultural producers, measured at farm gate level, arising from policy measures, regardless of their nature, objectives or impacts on farm production or income” (e.g. border protection and production-based subsidies)31. According to the OECD (2015), the PSE for Turkey in 2013 was similar to the average producer support proportion of gross farm receipts in all OECD countries. This implies that the average Turkish farmer did not receive a substantially larger proportion of his or her income from government transfers and protectionist border policies than the average farmer in all OECD countries.
However, the composition of this support in Turkey (Figure 32) involves a much larger proportion of direct support based on commodity output (16.1 percent of producer support versus 8.5 percent in all OECD countries combined) and to a minor proportion of payments based on input use (1 percent of producer support). Other payments account for 2 percent of producer support, while payments not requiring production (“decoupled payments”) were not in place in 2013 and 2014, but were in place in the decade before.
From an economic perspective, support based on commodity output potentially distorts the market more than payments not requiring production, because the former type of support not only improves farm incomes but also distorts markets by providing additional incentives for the production of specific agricultural commodities.
The PSE has to be distinguished from the total support estimate (TSE), which is the total support given to the farm sector in a country expressed as a proportion of that country’s GDP. This total support includes the support covered under PSE and additional support to the agricultural sector as a whole, but also potential consumption subsidies for agrifood products.
31 Source: OECD. Accessed at: https://stats.oecd.org/glossary/detail.asp?ID=2150.

112
Figure 32: The producer support estimate in Turkey and all OECD countries, 1990-2010
Source: OECD-FAO (2015).
The nominal protection coefficient (Figure 33) is the ratio between the average price received by producers and the border price. If this coefficient is greater than one, it expresses the average price increase that domestic farmers receive relative to the international market level. As can be seen in the figure, the TSE is higher than the nominal protection coefficient, primarily because the general support services estimate (GSSE) is not included in the nominal protection coefficient but is part of the TSE. For Turkey, the GSSE has fallen almost entirely in recent years into the category “Marketing and Promotion”, which includes import tariff refunds and export promotion programmes for example.
Figure 33: Comparison of selected support measures for Turkey and all OECD countries, 1990-2010
Source: OECD-PSE (2015).

Turkey - Water along the food chain
113
In Figure 34, the producer single commodity transfer for the year 2013 has been displayed in Turkish lira, both per tonne of national output and according to total governmental expenditure. For both units, the figure shows similar tendencies: beef is the most heavily supported sector, and milk is also heavily supported in absolute terms, even though the support per tonne is small in comparison to sunflower, sheep meat and apples. Grapes, tomatoes and tobacco do not receive support, at least none that is taken into account in the single commodity transfer estimate. For eggs, aggregate support is slightly negative, which indicates that overall this product group is taxed rather than subsidised.
Different volumes and intensities of single commodity transfers reflect the different weights that policymakers give to the producers of each of these commodities. Policymakers are often not only following strategic goals, such as the achievement of a desired degree of self-sufficiency, but also giving in to farmers’ lobbying efforts for farm income support. The beef and dairy sector in Turkey is heavily covered by subsidies, which indicates that farm incomes and output rates are not considered satisfactory in this sector from the government’s perspective. From an economic perspective, however, it is generally questionable to use output subsidies in order to achieve goals such as higher levels of self-sufficiency or improved productivity.
Figure 34: Producer single commodity transfer 2013 in Turkish lira and per tonne of output
- 1 000
0
1 000
2 000
3 000
4 000
5 000
SCT, TL/t SCT total, million TL
Source: Authors based on OECD-PSE (2015).

114
Instead, standard economic analysis suggests that productivity gains should be achieved through investment in modern technologies, and policymakers should not try to interfere with structural changes that can lead to existing resources, such as land and labour, being used by the most productive farms. However, if income support for a certain group of farmers is desired from a social welfare perspective, economic theory suggests that direct income transfers would be able to achieve the same goals without having to distort markets through excess production.
No attempt is made in this report to further quantify the economic cost of Turkey’s farm policies in terms of foregone economic welfare. Instead, the emphasis is on an analysis of the potential cross-effects of these agricultural subsidies with respect to water use. It is therefore necessary to link the single commodity transfers to the water footprint of each of these commodities. However, simply expressing commodity transfers per cubic metre of water used in the production of each product is not meaningful because the water footprint is not in the first instance a normative measure of water opportunity use, but merely a positive description of water usage under a typical production technology at a specific geographical location.
Furthermore, there are three different concepts of water footprint, namely the green water footprint, the blue water footprint and the grey water footprint. While the green footprint tries to capture the product-related water balance due to rainfall and evaporation and the grey water footprint refers to the waste/water balance, only the blue water footprint is considered here. The blue water footprint refers to groundwater extraction or other man-made influences that actively bring additional water into a certain production system; in other words, the blue water footprint may not describe the largest total amount of water used in the production process of some agricultural product, but it is the share of water usage that can most easily be influenced by the farmer and therefore is the most relevant for policy analysis. Furthermore, it is the one that can also most easily be measured and charged for if adequate infrastructure is in place.

Turkey - Water along the food chain
115
Figure 35: Turkey’s blue water disadvantage in beef production
2,90%
4,32%
10,25%
4,22%
2,05%
3,17%
6,94%
3,53%
0%
2%
4%
6%
8%
10%
12%
Grazing-basedproduction
Mixed system Industrial feedlot Output-weighted average ofproduction systems
Turkey World output weighted average
Source: Authors.
Figure 35 shows that beef production in Turkey has a higher share of blue water in its total water footprint than the weighted average of all global beef production (weighted by output quantities). This observation is true even when distinguishing between grazing-based production systems and more intense feedlot systems. The difference can be explained by the fact that Turkey uses more groundwater resources than the global average of beef production systems. Therefore, if Turkey imports beef from countries that in relative terms have more rain-fed pasture in use for beef production, it would achieve a positive balance in its corresponding “water deal”, since rainfall would implicitly be imported while saving on domestic groundwater usage.
In turn, assuming that Turkey replaces one tonne of imported beef with beef produced in Turkey, in grazing-based systems this would consume 41 percent more blue water than the average corresponding unit of beef on the global market consumed in its country of origin. Figure 35 shows that this ratio increases to about 48 percent more blue water consumed in Turkey for industrial feedlot-based beef production relative to the average global feedlot. Thus, Figure 35 indicates that Turkey has a comparative blue water disadvantage in beef production, and this disadvantage is even more pronounced with more intense, industrial production systems.

116
When trying to compare the relative water efficiency of different agricultural sectors in Turkey, it is not very meaningful to refer to physical output quantities. Instead, in Figure 36 blue and green water (in m3) are plotted against USD 1 of revenue that one tonne of output of this product could generate based on international prices (2013 data). In other words, the figure displays total water consumption of Turkish agricultural products in relation to their opportunity cost (or opportunity value) in global markets, i.e. when imported or exported.
In Figure 36, the red line shows the national simple average value and the black line has it weighted by total water consumed. The fact that the weighted average is almost double the simple average indicates that the agricultural commodities most prevalent in Turkey today (i.e. those that represent the largest proportion of total water consumption in the agricultural sector) are also those with the highest cubic metre water consumption per USD (the less “water-efficient” ones in terms of the amount of water needed to obtain USD 1 revenue).
Figure 36: Turkey’s blue and green water consumption per international market dollar output value
0,0
1,0
2,0
3,0
4,0
5,0
6,0
7,0
8,0
9,0
m3/
US
D
Weighted average m3/USD (weighted by total absolute quantity of water used)
Simple average m3/USD
Source: Authors.
It is also useful to compare the different levels of support and protection (PSE %) that major agricultural products in Turkey receive, and to relate these

Turkey - Water along the food chain
117
protection measures to the amount of water that required for one USD revenue to be obtained on international markets. Figure 37 plots the average PSE for 2011-2013 on the vertical axis. On the horizontal axis, the figure plots total blue and green water (in m3) used to produce USD 1 of revenue according to international prices.
Figure 37 enables the identification of three clusters of agricultural products:
(i) The grey area contains a number of agricultural products that can be considered to have fairly low water consumption for the generation of the equivalent value of USD 1 on international markets. At the same time, the products in this grey area also receive little support and can be considered to generate the highest value for the Turkish water used.
(ii) The green area containing potatoes and apples tends to receive a relatively high level of government support while requiring relatively little water in order to generate the equivalent value of USD 1 on international markets.
(iii) The red area identifies agricultural outputs with a relatively high water consumption to reach USD 1, while at the same time receiving significant support (PSE of between 10-50 percent). Clearly, this group of agricultural products, which also includes beef and veal, must be considered to generate the lowest value for the Turkish water used.

118
Figure 37: Turkey’s blue and green water consumption per dollar on international markets relative to the average producer support estimate
WHEAT
BARLEY
MAIZE
SUNFLOWER
REFINED SUGAR
MILK
BEEF AND VEAL
POULTRY MEATSHEEP MEAT
APPLES
EGGSGRAPESTOMATOES
POTATOES
COTTON (cottonseed)
TOBACCO0%
10%
20%
30%
40%
50%
60%
70%
0,0 1,0 2,0 3,0 4,0 5,0 6,0 7,0 8,0 9,0
Source: Authors.
However, Figures 36 and 37 consider total water consumption. As discussed before, the use of blue water is potentially more crucial from the perspective of domestic water resource use and should therefore also be assessed separately from green water consumption. Figure 38 presents Turkey’s blue water consumption per USD on international markets relative to the average PSE during the years 2011 to 2013. (Note that in this graph cotton would appear as an outlier, with very high support and high blue water consumption per USD generated on international markets. In order to keep the graphical presentation as clear as possible, cotton has therefore been excluded).
The distinction of clusters of products is less clear in Figure 38 than when considering total water (blue plus green) in Figure 37. However, it still allows at least two groups to be identified, of which the one in the centre of the graph exhibits a high water need per USD revenue while at the same time also receiving substantial domestic support. Interestingly, this group contains dairy and beef/veal, as well as maize – a major fodder crop used in both sectors.

Turkey - Water along the food chain
119
Clearly, political incentives to further increase the share of fodder maize produced on irrigated land will increase the proportion of blue water in the total water footprint of dairy and beef (see Figure 35), which means that, relative to the global average of these products, Turkey would use even more of its blue water resources.
Figure 38: Turkey’s blue water consumption per dollar on international markets relative to average producer support estimate
WHEAT
BARLEY
MAIZE
SUNFLOWER
REFINED SUGAR
MILK
BEEF AND VEAL
POULTRY MEATSHEEP MEAT
APPLES
EGGSGRAPES TOMATOES
POTATOES
COTTON (cottonseed)0%
10%
20%
30%
40%
50%
60%
70%
0,00 0,10 0,20 0,30 0,40 0,50 0,60 0,70 0,80
avg
PS
E 2
011-
2013
blue water m3/USD
Source: Authors.
Thus, throughout the analysis presented in this chapter, beef production emerges as a good example for studying the importance and the potential of aligning agricultural policy goals to economic incentives that use water resources in a “smarter” way.
Subsidising this sector in order to achieve a high degree of national self-sufficiency (as some authors and policymakers suggest) means ignoring the opportunity cost of not being able to use this water for other, potentially more competitive products. Instead, rather than focusing on absolute production increases as a seemingly desirable measure, agricultural policy makers in Turkey should realise that beef and veal production is not only rather costly to produce

120
in Turkey from an economic perspective, but also means a relatively high level of total and blue water consumption per dollar of output value generated according to international market prices.
Furthermore, this observation is true both for a comparison of Turkish water footprints for beef relative to the global average water footprint, and for the comparison of water usage between different agricultural products in Turkey. Under this logic, the target of achieving a high degree of self-sufficiency in beef production appears questionable. In turn, the analysis presented here would suggest that unless more water saving production strategies are developed and implemented, it would be beneficial to Turkey’s water resources to have low self-sufficiency in beef production. Consequently, importing fodder from areas where it can grow under a higher proportion of green water usage is not a signal of sectoral weakness, but may in the medium- to long-term constitute a substantial saving of Turkey’s water resources.
In summary, Turkey should not continue to subsidise the use of blue water in beef production by providing special incentives to irrigate maize, but instead should incentivise “water-smart” productivity increases in primary beef production. Examples of such measures include a further improvement in animal genetics towards high-productivity breeds (as currently in place under the 10th Development Plan), roughage production based on less water-intensive crops and imports of roughage or beef carcasses.

Turkey - Water along the food chain
121
Chapter 4 – red meat case study
This chapter presents the findings and results of a case study featuring issues related to the efficiency of water use along the red meat value chain in Turkey. Field interviews were conducted at various sites in Turkey and the results were analysed in combination with available research and secondary statistics. The chapter is organised as follows: the first section presents an overview of the macroeconomic drivers and dynamics behind meat consumption and red meat production in Turkey and highlights the important structural characteristics of the meat supply chain in Turkey. The next section focuses on technical aspects of water use along the red meat chain, while the last section reviews, compares and analyses relevant Turkish policies that indirectly and directly affect water consumption in the red meat chain.
Dynamics and efficiency of the red meat processing value chain
Key findings:
• Red meat demand and production in Turkey have grown steadily in the past decade and this trend is expected to continue.
• The price of beef – the largest red meat category – has increased in Turkey and is comparatively high in relation to other countries. Rising prices partly reflect the fact that more refined processing levels of fresh and chilled cuts have recently gained unit value compared to lower level processing.
• Primary production of red meat animals in Turkey is characterised by a fragmented structure of small farms, while the average weight of cattle slaughtered in Turkey is low, which has implications for the country’s water use efficiency.
• An international comparison shows that the production cost of beef in Turkey is fairly high, pointing to limited international competitiveness in the sector.
• Turkey has a comparative disadvantage in the export of live red meat animals, red meat and roughage compared to major global red meat exporters.
• A significant share of Turkish red meat slaughtering and processing still takes place in informal conditions, and the processes are largely hidden from quality control and environmental monitoring.
Trends in meat supply and demand in Turkey
Turkey is an upper middle-income country with moderate economic growth. After the 2008 financial crisis, annual GDP growth is now back to the level of pre-crisis years, at 9.2 percent. Between 2010 and 2014, average annual GDP growth was 4.6 percent, while the average consumer price inflation rate was 8 percent.

122
In its outlook for the period between 2014 and 2023, the OECD expects Turkey’s GDP to grow by an average of 4.3 percent per annum – one of the highest projected growth rates for this period of all OECD countries. Food imports as a percentage of merchandise exports in Turkey between 2010 and 2014 have been stable at around 4.5 percent, while food exports as a share of total merchandised exports are stable at between 10 and 11 percent (World Development Indicators, 2015).
Turkey’s population is projected to reach 82 million by 2020, up from 77.69 million at the end of 2014 (with projections of 5 percent population growth per annum until 2020) (OECD-FAO, 2015). Turkey is thus experiencing strong population growth and is also at a stage of macroeconomic development where continued growth in per capita income will translate into rising overall expenditure on food consumption, but also into rising absolute and relative expenditure on meat consumption. This is because consumers enjoying rising income levels in the upper-medium income range typically diversify their food expenditure patterns from largely cereal-based diets towards higher proportions of animal protein.
Consequently, the forecast from the FAO-OECD Agricultural Outlook shows that total meat consumption between 2014 and 2024 will increase by 20 percent for beef and veal and by 17 percent for poultry (Figure 39) while the per capita consumption of wheat will decrease by about 2 percent (from 211 kg/capita to 207 kg/capita) in the same period (OECD-FAO, 2015).
In this context, it is important to distinguish between “red meat” and “white meat”:
• Red meat: This is meat from mammals. It contains more myoglobin (“red”) than meat from other species. In the context of Turkey, the red meat category includes cattle, sheep, goat, camel, rabbit and game. Pork is also part of the red meat category, but for cultural reasons is not consumed in Turkey.
• White meat: This category of meat typically includes poultry meat and fish; however fish is not considered in this report. The term “white meat” is used synonymously with poultry meat here.

Turkey - Water along the food chain
123
Figure 39: Projected evolution of meat consumption by different categories, 2014-2024
8.3 8.9 8.7 8.7 8.8 9.0 9.2 9.4 9.6 9.8 10.0
16.1 16.1 16.7 17.4 17.6 17.8 18.0 18.2 18.4 18.6 18.9
3.8 3.9 3.9 3.9 3.9 4.0 4.0 4.0 4.0 4.1 4.1
0
2
4
6
8
10
12
14
16
18
20
2014 2015 2016 2017 2018 2019 2020 2021 2022 2023 2024
kg/c
apita
Beef & veal Poultry Sheep meat
Source: OECD-FAO (2015).
Note: Goat meat is not included in sheep meat.
Per capita consumption of all red meat categories combined amounts to about one-half of the per capita consumption of poultry. Corresponding total beef consumption in Turkey is projected to grow by 34 percent between 2014 and 2024, while total poultry meat consumption projected to rise by 28 percent by 2024. Thus, the projected growth in demand for poultry is slightly lower than the projected growth rates for red meat. Similarly, the consumption of sheep meat is expected to rise by 17 percent from 2014-2024, with per capita consumption increasing accordingly by 6.5 percent.
Figure 40 presents the production values of major red meat categories in Turkey. It should be noted, however, that the relative importance of red meat consumption in comparison to poultry meat may be understated because goat meat is omitted from the OECD Agricultural Outlook projections. The amount of goat meat production, although small, has nevertheless been in the range of about 20 percent of sheep meat production since 2010.

124
Figure 40: Production quantities of major red meat categories , 2004-2014
0
200
400
600
800
1000
1200
1400
1600
1800
2000
2004 2005 2006 2007 2008 2009 2010 2011 2012 2013 2014
Thou
sand
ton
nes
Sheep Goat Cattle Poultry
Source: TUIK (2015) and FAOSTAT (2015) for poultry.
Note: Data include slaughtering in slaughterhouses and also estimates of informal slaughtering from 2010.
As regards the production quantities of cattle meat (beef), Figure 40 shows a dramatic increase in 2010. This is due to a change in the compilation of statistics undertaken from this period onwards to include estimates of meat production under informal schemes (TUIK, 2015) such as slaughter and direct marketing on farms or the sale of live animals to private individuals or restaurants who slaughter and process these animals directly. Such estimates are possible for statistical agencies if there are reliable national inventories of animals. In this respect, Turkey has adopted a register of bovine animals similar to that of the EU.
A comparison of 2008 and 2009 levels with 2010 and 2011 levels of beef production suggests the existence of a “shadow” production of meat in the magnitude of 50-100 percent of the amount of meat production accounted for in official statistics prior to 2010. However, the fact that this shadow production is now better reflected in official statistics does not imply that this type of slaughtering is being monitored more closely.
Instead, Figure 40 indicates that a significant proportion of Turkish red meat production still takes place in informal conditions, and the corresponding processes are largely hidden from quality control and environmental monitoring.

Turkey - Water along the food chain
125
Figure 41: Share of meat categories in the production value of all agrifood products according to the FAOSTAT classification, 2007-2013
4.7%4.3%
6.4%5.9%
6.7% 6.7% 6.5%
9.8%
8.3%8.3%
13.1%
11.5%
12.4%12.2%
0%
2%
4%
6%
8%
10%
12%
14%
2007 2008 2009 2010 2011 2012 2013
perc
ent
shar
e
Share of white meat in total agricultural production value
Share of red meat in total agricultural production value
Source: FAOSTAT (2015).
Figure 41 presents the meat categories’ share of Turkey’s total agricultural production value. This total agricultural production value comprises marketable crops and crop products and low-level processing, e.g. sugar, but no further processing levels such as sugar confectioneries. In terms of animal production, typical products of animal origin such as eggs, honey, milk and meat are included, while corresponding products with higher processing levels are not (FAOSTAT, 2015).
The figure also shows that since 2007, the proportion of white meat in the total agricultural production value of Turkey has increased by 2 percentage points from around 4.5 percent to 6.5 percent. At the same time, the proportion of red meat in this total agricultural production value has been fluctuating, rising from roughly 9 percent in 2007/08 to more than 12 percent in 2012/13 – an increase of 3 percentage points.
There may be several reasons behind this slightly higher growth rate of red meat in comparison to white meat. For instance, different policy incentives may favour beef production over poultry production. Red meat may also have benefited from relatively more favourable export opportunities compared to

126
white meat, which cannot be determined without further analysis. A third reason is that the expansion seen in production might be in response to the relative increase in demand among the Turkish population, which would be in line with the trends implied by Figure 39. If this last reason is true, it would indicate that as income levels rise and meat consumption increases, Turkish consumers are favouring red meat over white meat.
Given that prices reflect the equilibrium in supply and demand, Figure 42 can be interpreted in a similar way:
Figure 42: Wholesale meat prices in Turkey, 2005-2014
9,6 10,311,2 11,7
13,4
18,4 18,517,5
15,817,1
2,4 2,73,6 3,7
4,8 4,9 5,4 5,4
0
5
10
15
20
25
2005 2006 2007 2008 2009 2010 2011 2012 2013 2014(3)
TL/k
g
Sheep meat Beef Poultry meat
Source: TUIK (2015).
Figure 42 shows that wholesale meat prices in Turkey have progressed slightly differently since 2005. While the price of poultry meat has grown steadily and more than doubled since 2005, prices for sheep meat and beef have almost doubled in the same period but the changes have been more dynamic. These dynamic changes reflect similar patterns in Turkey’s GDP growth, which rapidly recovered within a year of the financial crisis and has since continued to grow at around 4.5 percent per year.
Thus, at the current state of Turkey’s macroeconomic development, red meat consumption may be slightly more income sensitive than white meat
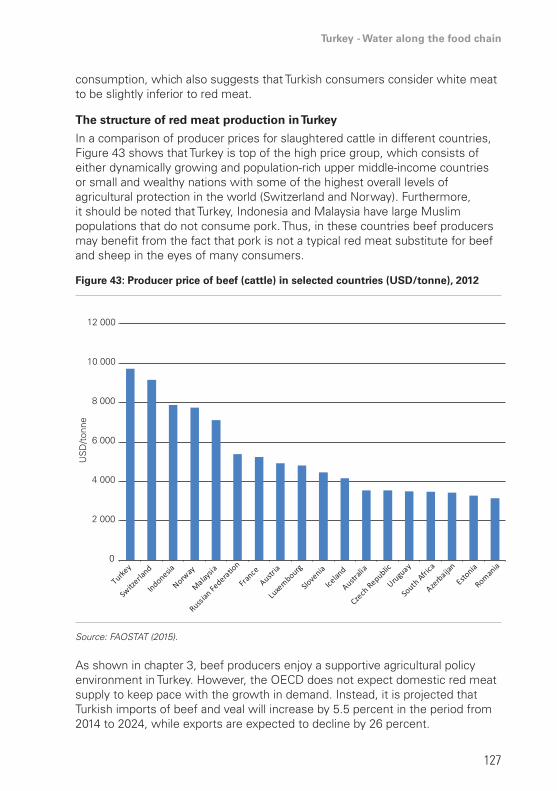
Turkey - Water along the food chain
127
consumption, which also suggests that Turkish consumers consider white meat to be slightly inferior to red meat.
The structure of red meat production in Turkey
In a comparison of producer prices for slaughtered cattle in different countries, Figure 43 shows that Turkey is top of the high price group, which consists of either dynamically growing and population-rich upper middle-income countries or small and wealthy nations with some of the highest overall levels of agricultural protection in the world (Switzerland and Norway). Furthermore, it should be noted that Turkey, Indonesia and Malaysia have large Muslim populations that do not consume pork. Thus, in these countries beef producers may benefit from the fact that pork is not a typical red meat substitute for beef and sheep in the eyes of many consumers.
Figure 43: Producer price of beef (cattle) in selected countries (USD/tonne), 2012
0
2 000
4 000
6 000
8 000
10 000
12 000
US
D/t
onne
Source: FAOSTAT (2015).
As shown in chapter 3, beef producers enjoy a supportive agricultural policy environment in Turkey. However, the OECD does not expect domestic red meat supply to keep pace with the growth in demand. Instead, it is projected that Turkish imports of beef and veal will increase by 5.5 percent in the period from 2014 to 2024, while exports are expected to decline by 26 percent.

128
Meanwhile, domestic production of beef will probably experience 2.67 percent growth over the same period, which means that production is not expected to be able to keep pace with the expected 4 percent growth in consumption.
It can therefore be assumed that domestic demand will, in principle, provide sufficiently strong domestic market incentives for Turkish beef producers to invest in their sector further. However, the Turkish beef sector has repeatedly been described as highly fragmented, dominated by small-scale structures and subject to strong policy interference (e.g. Helix Management Consultants, 2014; OECD-FAO, 2015).
Furthermore, due to a declining availability of rain-fed natural pastures in combination with relatively high land prices, the prospects for beef production do not suggest that this sector will be able to expand production in the near future on a much larger scale than is currently estimated. Instead, several structural factors have to be taken into account when assessing the efficiency of the Turkish red meat sector (hereafter with a particular emphasis on beef):
• The relatively low feed conversion ratio of beef cattle in the range of 4.5:1 to 14:1 is inefficient in comparison to pork (3:1) or poultry (1.9:1). The ratios in Turkey are fairly inefficient when compared to other beef-producing countries (Helix Management Consultants, 2014). These low feed conversion ratios are mostly due to the fact that ruminant animals consume a higher fibre diet and energy is lost as methane through rumen fermentation. Further inefficiencies arise if the quality of feed is heterogeneous and poor.
• The limited availability of land suitable for the production of roughage feed will continue to present a fundamental obstacle to large-scale beef production in Turkey, even if structural change allows the sector to exploit economies of scale further.
• The use of low-productivity genetic breeds is still widespread, although the government is currently trying to introduce incentives to adopt more productive bovine genetics in Turkish agriculture.
• The small-scale structure of farms. Only approximate figures are available concerning the distribution of farm size classes, but according to these figures, about 80 percent of all Turkish farms with bovine animals have fewer than 10 head of cattle (TUIK, 2015). The share of farms with a herd size of more than 50 bovine animals, which would be a size comparable to the lower limit for professional farms in Europe, is definitely below 1 percent of all farms with bovine animals in Turkey. However, these larger farms alone account for roughly 10 percent of the Turkish bovine population. On the other hand, the 80 percent of bovine farms in Turkey with fewer than 10 animals each represent 43 percent of the national cattle stock.
• An analysis of sheep and goat production reveals a more uneven distribution of animals between farms. In this sector, farms with over 300 animals make

Turkey - Water along the food chain
129
up less than 2 percent of all sheep and goat production in Turkey, but hold almost 16 percent of the Turkish sheep and goat population. On the other hand, small producers with up to 50 head account for 72 percent of this type of operation (relative to all farms with sheep and goat production in Turkey), but together account for around just 25 percent of Turkey’s sheep and goat population (TUIK, 2015).
• Given that a significant proportion of live cattle, sheep and goats in Turkey have to be collected from small or very small farms, this typically implies high transaction costs in the form of the effort made by market participants in the areas of search, transportation and price information. High transaction costs have widely been described in economic literature as impediments to market integration and a typical reason for fragmented markets. This problem of fragmented markets can be seen in Figure 44.
Figure 44: Producer prices per live male cattle in different Turkish provinces
2009
2009
2009 20
09
2009
2009 20
09
2009
2009
2010 20
10
2010
2010
2010
2010
2010
2010
2010
2011
2011
2011
2011
2011
2011
2011 20
11
2011
2012
2012
2012
2012 20
12
2012
2012
2012 20
12
2013
2013
2013
2013
2013
2013
2013
2013 20
13
0
1000
2000
3000
4000
5000
6000
7000
Tekirdağ İzmir Konya İstanbul Türkiye Zonguldak Diyarbakır Çankırı Kırşehir
TL/h
ead
Source: TUIK (2015).
The figure shows that farm gate prices for live cattle (here bulls older than 24 months, which is a typical slaughter age) vary widely by province. Out of all Turkish provinces, the four on the left of Figure 44 show the highest average prices for live cattle in the years 2009 to 2013. The central panel for Turkey (Türkiye) shows the national average prices, and the four provinces on the right show the lowest four averages between 2009 and 2013. Indeed, average prices for live cattle in some Turkish provinces can be almost double those in other provinces.

130
In summary, these observations point to a rather difficult structural situation for red meat production in Turkey. With regard to international competitiveness, however, it is important to assess the cost structure of a sector rather than the characteristics of the physical production structure alone. Comparable full cost assessments for beef production are available for many countries from the “Agri-benchmark” research network (Agri-benchmark, 2015). However, Turkey is not part of this network and therefore no comparable cost figures for beef production in Turkey are readily available.
Sahin et al. (2009) have published a full cost assessment of beef production in Turkey based on animals fattened under idealised conditions on experimental farms in Turkey. The actual fattening took place in 1999 with representative Turkish breeds. These data have been updated by Sahin et al. (2009) for input and output prices during 2007.
Figure 45 combines these Turkish total production cost estimates per 100 kg carcass weight with selected agri-benchmark figures from the same year (Deblitz et al., 2009).
Figure 45: Total production cost per 100 kg carcass weight in different countries, 2007
0 100 200 300 400 500 600 700 800 900
Brazil, Tocantins region
Brazil, Argentina other low
Brazil, Argentina other high
Australia low
Australia high
Canada
Poland
France
Turkey, idealised conditions*
Austria
Indonesia
Norway
Euro per 100kg carcass
*Assumptions and sources: carcass weight in Turkey 292 kg, which is the average value in Table 2 of Sahin et al. (2009); total production cost average across breeds is TL 1 862.22 from Table 3 of Sahin et al. (2009); annual exchange rate in 2007: TL 1 = EUR 0.56. Values for other countries have been obtained from a chart in Deblitz et al. (2009).
The total production cost estimates by the Agri-benchmark network typically refer to representative farms in a certain region and reflect the cost structure of a sample of the more successful farms. The Turkish data however refer to

Turkey - Water along the food chain
131
conditions on experimental stations and should therefore be considered as the lower cost boundary. In other words, the value indicated for Turkish beef production in Figure 45 is likely to be substantially higher for the majority of Turkish beef producers.
Nevertheless, the figure shows that, even under idealised conditions, Turkish beef production was not competitive in 2007, according to the cost structure estimated by Sahin et al. (2009) comparing major global beef-exporting nations. For instance, the Turkish total production cost was three times higher than that of the global cost leader in the Tocantins region in Brazil.
Of the selected European countries, Poland was able to produce 100 kg of beef at a lower total cost than Turkey under idealised conditions, while the latter was able to produce it slightly more cheaply than France. In this context it should be noted that beef is regarded by the European Commission as a “sensitive product” in international trade negotiations, implying that the EU considers its competitiveness in this sector as particularly weak.
Thus, it can be concluded that the Turkish red meat sector in general, and the beef sector in particular, are subject to several structural problems that may affect their ability to meet the expected domestic increase in demand.
Turkey’s trade in red meat products
It is therefore not surprising that, despite being a major exporter of a wide range of agrifood products, Turkey is in a negative net trade position when it comes to beef and live cattle. Figure 46 presents information on Turkey’s net export value in major red meat, live animal and processed meat product categories – other red meat categories that are not displayed in the figure typically exhibit a zero or slightly positive trade balance. From 2010 to 2014 not only live animals, but frozen red meat products and offal as well were imported on a large scale.
The fact that the net export value was again approaching self-sufficiency levels in 2014 may at first glance look like a success. However, this may only partly be due to improvements in sectoral efficiency. Instead, the extent to which Turkish agricultural policies currently provide incentives for the expansion of beef production has to be taken into account. For instance, a refund system compensates for the difference between the domestic price of imported feed and the world market price, which is explained further later in this chapter.
The political reasons and economic drivers behind these trends are complex and an analysis of them is beyond the scope of this report. However, Helix Management Consultants (2014) provide a qualitative review of recent events such as macroeconomic changes, the outbreak of avian flu in 2008 and changes to agricultural and trade policies in Turkey.

132
Figure 46: Net exports of Turkish red meat products, 2004-2014
Live bovine animals
Live sheep and goats
Meat of bovine animals, fresh or chilled
Meat and edible offal of poultry
-1000 000
-800 000
-600 000
-400 000
-200 000
0
200 000
400 000
600 000
800 000
2004 2005 2006 2007 2008 2009 2010 2011 2012 2013 2014
net
expo
rt v
alue
in t
hous
and
US
D
Source: Comtrade (2015).
As described in chapter 2, trade competitiveness can also be assessed using the NRCA index. This index is explained in more detail in the appendix.
Figure 47 presents NRCA index calculations for white and red meat products in Turkey from 2007 to 2014. The fact that this index is consistent across products and over time facilitates trend comparisons. The figure shows that almost all meat product categories have a comparative disadvantage in Turkey relative to other agrifood exports and all other industrial exports.
The exception within this category lies with the “poultry meat and offal” product category, which within seven years has been able to shift from a comparative disadvantage to a substantial comparative advantage. Apart from this category, Figure 47 shows that only further processed meat of mixed categories (the “meat and edible meat offal” category) have a small comparative advantage. This category may contain red and white meat in different proportions.
The strongest comparative disadvantage can be observed for preparations of animal feed, live sheep and live poultry, as well as roughage feed and red

Turkey - Water along the food chain
133
meat. Furthermore, according to the NRCA index in Figure 47, over time this comparative disadvantage is getting worse for “frozen beef”, “fresh or chilled sheep meat” and “live sheep”. However, the comparative disadvantage for the “frozen goat meat”, “live goats” and “live poultry” product categories has diminished during the same period.
Figure 47: Normalised revealed comparative advantage index for meat products, 2007-2014
2007
2007
2007
2007
2007
2007
2007
2007
2007
2007
2007
2007
2007
2008
2008
2008
2008
2008
2008
2008
2008
2008
2008
2008
2008
2008
2009
2009
2009
2009
2009
2009
2009
2009
2009
2009
2009
2009
2009
2010
2010
2010
2010
2010
2010
2010
2010
2010
2010
2010
2010
2010
2011
2011
2011
2011
2011
2011
2011
2011
2011
2011
2011
2011
2011
2012
2012
2012
2012
2012
2012
2012
2012
2012
2012
2012
2012
2012
2013
2013
2013
2013
2013
2013
2013
2013
2013
2013
2013
2013
2013
2014
2014
2014
2014
2014
2014
2014
2014
2014
2014
2014
2014
2014
-0,03 -0,025 -0,02 -0,015 -0,01 -0,005 0 0,005 0,01 0,015
Food waste andprepared animal feed
Sheep, live
Poultry, live
Meat of goats, fresh,chilled/frozen
Hay and fodder,green or dry
Meat of bovine animals,frozen
Goats, live
Meat and edible offalof the poultry
Meat of sheep,fresh/chilled
Bovine animals, live
Meat of bovine animals,fresh or chilled
Live animals, nes
Edible offal of bovineanimals, frozen
Source: Authors’ data based on Comtrade data.
Note: nes = not elsewhere specified.
Structure of the red meat processing sector in Turkey
Assessing the structure of the red meat value chain in Turkey “from farm to fork” presents a challenge due to the limited availability of disaggregated data, and because production activities in SMEs as well as informal production and

134
marketing activities play a relatively important role at various stages of the supply chain. In light of these limitations, the following section aims to analyse important structural characteristics and trends concerning the enterprises and corresponding employment in the Turkish red meat chain.
Obtaining reliable data about a further breakdown of slaughtering and meat-packing companies within the Turkish red meat supply chain is also difficult. Interviews with government representatives and representatives of the Butchers’ Federation in Turkey suggest that changing regulations and certification schemes result in the number of companies fluctuating on a monthly basis.
Table 30 shows that the number of registered slaughterhouses in Turkey is moderate in comparison to Germany for example, while the number of small and medium-sized butcher shops is difficult to quantify precisely. Germany has been chosen for comparison because of data availability and a comparable population size (Germany’s population in 2014 was 81 million). Furthermore, Germany represents a mature economy in which structural change in the meat sector can be expected to be more advanced than in an upper middle-income country such as Turkey.
The table suggests that in comparison to Germany, Turkey has a comparable number of registered slaughterhouses, while the number of butcher shops appears to be extraordinarily high. However, this comparison of the two countries can only provide an order of magnitude for the number of companies in the Turkish meat sector, because a large proportion of the red meat slaughter capacity in Germany is allocated to the slaughtering of pigs, and no information is provided in Table 30 about the capacity of these slaughterhouses.
Table 30: Number of slaughterhouses and butcher shops in Turkey and Germany, 2014-2015
number of slaughterhouses in turkey in 2014
number of butcher shops in turkey in
2014
number of slaughterhouses in
Germany in 2015
number of butcher shops in germany
in 2015
about 550* about 23 800** 760*** 5 005****
* Food Safety Information System, https://ggbs.tarim.gov.tr/.** Registered tradesmen according to President of the Butchers’ Federation in
Turkey, anonymous information in newspapers (http://www.ekonomigazetesi.net/gazeteler/20140313gazete.pdf).
*** https://apps2.bvl.bund.de/bltu/app/process/bvl-btl_p_veroeffentlichung?execution=e1s9.**** 2 122 of these are butcher shops and slaughterhouses combined, mostly SMEs.
https://apps2.bvl.bund.de/bltu/app/process/bvl-btl_p_veroeffentlichung?execution=e1s9.
Source: Survey results.
The total number of people employed in Turkish meat processing (red and white meat slaughter and processing) in comparison to total employment in the Turkish food processing industry is presented in Table 31. In the years 2009-

Turkey - Water along the food chain
135
2012, the proportion was stable at around 10 percent, implying that the entire meat processing sector in Turkey employed around 10 out of 100 workers in the country’s total food manufacturing sector.
All meat processing (red and white) together, however, accounts for just 1 percent of total industrial employment (not shown in Table 31). It should be noted that these figures ignore employment in primary agriculture related to red meat production. No reliable figures about the number of employees in bovine and sheep animal production could be obtained.
Table 31: Number of employees in meat processing in enterprises with more than 20 employees, 2009-2012
2009 2010 2011 2012
Total slaughter and meat processing (I)out of total food manufacturing 9.6% 9.9% 10.7% 10.6%
Red meat slaughter (II) out of total slaughter and meat processing (I) 12.6% 11.6% 15.3% 14.0%
White meat slaughter (III) out of total slaughter and meat processing (I) 65.2% 69.5% 69.4% 69.2%
Meat processing (red and white) (IV) out of total slaughter and meat processing (I) 22.2% 18.9% 15.3% 16.8%
Source: TUIK NACE Rev.2 industry data.
Table 31 further shows that, in 2009 of the 9.6 slaughterhouse and meat processing workers out of 100 workers in food manufacturing, 65.2 percent were employed in the white meat slaughter industry in 2009. This share had risen to 69.2 percent by 2012. At the same time, it can be seen from Table 31 that the number of workers in red meat slaughterhouses was much smaller, as indicated by their share of 12.6 percent of meat processing industry employment in 2009, although this share had slightly increased to 14 percent by 2012.
Since both red meat and white meat slaughter have gained a higher proportion of meat industry employment, it is evident that these shares have been lost by the third category, which is the downstream meat processing industry (only red and white meat statistics combined are available). This industry category refers to processing tasks after the slaughter stage.
Thus, the observed trends point towards an expansion of the poultry slaughter industry without a proportionate expansion in the subsequent processing stages. One explanation for this could be that Turkey has gained a comparative advantage in exports of poultry meat during the years under observation. Thus, expansion of this industry has been export driven, which is also in line with the NRCA index trend seen in Figure 47.

136
Figure 48: Number of red meat processors with more than 20 employees, 2005-2013
0
10
20
30
40
50
60
2005 2006 2007 2008 2009 2010 2011 2012 2013
num
ber o
f re
d m
eat
proc
esso
rs
No. of firms, fresh or chilled carcases, half-carcasses and quarters with bone in, of beef and veal
No. of firms, beef and veal fresh or chilled cuts
No. of firms, sheep, lamb & goat
No. of firms, fats of red meat animals
No. of firms, inedibale ofals of red meat animals
Source: TUIK (2015).
Figure 48 shows that meat processing in general is a sector in Turkey that has attracted the entry of new companies in recent years. The fastest growth in the number of firms is observed in companies that produce fresh or chilled cuts of beef, while the number of firms working on less refined processing stages, such as carcasses, half-carcasses and quarters with bones, has been growing at a slower pace.
The number of firms that process sheep and goat meat has recently also been growing, while the number of firms that process red meat animal fats or inedible offal has increased substantially since 2005 (Figure 48).
Figure 49 shows computed value added at factor cost per full-time equivalent employee in the Turkish meat industry. As in Table 31, this figure differentiates between three different industry sectors: slaughter activities of red meat, slaughter activities of white meat and further meat processing that is not distinguishable into red and white meat. Figure 49 shows that each full-time equivalent employee in further meat processing during the years 2009 to 2012

Turkey - Water along the food chain
137
generated about TL 40 000 per year in terms of value added. In comparison, red meat slaughtering generated lower value added per worker, but shows a rising trend. Furthermore, slaughtering of poultry initially generated a higher value added per worker, but shows a declining trend. Longer time series would be required in order to identify any longer-term trends in this respect.
Figure 49: Value added at factor cost per full-time equivalent employee
0
10 000
20 000
30 000
40 000
50 000
60 000
2009 2010 2011 2012
TL/f
ull-t
ime
equi
vale
nt e
mpl
oyee
Slaughter of red meat Slaughter of poultry Meat processing beyond slaughter (red+white)
Source: TUIK NACE Rev.2 industry data.
It is also important to consider the potential proportion of informal employment in meat processing because this may constitute a higher risk of neglecting or violating minimum standards, e.g. as set out by hygiene regulations relevant to meat production which are highly relevant for water use along the red meat chain.

138
Figure 50: Total employment and informal employment in Turkey
55,4
9,813,6
4 5,5 3,5 2,5 3,8 1,90
10
20
30
40
50
60
1-9
10-24
25-49
50-99
100-2
49
250-4
99
500-9
99
1 000-4999
5 000
+
perc
ent
firm size category, number of employees
0
10
20
30
40
50
60
70
80
1-10 11-19 20-49 50+pe
rcen
t
Total Non-agriculture
Source: OECD Entrepreneurship at a Glance (2013).
That said, no disaggregated estimates are available on the extent of informal employment in the Turkish red meat processing industry. However, Figure 50 presents recent OECD statistics on the estimated overall role of informal employment by company size in Turkish industries. According to these estimates, more than half of all Turkish firms have fewer than 10 employees, and in these firms the share of informal employment ranges from slightly more than 50 percent for non-agricultural companies to 70 percent for all companies including agriculture.
The numbers reproduced here are OECD estimates. No separate figures about informal employment in Turkish agriculture could be obtained. It should be noted that the difference between the total and non-agricultural columns in the right panel of Figure 50 cannot be interpreted directly as informal employment in agriculture.
When considering the sales value per unit of two different types of processed beef categories, Figure 51 shows that the increase has been substantial since 2005. In this graph, the unit value of fresh carcasses has been indexed to 100, and the unit values of fresh or chilled cuts from beef are expressed relative to that. It becomes evident from this figure that the more refined processing levels of fresh and chilled cuts have gained unit value relative to the lower level of processing represented by fresh or chilled carcasses, half carcasses and quarters with bones.

Turkey - Water along the food chain
139
Figure 51: Unit value of sales in red meat processing companies with more than 20 employees, 2005-2013 (nominal values)
0
50
100
150
200
250
2005 2006 2007 2008 2009 2010 2011 2012 2013
Rel
ativ
e pr
ice
inde
x
Unit value sales, beef and veal fresh or chilled cuts
Unit value sales, fresh or chilled carcasses, half-carcasses and quarters with bone
Source: TUIK (2015).
The figure shows that the difference between the unit value of the lower-level processing of fresh carcasses has grown by about 30-50 percent compared with the unit value of the higher-level processed cuts for beef and veal.
Figure 52: Gross investment per company with more than 20 employees, 2009-2012 (nominal values)
0.350.38
0.43 0.420.5
0.9
0.3
0.411.3
17.3
20.5
15.8
0
5
10
15
20
25
0
0.1
0.2
0.3
0.4
0.5
0.6
0.7
0.8
0.9
1
2009 2010 2011 2012
Mill
ion
TL/f
irm
Mill
ion
TL/f
irm
Slaughter of red meat
Meat processing beyond slaughter (red+white)
Slaughter of poultry (right axis)
Source: TUIK (2015).

140
Figure 52 shows the gross investment per company in the Turkish meat sector. On the secondary axis, investment per company involved in slaughtering poultry is presented, while the “slaughter of red meat”, and “total red and white meat processing beyond slaughter” categories are displayed on the primary axis. The graph shows that investment in the years observed was lowest for red meat slaughterhouses, not exceeding an average of TL 430 000 per company per year.
Average investment in the meat processing industry has been more volatile, but has also never exceeded an average of TL 1 million per company. However, average investment per poultry slaughtering house in Turkey has been up to 20 times higher than the average firm level across investments in red meat or meat processing. This may explain the growth in Turkey’s comparative advantage (according to the NRCA index) in the export of poultry meat, as shown in Figure 47.
Figure 53: Margins along the red meat value chain
Feed cost, 8 Feed cost, 10Live animal cost, 4
Live animal cost, 4,5Grower OPEX, 2,5Grower OPEX, 4,5Producer price, 1
Producer price, 1Slaughterhouse price, 1Slaughterhouse price, 1Traders' price, 2
Traders' price, 2,5Deboning cost, 6
Deboning cost, 8
Retail price, 32
Retail price, 60
0
10
20
30
40
50
60
70
80
90
100
Lower end Upper end
TL/k
g
Source: Presentation based on industry interview data conducted by Helix Management Consultants (2014).
Figure 53 presents the red meat value chain in Turkey based on representative price ranges. The figure shows typical lower and higher price ranges in the left and right panels, respectively. This means, for instance, that the retail price that the final customer pays may vary between TL 55 and TL 91/kg.

Turkey - Water along the food chain
141
Relatively high overall farm gate prices for beef, however, do not imply that the producer margin would necessarily be high as well. Figures 53 and 54 show that producer margins are substantially lower than retail margins, depending on feed cost and the cost of the live animal. The precise farm gate margin is difficult to assess because of the high proportion of family labour involved. Where family members pay themselves a competitive wage, these earnings are accounted for as operating income and are therefore included in farm-level operational expenditure as “Grower OPEX”. Larger commercial farms have to pay full labour costs, while family farms typically reduce the remuneration for their own labour input in times of low prices or rising input costs.
Figure 54: Average margin shares along the red meat value chain
feed cost
live animal costgrower OPEXproducer marginslaughterhouse margin traders margindeboning cost
retail margin
0%
10%
20%
30%
40%
50%
60%
70%
80%
90%
100%
Source: Presentation based on industry interview data conducted by Helix Management Consultants (2014).
The significant trader margin can be attributed to the high transaction costs of collecting beef from a large number of (fairly small) slaughterhouses and distributing the beef to butchers and butcher shops (see Table 30). High transaction costs in this context refer to the costs of communication, transportation and negotiation between many small and medium-sized firms32. The data underlying Figures 53 and 54 were gathered during field interviews by
32 For a recent analysis of the role of transaction costs in the context of value chains and market participation, see e.g. Swinnen, Deconinck, Vandemoortele and Vandeplas (2015).

142
Helix Management Consultants in 2014. Table 32 presents further price ranges that have been assumed in the calculation.
Table 32: Assumed prices underlying Figure 54
average prices used in calculations unit lower end upper end
computation of feed cost
Concentrated feed TL/kg 0.70 0.75
Barley TL/kg 0.65 0.75
Roughage TL/kg 0.25 0.35
Cost of live animal TL/cattle 1 100 1 300
Source: Helix Management Consultants (2014).
It should be noted that the information provided in Figures 53 and 54 constitutes a margin analysis along the value chain for beef based on observed market price ranges. However, the graphs do not include explicit estimates of total cost for any of the value chain stages presented.
When comparing the price level in Table 32 with the price level in Figure 46, it should be noted that the average carcass price for beef cattle in Turkey was around TL 15/kg in the years 2010-2013. During 2012, the annual average exchange rate was TL 1 to USD 0.5571, implying that one metric tonne of beef had a value of USD 8 356 that year, which is roughly in line with the FAO value in Figure 46. It is also important to realise that the Turkish live animal price in Table 32 refers to animals that typically weigh much less than cattle slaughtered in Europe or North America, due to the poor selection of races. Furthermore, slaughtered carcasses lose about another 50-60 percent of weight relative to a live animal.
When computing the average weight per slaughtered head of cattle according to FAO statistics, this figure ranges between 250 and 290 kg per carcass in the years 2010 to 2013. With respect to water along the red meat chain, this finding is potentially relevant because slaughtering lightweight cattle means that proportionately more feed (and water) resources have to be used to produce bones, hides and offal. In addition, it is likely that lower amounts of marketable meat are generated per animal and relatively more feed is spent on sustaining the animal’s metabolism. In absolute terms, the picture may still look different when heavy and light animals are compared. Therefore, it should be emphasised that these considerations concern relative water efficiency rather than to absolute water consumption.

Turkey - Water along the food chain
143
Water use in the red meat processing value chain
Key findings:
• Water consumption in Turkish slaughterhouses is greater per tonne of processed carcass in larger plants than in SMEs because large facilities typically obey stricter hygiene standards.
• Overall, cleaning tasks account for 10-30 percent of water consumption in red meat processing.
• More traditional approaches to slaughter and meat processing tend to require less water, but have been observed to use water inefficiently at times.
• The adoption of EU-type processing technologies will therefore require the establishment of a “water saving culture” among companies and employees.
• Total water consumption during processing is small in comparison to the blue water footprint of primary cattle and sheep production, reflecting the broader trend of relatively low water consumption in food processing compared to primary agriculture.
• Water saving in red meat processing can nevertheless be incentivised through appropriate pricing of groundwater usage from company-owned wells and appropriate pricing of tap water.
• The introduction of plant-based measures of water consumption could be a first step in this direction.
Beyond the farm gate, water consumption in slaughterhouses and meat processing units varies in Turkey, depending on the capacity of the unit, the availability and type of cold chain, the structure of hygiene practices and the training of employees. Field interviews revealed that the quantity of water consumed in slaughterhouses with low capacity and poor attention to hygiene regulations and standards normally tends to be lower than the quantity of water consumed in larger slaughterhouses that observe regulations and certification requirements (Table 33). However, this does not necessarily imply that smaller firms would use their water more efficiently.

144
Table 33: Water consumption in Turkish slaughterhouses (cattle)
source environmental assessment report
average small and middle-level processing units
large-capacity plants
Unit capacity (head of cattle) General 200-350 -
Real slaughtering per day per unit (head of cattle)
- 25-35 150-300
Dressing percentage - 52 percent-67 percent 55 percent
Water per head of slaughtered cattle 1 m3 0.25-0.4 m3 1.3 m3
Water to produce one tonne of carcass (calculated based on avg. carcass weight)
3.5 m3 /tonne (average carcass
weight 280 kg)
1.7 m3 /tonne (average carcass
weight 230-250 kg)
5 m3 /tonne(average carcass
weight 260 kg)
Water per staff member per day 0.15 m3 -
Water per tonne of processed meat products
2 m3
Source: Environmental
Assessment Report
Source: Field interviews, January
2015
Source: Field interviews, January
2015
Source: Field interviews and Environmental Assessment Report: Ministry of Environment and Urban Planning.33
Table 33 shows that the Environmental Assessment Report from the Ministry of Environment and Urban Planning in Turkey for planning in slaughterhouses calculates 1 m3 water for the slaughter process of one head of cattle. Assuming an average carcass weight of 280 kg, 3.5 m3 of water is needed per tonne of carcass. The Environmental Assessment Report also shows that 0.25 m3 of water is required for each sheep or goat. However, no field data about sheep or goat slaughtering could be gathered, therefore Table 33 refers to cattle alone.
33 http://www.csb.gov.tr/gm/ced/index.php?Sayfa=duyuruliste&Il=1 (in Turkish, last accessed 20.3.2015).

Turkey - Water along the food chain
145
Table 34: Water consumption in meat processing units with delicatessen products and minced meat
source Middle-level meat processing units
large-scale meat processing unit
Monthly carcass requirement 150-250 tonnes 4 500-5 000 tonnes
Approximate monthly final products (delicatessen) 200 tonnes 1 500 tonnes
Approximate monthly final products (fresh meat, minced meat, etc.) - 2 500 tonnes
Monthly water requirements 3 000-4 000 m3 13 000-15 000 m3
Water requirement per tonne of carcass 10-12 m3 2.5-3 m3
Water resources Well, tap water, buying in tank Well, tap water
Proportion of water cost 1.5 percent of operating costs
Source: Field interviews with two meat processing units in Istanbul (January 2015).
In addition, the report recommends making an additional 150 litres of water available for use by personnel, and 2 m3 water for processing 1 tonne of carcass meat into final products such as salami, sujuk, burgers, pastirma, smoked meat, etc. (not shown in the table). Furthermore, the meat processing plant must include pressurised water facilities and a water-disinfection system. The report considers 18 litres of blood production per head during the slaughter process. Appropriate processing of blood is potentially a major issue for wastewater management because blood can lead to a high biochemical oxygen demand (BOD) and may seriously harm surface water-based ecosystems.
According to interviews with technical employees involved in the slaughter process, during the actual slaughter process, most of the water is required for tasks such as cleaning the floor, facilities and equipment (especially knives). These cleaning tasks account for 10-30 percent of total water consumption. Extraction of offal (intestines) takes another 10 percent of total water consumption during slaughter. If the production unit cleans cattle offal for further use, then this constitutes the major water-consuming activity on top of the actual requirements for slaughtering. As discussed in chapter 2, the use of a washing machine for intestines can reduce water needs for this task by up to 30 percent compared to the current practice of washing by hand under running water.
Beyond the slaughter process, water usage in further meat processing varies, depending on the type of processing product. Results from field interviews show that the processing and production of delicatessen products (sausages,

146
sujuk, etc.) or packed meat products (fresh meat, minced meat, etc.) is more water intensive than fresh meat production or minced meat production. This is primarily due to additional requirements for hygiene and cleaning. Typically with such types of production, 25 percent of total water used is considered for the staff’s daily sanitation requirements (Table 34). The results in this table can therefore be considered to reflect the upper limits of water consumption for meat processing beyond the slaughter stage.
A comparison of the results of the field survey and international observations (Table 35) makes it clear that if Turkey’s meat industry moves towards more advanced and equipped stages of processing akin to the meat industries in many EU countries, then the water consumption in this industry will have to increase in order to meet the relevant hygiene standards. However, this will require the adoption of more efficient water management practices throughout Turkey’s meat industry in order to ensure that modernisation of the (red) meat chain will not lead to excessive and inefficient water usage.
In other words, in comparison to international benchmark figures of water consumption in the red meat industry, Turkey may currently not be among the top consumers of water in terms of cubic metre per tonne of meat produced. However, this is due to outdated slaughter and meat processing techniques rather than the result of efficient water management. Actual water usage practices among these less water-intensive processing techniques have been observed to be rather inefficient. Converting these inefficient practices into modern and more water-intensive slaughter and meat processing techniques may well imply a drastic increase in inefficient water consumption in Turkish red meat chains.

Turkey - Water along the food chain
147
Table 35: International water use benchmark values for food processing (not including primary agricultural production)
segment Value low
Value high
Bench-mark unit
Production process / task Year source region/
country
Cattle 1 200 1 300 l/animal
Slaughterhouses with integrated
meat cutting, deboning and
further processing
2002 (1) Finland
Cattle 1 000 l/animal 2001 (2) Denmark
Cattle 1.6 9.0 m³/t carcass Average for entire production process 2007 (3) Bolivia
Meat 13.6 18.1 l/kg Meat packing After 2002 (4) USA
Meat processing 0.5 1.0 m³/t raw
materialAverage for entire
production process 2007 (3) Bolivia
Mixed species 9.9 17.5
l/kg slaughtered
animals
Slaughterhouses with integrated
meat cutting, deboning and
further processing
2002 (1) Finland
Sheep 5 556 8 333 l/t sheep carcass
Average for entire production process 2005 (5) Not
Specified
Sheep 1 667 l/t sheep carcass
Red and green offal treatment 2005 (5) Not
Specified
Sheep 278 l/t sheep carcass Skin preservation 2005 (5) Norway
Blood rendering 2 000 2 300 l/t blood Average for entire
production process 2005 (5) Not Specified
Rendering 500 1 000 l/t raw material
Average for entire production process 2005 (5) Scandinavia
Cattle 1 000 l/animalAverage for entire
production process in slaughterhouse
2014 (6) Turkey
Sheep 250 l/animalAverage for entire
production process in slaughterhouse
2014 (6) Turkey
Source: IFC benchmarking tool:
(1) Finnish Environment Institute, Finnish expert report on best available techniques in slaughterhouses and installations for the disposal or recycling of animal carcasses and animal waste.
(2) EPA Denmark, Cleaner technology in the meat processing industry.(3) IFC, Environmental, health and safety guidelines, MEAT PROCESSING.(4) DPPEA, Clean technologies in U.S. industries: Focus on food processing.(5) EU IPPC, Reference document on best available techniques in slaughterhouses and animal by-
products industries.(6) Environmental Assessment Report, Ministry of Environment and Urban Planning, Turkey.
Source: IFC Food Processing Benchmark Tool (2015).

148
According to information collected on field visits to Turkey, the slaughterhouses and advanced meat processing units mainly receive their water from three different sources: wells, taps and the purchase of water in tanks.
Of these three main options, withdrawing groundwater from a well tends to be the least costly option and tap water the most expensive. However, survey results indicate that water cost as a share of total operating cost of slaughterhouses and meat processors only ranges between around 1.5-3 percent. This figure is representative for the facilities that were visited in the metropolitan regions of Ankara and Istanbul and refer to cost to the companies of the water required for 2014 at a price of TL 4/m3. These cost share estimates do not include any additional costs incurred with wells, tanks, filtering or repair of the water facilities.
Furthermore, the industrial area of East Istanbul is threatened by the depletion of groundwater resources. One of the respondents stated during field interviews that the groundwater level in this region had dropped by 30 metres in the last five years, without having any noticeable effect on the still relatively low price at which water can be obtained.
If efforts were made to regulate water use for meat processing purposes, water consumption patterns and related water costs would be significantly affected, especially for companies that actually pursue water management practices that are not up to standard. The technologically most advanced facilities in Turkey belonged to companies such as NAMET or the Milk and Meat Board. In these facilities, water is used according to international industry standards such as ISO or the Environmental Assessment Report.
Of course for hygiene reasons, meat processing facilities have to use a certain amount of water, and the more modern facilities have advanced filtering equipment in place, which ensures that the water used complies with predefined quality standards at all times. Beyond that, true water consumption is very difficult to measure, even for technologically advanced facilities, because water quantities are not typically measured at company level, and electricity used for pumping water is not accounted for separately in overall electricity consumption.
If a company uses tap water alone, the cost of water use will certainly increase compared to a scenario under which a company uses water from wells with its own pump as well as from the public supply, which may happen frequently in urban areas. According to evidence from field trip interviews, even large meat processing installations can be expected to have access to their own wells, thus water costs are not normally a problem for companies. Estimating the value added of water in the entire Turkish meat processing industry would require detailed industry survey data, but it was not feasible to obtain this within the scope of the current project.
The scattered structure of slaughterhouses and final meat processing units in Turkey and the absence of water use data in these facilities have made it

Turkey - Water along the food chain
149
difficult to calculate the value added of water. Furthermore, water consumption varies dramatically between meat processing facilities. The small to middle-level units, which focus primarily on slaughtering and hardly ever process the carcass beyond that stage, use substantially less water than the largest holdings and facilities near large cities. In addition, it is not possible to obtain reliable information about the prices that small and large firms pay for water from their own wells and municipalities, if any costs are incurred at all.
The small-scale slaughterhouses received a gross margin of TL 60-80 for slaughtering one head of cattle in 2014, as observed during field research. Occasionally the larger processing units outsourced their slaughter processes to small or medium-sized organizations.
Table 36: Financial structure of meat processing enterprises in Turkey, 2012
item unit 2012
Number of enterprises Count 214
Turnover TL 2 964 055 094
Production value TL 2 845 500 740
Value added at factor cost TL 219 333 208
Gross investment in tangible goods TL 88 937 000
Number of persons employed Count 6 140
Number of full-time equivalent employees (FTE) Count 5 940
Number of hours worked by employees TL 12 774 307
Average number of FTE per enterprise Count 28
Personnel costs TL 144 605 773
Wages and salaries TL 120 751 462
Social security costs TL 23 854 311
Total purchases of goods and services TL 2 824 464 787
Gross investment in tangible goods TL 88 937 000
Gross investment in land TL 3 650 909
Fixed capital sales TL 8 081 506
Gross investment in machinery and equipment TL 38 851 259
Gross investment in existing buildings and structures TL 40 613 108
Source: TUIK (2015).
Assumptions: Water extraction at TL 4/m3 (considering energy costs, municipality tap water, pump repair costs) for 2012. See further explanations in the text about the calculation of value added from water in slaughterhouses. All data refer to firms with more than 20 employees.

150
Due to these complications, Table 36 should be seen as an attempt to approximate the value added of water in the Turkish meat processing industry, which would amount to TL 15/m3 on average. Considering the exchange rate of TL 1 to USD 0.56 in 2012, the value added of water in this industry for 2012 is USD 8.5/m3. However, water economists do not consider such calculations to be adequate representations of the industry’s willingness to pay for water (Young, 2005) because it is likely that the market price of water dramatically understates the social value (“shadow price”) of water.
Policies and development of the red meat processing value chain in Turkey
Key findings:
• Water consumption in Turkish red meat production is significant, especially during the primary production stage.
• Agricultural and farm policies that do not directly target water consumption may therefore have a substantial impact on the use of domestic water resources.
• Policy goals in Turkey are currently focused on supporting farm incomes through subsidies that incentivise the production of red meat.
• Since water usage is not directly considered in these policies, conflicting goals arise with respect to the sustainable long-term management of water resources.
Water use along the red meat chain in Turkey is primarily affected by policies that fall in the domains of two main institutions: the MFAL and the MFWA. Furthermore, both ministries are seeking to implement the targets and strategic goals of the 10th Development Plan 2014-2018 (Ministry of Development, 2014). The strategic goals presented in this development framework can be interpreted as an approximation of overall political priorities and goals in Turkey today. From an economic perspective it is therefore important to analyse whether and to what extent some of these targets and strategies may produce conflicting goals.

Turkey - Water along the food chain
151
Box 6: Excerpts from the 10th Development Plan 2014-2018
750. In Turkey, livestock enterprises are generally small scale, the fodder production, protection and improvement of pastures and meadows are insufficient, the quantity of artificial insemination is below international averages and measures taken for animal health and animal movements are far from adequate. In this context, during the Plan period, animal husbandry support has been increased in terms of quantity and diversity […]. (p.99)
773. Efficient and productive use of meadows and pastures will be realised by accelerating the identification, limitation, classification and reclamation efforts of these areas, and forage needs will be met by increased production and product diversification. (p.102)
747. Considering the demand of non-agricultural sectors in particular for agriculture, forest, meadow and pasture lands, it seems important to maintain the balance between protection and use of these resources. (p.99)
760. Coordination between public institutions on land consolidation activities, especially those related to irrigation and transportation, will be maintained and the irrigation ratio will be increased by enabling the agricultural land development services. The transition to closed irrigation systems will be accelerated by renewing the existing channels and classical systems at water transmission and distribution facilities.
771. In the animal husbandry sector, the improvement of beef cattle and sheep breeding will be given priority and implementation of regional support programmes will be continued. (p.101)
761. Agricultural support will be arranged according to the social purposes and production focus on the basis of agricultural basins and parcel […] Compliance between the crop pattern and water potential will be considered in the design of agricultural support programmes […]. (p.10)
Source: Ministry of Development, 2014.
Box 6 presents an overview of a selection of policy goals and priorities that inevitably compete with the sustainable management of domestic water resources: in order to boost farm incomes, productivity gains are being targeted from the support given to beef, dairy and sheep production. However, as the amount of natural pasture is limited, policymakers consider it appropriate to develop irrigation networks further in order to increase the supply of maize and alfalfa from irrigated areas. In other words, political incentives to increase the domestic supply of food products based on animals that depend largely on roughage would increasingly shift domestic water resources towards feed production.
However, chapter 3 of this report has shown that this tends to be a comparatively inefficient way of using domestic water resources. Alternative policy strategies could include:
• supporting farm incomes directly without requiring farmers to produce resource-intensive and rather inefficient beef to qualify for this income support;

152
• stepping up financial incentives for beef and sheep producers to shift to poultry production or high-value crops, allowing more efficient use of domestic water;
• supporting imports of water-intensive concentrated feed and roughage or importing more live cattle for slaughter; and
• increasing support for improved breeds that have a higher feed conversion ratio and thus use existing feed more efficiently.
Table 37 presents current levels of output subsidies for bovine animals in Turkey. The table shows that, in line with the strategic goals of the 10th Development Plan, incentives are provided for the adoption of higher productivity genetic breeds for rootstock, which could be a way of improving resource efficiency through a higher average slaughter weight.
However, plain production support is also provided in terms of a direct premium per head. Such policies typically distort market incentives because this subsidy enables production that would otherwise be unprofitable to continue to take place. Again, given the objectives of policymakers summarised in Box 1, it would appear logical to subsidise beef production in this way. However, Table 37 also shows that these policies do not include incentives to reduce the blue water footprint of beef in Turkey.
Table 37: Output subsidies for cattle and relevance for Turkey’s development goals, 2014
support subject unit premium (tl/head)
Cattle for dairy and combined breeds and their hybrids Cattle for meat and combined breeds and their hybrids 225
Rootstock cattle for breeding 350
Rootstock buffalo 400
Addition to pedigree of cattle for dairy and combined breeds and their hybrids 70
Production support for fattening material (cattle for fattening)
Rootstock 350
Calf 150
Source: Ministry of Food, Agriculture and Livestock (2014).
Moreover, these policy-induced effects of increased water consumption in beef production are exacerbated by the provision of specific input subsidies provided by the Turkish government for the production of forage crops (Table 38). These subsidies incentivise the use of irrigated land for fodder production, which is a fuel-intensive process. Chapter 3 showed that irrigation water used in the production of fodder in Turkey is especially inefficient in relation to the global

Turkey - Water along the food chain
153
average water footprint for these crops. From an economic point of view, the absolute level of these subsidies is less important in this context; instead, it is a critical matter that they exist at all. This is because these input subsidies constitute further distortions to the otherwise already heavily distorted (or partly nonexistent) market for irrigation (ground) water in Turkey.
Chapter 2 has shown that much of the water in the red meat chain is currently drawn from private wells, with little monitoring. A public resource is thus potentially subject to the well-known “tragedy of the commons” unless price incentives are established to correct this market failure. A water market that is distorted in this way provides more incentives to use water in red meat than the long-term societal (social) optimum for Turkey would allow. Further policy-induced incentives to use irrigated land for fodder production will only aggravate this set of distortions.
From the perspective of policymakers, giving support to irrigated fodder may at first glance seem to present an opportunity to achieve the goals outlined in box 1, given that in the short term water costs appear to be a less binding constraint than the availability of rain-fed pasture and that there is a shortage of alternatives for farm incomes (see chapter 2) as well as in infrastructure to reduce transaction costs in the red meat supply chain (see earlier in this chapter).
In the long run, however, it would clearly be more cost- and resource-efficient to save domestic water resources for other, more productive purposes, rather than to spend government budgets on subsidies that are currently directed at short-term incentives to increase beef supply. For example, one alternative might be the diversification of bovine farm incomes through rural development measures or direct decoupled farm income support.
Table 38: Input subsidies related to forage crops, 2014
support subject unit price (tl/da) required documentsfor application
Fuel support for forage crops 3.1 Farmer registration document, letter of application
Fertiliser support for forage crops (50 decare and more) 6
Farmer registration document, letter of application, analysis form,
analysis report
Soil analysis 2.5
Source: Ministry of Food, Agriculture and Livestock (2014).
Further support for the production of fodder on irrigated land may come from investment incentives such as government loan programmes or deductions on interest rates for other loans. Such programmes do exist, but are not displayed in Table 38 because their effect on water usage in red meat is difficult to assess.

154
Furthermore, the development of infrastructure, such as investment in efficient irrigation technology, should contribute to more resource-efficient water use. It is therefore important that such programmes are not be tied to the production of specific fodder crops; in other words, investment programmes should not require the production of fodder on irrigated land, but should allow a profit-maximising choice of crops according to undistorted market conditions.
Concerning output subsidies for forage crops, the official PSE figures for corn (maize) in Turkey provided by the OECD and used in the analysis in chapter 3 of this report do not include the so-called category C supports, which comprise direct subsidies per animal or per hectare (ha). Category A (B) refers to general price-based output (input) subsidies. Such additional category C supports are published in the Bulletin of the Turkish Ministry of Agriculture and Food (2014). For instance, Table 39 reports TL 75/da/year for maize for (irrigated) silage (see chapter 3).
For irrigated maize in particular, per hectare subsidies were substantially increased between 2012 and 2013 (by 36 percent) and are now at TL 750/hectare and within the range of annual EU single farm payments per hectare. A similar result is also the true for artificial meadows and pastures.
These findings suggest that the results presented in chapter 3 of this report likely still understate the blue water resources that are used per unit of forage crop subsidies. From an economic perspective, Turkey’s goal of developing the efficiency of the beef sector may potentially conflict with its aim of using water efficiently.
Table 39: Average annual support for forage crops, 2006-2013 (TL/decare)
Forage crops - year 2006 2007 2008 2009 2010 2011 2012* 2013
Alfalfa (irrigated) 130 130 115 115 125 130 130 50
Alfalfa (dry) - 80 70 70 70 70 70 30
Sainfoin 80 80 75 75 80 90 90 40
Single annual forage crops 50 50 30 30 30 30 30 35
Single annual forage crops for silage - 55 45 45 45 45 45 50
Maize for silage (irrigated) 60 60 45 45 50 55 55 75
Maize for silage (dry) - - 30 30 30 30 30 35
Artificial meadow and pastures 100 100 75 75 75 75 75 100
*The supports for multi-year crops (alfalfa and sainfoin) were given for four years and these payments have been given for each year after 2013.
Source: Reproduced from Çelik and Şahin (2013).
Note: For comparison, maize for irrigated silage in 2013 amounts to TL 750/hectare, which is roughly comparable to the single farm payment that an EU farmer can activate through one hectare of crop or grazing land.

Turkey - Water along the food chain
155
Figure 55: The area harvested under maize for silage, 2011-2014
586622
659 656
313354
403 415
0
100
200
300
400
500
600
700
Maize (seed)
2011
Maize (seed)
2012
Maize (seed)
2013
Maize (seed)
2014
Maize (silage)
2011
Maize (silage)
2012
Maize (silage)
2013
Maize (silage)
2014
thou
sand
ha
+12%since 2011
+34% since 2011
Source: TUIK (2015).
In Figure 58 the effects of the financial incentive schemes presented in Table 39 are plain: the planted area of maize used for silage (and therefore exclusively for feeding bovine animals or sheep) is gradually increasing, while the area of maize planted for the production of seeds, e.g. used for feed in either the red meat or the poultry industry, remains fairly constant.
In summary, agricultural policies in Turkey are inherently linked to water resource use through the water footprint of each agricultural commodity. Water concerns should therefore be reflected extensively in agricultural policies. However, it is easy for a conflict to arise between agricultural policy objectives and sustainable water resource management.
The case study of the red meat industry has shown that red meat, a product that does not directly require irrigation water, can nevertheless still be heavily linked to the use of water resources. Thus policies intended to provide higher-quality fodder are likely to make a relatively high demand on Turkey’s water resources.
From an economic perspective, Turkey should therefore consider aligning its agricultural policies, which currently aim to increase productivity and efficiency in the red meat sector, more consistently towards sustainable long-term management of water resources. This could be achieved through a variety of alternative policy measures, such as:

156
• correct measurement and pricing of irrigation water in line with long-term water costs (i.e. the “shadow value”) to society;
• removal of incentives that increase irrigated fodder production; in the short-term, facilitation of fodder or roughage imports could be an alternative;
• facilitation of imports of live cattle and carcasses for further processing;
• income transfers and the development of income alternatives for domestic red meat-producing farmers through rural development measures; and
• continuation of investment in more productive animal genetics.

Turkey - Water along the food chain
157
Chapter 5 – Conclusions
Main findings
Agriculture plays a key role in Turkey, but is also the country’s single largest consumer of water
The main findings of the report suggest that Turkey’s role as a provider of agricultural and processed food products is not only significant for the global food economy, but it is also especially crucial for its net food-importing neighbours in the MENA region.
Given the severe water scarcity in most of these MENA countries, the question of sustainable water resource management in Turkey may therefore have implications for the long-term provision and security of food in the entire region.
Agriculture is by far the most important water-consuming sector in Turkey, and it also accounts for the largest share in the use of groundwater as a potentially valuable and only partly renewable resource.
Agricultural use of water is expected to continue to constitute the single most important source of domestic water demand, with 64 percent of total national water consumption in 2023 projected to go into agriculture. Pressure on water resources due to population growth and increased irrigation intensity (both per hectare and according to the proportion of irrigated land out of total agricultural land) has been increasing in recent decades and, given increasing water usage, water stress may become a countrywide problem in the near future. Severe water shortages already exist in many regions in Turkey.
Is Turkey allocating too much water to the “wrong” commodities?
The analysis in this report relating to the crops produced and the land used for irrigation shows that most irrigated land is not necessarily used for those agricultural products for which Turkey enjoys the strongest comparative advantage.
In particular, while fruit and vegetables and other permanent cultures provide the highest gain in revenue in terms of the production value generated from irrigation water, maize for silage, followed by cereals and cotton absorb the largest single share out of all the irrigated agricultural land in the country.
In terms of the blue water footprint per unit of output and total irrigation water consumption, cotton consumes the most water in Turkey. With regard to the blue water footprint of products of animal origin, average figures for most product categories in Turkey are higher than world averages. This indicates

158
that these products tend to be produced in Turkey with higher blue water consumption per tonne of output than the world average would suggest is necessary.
Specifically, when comparing Turkey’s blue water footprint for beef production to different production systems, it emerges that for the production of one tonne of beef, Turkey has a comparative disadvantage compared to blue water use requirements of the global average of countries. This contributes to a broader lack of competitiveness for Turkey in the export of primary and processed products along the red meat chain. For instance, if Turkey were to replace one tonne of imported beef with Turkish beef production, in the case of industrial feedlot-based beef production this would require about 48 percent more blue water in Turkey relative to the blue water consumption of the average global feedlot.
In this context, expressing total water consumption per unit value of export prices can serve as a rough approximation of the opportunity cost of water in the production of different agrifood products in Turkey. Products such as poultry meat, eggs, tobacco, grapes and tomatoes receive relatively little in PSEs and require a relatively low total amount of water per dollar export value. In contrast, sunflower, cottonseed and beef and veal are fairly heavily subsidised per unit of output and at the same time have among the highest water consumption per dollar export value.
As a result of heavy subsidisation, growing purchasing power and other related trends, domestic red meat demand and production in Turkey have grown steadily in the past decade, and this trend is expected to continue, with an estimated 34 percent growth in total beef consumption in Turkey between 2014 and 2024. However, several factors, including the aforementioned water statistics, contribute to a lack of production and export competitiveness by global standards.
Limited international competitiveness in the red meat sector and inefficiencies in water use
According to several trade indicators, Turkey’s trade patterns in agrifood products show that the country is by far most competitive when it comes to the export of fruit and vegetable products and other crop-based processed products. Turkey also appears to be a competitive exporter of poultry meat, eggs, fish and certain dairy products. However, Turkey is relatively uncompetitive in the exports of primary and processed products along the red meat chain, and there are several structural reasons for this.
First, primary production of red meat animals in Turkey is characterised by a fragmented structure of small farms, and the average weight of cattle slaughtered in Turkey is low, which has implications for the country’s water-use efficiency as well as export competitiveness. An international comparison also shows that the production cost of beef in Turkey is fairly high, partly due to the

Turkey - Water along the food chain
159
aforementioned factors, pointing to limited international competitiveness in the sector.
Additionally, a significant share of Turkish red meat slaughtering and processing still takes place in informal conditions, and the processes involved are largely hidden from quality control and environmental monitoring. Although these informal and more traditional approaches to slaughter and meat processing tend to require less water, competitiveness is further diminished because smaller firms often use water inefficiently.
In contrast, water consumption in Turkish slaughterhouses is greater per tonne of processed carcass in larger plants than in SMEs because large facilities typically obey stricter hygiene standards. Overall, cleaning tasks account for 10-30 percent of water consumption in red meat processing in general.
When assessing the structure of water consumption per unit of output in different types of Turkish slaughterhouses and meat processing plants, it also has to be taken into account that domestic demand for beef seems to be increasingly quality oriented, which may spur structural change and the need for investment among SME slaughterhouses and meat processing firms.
The adoption of EU-type processing technologies to increase hygiene standards may therefore not only open up marketing opportunities for Turkish red meat processing firms, but could also serve the goal of changing preferences among Turkish consumers. However, the implementation of such technologies would probably lead to higher water consumption per tonne of processed red meat.
Water consumption is significant during primary production stages compared to processing
Despite these issues, total water consumption during processing is small in comparison to the blue water footprint of primary cattle and sheep production, reflecting the broader trend of relatively low water consumption in food processing compared to primary agriculture.
By order of magnitude, the (limited) available data for 2008 show that saving 1 percent of irrigation water would be equivalent to saving 26 percent of the annual water consumption of all manufacturing industries together, including food processing. In terms of water consumption in the food processing industry (excluding primary agriculture), 1 percent of savings in irrigation water in 2008 would be equivalent to almost three times (291 percent) the entire water consumption of Turkey’s non-primary agrifood processing industry. This includes red and white meat slaughterhouses and meat processing firms.
Water consumption in the Turkish red meat production chain is significant, especially during the primary production stage. Agricultural and farm policies that do not directly target water consumption may in this context have a

160
substantial impact on the use of domestic water resources. Since water usage is not directly considered in these policies, conflicting goals arise with respect to the sustainable long-term management of water resources.
Red meat production is heavily linked to significant indirect water use
Turkey’s primary agriculture is dominated by small and medium-sized farms in both crop and livestock production, with a high proportion of land ownership by farmers. Structural change has been fairly slow in the past. Such structures are well known among OECD countries for having declining farm incomes (relative to incomes in other domestic sectors), and there is rising pressure on policymakers to provide support in terms of agricultural subsidies. Indeed, agricultural policy goals in Turkey are currently focused on supporting farm incomes through subsidies that incentivise the production of bovine animal-based outputs, such as red meat.
According to the OECD measure of single commodity transfers, beef and veal constitute the most heavily subsidised agricultural products in Turkey according to transfers per tonne of output. It is the second most heavily subsidised product group in terms of total transfers.
The significance of red meat-related subsidies is further increased when considering feed. Currently, about one-third of the irrigated area of Turkey’s agriculture is planted with forage crops, which feed mostly beef cattle and dairy cows and further deplete valuable water resources. Developing “water-smart” policies will therefore require Turkey to pay increasing attention to the appropriate design of incentives around water use, especially in primary agriculture.
Key policy options and potential priorities for public-private policy dialogue
Turkey has rather successfully established the necessary organizations and institutions for managing water resources at different levels. However, the frequent reorganization and restructuring of institutions may potentially distract from the long-term planning of programmes for sustainable water management. Turkey’s water agenda shows that there are political strategies and goals related to sustainable water use, and efficient irrigation in agriculture constitutes an important part of these strategies. Alignment to the EU water management framework as a precondition for potential EU accession has also progressed relatively far.
However, there is no coherent water law, while partly outdated partial laws govern aspects of groundwater use, irrigation infrastructure development and access to water for agricultural purposes. This means inefficient economic incentives are retained, despite the ambitious goals and strategies at a national level.

Turkey - Water along the food chain
161
For example, policies for the pricing of water do not encourage water efficiency or cost recovery, especially for irrigation water. Furthermore, irrigation water is not priced according to the quantity actually used, largely because volumetric measures are not installed.
This state of affairs contributes to a broader problem related to the widespread use of unregistered wells and inefficient water practices in Turkey. Groundwater resources are widely exploited across Turkey, and in some regions the lowering of groundwater levels has been observed to proceed at alarming rates, potentially because in the past the government placed a relatively strong emphasis on the management and protection of surface water.
Indeed, Turkey’s consumption of irrigation water is not only affected by policies that target irrigation water consumption directly, but also by other agricultural policies that affect farmers’ incentives to produce water-intensive products.
The findings from this report therefore suggest the following policy options in Turkey’s agrifood chain in general and for water-related policies in the red meat production and processing sector in particular.
Investment is needed to build a water saving infrastructure and culture
First, most of the water savings by far in absolute terms can be achieved by improving the efficiency of Turkey’s irrigation infrastructure and farmers’ current irrigation practices; while a major issue for urban water management is NRW, which is mainly caused by the old distribution system. This may affect food-processing companies that draw on municipal water. Clearly, more investment is also needed in this area.
Second, although the largest and most modern food processing companies in Turkey operate in line with international benchmark figures for water consumption per unit of output, smaller and more traditional companies tend to use less water per unit of output, mainly because of cleaning and cooling practices that deviate from industry standards. This comes with potentially negative implications for the fulfilment of health and safety requirements within these companies. Investments to modernise Turkey’s food processing chains might therefore imply slightly higher water consumption due to higher standards.
Small enterprises in particular are seen as key because these entities often fail to make the link between water efficiency and energy efficiency, so that low-cost water is initially used excessively, obliging firms to pump water from ever deeper wells. This means that investments in water efficiency may save companies money beyond the actual price that they pay per unit of water because they would see a decline in their electricity or fuel costs for pumping. Thus, improved production processes would probably still be more resource efficient overall, even though modernisation might result in an increase in water usage per tonne of processed food output.

162
In other words, small companies in particular currently tend to consider only the price per unit of water and conclude that investment in water saving technologies would not pay off. However, when assessing total cost for water and energy jointly, the picture may very well look different.
While there are exceptions, the management capacity in both the public and private sectors for addressing water-use efficiency is only starting to emerge. However, OSBs are perfectly suited to spearheading water conservation investments at the individual enterprise level, particularly to providing guidance to SMEs to shift their focus to water conservation in all aspects of their operations, ranging from primary processing (i.e. washing, packaging, cooling) to secondary and higher-level processing (cooking, cooling, etc., including production of convenience foods).
Furthermore, limited awareness of innovative technologies is a barrier for SMEs in their realignment with changing parameters of access to water, such as upcoming legislative measures, including pricing for water allocation by sector, region, basin and perhaps size.
Regarding the investment in future water saving technologies, attention should be paid to the development of a water saving culture among companies and employees. Firms should be encouraged to implement water saving technologies, while water prices should be designed so that they have more incentive to do so.
Beyond that, the improvement of water-use efficiency in WUOs, e.g. municipalities, ICs and WUAs, would be a suitable next objective after embarking on the decentralisation of the water distribution system.
Water saving behaviour should be incentivised at all stages along the agrifood chain
Water consumption in the food-processing industry varies widely by location and the state of technology, but typically does not constitute a major share of the processing cost. However, NRW is a serious problem that should be addressed and taken into consideration during any approach to save water in Turkey. This implies that increased control of informal groundwater extraction from unlicensed wells should not only be encouraged, but strictly enforced.
Public availability of groundwater data, the state of water tables in all aquifers and availability of surface water potentials in all basins and sub-basins should be facilitated for all entrepreneurial decision making. The introduction of a warning system to announce the state of water resources for any industrial or agrifood activities should be considered in order to stop further expansion of water-dependent industries in water-stressed regions. Feasibility studies to find water-abundant regions, especially in surface water supply for long-term planning of the establishment of industries, especially in agrifood industries, may offer another policy option in this respect.

Turkey - Water along the food chain
163
Saving water in the red meat processing sector can be incentivised through the appropriate pricing of groundwater usage from company-owned wells and of tap water. The introduction of plant-based measures of water consumption could be a first step in this direction.
Agricultural policies should be more consistently aligned to sustainable long-term management of water resources
Agricultural policies in Turkey are inherently linked to water resource use through the water footprint of each agricultural commodity. Water concerns should therefore be reflected extensively in agricultural policies. However, agricultural policy objectives and sustainable water resource management may readily reflect conflicting goals.
The case study of the red meat industry has shown that red meat, a product that does not directly require irrigation water, can nevertheless still be heavily linked to the use of water resources. Thus policies intended to provide higher quality fodder are likely to demand a relatively high proportion of Turkey’s water resources.
Regarding agricultural water use, the government should reconsider its approach to supporting beef producers through incentives to grow maize on irrigated land. The analysis in this report suggests that corresponding increases in production are especially costly in terms of national water resources.
In comparison to the average of OECD countries, Turkey maintains a relatively high share of agricultural subsidies coupled to each unit of output, which creates strong incentives for farmers to increase the production of certain agricultural products even if market prices alone do not reward production beyond a certain quantity of output.
Although policymakers, partly in response to deeply-rooted fears and beliefs of many citizens, are gearing policies towards increasing national self-sufficiency in agrifood products, these policies are not necessarily justified from an economic perspective.
In fact, the analysis presented here would suggest that low self-sufficiency in beef production would probably be beneficial for Turkey’s water resources. Consequently, importing fodder from areas where it can grow under a higher proportion of green water usage is not a sign of sectoral weakness, but may in the medium- to long-term constitute substantial savings of Turkey’s water resources, and thus could be viewed as a contribution to securing Turkey’s long-term agricultural competitiveness in those products that it currently exports competitively.
Thus, Turkey should not continue to subsidise the use of blue water in beef production by providing special incentives to irrigate maize. Instead, “water-smart” productivity increases in primary beef production should be

164
incentivised. Examples of more sustainable measures include the further improvement of animal genetics towards (i) high breed varieties (as is currently in place under the 10th Development Plan) and (ii) roughage production based on less water-demanding crops or imports of roughage or beef carcasses.

Turkey - Water along the food chain
165
Annex 1 – The trade intensity index
The TII is defined as the share of one country’s exports going to a partner divided by the share of world exports going to that partner. The TII is calculated as:
TIIij = (xij/Xit)/(xwj/Xwt)
where xij and xwj are the values of country i’s exports and of world exports to country j, and Xit and Xwt are country i’s total exports and total world exports respectively.
The index equals 100 if country x exports just as much of commodity k to country j as the share of all other countries’ exports of k to j in total world trade of all commodities would suggest. The higher the TII, the more important country x is as a provider of k for country j relative to j’s other trading partners. This does not imply however that exports of k would be equally important for country x.
The normalised revealed comparative advantage index
Since the introduction of the Balassa index, several attempts have been made to develop a revealed comparative advantage index that would revolve around a stable mean with a symmetrical distribution across products, countries and time (e.g. Vollrath, 1991). Recently, the NRCA index has in this context been suggested by Yu et al. (2009). The NRCA index is computed according to the following equation:
In this index, country i’s export of commodity k is given by . The total world export of all commodities combined is Xwt. The total export of country i is defined as . The total world export of commodity k is . Dividing the NRCA further by a constant of 0.25 transforms the index into a range from -1 to 1, where 0 indicates the comparative-advantage neutral reference point and index values >0 (<0) correspond to a comparative advantage (disadvantage) respectively.
The mean and sum in the NRCA of a country or a commodity are constant and equal to zero respectively. The logic of the index is that a country can gain comparative advantage in some commodities only by losing comparative advantages in other commodities, and each country or each commodity (considered at world trade level) are comparative-advantage-neutral, while no

166
country can have a comparative advantage or a comparative disadvantage in all its traded commodities (Yu et al., 2009, pp.271-272).
It should be emphasized that the NRCA index, as most revealed competitiveness trade indices, reflects all trade distortions (e.g. tariffs, subsidies), non-tariff barriers, quality standards and transaction costs implicitly in the trade flows. Thus, this methodology is typically very close to the empirical reality of international trade, but tends to constitute a black box whenever measuring the effect of specific trade distortions on trade flows is the goal.

Turkey - Water along the food chain
167
rEFErENCES
aea. 2007. Resource use efficiency in food chains Priorities for water, energy and waste opportunities. Report to Department for Environment Food and Rural Affairs (Defra) Restricted Commercial AEAT/ENV/R/2457 (ED05226) Issue 1 January 2007.
agri-benchmark. 2015. The beef and sheep network. http://www.agribenchmark.org/beef-and-sheep/beef-and-sheep-network.html.
Akbal, A., & Pınar, S. 2014. The recent court of appeals’ decision dated May 2014 states: no extra charge for power plants for using sea water as cooling water. Newsletter on Turkish Law Developments, 21–22.
akman, c., akman, e., & okcu, M. 2015. Reform in local governments: What did the new municipal law bring in Turkey? Global Journal on Humanities & Social Sciences, (2), 119–123.
aksever, F., davraz, a., & Karaguzel, r. 2015. Groundwater Balance Estimation and Sustainability in the Sandıklı Basin (Afyonkarahisar/Turkey). Journal of Earth System Science, Forthcoming.
Babaoğlu, M. 2008. Drought in Konya Province and Agriculture (in Turkish). Report presented in Konya-Karaman Economic and Social Coordination Council.
Barros, et al. 2014. Climate Change 2014: Impacts, Adaptation, and Vulnerability. Part B: Regional Aspects. Contribution of Working Group II to the Fifth Assessment Report of the Intergovernmental Panel on Climate Change. Stanford, USA: Cambridge University Press.
Birpinar, M. e. 2014. Public-private partnership in the water and sanitation sector. 21 – 22 October 2014, Geneva: Conference on PPPs in water and sanitation sector.
Burak, s. 2011. Water Use Efficiency and Economic Approach-National Study Turkey. Plan Blue, UNEP/MAP Regional Activity Center. http://planbleu.org/en/publications/water-use-efficiency-and-economic-approach-national-study-turkey.
Burrell, a., & oskam, a. 2005. Turkey in the European Union: implications for agriculture, food and structural policy. Wallingford, UK: CABI.
Cagatay, S., Kıymaz, T., & Özeş, r. 2015. To what extent are rural development policies compatible with achieving sustainable agriculture in Turkey? In M. Petit, E. Montaigne, F. El Hadad-Gauthier, J. M. G. Álvarez-Coque, K. Mattas, & S. Mili, eds., Sustainable Agricultural Development (pp.103–143). Heidelberg, Germany: Springer.

168
cakmak, e. h. 2010. Agricultural Water Pricing: Turkey. Paris, France.
cakmak, e. h. 2010b. Irrigation management and water pricing in Turkey. International Journal of Social Ecology and Sustainable Development, 1(2), 13–26. doi:10.4018/jsesd.2010040102.
Çelik, a., Şahin, n. 2013, Çelik A., Şahin Demirbağ N., Türkiye’de Tarımsal Desteklemelerin Yem Bitkileri Ekiliş ve Üretim Üzerine Etkileri, Yayın No: 215, 2013, Ankara.
Çiçek, N., Özonat, Ç., & Er, A. 2015. Drinking water protection studies in Turkey. In I. E. Gönenç, J. P. Wolflin, & R. C. Russo, eds., Sustainable watershed management. pp.143–150. London, UK: Taylor & Francis Group.
comtrade, u.n. 2015. United Nations commodity trade statistics database.URL: http://comtrade. un. org. or http://wits.worldbank.org/.
deblitz, c., Kaths, F. & Brüggemann, d., 2009, Agri benchmark Beef- Die Kosten im Vergleich. DLG-Mitteilungen 04/09, S. 102-105. http://www.agribenchmark.org/fileadmin/Dateiablage/B-Beef-and-Sheep/Misc/CDFKDB-DLG-Teil-I-lang.pdf.
demirel, z. 2004. The history and evaluation of saltwater intrusion into a coastal aquifer in Mersin, Turkey. Journal of Environmental Management, 70(3), 275–282. doi: http://dx.doi.org/10.1016/j.jenvman.2003.12.007.
demirel, z. 2010. The Influence of Seawater on a Coastal Aquifer in an International Protected Area, Göksu Delta Turkey. Journal of Water Resource and Protection, 2(7), 651–659. doi:10.4236/jwarp.2010.27075.
dudu, h., & cakmak, e. 2011. Climate Change and Agriculture: An Integrated Approach to Evaluate Economy-wide Effects for Turkey.
DSI 2015. Official data of DSİ. Water statistical data. General Directorate of State Hydraulic Works. Retrieved March 7, 2015, http://www.dsi.gov.tr/dsi-resmi-istatistikler.
dsİ 2014. Groundwater irrigation activities in Turkey, groundwater irrigation cooperatives, Original text in Turkish, accessed online 22.03.2015: http://www.dsi.gov.tr/docs/yayinlarimiz/turkiyede-yeraltisuyu-sulama-faaliyetleri.pdf?sfvrsn=4.
dsİ 2009. Turkey Water Report 2009, General Directorate of State Hydraulic Works. Ankara, Turkey.
european environment agency. 2010. The water exploitation index. Online recourse last accessed 13.12.2015. http://www.eea.europa.eu/data-and-maps/figures/water-exploitation-index-wei-3.
environment agency. 2013. Food and drink manufacturing water demand projections to 2050 Main Report – EBPLW12033 October 2013. https://www.

Turkey - Water along the food chain
169
gov.uk/government/ uploads/system/uploads/attachment_data/file/297233/LIT_8767_4d1fe5.pdf.
erdemli, B. Ü. 2008, June. Modeling and development of a groundwater management plan for Ulubey aquifer system, Uşak-Turkey. The graduate school of natural and applied science of Middle East Technical University, Ankara, Turkey.
Ertürk, A., Ekdal, A., Gürel, M., Karakaya, N., Guzel, C., & Gönenç, E. 2014. Evaluating the impact of climate change on groundwater resources in a small Mediterranean watershed. Science of The Total Environment, 499 (0), 437–447. doi:http://dx.doi.org/10.1016/j.scitotenv.2014.07.001.
Fao. 2008. Coping with water scarcity. Water Report 38. Rome, Italy: Food and Agriculture Organization of the United Nations (FAO).
Fao. 2003. Review of world water resources by country. Water Report 23., Vol. Water Repo. Rome, Italy: Food and Agriculture Organization of the United Nations (FAO).
Fao. 2015. Statistics division FAOSTAT, Online Databases accessed September-October 2015. http://faostat3.fao.org/home/E.
Foreign Relation Office of DSİ. 2014. Water and DSI- 60 years full of realized projects. Booklet by Ministry of Forestry and Water Affairs. (English).
Foreign Relation Office of DSİ. 2012. Water and DSI- 58 years full of realized projects. Booklet by Ministry of Forestry and Water Affairs. (English).
gassert, F., reig, P., shiao, t., & landis, M. 2015. Aqueduct global maps 2.1. Washington, DC, USA: World Resources Institute (WRI).
gassert, F., landis, M., luck, M., reig, P., & shiao, t. 2013. Aqueduct global maps 2.0. Washington, DC, USA: World Resources Institute (WRI).
gdWM. 2015. Basin management department. Ankara, Turkey: The General Directorate of Water Management (GDWM).
general directorate of agrarian reform. 2014. 50% matching grants to be provided for irrigation machinery and equipment. Original text in Turkish. Retrieved October 15, 2015, from http://kahramanmaras.tarim.gov.tr/Duyuru/20/50-Hibe-Destekli-2014-Yili-Basincli-Sulama-Teblig-Yayinlandi.
general directorate of state hydraulic Works (dsİ) of turkey. 2014. Decree of Irrigation Water Tariffs. Original text in Turkish. Retrieved March 22, 2015, from http://www.dsi.gov.tr/docs/birim-fiyatlar/2014-yili-sulama-ve-tahliye-tesisleri-isletme-ve-bakim-ucret-tarifeleri.pdf?sfvrsn=6.
ghazouani, W., Molle, F., & rap, e. 2012. Water users associations in the NEN region, IFAD interventions and overall dynamics. Rome, Italy: IFAD.

170
günay, g. 2003. Sea water intrusion in coastal aquifers of the Mediterranean coast of Turkey. In J. A. L. Geta & I. G. y Minero de España, eds., Coastal aquifers intrusion technology, Mediterranean countries. IGME.
helix Management consultants. 2014. Turkey Meat and Dairy Markets Assessment Report. Report for the European Bank of Reconstruction and Development. Istanbul, September 2014.
hoekstra, a. ed. 2003. Virtual water trade. Proceedings of the. International Expert Meeting on Virtual Water Trade. Delft, The Netherlands: Value of Water Research Report Series no. 12, UNESCO-IHE.
hoekstra, a. Y., chapagain, a. K., aldaya, M. M., & Mekonnen, M. M. 2011. The Water Footprint Assessment Manual: Setting the Global Standard (1st ed.). London, UK: Earthscan.
iFc Food Benchmark tool. 2015. About the IFC Food Processing Benchmark Tool. International Finance Group. http://www.ifc.org/wps/wcm/connect/region__ext_content/ regions/europe+middle+east+and+north+africa/ifc+in+europe+and+central+asia/countries/about+the+ifc+food+processing+benchmark+tool.
investment support and Promotion agency. 2015. Policies and execution of Policies regarding Organized Industrial Zones in Turkey (In Turkish). http://www.invest.gov.tr/en-US/investmentguide.
Kadirbeyoğlu, Z., & Özertan, G. 2011. Users’ perceptions of water user associations: evidence from three cases in Turkey. Istanbul, Turkey: Boğaziçi University.
Kerç, Aslihan. 2015. Community-Based Water Governance Approaches at Local Level (Examples from Turkey). 26-27 January 2015, Vienna: 23rd OSCE Economic and Environmental Forum.
Kibaroglu, a., & ahmetova, r. 2015. The privatization initiatives in the Turkish water sector: reflections on the transboundary water politics in the Euphrates-Tigris river basin. In V. R. Squires, H. M. Milner, & K. A. Daniell, eds., River basin management in the 21st century understanding people and place pp.162–188. Boca Raton, Florida, USA: Taylor & Francis Group.
Kibaroglu, a. and Baskan, a. 2011. Turkey’s water policy framework. In Kibaroglu, A.; Scheumann, W. and Kramer, A., eds, Turkey’s water policy: National frameworks and international cooperation, pp.3-25. Berlin, Germany: Springer.
Kibaroglu, a., sümer, e., & scheumann, e. 2012. Fundamental shifts in Turkey’s water policy. Méditerranée, n°(119), 27–34.
Kınacı, C. 2013. Water Management in Turkey. General Directorate of Water Management. http://suen.gov.tr/UserFiles/CKUpload/Upload/Annex%20

Turkey - Water along the food chain
171
A.2%20CUMAL%C4%B0%20KINACI%20-%20TURKEY%20-%20DG%20OF%20SYGM.ppt.
Mekonnen, M. M., & hoekstra, a. Y. 2010. The green, blue and grey water footprint of farm animals and animal products. Delft, The Netherlands: Value of Water Research Report Series No.48, UNESCO-IHE.
Ministry of Food, agriculture and livestock. 2015. About organic farming. Online resource. http://www.tarim.gov.tr/Konular/Organic-Farming/Organic-Farming-Projects?Ziyaretci=Ciftci.
Ministry of Food, agriculture and livestock. 2014. Agricultural Support Bulletin, Ministry of Food, Agriculture and Animal Husbandry Department of Strategy Development, Number 1, 2014.
Ministry of development. 2014. Medium term programme (2015-2017). Ankara, Turkey: Prepared by Ministry of Development was decided by issuing Cabinet Decree No. 2014/6840, 05.09.2014 and Published in Official Gazette No. 29139, 08.10.2014.
Ministry of development. 2013. Tenth Development Plan (2014-2018). Approved at the 127th plenary session of The Grand National Assembly of Turkey, on 1 July 2013, in accordance with the Law No.3067, dated 30 October 1984.
Ministry of economy 2014. Export sector statistics. Online database Food & Agriculture. http://www.tcp.gov.tr/english/sectors/index.cfm.
Ministry of environment and Forestry. 2006. EU integrated environmental approximation strategy (2007 - 2023). Ankara, Turkey: Ministry of Environment and Forestry, Republic of Turkey.
Ministry of environment and urban Planning. 2015. Environmental Impact Assessment carried out by the General Directorate of Permit and Inspection. Süt Ürünleri Üretim Tesisi Kapasite Artışı (80 ton/gün) http://eced.csb.gov.tr/ced/jsp/ek1/6089#.
Ministry of environment and urbanisation. 2013. Turkey’s Fifth National Communication Under the UNFCCC. (The United Nations Development Programme (UNDP) Turkey, Ed.). Ankara, Turkey: Republic of Turkey Ministry of Environment and Urbanisation.
Ministry of environment and urbanization. 2012. Republic of Turkey, Climate Change Action Plan (2011-2023). Ankara: Ministry of Environment and Urbanization.
Ministry of Forestry and Water affairs. 2015. Republic of Turkey - Ministry of Forestry and Water Affairs. Booklet. http://www2.ormansu.gov.tr/osb/Dosya/did/B2.pdf.

172
Ministry of Forestry and Water affairs. 2014. Effective Use of Water in Agriculture. Original text in Turkish. Retrieved October 15, 2015, from http://www.ormansu.gov.tr/osb/HaberDuyuru/guncelHaber/14-02-09/Tar%C4%B1mda_Suyun_Etkin_Kullan%C4%B1m%C4%B1_Program%C4%B1_Hayata_Ge%C3%A7iyor.aspx?sflang=tr.
Ministry of science, industry and technology. 2015, Organized Industrial Zone (OSB) information website: https://osbbs.sanayi.gov.tr/.
Montfort, c. van, Michels, a., & Frankowski, a. 2014. Governance models and partnerships in the urban water sector. The Hague, Utrecht & Tilburg, The Netherlands.
Mutlu, s. 2011. Political Economy of Water Regulation and the Environment in Turkey. In T. Çetin & F. Oğuz, eds., The Political Economy of Regulation in Turkey (2011th ed., pp. 215–245). Springer.
Muluk, Ç. B., Kurt, B., Turak, A., Türker, A., Çalışkan, M. A., Balkız, Ö., Gümrükçü, S., Sarıgül, G., Zeydanlı, U. 2013. State of water in Turkey and new approaches to water management: environmental Perspective. Turkey: Business Council for Sustainable Development Turkey (SKD) and The Nature Conservation Centre (DKM).
Ocak, S., Öğün, s., emsen, e. 2013. Turkey’s Animal Production Water Footprint; Heading in the Wrong Direction, Procedia Technology, Volume 8: 255-263.
oecd/Food and agriculture organization of the united nations. 2015, OECD-FAO Agricultural Outlook 2015, OECD Publishing, Paris. http://dx.doi.org/10.1787/agr_outlook-2015-en.
oecd. 2014. Agricultural Policy Monitoring and Evaluation 2014: OECD Countries Turkey. www.oecd.org. DOI:10.1787/agr_pol-2014-18-en.
oecd-Pse. 2015. Producer Support Estimate Turkey: http://www.oecd.org/tad/agricultural-policies/TUR-monitoring-definitions-september-2014.pdf.
oecd. 2013. Water and climate change adaptation: policies to navigate uncharted waters. Paris, France: Organisation for Economic Co-operation and Development (OECD).
oecd. 2011, Evaluation of Agricultural Policy Reforms in Turkey, OECD Publishing. DOI: http://dx.doi.org/10.1787/9789264113220-en.
oecd. 2010. Sustainable management of water resources in agriculture. Paris, France: Organisation for Economic Co-operation and Development (OECD). doi:10.1787/9789264083578-en.
oecd. 2008. OECD Environmental Performance Reviews: Turkey. Paris, France: Organisation for Economic Co-operation and Development (OECD).

Turkey - Water along the food chain
173
ozler, h. M. 2003. Hydrochemistry and salt-water intrusion in the Van aquifer, east Turkey. Environmental Geology, 43(7), 759–775. doi:10.1007/s00254-002-0690-0.
Öztürk, M. Z. 2011. Sea level changes according to data of tide gauge station and its relationship with elements of climate in eastern Mediterranean: 1972-2009. International Journal of Human Sciences (Turkish Language), 8(2).
rethink Water. 2013. How to save and recycle water without compromising product quality: improving water efficiency in the food and beverage industry: white paper. Rethink Water Network. http://rethinkwater.dk/sites/default/files/whitepaper_foodbeverage_ rethinkwater_ver_1.0_0.pdf.
Şahin, A., Miran, B., Yildirim, I., Önenc, A., & Alcicek, A. 2009. Fattening costs of beef breeds reared under controlled conditions and the determination of optimum fattening period. Turkish Journal of Veterinary and Animal Science 33(6), 485-492.
seMide/eMWis. 2012. Interview with Prof. Dr. Cumali Kinaci, Director General of Water Management of the Ministry of Forestry and Water Affairs (June 21, 2012). Euro-Mediterranean Information System on know-how in the Water sector. Retrieved October 14, 2015, from http://www.emwis.org/countries/fol749974/country378851/links/interview-with-prof.-dr.-cumali-kinaci-director-general-of-water-management-of.
sensoy, s., demircan, M., ulupinar, Y., & Balta, İ. 2008. Climate of Turkey (p. 7). Ankara, Turkey.
sumer, V., & Muluk, c. 2011. Challenges for Turkey to Implement the EU Water Framework Directive. In A. Kramer, A. Kibaroglu, & W. Scheumann, eds., Turkey’s Water Policy (pp.43–67). Springer Berlin Heidelberg. doi:10.1007/978-3-642-19636-2_3.
sütas, süt Ürünglerg a.g. 2013. Tire süt ve süt ürünleri üretim tesisi. Ced Raporu. http://www.csb.gov.tr/db/ced/editordosya/sutas_izmir_sut_ids.pdf.
svendsen, M., Murray-rust, d. h., harmanciohlu, n., & alpaslan, n. 2005. Governing Closing Basins: the Case of the Gediz River in Turkey. In M. Svendsen (Ed.), Irrigation and River Basin Management: Options for Governance and Institutions (First.). Wallingford, UK: CABI.
sWan. 2011. Stated NRW (Non-Revenue water) rates in urban networks. Surrey, UK: Smart Water Networks Forum SWAN.
swinnen, J., deconinck, K., Vandemoortele, t., & Vandeplas, a. 2015. Quality Standards, Value Chains, and International Development: Economic and Political Theory. Cambridge University Press.
Talu, N., Özden, M. S., Özgün, S., Dougherty, W., & Fencl, A. 2011. Enhancing the Capacity of Turkey to Adapt to Climate Change Participatory Vulnerability.
174
(D. Ş. Tapan, Ed.). Ankara, Turkey: Ministry of Environment and Urbanization, General Directorate of Environmental Management, Department of Climate Change.
Tokatli, C., Köse, E., & Çiçek, A. 2013. Groundwater Quality of Türkmen Mountain, Turkey. Polish JourPolish Environmental Studies, 22(4), 1197–1208.
topcu, s. 2011. Water for agriculture: a major and inefficient consumer. In A. Kibaroglu, A. Kramer, & W. Scheumann, eds., Turkey’s water policy (pp.93–116). Heidelberg, Germany: Springer.
trenchless international. 2015. “Under Turkey.” News. Retrieved October 10, 2015, from http://trenchlessinternational.com/news/under_turkey1/98662.
tsur, Y., & dinar, a. 1997. The Relative Efficiency and Implementation Costs of Alternative Methods for Pricing Irrigation Water. World Bank Economic Review, 11(2), 243–262.
topraksuenerji. 2011. Waste Water Issue in Industrial Sector (in Turkish). http://topraksuenerji.org/.
tuBitaK Marmara research center. 2010. River Basin Protection Action Plans. Ankara, Turkey: Turkish Ministry of Environment and Forestry.
tuiK. 2015. Website and databases of the Turkish Statistical Institute. Accessed between September-October 2015.
tuiK. 2014. Municipal Waste Statistics Newsletter No. 16169, various issues. Turkish Statistical Institute, http://www.turkstat.gov.tr/PreHaberBultenleri.do?id=16169.
türker, M. 2013. Groundwater management for water and food security and the importance of cooperative irrigation management in Turkey. International Conference on Policies for Water and Food Security in Dry Areas Cairo, Egypt, 2013.
turkish state Meteorological service. 2015. Rainfall in Turkey. Retrieved March 18, 2015, from http://www.mgm.gov.tr/FILES/resmi-istatistikler/turkiye-yagis-2.pdf.
Ünver, o., & gupta, r. K. 2003. Water Pricing: Issues and Options in Turkey. International Journal of Water Resources Development, 19(2), 311–330.
Varol, s. o., & davraz, a. 2010. Hydrogeological investigation of Sarkikaraagac Basin (Isparta, Turkey) and groundwater vulnerability. Water International, 35(2), 177–194. doi:10.1080/02508061003663445.
Vollrath, t. l., 1991. A theoretical evaluation of alternative trade intensity measures of revealed comparative advantage. Weltwirtschaftliches Archiv, 127(2): 265-280.

Turkey - Water along the food chain
175
World Bank group. 2015. World Bank Group – Turkey partnership: country program snapshot. Washington DC, USA: The World Bank. http://www.worldbank.org/content/dam/Worldbank/document/eca/Turkey-Snapshot.pdf.
World Bank group. 2014. Turn down the heat: confronting the new climate normal. Washington DC, USA: The World Bank.
World Bank group, ed. 2014b. World Development Indicators 2014. World Bank Publications.
World Bank. 2010. Turkey national basin management strategy. Secter note, final draft: World Bank Group.
World Bank PPP. 2015. 2014 global PPI update. Washington DC, USA: The World Bank, Public Private Partnership.
Young, r. a. 2005. Determining the Economic Value of Water: Concepts and Methods. RFF Press, Washington, DC, USA, illustrated edition.
Yu, r., cai, J., loke, M. K., & leung, P. 2010. Assessing the comparative advantage of Hawaii’s agricultural exports to the US mainland market. The Annals of Regional Science, 45(2), 473-485.
Yu, r., cai, J., & leung, P. 2009. The normalized revealed comparative advantage index. The Annals of Regional Science, 43(1), 267-282.
zeldin, W. 2015. Legislation on use of water in agriculture: Turkey. Library of Congress. Retrieved October 10, 2015, from http://www.loc.gov/law/help/water-law/turkey.php#_ftn67.

Please address comments and inquiries to:Investment Centre DivisionFood and Agriculture Organization of the United Nations (FAO)Viale delle Terme di Caracalla – 00153 Rome, Italy [email protected]/investment/en
Report No. 27 – August 2016
Turkey – W
ater alon
g th
e foo
d ch
ainR
epo
rt No. 2
7
Turkey
Water along the food chain
I5991E/1/08.16
ISBN 978-92-5-109360-3
9 7 8 9 2 5 1 0 9 3 6 0 3