unaudited group results - reunert inve… · cbi-electric: aberdare atc telecom cable the...
TRANSCRIPT

UNAUDITED GROUP
RESULTSUNAUDITED GROUP RESULTSAND cASh D Iv IDEND DEcLARAT ION
for the six months ended 31 March 2014
Incorporated in the Republic of South AfricaReg. No 1913/004355/06Ordinary share Code: RLO ISIN code: ZAE000057428(“Reunert”, “the group” or “the company”)

Group profile 1
COMMENTARY 2 – 10Operational reviews 4
– CBI-electric 4
– Nashua 5
– Reutech 8
Prospects 9
Directorate 9
Cash dividend 10
FINANCIAL INFORMATION 11 – 25Summarised group income statement 11
Summarised group statement of comprehensive income 12
Summarised group balance sheet 13
Summarised group cash flow statement 14
Summarised group statement of changes in equity 15
Summarised segmental analysis 17
Notes 18
SUPPLEMENTARY INFORMATION 26
cONTENTS
Incorporated in the Republic of South AfricaReg. no: 1913/004355/06 Share Code: RLO ISIN code: ZAE000057428(“Reunert”, “the group” or “the company”)

1
R3,7 bn R477 m 200 cents(2013: R3,2 bn)REvENUE
(2013: R449 m)OPERATING PROFIT
(2013: 194 cents)NORMALISED hEADLINE EARNINGS PER ShARE
95 cents(2013: 95 cents)TOTAL DIvIDEND PER ShARE
Information & communications
technologies
Defence & allied electronicsElectrical engineering
NASHUA (Office Automation)
NASHUA MOBILE
NASHUA COMMUNICATIONS
PANSOLUTIONS
QUINCE
REUTECH RADAR
REUTECH COMMUNICATIONS
REUTECH SOLUTIONS
FUCHS ELECTRONICS
RC&C MANUFACTURING
CBI-ELECTRIC: African Cables
CBI-ELECTRIC: Low Voltage
CBI-ELECTRIC: ATC Aberdare Telecom Cables (50%)
Other
Group administration
Property portfolio

2
cOMMENTARyOn 14 April 2014 Reunert announced that its subsidiary, Nashua Mobile, had entered into separate and distinct agreements with MTN and Vodacom to dispose of its subscriber bases. As a consequence of this announcement, Nashua Mobile has been presented as a discontinuing operation in the March 2014 results. Summarised financial information pertaining to Nashua Mobile has been included in note 3 in the condensed financial information.
Normalised headline earnings per share for the group, including Nashua Mobile, has decreased by 8% from 256,5 cents to 237,2 cents.
Revenue from continuing operations increased by 14% to R3,7 billion, whilst operating profit increased from R449,2 million to R477,2 million. Basic earnings per share and headline earnings per share from continuing operations increased by 3% to 200,9 cents and 201,3 cents respectively.
Normalised headline earnings per share from continuing operations increased by 3% from 194,0 cents to 200,0 cents.
RmREVENUE 10 YEAR HISTORY
6 000
5 000
4 000
3 000
2 000
1 000
005 06 07 08 09 10 11 12 13 14
n H1 Continuing n H1 Discontinuing n H2 Continuing n H2 Discontinuing
RmOPERATING PROFIT 10 YEAR HISTORY
1 000
800
600
400
200
005 06 07 08 09 10 11 12 13 14
n H1 Continuing n H1 Discontinuing n H2 Continuing n H2 Discontinuing
3
UNAUDITED GROUP RESULTS AND CASH DIVIDEND DECLARATION
CentsNORMALISED HEPS 10 YEAR HISTORY
700
600
500
400
300
200
100
005
n H1 n H2
1406 090807 10 11 12 13
242I
I(223) I
(27)
10I
I(281)
RmCASH FLOW FOR THE SIX MONTHS ENDED 31 MARCH 2014
I(172)
Cash flowfrom operating
activities including traditional
working capital
Movement in total
rental and finance lease
receivables
Acquisition of business
Investing activities
Financing activities
I(111)
Opening balance
Closing balance
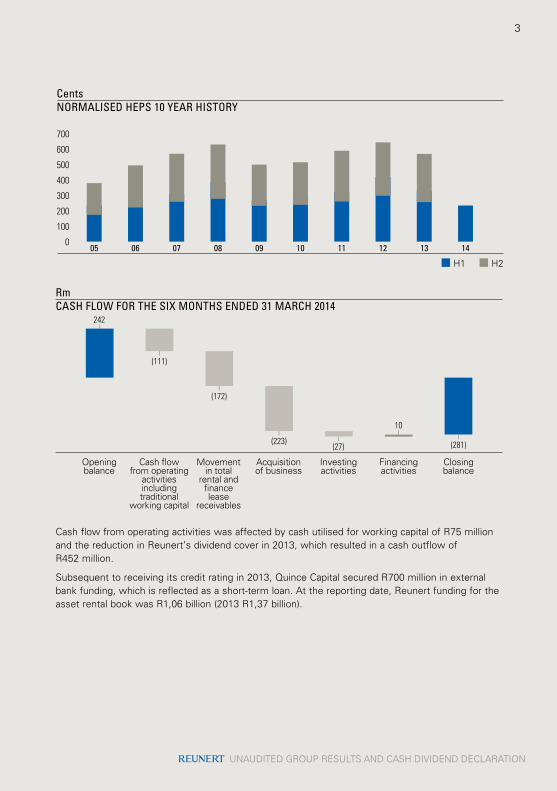
Cash flow from operating activities was affected by cash utilised for working capital of R75 million and the reduction in Reunert’s dividend cover in 2013, which resulted in a cash outflow of R452 million.
Subsequent to receiving its credit rating in 2013, Quince Capital secured R700 million in external bank funding, which is reflected as a short-term loan. At the reporting date, Reunert funding for the asset rental book was R1,06 billion (2013 R1,37 billion).

4 COMMENTARY
cOMMENTARy cONTINUED
OPERATIONAL REvIEWS
CBI-ELECTRICRevenue increased by 12% to R1,8 billion, mainly as a result of increased sales by the energy cables business. Although revenue increased, operating profit decreased by 8% to R214,6 million as a result of margin pressure and change in product mix.
%FACTORY CAPACITY UTILISATION
Sep09
Mar09
9080706050403020100
Mar11
Mar10
Mar13
Mar12
Mar14*
Sep13*
Sep12
Sep11
Sep10
n Low voltage n Energy cables* n Copper telecom cables n Fibre telecom cables
* Energy cables quantities adjusted for renewable energy cables in line with factory capacity.
CBI-electric: low voltageThe low voltage business delivered stable revenue from its local market, but offshore operations remained under pressure. Further, higher material input costs due to the weaker rand resulted in lower margins.
The demand for product in Europe for the roll-out of the 4G cellular network was somewhat muted, which affected export sales’ volumes. The Australian operation, although still operating in an environment with muted demand, has stabilised.
The solutions’ business was awarded a number of contracts in the renewable energy sector, which increased revenues, although the work was performed at relatively lower margins.
LOW-VOLTAGE EXPORT REVENUE BY REGION (%)
1009080706050403020100
n North America n Europe n Africa n Australia n Far East
Sep09
Mar14
Sep10
Sep12
Sep13
Sep11

5
UNAUDITED GROUP RESULTS AND CASH DIVIDEND DECLARATION
Low voltage market segmentation as % of revenue FY2010 FY2011 FY2012 FY2013 1H2014
Residential and commercial 45 40 35 35 33Industrial 9 7 5 6 5Mining 12 12 8 6 7Automation and control 10 12 7 5 5Retail 4 6 5 4 4Utilities 5 2 5 8 7Solutions 0 2 2 4 13Exports and offshore subsidiaries 15 19 33 32 27
CBI-electric: African CablesThe continued delays in infrastructure projects had a negative impact on the activity levels of the power installation division. The tragic accident at the Ingula Pump Station site resulted in a halt in construction, which further affected this operation.
The manufacturing operation was negatively affected by industrial action, which delayed certain sales. Pleasingly, the contribution from revenues recorded from the renewable energy sector more than offset the above adverse effects, although margin pressure continues to be experienced by the business.
MARKET SEGMENTATION (% OF REVENUE)
0 10 20 30 40 50
n 1H2014 n 1H2013
Exports
Utilities
Construction and general industry
Resources
CBI-electric: Aberdare ATC telecom cable The telecommunications cables operation had another slow six months with revenue and operating profit remaining flat.
NAShUARevenue increased by 3% to R3,4 billion for the Nashua segment as a whole. However, excluding Nashua Mobile, revenue increased by 10% to R1,6 billion.
Operating profit from continuing operations increased by 11% to R204,4 million, whilst operating profit, including Nashua Mobile, decreased by 8% to R290 million.

6 COMMENTARY
cOMMENTARy cONTINUED
Nashua MobileRevenue for Nashua Mobile decreased by 5%, as a result of continued price deflation in the mobile industry, as well as the impact of the reduced incentives received from the service providers.
R’000REVENUE ANALYSIS
Aug09
Mar09
1 000800700600500400300200100
0Nov10
Jan10
Jul12
Sep11
Mar14
May13
Feb12
Apr11
Jun10
n Airtime (excl. LCR) n Subscriptions (excl. LCR) n LCR combined
Dec12
Oct13
While the announcement of the disposal of the subscriber bases will culminate in the disposal of the business of Nashua Mobile and its operations, until such time as the conditions precedent in the agreements have been fulfilled, the company will strive to minimise its churn and protect its subscriber base.
FY2012 FY2013 1H2014
Closing subscriber base 897 534 934 911 924 862Number of subscribers signed up 214 442 196 822 81 160Number of subscribers lost 120 861 83 366 55 858Network base adjustments 42 568 61 270 35 351ARPU R337 R312 R292Churn %-total 18,7% 17,4% 11,9%Number of prepaid sims 44 863 63 148 65 744
Nashua Office AutomationNashua Office Automation reported an increase of 19% in revenue, which was principally due to the acquisition of Nashua North and Prodoc Svenska AB, our acquisition in Sweden.
Nashua Office Automation managed to limit the impact of the weakening Rand on its margins.
Demand has been subdued in the slow market as customers delay the upgrade of office automation equipment. However, document volumes, as well as active machines in the field, have remained stable.
7
UNAUDITED GROUP RESULTS AND CASH DIVIDEND DECLARATION
Nashua MobileRevenue for Nashua Mobile decreased by 5%, as a result of continued price deflation in the mobile industry, as well as the impact of the reduced incentives received from the service providers.
R’000REVENUE ANALYSIS
Aug09
Mar09
1 000800700600500400300200100
0Nov10
Jan10
Jul12
Sep11
Mar14
May13
Feb12
Apr11
Jun10
n Airtime (excl. LCR) n Subscriptions (excl. LCR) n LCR combined
Dec12
Oct13
While the announcement of the disposal of the subscriber bases will culminate in the disposal of the business of Nashua Mobile and its operations, until such time as the conditions precedent in the agreements have been fulfilled, the company will strive to minimise its churn and protect its subscriber base.
FY2012 FY2013 1H2014
Closing subscriber base 897 534 934 911 924 862Number of subscribers signed up 214 442 196 822 81 160Number of subscribers lost 120 861 83 366 55 858Network base adjustments 42 568 61 270 35 351ARPU R337 R312 R292Churn %-total 18,7% 17,4% 11,9%Number of prepaid sims 44 863 63 148 65 744
Nashua Office AutomationNashua Office Automation reported an increase of 19% in revenue, which was principally due to the acquisition of Nashua North and Prodoc Svenska AB, our acquisition in Sweden.
Nashua Office Automation managed to limit the impact of the weakening Rand on its margins.
Demand has been subdued in the slow market as customers delay the upgrade of office automation equipment. However, document volumes, as well as active machines in the field, have remained stable.
MillionsTOTAL DOCUMENT VOLUME
Mar10
Sep09
450400350300250200150100500
Sep10
Mar12
Sep11
Mar14
Mar13
Mar11
n Printers
Sep12
Sep13
9080706050403020100
n Total clicks n Multi-functional printers
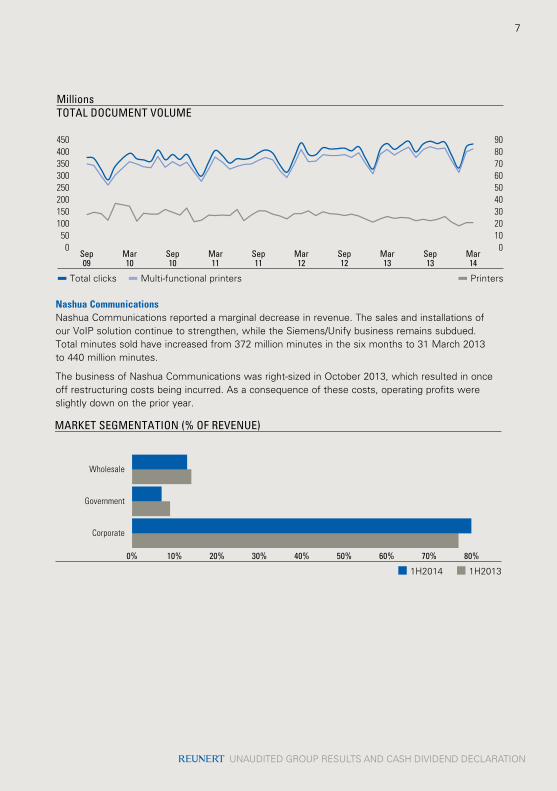
Nashua CommunicationsNashua Communications reported a marginal decrease in revenue. The sales and installations of our VoIP solution continue to strengthen, while the Siemens/Unify business remains subdued. Total minutes sold have increased from 372 million minutes in the six months to 31 March 2013 to 440 million minutes.
The business of Nashua Communications was right-sized in October 2013, which resulted in once off restructuring costs being incurred. As a consequence of these costs, operating profits were slightly down on the prior year.
MARKET SEGMENTATION (% OF REVENUE)
0% 10% 20% 30% 40% 50% 80%
n 1H2014 n 1H2013
Wholesale
Government
Corporate
70%60%

8 COMMENTARY
cOMMENTARy cONTINUED
PansolutionsPansolutions’ revenue and operating profit declined marginally as the market remained highly competitive.
Quince CapitalQuince, Nashua’s financing operation, delivered a strong performance with increased revenue and operating profits. Despite the poor economic conditions, Quince has continued to contain its bad debt levels.
The rental book increased to R1,9 billion over the prior reporting period due in the main to the rental book acquired from Nashua North.
R million FY2011 FY2012 FY2013 1H2014
Total book 1 281,2 1 431,1 1 820,0 1 867,7Average monthly discounting 55,4 64,5 79,5 79,5
REUTEChRevenues increased by 28% over the prior period from R380,5 million to R487,7 million. This growth was delivered by all operations in the segment, with the exception of Fuchs.
Operating profit increased by 58% to R77,9 million, due to the higher revenues as well as the once-off integration costs associated with the SAAB Grintek acquisition in 2013 not being repeated.
n Local revenue
n Export revenue
LOCAL VSEXPORT SALES
51%1H201349%
55%1H201445%
n Mining
n Defence
n Commercial
SALES BYMARKET SECTOR
23%
1H2013
65%
12%
41%1H201450%
9%

9
UNAUDITED GROUP RESULTS AND CASH DIVIDEND DECLARATION
PROSPECTSLooking forward, Reunert will continue to pursue earnings growth, both organically and through synergistic acquisitions. However, given the sluggish economy, organic growth is expected to remain challenging. Consequently, the group will also retain its focus on rigorous cost control, effective cash management and the extraction of efficiencies from its businesses.
The financial information on which the above is based has not been reviewed or reported on by the company’s external auditors.
DIRECTORATE With effect from 21 November 2013 Messrs Alan Dickson and Mark Taylor were appointed to the board as executive directors.
With effect from 26 November 2013 Ms Sarita Martin was appointed to the board and the audit and risk committees.
Mr Johannes van der Horst retired from the board on 17 February 2014, having reached mandatory retirement age. The board extends its sincere appreciation to him for his exemplary service over the years and wishes him and his wife all the best in their retirement.
Ms Louisa Mojela did not make herself available for re-election to the board at the AGM on 17 February 2014.

10
CASh DIvIDENDNotice is hereby given that a gross interim cash dividend No 176 of 95 cents per ordinary share (2013: 95 cents per share) has been declared by the directors for the six months ended 31 March 2014.
The dividend has been declared from income reserves and no secondary tax on companies’ credits have been used.
A dividend withholding tax of 15% will be applicable to all shareholders who are not exempt from, or who do not qualify for a reduced rate of withholding tax. The net dividend payable to shareholders subject to withholding tax at a rate of 15% thus amounts to 80,75 cents per share.
The issued share capital at the declaration date is 187 256 746 ordinary shares. Reunert’s income taxation reference number is 9100/101/71/7P.
In compliance with the requirements of Strate, the following dates are applicable:
Last date to trade (cum dividend) Thursday, 12 June 2014
First date of trading (ex dividend) Friday, 13 June 2014
Record date Friday, 20 June 2014
Payment date Monday, 23 June 2014
Shareholders may not dematerialise or rematerialise their share certificates between Friday, 13 June 2014 and Friday, 20 June 2014, both days inclusive.
On behalf of the board
Trevor Munday David Rawlinson Manuela KrogChairman Chief Executive Chief Financial Officer
Sandton
19 May 2014
COMMENTARY

11
UNAUDITED GROUP RESULTS AND CASH DIVIDEND DECLARATION
FINANcIAL INFORMATIONSummarised group income statement
R million Notes
Six months ended 31 March
%change
Year ended 30 September
2013(Audited)
(Restated)*2014
(Unaudited)
2013(Unaudited)
(Restated)*
Revenue 3 681,7 3 242,5 14 7 246,7
Earnings before interest, taxation, depreciation, amortisation, other income and dividends 514,9 495,2 4 1 174,6 Other income 14,2 14,1 41,9
Earnings before interest, taxation, depreciation and amortisation (EBITDA) 529,1 509,3 4 1 216,5 Depreciation and amortisation 51,9 60,1 114,0
Operating profit 1 477,2 449,2 6 1 102,5 Net interest and dividend income 2 (7,8) 9,3 11,6
Profit before taxation 469,4 458,5 2 1 114,1Taxation 137,0 136,1 313,2
Profit after taxation 332,4 322,4 3 800,9 Share of joint ventures’ profit 11 0,5 0,9 10,1
Profit for the period from continuing operations 332,9 323,3 3 811,0 Profit for the period from discontinuing operation 3 60,4 101,8 (41) 161,8
Profit for the period 393,3 425,1 (7) 972,8
Profit attributable to:Non-controlling interests 3,7 4,6 (20) 13,8 Equity holders of Reunert – from continuing operations 329,2 318,7 3 797,2 Equity holders of Reunert – from discontinuing operation 60,4 101,8 (41) 161,8
Basic earnings per share from continuing operations (cents) 4 & 5 200,9 195,6 3 488,6Diluted earnings per share from continuing operations (cents) 4 & 5 198,7 193,3 3 484,0 Basic earnings per share (cents) 4 & 5 237,8 258,1 (8) 587,8 Diluted earnings per share (cents) 4 & 5 235,1 255,2 (8) 582,3
* Restated to reflect the reallocation of the results of Nashua Mobile Proprietary Limited (Nashua Mobile) to profit from discontinuing operation and the adoption of the consolidation suite of accounting standards. Refer to Notes 3, 10 and 11 for additional information. The results before restatement reported for 30 September 2013 have been audited, although the restatements are unaudited.

12 FINANCIAL INFORMATION
Cents Notes
Six months ended 31 March
%change
Year ended 30 September
2013(Audited)
2014(Unaudited)
2013(Unaudited)
Other measures of earnings per share from continuing operationsHeadline earnings per share 4 & 5 201,3 195,7 3 484,0Diluted headline earnings per share 4 & 5 199,1 193,4 3 479,5Normalised headline earnings per share 4 & 5 200,0 194,0 3 469,9Diluted normalised headline earnings per share 4 & 5 197,9 191,7 3 465,4Other measures of earnings per shareHeadline earnings per share 4 & 5 238,5 258,2 (8) 583,2 Diluted headline earnings per share 4 & 5 235,8 255,2 (8) 577,7 Normalised headline earnings per share 4 & 5 237,2 256,5 (8) 569,1 Diluted normalised headline earnings per share 4 & 5 234,6 253,5 (7) 563,7
Cash dividend per ordinary share declared 95,0 95,0 – 370,0
Summarised group statement of comprehensive income
R million
Six months ended 31 March Year ended30 September
2013(Audited)
2014(Unaudited)
2013(Unaudited)
Profit for the period 393,3 425,1 972,8 Other comprehensive income, net of taxation:Items that may be reclassified subsequently to profit or loss (Losses)/Gains arising from translating the
financial results of foreign subsidiaries (0,1) 3,2 4,9
Total comprehensive income 393,2 428,3 977,7
Total comprehensive income attributable to:Non-controlling interests 3,7 4,6 13,8 Equity holders of Reunert 389,5 423,7 963,9
SUMMARISED GROUP INcOME STATEMENT cONTINUED

13
UNAUDITED GROUP RESULTS AND CASH DIVIDEND DECLARATION
Summarised group balance sheet
R million Notes
31 March2014
(Unaudited)
31 March2013
(Unaudited)(Restated)*
30 September2013
(Audited)(Restated)*
Non-current assetsProperty, plant and equipment and intangible assets 724,3 637,6 712,5 Goodwill 7 859,3 695,2 792,2 Investments and loans 8 86,2 106,2 128,7 Investments in joint ventures 160,7 160,8 170,1 Rental and finance lease receivables 1 355,0 1 186,7 1 378,2 Deferred taxation 52,6 28,5 55,3
3 238,1 2 815,0 3 237,0
Current assetsInventory and contracts in progress 1 062,0 972,6 1 083,9 Rental and finance lease receivables 642,7 722,2 792,5 Accounts receivable, derivative assets and taxation 1 532,2 1 461,3 1 648,0 Cash and cash equivalents 463,1 754,7 611,2 Assets held for sale 3 874,7 – –
4 574,7 3 910,8 4 135,6
Total assets 7 812,8 6 725,8 7 372,6
Equity attributable to equity holders of Reunert Ordinary 4 839,9 4 449,0 4 877,9 Preference – 0,7 –
4 839,9 4 449,7 4 877,9 Non-controlling interests 73,8 52,5 59,4
Total equity 4 913,7 4 502,2 4 937,3
Non-current liabilitiesDeferred taxation 64,7 113,6 131,7 Long-term borrowings 9 24,9 26,7 24,9
89,6 140,3 156,6
Current liabilitiesAccounts payable, derivative liabilities, provisions and taxation 1 496,8 1 857,3 1 908,7 Bank overdrafts, short-term loans and current portion of long-term borrowings (including finance leases) 816,0 226,0 370,0 Liabilities associated with assets held for sale 3 496,7 – –
2 809,5 2 083,3 2 278,7
Total equity and liabilities 7 812,8 6 725,8 7 372,6
* Restated to reflect the adoption of the consolidation suite of accounting standards. Refer to Notes 10 and 11 for additional information. The results before restatement reported for 30 September 2013 have been audited, although the restatements are unaudited.

14 FINANCIAL INFORMATION
Summarised group cash flow statement
R million
Six months ended 31 March Year ended30 September
2013(Audited)
(Restated)*2014
(Unaudited)
2013(Unaudited)
(Restated)*
EBITDA 620,2 646,3 1 438,6
EBITDA from continuing operations 529,1 509,3 1 216,5 EBITDA from discontinuing operation 91,1 137,0 222,1
(Increase)/decrease in net working capital (75,3) 113,2 (149,2)Other (net) (1,5) 1,9 (10,7)
Cash generated from operations 543,4 761,4 1 278,7 Net interest and dividend income (6,0) 13,3 15,7 Taxation paid (196,4) (188,2) (361,1)Dividends paid (including to non-controlling interests) (452,0) (456,1) (612,8)
Net cash flows from operating activities (111,0) 130,4 320,5 Net cash flows from investing activities (422,0) (191,6) (692,1)
Capital expenditure (65,0) (50,7) (172,2)Net cash flows arriving from acquisition of businesses (222,9) – (238,6)Movement in total rental and finance lease receivables (171,8) (146,7) (287,5)Non-current loans granted (1,2) – (17,7)Dividends received 38,4 – –Other 0,5 5,8 23,9
Net cash flows from financing activities 10,2 21,6 44,9
Shares issued 10,6 20,5 46,0 Redemption of preference shares – – (0,7)Other (0,4) 1,1 (0,4)
Decrease in net cash resources (522,8) (39,6) (326,7)Net cash resources at the beginning of the period 241,8 568,5 568,5
Net (borrowings)/cash resources at the end of the period (281,0) 528,9 241,8
Cash and cash equivalents 463,1 754,7 611,2 Cash and cash equivalents of assets held for sale 71.7 – –Bank overdrafts (815,8) (225,8) (369,4)
Net (borrowings)/cash resources at the end of the period (281,0) 528,9 241,8
* Restated to reflect the adoption of the consolidation suite of accounting standards. Refer to Notes 10 and 11 for additional information. The results before restatement reported for 30 September 2013 have been audited, although the restatements are unaudited.
The cash flow statement includes the cash flows of all operations, including the discontinuing operation, which has been recorded in terms of IFRS 5 – Non-current Assets Held for Sale.

15
UNAUDITED GROUP RESULTS AND CASH DIVIDEND DECLARATION
Summarised group statement of changes in equity
R million
Six months ended 31 March Year ended30 September
2013(Audited)
2014(Unaudited)
2013(Unaudited)
Share capital and premium Balance at the beginning of the period 288,1 242,8 242,8 Issue of shares 10,6 20,5 46,0 Redemption of preference shares – – (0,7) Cancellation of issued shares (20,7) – –
Balance at the end of the period 278,0 263,3 288,1
Share-based payment reserve Balance at the beginning of the period – 766,9 766,9 Share-based payment expense 12,0 11,0 29,6 Transfer to retained earnings (12,0) – (796,5)
Balance at the end of the period – 777,9 –
Equity transactions with empowerment partner and non-controlling shareholder Balance at the beginning of the period – (34,9) (34,9) Acquisition of non-controlling interest – – (0,2) Transferred to retained earnings – (0,4) 35,1
Balance at the end of the period – (35,3) – Empowerment shares* (276,1) (276,1) (276,1)
Treasury shares Balance at the beginning of the period (1 253,6) (1 253,6) (1 253,6) Cancellation of issued shares 941,0 – –
Balance at the end of the period (312,6) (1 253,6) (1 253,6)
Non-distributable reserves Balance at the beginning of the period – 3,9 3,9 Transfer to retained earnings – – (3,9)
Balance at the end of the period – 3,9 –
Foreign currency translation reserves Balance at the beginning of the period 2,1 (2,8) (2,8) Other comprehensive income (0,1) 3,2 4,9
Balance at the end of the period 2,0 0,4 2,1
Retained earnings Balance at the beginning of the period 6 117,4 4 996,2 4 996,2 Profit after taxation attributable to equity holders
of Reunert 389,6 420,5 959,0 Cash dividends declared and paid (450,1) (447,9) (603,1) Cancellation of issued shares (920,3) – – Transfer from reserves 12,0 0,4 765,3
Balance at the end of the period 5 148,6 4 969,2 6 117,4

16 FINANCIAL INFORMATION
R million
Six months ended 31 March Year ended30 September
2013(Audited)
2014(Unaudited)
2013(Unaudited)
Equity attributable to equity holders of Reunert 4 839,9 4 449,7 4 877,9 Non-controlling interests
Balance at the beginning of the period 59,4 56,1 56,1 Share of total comprehensive income 3,7 4,6 13,8 Dividends declared and paid (1,9) (8,2) (9,7) Acquisition of non-controlling interest 12,6 – (0,8)
Balance at the end of the period 73,8 52,5 59,4
Total equity at end of the period 4 913,7 4 502,2 4 937,3
* These are shares held by Bargenel Investments Limited (Bargenel), a company sold by Reunert to an accredited empowerment partner in 2007. Until the amount owing by the empowerment partner is repaid to Reunert, Bargenel is consolidated by the group as the significant risks and rewards of ownership of the equity have not passed to the empowerment partner.
SUMMARISED GROUP STATEMENT OF chANGES IN EQUITy cONTINUED

17
UNAUDITED GROUP RESULTS AND CASH DIVIDEND DECLARATION
Summarised segmental analysis
R million
Six months ended 31 March
%change
Year ended 30 September
2013(Audited)
(Restated)%
of total2014
(Unaudited)%
of total
2013(Unaudited)
(Restated)%
of total
Revenue*CBI-electric 1 774,1 31 1 577,8 30 12 3 505,7 31 Nashua 3 379,8 60 3 276,8 63 3 6 748,4 60 Reutech 487,7 9 380,5 7 28 1 019,9 9 Other 7,4 – 5,6 – 32 12,9 –
Total operations 5 649,0 100 5 240,7 100 8 11 286,9 100
Revenue from equity accounted joint ventures (159,6) (148,8) 7 (345,0)Revenue from discontinuing operation (1 807,7) (1 849,4) (2) (3 695,2)
Revenue as reported 3 681,7 3 242,5 14 7 246,7 * Inter-segment revenue is
immaterial and has not been separately disclosed.
Operating profit CBI-electric 214,6 38 233,8 40 (8) 505,5 38 Nashua 290,0 52 316,0 54 (8) 647,7 49 Reutech 77,9 14 49,3 9 58 207,0 15 Other (19,4) (3) (15,9) (3) (22) (29,9) (2)
Total operations 563,1 100 583,2 100 (3) 1 330,3 100
Operating profit from equity accounted joint ventures (0,3) (1,5) (80) (15,7)Operating profit from discontinuing operation (85,6) (132,5) (35) (212,1)
Operating profit as reported 477,2 449,2 6 1 102,5
R million
31 March2014
(Unaudited)%
of total
31 March2013
(Unaudited)(Restated)
%of total
30 September2013
(Unaudited)(Restated)
%of total
Total assetsCBI-electric 2 037,3 26 1 715,7 26 1 935,4 26Nashua 4 830,0 62 4 180,4 62 4 464,4 61Reutech 701,3 9 604,9 9 727,2 10Other 244,2 3 224,8 3 245,6 3
Total assets as reported 7 812,8 100 6 725,8 100 7 372,6 100

18 FINANCIAL INFORMATION
NotesSix months ended 31 March
30 September2013
(Audited)(Restated)R million
2014(Unaudited)
2013(Unaudited)
(Restated)
1. OPERATING PROFITOperating profit includes:– Cost of sales 2 436,0 2 143,8 4 637,4 – Realised gain on foreign exchange and
derivative instruments 8,6 5,0 8,1 – Unrealised gain on foreign exchange and
derivative instruments 11,5 9,8 30,8
2. NET INTEREST AND DIvIDEND INCOMEInterest income 5,9 14,4 22,0Interest expense (13,7) (5,1) (10,9)Dividend income – – 0,5
Total (7,8) 9,3 11,6
3. DISCONTINUING OPERATION AND ASSET hELD FOR SALE As announced on the JSE Securities Exchange News Service on 14 April 2014, Nashua
Mobile, a wholly-owned subsidiary of Reunert, has entered into separate and distinct sale agreements with each of Mobile Telephone Networks Proprietary Limited (MTN) and Vodacom Proprietary Limited (Vodacom), on 11 April 2014, in terms of which, inter alia, Nashua Mobile will dispose of its MTN and Vodacom subscriber bases to MTN and Vodacom respectively. The culmination of these transactions will result in the disposal of the business of Nashua Mobile and its operations. It is anticipated that the disposal will be completed within the next six months. Nashua Mobile is presented in the Nashua segment of the segmental analysis.
Arising out of this the summarised group income statement and related notes have been restated to exclude the results of Nashua Mobile.

19
UNAUDITED GROUP RESULTS AND CASH DIVIDEND DECLARATION
3. DISCONTINUING OPERATION AND ASSET hELD FOR SALE CONTINUED The summarised income statement, abridged cashflows and related notes of Nashua Mobile
are presented below:
SUMMARISED INCOME STATEMENT
R million
Six months ended 31 March
%change
Year ended 30 September
2013(Audited)
2014(Unaudited)
2013(Unaudited)
Revenue 1 807,7 1 849,4 (2) 3 695,2 EBITDA 91,1 137,0 (34) 222,1 Operating profit 85,6 132,5 (35) 212,1
Profit for the period 60,4 101,8 (41) 161,8
SUMMARISED CASh FLOW STATEMENT
R million
Six months ended 31 March Year ended30 September
2013(Audited)
2014(Unaudited)
2013(Unaudited)
Net cash flows from: Operating activities 110,7 348,6 330,4 Investing activities (2,3) (27,4) (95,4)Financing activities – – –
Net cash flow 108,4 321,2 235,0
The major classes of assets and liabilities of Nashua Mobile at the end of the reporting period were as follows:
R million
As at31 March
2014(Unaudited)
Non-current assets classified as held for sale 293,2
Current assets classified as held for sale 581,5
Assets classified as held for sale 874,7
Liabilities associated with asset classified as held for sale 496,7

20 FINANCIAL INFORMATION
NOTES cONTINUED
R million
Six months ended 31 March Year ended 30 September
2013(Audited)
(Restated)2014
(Unaudited)
2013(Unaudited)
(Restated)
4. NUMBER OF ShARES USED TO CALCULATE EARNINGS PER ShAREWeighted average number of shares in issue used to determine basic earnings, headline earnings and normalised headline earnings per share (millions of shares) 163,8 162,9 163,1
Adjusted by the dilutive effect of unexercised share options granted (millions of shares) 1,9 1,9 1,6
Weighted average number of shares used to determine diluted basic, diluted headline and diluted normalised headline earnings per share (millions of shares) 165,7 164,8 164,7
5.1 hEADLINE EARNINGSProfit attributable to equity holders of Reunert from continuing operations 329,2 318,7 797,2 Headline earnings are determined by eliminating the effect of the following items from attributable earnings:Net loss/(gain) on disposal of property, plant and equipment and intangible assets (after tax charge of R0,1 million (2013: R0,1 million) (September 2013: R0,8 million)) 0,5 0,1 (7,4)
Gain on change in shareholding in investment (after tax charge of Rnil) – – (0,2)Impairment charge recognised for property, plant and equipment(after tax credit of Rnil (2013: Rnil) (September 2013: R0,1 million)) – – 0,3 Gain on disposal of subsidiary (after tax charge of Rnil (2013: Rnil)(September 2013: R0,5 million)) – – (0,2)
Headline earnings from continuing operations 329,7 318,8 789,7
Profit attributable to equity holders of Reunert from discontinuing operation 60,4 101,8 161,8Net loss on disposal of property, plant and equipment and intangible assets(after tax credit of R0,2 million (2013: Rnil)(September 2013: Rnil)) 0,5 – –
Headline earnings from discontinuing operation 60,9 101,8 161,8
Headline earnings 390,6 420,6 951,5

21
UNAUDITED GROUP RESULTS AND CASH DIVIDEND DECLARATION
R million
Six months ended 31 March Year ended 30 September
2013(Audited)
(Restated)2014
(Unaudited)
2013(Unaudited)
(Restated)
5.2 NORMALISED hEADLINE EARNINGS FROM CONTINUING OPERATIONSHeadline earnings from continuing operations (refer to note 5.1) 329,7 318,8 789,7It is the group’s policy to determine normalised headline earnings by eliminating the effect of the following items from attributable headline earnings:Net economic interest in profit attributable to minority interests with outstanding equityrelated loan accounts (refer to note 6) (2,0) (2,8) (23,0)Share of headline and normalised headline earnings adjustments – – (0,1)
Normalised headline earnings from continuing operations 327,7 316,0 766,6Headline earnings attributable to equity holders of Reunert from discontinuing operation 60,9 101,8 161,8
Normalised headline earnings 388,6 417,8 928,4
6. MINORITY INTERESTS WITh OUTSTANDING EqUITY RELATED LOAN ACCOUNTSIt is the group’s policy that where the significant risks and rewards of ownership in respect of equity interests have not passed to the minority shareholders, these are not recognised as non-controlling interests.Had the non-controlling interests been recognised, the effect would be the following:– Net economic interest in current period
profit that is attributable to all affected minority shareholders 2,0 2,8 23,0
– Balance sheet interest that is economically attributable to all affected minority shareholders 104,1 118,3 147,3

22 FINANCIAL INFORMATION
R million
Six months ended 31 March Year ended 30 September
2013(Audited)
(Restated)2014
(Unaudited)
2013(Unaudited)
(Restated)
7. GOODWILLCarrying value at the beginning of the period 792,2 696,2 696,2 Acquisition of businesses 225,2 – 97,0 Adjustment to goodwill on finalisation of acquisitions made in the prior period – (1,0) (1,0)Goodwill associated with non-current asset held for sale (158,1) – –
Carrying value at the end of the period 859,3 695,2 792,2
8. INvESTMENTS AND LOANSLoans – at cost 75,4 59,9 74,3 Investment in insurance cells – at fair value 9,1 44,6 52,7 Other unlisted investments – at cost 1,7 1,7 1,7
Carrying value at the end of the period 86,2 106,2 128,7
9. LONG-TERM BORROWINGSTotal long-term borrowings (including finance leases) 25,1 26,9 25,5 Less: short-term portion (including finance leases) (0,2) (0,2) (0,6)
24,9 26,7 24,9
10. BASIS OF PREPARATION These summarised consolidated financial statements have been prepared in accordance
with the framework concepts and the recognition and measurement criteria of IFRS and its interpretations adopted by the International Accounting Standards Boards (IASB) in issue and effective for the group at 30 September 2013 and the SAICA Financial Reporting Guides, as issued by the Accounting Practices Committees and Financial Reporting pronouncements as issued by the Financial Reporting Standards Council. This summarised consolidated information has been prepared using the information as required by IAS 34 – Interim Financial Reporting, and complies with the Listings Requirements of the JSE Limited and the requirements of the Companies Act, No 71 of 2008, of South Africa. This report was compiled under the supervision of MC Krog (Chief Financial Officer).
The group’s accounting policies, as per the audited annual financial statements for the year ended 30 September 2013, have been consistently applied except where the group adopted new or revised accounting standards. These accounting policies comply with IFRS.
NOTES cONTINUED

23
UNAUDITED GROUP RESULTS AND CASH DIVIDEND DECLARATION
11. ChANGES IN ACCOUNTING POLICIES The group has adopted the new, revised or amended accounting pronouncements as issued
by the IASB which became effective to the group on 1 October 2013, including some of the more significant changes listed below:
IFRS 10 – CONSOLIDATED FINANCIAL STATEMENTS IFRS 10 replaces IAS 27 – Consolidated and Separate Financial Statements, that addresses
the accounting for consolidated financial statements and SIC 12 – Consolidation – Special Purpose Entities. IFRS 10 provides a single basis for consolidation with new criteria to determine whether entities, in which the group has an interest, should be consolidated.
The adoption of IFRS 10 has resulted in the groups’ interest in insurance cell captives being recognised as long term investments instead of consolidated special purpose entities of the group. The change from full consolidation to accounting for investments at fair value is not considered material. No other material subsidiaries within the group were affected.
As the majority of the insurance cell captives’ assets consist of cash and cash equivalents the carrying amounts approximate fair value because of the short-term nature of these instruments.
IFRS 11 – JOINT ARRANGEMENTS IFRS 11 replaces IAS 31 – Interests in Joint Ventures and SIC 13 – Jointly-controlled Entities
– Non-monetary Contributions by Ventures and changes the classification for joint operations.
Under IFRS 11, a joint arrangement is classified as either a joint operation or a joint venture based on the rights and obligations of the parties to the arrangement, the legal form of the joint arrangement and when relevant, other facts and circumstances. IFRS 11 removes the option to proportionately consolidate joint ventures and instead, all interests in joint arrangements that meet the definition of a joint venture under IFRS 11 must be accounted for using the equity method.
The application of IFRS 11 has resulted in changes in accounting for the group’s jointly controlled entities previously accounted for using the proportionate consolidation method and now will be accounted for using the equity method under IFRS 11.
Both these accounting standards have to be applied retrospectively in terms of their transitional provisions and accordingly the reported results of both comparative periods were restated.

24 FINANCIAL INFORMATION
11. ChANGES IN ACCOUNTING POLICIES cONTINUED The quantitative changes resulting from adopting these standards to the prior year
summarised consolidated financial statements are set out below:
ADJUSTMENTS TO ThE SUMMARISED GROUP BALANCE ShEET
R million
() = decrease
As at31 March
2013
As at30 September
2013
Non-current assets 146,0 165,2
Current assets (189,5) (235,6)
Non-current liabilities (9,1) (8,0)
Current liabilities (34,4) (62,4)
ADJUSTMENTS TO ThE SUMMARISED GROUP INCOME STATEMENT
R million
() = decrease
For the sixmonths ended
31 March2013
For the yearended
30 September2013
Revenue (180,3) (408,7)
EBITDA (5,1) (22,6)
Operating profit (1,3) (14,9)
Profit after taxation (0,9) (10,1)
Share of joint venture’s profits 0,9 10,1
ADJUSTMENTS TO ThE SUMMARISED GROUP CASh FLOW STATEMENT
R million
() = decrease
For the sixmonths ended
31 March 2013
For the yearended
30 September2013
Cash generated from operations (19,8) (51,7)
Net cash flows from operating activities (13,8) (40,0)
Net cash flows from investing activities 1,9 4,2
Net cash flows from financing activities – –
Change in net cash resources (11,9) (35,8)
The adoption of the new, revised or amended accounting pronouncements did not have a significant impact on the Statement of Changes in Equity or the Statement of Comprehensive Income for the six months ended 31 March 2013 and the year ended 30 September 2013.
NOTES cONTINUED

25
UNAUDITED GROUP RESULTS AND CASH DIVIDEND DECLARATION
12. RESTATEMENT OF SUMMARISED GROUP CASh FLOW STATEMENT It is the group’s view that rental and finance leases provided to customers are investing
activities due to the long-term nature of these advances.
Accordingly the summarised group cash flow statement for the six months ended 31 March 2013 was restated to reflect the movement in these amounts from operating activities to investing activities.
The impact of the restatement is R146,7 million and is detailed below:
Previouslyreported* Restated
(Increase)/decrease in net working capital (33,5) 113,2 Cash generated from operations 614,7 761,4 Net cash (outflow)/inflow from operating activities (16,3) 130,4 Movement in total rental and finance lease receivables – (146,7)Net cash outflow from investing activities (44,9) (191,6)
* Cash flow as previously reported taking into account amendments arising from the adoption of IFRS 10 and 11. Refer to notes 10 and 11.
The 30 September 2013 financial statements were reported on the above basis and therefore do not require restatement.
13. UNCONSOLIDATED SUBSIDIARY The financial results of Cafca Limited (Cafca), a subsidiary incorporated in Zimbabwe, have
not been consolidated in the group results as the group does not have management control. The amounts involved are not material to the group’s results.
At 31 March 2014 Cafca’s retained earnings amounted to US$10,9 million.
14. OThER MATTERS In our annual financial statements for the year ended 30 September 2013, note 24 we
referred to a formal complaint initiated against the cables’ industry and that ATC (Pty) Ltd was included as a named party.
The allegations contained in the complaint are legacy issues that relate to tenders and contracts awarded in periods before December 2009. ATC (Pty) Ltd is co-operating fully with the Competition Commission on this matter. Since the date of our annual financial statements we have engaged in settlement negotiations with the Competition Commission, which are expected to be finalised in due course.
15. RELATED PARTY TRANSACTIONS The group entered into various transactions with related parties, which occurred in the
ordinary course of business and under terms that are no more favourable than those arranged with independent third parties.
16. EvENTS AFTER BALANCE ShEET DATE No events have occurred after the balance sheet date that require additional disclosure or
adjustment to the results presented.

26 FINANCIAL INFORMATION
SUPPLEMENTARy INFORMATION
R million (unless otherwise stated)
31 March2014
(Unaudited)
31 March2013
(Unaudited)(Restated)
30 September2013
(Audited)(Restated)
Net worth per share (cents) 2 953 2 728 2 980 Current ratio (:1) 1,6 1,9 1,8 Net number of ordinary shares in issue (million) 163,9 163,1 163,7
Number of ordinary shares in issue (million) 187,2 200,8 201,4 Less: Empowerment shares (million) (18,5) (18,5) (18,5)Less: Treasury shares (million) (4,8) (19,2) (19,2)
Capital expenditure 65,0 50,7 172,2
– expansion 53,8 23,1 137,5 – replacement 11,2 27,6 34,7
Capital commitments in respect of property, plant and equipment 48,4 88,5 126,0
– contracted 32,9 80,2 50,5 – authorised not yet contracted 15,5 8,3 75,5
Commitments in respect of operating leases 121,3 82,2 127,6

UNAUDITED GROUP RESULTS AND CASH DIVIDEND DECLARATION
DIRECTORS TS Munday (Chairman)*, DJ Rawlinson (Chief Executive), AE Dickson, SD Jagoe*, MC Krog (Chief Financial Officer), S Martin*, TJ Motsohi*, NDB Orleyn**, SG Pretorius*, MAR Taylor, R Van Rooyen** Independent non-executive; ** Non-executive
REGISTERED OFFICELincoln Wood Office Park6 – 10 Woodlands DriveWoodmead, SandtonPO Box 784391Sandton, 2146Telephone +27 11 517 9000
TRANSFER SECRETARIESComputershare Investor Services Proprietary Limited70 Marshall StreetJohannesburg, 2001PO Box 61051Marshalltown, 2107
SPONSORRand Merchant Bank (A division of FirstRand Bank Limited)
SECRETARIES’ CERTIFICATIONIn terms of section 88(2)(e) of the Companies Act, 71 of 2008, we certify that, to the best of our knowledge and belief, the company has lodged with the Companies and Intellectual Property Commission for the financial period ended 31 March 2014 all such returns and notices as are required of a public company in terms of the aforesaid Act and that all such returns and notices appear to be true, correct and up to date.
Karen Louwfor Reunert Management Services Proprietary LimitedGroup Company Secretaries
ENqUIRIESCarina de Klerk +27 11 517 9000 or e-mail [email protected] more information log on to the Reunert website at www.reunert.com
20 May 2014

www.reunert.co.za