university of nairobi project no: gon 03/2015...
TRANSCRIPT

UNIVERSITY OF NAIROBI
PROJECT NO: GON 03/2015
DESIGN OF A PENSTOCK FOR A MICRO HYDRO PLANT
AUTHORED BY:
MOMANYI DUNCAN F18/29933/2009
MOKO ANTONY F18/20005/2009
PROJECT SUPERVISOR:
ENG. G. NYANGASI
SUBMITTED: APRIL, 2015
SUBMITTED IN PARTIAL FULFILMENT OF THE REQUIREMENT FOR THE
AWARD OF THE DEGREE OF BACHELOR OF SCIENCE IN MECHANICAL AND
MANUFACTURING ENGINEERING
DEPARTMENT OF MECHANICAL & MANUFACTURING ENGINEERING

DECLARATION
The work presented in this project is my original work and to the best of my knowledge, it has
not been submitted either in the same or different form anywhere for certification in any other
university for academic qualification.
Signed
……………………………………………..
MOMANYI DUNCAN
Signed
……………………………………………..
MOKO ANTONY
………………………………………………
Signed Supervisor
Eng. G. NYANGASI
………………………………………………

DEDICATIONS
This project is dedicated to our parents for their love for our education and their positive
influence towards its completion.

ACKNOWLEDGEMENTS
This project might not have been a success were it not for the countless effort from people we
are obliged to acknowledge here.
First and foremost, we would like to acknowledge our supervisor, Eng. Nyangasi for his
guidance and for all the literature material provided by him that were a huge guide.
We also acknowledge the operations officer at KENGEN Kenya, eastern region,Mr. Joel Ngugi
for allowing us to visit their power plant at Sagana, Nyeri county to carry the field study that laid
the basis for this research project.
Abundant gratitude goes to Miss. Ruth of the operations office at KENGEN for her great
facilitation to see that the trip to their plant was a success.
Above all, we wish to thank our parents for the financial and moral support provided by them to
ensure that we completed this research project.
ACCRONYMS
Ki - turbulence loss coefficient �� - Velocity
Q - Discharge
UPVC - Unplasticised polyvinyl chloride
CFM/cfm - Cubic feet per minute
FPM/fpm - feet per minute
Kw - Kilowatts
Hp - Horsepower
Fd - Loss coefficient for pipe entry �� - Capture velocity � - Height between the vessel and the exhaust hood
� - Velocity Pressure
- Fitting coefficient of friction
� - Coefficient of friction due to angle of bend
- Coefficient of friction due to Reynolds number � - Density
- Acceleration due to gravity ℎ - static height
table of contents
Contents
DECLARATION ........................................................................................................................................... 2
DEDICATIONS............................................................................................................................................ 3
ACKNOWLEDGEMENTS ............................................................................................................................ 3
ACCRONYMS ............................................................................................................................................. 4
ABSTRACT ................................................................................................................................................. 9
CHAPTER 1: INTRODUCTION .................................................................................................................. 10
1.1 Background information .................................................................................................................. 10
1.2 Problem statement ......................................................................................................................... 11
1.3 Objectives ......................................................................................................................................... 12
CHAPTER 2: LITERATURE REVIEW .......................................................................................................... 13
2.1 Materials used for penstocks ........................................................................................................... 13
2.1.1 Ductile iron ................................................................................................................................ 13
Figure 2.1: Ductile iron ........................................................................................................................... 13
2.1.2 Prestressed concrete ................................................................................................................. 13
Figure 2.2: Concrete Penstock................................................................................................................ 13
2.1.3 Mild steel ................................................................................................................................... 13
Figure 2.3: Steel penstocks ..................................................................................................................... 14
2.1.4 UUPVC (Unplasticised polyvinyl chloride .................................................................................. 14
Figure 2.4: uPVC penstock ...................................................................................................................... 15
2.2 Factors to be considered when selecting material ......................................................................... 15
2.2.1 Design Pressure ......................................................................................................................... 15
2.2.2 Surface Roughness .................................................................................................................... 16
2.2.3 Weight of material .................................................................................................................... 16
2.2.4 Ease of transportation .............................................................................................................. 16
2.2.5Method of jointing ..................................................................................................................... 16
2.2.6 Cost of material ......................................................................................................................... 17
2.3 Determination of penstock dimensions and losses ......................................................................... 17
2.3.1 darcy-weischbach method ........................................................................................................ 17
Figure 2.5: Moody diagram .................................................................................................................... 19
2.3.2 Hazen william method ............................................................................................................... 19

Table 2.1: Materials ................................................................................................................................ 20
(courtesy engineeringtool-box.com) ...................................................................................................... 20
Pipe equation ......................................................................................................................................... 21
CHAPTER 3: EXISTING PENSTOCK OF KENGEN SAGANA PLANT ............................................................... 1
3.1 specifications. ................................................................................................................................. 1
Table 3.1: Plant Specifications .................................................................................................................. 2
Figure 3.1: AUTOCAD drawing of the SAGANA hydo plant’s pensto k indi ating the uried part. ......... 3
Figure 3.2: dimensioned CAD drawing of the SAGANA plant .................................................................. 3
Figure 3.3: CAD drawing of the SAGANA hydro plant penstock outlay ................................................... 4
3.2 Performance of existing plant ............................................................................................................ 4
3.3 Net head available at turbine ............................................................................................................. 5
3.4 Determining the plant efficiency ........................................................................................................ 6
3.5 Percentage head loss.......................................................................................................................... 6
3.6 Penstock efficiency ............................................................................................................................. 6
CHAPTER 4: REVIEW OF THE EXISTING PENSTOCK .................................................................................. 7
4.1 Mild steel ............................................................................................................................................ 8
4.1.1 Penstock loss calculations .......................................................................................................... 8
4.1.2 Steel penstock efficiency ............................................................................................................. 8
4.1.3 Steel penstock diameter .............................................................................................................. 9
Table 4.1: Iterating for different diameters, .......................................................................................... 10
4.1.4 expected power output at optimum penstock ......................................................................... 10
=25.3x36.19x60.36x9.81 .................................................................................................................... 10
4.2uPVC .................................................................................................................................................. 10
4.2.1 PENSTOCK LOSS CALCULATIONS ............................................................................................... 10
4.2.2 pvc penstock efficiency ............................................................................................................. 11
4.3 Proposed outlay of new penstock ...................................................................................................... 1
Figure 4.1: AUTOCAD Proposed outlay of new penstock......................................................................... 2
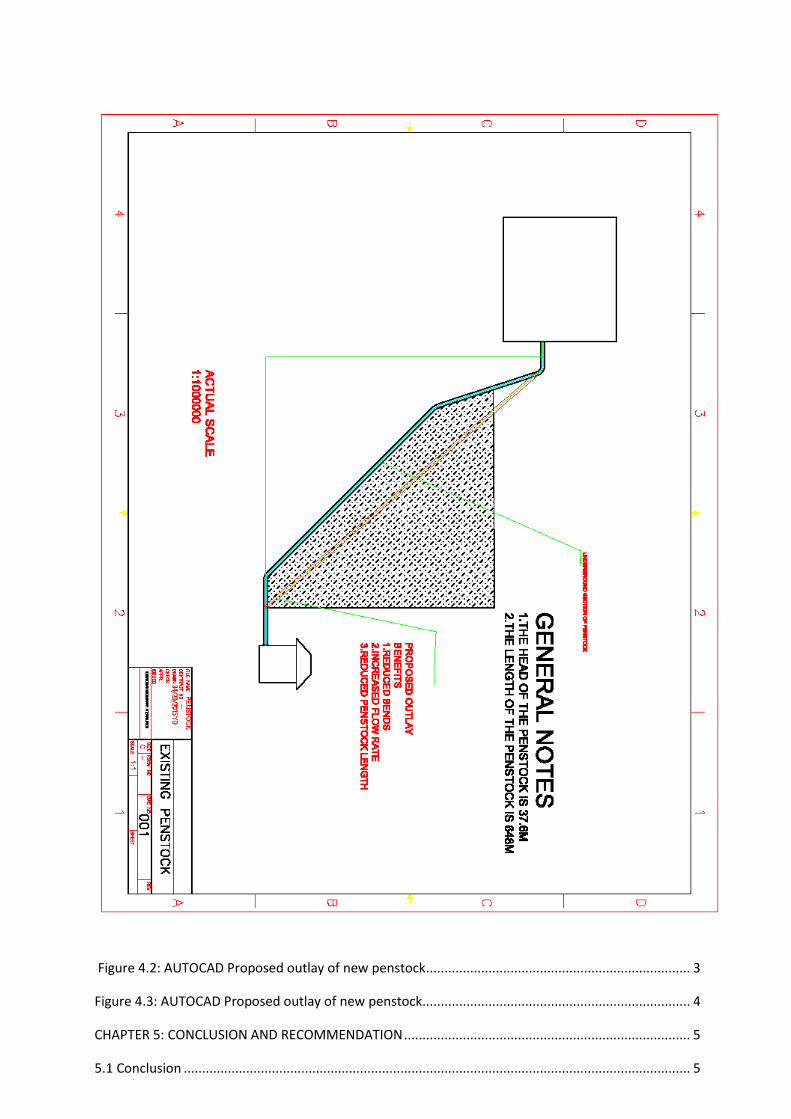
Figure 4.2: AUTOCAD Proposed outlay of new penstock ........................................................................ 3
Figure 4.3: AUTOCAD Proposed outlay of new penstock......................................................................... 4
CHAPTER 5: CONCLUSION AND RECOMMENDATION .............................................................................. 5
5.1 Conclusion .......................................................................................................................................... 5

5.2 Recommendation ............................................................................................................................... 6
REFERENCES ............................................................................................................................................. 7
ABSTRACT
The objective of the project was to conduct a literature review regarding the specifications and
design parameters required to design a penstock. After review of the field data required to design
the component were derived from KENGEN SAGANA HYDRO POWER STATION. This is
because of poor performance of the existing penstock at the plant. To achieve this objective a
review of the existing system was done as well as factors to be considered evaluated. This was
followed by a design of a penstock that would presumably be more efficient leading to increased
power output.
From the review of the existing penstock, it was found that it can be improved to yield a higher
output regarding the amount of water it will discharge to the turbine. Improving the current
penstock involved designing for the best material with lesser losses and suggesting the best
outlay. A simulated model of the proposed penstock was also designed to show how it’s going to
work.
Data such as that obtained from the site and use of penstocks design handbooks enabled us to
determine the optimum parameters for the penstock as well as suggest the efficient turbine.
Also, route consideration was of factor to aid in elevation changes which are very important
in determining the optimum head and economical penstock length.
A turbine and generator was selected to match the flow and pressure at the bottom of the
penstock. Inaccurate flow versus pressure measurements existed for the old penstock route. In
order to estimate the available hydraulic power which can be expected from the new penstock
route, both routes were mapped with special attention paid to elevation changes. Total head was
found to be 37.5 meters over a distance of roughly 648 meters. The effects of fittings and pipe
dimensions, materials and ages on pressure dissipation were accounted for via minor loss
correlations and both Darcy-Weisbach and Hazen-Williams equations. For each penstock route,
total head loss was calculated at various flow rates from which total hydraulic power could be
estimated. The head loss calculated in the old route was compared with the existing
measurements. At the permitted average water flow rate of 25.4 meters cubic per second,
hydraulic power is predicted to be 543.44 kw using the new material and a Francis turbine is

recommended. While the original measurements corroborate this finding, corrections made to
the measurements suggest that 530 kw is a more reasonable power estimate
(source of figures: Kengen Kenya,Sagana plant)
CHAPTER 1: INTRODUCTION
1.1 Background information
The penstock is the pipe which conveys water under pressure from the forebay tank to the
turbine. The penstock often constitutes a major expense in the total micro hydro budget, as much
as 40 % is not uncommon in high head installations, and it is therefore worthwhile optimizing
the design. The trade-off is between head loss and capital cost. Head loss due to friction in the
pipe decrease dramatically with increasing pipe diameter. Conversely, pipe costs increase steeply
with diameter. Therefore a compromise between cost and performance is required.
The design philosophy is first to identify available pipe options, then to select a target head loss,
5 % of the gross head being a good starting point. The details of the pipes with losses close to
this target are then tabulated and compared for cost effectiveness. A smaller penstock may save
on capital costs, but the extra head loss may account for lost revenue from generated electricity
each year.
The materials used in penstock are usually steel, HDPE (High Density Polythene) and
increasingly PVC (Poly Vinyl Chlo-ride). It is one of the most important components of the
MHS (Micro Hydro-power System) because it is at this point that the potential energy of the
water is converted into kinetic energy. The velocity of water at the penstock is typically 3m/s
and is often located at a slope over 45 degrees (Sanchez & Rodriguez, June 2011). Due to the
risk of contraction and expansion of penstock pipes due to fluctuation in seasonal temperature,
sliding type of expansion joints are placed between two consecutive pipe lengths. Anchor block,
which is basically a mass of concrete fixed into the ground, is used to restrain the penstock from
movement in undesirable directions.
Traditionally, steel penstocks have been considered as very high pressure conduits, usually of
large diameter, and operating with frequent surges during the normal condition. Penstocks may
also be subject to pulsations of varying frequency and amplitudes transmitted from the turbine or
pump.
When penstocks are installed above ground, this can sometimes cause excessive vibration. These
are the perceived differences between a penstock and an ordinary pipeline. Based on these
conditions, penstocks have been designed to standards initially established with minor revisions
based on an allowable design stress at normal conditions of 2/3 of yield or 1/3 of tensile strength.
In the last 25 years there have been many changes in steel making practice, pipe manufacturing
methods and welding procedures. These lines have usually been buried lines operating at
working pressure of 150 to 350 p.s.i. plus transient pressures. Many lines, however, have been
installed since 1960 with working pressure as high as640 p.s.i. using high strength low alloy
steels with an allowable design stress of 50% of yield at working pressure and up to 75% of yield
at transient pressures.
Today there are many penstocks installed utilizing thousands of feet of pipe with operating
pressures varying from no pressure at the inlet structure, to low or moderate pressures, or to very
high pressures at the power plants. Most of these penstocks are buried and many parallel to the
stream from which the water was diverted. They are usually in remote locations. With certain
types of turbines and an adequate control valve system, sometimes involving a synchronous
bypass system. Transient pressures can be limited. A buried penstock will not be subject to the
problem of harmonic vibrations sometimes associated with the traditional penstock.
For many of these installations, when carefully evaluated by the engineer, the normal quality and
the design standards of KEBS steel standards should be considered adequate and will provide the
most economical material for this service. As working pressure and pipe diameter increase, the
use of high strength low alloy steel will become economical. At design stresses over 21,000 p.s.i.
at normal conditions, additional testing, including 100% ultrasonic or radiographic inspection of
welds, is appropriate.
1.2 Problem statement
Penstocks are the single major component of a hydro-power plant that comprises the significant
cost (about 40 per cent) to install and maintain. Therefore looking for the best way of selecting
the best material and having the best dimensions that will convey sufficient thrust to the turbine
is very necessary.
Our case study was based on Sagana micro hydro power plant that was commissioned in the pre-
independence period with three penstocks feeding three Francis turbines each producing 500KW
of electrical power at full load.
The penstocks are all made of ductile iron and their outlay is illustrated in this study which gives
us conviction of providing a better design of a penstock that can perform better than the existing
as shall be shown herein.

The existing penstocks at Sagana micro hydro-power plant have been presumed not to be fully
optimized to yield the best of their ability. We are therefore going to use the existing data about
the currently installed penstocks and turbines to come up with a presumably more efficient
through theoretical workings and show how a more optimized penstock to be suggested here can
be utilized for that reason.
Cost is also going to be of a major factor here as every project is usually evaluated by its
economic viability. It shall be shown here basing on figures obtained of the current penstock
how the newly installed penstock shall be of economic significance relative to the former on
matters installation and maintenance.
1.3 Objectives
The research study was aimed at reviewing the design of the penstock at Sagana KenGen micro
hydro power plant
Suggest most suitable material for use to design the new penstock giving consideration to:
i) Design Pressure
ii) surface roughness
iii) weight of material
iv) Method of joining
v) Cost of material
CHAPTER 2: LITERATURE REVIEW
2.1 Materials used for penstocks
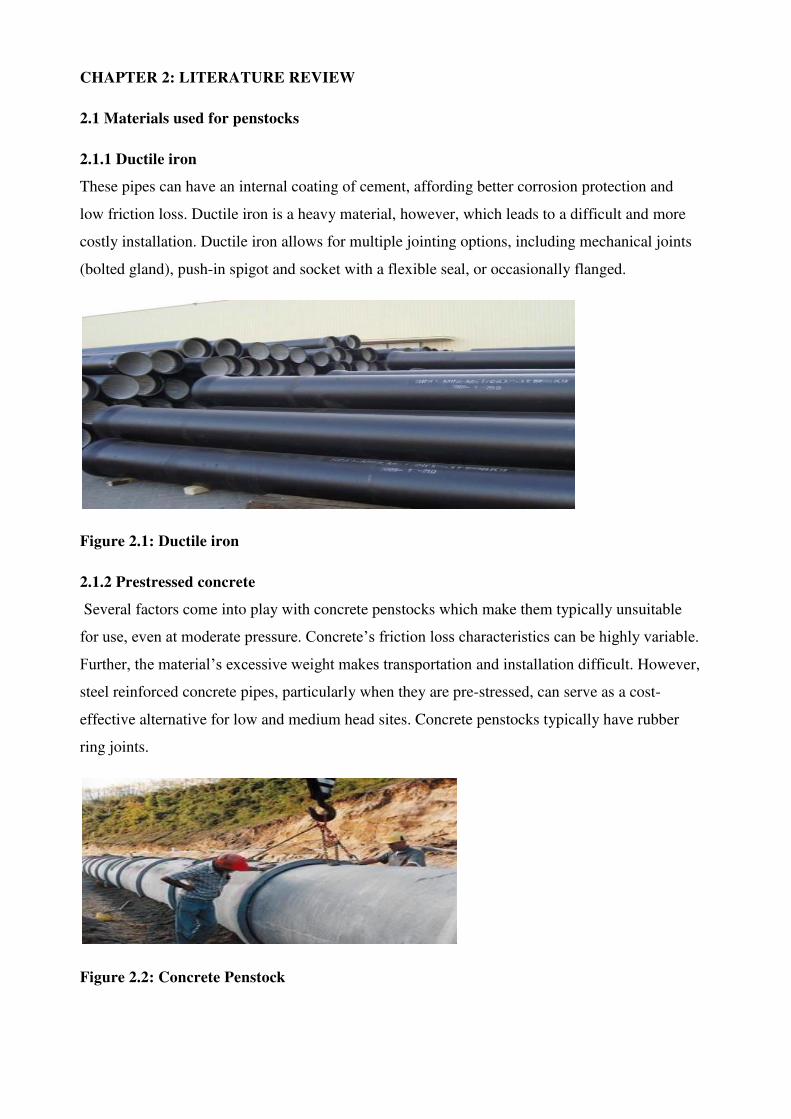
2.1.1 Ductile iron
These pipes can have an internal coating of cement, affording better corrosion protection and
low friction loss. Ductile iron is a heavy material, however, which leads to a difficult and more
costly installation. Ductile iron allows for multiple jointing options, including mechanical joints
(bolted gland), push-in spigot and socket with a flexible seal, or occasionally flanged.
Figure 2.1: Ductile iron
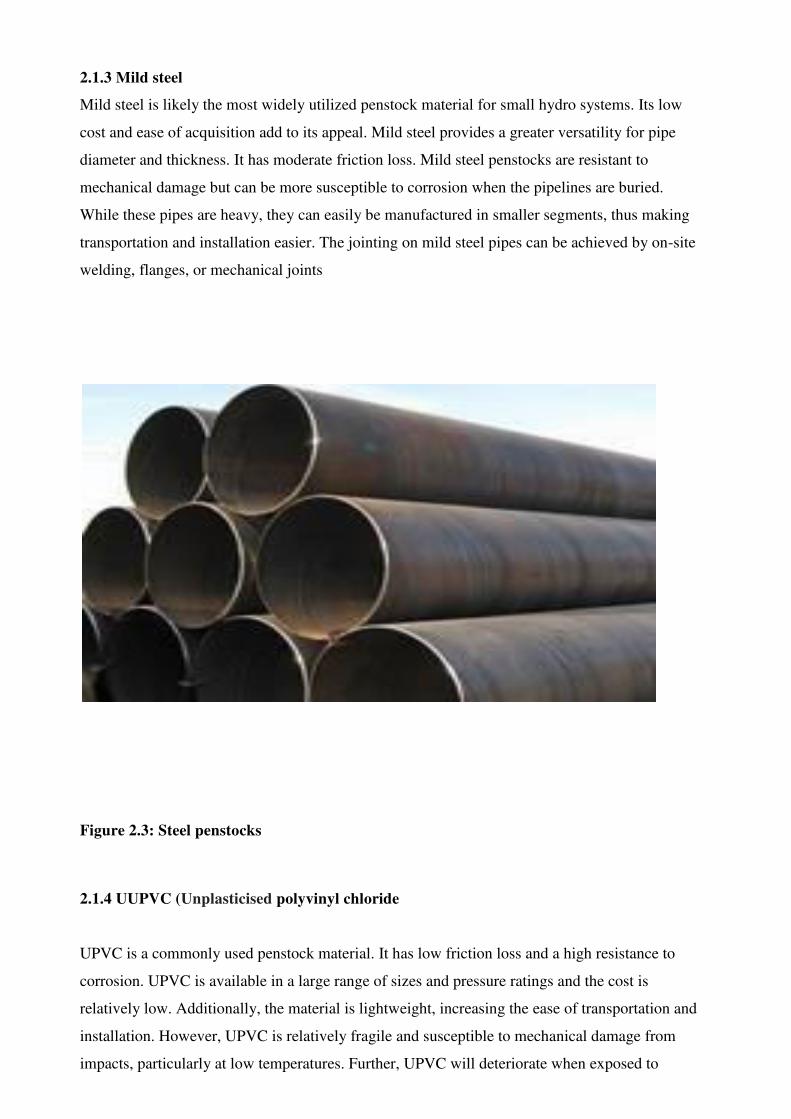
2.1.2 Prestressed concrete
Several factors come into play with concrete penstocks which make them typically unsuitable
for use, even at moderate pressure. Concrete’s friction loss characteristics can be highly variable.
Further, the material’s excessive weight makes transportation and installation difficult. However,
steel reinforced concrete pipes, particularly when they are pre-stressed, can serve as a cost-
effective alternative for low and medium head sites. Concrete penstocks typically have rubber
ring joints.
Figure 2.2: Concrete Penstock
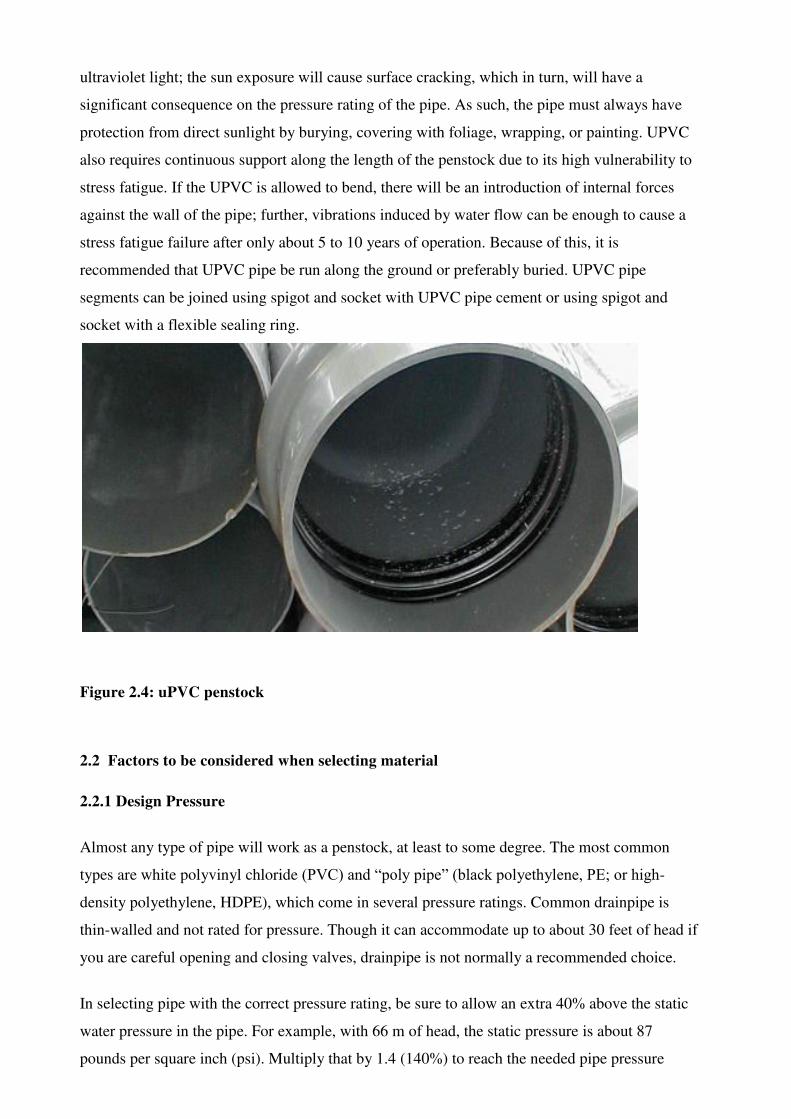
2.1.3 Mild steel
Mild steel is likely the most widely utilized penstock material for small hydro systems. Its low
cost and ease of acquisition add to its appeal. Mild steel provides a greater versatility for pipe
diameter and thickness. It has moderate friction loss. Mild steel penstocks are resistant to
mechanical damage but can be more susceptible to corrosion when the pipelines are buried.
While these pipes are heavy, they can easily be manufactured in smaller segments, thus making
transportation and installation easier. The jointing on mild steel pipes can be achieved by on-site
welding, flanges, or mechanical joints
Figure 2.3: Steel penstocks
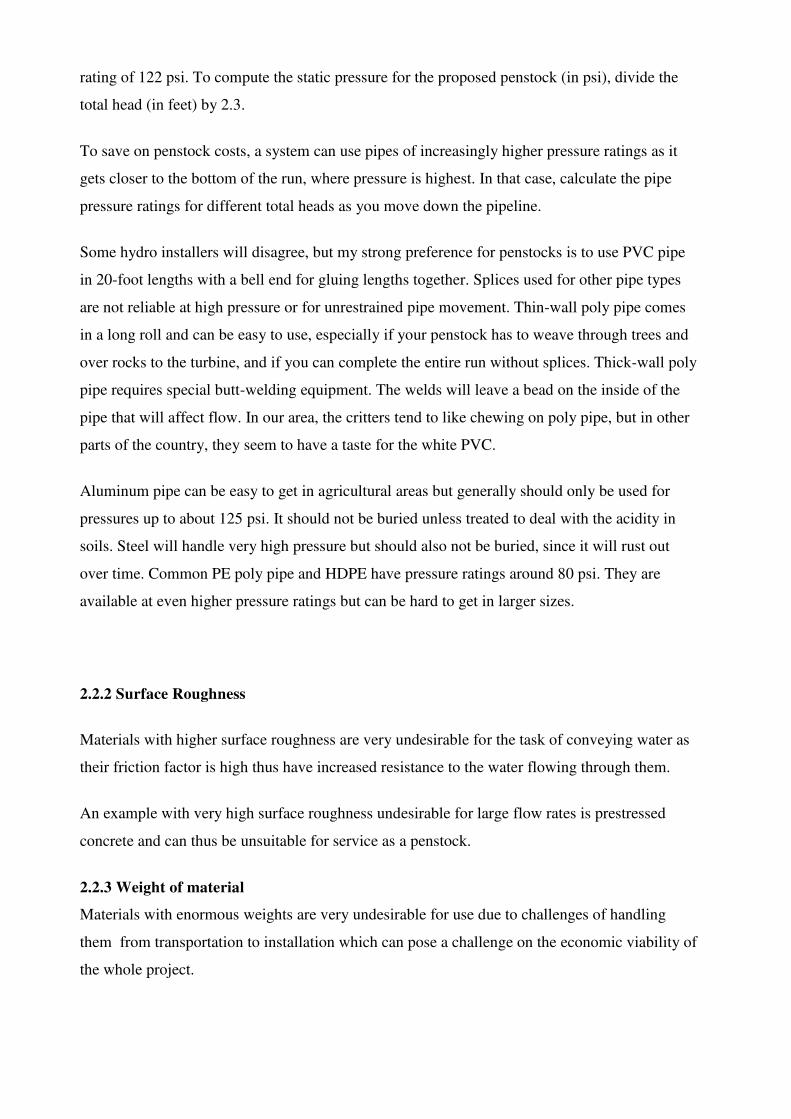
2.1.4 UUPVC (Unplasticised polyvinyl chloride
UPVC is a commonly used penstock material. It has low friction loss and a high resistance to
corrosion. UPVC is available in a large range of sizes and pressure ratings and the cost is
relatively low. Additionally, the material is lightweight, increasing the ease of transportation and
installation. However, UPVC is relatively fragile and susceptible to mechanical damage from
impacts, particularly at low temperatures. Further, UPVC will deteriorate when exposed to
ultraviolet light; the sun exposure will cause surface cracking, which in turn, will have a
significant consequence on the pressure rating of the pipe. As such, the pipe must always have
protection from direct sunlight by burying, covering with foliage, wrapping, or painting. UPVC
also requires continuous support along the length of the penstock due to its high vulnerability to
stress fatigue. If the UPVC is allowed to bend, there will be an introduction of internal forces
against the wall of the pipe; further, vibrations induced by water flow can be enough to cause a
stress fatigue failure after only about 5 to 10 years of operation. Because of this, it is
recommended that UPVC pipe be run along the ground or preferably buried. UPVC pipe
segments can be joined using spigot and socket with UPVC pipe cement or using spigot and
socket with a flexible sealing ring.
Figure 2.4: uPVC penstock
2.2 Factors to be considered when selecting material
2.2.1 Design Pressure
Almost any type of pipe will work as a penstock, at least to some degree. The most common
types are white polyvinyl chloride (PVC) and “poly pipe” (black polyethylene, PE; or high-
density polyethylene, HDPE), which come in several pressure ratings. Common drainpipe is
thin-walled and not rated for pressure. Though it can accommodate up to about 30 feet of head if
you are careful opening and closing valves, drainpipe is not normally a recommended choice.
In selecting pipe with the correct pressure rating, be sure to allow an extra 40% above the static
water pressure in the pipe. For example, with 66 m of head, the static pressure is about 87
pounds per square inch (psi). Multiply that by 1.4 (140%) to reach the needed pipe pressure
rating of 122 psi. To compute the static pressure for the proposed penstock (in psi), divide the
total head (in feet) by 2.3.
To save on penstock costs, a system can use pipes of increasingly higher pressure ratings as it
gets closer to the bottom of the run, where pressure is highest. In that case, calculate the pipe
pressure ratings for different total heads as you move down the pipeline.
Some hydro installers will disagree, but my strong preference for penstocks is to use PVC pipe
in 20-foot lengths with a bell end for gluing lengths together. Splices used for other pipe types
are not reliable at high pressure or for unrestrained pipe movement. Thin-wall poly pipe comes
in a long roll and can be easy to use, especially if your penstock has to weave through trees and
over rocks to the turbine, and if you can complete the entire run without splices. Thick-wall poly
pipe requires special butt-welding equipment. The welds will leave a bead on the inside of the
pipe that will affect flow. In our area, the critters tend to like chewing on poly pipe, but in other
parts of the country, they seem to have a taste for the white PVC.
Aluminum pipe can be easy to get in agricultural areas but generally should only be used for
pressures up to about 125 psi. It should not be buried unless treated to deal with the acidity in
soils. Steel will handle very high pressure but should also not be buried, since it will rust out
over time. Common PE poly pipe and HDPE have pressure ratings around 80 psi. They are
available at even higher pressure ratings but can be hard to get in larger sizes.
2.2.2 Surface Roughness
Materials with higher surface roughness are very undesirable for the task of conveying water as
their friction factor is high thus have increased resistance to the water flowing through them.
An example with very high surface roughness undesirable for large flow rates is prestressed
concrete and can thus be unsuitable for service as a penstock.
2.2.3 Weight of material
Materials with enormous weights are very undesirable for use due to challenges of handling
them from transportation to installation which can pose a challenge on the economic viability of
the whole project.
2.2.4 Ease of transportation
The material to be used for a penstock must provide ease of transport to the installation site as
area of manufacture to the site could be miles away thus relatively light and posses a a smaller
diameter while performing the same expected function.
Materials such as upvc are most suitable as they are light as well as easy to join compared to
materials like prestressed concrete.
2.2.5Method of jointing
Pipes are generally supplied in standard lengths and have to be joined together on site. There are
several ways of doing this and the following factors should be considered when choosing the
best joint system for a particular scheme:
suitability for chosen pipe material,
skill level of personnel installing the pipe,
whether any degree of joint flexibility is required,
relatively costs,
ease of installation.
Methods of pipe jointing fall roughly into four categories:
flanged,
spigot and socket,
mechanical,
welded.
2.2.6 Cost of material
This is the most fundamental factor to consider in the whole selection process because as
explained above the penstock cost comprises close to 40% of the hydro plant cost thus decisive
selection of the most reasonably priced material that can still perform as optimally as expected is
of invaluable essence.
2.3 Determination of penstock dimensions and losses
2.3.1 darcy-weischbach method
The flow of liquid through a pipe is resisted by viscous shear stresses within the liquid and the
turbulence that occurs along the internal walls of the pipe, created by the roughness of the pipe
material. This resistance is usually known as pipe friction and is measured is feet or metres

head of the fluid, thus the term head loss is also used to express the resistance to flow.
Many factors affect the head loss in pipes, the viscosity of the fluid being handled, the size of
the pipes, the roughness of the internal surface of the pipes, the changes in elevations within
the system and the length of travel of the fluid.
The resistance through various valves and fittings will also contribute to the overall head loss. A
method to model the resistances for valves and fittings is described elsewhere. In a well designed
system the resistance through valves and fittings will be of minor significance to the overall head
loss, many designers choose to ignore the head loss for valves and fittings at least in the initial
stages of a design.
The Darcy-Weisbach equation
Weisbach first proposed the equation we now know as the Darcy-Weisbach formula or Darcy-
Weisbach equation:
hf = f (L/D) x (v2/2g)
where:
hf = head loss
(m) f = friction
factor
L = length of pipe work (m)
d = inner diameter of pipe work
(m) v = velocity of fluid (m/s)
g = acceleration due to gravity
(m/s)
or:
hf = head loss
(ft) f = friction
factor
L = length of pipe work (ft)
d = inner diameter of pipe work
(ft) v = velocity of fluid (ft/s)
g = acceleration due to gravity
(m/� )
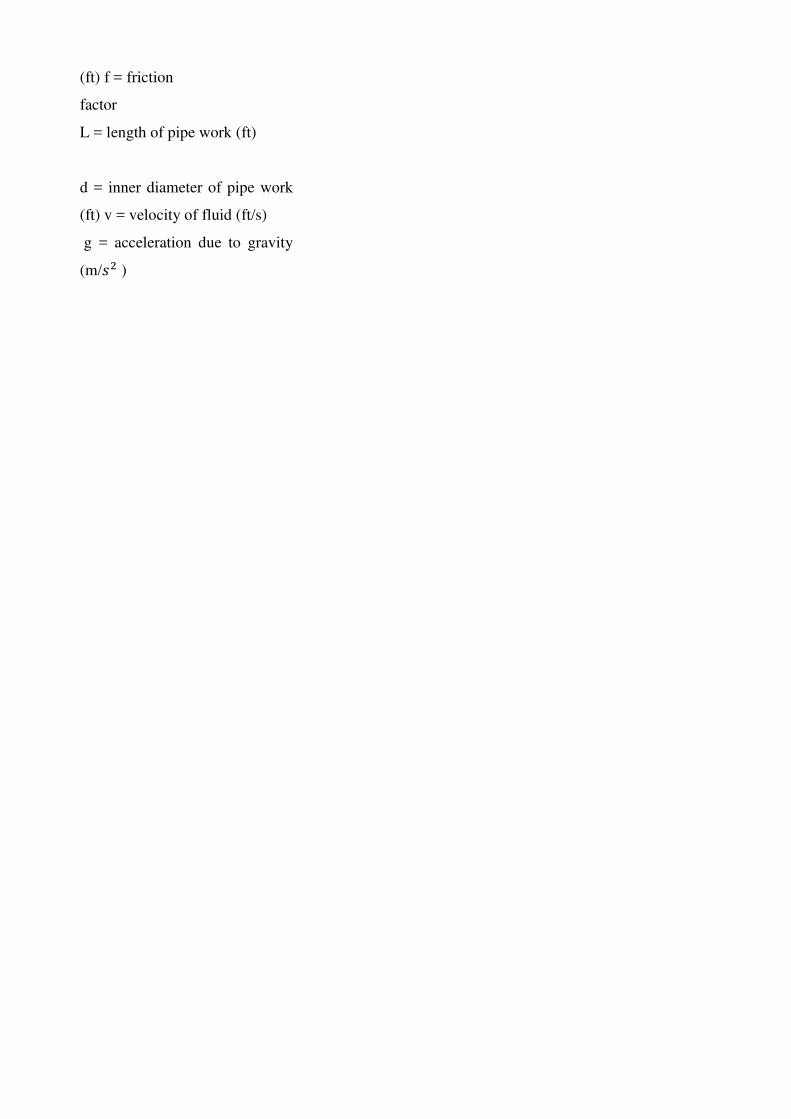
The friction factor is obtained from a moody diagram.
The Moody Chart or sometimes the Friction Factor Chart, enables a user to plot the
Reynolds number and the Relative Roughness of the pipe and to establish a reasonably
accurate value of the friction factor for turbulent flow conditions.
The Moody Chart encourages the use of the Darcy-Weisbach friction factor and this is the
method of choice for hydraulic engineers.
Figure 2.5: Moody diagram
2.3.2 Hazen william method
The Darcy-Weisbach equation can be difficult to use because the friction factor was difficult
to estimate. In 1906, Hazen and Williams provided an empirical formula that was easy to use.
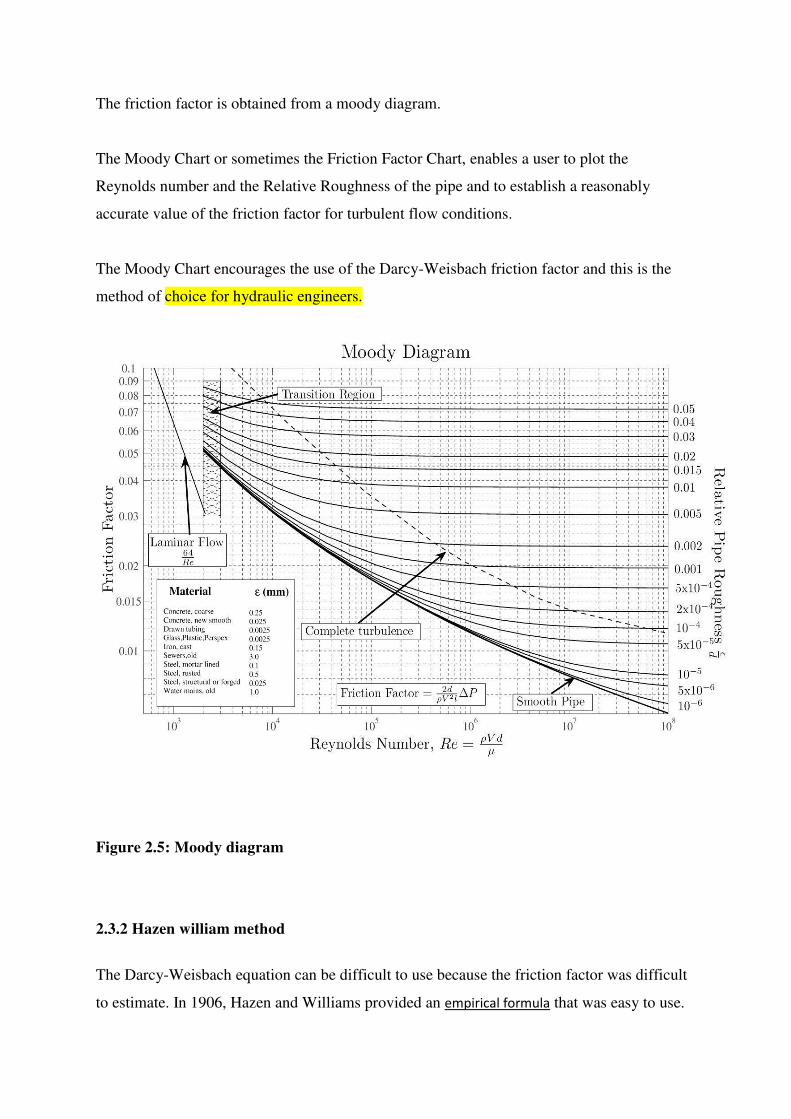
The general form of the equation relates the mean velocity of water in a pipe with the
geometric properties of the pipe and slope of the energy line.
where:
V is velocity
k is a conversion factor for the unit system (k = 0.849 for SI units)
C is a roughness coefficient
R is the hydraulic radius
S is the slope of the energy line (head loss per length of pipe or hf/L)
The conversion factor k was chosen so that the values for C were the same as in the Chézy
formula for the typical hydraulic slope of S=0.001.The value of k is 0.001
−0.04
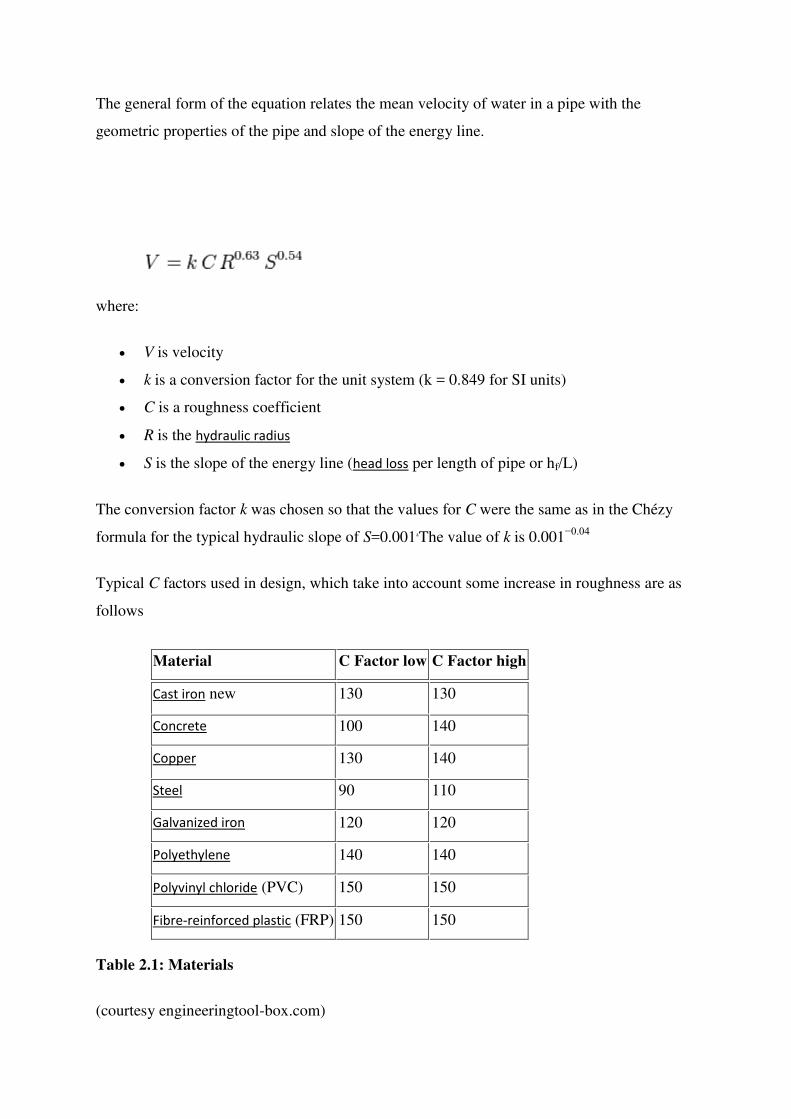
Typical C factors used in design, which take into account some increase in roughness are as
follows
Material C Factor low C Factor high
Cast iron new 130 130
Concrete 100 140
Copper 130 140
Steel 90 110
Galvanized iron 120 120
Polyethylene 140 140
Polyvinyl chloride (PVC) 150 150
Fibre-reinforced plastic (FRP) 150 150
Table 2.1: Materials
(courtesy engineeringtool-box.com)
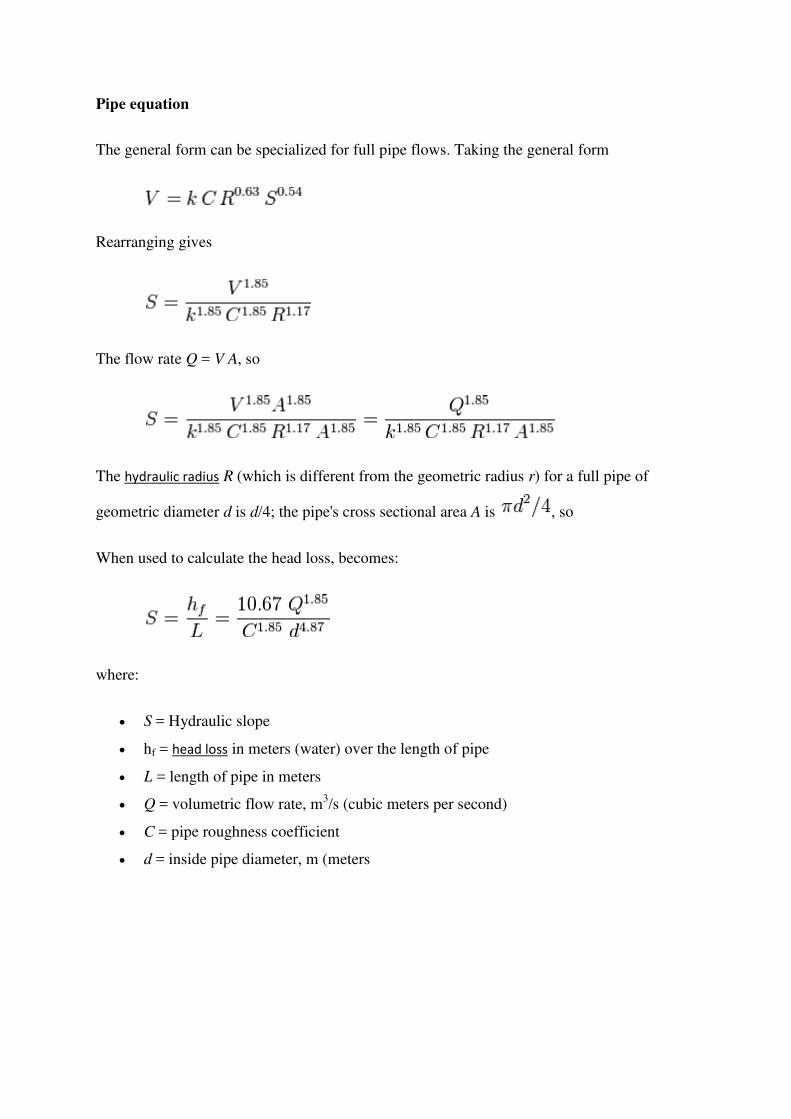
Pipe equation
The general form can be specialized for full pipe flows. Taking the general form
Rearranging gives
The flow rate Q = V A, so
The hydraulic radius R (which is different from the geometric radius r) for a full pipe of
geometric diameter d is d/4; the pipe's cross sectional area A is , so
When used to calculate the head loss, becomes:
where:
S = Hydraulic slope
hf = head loss in meters (water) over the length of pipe
L = length of pipe in meters
Q = volumetric flow rate, m3/s (cubic meters per second)
C = pipe roughness coefficient
d = inside pipe diameter, m (meters

CHAPTER 3: EXISTING PENSTOCK OF KENGEN SAGANA PLANT
In this chapter, the specifications of the existing penstock at sagana micro hydro plant are discussed in
detail.
Sagana micro hydro power plant is owned by KENGEN limited and was commissioned in 1957.
The plant has a capacity of 1.5MW at full load. It has three Francis turbines. Each turbine is supplied
by a 0.5 m diameter 648m long ductile iron penstock.
All the available specifications for the penstock are given below and a schematic of it drawn below.
3.1 specifications.
i) Available head
ii) available flow rate
iii) Length of pipeline
iv) material of penstock
v) diameter of penstock
Total Head
available ,H
Flow Rate
Q
Length of
penstock, L
Material of
penstock, M
Power output,
P
Penstock
diameter,
D
37.5 m 25.4� /s 648 m Ductile iron 500 KW 0.5 m
(source: Kengen Kenya, Sagana plant)

Table 3.1: Plant Specifications
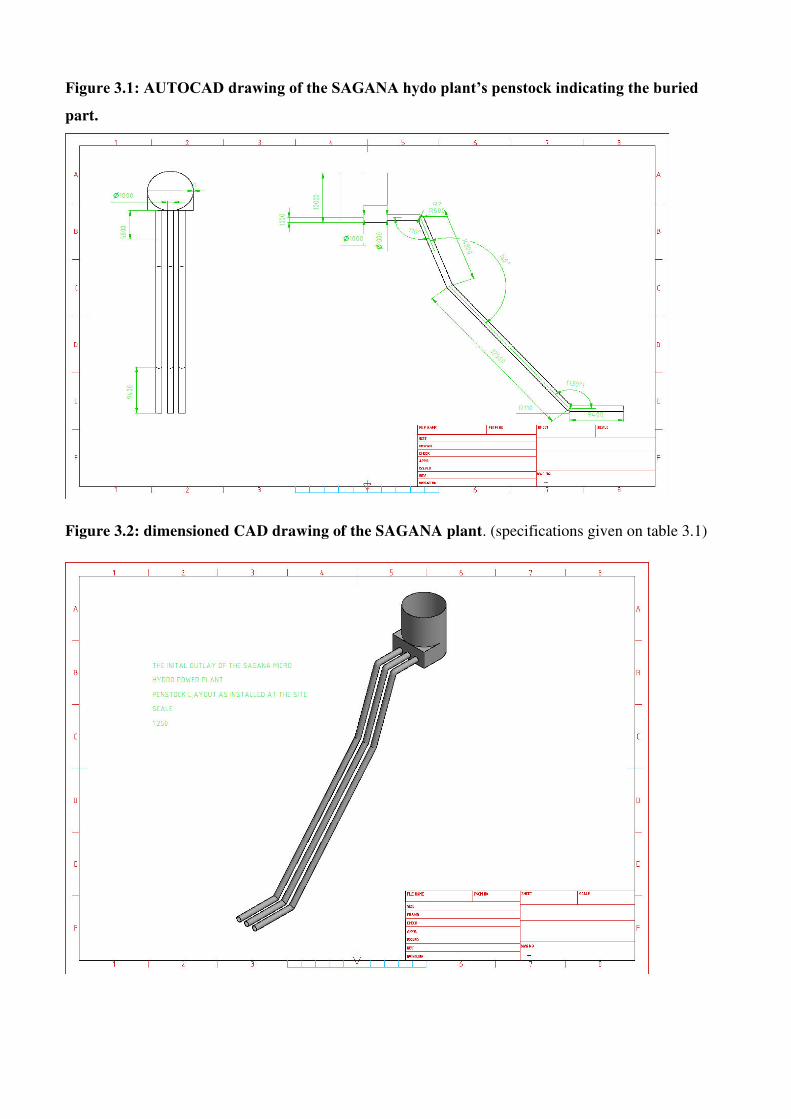
Figure 3.1: AUTOCAD drawing of the SAGANA hydo plant’s penstock indicating the buried
part.
Figure 3.2: dimensioned CAD drawing of the SAGANA plant. (specifications given on table 3.1)
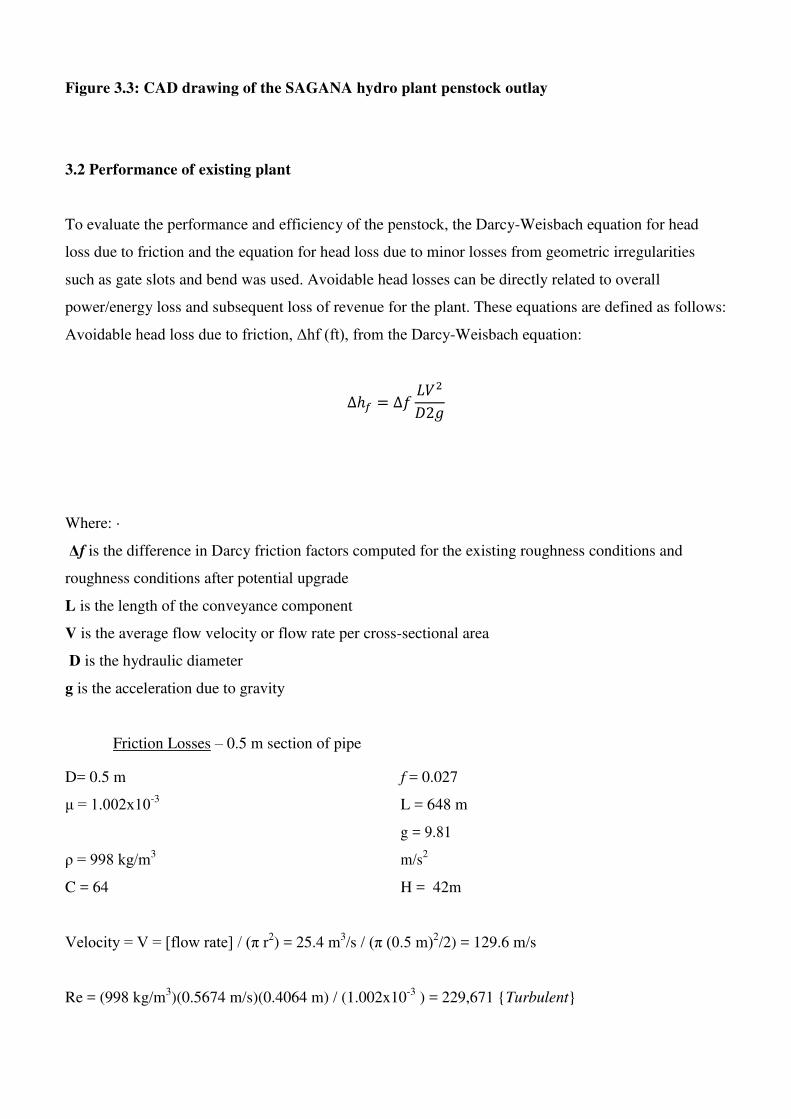
Figure 3.3: CAD drawing of the SAGANA hydro plant penstock outlay
3.2 Performance of existing plant
To evaluate the performance and efficiency of the penstock, the Darcy-Weisbach equation for head
loss due to friction and the equation for head loss due to minor losses from geometric irregularities
such as gate slots and bend was used. Avoidable head losses can be directly related to overall
power/energy loss and subsequent loss of revenue for the plant. These equations are defined as follows:
Avoidable head loss due to friction, Δhf (ft), from the Darcy-Weisbach equation:
∆ℎ = ∆ �
Where: ·
Δf is the difference in Darcy friction factors computed for the existing roughness conditions and
roughness conditions after potential upgrade
L is the length of the conveyance component
V is the average flow velocity or flow rate per cross-sectional area
D is the hydraulic diameter
g is the acceleration due to gravity
Friction Losses – 0.5 m section of pipe
D= 0.5 m f = 0.027
μ = 1.002x10⁻³ L = 648 m
ρ = 998 kg/m3
g = 9.81
m/s2
C = 64 H = 42m
Velocity = V = [flow rate] / (π r2) = 25.4 m
3/s / (π (0.5 m)2
/2) = 129.6 m/s
Re = (998 kg/m3)(0.5674 m/s)(0.4064 m) / (1.002x10
-3 ) = 229,671 {Turbulent}
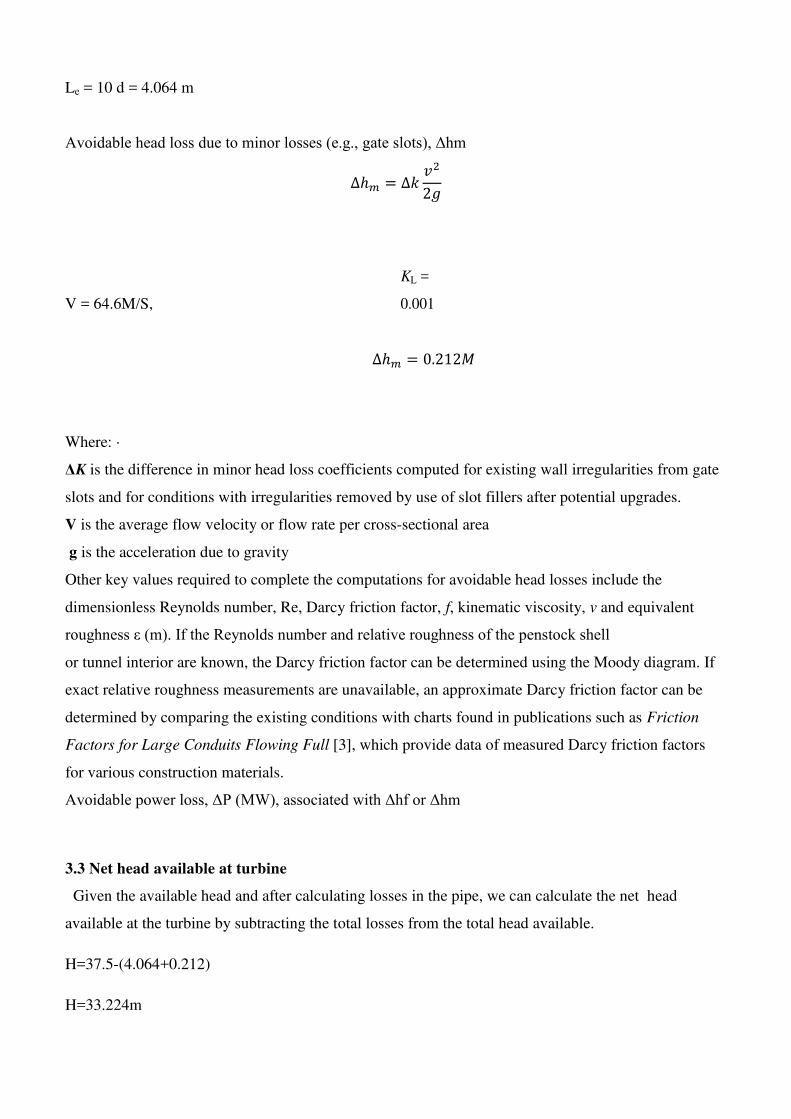
Le = 10 d = 4.064 m
Avoidable head loss due to minor losses (e.g., gate slots), Δhm ∆ℎ = ∆� �
V = 64.6M/S,
KL =
0.001
∆ℎ = .
Where: ·
ΔK is the difference in minor head loss coefficients computed for existing wall irregularities from gate
slots and for conditions with irregularities removed by use of slot fillers after potential upgrades.
V is the average flow velocity or flow rate per cross-sectional area
g is the acceleration due to gravity
Other key values required to complete the computations for avoidable head losses include the
dimensionless Reynolds number, Re, Darcy friction factor, f, kinematic viscosity, v and equivalent
roughness ε (m). If the Reynolds number and relative roughness of the penstock shell
or tunnel interior are known, the Darcy friction factor can be determined using the Moody diagram. If
exact relative roughness measurements are unavailable, an approximate Darcy friction factor can be
determined by comparing the existing conditions with charts found in publications such as Friction
Factors for Large Conduits Flowing Full [3], which provide data of measured Darcy friction factors
for various construction materials.
Avoidable power loss, ΔP (MW), associated with Δhf or Δhm
3.3 Net head available at turbine
Given the available head and after calculating losses in the pipe, we can calculate the net head
available at the turbine by subtracting the total losses from the total head available.
H=37.5-(4.064+0.212)
H=33.224m

Its evident from above that major losses are incurred. Mostly courtesy of the frictional losses resulting
from a high roughness factor of ductile iron.
3.4 Determining the plant efficiency
From the formulae: = ��g
Given all the parameters in table 3.1 above , we can calculate for efficiency by making it the subject,
� = �
� . � . � .
� = . %
3.5 Percentage head loss
This is an expression of the percentage head loss from frictional factors and minor losses of the gross
head .This is so as to express the how desirable or undesirable the material used is.
%�� = � X100
%�� = . . X100
=11.4%
This is an indication that the material currently in use is very inefficient due to a high percentage head
loss as a desirable material should have a percentage head loss of less than 8%.
3.6 Penstock efficiency
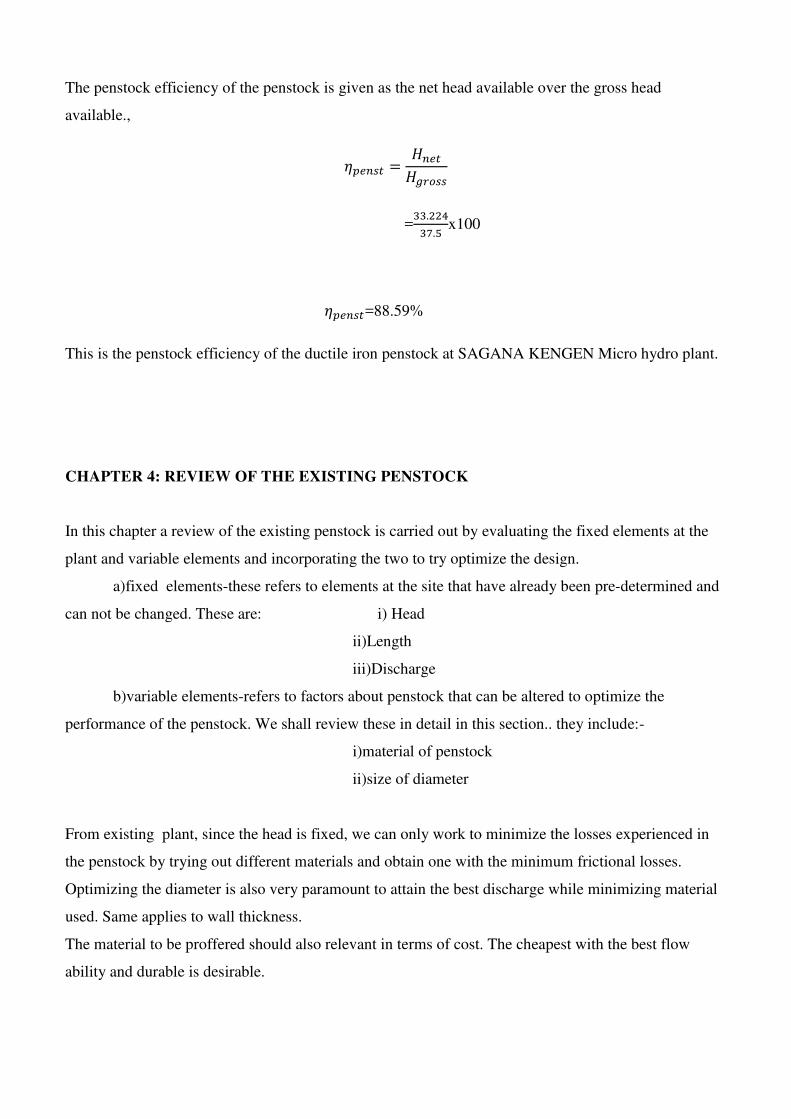
The penstock efficiency of the penstock is given as the net head available over the gross head
available.,
� = ��
=. . x100
� =88.59%
This is the penstock efficiency of the ductile iron penstock at SAGANA KENGEN Micro hydro plant.
CHAPTER 4: REVIEW OF THE EXISTING PENSTOCK
In this chapter a review of the existing penstock is carried out by evaluating the fixed elements at the
plant and variable elements and incorporating the two to try optimize the design.
a)fixed elements-these refers to elements at the site that have already been pre-determined and
can not be changed. These are: i) Head
ii)Length
iii)Discharge
b)variable elements-refers to factors about penstock that can be altered to optimize the
performance of the penstock. We shall review these in detail in this section.. they include:-
i)material of penstock
ii)size of diameter
From existing plant, since the head is fixed, we can only work to minimize the losses experienced in
the penstock by trying out different materials and obtain one with the minimum frictional losses.
Optimizing the diameter is also very paramount to attain the best discharge while minimizing material
used. Same applies to wall thickness.
The material to be proffered should also relevant in terms of cost. The cheapest with the best flow
ability and durable is desirable.
Using the given fixed parameters about the plant, we shall try with steel and upvc as prestressed
concrete was already eliminated due to unnecessary bulkiness, to try realise one with most minimum
head loss and optimum diameter for purposes of best efficiency and cost effectiveness.
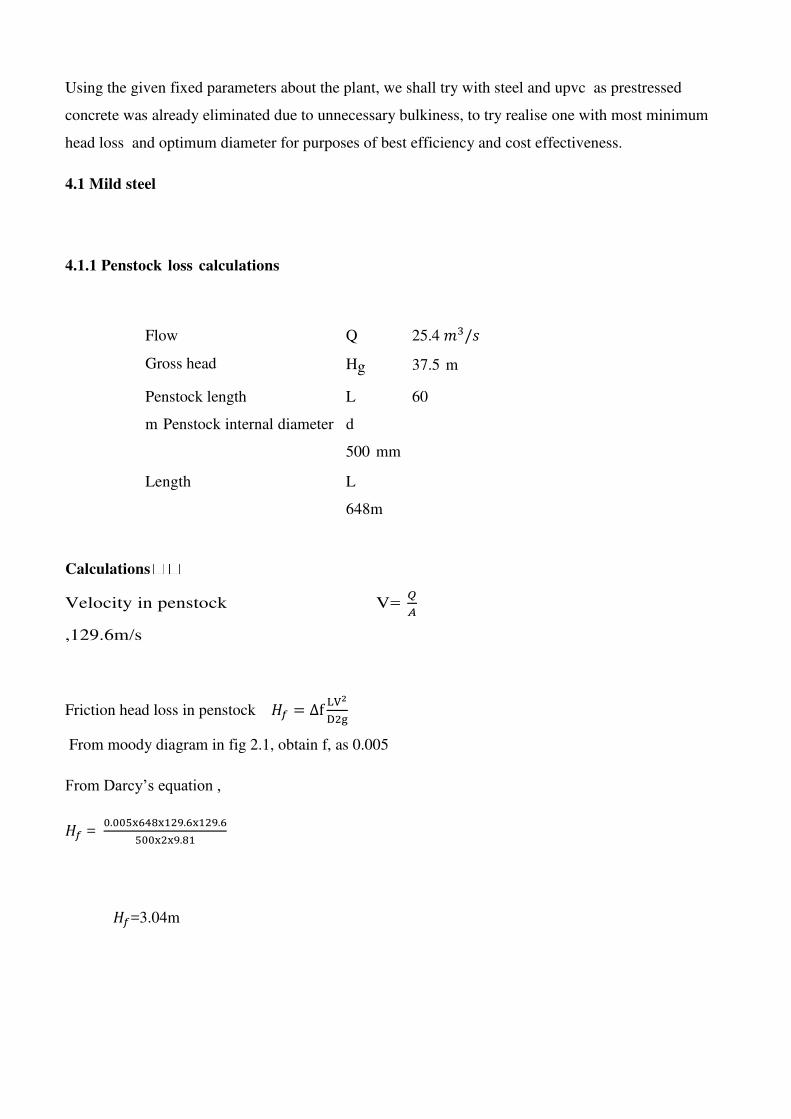
4.1 Mild steel
4.1.1 Penstock loss calculations
Flow Q 25.4 � /�
Gross head Hg 37.5 m
Penstock length L 60
m Penstock internal diameter d
500 mm
Length L
648m
Calculations
Velocity in penstock V= �
,129.6m/s
Friction head loss in penstock � = ∆f LV2D g
From moody diagram in fig 2.1, obtain f, as 0.005
From Darcy’s equation ,
� = . x x . x .x x .
� =3.04m
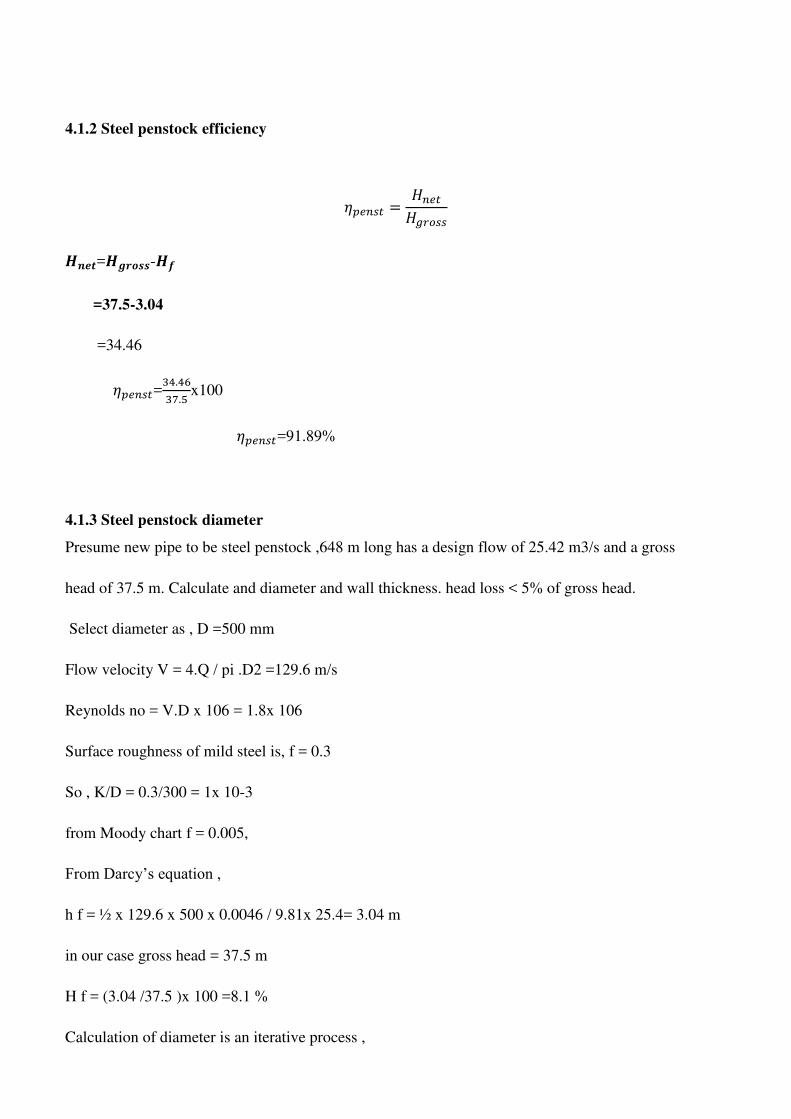
4.1.2 Steel penstock efficiency
� = ��
� =� -�
=37.5-3.04
=34.46
� =. . x100
� =91.89%
4.1.3 Steel penstock diameter
Presume new pipe to be steel penstock ,648 m long has a design flow of 25.42 m3/s and a gross
head of 37.5 m. Calculate and diameter and wall thickness. head loss < 5% of gross head.
Select diameter as , D =500 mm
Flow velocity V = 4.Q / pi .D2 =129.6 m/s
Reynolds no = V.D x 106 = 1.8x 10⁶
Surface roughness of mild steel is, f = 0.3
So , K/D = 0.3/300 = 1x 10⁻³
from Moody chart f = 0.005,
From Darcy’s equation ,
h f = ½ x 129.6 x 500 x 0.0046 / 9.81x 25.4= 3.04 m
in our case gross head = 37.5 m
H f = (3.04 /37.5 )x 100 =8.1 %
Calculation of diameter is an iterative process ,
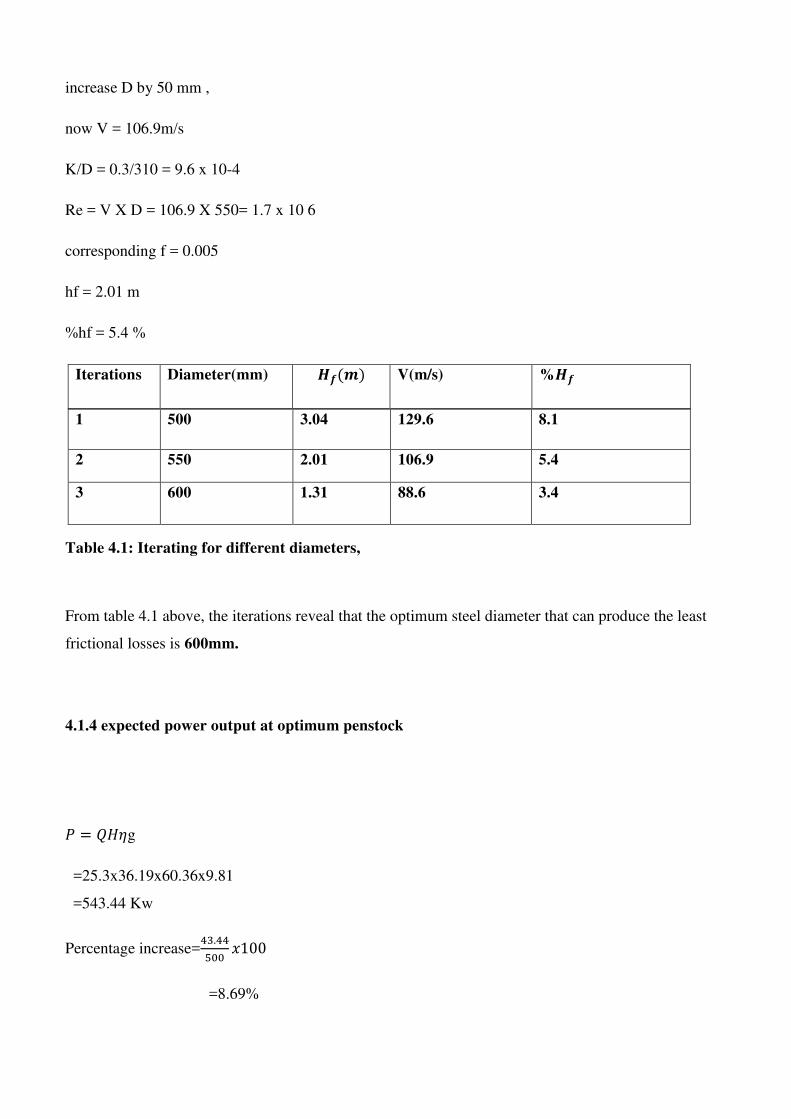
increase D by 50 mm ,
now V = 106.9m/s
K/D = 0.3/310 = 9.6 x 10⁻⁴
Re = V X D = 106.9 X 550= 1.7 x 10 6
corresponding f = 0.005
hf = 2.01 m
%hf = 5.4 %
Iterations Diameter(mm) � V(m/s) %�
1 500 3.04 129.6 8.1
2 550 2.01 106.9 5.4
3 600 1.31 88.6 3.4
Table 4.1: Iterating for different diameters,
From table 4.1 above, the iterations reveal that the optimum steel diameter that can produce the least
frictional losses is 600mm.
4.1.4 expected power output at optimum penstock
= ��g
=25.3x36.19x60.36x9.81
=543.44 Kw
Percentage increase=. �
=8.69%

4.2uPVC
4.2.1 PENSTOCK LOSS CALCULATIONS
Flow Q 25.4 � /�
Gross head Hg 37.5 m
Penstock length L 648m
Penstock internal diameter,d 500 mm
Calculations
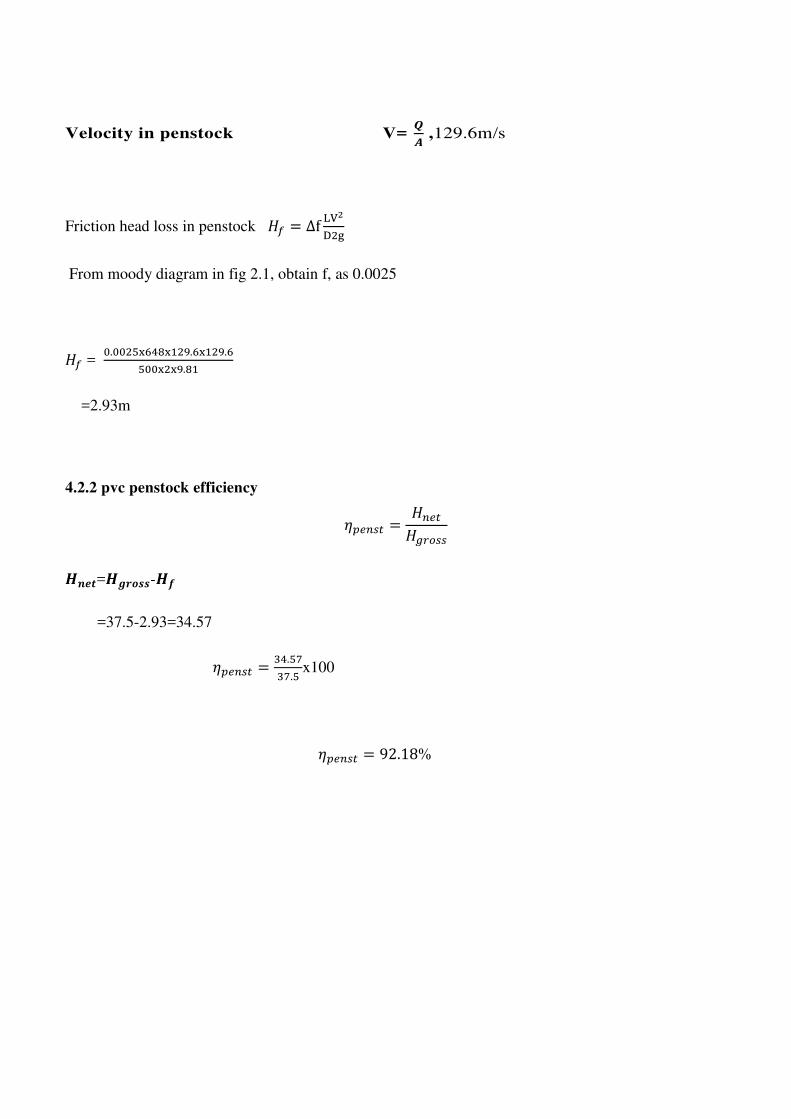
Velocity in penstock V= �� ,129.6m/s
Friction head loss in penstock � = ∆f LV2D g
From moody diagram in fig 2.1, obtain f, as 0.0025
� = . x x . x .x x .
=2.93m
4.2.2 pvc penstock efficiency � = ��
� =� -�
=37.5-2.93=34.57
� = . . x100
� = . %
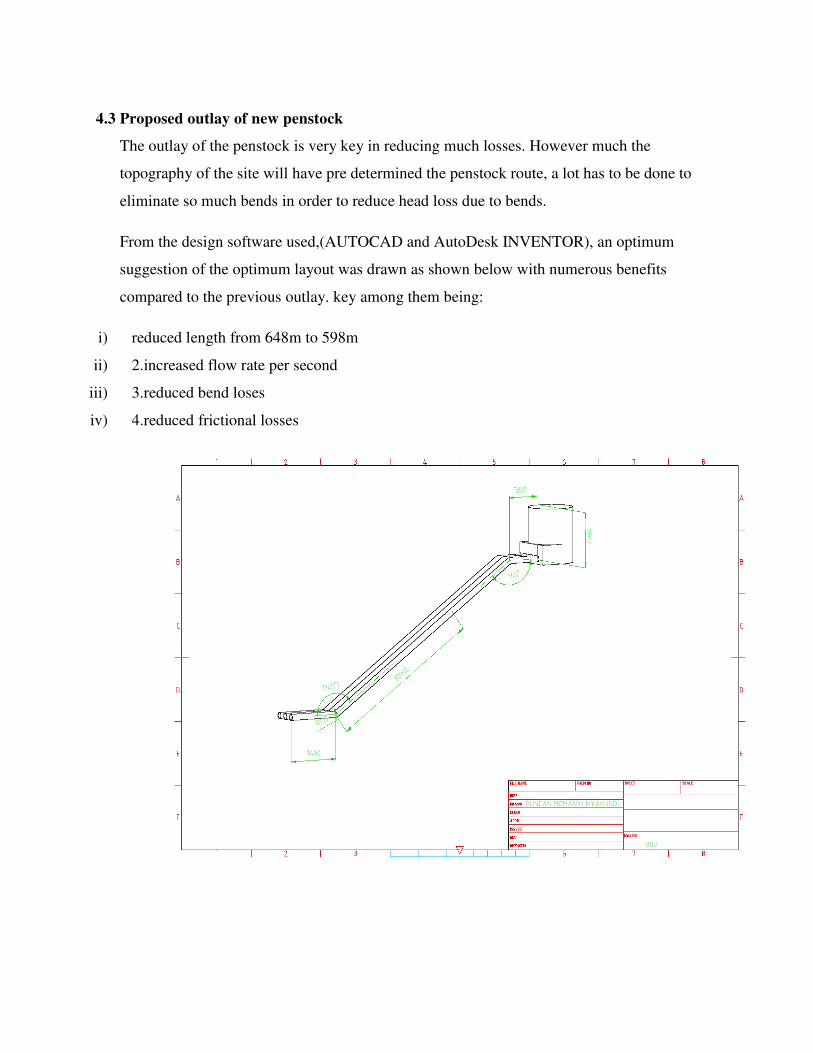
4.3 Proposed outlay of new penstock
The outlay of the penstock is very key in reducing much losses. However much the
topography of the site will have pre determined the penstock route, a lot has to be done to
eliminate so much bends in order to reduce head loss due to bends.
From the design software used,(AUTOCAD and AutoDesk INVENTOR), an optimum
suggestion of the optimum layout was drawn as shown below with numerous benefits
compared to the previous outlay. key among them being:
i) reduced length from 648m to 598m
ii) 2.increased flow rate per second
iii) 3.reduced bend loses
iv) 4.reduced frictional losses

Figure 4.1: AUTOCAD Proposed outlay of new penstock
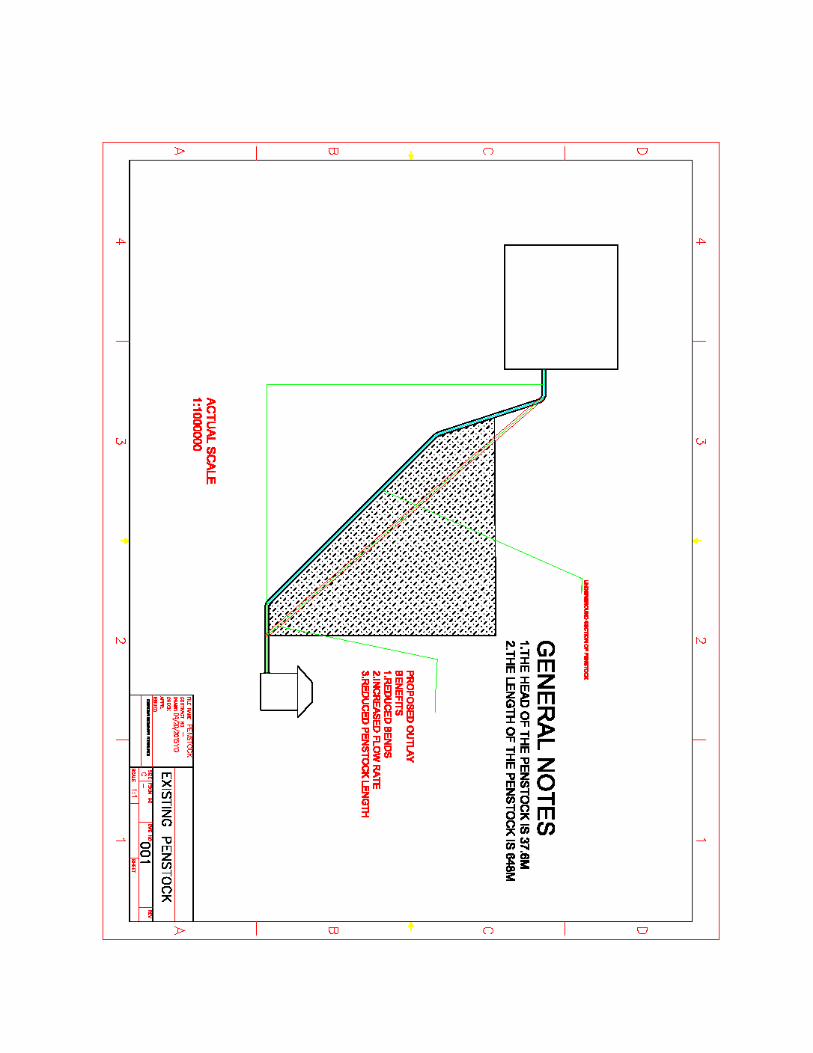
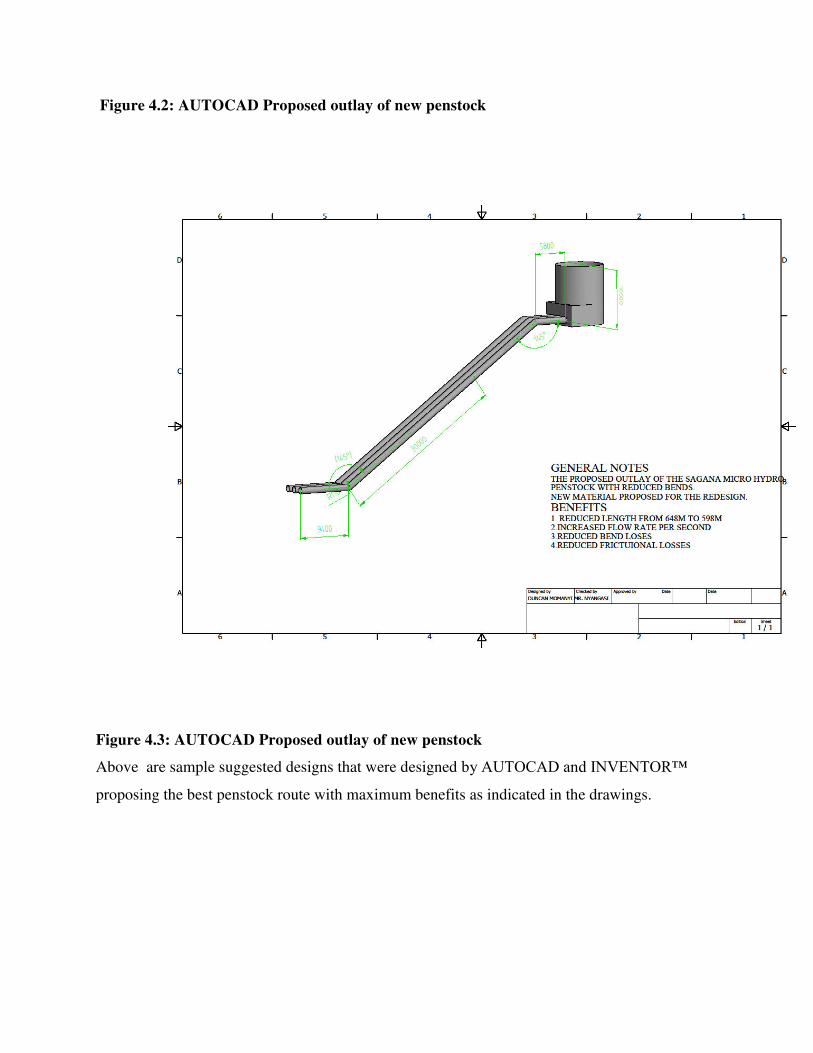
Figure 4.2: AUTOCAD Proposed outlay of new penstock
Figure 4.3: AUTOCAD Proposed outlay of new penstock
Above are sample suggested designs that were designed by AUTOCAD and INVENTOR™
proposing the best penstock route with maximum benefits as indicated in the drawings.

CHAPTER 5: CONCLUSION AND RECOMMENDATION
5.1 Conclusion
All three objectives addressed in this report were satisfied by the end of the project.
The total head losses resulting from the use of ductile iron as the penstock were calculated and
its subsequent efficiency determined then compared to that of steel and uPVC and it was noted
that ductile iron is not as efficient as both steel and uPVC.
Ultimately, the most optimal diameter of the steel penstock that has the least percentage of head
losses was determined by iterating from the initial diameter at the provided length.
Considering all the factors discussed in chapter two on factors to consider on selection of
penstock material, steel was settled on more so due to its ease of availability relative to uPVC
and durability as well as method of joining.
The optimal diameter of this steel proposed penstock was determined as 600mm.
At this optimum penstock, power is noted to have a very reasonable 8.7% increase and
considering a new material has been implemented with more efficiency than initial, its worth the
cost.
A CAD designed penstock layout was established as shown herein.
The route was accurately mapped, with consideration to both overall length and elevation
changes, using several different methods. Both Darcy-Weisbach and Hazen-Williams
correlations were used to predict friction head loss. Minor head loss was estimated via the minor
loss correlation.
From head loss and flow rate, available power could be estimated. Discrepancies between the
estimates produced by the two different friction head loss correlations were shown to be a result
of the differing sensitivity of each correlation to flow velocity. Sample calculations for available
power were used to clarify this point.
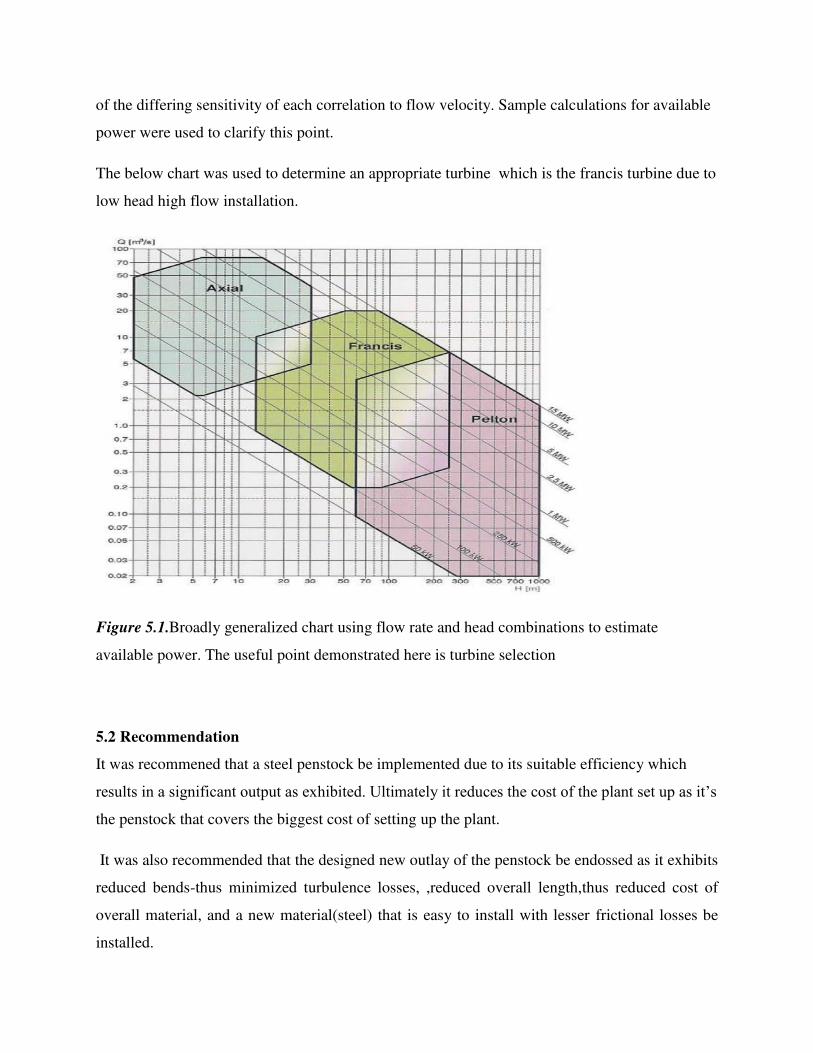
The below chart was used to determine an appropriate turbine which is the francis turbine due to
low head high flow installation.
Figure 5.1.Broadly generalized chart using flow rate and head combinations to estimate
available power. The useful point demonstrated here is turbine selection
5.2 Recommendation
It was recommened that a steel penstock be implemented due to its suitable efficiency which
results in a significant output as exhibited. Ultimately it reduces the cost of the plant set up as it’s
the penstock that covers the biggest cost of setting up the plant.
It was also recommended that the designed new outlay of the penstock be endossed as it exhibits
reduced bends-thus minimized turbulence losses, ,reduced overall length,thus reduced cost of
overall material, and a new material(steel) that is easy to install with lesser frictional losses be
installed.
The Francis turbine at the site can be retained as its relevance to deliver a higher out put at the
new elevation and increased flow rate is valid.
REFERENCES
“Design of Large Pipelines” by Herman Schorer, Transactions, 98:lOl. ASCE, 1933.
White, Frank. Fluid Mechanics. 7th. New York: McGraw-Hill, 2009. Print
“Welded Steel Penstocks” Engineering Monograph No. 3, U.S. Bureau of Reclamation, 1967.
“Welded Steel Penstock-Design and Construction” by P. J. Bier, Engineering Monograph No. 3,
U.S. Bureau of Reclamation, September 1960. (Revised 1966).
"Darcy-Weisbach Equation." Wikipedia. N.p., n.d. Web. 1 Jun 2012.
<http://en.wikipedia.org/wiki/Darcy–Weisbach_equation>
"Major Loss in Ducts." Engineering Toolbox. N.p., n.d. Web. 1 Jun 2012.
<http://www.engineeringtoolbox.com/major-loss-ducts-tubes-d_459.html>
KS0574:1997 Standard for Steel Water Pipe 6 In. and Larger
“Optimum Penstock Diameter in Hydro-Electric Plants” by Edward J. Low - Journal, Power
Division, ASCE Proceedings, July 1962
“Hydraulic Losses in Pipe Fittings” by D. Thoma, Transactions of the Munich Hydraulic
Institute, Bulletin No. 3.
