u.s. geological survey bulletin 1839-a-d · the price mountain fenster (fig. 3) exposes a doubly...
TRANSCRIPT

Horses in Fensters of the Pulaski Thrust Sheet, Southwestern Virginia: Structure, Kinematics, and Implications for Hydrocarbon Potential of the Eastern Overthrust Belt
Fluvial Deposition in the Central Appalachians During the Early Pennsylvanian
Disturbed Zones: Indicators of Subsurface Faults and Possible Hydrocarbon Traps in the Valley and Ridge and Appalachian Plateau Provinces of Pennsylvania, Maryland, Virginia, and West Virginia
Reevaluation of Conodont Color Alteration Patterns in Ordovician Rocks, East-Central Valley and Ridge and Western Blue Ridge Provinces, Tennessee
U.S. GEOLOGICAL SURVEY BULLETIN 1839-A-D


Horses in Fensters of the Pulaski Thrust Sheet, Southwestern Virginia: Structure, Kinematics, and Implications for Hydrocarbon Potential of the Eastern Overthrust Belt
By ARTHUR P. SCHULTZ
Fluvial Deposition in the Central Appalachians During the Early Pennsylvanian
By CHARLES L. RICE and JOSEPH F. SCHWIETERING
Disturbed Zones: Indicators of Subsurface Faults and Possible Hydrocarbon Traps in the Valley and Ridge and Appalachian Plateau Provinces of Pennsylvania, Maryland, Virginia, and West Virginia
By HOWARD A. POHN and TERRI L. PURDY
Reevaluation of Conodont Color Alteration Patterns in Ordovician Rocks, East-Central Valley and Ridge and Western Blue Ridge Provinces, Tennessee
By RANDALL C. ORNDORFF, ANITA G. HARRIS, and ARTHUR P. SCHULTZ
U.S. GEOLOGICAL SURVEY BULLETIN 1839-A-D
EVOLUTION OF SEDIMENTARY BASINS-APPALACHIAN BASIN
DEPARTMENT OF THE INTERIOR
DONALD PAUL MODEL, Secretary
U.S. GEOLOGICAL SURVEY
Dallas L. Peck, Director
UNITED STATES GOVERNMENT PRINTING OFFICE: 1988
For sale by the Books and Open-File Reports Section, U.S. Geological Survey, Federal Center, Box 25425, Denver, CO 80225
Library of Congress Cataloging in Publication Data
Schultz, Arthur P.Evolution of sedimentary basins Appalachian basin.
(U.S. Geological Survey bulletin ; 1839 A-D)Supt. of Docs. no. : I 19.3:1839A-DBibliography: p.1. Sedimentation and deposition. 2. Geology Appalachian Region. I.
Title. II. Series. QE75.B9 no. 1839A-D [QE571] 557.3 s 88-600224 [557.4]

Chapter A
Horses in Fensters of the Pulaski Thrust Sheet, Southwestern Virginia: Structure, Kinematics, and Implications for Hydrocarbon Potential of the Eastern Overthrust Belt
By ARTHUR P. SCHULTZ
A multidisciplinary approach to research studies of sedimentary rocks and their constituents and the evolution of sedimentary basins, both ancient and modern
U.S. GEOLOGICAL SURVEY BULLETIN 1839
EVOLUTION OF SEDIMENTARY BASINS-APPALACHIAN BASIN


CONTENTS
Abstract AlIntroduction AlGeologic setting A3Horses and fensters A3Implications for hydrocarbon potential A6Conclusions A7References cited A10
FIGURES
1,2. Maps showing:1. Major thrust faults of southern Appalachian Valley and Ridge province,
Kentucky, Tennessee, West Virginia, Virginia, and North Carolina Al2. Major thrust faults of southern Appalachian Valley and Ridge province,
horses of Pulaski thrust sheet, and distribution of Mississippian rocks discussed in report A2
3. Cross section A-A' showing major frontal tectonic ramp of Pulaski thrust sheet A2
4. Map showing western edge of Price Mountain fenster, including distribution of rooted Mississippian rocks and complexly deformed horses that lie below Cambrian rocks of Pulaski thrust sheet and above Mississippian rocks A4
5. Cross section Z-Z' showing structural relationships between Mississippian rocks exposed in Price Mountain fenster, horses around edge of fenster, and Cambrian rocks of base of Pulaski thrust sheet A5
6. Sketch of outcrop along edge of Price Mountain fenster A57. Photomicrographs of undeformed and cataclasized Silurian sandstones A58. Cumulative frequency diagram showing grain size of Silurian sandstones in
horses around Price Mountain fenster A69. Photomicrograph of dolomite microbreccia from Ordovician horse A6
10. Histograms showing stages of intracrystalline deformation of Silurian sand stones resulting from increased amounts of cataclastic deformation A6
11. Flinn diagram of lensoid double boudinage showing distribution of strain in thinly bedded Ordovician rocks that are horses of Pulaski thrust sheet A7
12. Structural plots for folds in thinly bedded Ordovician rocks in horses of Pulaski thrust sheet A7
13. Map showing horses exposed in fensters of Pulaski thrust sheet A814. Cross section X-X' showing structural relationships between Devonian and
Mississippian rocks of rooted footwall, horse duplexes, and Cambrian rocks of Pulaski thrust sheet A8
15. Sketch of outcrop section W-W showing overturned, faulted core of anti- form composed of Ordovician and Silurian rocks A9
16. Schematic drawings showing simple kinematic model for horse derivation at frontal tectonic ramp of thrust sheet A9
Contents III

17, 18.Maps showing:17. Location of geochemical samples and coal-bed methane test wells A1018. Thermal maturation level of rocks in study area based on conodont color
alteration values A12
TABLE
1. Results of Rock-Eval pyrolysis of potential source rocks of Devonian and Ordovican age, Pulaski thrust sheet, southwestern Virginia All
CONVERSION FACTORS FOR SOME SI METRIC AND U.S. UNITS OF MEASURE
To convert from To Multiply by
Feet (ft) Meters (m) 0.3048Miles (mi) Kilometers (km) 1.609Pounds (Ib) Kilograms (kg) .4536Degrees Fahrenheit (°F) Degrees Celsius (°C) Temp °C=(temp °F-32)/l.
IV Contents

EVOLUTION OF SEDIMENTARY BASINS-APPALACHIAN BASIN
Horses in Fensters of the Pulaski Thrust Sheet, Southwestern Virginia: Structure, Kinematics, and Implications for Hydrocarbon Potential of the Eastern Overthrust Belt
By Arthur P. Schultz
Abstract
Highly deformed rocks of Cambrian through Devo nian age are exposed in fensters of the Pulaski thrust sheet near the northern terminus of the southern Appalachian Valley and Ridge province. Detailed mapping of these outcrops shows a consistency of structural style namely, faulted antiformal synclines having duplex geometry. Examination of strain data and cross sections suggests that the fensters expose rootless tectonic slices, or horses. Structural analysis of the rocks shows that cataclasis was the dominant deformation mechanism in thickly bedded carbonate rocks and sandstones. By contrast, isoclinal folding, cleavage, and boudinage were the dominant mechanisms in thinly bedded shales, sandstones, and limestones. Both the amount of tectonic thinning and the intensity of strain in the horses are dependent on litho- tectonic units and the distance of transport from the root zone, which is perhaps a frontal tectonic ramp in the trailing part of the subjacent Saltville thrust sheet. Seismic studies indicate that this ramp is east of and below thrust sheets of the Valley and Ridge and western Blue Ridge provinces, an interpretation supported by structural stud ies of rocks in the fensters. Thermal maturation and geochemical data suggest that coal-bed methane in rocks of Mississippian age may exist below thermally overma ture thrust sheets of the eastern Valley and Ridge and western Blue Ridge provinces. Rocks of Ordovician and Devonian ages in this area may have been source rocks but do not contain hydrocarbons.
INTRODUCTION
Regional-scale seismic studies of the Eastern Over- thrust Belt have resulted in speculation about this frontier hydrocarbon province (Cook and others, 1979; Harris and Bayer, 1979; Milici and others, 1979; Harris and others, 1981, 1982). Hydrocarbon-bearing Paleozoic sedimentary
rocks probably extend from surface exposures in the Valley and Ridge province of the Appalachian foreland eastward below thrust sheets of metamorphic rocks of the Blue Ridge and Piedmont provinces, but the hydrocarbon potential of these sedimentary rocks is very poorly known because drilling is nonexistent in the area and fensters are few.
This report describes certain complex structures asso ciated with the Pulaski thrust sheet in southwestern Virginia (figs. 1, 2). These structures are tectonic slices or horses, many of which are exposed in fensters, and they have been termed "windows of dislodged slices" or schurflingsfensters (Tollman, 1968; Boyer and Elliot, 1982; Schultz and Anders, 1985). The tectonic rootless slices of sedimentary rocks of Cambrian through Devonian age are interpreted to have been derived from below the easternmost exposed rocks of the Valley and Ridge province and perhaps from below rocks of the Blue Ridge province.
Acknowledgments. The author thanks Donald E. Anders of the U.S. Geological Survey (USGS) for geochem ical analyses, Anita G. Harris and Randall Orndorff
/ West Virginia
100 KILOMETERS
Figure 1. Major thrust faults of southern Appalachian Valley and Ridge province, Kentucky, Tennessee, West Virginia, Virginia, and North Carolina. Location of study area (fig. 2) also shown.
Manuscript approved for publication, 5/16/88 Horses in Fensters of Pulaski Thrust Sheet, Southwestern Virginia A1

81W 80°00'
37°30' -
37°00' -
APPALACHIAN PLATEAU PROVINCE
A
\':'-\ Mississippian rocks
EXPLANATION
^fc Horse Thrust faultdashed where location uncertain
Figure 2. Major thrust faults of southern Appalachian Valley and Ridge province, horses of Pulaski thrust sheet, and distribution of Mississippian rocks discussed in report. Line of section A-A' (fig. 3) and locations of areas of figures 4 and 13 also shown. Modified from Bartholomew and others (1982).
APPALACHIAN PLATEAU PROVINCE
VALLEY AND RIDGE PROVINCE BLUE RIDGE PROVINCE
PRICE MOUNTAINFENSTER
Horse I
Middle Cambrian through Mississippian rocks on Pulaski frontal ramp
10 KILOMETERS
Horse derived from Pulaski frontal ramp
NO VERTICAL EXAGGERATION
EXPLANATION
I'--. M ?.| Mississippian rocks
| PS | Silurian and Devonian rocks
| O | Lower Cambrian Rome Formation through Ordovician rocks
| L | Lower Cambrian rocks
|L /p<3 Precambrian and Lower Cambrian rocks
| p | Precambrian rocks
Thrust fault arrow showing sense of movement; dashed where inferred
Figure 3. Cross section A-A' showing major frontal tectonic ramp of Pulaski thrust sheet, the proposed source of horses exposed in fensters. Modified from Gresko (1985) and Woodward (1985).
A2 Evolution of Sedimentary Basins Appalachian Basin

(USGS) for unpublished conodont data, and C. Scott Southworth (USGS), Robert C. McDowell (USGS), and Judith W. Stoeser (MESU Associates) for manuscript reviews.
GEOLOGIC SETTING
The Pulaski thrust fault (fig. 1) is one of several major, southeast-dipping thrust faults of the central and southern Valley and Ridge province and has been traced along strike for approximately 500 km (Cooper, 1970; Rodgers, 1970) from a terminus in central Virginia south- westward into Tennessee, where it is overridden by rocks of the Blue Ridge thrust sheet. Estimates of the displacement of the Pulaski thrust near the study area range from 15 (Cooper, 1970) to 50 km (Bartholomew, 1979). Near Pulaski, Va., the preserved thickness of the Pulaski thrust sheet is about 1,500 m, and the decollement of the Pulaski thrust is within shales and dolomites of the Lower Cambrian Rome Formation (fig. 3) and the Middle and Upper Cam brian Elbrook Formation. Rocks of Mississippian age are in the footwall of the Pulaski thrust sheet along its leading edge, in the Price Mountain fenster, and in the core of the Salem synclinorium (fig. 3).
Unique to the Pulaski thrust are thick, broken forma tions near the base of the thrust sheet (Cooper, 1970; Bartholomew and Lowry, 1979; Schultz, 1983), the unusual and widespread Max Meadows tectonic breccia (Cooper, 1970), and, in an area from near Pulaski to Roanoke, Va., a series of fensters and horses (fig. 2) (Butts, 1933, 1940; Cooper, 1939; Marshall, 1959; Bartholomew and Lowry, 1979; Schultz, 1979a, b; Bartholomew, 1981; Henika, 1981; Decker and others, 1985). Except for the Price Mountain fenster, the fensters expose thin, rootless tectonic slices or horses. Horses are also exposed along the leading edge of the Pulaski fault. Detailed structural and strain analysis (Schultz, 1979a,b, 1981) shows that defor mation style and intensity in these horses are in striking contrast to those in footwall rocks below the Pulaski thrust sheet. Rocks of the horses are some of the most highly strained in the Appalachian Valley and Ridge province (Schultz, 1979a, b, 1981).
HORSES AND FENSTERS
The Price Mountain fenster (fig. 3) exposes a doubly plunging, fault-modified anticline of Mississippian rocks below Cambrian rocks of the Pulaski thrust sheet. Drilling of this structure (Bartholomew and Lowry, 1979; Stanley and Schultz, 1983) (fig. 3) shows a continuous, 3,000-m- thick section of rocks ranging from Middle Ordovician to Lower Mississippian in age. Stratigraphic thickening in the Ordovician and Devonian shales has been attributed to minor faulting within these Stratigraphic sections (Harris
and Milici, 1977). Structural interpretations based on seis mic data (Gresko, 1985) collected across the Price Moun tain anticline place basement rocks at a depth of 7,000 m, a depth consistent with projected thicknesses of rocks of Late Cambrian through Middle Ordovician age below available drill-hole data (Bartholomew and Lowry, 1979). The Price Mountain sequence is part of the Saltville thrust sheet (Bartholomew and Lowry, 1979; Gresko, 1985) (figs. 2, 3).
Complexly deformed horses ranging in age from Late Ordovician to Middle Devonian are located along the Pulaski fault between Cambrian rocks of the hanging wall and Mississippian rocks of the footwall. Many of these horses are exposed along the leading edge of the thrust and in fensters in the Pulaski and Roanoke areas (fig. 2). Horses along the southwestern edge of the Price Mountain fenster are discontinuous, faulted lensoid rock masses having duplex geometry (Schultz, 1979a, b) in which folded Cambrian rocks of the Pulaski thrust sheet form the roof thrust (figs. 4, 5). Irregular fault contacts separate individ ual horses in the duplexes, and much of the original Stratigraphic sequence is missing. Inverted Stratigraphic sequences predominate (Schultz, 1979a, b). Mesoscopic deformation in the horses increases in intensity with trans port distance (Schultz, 1981). The smaller horses consist of Ordovician dolomite and Silurian sandstone clasts sup ported in a matrix of Ordovician and Devonian shales and siltstones (fig. 6). The more competent sandstone clasts of the fault zone have been internally deformed by a pervasive mesoscopic and microscopic brittle fracture or cataclasis, such that the original sedimentary fabric of the rock is obliterated (fig. 7). Cataclasis of transported sandstone clasts resulted in an extremely poorly sorted fabric of angular grains that have little to no preferred long-axis orientation and reduced mean grain size (Schultz, 1979a, b) (fig. 8). Cataclasis in Ordovician dolomite clasts (fig. 9) disrupted the original crystalline fabric and produced micro- breccias. Intracrystalline deformation of the cataclastic rocks is minor and is similar to that of rocks away from the fault zone (fig. 10).
Penetrative, tectonically induced, mesoscopic melangelike deformation fabrics are in horses consisting of thinly bedded, alternating sequences of Ordovician and Devonian shales, sandstones, and limestones. These defor mation fabrics consist of isolated, fractured, and flattened inclusions of more competent rock in a cleaved matrix of less competent shale. The melangelike inclusions are len soid double boudinage and are 1 cm to 3 m long. In all cases, the boudin and matrix are of the same Stratigraphic formation. Variably oriented extension fractures in the boudin suggest that the bedding from which the boudin were derived was extended in several directions. This conclusion is consistent with strain data (fig. 11), which show that tectonic flattening was the dominant deformation mechanism during formation of the melangelike fabric in the horses. The sequence in fabric development consists of
Horses in Fensters of Pulaski Thrust Sheet, Southwestern Virginia A3

80°30'
EXPLANATION
I M I Mississippian rocks
I D | Devonian rocks
I S I Silurian rocks
I UP | Upper Ordovician rocks
| MO | Middle Ordovician rocks
I LO I Lower Ordovician rocks
|::':.y.'-.1 Middle Cambrian rocks of Pulaski thrust sheet
^ Pulaski roof thrust, sawteeth on upper plateA Pulaski floor thrust, sawteeth on
upper plate Faulted horse contact, hachures
on upper blockThrust fault sawteeth on
upper plate
Location of outcrop ' .'. '.' ;' ': section V" ---"
A- PULASKI : ; ; v: THRUST :;; :
Strike and dip of beds '.:'££&: :$. '-vr ^iV^-'-^'X-JI
Strike and dip of overturned beds '-^:- ://-:.V- :^V: A':^V-:'{:V-:.: :V':Vji>37°10'
^PULASKI THRUST SHEET %£&£*
Figure 4. Western edge of Price Mountain fenster, including distribution of rooted Mississippian rocks and complexly deformed horses that lie below Cambrian rocks of Pulaski thrust sheet and above Mississippian rocks. Line of section Z-Z' (fig. 5) and location of outcrop section Y-Y' (solid circle) (fig. 6) also shown.
rotation (fig. 12), followed by transposition of early iso- clinally folded rocks and formation of penetrative cleavage (Schultz, 1981). The southeasternmost fensters of the Pulaski thrust sheet in the Price Mountain area (fig. 3) expose rocks of similar structural complexity characterized by rootless and fault-bounded, stratigraphically attenuated slices (figs. 13, 14). In this area, lithologic variations are minimal, and the individual slices that compose the horses are more internally coherent; that is, mesoscopic deforma tion is limited to mesoscopic brittle faults (fig. 15).
Cross sections (figs. 3, 5, 14) drawn on the basis of existing drill-hole data and thickness constraints and avail able seismic interpretations (Stanley and Schultz, 1983; Gresko, 1985) suggest that rocks of Middle Cambrian
through Devonian age in fensters in the study area lie structurally above a footwall of rocks of Mississippian age. This footwall may be continuous in the subsurface with southeast-dipping rocks on the southeastern limb of the Price Mountain anticline (figs. 3, 5). Interpretations of all other fensters of the Pulaski thrust sheet (Cooper, 1939; Marshall, 1959; Bartholomew, 1981;Henika, 1981; Decker and others, 1985) (fig. 2) are similar to those described near Pulaski (Schultz, 1979a, b). In all cases, highly deformed, rootless slices of stratigraphically older rocks are thought to lie above relatively less deformed younger footwalls.
A simple kinematic model for the origin and emplace ment of horses (fig. 16) involves the interaction of an overriding thrust sheet with a subthrust syncline on or near a
A4 Evolution of Sedimentary Basins Appalachian Basin

PRICE MOUNTAIN FENSTER
Horse duplex in schurflingsfenster
PULASKI ROOF THRUST
SW
^PULASKI FLOOR THRUST
Mississippian rock
EXPLANATION p | Devonian rocks
| S | Silurian rocks
| UQ | Upper Ordovician rocks
I MO | Middle Ordovidan rocks
fr.':':':'-] Middle Cambrian rocks of Pulaski thrust sheet
' T- ̂ Bedding surface showing facing direction
NO VERTICAL EXAGGERATION
Thrust fault, arrow showing sense of movement; dashed where inferred
Figure 5. Cross section Z-Z' showing structural relationships between Mississippian rocks exposed in Price Mountain fenster, horses around edge of fenster, and Cambrian rocks of base of Pulaski thrust sheet. Horses below ground surface shown schematically.
H- Horse duplex
NE PRICEY MOUNTAIN-| FENSTER /PULASKI FLOOR
N. / THRUST
PULASKI ROOF THRUST
EXPLANATION
Mississippian rocks Cj~ I Upper Ordovician rocks. showing cleavage
tHZ-EJrr] Devonian rocks [^J=J Lower Ordovician rocks
|-' ' ' I Silurian rocks l^yy'-! Cambrian rocks
_ *- _ Thrust fault, arrow showing sense of movement; dashed where inferred
0 10 METERS
NO VERTICAL EXAGGERATION
Figure 6. Outcrop along edge of Price Mountain fenster (line of section Y-Y', fig. 4) showing relatively small horse duplex between Mississippian rocks of Price Mountain fenster and Cambrian rocks of Pulaski sheet. Rocks in duplex have undergone substantial amount of tectonic mixing and deformation during transport from their root zone. Drawn from photograph presented by Schultz (1979a).
Figure 7. Photomicrographs of Silurian sandstones. A, Quartzite believed to be similar to undeformed protolith of cataclasites in horses of Pulaski thrust sheet. Sample collected on Saltville thrust sheet (fig. 2), about 10 km northwest of outcrop sketched in figure 6. B, Well-developed cataclastic fabric in Silurian sandstone from a horse of Pulaski thrust sheet. Development of poorly sorted fabric and angular grains indicates complete disruption of original sedimentary fabric. Sample collected at outcrop location Y-Y' (figs. 4, 6).
Horses in Fensters of Pulaski Thrust Sheet, Southwestern Virginia A5

99r
95ZHIU CC 85UJ°- 70
UJ
p
6 12 25 50 100 200
GRAIN SIZE, IN MICRONS
400
Figure 8. Cumulative frequency diagram showing grain size of Silurian sandstones in horses around Price Moun tain fenster. Each curve based on 300 measurements of longest diameter of grains observed in thin section. Curves A, B, and C are based on counts from three mutually perpendicular thin sections of the same cata- clastically deformed sandstone and indicate little or no preferred orientation of grains, an expected result of cataclasis. Curve 1 for undeformed sandstone shown in figure 7A. Method from Engelder (1974)
tectonic frontal ramp. The first stage of horse development is footwall imbrication in a subthrust synclinal hinge and (or) in either the overturned limb or the normal limb of the syncline. The location of footwall thrusts determines the eventual facing of the horses. Detachment of the pieces (horse) from the footwall and their transport up the frontal ramp onto a decollement complete the early stages of horse development. Subsequent transport of the horses along the upper level decollement intensifies internal deformation fabrics and thins and tectonically mixes stratigraphic units.
10CH
UNDULOSE
EXTINCTION
A B
STRAIN RECOVERY
RECRYSTALLIZED GRAINS 35-,
30-
25-
20-
10-
DEFORMATION BANDS
AND (OR) LAMELLAE
z 10-
5-
\\\Y \\\Y
\\\\ \\\\ \\\\\\\\
SILURIAN SANDSTONES
A Undeformed rocks northwest of thrust belt
B Protocataclasites of the Pulaski decollement
C Cataclasites of the Pulaski decollement
D Ultracataclasites of the Pulaski decollement
E jjj
Figure 10. Histograms showing stages of intracrystalline deformation of Silurian sandstones resulting from increased amounts of cataclastic deformation. Percentage of detrital grains showing deformation is used as measure of deformation; 300 grains observed in each group of sandstones. Histograms show that no appreciable change occurred in amount of intracrystalline deformation as cataclasis intensified. Classification of stages of deforma tion from Sibson (1977).
Figure 9. Photomicrograph of dolomite microbreccia from Ordovician horse. Angular fragments of dolomite have been plucked from the original crystalline fabric along cataclastic shears. Collected at outcrop location Y-Y' (figs. 4, 6).
IMPLICATIONS FOR HYDROCARBON POTENTIAL
The kinematic model for the evolution of horses in fensters of the Pulaski thrust sheet has important implica tions for hydrocarbon potential. If rocks of Devonian and (or) Mississippian age are below rocks in the fensters, they may also extend below the easternmost exposed Pulaski and Max Meadows thrust sheets of the Valley and Ridge province and perhaps below the westernmost part of the Blue Ridge province (fig. 3). This interpretation agrees well with regional seismic interpretations near this area that postulate undeformed foreland Paleozoic sedimentary rocks to the east of and below Precambrian metamorphic rocks of the Blue Ridge province (Milici and others, 1979; Harris and others, 1982).
In the study area, coals of Mississippian age below the Pulaski thrust sheet have proven coal-bed methane
A6 Evolution of Sedimentary Basins Appalachian Basin

k=x UNIAXIAL CIGARS
1+e, 1+e3
k=-b-1
1<ks» CONSTRICTED
ELLIPSOIDS
1>k>0 FLATTENED ELLIPSOIDS
_l k=0 UNIAXIAL 4 PANCAKES
=b (n = 100)
Figure 11. Flinn diagram of lensoid double boudinage showing distribution of strain in thinly bedded Ordovician rocks that are horses of Pulaski thrust sheet in area of study. Seventy-three percent of boudin fall within flat tened ellipsoid field of diagram, e-,, e2 , and e3/ axes of principal extensions; a, ratio of elongations in e-, and e2 directions; b, ratio of elongations in e2 and e3 directions; k, slope of line defining strain types. Method from Cowan (1978).
potential (Stanley and Schultz, 1983). If rootless horses in the fensters southeast of the Price Mountain fenster overlie Mississippian rocks in the footwall. as the model presented herein suggests, then the area of coal-bed methane potential can be increased and may extend below the metamorphic rocks of the Blue Ridge province (fig. 3).
Results of Rock-Eval pyrolysis (fig. 17, table 1) of samples from Ordovician and Devonian horses of the Pulaski thrust sheet suggest that these rocks may have been potential source rocks of hydrocarbons. For a rock to be considered a potential source rock, the total organic carbon value must exceed 0.5 to 1.0 percent carbon (Tissot and Welte, 1984); 10 of the samples tested contain enough carbon to qualify. Hydrocarbon-generating capacity (or genetic potential) is expressed as the total hydrocarbon content (HC = SI + S2) (table 1), and rocks containing more than 6 mg HC per gram of rock are considered to have good resource potential (Tissot and Welte, 1984). None of the samples analyzed, however, had a total hydrocarbon content above this value. Thermal maturation of the rocks, as measured by conodont color alteration index (CAI), is slightly higher (CAI 4) (fig. 18) than that of Mississippian coals in the Price Mountain fenster (CAI 3.5) (fig. 18) but is well within the upper limits of the dry gas window (Tissot and Welte, 1984). If coal-bearing Mississippian rocks extend to the east below thermally overmature thrust sheets (fig. 3), a viable coal-bed methane potential may exist below these rocks.
DIP OF AXIAL SURFACE, IN DEGREES
.90 80 60 _____30_____10
Figure 12. Structural plots for folds in thinly bedded Ordovician rocks in horses of Pulaski thrust sheet. A, Schmidt equal-area stereographic plot of pole to axial surface (solid circles) and fold axes (solid squares) in thinly bedded Ordovician rocks in horses of Pulaski thrust sheet. Variability of orientation reflects rotation of folds during formation of melangelike deformation fabric. Number of observations n=34. B, Fleuty diagram for folds in A shows that a wide range of fold styles is characteristic of melangelike deformation in horses. Method after Fleuty (1964).
CONCLUSIONS
Fensters of the Pulaski thrust sheet in southwestern Virginia expose both rooted and rootless rocks. A simple kinematic model for the formation of horses in these fensters involves detachment and transport of thrust slices from footwall subthrust synclines. These subthrust syn- clines developed in a footwall composed of rocks of
Horses in Fensters of Pulaski Thrust Sheet, Southwestern Virginia A7

37°05' -
EXPLANATION
Devonian rocks
Silurian rocks
Upper Ordivician rocks
Middle Ordovician rocks
Lower Ordovician rocks
Upper Cambrian rocks
Middle Cambrian rocks ofPulaski thrust sheet
Pulaski fault, sawteeth onupper plate
Fault between horses.hachures on upper block
Strike and dip of bedding
Strike and dip of overturnedbedding
Syncline
Anticline
Antiform showing plunge
Figure 13. Horses exposed in fensters of Pulaski thrust sheet. Note juxtaposition of horses within each duplex along thrust faults contained within fensters. Location of map shown in figure 2; lines of section X-X' (fig. 14) and VV-VV' (fig. 15) also shown.
PULASKI ROOF THRUST
EXPLANATION
| M | Mississippian rocks £
I D | Devonian rocks
| S | Silurian rocks
| UP | Upper Ordovician rocks
| MO | Middle Ordovician rocks
| LO | Lower Ordovician rocks
| U | Upper Cambrian rocks
|MCj Middle Cambrian rock
0 1 KILOMETER
NO VERTICAL EXAGGERATIONfn^T] Middle Cambrian rocks of k* Pulaski thrust sheet
- !_ Bedding surface showing facing direction
__^. Thrust fault arrow showing sense of movement; dashed where inferred
Contact
Figure 14. Cross section X-X' showing structural relationships between Devonian and Mississippian rocks of rooted footwall, horse duplexes, and Cambrian rocks of Pulaski thrust sheet. Line of section shown on figure 13.
A8 Evolution of Sedimentary Basins Appalachian Basin

NW SE
IV'
25 METERS
NO VERTICAL EXAGGERATION
Road level
[ | Middle Silurian rocks
|-i: .';./V;| Lower Silurian rocks
r^d Upper Ordovician rocks
^^ Fault, arrow shows **^ relative movement
Figure 15. Sketch of outcrop section VV-VV showing overturned, faulted core of antiform composed of Ordovician and Silurian rocks. Antiform is part of larger horse complex shown in figures 13 and 14. Line of section shown in figure 13.
WFlattening, stretching, and tectonic thinning
of horse during transport along decollement
Present-day erosion surface
STAGE THREE
Detachment and transport of horse off ramp and onto decollement; anticlinal folding of overriding sheet
STAGE TWO
Footwall imbrication on the frontal thrust ramp in core of subthrust syncline
STAGE ONE
Figure 16. Simple kinematic model for horse derivation at frontal tectonic ramp of thrust sheet.
Horses in Fensters of Pulaski Thrust Sheet, Southwestern Virginia A9

37°30'
37°00'
STOP'_____________ I
APPALACHIAN PLATEAU
PROVINCE
SOW
c > VALLEY
AND '"' RIDGE
.' PROVINCE
West Virginia
20 KILOMETERS I
EXPLANATION
0 Geochemical sample locality; nunr her refers to table 1.Circled number indicates sample has source-rock potential
- t Thrust fault; dashed where location uncertain
^B Horse
[' .V'.'.'^l Mississippian rocks
Figure 17. Location of geochemical samples and coal-bed methane test wells (Stanley and Schultz, 1983). Geochemical data for samples shown in table 1.
Cambrian through Mississippian age on the frontal tectonic ramp of the Pulaski thrust. This frontal ramp may extend eastward below the Blue Ridge province. This interpreta tion agrees well with regional-scale models for the evolu tion of the Eastern Overthrust Belt derived from seismic studies. Studies of the thermal maturity of horses in fensters in the Pulaski thrust sheet seem to indicate that rocks of similar age below thrust sheets of the Valley and Ridge and Blue Ridge provinces probably are in the upper part of the dry gas window. In addition, methane in Mississippian coals extending into this frontier hydrocarbon province may have an economic potential. Hydrocarbons probably are not in Ordovician and Devonian source rocks but may be elsewhere in this structurally complex area and may have been derived from the Ordovician and Devonian black shales.
REFERENCES CITED
Bartholomew, M.J., 1979, Thrusting component of shortening and a model for thrust fault development at the central southern Appalachian junction [abs.]: Geological Society of America Abstracts with Programs, v. 11, p. 384-385.
1981, Geology of the Roanoke and Stewartsville quadran gles, Va.: Virginia Division of Mineral Resources Publica tion 34, 23 p.
Bartholomew, M.J., and Lowry, W.D., 1979, Geology of the Blacksburg quadrangle, Va.: Virginia Division of Mineral Resources Publication 14, 1 sheet, scale 1:24,000.
Bartholomew, M.J., Schultz, A.P., Henika, W.S., and Gathright, T.M., II, 1982, Geology of the Blue Ridge and Valley and Ridge at the junction of the central and southern Appala chians, in Lyttle, P.T., ed., Central Appalachian geology: Falls Church, Va., American Geological Institute, p. 121-170.
Boyer, S.E., and Elliott, D., 1982, Thrust systems: American Association of Petroleum Geologists Bulletin, v. 66, no. 9, p. 1196-1230.
Butts, C., 1933, Geologic map of the Appalachian Valley of Virginia: Virginia Geological Survey Bulletin 42, 56 p.
1940, Geology of the Appalachian Valley in Virginia, pt. I: Virginia Geological Survey Bulletin 52, 568 p.
Campbell, M.R., 1925, The Valley coal fields of Virginia: Virginia Geological Survey Bulletin 25, 300 p.
Cook, F.A., Albaugh, D.S., Brown, L.D., Oliver, I.E., and Hatcher, R.D., Jr., 1979, Thin-skinned tectonics in the crystalline southern Appalachians; COCORP seismic- reflection profiling of the Blue Ridge and Piedmont: Geol ogy, v. 7, no. 12, p. 563-567.
Cooper, B.N., 1939, Geology of the Draper Mountain area, Va.: Virginia Geological Survey Bulletin 55, 98 p.
A10 Evolution of Sedimentary Basins Appalachian Basin

Table 1. Results of Rock-Eval pyrolysis of potential source rocks of Devonian and Ordovician age, Pulaski thrust sheet, southwestern Virginia
Total organic Free hydrocarbons PyrolyzedSample carbon S1 1 hydrocarbons S22number (in percent) (mg/g of rock) (mg/g of rock)
Devonian black shales
6................ 2.59 0.0114............... 1.37 .0117............... 2.12 .0218............... 2.59 .0124............... 1.01 0 ___
Ordovican black and gray shales
2................ 0.22 03................ .18 04A .............. .15 .014B .............. .23 05................ .26 07................ .13 011............... 1.27 .0213A ............. .31 .0113B ............. .11 015............... .26 019A ............. .38 .0219B ............. .24 .0320A ............. .78 .Ql20B ............. .43 .0220C ............. .06 .0121A ............. .70 .0221B ............. 1.04 .0322A ............. .68 .0422B ............. .36 .0223............... .14 .01
0.16 .05 .07 .03 .02
.02
.03
0
.04
.02) .02
).01 .02 .11 .04 .12
SI, Quantity of organic matter existing in rock as free or adsorbed hydrocarbons.
S2, Quantity of hydrocarbons.
1970, The Max Meadows breccias; a reply, in Fisher, G.W., and others, eds., Studies of Appalachian geology, central and southern: New York, Wiley-Interscience, p. 179-191.
Cowan, D.S., 1978, Origin of blueschist-bearing chaotic rocks in the Franciscan Complex, San Simeon, Calif.: Geological Society of America Bulletin, v. 89, no. 9, p. 1415-1423.
Decker, E.W., Campbell, K.D., Waller, E.B., Orndorff, R.C., and Venkatakrishnan, R., 1985, Structures between thrust sheets, Glade Creek Window, Va. [abs.]: Geological Society of America Abstracts with Program, v. 17, no. 2, p. 87.
Engelder, J.T., 1974, Cataclasis and the generation of fault gouge: Geological Society of America Bulletin, v. 85, no. 10, p. 1515-1522.
Epstein, A.G., Epstein, J.B., and Harris, L.D., 1977, Conodont color alteration; an index to organic metamorphism: U.S. Geological Survey Professional Paper 995, 27 p.
Fleuty, M.J., 1964, The description of folds: Geological Associ ation Proceedings, v. 75, p. 461-492.
Gresko, M.J., 1985, Analysis and interpretation of compressional (P-wave) and shear (5/f-wave) reflection seismic and geo
logic data over the Bane dome, Giles County, Va.: Blacks- burg, Va., Virginia Polytechnic Institute, unpublished M.Sci. thesis, 74 p.
Harris, L.D., and Bayer, K.C., 1979, Sequential development of the Appalachian orogen above a master decollement; a hypothesis: Geology, v. 7, no. 12, p. 568-572.
Harris, L.D., and Milici, R.C., 1977, Characteristics of thin- skinned style of deformation in the southern Appalachians, and potential hydrocarbon traps: U.S. Geological Survey Professional Paper 1018, 40 p.
Harris, L.D., Harris, A.G., deWitt, W., Jr., and Bayer, K.C., 1981, Evaluation of southern Eastern Overthrust Belt beneath Blue Ridge-Piedmont thrust: American Association of Petro leum Geologists Bulletin, v. 65, no. 12, p. 2497-2505.
Harris, L.D., deWitt, W., Jr. and Bayer, K.C., 1982, Interpretive seismic profile along Interstate 1-64 from the Valley and Ridge to the coastal plain in central Virginia: United States Geological Survey Oil and Gas Investigations Chart OC-123, 1 sheet.
Henika, W.S., 1981, Geology of the Villamont and Montvale quadrangles, Va.: Virginia Division of Mineral Resources Publication 35, 18 p.
A11

37°30'
37°00'
81°00'___________ I
APPALACHIAN PLATEAU
PROVINCE
West Virginia
SOW
VALLEY
AND
RIDGE
PROVINCE
20 KILOMETERS 1
Regional conodont color alteration values
2-3 Hill 4-53-4 fr^TJ 5 +
3.5
EXPLANATION
4.0 Conondont index locality and color alteration value
SA Semianthracite Mississippian coal
SA (M) Coal-bed methane test well
._ Thrust fault; dashed where location uncertain
Mississippian rocks
Horse
Figure 18. Thermal maturation level of rocks in study area based on conodont color alteration values of Epstein and others (1977) and A.G. Harris (unpublished data, 1985). Semianthracite coal localities from Stanley and Schultz (1983), Simon and Englund (1983), and Campbell (1925).
Marshall, F.C., 1959, Geology of the Kent window, Wythe County, Va.: Blacksburg, Va., Virginia Polytechnic Institute and State University, unpublished M.Sci. thesis, 21 p.
Milici, R.C., Harris, L.D., and Statler, A.T., 1979, An interpre tation of seismic cross sections in the Valley and Ridge of eastern Tennessee: Tennessee Division of Geology Oil and Gas Chart 6, 2 sheets.
Rodgers, J., 1970, The Pulaski fault, and the extent of Cambrian evaporites in the central and southern Appalachians, in Fisher, G.W. and others, eds., Studies of Appalachian geology, central and southern: New York, Wiley-Interscience, p. 175-178.
Schultz, A.P., 1979a, Deformation associated with Pulaski over- thrusting in the Price Mountain and East Radford windows, Montgomery Co., southwest Va.: Blacksburg, Va., Virginia Polytechnic Institute and State University, unpublished M.Sci. thesis, 134 p.
1979b, Fault breccia, fault chaos, tectonic melange and deformed parautochthonous rocks in the Price Mountain and East Radford windows of the Pulaski overthrust, Montgom ery County, southwestern Va.: Geological Society of Amer ica Southeastern Section Meeting, 1979, Blacksburg, Va., Guides to Field Trips 1-3, p. 112-133.
1981, Progressive development of melange fabrics in allochthons of the Pulaski thrust, southwest Va. [abs.]: Geological Society of America Abstracts with Program, v, 13, no. 7, p. 28.
1983, Broken-formations of the Pulaski thrust sheet nearPulaski, Va.: Blacksburg, Va., Virginia Polytechnic Institute and State University, unpublished Ph.D. thesis, 111 p.
Schultz, A.P., and Anders, D.E., 1985, Schurflingsfensters in the Pulaski thrust sheet and their implications for hydrocarbon potential [abs.]: American Association of Petroleum Geolo gists Bulletin, v. 69, no. 9, p. 1447.
Sibson, R.H., 1977, Fault rocks and fault mechanisms: Journal of the Geological Society of London, v. 133, pt. 3, p. 191-213.
Simon, P.O., and Englund, K.J., 1983, Test drilling for coal in 1982-1983 in the Jefferson National Forest, Va., pt. 4, Analyses of coal cores from the Valley coal fields: U.S. Geological Survey Open-File Report 83-626, 16 p.
Stanley, C.B., and Schultz, A.P., 1983, Coal-bed methane resource evaluation, Montgomery County, Va.: Virginia Division of Mineral Resources Publication 46, 59 p.
Tissot, B.P., and Welte, D.H., 1984, Petroleum formation and occurrence (2d ed.): New York, Springer-Verlag, 699 p.
A12 Evolution of Sedimentary Basins Appalachian Basin

Tollmann, A., 1968, Die Grundbegriffe der deckentektonischen Woodward, N.B., 1985, Valley and Ridge thrust belt; balanced Nomenklatur [Basic principles of tectonic thrusting nomen- structural sections, Pennsylvania to Alabama: University of clature]: Geotektonische Forschungen, v. 29, p. 26-59. Tennessee Department of Geological Sciences Studies in
Geology 12, 64 p.
References Cited A13


Chapter B
Fluvial Deposition in the Central Appalachians During the Early Pennsylvanian
By CHARLES L. RICE and JOSEPH F. SCHWIETERING
A multidisciplinary approach to research studies of sedimentary
rocks and their constituents and the evolution of sedimentary
basins, both ancient and modern
U.S. GEOLOGICAL SURVEY BULLETIN 1839
EVOLUTION OF SEDIMENTARY BASINS-APPALACHIAN BASIN


CONTENTS
Abstract BlIntroduction BlGeologic setting BlSediment dispersal patterns for the Pennsylvanian B3Drainage systems B3Depositional models B5Conclusions B8References cited B8
FIGURES
1. Paleogeographic map showing distribution of Upper Mississippian rocks and inferred Late Mississippian-Early Pennsylvanian drainage system, Kentucky, Ohio, West Virginia, and parts of adjacent States B2
2. Correlation chart for Lower and Middle Pennsylvanian and Upper Mississip pian stratigraphic units used in report B3
3, 4. Photographs showing:3. Crossbedded sets of Pennsylvanian quartz-pebble conglomerate and peb
bly quartz arenite on Pilot Knob, Levee Wi-minute quadrangle, east- central Kentucky B3
4. Detail of Pennsylvanian crossbedded quartz-pebble conglomerate on Pilot Knob, Levee VVi-minute quadrangle, east-central Kentucky B4
5. Isopach map of Mississippian Greenbrier Limestone in West Virginia show ing traces and directions of flow of inferred paleochannels B4
6. Geologic sections showing westward onlap and pinchout of Pennsylvanian Lee Formation in eastern Kentucky B5
7. Schematic drawing showing two interpretations of Early Pennsylvanian paleogeography in the Appalachian basin B6
8. Photograph showing southeast-inclined tabular sets of crossbedded pebbly quartz arenite of basal part of Lee Formation, eastern Kentucky B7
CONVERSION FACTORS FOR SOME SI METRIC AND U.S. UNITS OF MEASURE
To convert from To Multiply by
Feet (ft) Meters (m) 0.3048Miles (mi) Kilometers (km) 1.609Pounds (Ib) Kilograms (kg) .4536Degrees Fahrenheit (°F) Degrees Celsius (°C) Temp °C=(temp °F-32)/l.
Contents III


EVOLUTION OF SEDIMENTARY BASINS-APPALACHIAN BASIN
Fluvial Deposition in the Central Appalachians During the Early Pennsylvanian
By Charles L. Rice1 and Joseph F. Schwietering2
Abstract
Development of a Pennsylvanian fluvial system in eastern North America following emergence of the craton in Late Mississippian time was controlled by a southwest- dipping paleoslope. Tectonism during the Late Mississip pian and Early Pennsylvanian caused streams draining the Cincinnati arch toward the southwest to be captured and diverted to the south and southeast into the subsiding Appalachian basin. These drainage modifications resulted in a significant contribution of sediment to the Appala chian basin from source areas to the north and northwest.
INTRODUCTION
Arguments about the existence of a Mississippian- Pennsylvanian unconformity in individual outcrops or small areas in the central Appalachian basin have tended to overshadow accumulated data that indicate the existence of a well-developed fluvial drainage system in much of the area by latest Mississippian and earliest Pennsylvanian time. Numerous geologic reports, some of which date from the early part of the 20th century, describe the basal Pennsylvanian channels and rocks that crop out mostly along the northwestern border of the Appalachian basin. Although the varied nature of the Mississippian- Pennsylvanian contact and the lack of reliable data have generally precluded definitive subsurface interpretations for much of the Appalachian basin, a few local and regional subsurface studies of Carboniferous strata also support a fluvial interpretation for the basal Pennsylvanian. This report discusses these data and suggests a model of fluvial deposition for the Early Pennsylvanian of the Appalachian basin that is regionally consistent with that for the related Eastern Interior (Illinois) basin to the west.
Concepts of the shape and history of the Appalachian basin and of the character of deposition during Pennsylva-
U.S. Geological Survey, Reston, VA 22092. 2 West Virginia Geological and Economic Survey, Morgantown,
WV 26507.
nian time are influenced by a widely held perception that a sea existed northwest of the Appalachian orogenic belt and its northwest-facing deltas (Englund, 1974). Thick sequences of quartz arenites in the Lower Pennsylvanian of the Appalachian basin commonly are cited as evidence of that sea and of beach or barrier-bar deposition. We propose, however, that the quartz arenites, which commonly occur in channel deposits, are fluviatile. We also suggest that their distribution reveals a drainage pattern showing a significant contribution of sediment to the Appalachian basin during Early Pennsylvanian time, first from the northern flank of the basin and later, by means of stream capture, from cratonic sources north and northwest of the basin.
GEOLOGIC SETTING
Late Mississippian deposition in the Appalachian and Eastern Interior basins began with formation of shallow- water shelf carbonates (Greenbrier Limestone and equiva lent strata), which, in northern Kentucky and adjacent areas, contain numerous exposure features and diastems indicative of frequent subaerial exposure (Rice and others, 1979). Predominantly terrigenous strata (Mauch Chunk Group and equivalents) subsequently were deposited by south- and west-prograding deltas. Subsidence in the Appa lachian basin during Late Mississippian time resulted in deposition of a wedge of sediments that thickens southeast ward and is as thick as 5,000 ft in southeastern West Virginia (Arkle, 1974). Thickness projections of Upper Mississippian rocks suggest, however, that the Cincinnati arch was emergent during the Late Mississippian in most of western Ohio, north-central Kentucky, and eastern Indiana (Pryor and Sable, 1974).
During Late Mississippian or Early Pennsylvanian time, a eustatic lowering of sea level resulted in the emergence of most, if not all, of the craton in eastern North America. The sea retreated from the craton toward the southwest (Swann, 1964), and southwest-flowing rivers cut valleys as deep as 450 ft in both the Eastern Interior basin (Siever, 1951) and the Appalachian basin (Mrakovich,
Manuscript approved for publication, 5/16/88 Fluvial Deposition in Central Appalachians during Early Pennsylvanian B1

86' I
EXPLANATION
Mauch Chunk Group (Upper Mississippian) and equivalent strata
Greenbrier Limestone (Upper Mississippian) and equivalent strata
I IArea of karst topography
Edge of structural platform
Northwestern margin of J depocenter
EscarpmentOlder rocks (includes minor Upper
Mississippian strata in area of folded Appalachians)
JESSAMINE DOME
38'
Figure 1. Distribution of Upper Mississippian rocks and inferred Late Mississippian-Early Pennsylvanian drainage system, Kentucky, Ohio, West Virginia, and parts of adjacent States. Locations of areas A and B depicted in figure 7 also shown.
1969). Erosion truncated progressively older strata north ward, so that Pennsylvanian rocks directly overlie Ordovi- cian strata in northern Illinois and Devonian strata in New York. Upwarping of the Cincinnati arch and erosion of less competent shales and siltstones above and below the more competent Mississippian carbonate rocks (Greenbrier Lime stone and its equivalents) resulted in the formation of a low north-facing escarpment that defined the open shape of the south-plunging arch and, in particular, the northwestern edge of the Appalachian basin (fig. 1). Remnants of that escarpment are buried beneath Pennsylvanian rocks in southwestern Pennsylvania and southeastern Ohio (Wan- less, 1975). The escarpment locally has been exhumed by erosion and is represented today, in part, by the Cumber
land Escarpment and by Muldraughs Hill (a northeast- facing escarpment) in central Kentucky (Lobeck, 1929) and its extension in Indiana.
Emergence of the craton and upwarping of the Cin cinnati arch during Late Mississippian and Early Pennsyl vanian time were accompanied by relative downwarping of the Appalachian basin. Although Rice (1985) has suggested that an unconformity between Mississippian and Pennsyl vanian strata extends throughout the central Appalachian basin, subsidence and sedimentation apparently continued in southeasternmost West Virginia and adjoining parts of Virginia, areas in which Englund (1974, 1979) reported that strata of the Pocahontas Formation (basal Pennsylvanian) (fig. 2) conformably overlie Mississippian strata.
B2 Evolution of Sedimentary Basins Appalachian Basin

OHIO
NORTHEASTERNand
SOUTH-CENTRAL KENTUCKY
SOUTHEASTERN KENTUCKY
Livingston Conglomerate: Mbr. of Lee Fm
MauchChunk Group
and equivalent strata
Greenbrier Limestone and equivalent stratc
SOUTHEASTERN WEST VIRGINIA
and VIRGINIA
Figure 2. Lower and Middle Pennsylvanian and Upper Mississippian stratigraphic units used in report. Pattern indicates missing strata; M, horizon containing restricted marine fauna; B, horizon containing brackish-water fauna. Data from Arkle (1974), Englund (1974), Rice (1984), and Wanless (1975).
Figure 3. Crossbedded sets of Pennsylvanian quartz- pebble conglomerate and pebbly quartz arenite on Pilot Knob, Levee 7 1/2-minute quadrangle, east-central Ken tucky. These deposits and those of adjacent Rotten Point are west of carbonate escarpment shown in figure 1 and comprise a channel fill as thick as 165 ft that rests on Lower Mississippian rocks (McDowell, 1978). Current direction is southwest. Location of Pilot Knob shown in figure 6. Brunton compass shown for scale.
SEDIMENT DISPERSAL PATTERNS FOR THEPENNSYLVANIAN
In a detailed analysis of the paleogeography of Pennsylvanian rocks in the Appalachian basin in Pennsyl vania and adjacent States, Meckel (1967) identified two distinct source areas for detritus in the Appalachian basin: (1) a "tectonic" source area along the southeastern margin of the basin in an area of rapid uplift and erosion and (2) a stable "cratonic" source area in southern Canada and northern New York. Detritus from the tectonic source is characterized by sedimentary and metamorphic rock frag ments and generally angular to subrounded polycrystalline quartz grains, whereas detritus from the cratonic source is composed predominantly of well-rounded monocrystalline quartz grains, best typified by the quartz arenite of the Sharon (conglomerate) Member of the Pottsville Formation (fig. 2). Meckel's model suggests that sediment-dispersal patterns were controlled in part by a "thalweg," or linear topographic low, that extended south westward from the general area of southwestern Pennsylvania. Clastic materi als from the two source areas were carried by tributaries to the topographic low and ultimately toward a sea that, whenever subsidence exceeded deposition, extended north eastward into Pennsylvania from areas in West Virginia and Ohio.
Although Meckel's depositional model fits the gen eral pattern of Pennsylvanian sedimentation, especially with regard to the two source areas, it neither conforms to nor explains major aspects of Early Pennsylvanian deposition. For example, marine incursions did not extend into western Pennsylvania until the middle part of Middle Pennsylvanian time, and marine fauna, generally of a restricted nature,
have been identified only in one to three thin stratigraphic zones (generally only inches thick) in Lower Pennsylvanian rocks of Ohio, West Virginia, Virginia, and Kentucky (Rice, 1984) (fig. 2). In the general area of Meckel's topographic low, Middle Pennsylvanian rocks commonly overlie Lower Mississippian rocks. During the Early Penn sylvanian, these areas probably were uplands and more subject to erosion than to deposition (Wanless, 1975).
DRAINAGE SYSTEMS
Most studies of current directions in basal Pennsyl vanian strata in eastern North America indicate a southwest erly transport direction (see, for example, Siever and Potter, 1956). Along the northwestern margin of the Appalachian basin, sub-Pennsylvanian valleys and channels have been described in northern Ohio (Lamb, 1911), in western Pennsylvania (Ingham and others, 1956), in southern Ohio (Fuller, 1955; Couchot, 1972), in northeastern Kentucky (Englund and Windolph, 1971), in south-central Kentucky (Wixted, 1977; Rice, 1984), and in the Eastern Interior basin (Bristol and Howard, 1971). The studies cited describe the valley- and channel-fill deposits as Pennsylva nian stream deposits, many of which are composed of pebbly or conglomeratic quartz arenite that indicates south erly current directions parallel with the valleys or channels (see, for example, figs. 3, 4). The basal quartz arenite deposits, although widely separated, are postulated by Rice (1984) to derive from the same southwest-flowing river system that included the basal Pennsylvanian deposits of the Brownsville paleovalley in the Eastern Interior basin (Pryor and Potter, 1979). In south-central Kentucky, an area of
Fluvial Deposition in Central Appalachians during Early Pennsylvanian B3

Figure 4. Detail of Pennsylvanian crossbedded quartz- pebble conglomerate on Pilot Knob, Levee 7 1/2-minute quadrangle, east-central Kentucky, shown in figure 3. Brunton compass shown for scale.
extensive Pennsylvanian lag gravels (Miller, 1910) indi cates where that river, herein called the Sharon-Brownsville river system (fig. 1), breached the Cincinnati arch. The stream pattern shown in figure 1 in the area of the Jessamine dome suggests that the southwest-dipping paleoslope was modified locally by upwarping of the Cincinnati arch in Late Mississippian time (Rice and Haney, 1980) and that the escarpment southeast of the Sharon-Brownsville river system was the drainage divide between the Appalachian and Eastern Interior basins at that time.
Paleocurrent directions and thickness contours show that the major Pennsylvanian depocenters were along the margin of the craton in the Appalachian basin in southeast ern West Virginia and southwestern Virginia, in the Black Warrior basin of Mississippi and Alabama, and in the Arkoma basin of Oklahoma and Arkansas. Thus, in West Virginia and parts of Virginia along the eastern margin of the Appalachian basin, paleocurrent directions of basal Pennsylvanian strata are westerly or northwesterly from the evolving Appalachian erogenic belt (see, for example, Englund, 1974). In northeastern Kentucky, southeast- flowing streams at the base of the Pennsylvanian, such as the drainage system mapped by Englund and Windolph (1971), also carried detritus to the depocenter from the emergent southeastern flank of the Cincinnati arch. In southwestern Virginia, much of the depocenter is eroded away, and Early Pennsylvanian current directions shift from westerly to southwesterly and follow the margin of the craton in eastern Kentucky and Tennessee toward the southwest (Donaldson and others, 1979).
Although small channels cannot be traced in the subsurface by using available drill-hole data, several large paleovalleys have been distinguished at the base of the Pennsylvanian in West Virginia and easternmost Kentucky. Figure 5 is a modification of a map by Flowers (1956) showing the thickness of the Greenbrier Limestone in the
38°-
Figure 5. Isopach map of Mississippian Greenbrier Lime stone in West Virginia showing traces and directions of flow of inferred paleochannels (indicated by arrows). Contour interval 25 ft. Modified from Flowers (1956, pi. 2).
subsurface of West Virginia. The configuration of thickness contours indicates that the upper surface of the limestone in northwestern West Virginia was beveled and locally deeply scoured by subaerial erosion. Depression contours indicate a huge sink hole and, together with Flowers' description of the systemic boundary, suggest development of a karst topography on the Greenbrier in that area in Late Missis sippian and Early Pennsylvanian time. Flowers identified the large trough outlined by the 100-ft contour in the central part of the map as a river paleochannel and, because northwest-trending hanging valleys are tributary to the main channel, postulated that the channel and its fill of Pennsyl vanian quartzose sandstone and conglomerate are the prod uct of a northwest-flowing river. We believe, however, that the paleovalley was cut by a south-flowing river for several reasons: (1) the regional paleocurrent direction in Early Pennsylvanian time was southerly; (2) the paleovalley is large and is filled by quartzose sandstone and conglomerate; and (3) the paleovalley is cut in bedrock and was situated between a continental source of detritus and the rapidly subsiding Appalachian basin. Several other scours sugges-
B4 Evolution of Sedimentary Basins Appalachian Basin

Elkhorn City quadrangle USGS Map GQ-9S1
Figure 6. Westward onlap and pinchout of Pennsylvanian Lee Formation in eastern Kentucky. Generalized columnar sections from U.S. Geological Survey Geologic Quadrangle Maps GQ-951 (Alvord and Miller, 1972) and GQ-1126 (Rice, 1973). Subsurface data from core holes drilled for coal resource evaluation of Lower Pennsylvanian rocks (Bergeron and others, 1983). The Rockcastle Conglomerate Member of the Lee Formation was correlated with the upper sandstone member of the Lee Formation by Englund (1968) and by Rice and Smith (1980). c, coal bed; L, linguloid brachiopod; P, productoid brachiopod.
live of paleochannels are indicated on the sub-Pennsyl- vanian surface in figure 5. Because the Greenbrier dips to the southeast (see fig. 1), the south-flowing streams cut progressively higher stratigraphic levels, and, south of their terminations shown in figure 5, the paleochannels are entirely in strata of the overlying Mauch Chunk Group.
A southwest-trending linear depression was identified in the subsurface at the base of the Pennsylvanian in eastern Kentucky (Coskren and Rice, 1979) and is shown in area A on figure 1 as a paleovalley. The extension of this paleo- valley into southwestern Virginia was described by Rice (1985, 1986). The paleovalley is 10 mi wide and more than 300 ft deep and filled with pebbly and conglomeratic quartz arenite of the Lee Formation (fig. 2). The basal Pennsylva nian quartz arenites that occupy a portion of this paleovalley are locally brought to the surface by the Pine Mountain overthrust fault along part of the Kentucky-Virginia State line. Figure 6 contrasts a simplified geologic section for the Lee Formation in the central part of the paleovalley (Elk- horn City 7 1/2-minute quadrangle) (Alvord and Miller, 1972) with one for an upland area west of the paleovalley
(Jenkins West 7V2-minute quadrangle) (Rice, 1973). The presence of a paleovalley at the base of the Pennsylvanian in the Elkhorn City quadrangle is corroborated by the differ ence in the thickness of the interval between the Mississip- pian Little Stone Gap Member of the Pennington Formation and the base of the Lee Formation in the two areas. In addition, a distinctive 200-ft-thick high-silica (>99.9 per cent) conglomeratic sandstone unit at the base of the Lee Formation in the central part of the paleovalley in the Elkhorn City quadrangle is not in the upland area in the Jenkins West quadrangle.
DEPOSITIONS. MODELS
Depositional models for Lower Pennsylvanian rocks in the central Appalachian basin must explain the contrast between what might be called the "northwestern" and "southeastern" facies of the New River Formation (or equivalent strata of the Lee Formation) (fig. 2). The
Fluvial Deposition in Central Appalachians during Early Pennsylvanian B5

B
Mojor capture point of Sharon River
METAMORPHIC ROCKS
Figure 7. Two interpretations of Early Pennsylvanian paleogeography in the Appalachian basin. A, Area A in figure 1. Beach and barrier island model of Miller (1974, fig. 59) in parts of Kentucky, Virginia, and West Virginia. B, Area B in figure 1. Fluvial model presented in this report. Arrows indicate general location and paleocurrent directions of known deposits of basal Pennsylvanian quartz arenite; paleocurrent direction inferred for subsurface data (dashed) (Flowers, 1956; Hansen, 1984) Details of streams altered; vertical scale exaggerated for sake of perspective.
northwestern facies is dominated by quartz arenite units, which are broadly linear, trend southwest, and locally are more than 400 ft thick and 50 mi wide. The quartz arenite facies wedges out to the southeast or locally grades into the southeastern facies, which is dominated by subgraywacke, siltstone, and shale. Figure 1A (Miller, 1974) shows a model of the paleogeography during deposition of Lower
Pennsylvanian strata in adjacent areas of Kentucky, Vir ginia, and West Virginia that is supported by the studies of Donaldson (1974, fig. 1), Englund (1974, 1979), Englund and others (1979, 1985, 1986), Perm (1974a, b), Perm and others (1971), Home (1979), and Home and others (1974). In this model, the two facies are genetically related: the northwestern facies is represented by the beach and barrier
B6 Evolution of Sedimentary Basins Appalachian Basin

island complex and the southeastern facies by the back- barrier and alluvial complexes. However, marine units predicted by the model to represent the foreshore and offshore environments in Kentucky and West Virginia have never been identified in either State. Proponents of the model argue either that the Pennsylvanian quartz arenite is a facies of Mississippian marine shale and carbonate units (Perm, 1974b; Home and others, 1974) or that the north western marine equivalents of the quartz arenite have been eroded away (Englund, 1974). We believe that these hypotheses are untenable. Available data indicate that the Pennsylvanian quartz arenite units onlap the southeastern flank of the Cincinnati arch and either fill south- or southwest-trending channels in the Mississippian surface (such as the Livingston Conglomerate Member of the Lee Formation) or, as figure 6 shows, overlie or wedge out to the northwest (similar to the Rockcastle Conglomerate Member of the Lee Formation) into coal-bearing sequences of Pennsylvanian shale and siltstone of the Breathitt For mation. Depositional thinning of the lower part of the Lee Formation increases with westward onlap (fig. 6). Core hole D2 (fig. 6) was drilled on the western rim of the Livingston paleochannel, the base of which is at least 150 ft below the base of the Pennsylvanian section in the core hole (Brown and Osolnik, 1974). The Livingston channel is about 4 mi wide and is filled with interstratified and intergraded quartz sandstone and conglomerate deposited by a south- to southeast-flowing stream (Rice, 1984). Thus, data from the outcrop belts at both ends of the section shown in figure 6 suggest that the pre-Pennsylvanian surface was terrestrial and had local relief of at least 150 ft.
A continental environment of deposition for the basal Pennsylvanian strata is also indicated by Alvord and Miller (1972), who characterized quartz arenites of the Elkhorn City area as conspicuously cross stratified in large-scale sets and forming persistent channel-in-channel units that contain thin, lenticular bodies of interstratified clayey and silty sandstone and thin coal beds. Sedimentologic and paleohy- drologic studies by BeMent (1976) of outcropping Lower Pennsylvanian quartz arenites in areas including area A (fig. 1) indicate that the arenites were deposited by a southwest- flowing braided river. A study by Miller (1974, p. 118) suggests that the abundant current and crossbedding struc tures of those strata are characteristically composed of tabular sets of uniformly dipping, planar crossbeds that mostly dip 15° to 25° south and southwest (fig. 8). Miller noted, however, that "a significant number of low-angle laminar and festoon cross-bedding features have a dip to the southeast or northwest." Although he attributed these latter structures to deposition in a marine beach or barrier-bar environment and explained their scarcity as resulting from destruction by southwest-migrating tidal channels, he was unable to explain the absence of shelly fossils in the arenites or associated strata. Confronted with data similar to the foregoing, Donaldson and others (1979) reevaluated the
Figure 8. Southeast-inclined tabular sets of crossbedded pebbly quartz arenite of basal part of Lee Formation, eastern Kentucky. U.S. Highway 119 at crest of Pine Mountain, about 3.2 mi south of Whitesburg, Ky. Cross- bedding is unidirectional toward southwest. Location of photograph shown in figure 6.
paleogeography of Lower Pennsylvanian strata and sug gested that plant fossils, textural sequences, and sedimen tary structures of the quartz arenites of the New River Formation in West Virginia indicate deposition in braided rivers.
Our fluvial model for Early Pennsylvanian deposition in the Appalachian basin, shown in figure IB, indicates inferred drainage configurations and the locations and current directions of identified deposits of quartz arenite in paleovalleys at the base of the Pennsylvanian. We envision the following scenario for Early Pennsylvanian time. Dep osition began in the central part of the basin (depocenter) and consisted of sequences of sand, silt, clay, and peat, which became the Pocahontas Formation (see fig. 2). Increased erosion of the uplifted cratonic source area in Canada and New York resulted in transport of great
Fluvial Deposition in Central Appalachians during Early Pennsylvanian B7

quantities of quartz sand and gravel into the Sharon- Brownsville valley and its alluviation. Head ward erosion of streams along the southeastern margin of the carbonate escarpment flanking the Cincinnati arch led to the capture and diversion of the headwaters of the Sharon-Brownsville river into the Appalachian basin. The major capture was by way of the great valley cut into the Greenbrier Limestone described by Flowers (1956) and by us (fig. 5). Thick sequences of quartz arenite of the New River and Lee Formations represent clastic material transported from northern cratonic areas across West Virginia; these sequences truncate or disconformably overlie the Poca- hontas in the northwestern part of its extent (Englund, 1974). Braided streams deposited coarse quartzose sedi ments on delta plains in the subsiding Appalachian basin, and the rapid aggradation resulted in construction of exten sive sand sheets in the southern and western parts of the basin. Detritus in the central part of the basin came mostly from source areas to the southeast (Englund, 1974). The braided rivers were bordered mostly by freshwater lakes and swamps in which clay, silt, and peat were deposited. Several transgressive events during the Early Pennsylvanian are interpreted to represent the encroachment of seas into areas of rapid subsidence in the central part of the basin and the local extension of shallow marine or brackish water into certain river valleys (Rice, 1984). As regional subsidence continued in the Appalachian basin, south-trending Sharon channels were alluviated and abandoned. West-flowing streams built deltas into the basin, and the delta plain extended progressively west from the rising Appalachians. These deltaic deposits did not completely displace the Sharon system and bury the remnants of the carbonate escarpment in northeastern Kentucky until Middle Pennsyl vanian time.
CONCLUSIONS
Integration of stratigraphic and sedimentologic infor mation within the Early Pennsylvanian tectonic framework for eastern North America suggests that, at the beginning of the Pennsylvanian, much of the area was emergent and had a southwest-dipping paleoslope. Earliest Pennsylvanian deposition in southeastern West Virginia and southwestern Virginia was accompanied by headward erosion of streams draining the southeastern flank of the developing Cincinnati arch and by the capture of major rivers originating in the southeastern part of the Canadian Shield and their diversion into the subsiding Appalachian basin. A reevaluation of Flowers' (1956) subsurface study of the Greenbrier Lime stone in West Virginia, including his identification of a large south-trending paleovalley at the base of the Pennsyl vanian that is filled with pebbly and conglomeratic quartz arenite, provides the necessary link between cratonic source areas in the Sharon drainage system and vast deposits of
Lower Pennsylvanian pebbly quartz arenite in the Appala chian basin. The channel identified by Flowers is the largest of those that diverted streams from the Eastern Interior basin into the Appalachian basin, and it greatly affected both depositional patterns and facies distribution in the Appalachian basin during Early Pennsylvanian time. Our fluvial model and the sedimentation history for the Appa lachian and Eastern Interior basins furnish a new basis for intraregional and interregional correlation of Lower Penn sylvanian strata and for analysis of large and small tectonic events in eastern North America during the Early Pennsyl vanian.
REFERENCES CITED
Alvord, D.C., and Miller, R.L., 1972, Geologic map of the Elkhorn City Quadrangle, Ky.-Va., and part of the Harman Quadrangle, Pike County, Ky.: U.S. Geological Survey Geologic Quadrangle Map GQ-951, scale 1:24,000.
Arkle, T., Jr., 1974, Stratigraphy of the Pennsylvanian and Permian Systems of the central Appalachians, in Briggs, G., ed., Carboniferous of the southeastern United States: Geo logical Society of America Special Paper 148, p. 5-29.
BeMent, W.O., 1976, Sedimentological aspects of Middle Car boniferous sandstones on the Cumberland overthrust sheet: Cincinnati, Ohio, University of Cincinnati, unpublished Ph.D. thesis, 182 p.
Bergeron, R.R., Cobb, J.C., Slucher, E.R., and Smath, R.A., 1983, Geologic descriptions and coal analyses for 1982 coal drilling in the Daniel Boone National Forest, eastern Ky.: Kentucky Geological Survey Information Circular 12, 243 p.
Bristol, H.M., and Howard, R.H., 1971, Paleogeologic map of the sub-Pennsylvanian Chesterian (Upper Mississippian) sur face in the Illinois Basin: Illinois State Geological Survey Circular 458, 13 p.
Brown, W.R., and Osolnik, M.J., 1974, Geologic map of the Livingston quadrangle, southeastern Ky.: U.S. Geological Survey Geologic Quadrangle Map GQ-1179, scale 1:24,000.
Coskren, T.D., and Rice, C.L., 1979, Contour map of the base of the Pennsylvanian System, eastern Ky.: U.S. Geological Survey Miscellaneous Field Studies Map MF-1100, scale 1:250,000.
Couchot, M.L., 1972, Paleodrainage and lithofacies relationships of the Sharon conglomerate of southern Ohio: Athens, Ohio, Ohio University, unpublished M.Sci. thesis, 64 p.
Donaldson, A.C., 1974, Pennsylvanian sedimentation of central Appalachians, in Briggs, G., ed., Carboniferous of the southeastern United States: Geological Society of America Special Paper 148, p. 47-78.
Donaldson, A.C., Presley, M.W., and Renton, J.J., 1979, Car boniferous coal; short course and guidebook: West Virginia Geological and Economic Survey Bulletin B-37, v. 3, 181 p.
Englund, K.J., 1968, Geology and coal resources of the Elk Valley area, Tenn. and Ky.: U.S. Geological Survey Profes sional Paper 572, 59 p.
1974, Sandstone distribution patterns in the Pocahontas Formation of southwest Virginia and southern West Virginia, in Briggs, G., ed., Carboniferous of the southeastern United States: Geological Society of America Special Paper 148, p. 31-45.
B8 Evolution of Sedimentary Basins Appalachian Basin

1979, The Mississippian and Pennsylvanian (Carbonifer ous) Systems in the United States; Virginia: U.S. Geological Survey Professional Paper 1110-C, 21 p.
Englund, K.J., and Windolph, J.F., Jr., 1971, Geology of the Carter Caves Sandstone (Mississippian) in northeastern Ken tucky: U.S. Geological Survey Professional Paper 750-D, p. D99-D104.
Englund, K.J., Cecil, C.B., and Stricker, G.D., 1979, Deposi- tional environments of the Mississippian System and Lower Pennsylvanian Series in proposed Pennsylvanian System stratotype area, in Englund, K.J., Arndt, H.H., and Henry, T.W., eds.. Proposed Pennsylvanian System stratotype, Va. and W. Va.; Selected guidebook 1: Falls Church, Va., American Geological Institute, p. 113-114.
Englund, K.J., Gillespie, W.H., Cecil, C.B., Windolph, J.F., Jr., and Crawford, T.J., 1985, Characteristics of the Mississippian-Pennsylvanian boundary and associated coal- bearing rocks in the southern Appalachians: U.S. Geological Survey Open-File Report 85-557, 84 p.
Englund, K.J., Gillespie, W.H., Johnson, P.L., and Pfefferkorn, H.W., 1986, Depositional model for Upper Mississippian and Lower Pennsylvanian rocks of southwestern Virginia, in McDowell, R.C., and Glover, L., Ill, eds., The Lowry volume; studies in Appalachian geology: Virginia Polytech nic Institute and State University Memoir 3, p. 37^5.
Ferm, J.C., 1974a, Carboniferous environmental models in east ern United States and their significance, in Briggs, G., ed., Carboniferous of the southeastern United States: Geological Society of America Special Paper 148, p. 79-95.
1974b, Carboniferous paleogeography and continental drift: International Congress of Carboniferous Stratigraphy and Geology, 7th, Krefeld, West Germany, 1971, Compte Rendu, v. 3, p. 9-25.
Ferm, J.C., Home, J.C., Swinchatt, J.P., and Whaley, P.W., 1971, Carboniferous depositional environments in northeast ern Kentucky, in Geological Society of Kentucky guidebook, annual spring field conference, Lexington, Ky., 1971: Lexington, Ky., Kentucky Geological Survey, 30 p.
Flowers, R.B., 1956, A subsurface study of the Greenbrier Limestone in West Virginia: West Virginia Geological Sur vey Report of Investigations 15, 17 p.
Fuller, J.O., 1955, Source of Sharon Conglomerate of northeast ern Ohio: Geological Society of America Bulletin, v. 66, p. 159-176.
Hansen, M.C., 1984, Middle Carboniferous depositional events; the Sharon Sandstone, a basal Pennsylvanian quartz arenite in the north-central Appalachian basin, m Shumaker, R.C., comp., Appa^hian Basin Industrial Associates, Spring Meeting, Columbus, Ohio, Proceedings: Columbus, Ohio State University, p. 148-173.
Home, J.C., 1979, The orthoquartzite problem, in Ferm, J.C., and others, eds., Carboniferous depositional environments in the Appalachian region: Columbia, S.C., University of South Carolina, p. 370.
Home, J.C., Ferm, J.C., and Swinchatt, J.P., 1974, Depositional model for the Mississippian-Pennsylvanian boundary in northeastern Kentucky, in Briggs, G., ed., Carboniferous of the southeastern United States: Geological Society of Amer ica Special Paper 148, p. 97-114.
Ingham, A.I., and others, 1956, Oil and gas geology of the Sheffield quadrangle, Pa.: Pennsylvania Geological Survey Bulletin M-38 (4th ser.), 72 p.
Lamb, G.F., 1911, The Mississippian-Pennsylvanian unconform ity and the Sharon Conglomerate: Journal of Geology, v. 19, p. 104-109.
Lobeck, A.K., 1929, The geology and physiography of the Mammoth Cave National Park: Kentucky Geological Survey, ser. 6, v. 31, p. 327-399.
McDowell, R.C., 1978, Geologic map of the Levee quadrangle, east-central Ky.: U.S. Geological Survey Geologic Quadran gle Map GQ-1478, scale 1:24,000.
Meckel, L.D., 1967, Origin of Pottsville conglomerates (Pennsyl vanian) in the central Appalachians: Geological Society of America Bulletin, v. 78, no. 2, p. 223-257.
Miller, A.M., 1910, Evidence that the Appalachian and central coal fields were once connected across central Kentucky: Geological Society of America Bulletin, v. 20, p. 621-624.
Miller, M.S., 1974, Stratigraphy and coal beds of Upper Missis sippian and Lower Pennsylvanian rocks in southwestern Virginia: Virginia Division of Mineral Resources Bulletin 84, 211 p.
Mrakovich, J.V., 1969, Fluvial deposits of the Sharon Conglom erate in Portage, Summit, eastern Medina, and northeastern Wayne Counties: Kent, Ohio, Kent State University, unpub lished M.Sci. thesis, 92 p.
Pryor, W.A., and Potter, P.E., 1979, Sedimentology of a paleo- valley fill; Pennsylvanian Kyrock Sandstone in Edmonson and Hart Counties, Ky., in Palmer, J.E., and Dutcher, R.R., eds., Depositional and structural history of the Illinois basin: Illinois State Geological Survey Guidebook Series 15, pt. 2, p. 49-61.
Pryor, W. A., and Sable, E.G., 1974, Carboniferous of the Eastern Interior basin, in Briggs, G., ed., Carboniferous of the southeastern United States: Geological Society of America Special Paper 148, p. 281-313.
Rice, C.L., 1973, Geologic map of the Jenkins West Quadrangle, Ky.-Va.: U.S. Geological Survey Geologic Quadrangle Map GQ-1126, scale 1:24,000.
1984, Sandstone units of the Lee Formation and related strata in eastern Kentucky: U.S. Geological Survey Profes sional Paper 1151-G, 53 p.
1985, Terrestrial vs. marine depositional model; a new assessment of subsurface Lower Pennsylvanian rocks of southwestern Virginia: Geology, v. 13, no. 11, p. 786-789.
-1986, Reply to comments of Shepherd et al. on "Terrestrialvs. marine depositional model, etc.": Geology, v. 14, p. 801-802.
Rice, C.L., and Haney, D.C., 1980, The Mississippian- Pennsylvanian systemic boundary in eastern Kentucky; dis cussion and reply: Southeastern Geology, v. 21, no. 4, p. 299-305.
Rice, C.L., and Smith, J.H., 1980, Correlation of coal beds, coal zones, and key stratigraphic units in the Pennsylvanian rocks of eastern Kentucky: U.S. Geological Survey Miscellaneous Field Studies Map MF-1188, 1 sheet.
Rice, C.L., Sable, E.G., Dever, G.R., Jr., and Kehn, T.M., 1979, The Mississippian and Pennsylvanian (Carboniferous) Systems in the United States; Kentucky: U.S. Geological Survey Professional Paper 1110-F, 32 p.
Siever, R., 1951, The Mississippian-Pennsylvanian unconformity in southern Illinois: American Association of Petroleum Geologists Bulletin, v. 35, no. 3, p. 542-581.
Siever, R., and Potter, P.E., 1956, Sedimentary petrology; Sources of basal Pennsylvanian sediments in the Eastern Interior basin, pt. 2: Journal of Geology, v. 64, no. 4, p. 317-335.
Swann, D.H., 1964, Late Mississippian rhythmic sediments of Mississippi Valley: American Association of Petroleum Geologists Bulletin, v. 48, no. 5, p. 637-658.
Wanless, H.R., 1975, Appalachian region, in McKee, E.D., and Crosby, E.J., coords., Introduction and regional analyses of
References Cited B9

the Pennsylvanian System; Paleotectonic investigations of the Wixted, J.B., 1977, Sedimentary aspects of the Livingston Con-Pennsylvanian System in the United States, pt. 1: U.S. glomerate, southeastern Ky.: Lexington, Ky., University ofGeological Survey Professional Paper 853, p. 17-62. Kentucky, unpublished M.Sci. thesis, 63 p.
B10 Evolution of Sedimentary Basins Appalachian Basin

Chapter C
Disturbed Zones: Indicators of Subsurface Faults and Possible Hydrocarbon Traps in the Valley and Ridge and Appalachian Plateau Provinces of Pennsylvania, Maryland, Virginia, and West Virginia
By HOWARD A. POHN and TERRI L. PURDY
A multidisciplinary approach to research studies of sedimentary
rocks and their constituents and the evolution of sedimentary
basins, both ancient and modern
U.S. GEOLOGICAL SURVEY BULLETIN 1839
EVOLUTION OF SEDIMENTARY BASINS-APPALACHIAN BASIN


CONTENTS
Abstract ClIntroduction ClCharacteristics and morphology ClRegional implications C3Magnitude of displacement C4Lithotectonic associations C5Association of disturbed zones and hydrocarbon occurrences C6Conclusions C6References cited CIO
FIGURES
1. Map showing location of study area in Valley and Ridge and Appalachian Plateau provinces of Appalachian Mountains, Pennsylvania, Maryland, Vir ginia, and West Virginia C2
2, 3. Schematic drawings showing:2. Structural elements in thrust system C33. Formation of disturbed zones in various structural settings C3
4. Photograph showing disturbed zone in Devonian Lock Haven (Chemung) Formation at Towanda, Pa. C3
5. Schematic drawings showing evolution of disturbed zone at Towanda,Pa. C4
6, 7. Simplified structural maps showing:6. Distribution of faults in part of Hyndman TVz-minute quad
rangle, Pennsylvania C47. Locations of disturbed zones along extensions of mapped faults in part
of Allegheny County, Maryland. C58. Map showing structure of Oriskany Sandstone along part of Deer Park anti
cline, Preston County, West Virginia C5 9, 10. Geologic maps showing:
9. Disharmonic fold patterns of formations and relationship between for- mational contacts and disturbed zones in part of Huntingdon County, Pennsylvania C6
10. Relationship between formational flexures and disturbed zone in part of Hyndman TVi-minute quadrangle, Pennsylvania C7
11. Block diagrams showing stacked anticlines that have identical surface config urations but considerably different displacements on intervening faults C7
12. Photograph showing zone of wedge faults in Upper Devonian Catskill For mation of Pennsylvania C7
13, 14. Maps showing:13. Locations of surface exposures of disturbed zones, structure contours of
top of Onondaga Formation or equivalent, and locations of subsurface thrust fault and oil and gas wells C8
14. Relationship between disturbed zones and gas fields, West Virginiapanhandle C9
15. Schematic cross section showing relationship between concentrations of dis turbed zones and areas of high fracture porosity in Oriskany Sandstone and reservoir seals in Marcellus and Needmore Shales CIO
Contents III

CONVERSION FACTORS FOR SOME SI METRIC AND U.S. UNITS OF MEASURE
To convert from To Multiply by
Feet (ft) Meters (m) 0.3048Miles (mi) Kilometers (km) 1.609Pounds (Ib) Kilograms (kg) .4536Degrees Fahrenheit (°F) Degrees Celsius (°C) Temp °C=(temp °F-32)/l.
IV Contents

EVOLUTION OF SEDIMENTARY BASINS-APPALACHIAN BASIN
Disturbed Zones: Indicators of Subsurface Faults and Possible Hydrocarbon Traps in the Valley and Ridge and Appalachian Plateau Provinces of Pennsylvania, Maryland, Virginia, and West Virginia
By Howard A. Pohn andTerri L. Purdy
Abstract
Disturbed zones are sequences of severely thrust faulted and folded rocks either in the hanging walls or footwalls adjacent to thrust faults or between closely spaced pairs of thrust faults. They are common in the central Appalachian Valley and Ridge province and are surface manifestations of imbricate thrust faults that are rooted to detachments at depth. The zones are tens to hundreds of meters thick and a few kilometers to tens of kilometers long. Although they commonly form in units composed of alternating siltstone and shale, some are in more competent units. The intense folding and faulting in disturbed zones may localize domains of high fracture porosity in the subsurface, which, when sealed from the surface, may produce potential hydrocarbon traps.
INTRODUCTION
The gross aspects of the structural geology of folded and faulted Paleozoic rocks of the central Appalachian Mountains have been fairly well described by using seismic analyses and geologic mapping (Rodgers, 1963; Gwinn, 1964, 1970; Harris and Milici, 1977; Perry, 1978). One type of structural feature, herein referred to as a "disturbed zone," has been frequently described (Rickard, 1952, p. 517), but the relationship between these zones and the regional tectonic framework has been given little attention. This report discusses the occurrence, morphology, and sequential development of these zones.
The disturbed zones described in this paper are in the Valley and Ridge and Appalachian Plateau provinces of the Appalachian Mountains from central Pennsylvania to north ern West Virginia (fig. 1). In this area, a series of folded and thrust-faulted Paleozoic rocks trend east-northeast to northeast. The sedimentary sequence comprises predomi nantly carbonate rocks of Cambrian through Ordovician age
and clastic rocks of Ordovician through Pennsylvanian age and is 7,800 to 10,200 m thick.
Seismic profiles and drilling data indicate that both the Valley and Ridge province and a large part of the Appalachian Plateau province are underlain by large thrust sheets that have been translated westward along a thrust system consisting of extensive bed-parallel flats (decolle- ments), ramps, and imbricate splay faults (fig. 2). This type of structural architecture is indicative of thin-skinned tec tonic systems in which the deformation is concentrated above the basal detachment and the basement is virtually undeformed (Rodgers, 1963; Gwinn, 1964; Dahlstrom, 1970; Boyer and Elliott, 1982; Butler, 1982). Disturbed zones are common throughout the study area, and we believe that such structures are characteristic of thrust belts worldwide.
Acknowledgments. The authors are grateful to Robert C. Milici (Virginia Division of Mineral Resources) and William M. Dunn (Department of Geology, West Virginia University) for their insightful reviews and helpful comments during the writing of this paper. Field data collected by C. Scott Southworth of the U.S. Geological Survey aided the study.
CHARACTERISTICS AND MORPHOLOGY
The term "disturbed zone" was first used by Rickard (1952, p. 517) to describe precisely the structures discussed below. Disturbed zones consist of intensely folded and thrust-faulted beds either in the hanging wall or footwall adjacent to a thrust fault or in a zone between a closely spaced pair or within a series of approximately parallel thrust faults (fig. 3). Beds within a disturbed zone are intensely deformed, whereas beds adjacent to the zone are relatively undeformed. Disturbed zones are tens to hundreds
Manuscript approved for publication, 5/16/88 Disturbed Zones: Indicators of Subsurface Faults and Possible Hydrocarbon Traps C1

80
38
PENNSYLVANIA
WEST VIRGINIA r^'
Figure 1. Location of study area in Valley and Ridge and Appalachian Plateau provinces of Appalachian Mountains, Pennsylvania, Maryland, Virginia, and West Virginia. Boundaries of Great Valley (east) and Appalachian structural front (west) indicated by dotted lines.
of meters thick and commonly can be traced for a few kilometers to tens of kilometers along strike. They can be distinguished from horse blocks or duplexes (fig. 2) because horse blocks and duplexes are not necessarily intensely folded or faulted in the fault-bounded block.
The thrust faults that bound disturbed zones can be either bed parallel or bed oblique. Although bed-parallel disturbed zones are similar in appearance to drag folds, they are different from drag folds in that disturbed zones are not restricted to the limbs of a host fold, generally contain more intensely deformed rocks, and may show opposite senses of rotation of axial planes of folds within the fault blocks.
Field mapping in the study area demonstrates an abundance of disturbed zones. At several locations, the entire width of a zone is exposed, and the morphology of the zone can be described in detail. An excellent example of a well-exposed disturbed zone occurs at Towanda, Pa., 80 km north of the study area (fig. 4). This bed-oblique disturbed zone is bounded by a pair of thrust faults, and the total displacement to the south along the faults is greater than 15 m. The antithetic or back-thrusted disturbed zone, in the siltstone and shale of the Devonian Lock Haven (Chemung) Formation, evolved from a series of horse blocks that imbricated successively in a piggyback fashion
C2 Evolution of Sedimentary Basins Appalachian Basin

Figure 2. Structural elements in thrust system.
(fig. 5). Individual horse blocks were internally deformed by compression and drag, and concomitant thickening occurred. Many folds within individual horse blocks are asymmetric, and one limb commonly is vertical to over turned. These folds may themselves be cut by thrust or extension faults. Shaly beds generally have been deformed in response to disharmonic folding between resistant units.
fl
Figure 3. Formation of disturbed zones. A, In hanging wall of thrust fault. B, Between pair of thrust faults. C, In footwall of thrust fault.
REGIONAL IMPLICATIONS
Disturbed zones have been noted by many field geologists and identified as "crumpled" (Root, 1977), "tightly folded or otherwise contorted on a small scale" (Miller, 1959; Conlin and Hoskins, 1962; Dyson, 1963; deWitt, 1974), or "contorted" (Hoskins, 1976). These structures have never before been interpreted as being the surface expressions of regional fault systems, but, in our opinion, they are precisely that for the following reasons. First, many disturbed zones are associated with mapped faults. Figure 6 shows a map of surface thrust faults in part of the Hyndman 7V2-minute quadrangle, Pennsylvania (deWitt, 1974). Most of the disturbed zones that we mapped in this area occur along faults mapped by deWitt (1974). Second, many disturbed zones are found along extensions of mapped faults (fig. 7). Third, disturbed zones commonly occur along upward extensions of faults that were mapped in the subsurface on the basis of well control or seismic interpretation. Gwinn (1964, p. 872), for example, showed that thrust faults in the subsurface, as determined from seismic and drill-hole data, are found on both sides of the Deer Park anticline in Preston County, W. Va., and we mapped disturbed zones along the surface projections of these faults (fig. 8). Fourth, disturbed zones commonly occur along contacts of disharmonically folded stratigraphic units. Figure 9 shows an area in Huntingdon County, Pennsylvania, in which numerous disturbed zones are in Silurian rocks along the contacts between the Clinton Group and the Mifflintown Formation and between the Blooms- burg Formation and the Wills Creek Formation. The same formational contacts show disharmony throughout much of Pennsylvania, Virginia, and West Virginia, and extensive disharmonic fold patterns strongly suggest the presence of decollements (James Parley, oral communication, 1980;
Figure 4. Disturbed zone in Devonian Lock Haven (Che- mung) Formation at Towanda, Pa., about 80 km north of the study area. Details of geometry of this bed-oblique disturbed zone that formed between a pair of thrust faults are shown in figure 5.
Disturbed Zones: Indicators of Subsurface Faults and Possible Hydrocarbon Traps C3

39P50'78°45'
Figure 5. Evolution of disturbed zone at Towanda, Pa. Zone is shown in figure 4.
Pohn and Purdy, 1982). In the example shown in figure 9, the decollements (bed-parallel disturbed zones) have been folded.
These examples are evidence that disturbed zones are surface expressions of thrust faults rooted in the subsurface. We believe that, in areas where disturbed zones and mapped flexures are coincident, these flexures represent duplication of the stratigraphic sequence by faulting. An example of the association of flexures and disturbed zones occurs in the Hyndman TW-minute quadrangle, Pennsylvania (de Witt, 1974) (fig. 10). If a line is drawn between the two flexures in the Keyser Limestone (locations A and B, fig. 10), it will
39P461
KILOMETERS
Figure 6. Distribution of faults in part of Hyndman 71/2- minute quadrangle, Pennsylvania. Asterisks, disturbed zones; solid lines, faults (barbs on upper plate); dashed lines, inferred faults; dotted lines, concealed faults. Mod ified from deWitt (1974).
pass directly through the disturbed zone at location C; we believe that the presence of the disturbed zone indicates that the flexures result from duplication by a thrust fault denoted by the disturbed zone. This conclusion is supported by Wallace deWitt, Jr. (oral communication, 1982), who originally mapped the zone as "tightly folded rocks."
MAGNITUDE OF DISPLACEMENT
Many disturbed zones are intraformational in that rocks in the hanging wall and footwall belong to the same stratigraphic unit and therefore appear to have only small displacement; however, intraformational faults may have large displacements. Stacked anticlines in the Valley and Ridge province (fig. 11) are similar to those in the Canadian
C4 Evolution of Sedimentary Basins Appalachian Basin
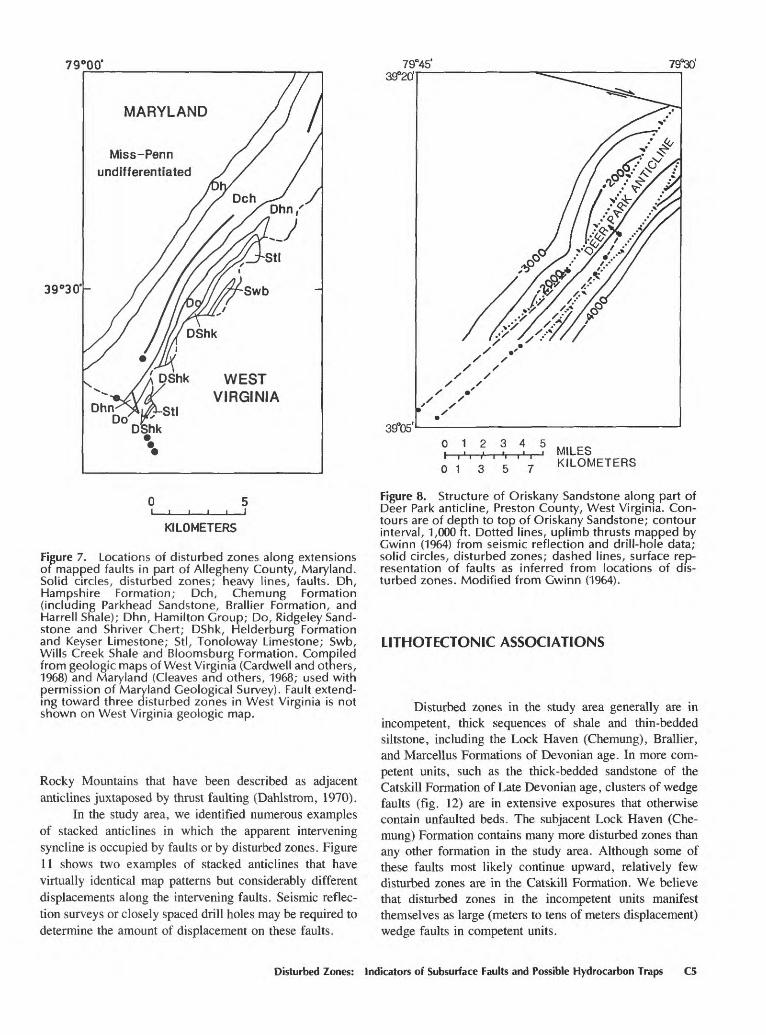
79°00'
39°30'
Miss-Penn
undifferentiated
Dhn
WEST VIRGINIA
DoDShk
79°45' 39°20'
79°30'
KILOMETERS
Figure 7. Locations of disturbed zones along extensions of mapped faults in part of Allegheny County, Maryland. Solid circles, disturbed zones; heavy lines, faults. Dh, Hampshire Formation; Dch, Chemung Formation (including Parkhead Sandstone, Brallier Formation, and Harrell Shale); Dhn, Hamilton Group; Do, Ridgeley Sand stone and Shriver Chert; DShk, Helderburg Formation and Keyser Limestone; Stl, Tonoloway Limestone; Swb, Wills Creek Shale and Bloomsburg Formation. Compiled from geologic maps of West Virginia (Cardwell and others, 1968) and Maryland (Cleaves and others, 1968; used with permission of Maryland Geological Survey). Fault extend ing toward three disturbed zones in West Virginia is not shown on West Virginia geologic map.
Rocky Mountains that have been described as adjacent anticlines juxtaposed by thrust faulting (Dahlstrom, 1970).
In the study area, we identified numerous examples of stacked anticlines in which the apparent intervening syncline is occupied by faults or by disturbed zones. Figure 11 shows two examples of stacked anticlines that have virtually identical map patterns but considerably different displacements along the intervening faults. Seismic reflec tion surveys or closely spaced drill holes may be required to determine the amount of displacement on these faults.
39°05012345 ....I . .' MILES0135 7 KILOMETERS
Figure 8. Structure of Oriskany Sandstone along part of Deer Park anticline, Preston County, West Virginia. Con tours are of depth to top of Oriskany Sandstone; contour interval, 1,000 ft. Dotted lines, uplimb thrusts mapped by Gwinn (1964) from seismic reflection and drill-hole data; solid circles, disturbed zones; dashed lines, surface rep resentation of faults as inferred from locations of dis turbed zones. Modified from Gwinn (1964).
LITHOTECTONIC ASSOCIATIONS
Disturbed zones in the study area generally are in incompetent, thick sequences of shale and thin-bedded siltstone, including the Lock Haven (Chemung), Brallier, and Marcellus Formations of Devonian age. In more com petent units, such as the thick-bedded sandstone of the Catskill Formation of Late Devonian age, clusters of wedge faults (fig. 12) are in extensive exposures that otherwise contain unfaulted beds. The subjacent Lock Haven (Che mung) Formation contains many more disturbed zones than any other formation in the study area. Although some of these faults most likely continue upward, relatively few disturbed zones are in the Catskill Formation. We believe that disturbed zones in the incompetent units manifest themselves as large (meters to tens of meters displacement) wedge faults in competent units.
Disturbed Zones: Indicators of Subsurface Faults and Possible Hydrocarbon Traps C5

4Cf37'30"
Swc
IKILOMETERS
Figure 9. Disharmonic fold patterns of formations and relationship between formational contacts and disturbed zones in parts of Pine Grove Mills, McAlevy's Fort, Donation, and Allensville quadrangles, Huntingdon County, Pennsylvania. Asterisks, disturbed zones; heavy lines, faults. Dh, Hamilton Croup; Doo, Onondaga and Old Port Formations, undivided; Dor, Ridgely Member of the Old Port Formation; DSkt, Keyser and Tonoloway Formations, undivided; Swc, Wills Creek Formation; Sbm, Bloomsburg and Mifflintown Formations, undivided; Sc, Clinton Croup; St, Tuscarora Formation; Oj, Juniata Formation; Obe, Bald Eagle Formation. Geology modified from Berg and Dodge (1981).
ASSOCIATION OF DISTURBED ZONES AND HYDROCARBON OCCURRENCES
disturbed zones and the relationship between these zones and certain hydrocarbon traps.
Field mapping shows the coincidence of concentra tions of disturbed zones and lines of gas wells, which are slightly offset from and parallel with the concentrations of disturbed zones (figs. 13, 14). This association can be understood by examining a schematic cross section of such a concentration (fig. 15). Folding and extreme wedge faulting in a competent formation such as the Oriskany Sandstone considerably increase the fracture porosity of the formation. The same faults that fracture competent forma tions are taken up by flowage and concomitant disharmonic folding in superjacent incompetent shale beds, such as the Needmore and Marcellus Formations, and produce dis turbed zones that serve to seal the reservoir. Detailed mapping of disturbed zones in overthrust belts will result in a better understanding of both the structural setting of
CONCLUSIONS
Disturbed zones are intensely folded and thrust- faulted beds in the hanging wall or footwall of thrust faults or in zones between closely spaced pairs or series of approximately parallel thrust faults. They are surface expressions of thrust faults rooted in the subsurface to detachments or ramps. The zones are tens to hundred of meters thick and kilometers to tens of kilometers long.
Disturbed zones are common throughout the central Appalachian Valley and Ridge and Appalachian Plateau provinces, and we believe that such structures are charac teristic of thrust belts worldwide. They are more abundant in incompetent units and are manifested as wedge faults in competent units. Although concentrations of disturbed
C6 Evolution of Sedimentary Basins Appalachian Basin

78°43'OO" 39° 51'
78° 41 "30"
39°50'
-B
Ridgeley Sandstone
Shriver Formation
| Dm* I
New Creek and Corriganville Limestone and Mandate Formation
Keyser Limestone
| SH |
Tonoloway Limestone
| Sv»T"|
Wills Creek Formation
| Sb 1
Bloomsburg Red Beds
.5
KILOMETERS
Fault Sawteeth on upper plate
Figure 10. Relationship between formational flexures (A, B) and disturbed zone (C) in part of Hyndman 7 1/2-minute quadrangle, Pennsylvania (deWitt, 1974). Symbol at letter C is deWitt's symbol for "tightly folded rocks."
Figure 11. Stacked anticlines that have identical surface configurations but considerably different displacements on intervening faults.
zones are commonly associated with hydrocarbon occur rences, the converse is not necessarily true, and careful mapping of disturbed zones may be used to augment hydrocarbon exploration techniques in thrust belts.
Figure 12. Zone of wedge faults in Upper Devonian Catskill Formation of Pennsylvania. Wedge faults in com petent units probably are structural equivalents of dis turbed zones in incompetent units. Note open wedge fractures, higher joint density, and shattered sandstone in region of wedge faults, all of which lead to increases in fracture porosity.
Disturbed Zones: Indicators of Subsurface Faults and Possible Hydrocarbon Traps C7

78P37'30"
39°30'
39°15'
EXPLANATION
THRUST FAULT IN SUBSURFACE v
DISTURBED ZONE AT SURFACE -
PRODUCING WELL -#
SHOW OF GAS -^
DRY HOLE -$
KILOMETERS
<
Figure 13. Locations of surface exposures of disturbed zones, structure contours (interval 1,000 ft) of top of Onondaga Formation or equivalent, and locations of subsurface thrust fault and oil and gas wells. Modified from Cardwell (I982).
C8 Evolution of Sedimentary Basins Appalachian Basin

79POO' 78°30'
39P30
39POO'
MARYLAND'-<
K
V
WEST VIRGINIA
r- VIRGINIA
10 is 20
i MILES
KILOMETERS
/
Figure 14. Relationship between disturbed zones (solid circles and dashed lines) and gas fields (patterned areas), West Virginia panhandle. Numerals indicate number of disturbedzones.
Disturbed Zones: Indicators of Subsurface Faults and Possible Hydrocarbon Traps C9

w
CONCENTRATIONOF
DISTURBED ZONES
MARCELLUS SHALE
NEEDMORE SHALE
RISKANY SANDSTONE
FRACTURES
MARCELLUS SHALE
NEEDMORE SHALE i3V)RISKANY SANDSTONE
DECOLLEMENT
Figure 15. Relationship between concentrations of disturbed zones and areas of high fracture porosity in Oriskany Sandstone and reservoir seals in Marcellus and Needmore Shales.
REFERENCES CITED
Berg, T.M., and Dodge, C.M., compilers, 1981, Preliminary geologic quadrangle maps of Pennsylvania: Pennsylvania Geological Survey Map 61, 636 p., scale 1:62,500.
Boyer, S.E., and Elliott, D., 1982, Thrust systems: American Association of Petroleum Geologists Bulletin, v. 66, no. 9, p. 1196-1230.
Butler, R.W.H., 1982, The terminology of structures in thrust belts: Journal of Structural Geology, v. 4, no. 3, p. 239-245.
Cardwell, D.H., 1982, Oriskany and Huntersville gas fields of West Virginia: West Virginia Geological and Economic Survey Mineral Resource Series MRS-5 A, p. 43.
Cardwell, D.H., Erwin, R.B., and Woodward, H.P., compilers, 1968, Geologic map of West Virginia: Morgantown, W. Va., West Virginia Geologic and Economic Survey, 2 sheets, scale 1:250,000.
Cleaves, E.T., Edwards, J., Jr., and Glaser, J.D., compilers, 1968, Geologic map of Maryland: Baltimore, Maryland Geological Survey, scale 1:250,000.
Conlin, R.R., and Hoskins, D.M., 1962, Geology and mineral resources of the Mifflintown quadrangle, Pa.: Pennsylvania Geological Survey Topographic and Geologic Atlas of Penn sylvania 126, 46 p.
Dahlstrom, C.D.A., 1970, Structural geology in the eastern margin of the Canadian Rocky Mountains: Canadian Petro leum Geology Bulletin, v. 18, no. 3, p. 332-406.
deWitt, W., Jr., 1974, Geologic map of the Beans Cove and Hyndman quadrangles and part of the Fairhope quadrangle, Bedford County, Pa.: U.S. Geological Survey Miscellaneous Investigations Map 1-801, 6 p., scale 1:24,000.
Dyson, J.L., 1963, Geology and mineral resources of the northern half of the New Bloomfield quadrangle: Pennsylvania Geo logical Survey Topographic and Geologic Atlas of Pennsyl vania 137ab, 4th ser., 63 p.
Gwinn, V.E., 1964, Thin-skinned tectonics in the Plateau and northwestern Valley and Ridge provinces of the central Appalachians: Geological Society of America Bulletin, v. 75, no. 9, p. 863-900.
1970, Kinematic pattern and estimates of lateral shorten ing, Valley and Ridge and Great Valley provinces, central Appalachians, south-central Pa., in Fischer, G.W., Pettijohn, F.J., Reed, J.C., Jr., and Weaver, K.N., eds., Studies of Appalachian geology, central and southern: New York, Wiley-Interscience, p. 127-146.
Harris, L.D., and Milici, R.C., 1977, Characteristics of thin- skinned style of deformation in the southern Appalachians, and potential hydrocarbon traps: U.S. Geological Survey Professional Paper 1018, 40 p.
Hoskins, D.M., 1976, Geology and mineral resources of the Millersburg 15-minute quadrangle, Dauphin, Juniata, North umberland, Perry, and Synder Counties, Pa.: Pennsylvania Geological Survey Topographic and Geologic Atlas of Penn sylvania 146, 4th ser.
C10 Evolution of Sedimentary Basins Appalachian Basin

Miller, J.T., 1959, Geology and mineral resources of the Loys- ville quadrangle: Pennsylvania Geological Survey Topo graphic and Geologic Atlas of Pennsylvania 127, 4th ser.
Perry, W.J., Jr., 1978, Sequential deformation in the eastern Appalachians: American Journal of Science, v. 278, p. 518-542.
Pohn, H.A., and Purdy, T.L., 1982, Disturbed zones: Indicators of deep-seated subsurface faults in the Valley and Ridge and Appalachian structural front of Pennsylvania: U.S. Geologi cal Survey Open-File Report 82-967, 42 p.
Rickard, L.V., 1952, The Middle Devonian Cherry Valley lime stone of eastern New York: American Journal of Science, v. 250, p. 511-522.
Rodgers, J., 1963, Mechanics of Appalachian foreland folding in Pennsylvania and West Virginia: American Association of Petroleum Geologists Bulletin, v. 47, no. 8, p. 1527-1536.
Root, S.I., 1977, Geology and mineral resources of the Harrisburg West area, Cumberland and York Counties, Pa.: Pennsylva nia Geological Survey Topographic and Geologic Atlas of Pennsylvania 148ab, 4th ser.
References Cited C11


CHAPTER D
Reevaluation of Conodont Color Alteration Patterns in Ordovician Rocks, East-Central Valley and Ridge and Western Blue Ridge Provinces, Tennessee
By RANDALL C. ORNDORFF, ANITA G. HARRIS, and
ARTHUR P. SCHULTZ
A multidisciplinary approach to research studies of sedimentary
rocks and their constituents and the evolution of sedimentary
basins, both ancient and modern
U.S. GEOLOGICAL SURVEY BULLETIN 1839
EVOLUTION OF SEDIMENTARY BASINS-APPALACHIAN BASIN


CONTENTS
Abstract DlIntroduction DlEvaluation of color alteration index data D4Geologic interpretation D6Conclusions D9References cited D9
FIGURES
1. Generalized geologic map of central eastern Tennessee showing conodont color alteration index sample localities D2
2. Map showing conodont color alteration index localities and isograds for Ordovician carbonate rocks east of the Saltville fault, central eastern Tennessee D3
3. Generalized cross section from the Dumplin Valley fault through the Tucka-leechee Cove window D4
4, 5. Maps showing:4. Conodont color alteration index localities and revised isograds for
Ordovician carbonate rocks east of the Saltville fault, central eastern Tennessee D7
5. Unrestored thickness of Ordovician rocks younger than the LenoirLimestone in the Saltville and Dumplin Valley thrust belts, central east ern Tennessee D8
TABLE
1. Ordovician conodont color alteration index localities used in this report D5
CONVERSION FACTORS FOR SOME SI METRIC AND U.S. UNITS OF MEASURE
To convert from To Multiply by
Feet (ft) Meters (m) 0.3048Miles (mi) Kilometers (km) 1.609Pounds (Ib) Kilograms (kg) .4536Degrees Fahrenheit (°F) Degrees Celsius (°C) Temp °C=(temp °F-32)/1.8
Contents III


EVOLUTION OF SEDIMENTARY BASINS-APPALACHIAN BASIN
Reevaluation of Conodont Color Alteration Patterns in Ordovician Rocks, East-Central Valley and Ridge and Western Blue Ridge Provinces, Tennessee
By Randall C. Orndorff, Anita G. Harris, and Arthur P. Schultz
Abstract
An anomalously low conodont color alteration index (CAI) has been reported for Ordovician rocks in the Tuckaleechee Cove window of the Blue Ridge province in previous investigations. These data encouraged hydrocar bon explorationists to consider the eastward extension of Valley and Ridge rocks beneath thrust sheets of the Blue Ridge as a potential hydrocarbon province. Reevaluation of old and new CAI data in the easternmost thrust belt of the Valley and Ridge province and in windows through the Blue Ridge in central eastern Tennessee shows that, although the CAI anomaly in the Tuckaleechee Cove window is of less magnitude than first reported, CAI values for rocks in the window are still lower than those in correlative rocks northward and northwestward at the eastern limit of the Valley and Ridge province. CAI pat terns in Lower and lower Middle Ordovician rocks in central eastern Tennessee are more complex than those shown by earlier investigations, and the patterns may be related to primary depositional and burial trends in Mid dle and Upper Ordovician chiefly clastic rocks. CAI values in Ordovician rocks of the Tuckaleechee Cove window are slightly lower than those in correlative rocks in nearby windows; a similar pattern exists in the Dumplin Valley thrust belt opposite the windows and may reflect thick ness patterns of Middle and Upper Ordovician rocks. The area of hydrocarbon potential for Valley and Ridge rocks beneath the crystalline rocks of the Blue Ridge is some what less than previous estimates; these rocks, however, still have thermal potential for natural gas but are probably beyond the thermal limit for liquid hydrocarbons.
INTRODUCTION
Maps showing thermal maturation patterns in Paleo zoic rocks in the Appalachian basin based on conodont color alteration indices (CAI) were first presented by Epstein and others (1977). Subsequently, Harris and others (1978) published more detailed maps of the same area.
These early studies showed that, in most of the Valley and Ridge province, thermal maturation patterns in Paleozoic rocks are generally related to overburden thickness estab lished before Alleghanian thrusting. In general, CAI values increase eastward and reflect the eastward increase in thickness of Paleozoic rocks. Some exceptions that are structurally controlled are in Lower and Middle Ordovician rocks along the eastern limit of the Valley and Ridge province. CAI values in the westernmost thrust sheet of the Taconic allochthon in New York, in the Jutland klippe in New Jersey, and in the Hamburg klippe in Pennsylvania (Harris and others, 1978; Harris, 1979) are all significantly lower than those in parautochthonous rocks with which they are juxtaposed. Thus far, the only other noteworthy reversal in thermal maturation patterns near the eastern limit of the Valley and Ridge province has been found in the western Blue Ridge province, in windows through the Great Smoky thrust sheet in central eastern Tennessee (figs. 1, 2). An anomalously low CAI value of 2 reported from Ordovician rocks of the Tuckaleechee Cove window (Epstein and others, 1977; Harris and others, 1978) indicates thermal potential for hydrocarbons in sedimentary rocks that under lie crystalline rocks of the Blue Ridge thrust sheets (fig. 3). The CAI of rocks in this window was reported to be two indices lower than values in correlative rocks 15 to 20 km to the west at the eastern limit of the Valley and Ridge province. Regional structural interpretations (Woodward, 1985) show that rocks in the windows are thrust slices having duplex geometry (fig. 3). The slices were derived from a tectonic ramp below the western part of the Blue Ridge province. A similar interpretation was put forth for rocks in the windows of southwestern Virginia (Schultz and Anders, 1985; Schultz, this volume), but, in that area, CAI values and geochemical data (Schultz, this volume) indicate that little to no hydrocarbon potential exists east of the western edge of the Blue Ridge province. Thus far, the Tuckaleechee Cove thermal low has not been explained either structurally or sedimentologically. The apparent
Manuscript approved for publication, 5/16/88 Reevaluation of Conodont Color Alteration Patterns, Ordovician of Tennessee D1

MIS
SIS
SIP
PIA
N
AN
D
UP
PE
R
DE
VO
NIA
N
RO
CK
S
UP
PE
R
AN
D
MID
DLE
O
RD
OV
ICIA
N
CH
IEF
LY
C
LA
ST
IC
RO
CK
S
MID
DLE
O
RD
OV
ICIA
N
TO
M
IDD
LE
C
AM
BR
IAN
C
HIE
FL
Y
CA
RB
ON
AT
E
RO
CK
S
LO
WE
R
CA
MB
RIA
N
AN
D
PR
EC
AM
BR
IAN
R
OC
KS
TH
RU
ST
F
AU
LT
SA
WT
EE
TH
O
N
UP
PE
R
PL
AT
E
CO
NO
DO
NT
S
AM
PL
E
LO
CA
LIT
Y
oP
RO
DU
CT
IVE
B
AR
RE
N
iXv-
'r-'
x'';T
E->
l1r!
"!<
5
r''
-'-'\~
iii- 'r
UA
' Li^
bU
Hu.y
,-;/-^
^',~
:.'i\
-<i\i
- uj
\o
TU
CK
AL
EE
CH
EE
C
OV
E
WIN
DO
W
Figu
re 1
. G
en
era
lize
d g
eo
log
ic m
ap o
f ce
ntr
al
east
ern
Ten
ness
ee s
how
ing c
on
od
on
t co
lor
alte
ratio
n i
ndex
sam
ple
loca
litie
s. D
eta
iled e
eo
era
oh
ic
and
stra
t.gra
phic
dat
a ar
e sh
ow
n f
or
each
nu
mb
ere
d s
am
ple
lo
calit
y in
table
1.
Line
of
sect
ion
A-A
' (f
ig.
3) i
s al
so s
ho
wn
. G
eolo
gy
modifi
ed f
rom
ria
l C
IGlT
lcir
i \
I _/
OQ
J *

n o I
TU
CK
AL
EE
CH
EE
C
OV
E
WIN
DO
W
CA
LD
ER
WO
OD
\S
W
IND
OW
~l I r i "n r
0 5
10
15
2
0
25
3
0
KIL
OM
ET
ER
S
CA
I R
AN
GE
2 to
2
1/2
2 1/2
1o
3
3 to
3
1/2
3 1/2
to
4
4
to
4
1/2
3
CA
I IS
OG
RA
D
CO
NO
DO
NT
S
AM
PL
E
LO
CA
LIT
Figu
re 2
. C
on
od
on
t co
lor
alte
ratio
n
inde
x lo
calit
ies
and
isog
rads
fo
r O
rdo
vici
an
ca
rbon
ate
rock
s ea
st o
f th
e S
altv
ille
fau
lt,
cent
ral
east
ern
Ten
ness
ee.
Slig
htly
mo
difi
ed
fro
m H
arris
and
oth
ers
(197
8).

NW
A
SE A'
DUMPLINVALLEYFAULT
GUESS
TUCKALEECHEEWILDWOOD FAULT GREAT SMOKY COVE FAULT ^ .-FAULT
01 0
15
5 1
1 10
I15
10 MILES I
KILOMETERS
NO VERTICAL EXAGGERATION
Figure 3. Generalized cross section from the Dumplin Valley fault through the Tuckaleechee Cove window. p , Precambrian and Lower Cambrian rocks; , Cambrian rocks of the Rome Formation through the Conococheague Limestone; O k, Upper Cambrian and Lower Ordovician rocks of the Knox Group; Oum, Middle and Upper Ordovician rocks. Line of section is shown in figure 1. Modified from Roeder and others (1978) and Woodward (1985).
thermal anomaly may be the result of rapid eastward thinning of overburden above the Ordovician rocks exposed in the window. Alternatively, geochemical and (or) physi cal factors may have kept these rocks from reaching the same thermal maturity as correlative rocks both along strike to the north or across strike to the west at the eastern limit of the Valley and Ridge province. The Canning basin in Australia, for example, contains as much as 6,500 m of post-Precambrian sedimentary rocks that are flat lying to gently deformed. In a study of the geothermal history of this basin, Nicoll and Goiter (1984) showed that differences in CAI values at equivalent depths in bore holes having similar stratigraphy are not related to overburden but rather to differences in thermal conductivity of basin sediments, hydrology, and heat flow patterns. Similar factors could have produced local variations in CAI patterns early in the evolution of the Appalachian basin. The relatively low organic maturation levels reported from Ordovician rocks that structurally underlie the chiefly crys talline rocks of the western Blue Ridge in central eastern Tennesee have encouraged hydrocarbon explorationists to consider this area a potential natural gas province (Harris and others, 1981). In addition, seismic interpretations of this region (Cook and others, 1979, 1983; Harris and Bayer, 1979; Milici and others, 1979) have encouraged further speculations concerning this frontier hydrocarbon province. Hydrocarbon-bearing Paleozoic sedimentary rocks appear to extend from surface exposures in the Valley and Ridge province of the Appalachian foreland eastward below thrust sheets of metamorphic rocks of the Blue Ridge and Pied mont provinces. Palinspastic reconstructions of the eastern thrust belt in Tennessee (Harris and others, 1981) show that the area of hydrocarbon potential in the subsur
face may equal that of known production to the west. A less optimistic view was presented by Hatcher (1982), who summarized a variety of geologic data and concluded that the area of hydrocarbon potential was limited to a relatively narrow zone in the westernmost Blue Ridge province in the southern half of Tennessee, western North Carolina, and northern Georgia. Despite this view, others (Cook and others, 1983) have continued to speculate that a sizable part of the subsurface beneath the Blue Ridge and Piedmont provinces has commercial potential for natural gas. The purpose of this investigation was to verify and explain the anomalously low CAI of Ordovician rocks of the Tuckalee chee Cove window. This anomalously low value has important implications for understanding the geologic framework of the area and its implications for hydrocarbon potential.
Acknowledgments. -We wish to thank R.D. Hatcher Jr., (Department of Geological Sciences, University of Tennessee) and R.C. Milici (Virginia Division of Mineral Resources) for technical review of the manuscript. We also wish to thank the U.S. Park Service for access to Cades Cove.
EVALUATION OF COLOR ALTERATION INDEX DATA
Examination of the CAI data base used by Harris and others (1978) shows that conodonts from rocks in only two windows through the Great Smoky thrust sheet were indexed (fig. 2); of these, only rocks in the Tuckaleechee Cove window produced an anomalously low CAI value in comparison with values in the adjacent Valley and Ridge province. Moreover, correlative rocks in the easternmost
D4 Evolution of Sedimentary Basins Appalachian Basin

Table 1. Ordovician conodont color alteration index (CAI) localities used in this report[Sample localities and geologic information shown in fig. 1. Localities without U.S. Geological Survey (USGS) collection numbers are from the collections of S.M. Bergstrom and are reposited in the Department of Geology and Mineralogy, Ohio State University, Columbus, Ohio. Asterisk indicates sample was collected for this study; all others are from Harris and others (1978). Dolostone was sampled at localities 7, 15, 16, and 34; all other samples are from limestone]
Locality no.
1 ........2 ........3 ........4 ........5 ........6 ........7 ........8 ........9 ........10 .......11 .......12 .......13 .......14 .......15 .......16 .......17 .......18 .......19 .......20 .......21 .......22 .......23 .......24 .......25 .......26 .......27 .......28 .......29 .......30 .......31 .......32 .......33 .......34 .......35 .......36 .......37 .......38 .......39 .......40 .......41 .......42 .......43 .......44 .......45 .......46 .......
Field no. (USCS colln. no.)
. . .*SOCW-30 (10451-CO)
...T-O-77(10576-CO)
. . .T-O-76 (10575-CO)
. . .*SOVO-50 (10549-CO)*SOCC-26 (10449-CO)
. . .*SOVO^9 (10548-CO)
...*SOCC-25 (10448-CO)
...*SOTA-51 (10550-CO)
. . .70B9^
...*SOTC-23 (10447-CO)
...*SOTC-16(10444-CO)
. . .*SOTC-53 (10552-CO)
...70B11-2
...*SOTC-18(10445^CO)
. . .*SOBH^8 (10547-CO)
...*SOBH-52 (10551-CO)
...*SOLR-34(10453^CO)
. . .70B29-2
. . .64B6-2
...71B8
...74B36-3
...70B10-5
. . .*SOWW^5 (10546-CO)
. . .*SOWW^W (10545-CO)
. . .T-O-79 (10577-CO)
. . .T-CMO (10574-CO)
...*SONE-60(10559-CO)
...T-O-11 (10573^CO)
...*SOWP-59(10558^CO)
. . .*SOCH-62 (10560^CO)
. . .73B8-2
. . .T-O-81 (10578^CO)
...*SODD-57(10556-CO)
...*SOSG-58(10557-CO)
. . .74B38-1
. . .70B8-2
...*SOWC-38(10455^CO)
...*SOWC-10(10443^CO)
...*SOPF-43(10544-CO)
...*SOFG^t(10440^CO)
. ..*SOFG-5 (10441-CO)
...*SOPF-42(10543-CO)
...*SOBC-55 (10554-CO)
...*SOBC-56(10555^CO)
...*SOSG-63(10561-CO)
...*SOBC-54(10553^CO)
County
Blountdo.do.do.do.do.do.do.do.do.do.do.do.do.do.do.do.do.do.do.do.do.do.do.
do.do.
do.do.do.do.do.
MonroeSevier
do.do.do.do.do.do.do.do.do.
7-minute quadrangle
Calderwooddo.do.
VonoreCades CoveVonore
Binfield
Wear Cove
BlockhouseKinzel SpringsBlockhouse
do.
do.Concord
do.do.do.
Hartford
do.
White PineChestnut HillDouglas Dam
do.do.do.
GatlinburgWear CovePigeon ForgeRichardson Cove
do.Pigeon ForgeBoyds Creek
do.Shady GroveBoyds Creek
Latitude/longitude(N./W.)
35°30.6'/83°59.4'35°30.7'/83°59.9'35°30.4'/83°59.6'35°35.7'/84°11.3'35°36.1'/83°49.1'35°36.4'/84°07.7'35°36.7783°48.r35°36.9'/84°06.7'35°37.4'/84°06.7'35°38.8'/83°48.3'35°40.2'/83°43.r35°40.2'/83°46.9'35°41.0'/83°57.0'35°41.5'/83°45.8'35°42.1'/83°56.6'35°44 f)'/83°53 7'35°44 2'/83°49 4'35°45.0'/84°01.0'35°45.8'/84°07.3'35°46.2'/84°07.8'35°47.0783°59.0'35°48.r/83°45.3'35°48.8'/83°46.3'35°49.5783°46.8'35°52.4'/83°13.5'35°52.7'/83°13.3'35°53.0'/83°13.1'36°10.9'/82°58.9'35°04.0'/83°19.0'35°55.7783°20.3'35°58.0783°20.3'35°58.3783°30.1'35°58.3783°31.5'35°58.4783°29.9'35°58.5783°44.0'35°34.3784°08.0'35°43.5783°37.5'35°43.8783°39.3'35°49.5783°33.5'35°49.7783°29.8'35°50.0783°28.7'35°50.7783°34.7'35°53.5783°43.5'35°53.9783°42.4'35°54.5783°24.6'35°55.0783°40.3'
Series
Lowerdo.do.do.do.do.do.do.
Middledo.do.
LowerMiddle
do.
do.Middle
do.do.do.do.do.do.do.do.do.
MiddleLower
do.Middle
do.
do.Middle
do.LowerMiddleLower
do.Middle
do.LowerMiddle
do.do.
Stratigraphic unit
Knox GroupJonesboro Limestone
do.Chepultepec Dolomite
Mascot DolomiteWhitesburg LimestoneLenoir Limestone
do.Jonesboro LimestoneBlockhouse ShaleLenoir Limestone
do.
Arline FormationLenoir Limestone
do.do.do.do.do.do.
Chepultepec DolomiteBlockhouse ShaleChepultepec Dolomite
do.Lenoir Limestone
do.Chepultepec DolomiteKingsport DolomiteLenoir LimestoneChota FormationJonesboro LimestoneLenoir LimestoneMascot DolomiteJonesboro LimestoneNot knownLenoir LimestoneMascot DolomiteLenoir Limestone
do.do.
CAIvalue
33V23'/2331/22V2
32V2
33333i/2^t332V2-332V2-32'/2-321/2-32W3W^33W3V2-43-3V23V2431/243-31/23V2^t33321/2-331/23V23-3 !/2
431/2^3-3V232V2
3V23
thrust belt (Dumplin Valley thrust belt) of the Valley and Ridge closest to the Tuckaleechee Cove window were indexed at only two localities (fig. 2). In order to under stand and explain the Tuckaleechee Cove window anomaly, additional CAI data were required. Ordovician rocks were sampled in all windows in the Great Smoky thrust sheet in central eastern Tennessee and at geologically appropriate spacings in the Dumplin Valley thrust belt.
Thirty new localities were sampled for CAI evalua tion (table 1); except for a single locality at which Missis- sippian rocks were sampled, all were productive. The 29 new localities in Lower and Middle Ordovician rocks increased the CAI data base in the Dumplin Valley thrust belt (between the southern limit of Blount County and northern Jefferson County) and the Calderwood, Cades Cove, Tuckaleechee Cove, and Wear Cove windows
Reevaluation of Conodont Color Alteration Patterns, Ordovician of Tennessee D5

(compare figs. 2 and 4). For consistency, we also reindexed the conodont collections used by Harris and others (1978) in their study for central eastern Tennessee; as a result, some earlier CAI values have been changed, chiefly because of changes in indexing methodology. Changes of one-half index in the eastern part of the Saltville and the western part of the Dumplin Valley thrust belts produced minor changes in the formerly consistent eastward increase in CAI values. The most significant change, however, is for rocks in the Tuckaleechee Cove window, now indexed as 3 (fig. 4), an increase of one index over the former value. The previous CAI value of 2 for rocks in this window (Epstein and others, 1977; Harris and others, 1978) was based on a few relatively thin walled Middle Ordovician conodonts. Our experience has shown that such conodonts generally yield lower CAI values than do thicker walled conodonts in a sample. Lower and Middle Ordovician rocks at four local ities in the Tuckaleechee Cove window all produced cono dont collections having CAI values of 3, which are still lower than those from localities indexed by Harris and others (1978) in the nearby Dumplin Valley thrust belt to the west.
Ordovician rocks in the Cades Cove and Wear Cove windows (fig. 4) have CAI values of 3W, slightly higher than those of correlative strata in the Tuckaleechee Cove window. Ordovician rocks in the Calderwood window, about 20 km south of the Tuckaleechee Cove window, have intermediate CAI values of 3 to 3Vi. Thus, inspection of CAI values in the windows alone shows no apparent trend or relationship between CAI values and inferred tectonic or depositional patterns.
On the basis of seven CAI localities along a 120-km- long strike belt of the Dumplin Valley thrust sheet, Harris and others (1978) showed that CAI values gradually decrease southwestward, northwestward, and northeast ward from the eastern limit of the thrust belt in Sevier County. The 21 new localities in the Dumplin Valley thrust belt add complexity to the CAI patterns in this area (compare figs. 2 and 4), and some intriguing relationships emerge. The CAI values of 3Vi in Ordovician rocks of the Wear Cove and Cades Cove windows are opposite equiva lent values in the Dumplin Valley thrust belt to the west. Likewise, the slightly lower CAI values in Ordovician rocks of the Tuckaleechee Cove window are opposite an area of similarly lower CAI in the Dumplin Valley thrust belt.
GEOLOGIC INTERPRETATION
We suspect that CAI patterns in lower Middle and Lower Ordovician rocks in the Dumplin Valley thrust belt and in windows to the east chiefly reflect primary deposi tional trends of Middle and Upper Ordovician predomi
nantly clastic rocks that have been shown to be thickest in Blount and Sevier Counties and that may be even thicker in eastern Jefferson and Cocke Counties (fig. 5). The thick ness of post-Lenoir Ordovician deposits in the eastern Valley and Ridge province of part of central eastern Tennessee was compiled from a variety of published reports (fig. 5). This task proved difficult because (1) Upper Ordovician rocks are partly eroded from the Saltville thrust belt and almost totally absent from the Dumplin Valley thrust belt, (2) Middle Ordovician clastic deposits are incompletely preserved or incompletely exposed in the Dumplin Valley thrust belt, and (3) the area of probable thickest pelitic deposition north of Sevierville is probably the most structurally complex area in the Dumplin Valley belt, so that thickness data are unavailable or speculative. Consequently, only generalized unrestored thicknesses could be plotted for post-Lenoir Middle Ordovician rocks south of Sevierville in the Dumplin Valley thrust belt and for post-Lenoir Middle Ordovician rocks and part of the Upper Ordovician rock succession in the Saltville thrust belt (fig. 5). Interestingly, these data mimic CAI trends in the same area. Moreover, these thickness trends appear to extend eastward toward the CAI values in the windows. This projection may be inappropriate, however, because Ordovician rocks in the windows are now 15 to 20 km east of correlative rocks in the Dumplin Valley thrust belt as a result of tectonic juxtaposition (fig. 3). In addition, palin- spastic reconstructions based on existing interpretations (fig. 3) place these rocks at least 8 km farther eastward. Thus, it is likely that these parallel CAI trends, although possibly produced by the same processes, may not be part of a single depositional pattern.
CAI data from the single outcrop belt of younger Upper Devonian and Mississippian rocks in the Dumplin Valley thrust belt (fig. 1) would be useful, but, thus far, three samples from these dominantly clastic deposits have not produced conodonts. If CAI values for these younger rocks are considerably lower than those for the Lower and lower Middle Ordovician rocks that lie beneath the thick post-Lenoir Ordovician deposits in the same vicinity, then a primary depositional origin for the CAI patterns in the older Ordovician rocks could be established.
North of the Blount-Sevier County border in the Dumplin Valley thrust belt, CAI values are higher and appear to be more consistent. These higher values coincide with the broadening belt of Middle and Upper Ordovician chiefly clastic rocks in the same area (see Hardeman, 1966). Although thicknesses for these deposits are unavailable, the higher CAI values north of Blount County, as compared with those along strike to the south, strongly indicate thicker Ordovician deposits northward and eastward. We do not believe that these CAI trends are related to thickness patterns of post-Ordovician Paleozoic rocks or to major differences in thickness of tectonic overburden along strike.
D6 Evolution of Sedimentary Basins Appalachian Basin

n o o n. o n o
TU
CK
ALE
EC
HE
E
CO
VE
W
IND
OW
CA
I R
AN
GE
2 1/2
to
3
3 10
3
1/2
3 1
/2
to
4
to
4 1/2
3
CA
I IS
OG
RA
D D
ashed
where
in
ferr
ed
CO
NO
DO
NT
S
AM
PL
E
LO
CA
LIT
Y
30
KIL
OM
ET
ER
S
Figu
re 4
. C
on
od
on
t co
lor
alte
ratio
n i
ndex
loc
aliti
es a
nd r
evis
ed i
sogr
ads
for
Ord
ovi
cia
n c
arbo
nate
roc
ks e
ast
of
the
Sal
tvill
e fa
ult,
cen
tral
eas
tern
T
enne
ssee
.

1
-Q 03 o>
0) CN
-*T * C ^
co :^
^c *; ^:rt 03 O
O gj ' ' >~QJOC in "D "5
i- C </)
O t 1-o QJ
.ys D-C ,.
2£§
U_ 0) ^
D8 Evolution of Sedimentary Basins Appalachian Basin

CONCLUSIONS
This study shows that:
1. The "anomalously" low CAI value for Ordovician rocks of the Tuckaleechee Cove window is not as low as that reported by earlier investigators (Epstein and others, 1977; Harris and others, 1978) and is anoma lous only with respect to CAI values in correlative rocks northward and northeastward at the eastern limit of the Valley and Ridge province.
2. CAI patterns in Lower and lower Middle Ordovician rocks in central eastern Tennessee are more complex than those shown by earlier investigators; these patterns appear to be related chiefly to primary depositional trends in Middle and Upper Ordovician rocks.
3. CAI values in Ordovician rocks of the Tuckaleechee Cove window are slightly lower than those in correla tive rocks in nearby windows. A similar pattern persists in correlative rocks in the Dumplin Valley thrust belt opposite the windows and appears to mimic thickness patterns of Middle and Upper Ordovician rocks in the same area. These depositional patterns may persist eastward toward the windows and could account for the difference in CAI values of rocks in the windows.
4. Regardless of these changes in CAI values and their inferred geologic causes, the data still indicate thermal potential for hydrocarbons in the eastward extension of Valley and Ridge rocks beneath the chiefly crystalline rocks of the Blue Ridge. Reevaluation of CAI patterns, however, somewhat decreases the area of this potential hydrocarbon province and virtually restricts its poten tial to natural gas.
More detailed sampling and mapping of CAI values will provide a higher resolution and probably increase the complexity of thermal maturation patterns in the Appala chian basin. Such studies may help to better understand the tectono-depositional framework of the basin, particularly along its eastern exposed margin, where such data can be projected into the eastward extension of the sedimentary succession beneath the Blue Ridge province.
REFERENCES CITED
Bridge, J., 1956, Stratigraphy of the Mascot-Jefferson City zinc district, Tenn.: U.S. Geological Survey Professional Paper 277, 76 p.
Bridge, J., and Hatcher, R.D., Jr., 1973, Geologic map of the New Market quadrangle, Tenn.: Tennessee Division of Geol ogy Geologic Map GM 155-SE, scale 1:24,000.
Cattermole, J.M., 1955, Geology of the Shocks Gap quadrangle, Tenn.: U.S. Geological Survey Geologic Quadrangle Map GQ-76, scale 1:24,000.
1958, Geology of the Knoxville quadrangle, Tenn.: U.S. Geological Survey Geologic Quadrangle Map GQ-115, scale 1:24,000.
1960, Geology of the Bearden quadrangle, Tenn.: U.S. Geological Survey Geologic Quadrangle Map GQ-126, scale 1:24,000.
1962, Geology of the Maryville quadrangle, Tenn.: U.S. Geological Survey Geologic Quadrangle Map GQ-163, scale 1:24,000.
-1966, Geologic map of the John Sevier quadrangle, KnoxCounty, Tenn.: U.S. Geological Survey Geologic Quadran gle Map GQ-514, scale 1:24,000.
Cook, F.A., Albaugh, D.S., Brown, L.D., Oliver, J.E., and Hatcher, R.D., Jr., 1979, Thin-skinned tectonics in the crystalline southern Appalachians; COCORP seismic reflec tion profiling of the Blue Ridge and Piedmont: Geology, v. 7, no. 12, p. 563-567.
Cook, F.A., Brown, L.D., Kaufman, S., and Oliver, J.E., 1983, The COCORP seismic reflection traverse across the Southern Appalachians: American Association of Petroleum Geolo gists Studies in Geology 14, 60 p.
Epstein, A.G., Epstein, J.B., and Harris, L.D., 1977, Conodont color alteration; an index to organic metamorphism: U.S. Geological Survey Professional Paper 995, 27 p.
Hamilton, W., 1961, Geology of the Richardson Cove and Jones Cove quadrangles, Tenn.: U.S. Geological Survey Profes sional Paper 349-A, 55 p.
Hardeman, W.D., 1966, Geologic map of Tennessee, east sheet: Nashville, Tenn., Tennessee Division of Geology, scale 1:250,000.
Harris, A.G., 1979, Conodont color alteration, an organo-mineral metamorphic index, and its application to Appalachian basin geology, in Scholle, P.A., and Schluger, P.R., eds., Aspects of diagenesis: Society of Economic Paleontologists and Mineralogists Special Publication 26, p. 1-16.
Harris, A.G., Harris, L.D., and Epstein, J.B., 1978, Oil and gas data from Paleozoic rocks in the Appalachian basin; maps for assessing hydrocarbon potential and thermal maturity (cono- dont color alteration isograds and overburden isopachs): U.S. Geological Survey Miscellaneous Investigations Map I-917-E, 4 sheets, scale 1:2,500,000.
Harris, L.D., and Bayer, K.C., 1979, Sequential development of the Appalachian orogen above a master decollement; a hypothesis: Geology, v. 7, no. 12, p. 568-572.
Harris, L.D., Harris, A.G., deWitt, W., Jr., and Bayer, K.C., 1981, Evaluation of southern Eastern Overthrust Belt beneath Blue Ridge-Piedmont thrust: American Association of Petro leum Geologists Bulletin, v. 65, no. 12, p. 2497-2505.
Hatcher, R.D., Jr., 1982, Hydrocarbon resources of the Eastern Overthrust Belt; a realistic evaluation: Science, v. 216, no. 4549, p. 980-982.
Keith, A., 1896a, Description of the Loudon sheet, Tenn.: U.S. Geological Survey Geologic Atlas, folio 16, scale 1:125,000.
1896b, Description of the Morristown sheet, Tenn.: U.S. Geological Survey Geologic Atlas, folio 27, scale 1:125,000.
-1901, Description of the Maynardville quadrangle, Tenn.:U.S. Geological Survey Geologic Atlas, folio 75, scale 1:125,000.
Milici, R.C., Harris, L.D., and Statler, A.T., 1979, An interpre tation of seismic cross sections in the Valley and Ridge of eastern Tennessee: Tennessee Division of Geology Oil and Gas Chart 6, 2 sheets.
Neuman, R.B., 1955, Middle Ordovician rocks of the Tellico- Sevier belt, eastern Tenn.: U.S. Geological Survey Profes sional Paper 274-F, p. F141-F178.
1960, Geology of the Wild wood quadrangle, Tenn.: U.S. Geological Survey Geologic Quadrangle Map GQ-130, scale 1:24,000.
References Cited D9

Neuman, R.B., and Wilson, R.L., 1960, Geology of the Block house quadrangle, Tenn.: U.S. Geological Survey Geologic Quadrangle Map GQ-131, scale 1:24,000.
Nicoll, R.S., and Gorter, J.D., 1984, Interpretation of additional conodont colour alteration data and the thermal maturation and geothermal history of the Canning Basin, Western Australia, in Purcell, P.G., ed., The Canning Basin, Western Australia: Geological Society of Australia and Petroleum Exploration Society of Australia Symposium, Perth, 1984, Proceedings, p. 411^25.
Roeder, D., Gilbert, O.E., and Witherspoon, W.D., 1978, Evolution and macroscopic structure of Valley and Ridge thrust belt, Tenn. and Va.: University of Tennessee, Depart ment of Geological Sciences, Studies in Geology 2, 25 p.
Schultz, A.P., and Anders, D.E., 1985, Schurflingsfensters in the
Pulaski thrust sheet and their implications for hydrocarbon potential [abs.]: American Association of Petroleum Geolo gists Bulletin, v. 69, no. 9, p. 1447.
Swingle, G.D., Harper, D.D., Palmer, R.A., and Milici, R.C., 1967, Geologic map of the Boyds Creek quadrangle, Tenn.: Tennessee Division of Geology Geologic Map 156-NW., scale 1:24,000.
Walker, K.R., Shanmugam, G., and Ruppel, S.C., 1983, A model for carbonate to terrigenous clastic sequences: Geo logical Society of America Bulletin, v. 94, no. 6, p. 700-712.
Woodward, N.B., ed., 1985, Valley and Ridge thrust belt; balanced structural sections, Pennsylvania to Alabama: Uni versity of Tennessee, Department of Geological Sciences, Studies in Geology 12, 64 p.
D10 Evolution of Sedimentary Basins Appalachian Basin ir US GOVERNMENT PRINTING OFFICE 1988 - 201-933 - 226/80023

