utilizing multi-sonographic measures in the detection of
TRANSCRIPT

Utilizing multi-sonographic measures in the detection of
clinically diagnosed carpal tunnel syndrome, compared to
nerve conduction studies: A pilot study
Undergraduate Thesis
By
Christine M Fahy, BA, RDMS
The Ohio State University
School of Health and Rehabilitation Science
Radiologic Sciences and Therapy Division
2012
Undergraduate Thesis Committee:
Kevin Evans, PhD, RT(R)(M)(BD), RDMS, RVS, FSDMS, Advisor
Nina Kowalczyk, PhD, RT(R)(QM)(CT), FASRT
Shawn C. Roll, PhD OTR/L, CWCE

ii
Abstract
Carpal tunnel syndrome (CTS) has shown increasing incidence rates over the last few
decades. This upward trend will likely continue, correlating with increases in contributing
factors, including obesity, diabetes, increased age, and occupational strain. Carpal tunnel
syndrome is generally diagnosed clinically but confirmed with nerve conduction studies (NCS).
The use of NCS as the gold standard has been argued in the literature, largely based on false
negative rates up to 34%. Additionally, the invasive and costly nature of NCS has prompted the
exploration of alternative methods. Sonography has shown great promise, reporting comparable
predictive values in current literature. Although sonography provides a cost-effective, well
tolerated, non-invasive evaluation, clearly identified methods for diagnosing and categorizing the
severity of CTS have not been established. The purpose of this pilot study was to determine if a
blended approach using sonographic and clinical indicators could improve the predictive value
and provide clinicians with a feasible alternative for diagnosing and categorizing the severity of
CTS. A retrospective case-control study was conducted to identify the most sensitive variables
and establish a severity classification method based on sonographic and clinical indicators.
Symptomatic subjects and asymptomatic controls were compared, as were variables amongst
NCS severity categories. Sonographic and clinical indicators associated with CTS included
increased cross-sectional area (CSA), abnormal longitudinal appearance and restricted excursion
of the median nerve, presence of classic and nocturnal symptoms, and positive provocative
testing. Ultrasound severity categorization using a combination of these indicators matched 63%
of NCS results, and 84% of asymptomatic controls were identified as normal using the scoring
system. This pilot data is a useful step in isolating salient variables that could be further explored

iii
in replicated studies with increased recruitment. Confirmatory studies may provide clinicians
with a holistic approach for the initial diagnosis and categorization of CTS.

iv
Table of Contents
Abstract ……………………………………………………………………………...ii
Acknowledgements ………………………………………………………………….v
List of Figures ……………………………………………………………………….vii
List of Tables ………………………………………………………………………..viii
Chapter I: Introduction
Background ………………………………………………………………….1
Significance of the Problem …………………………………………………3
Research Objective ………………………………………………………….4
Chapter II: Literature Review
Literature Review ……………………………………………………………6
Research Question …………………………………………………………..13
Chapter III: Methods and Analysis
Materials and Methods ……………………………………………………...14
Statistical Analysis ………………………………………………………….19
Chapter IV: Results
Demographics ……………………………………………………………….21
Subjects versus Controls …………………………………………………….21
Subjects versus NCS Severity Categorization ………………………………23
Sonographic Severity Categorization ……………………………………….25
Sonographic Severity versus NCS Categorization ………………………….25
Chapter V: Discussion ………………………………………………………………27
Chapter VI: Conclusion ……………………………………………………………..35
Appendices ………………………………………………………………………….38
References …………………………………………………………………………..53

v
Acknowledgements
Oscar Wilde is quoted as saying “success is a science; if you have the conditions, you get
the result”. I have had the great fortune to conduct research at The Ohio State University; an
institution known for providing the “conditions” so necessary for success. In addition to faculty
and staff that have promoted my success, I have been blessed with an amazing family that has
never faltered in their support and encouragement.
Although this project has been a labor of love, there has been an abundance of blood,
sweat, and tears shed along the way. The patience and dedication of my advisor, Dr. Kevin
Evans, has been invaluable. My successes are a reflection of his commitment and passion to the
Radiologic Sciences and Therapy Division and to our profession, and I look forward to
continuing our endeavors for years to come.
My family has also provided the “conditions” essential to my success. My husband,
Jamie, has picked me up and dusted me off more times than I can count, believing in me when I
didn’t believe in myself. Our children, Sean, Nicolas, and Ryan, have shared in the ups and
downs along the way. My sweet boys never complained about the long hours I’ve spent pouring
over data with articles spread out all over the dining room table. I am so grateful for my children;
they are my sun and my moon. The love and encouragement of my parents, Tim and Debbie
Burchfield, has also greatly contributed to my success. Thank you to each and every one of my
family for their support and love, I am only successful because I have you.
I am eternally grateful to the faculty and staff of the Radiologic Sciences and Therapy
Division within the School of Health and Rehabilitation Sciences. I would like to specifically
thank Rachel Pargeon, Kate Zale, Kevin Volz, Crissie Hutmire, and Brian Keller for their

vi
contributions and encouragement. Additionally, I would like to thank Dr. Shawn Roll and Dr.
Steffen Sammet for their collaboration and ground work in this venture.

vii
List of Figures
3.1 Subject Flow Chart ……………………………………………………………...15
3.2 Carpal Tunnel Anatomy …………………………………………………………17
4.1 Variable Frequencies in Subject and Control Groups …………………………..22
4.2 Subject Severity Based on NCS …………………………………………………24
4.3 Subject Severity Based on US Scoring ………………………………………….24
viii
List of Tables
3.1 CTS Indicators for US Severity …………………………………………………19
3.2 US Severity Categories ………………………………………………………….19
4.1 Subject and Control Variable Means ± SD and Significance …………………...21
4.2 Mean, SD, and Significance of Subject Variables (wrist level) Compared
to NCS Severity ……………………………………………………………..23
4.3 Subject Variable Percentages by NCS Severity …………………………………24
4.4 BMI and CSA Measurements by NCS and US Severity ………………………..25
4.5 Subject US and NCS Severity Category Percentage Agreement ……………….26

1
Chapter 1: Introduction
Background
Carpal tunnel syndrome (CTS) is the most common entrapment neuropathy and the most
common work-related musculoskeletal disorder. Although CTS is a known work-related injury,
idiopathic and secondary CTS are also frequent diagnoses. Regardless of the etiology, the
ensuing pathophysiology of the median nerve follows a similar path, resulting in CTS. Diagnoses
may rely on clinical evaluations, electrodiagnostic studies (EDX), or sonographic examinations
(US). The treatment of CTS varies according to severity, ranging from conservative treatments to
surgical interventions.
Carpal tunnel syndrome spans the globe, with general population incidence rates of 3.76
per 1000 person-years in the United States to 4.96 per 1000 person-years in Korea, with
incidence rates showing an increase over time.1,2
Increased incidence rates have been observed in
employed CTS patients as compared to unemployed CTS patients, and particular occupations are
considered at risk for developing work-related musculoskeletal injuries.3 Sonography is an
example of an at-risk occupation due to the frequency, duration, and nature of the examinations.
Studies have indicated approximately 65% of sonographers have experienced CTS symptoms
during their career and over 90% have reported working in pain.4-8
Although occupational factors
such as repetitive strain, vibration, and malpositioning increase the risk of CTS, over 50% of
CTS cases are idiopathic.9 Secondary CTS may result from conditions and diseases including
pregnancy, obesity, diabetes, thyroid disorders, rheumatoid arthritis, amyloidosis, trigger digit,
and cervical radiculopathy. Space occupying lesions or masses located within the carpal tunnel
may also cause secondary CTS.10-12

2
Repeated or endured compression and stress on the median nerve creates a cascade of
pathological responses, resulting in carpal tunnel syndrome. Elevated pressure and stress cause
impaired nerve perfusion, triggering ischemia and damage to the nerve-blood barrier within the
endoneurial capillaries. Leakage from the microvessels into the endoneurium leads to increased
pressure and edema. Edema initiates the inflammation process as fibroblasts infiltrate the region.
The ensuing fibrosis results in scar tissue formation, axonal injury, and localized demyelination.
Diffuse demyelination and Wallerian degeneration occur with prolonged stress.10-14
Symptoms
progress as the severity of the individual’s CTS increases. Early symptoms include intermittent
numbness, tingling, burning, or pain in the lateral palm, thumb, index and middle fingers.
Nocturnal symptoms may also occur, causing affected individuals to awaken from pain and
numbness. Symptoms progress to grip and digit awkwardness, constant numbness, and decreased
pain due to sensory loss as CTS severity increases. At the advanced stage of CTS, the patient
experiences muscle atrophy and increased weakness.1,4,10,11
Diagnosis of CTS often relies on a clinical diagnosis, confirmed by EDX testing.
Sonographic examinations have also proved useful for the evaluation of CTS. Clinical diagnosis
should include symptom specifics, such as location, characteristics, and provocative and
mitigating factors, and may include the use of functional status surveys (FSS) and symptom
severity surveys (SSS), such as the Boston Carpal Tunnel Questionnaire. Clinical diagnoses also
utilize physical testing including Phalen’s test, Reverse Phalen’s test, Tinel sign, carpal tunnel
compression test (with and without wrist flexion), and hand elevation test. Electrodiagnostic tests
include electromyography (EMG) and nerve conduction studies (NCS). Of the two, NCS is the
more commonly used EDX testing.10
Although EDX, more specifically NCS, has historically
been considered the gold standard for confirming CTS diagnosis, its use as the gold standard has

3
been debated within the research literature.1,15-17
Radiologic imaging, including sonography, has
also been incorporated as a diagnostic tool. Sonographic evaluations of CTS patients typically
evaluate the cross-sectional areas (CSA) of the median nerve at the proximal carpal tunnel.
Magnetic resonance imaging (MRI) and computed tomography (CT) has also been employed in
the diagnosis of CTS.
Treatment of CTS also varies according to the severity of the pathology. Conservative
treatment includes splinting, oral medications, and injections such as corticosteroids. In more
advanced CTS, surgery may be necessary. Carpal tunnel surgery involves the division of the
transverse carpal tunnel ligament to alleviate compression of the median nerve, and may be
performed either openly or endoscopically. Open carpal tunnel release is the most common
surgical method, and has shown high success rates.10
Although surgery usually has a high
success rate, some CTS patients may have persistent symptoms, requiring further evaluation.9,10
Significance of the Problem
Current trends in CTS risk factors will likely result in an increased prevalence of CTS.
Diabetes, obesity, an increasing life span, and occupational risks are several of the contributing
factors expected to increase the incidence rate.1,3,10
Research has indicated a prevalence rate of
diabetes and obesity twice as high in CTS patients than that found in the general population.3 As
these trends increase so too will the need for a reliable, non-invasive method of assessing and
diagnosing CTS. Clinical diagnosis, including symptoms and physical tests, has been shown to
have high predictive values, and has been utilized as the gold standard in several studies rather
than NCS.15,16,18
More commonly, a clinical diagnosis of CTS is followed by confirmatory EDX

4
studies. Electrodiagnostic studies are invasive, uncomfortable, time consuming, and costly.
Additionally, the results of EDX studies are questionable, including high rates of false-positives
and a wide range of sensitivities reported within the research.2,9,15-17,19
Sonography is widely available throughout the world and examinations are cost-
efficient, portable, and well tolerated by patients. The non-invasive nature and lack of radiation
makes sonography an ideal modality for repeat examinations. The sonographic evaluation of
CTS is commonly used but sensitivity rates have not consistently exceeded those of NCS.
Evaluation of the CSA of the median nerve has been reported as beneficial for sonographically
assessing CTS.9,10,12,15,18-24
It has been proposed that sonography may replace NCS as a first-line
test to confirm clinically diagnosed CTS, potentially eliminating the need for NCS in over 50%
of the patients.15,18
Evaluating multiple variables, both sonographic and clinical CTS indicators,
may provide a more inclusive assessment of physiologic changes in the median nerve and the
most accurate representation of the patient’s pathology.
Research Objective
An increase in sensitivity, specificity, and predictive value rates is necessary before
implementing the wide-spread use of sonography as a first-line diagnostic tool for CTS. The
current trend in sonographic investigation of CTS focuses primarily on median nerve CSA
however a multivariate approach may add value to the sonographic examination. Because of the
complex cascade of pathological effects observed in the development and advancement of CTS,
multiple factors should be assessed. Specifically, the median nerve should be evaluated for an
increased CSA, abnormal longitudinal appearance, restricted excursion, and intraneural

5
vascularity. By assessing multiple variables in addition to the CSA, sonographic evaluation
efficacy may match the gold standard of diagnosis provided by NCS in the detection and
evaluation of clinically diagnosed CTS.

6
Chapter 2: Literature Review
As mentioned previously, clinical diagnosis relies on patient history, specifically
symptom characteristics, and physical testing (Phalen’s, Reverse Phalen’s, Tinel, carpal tunnel
compression, hand elevation). It is not uncommon for research studies to refer to clinical
diagnosis as the gold standard in lieu of NCS. A general population study in Korea, including
97% of the population, reported 80% of CTS patients did not undergo electrodiagnostic testing
(EDX), with medical practitioners relying solely on clinical diagnosis.2 The presence of multiple
primary symptoms of CTS has been found to have a high predictive value.15-18
Although some
studies have indicated relatively low sensitivities and specificities for individual clinical tests,25
an increase in their predictive value when combined with other clinical indications and testing
has been reported, with sensitivity rates as high as 99%.15-18
Electrodiagnostic studies are often used to confirm clinically diagnosed CTS. Nerve
conduction studies evaluate the function of the median nerve, measuring the sensory and motor
latencies, amplitudes, and velocities of the median nerve. Because EDX requires needles to be
inserted into the upper extremity, it is considered an invasive and uncomfortable procedure.
Nerve conduction studies are also costly; with a reported cost twice that of a sonographic
examination.15
While it is often referred to as the gold standard in research, its added value for
clinically diagnosed CTS has been questioned.15
Nerve conduction studies have consistently
reported higher sensitivity ratings than sonography, however false-positives and false-negatives,
especially in asymptomatic patients or cases of mild CTS, plague the use of NCS.15-17,24
False-
positive rates ranging from 10-20% and false-negative rates of 16-34% in clinically diagnosed
CTS patients have been reported. Similarly, it has been reported that less than 50% of
asymptomatic patients had positive NCS findings.16,24
Sonography has been proposed as an

7
alternative to NCS as a confirmatory tool for CTS, with hopes of a well-tolerated examination,
reduced medical expenses, and a diagnostic findings equal to or greater than those of NCS.
The majority of sonographic evaluations have relied on the CSA of the median nerve to
evaluate the presences of CTS, with increasing areas correlating to an increase in severity.20,24
Edema is one aspect of compressive neuropathies, resulting in the swelling of the median nerve
at the carpal tunnel inlet. The flexor retinaculum flattens the median nerve as it travels through
the carpal tunnel. As the median nerve exits the carpal tunnel distally it again takes on a swollen
appearance. The cross-sectional imaging of the median nerve allows the area to be calculated
using either direct trace methods or anteroposterior and mediolateral diameters. Cross-sectional
area has been found to correlate well with both patient-oriented parameters, such as the Boston
Carpal Tunnel Questionnaire, and with NCS findings.24
In a meta-analysis of 19 prospective
studies (3131 wrists) comparing sonography to clinical and NCS diagnoses, Fowler et al.15
reported sonography had a sensitivity and specificity of 77.6% and 86.8%, respectively, when
evaluating CSA. Sensitivities ranged from 57-98% and specificities ranged from 63-100%. The
authors concluded the accuracy of sonographic evaluation may improve with higher CSA cut-off
values employed.
The location for imaging CSA varies within the research as does location definitions.16,22
Cross-sectional areas have been imaged proximal to the carpal tunnel, at the carpal tunnel inlet,
and distal to the carpal tunnel, as well as in the forearm. Common verbiage describing imaging
locations include carpal tunnel inlet, proximal carpal tunnel, distal carpal tunnel, carpal tunnel
outlet, and at the wrist crease (also using locators such as distal, mid, and proximal). The location
is often identified by the carpal bones, such as the level of the pisiform, but this too varies within
research.16
The location may affect the significance of the findings. Rahmani et al.19
determined

8
there were significant differences between CTS patients and controls when the CSA was
acquired at the wrist but when imaged at the forearm there were no differences between the
groups. Akcar et al.21
found statistically significant differences between CTS and control groups
when the CSA was acquired at “mid-level”, located at the level of the pisiform, but the CSA
acquired proximal to the carpal tunnel inlet was not found to be a “clinically important
predictor”. A systematic review conducted by Roll et al.25
postulated the pisiform would identify
the level of the mid-carpal tunnel because of the distal arching of the proximal row of carpal
bones. Roll suggested using the distal radial-ulnar joint, pisiform, and hamate as the carpal
tunnel inlet, mid-carpal tunnel, and outlet, respectively. The most accurate CSA measurements
were at the level of the pisiform, followed by CSA measurements immediately proximal to the
inlet. Measurements at the distal carpal tunnel had the lowest accuracy, with a sensitivity rate
ranging from 18-65%.25
Area differences between the CSA values proximal to and within the
carpal tunnel has shown diagnostic accuracy in confirming CTS. Akcar evaluated the CSA area
difference between the level of the pisiform (CSAb) and proximal to the carpal tunnel (CSAa).
Using a cut-off value of 3.65, CSA area difference (CSAb-CSAa) reported 83% sensitivity and
82% specificity.21
Although the level at which the measurements are acquired has been debated, an
increased CSA is considered a consistent criterion.9,10,12
Padua et al. found a significantly strong
positive relationship between increasing CSA values and the increasing severity of clinical
impairment in CTS patients (r=0.80, p<0.0000001).20
El Miedany et al.24
also evaluated CSA
values to propose a severity grading system based on a strong correlation between increasing
CSA levels and EMG and clinical findings. The authors proposed a CSA of 10-13mm² as mild,
13-15mm² as moderate, and greater than 15mm² as severe.24
Optimal cut-off points have varied,

9
ranging from 9mm² to 15mm² throughout the research.6,9,12,15,16,18,21-24
Cross-section area has
proven to be valuable in the assessment of CTS, however varying cut-off points have affected the
comparison of sensitivity ratings.
Excursion is a measure of the distance traversed by the median nerve as it glides through
the nerve bed during flexion and extension movements. As the nerve bed is elongated, stress and
strain of the median nerve occur. Increased strain negatively impacts conduction and blood flow
within the nerve, leading to nerve injury.14,26
In addition to nerve bed elongation during
movement, physiologic changes occurring in CTS may invoke an increased strain on the median
nerve. 9,11,13,14,26
Inflammation of the median nerve impedes movement through the carpal
tunnel. Collagen deposition and fibrosis may cause thickening of the connective tissue, impairing
nerve gliding. Fibrosis and scarring can also cause adhesion of the median nerve to surrounding
tissue, reducing excursion by a tethering effect.
Studies have indicated specific positions and movements evoke specific excursion
reactions. Forearm supination results in a greater excursion than pronation,27
extension results in
a greater excursion than flexion, 27,28
and distal excursion results from extension rather than
flexion.26,27,29-31
Median nerve excursion measurements have varied in the research. Wright et al.
observed a 9.2mm excursion upon wrist extension in cadavers.26
Lower excursion rates in
healthy individuals were demonstrated by the Dilley et al. and Echigo et al. in vivo studies,
ranging from 2.6-6.0mm and 1.8-3.0mm upon wrist extension, respectively.27,30,32
Two
sonographic modes commonly used to evaluate longitudinal median nerve excursion are spectral
Doppler and frame-by-frame cross-correlation analysis. Doppler imaging encompasses capturing
the longitudinal excursion test movements and correlating Doppler waveforms. The extension
phases of the test movements are traced, resulting in velocity time integrals (VTI) representing

10
the median nerve excursion. The VTI are calculated in pixels and then converted into millimeters
using programs such as Excel.28,33
The accuracy of the Doppler technique is approximately
±0.7mm, and the test-retest reliability had an intraclass correlation coefficient of 0.92.28,33
Cross-
correlational analysis entails imaging the excursion with a frame rate approximately 10 frames
per second. A region of interest (ROI) is selected and fine structures are marked within the ROI.
Pixel gray levels within the region are evaluated in adjacent frames, with pixel shifts
corresponding to nerve excursion. To increase the accuracy, frame intervals are increased and
analysis is carried out with 1-3 frames between the compared frames. In vivo measurements
were found to be reliable measuring movement with less than a 10% error.32
It has been hypothesized that excursion rates would be reduced in CTS patients as
compared to controls. Hough28
reported a significantly lower excursion rate; however Erel et al.
29
found no significant difference between CTS patients and controls. This difference in significant
findings may be due to the varying methods utilized in the studies. Employing the Doppler
technique, Hough measured excursion with the transducer placed longitudinally at the carpal
tunnel, with the Doppler sample volume indicator at the location of the lunate-capitate
intercarpal joint. From a starting position of either a fully extended or 90˚ flexed elbow, wrist
extended 30˚, and fingers fully flexed, excursion was measured as the fingers extended to the
maximal allowed amount. Erel measured excursion employing frame-by-frame cross-correlation
with the transducer placed 5-15cm proximal from the distal wrist crease. From a starting position
with the elbow fully extended and the wrist in neutral, the fingers were extended from a 90˚
flexion to neutral. With both the wrist and the elbow started in an extended position, Hough
found a significant reduction of excursion in CTS patients (8.3mm) compared to controls
(11.2mm). With the wrist in neutral and the elbow extended, Erel did not find a significant

11
reduction in median nerve excursion in CTS patients (2.2mm) compared to controls (2.6mm). It
is unclear if the positioning differences or the measurement techniques could be responsible for
the disagreement between the two studies.28,29
Blood is supplied to the median nerve by the radial and ulnar arteries and supply from a
persistent medial artery is a normal variant. As the median nerve courses through the carpal
tunnel, blood flow is also supplemented by the superficial palmar arch. Injury to the microvessels
within the endoneurium results from endured compression and strain, causing ischemia and
venous congestion. Edema and inflammation trigger an increased blood flow to the area, further
increasing the pressure within and surrounding the carpal tunnel. As inflammation of the nerve
ensues, longitudinal images of the median nerve demonstrate a “notched” appearance as the
nerve passes under the flexor retinaculum. This abnormal appearance of the median nerve has
been employed for the evaluation of CTS. Kele et al.34
observed 50% of patients had longitudinal
compression signs and 39 patients had bulbous nerve swelling. Longitudinal compression had
50% sensitivity and 100% specificity. Wang et al.35
introduced a semi-quantitative scale to
evaluate longitudinal compression sign (LCS), using grades 0-3 to categorize the distortion. A
significant difference between subjects and controls (p < 0.001) was reported, with sensitivity
and specificity rates of 50.0% and 95.8%, respectively.
Hypervascularity at the carpal tunnel inlet is a common presentation in CTS patients.
Rahmani et al.19
evaluated hypervascularity using color Doppler in CTS patients with clinical
presentations but normal EDT findings, reporting a significantly higher hypervascularity in CTS
patients compared to controls [odds ratio (OR) 5.004]. Only intraneural hypervascularity was
considered abnormal, differentiating hypervascularity from normal perineural and prominent
median artery vascularity. Mallouhi et al.22
reported similar findings with a 91% accuracy for

12
detecting CTS compared to NCS when evaluating hypervascularization with color Doppler
sonography. Of the 5 sonographic criteria employed, hypervascularization had the highest
sensitivity, positive predictive value, and negative predictive value (95%, 94%, and 75%,
respectively).
Improvements in predictive values have been made by employing multivariate
sonographic examinations. Rahmani et al.19
evaluated median nerve CSA, echogenicity, and
vascularity in clinically-evidenced CTS patients with normal NCS findings. Using multivariate
linear regression analysis, the probability of having clinically-evidenced CTS improved as more
sonographic signs were identified. With identification of one sign the probability was 35%, with
two it increased to 70%, and with three signs identified the probability increased to 90%.
Mallouhi et al.22
also conducted multivariate examinations to evaluate sonographic predictors of
CTS. Of 153 CTS wrists, the presence of both hypervascularity and increased CSA were found
in 89% of the wrists compared to 9% having only one of the two signs. Similar improvements
were shown by Rempel et al.17
upon evaluation of specificities of clinical findings. Specificity
increased from 76% with the presence of positive physical examinations to 99% with the
presence of positive physical examinations, classic or probable symptoms, and night symptoms.
Altinok et al.36
also reported increased sensitivity, specificity, and overall accuracy by evaluating
multiple variables. The authors determined the most sensitive variables for diagnosing CTS were
swelling ratio (72.5%), CSA at the pisiform level greater than 9mm² (65%), and palmar
displacement (62.5%). When two out of the three criteria were present, the sensitivity increased
to 95% in identifying moderate CTS and had an overall accuracy of 83.3% for properly
classifying normal, mild, and moderate CTS groups. Given that cross-sectional area, longitudinal
appearance, excursion, and intraneural vascularity have not been combined as diagnostic

13
parameters to evaluate CTS, multivariate evaluations may prove valuable as a set of diagnostic
criteria for detecting and staging the severity of CTS.
Research Question
Since the use of multiple sonographic measures to diagnose and categorize the severity of
CTS has rarely been addressed in the literature, a gap exists. This study was proposed to address
this gap with the following research question:
Will the sonographic evaluation of multiple carpal tunnel syndrome indicators, including
increased cross-sectional area, abnormal longitudinal appearance, restricted excursion, and
intraneural vascularity of the median nerve, aid in the detection and severity categorization of
carpal tunnel syndrome?
By investigating this research question, information may be attained that will expand the scope
of sonographic evaluation of carpal tunnel syndrome.

14
Chapter 3: Methods and Analysis
Materials and Methods
Patients
A retrospective, age and gender matched case-control study was conducted from May
2010 through October 2011. A convenience sample of 38 wrists included 13 symptomatic
subjects (19 wrists) and 13 asymptomatic controls (19 wrists). (Figure 3.1) The subjects and
controls were matched by examination age within 36 months, gender, and wrist, with the
exception of one subject matched to the control’s contralateral wrist. Individuals were excluded
if a history of uncontrolled diabetes, fractures affecting the carpal tunnel region, previous carpal
tunnel release surgery, or current pregnancy was indicated in the medical history. Individuals
with bifid median nerves or space occupying mass in the carpal tunnel were also excluded.
Symptomatic subjects had sonographic evaluations performed immediately following NCS by a
sonographer blinded to the NCS results. Physical examinations and severity surveys were also
completed at the time of sonography. Evaluations were performed at The Ohio State University’s
Cramblett Outpatient Clinic Nerve Conduction Clinic in Columbus, Ohio. The research study
was granted approval by The Ohio State University’s Biomedical Institutional Review Board.
Nerve Conduction Studies
Nerve conduction studies were considered the gold standard to determine the presence
and severity of CTS. Both positive and negative findings were included in the study, and the
sonographer was blinded to the NCS results. Carpal tunnel syndrome severity was categorized as
normal, mild, moderate, or severe, using guidelines set by The Ohio State University Nerve
Conduction Clinic based on standards established by the American Association of

15
Figure 3.1 Subject Flow Chart
Assessed for CTS:
33 wrists
29 symptomatic wrists
17 Subjects:
12 Bilateral symptoms
5 Unilateral symptoms
24 symptomatic wrists
19 symptomatic wrists: 12 right wrists
7 left wrists
4 asymptomatic wrists
Exclusion criteria:
3 Bifid median nerves
1 CT release surgery
1 ulnar neuropathy
5 unmatched wrists

16
Neuromuscular and Electrodiagnostic Medicine (AANEM). Subjects with sensory values of No
Response (NR) were automatically categorized as severe. For comparative purposes, values were
assigned to the NCS severity categories as follows: 1-normal, 2-mild, 3-moderate, 4-severe.
Clinical Examination
Individuals were physically examined prior to the sonographic evaluation. Height and
weight were attained and the BMI was calculated accordingly. As a precursor to nerve excursion
evaluation, maximum extension of the wrist was documented. With the forearm resting medially
on a table, test subjects were asked to extend the wrist as far as possible. A goniometer was used
to measure the angle between the lateral forearm at the radial stylus process and the index finger
to determine the maximum range of motion (ROM) angle. Provocative testing, including
Phalen’s, Tinel, and Durkan testing, was performed. Testing was considered positive if the
individual experienced pain, tingling, or numbness in the hand or wrist within one minute. All
individuals completed questionnaires pertaining to symptom and functional status severity. From
the completed questionnaire, the absence or presence of classic symptoms and nocturnal
symptoms were documented. Classic symptoms were considered present if the individual had
symptoms of numbness, tingling, and/or pain in the hand or wrist within two weeks prior to
evaluation. Nocturnal symptoms were considered present if pain, numbness, and/or tingling
woke the individual more than once in the two weeks prior to evaluation.
Sonographic Evaluation
The median nerve was imaged in transverse and longitudinal planes using high-resolution
real-time sonography. Individuals were positioned with the forearm supine, the elbow semi-
flexed, and the fingers and the wrist in a neutral position. Evaluations were performed using a

17
GE Logiq i hand-carried sonographic machine and an 8-12.0 MHz, 43mm linear array transducer
(GE Healthcare Clinical Systems, Wauwatosa, Wisconsin). Imaging was performed using the
musculoskeletal (MSK) preset, harmonics, and CrossXBeam technology.
The median nerve CSA evaluations were performed in a transverse plane at the carpal
tunnel inlet (CSAa) and mid carpal tunnel (CSAb), using the distal radial-ulnar joint and
pisiform as anatomical landmarks, respectively. (Figure 3.2) A direct trace method was used to
record the CSA, with tracings performed within the epineurium. (Appendix III) Five CSA
measurements were attained at both levels; the highest and lowest values were discarded with the
remaining three values averaged to determine the mean CSA. Using the CSA means from both
locations, the largest CSA (CSAmax) was also recorded. A cut-off value of 10mm² was
considered abnormal. Additionally, the CSA area difference was calculated between CSAa and
CSAb, with an absolute value difference greater than 3.65 considered abnormal.
Figure 3.2 Carpal Tunnel Anatomy at the Level of the Pisiform (European Society of Musculoskeletal Radiology. Musculoskeletal Ultrasound Technical Guidelines, http://www.essr.org/html/img/pool/wrist.pdf)

18
Longitudinal appearance, excursion, and intraneural vascularity were evaluated in a
longitudinal plane over the carpal tunnel region. (Appendix III) The longitudinal appearance of
the median nerve was evaluated for signs of enlargement and compression by the flexor
retinaculum. Proximal and distal enlargement and compression were subjectively categorized as
present or absent. Cine clips of excursion were obtained at the proximal carpal tunnel inlet using
gray-scale sonography. Beginning in the aforementioned starting position, the individual was
instructed to slowly extend the wrist from neutral to the maximal extension angle. This maximal
amount was assumed to be the same degree of extension as measured with the goniometer prior
to sonographic examination. Forward (distal) movement of the median nerve was evaluated
using frame-by-frame analysis of the cine clip. Landmarks within the median nerve and carpal
tunnel were used to subjectively categorize the excursion as normal or restricted. To evaluate
intraneural vascularity within the median nerve, the nerve was imaged using both gray-scale and
Doppler sonography. Color Doppler PRF ranged from 0.4-0.6 KHz, depending on the subject.
Spectral Doppler was used to evaluate vascularity. Intraneural vascularity was categorized as
present or excluded using the following exclusion criteria, developed by Evans et al.37
: 1) Must
demonstrate at least 3 cardiac cycles in the sample, 2) must have the spectral Doppler gate
positioned within the median nerve, 3) must have more than pulsatility in the spectral tracing, 4)
must have an optimized gray scale image, 5) must have a signal greater than noise ratio, and 6)
must have a color pixel within the spectral Doppler gate.
Sonographic Severity Categorization
A scoring matrix was developed incorporating multiple sonographic and clinical CTS
indicators to categorize the CTS severity. Carpal tunnel syndrome severities were categorized as

19
normal, mild, moderate, and severe. Categories were assigned the same values as the NCS
categories for comparative purposes (normal-1, mild-2, moderate-3, severe-4). Subjects and
controls were both scored and categorized. Categories were assigned according to the number of
positive CTS indicators (normal=0-1, mild=2-4, moderate=5-7, severe=8-9). (Table 3.1, 3.2)
Statistical Analysis
Mean values, ranges, and standard deviations (SD) were calculated for age, BMI, CSAa,
CSAb, CSAmax, CSA area difference, and ROM. Data entry and statistical analysis was
performed using Microsoft Excel 2010 and SPSS Version 19 for Windows (Chicago, IL).
Binomial statistics were coded using 1 for normal (negative), 2 for abnormal (positive), and 0 for
excluded or missing values. Student t tests (two-tailed, assuming unequal variances) were
performed to compare independent variables between subject and control groups. Spearman
correlations and Student t tests (two-tailed, assuming equal variances) were performed to
determine the association and statistical significance between subject independent variables (age,
CATEGORY SEVERITY POSITIVE MARKERS
1 Normal 0-1
2 Mild 2-4
3 Moderate 5-7
4 Severe 8-9
Sonographic and Clinical Indicators
CSAmax > 10mm²
CSAmax > 13mm²
CSAmax > 15mm²
Longitudinal Compression
Proximal Enlargement
Restricted Excursion
Positive Provocative Test
Classic Symptoms Present
Nocturnal Symptoms Present
Table 3.1 CTS Indicators for US Severity
Table 3.2 US Severity Categories

20
BMI, CSAa, CSAb, CSAmax, CSA area difference, ROM) and NCS severity. Chi-square
analysis was used to calculate the agreement between sonographic (US) and NCS severity
categories. P values > 0.05 were considered statistically significant. Strength of association was
considered weak (< 0.3), moderate (0.3-0.7), or high (> 0.7).38

21
Chapter 4: Results
Demographics
The subject cohort consisted of 13 individuals (9 female, 69.23%). Symptoms were
bilateral in 6 subjects and unilateral in 7, for a total of 19 wrists. Subject age ranged from 23-62
years (mean age, 43.85 ± 10.71 years) at the time of the examination. The control cohort
consisted of 13 individuals (9 female, 69.23%) and 19 wrists. Control age ranged from 23-61
years (mean age, 43.84 ± 10.02 years) at the time of the examination. Mean subject BMI (30.39
± 9.55) and control BMI (27.72 ± 5.09) were not significantly different (p>0.05). (Table 4.1)
Subjects versus Controls
Mean CSA measurements were significantly increased in subjects as compared to control
CSA values (Table 4.1, Figure 4.1). The mean CSAa (13.00 ± 3.91mm2) and CSAb (12.98 ±
3.24mm2) in subjects was statistically significant compared to CSAa (9.52 ± 3.25mm
2) and
CSAb (8.86 ± 2.89mm2) in controls (p<0.01 and p<0.0001, respectively). Additionally,
Table 4.1 Subject and Control Variable Means ± SD and Significance, reported as mean ± SD
Variable Subject Control p=
Age, years 43.85 ± 10.71 43.46 ± 10.95 0.93
% Female 69.23% 69.23%
BMI 30.39 ± 9.55 27.72 ± 5.09 0.38
CSAa, mm² 13.00 ± 3.91 9.52 ± 3.25 < 0.01
CSAb, mm² 12.98 ± 3.24 8.86 ± 2.89 < 0.001
CSAmax, mm² 14.76 ± 3.86 10.36 ± 3.35 <0.001
CSA Area Difference, mm² 3.53 ± 2.78 2.35 ± 1.95 0.14

22
CSAmax was significantly increased in subjects (14.76 ± 3.86) compared to controls (10.36 ±
3.35mm²) (p<0.001). Using a cut-off value of 10mm2, 84.21% of subjects had a CSAmax over
the cut-off value compared to 52.63% of controls. The difference between subjects and controls
increased as the CSAmax increased to more than 15mm2, 47.37% of subjects compared to 5.26%
of controls. The mean CSA area difference was not found to be significantly different between
the two groups (p>0.05).
While none of the controls presented with abnormal longitudinal median nerve
appearance, 52.63% of subjects had at least one abnormal presentation. Of the three evaluated,
compression was the most frequent (52.63%), followed by proximal enlargement (42.11%) and
distal enlargement (10.53%). Controls had a greater percentage of intraneural vascularity
compared to subjects, 63.16% and 52.63%, respectively. Restricted excursion was observed in
Figure 4.1 Variable Frequencies in Subject and Control Groups
0
2
4
6
8
10
12
14
16
18
Subject (n=19)
Control (n=19)

23
26.32% of subjects and was only observed in subjects with a CSAmax greater than 15mm2.
Range of motion (ROM) and excursion were not evaluated in the control cohort. Clinical
evaluation included provocative testing and symptom presentations. Provocative testing was
normal in all controls and none experienced classic or nocturnal symptoms. By comparison,
42.11% of subjects had at least one positive provocative test, 84.21% experienced classic
symptoms, and 57.89% reported nocturnal symptoms. (Appendix VII)
Subjects versus NCS Severity
At the wrist level analysis, mean subject age and BMI were slightly higher than the
individual level due to the increased sample (13 individuals compared to 19 symptomatic wrists),
with a mean subject age of 43.89 ± 9.68 and BMI of 32.03 ± 10.08. Increases in subject BMI,
CSAa, CSAb, and CSAmax had statistically significant moderate associations with increasing
severity based on NCS (Table 4.2). Age, CSA area difference, and ROM had weak associations
with increasing severity, and of the variables CSA area difference was not significant (p>0.05).
VARIABLE MEAN (±SD) p= r=
Age, years 43.89 (9.68) <0.01 0.24
BMI 32.03 (10.08) <0.01 0.60
CSAa, mm2 13.00 (3.91) <0.01 0.36
CSAb, mm2
12.98 (3.24) <0.01 0.53
CSAmax, mm2 14.76 (3.86) <0.01 0.49
CSA Area Difference (CSAb-CSAa), mm2 3.53 (2.78) 0.25 0.24
ROM, degrees 48.53 (14.94) <0.01 -0.20
Table 4.2 Mean, SD, and Significance of Subject Variables (wrist level) Compared to NCS Severity

24
Table 4.3 Subject Variable Percentages by NCS Severity
Based on NCS, severity categorization resulted in 2 normal, 7 mild, 4 moderate, and 6
severe CTS subjects. (Figure 4.2) Subject BMI increased with severity, increasing from 21.55 in
normal subjects to 39.62 in severe subjects, as did CSAb, increasing from 9.92 ± 0.09mm² in
normal subjects to 14.94 ± 2.85mm² in severe subjects. (Table 4.4) Severe CTS subjects had the
highest percentage of sonographic variables, and the majority of severe subjects had a CSAmax
greater than 15mm2 (83.33%). Restricted excursion was only observed in moderate and severe
subjects. (Table 4.3)
Figure 4.2 Subject Severity Based on NCS Figure 4.3 Subject Severity Based on US Scoring
2
7
4
6
NCS Subject Severity
Normal
Mild
Moderate
Severe
1
7
6
5
US Subject Severity
Normal
Mild
Moderate
Severe
Variable Normal (n=2) Mild (n=7) Moderate (n=4) Severe (n=6)
CSAmax > 10mm2 50.00% 85.71% 75.00% 100.0%
CSAmax > 13mm2 50.00 42.86 75.00 83.33
CSAmax > 15mm2 50.00 14.29 50.00 83.33
Compression 50.00 42.86 50.00 66.67
Proximal Enlargement 50.00 14.29 50.00 66.67
Restricted Excursion 0.00 0.00 25.00 66.67
Provocative Testing Excluded 14.29 75.00 66.67
Classic Symptoms 50.00 100.0 100.0 66.67
Nocturnal Symptoms 50.00 28.57 100.0 66.67

25
Sonographic Severity Categorization
A scoring matrix incorporating sonographic and clinical CTS indicators was used to
categorize severity. (Table 3.1, 3.2) Based on the scoring, US severity categorization resulted in
1 normal, 7 mild, 6 moderate, and 5 severe CTS subjects. (Figure 4.3) Mean CSAmax increased
with severity, increasing from 11.69mm² in normal subjects to 18.80 ± 2.01mm² in severe CTS
subjects. Mean BMI, CSAa, and CSAb also increased with severity when normal values were
excluded.
Sonographic Severity versus NCS Severity
An overall agreement of 63.16% was observed between US and NCS severities, and the
level of agreement was determined to be statistically significant using chi-square analysis
Severity n= BMI CSAa CSAb CSAmax
Normal
NCS 2 21.55 ± 4.17 12.60 ± 7.90 9.92 ± 0.09 14.02 ± 5.89
US 1 29.50 ± 0 11.36 ± 0 11.69 ± 0 11.69 ± 0
Mild
NCS 7 28.37 ± 2.92 11.45 ± 1.82 11.80 ± 2.74 12.49 ± 2.40
US 7 27.04 ± 4.35 10.67 ± 2.41 11.38 ± 3.02 12.07 ± 2.82
Moderate
NCS 4 32.30 ± 8.29 12.48 ± 3.66 13.66 ± 4.09 14.93 ± 4.34
US 6 28.18 ± 4.88 12.24 ± 3.21 13.67 ± 3.64 15.04 ± 3.51
Severe
NCS 6 39.62 ± 13.39 15.29 ± 4.55 14.94 ± 2.85 17.54 ± 3.42
US 5 44.14 ± 12.20 17.49 ± 3.32 14.66 ± 2.83 18.80 ± 2.01
Table 4.4 BMI and CSA Measurements by NCS and US Severity, CSA reported as mean ± SD in mm²
26
Table 4.5 Subject US and NCS Severity Category Percentage Agreement
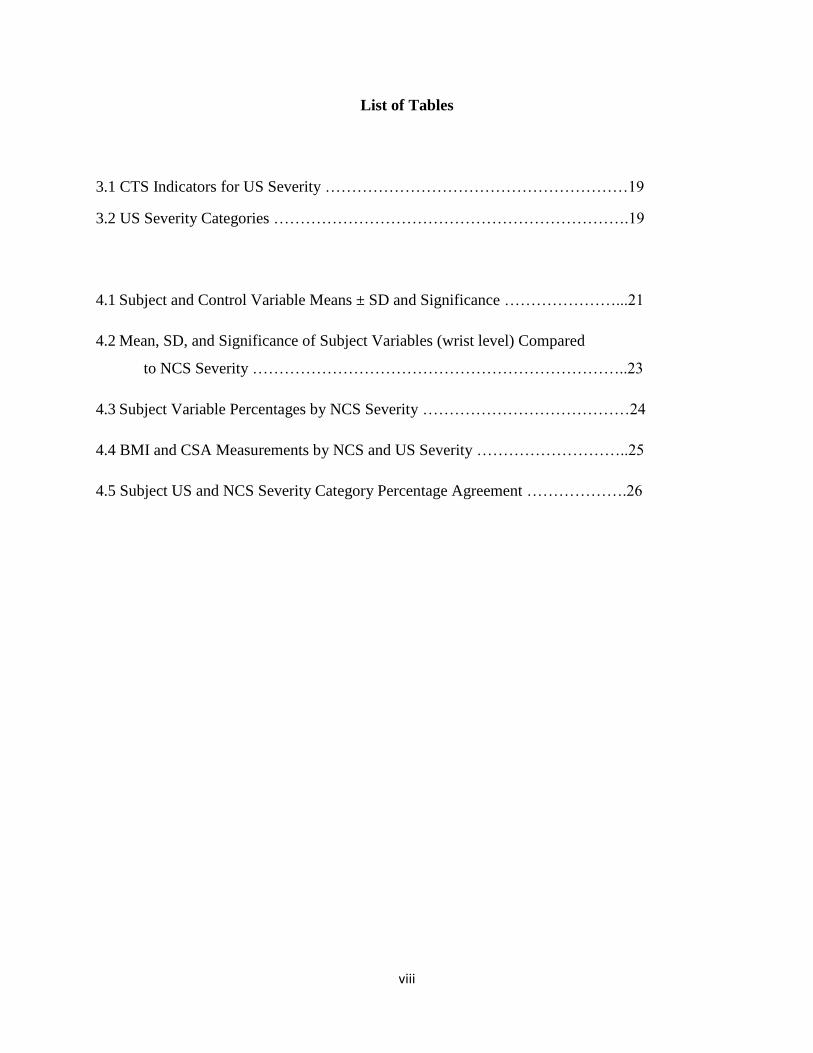
(p<0.05). The highest agreements were observed in mild (71.43%) and moderate CTS subjects
(75.00%). Normal subject severity according to US did not agree with NCS severity, with US
scoring categorizing one subject as mild and one as moderate. The majority of mild subject
severity agreed (5/7) and both subjects not in agreement had an US severity of moderate. The
majority of moderate subjects were also in agreement (3/4), with one scored as severe by US
severity. Although severe CTS subject severity agreed between NCS and US in 66.67%, this
category had the most disagreement between categorization. The two subjects not in agreement
were scored as one normal and one mild by US severity. (Appendix X) Five of the seven subjects
with differing NCS and US severities had missing values, including excursion, provocative
testing, and symptom presentations. (Appendix X) Agreement increased between US and NCS
severity when subjects with missing values were excluded, reaching an overall agreement of
85.71%. (Table 4.5)
NCS Normal NCS Mild NCS Moderate NCS Severe Total
All Subjects (n=19)
0/2 (0.00%) 5/7 (71.43%) 3/4 (75.00%) 4/6 (66.67%) 12/19 (63.16%)
Less subjects with excluded
variables (n=14) Excluded 5/6 (83.33%) 3/4 (75.00%) 4/4 (100.0%) 12/14 (85.71%)

27
Chapter 5: Discussion
Historically, clinical evaluation and electrodiagnostic testing have been used to detect and
stage the severity of CTS. Over the past two decades, the use of ultrasound to evaluate CTS has
made many advances but has yet to surpass NCS, especially in the staging of CTS severity. The
purpose of this study was to explore the use of multiple CTS indicators, blending both qualitative
and quantitative variables, as a means for detecting and staging the severity of CTS.
A multitude of variables were evaluated to assess the difference between subjects and
controls as well as the difference between NCS severity categories. Cross-sectional area was
found to be useful in evaluating CTS, with significant differences observed between subjects and
controls. This included the CSA at the proximal and mid carpal tunnel as well as the largest CSA
measure (p<0.01). A moderately significant positive correlation was also found between these
measures and NCS severity. Of the studies evaluated in Roll’s systematic review, the CSA at the
level of the pisiform was the most commonly used and the most accurate measure.25
Similarly,
the present study concluded the CSA at the level of the pisiform (CSAb) had the strongest
correlation with CTS severity. Although this mid tunnel measurement may be the most
indicative, other CSA measures may be necessary for a thorough evaluation. As explained by
Roll,25
the carpal tunnel may not accommodate for swelling within the tunnel and swelling may
occur just proximal to the tunnel instead. Ziswiler et al.39
identified the largest CSA within the
carpal tunnel region, reporting high concordance between the largest CSA measurement and
NCS. The present study also used the largest CSA measurement, although this was determined as
the largest of the proximal and mid carpal tunnel CSA means. Employing the largest CSA
measure aided in the proper assessment of subjects by US; three out of four subjects with
pisiform-level CSA measurements less than 10mm2 and proximal tunnel CSA measurements
28
greater than 10mm2 were correctly staged by US with mild CTS. Of the CSA parameters
evaluated, CSA area difference was not found to be helpful in evaluating CTS. Unlike Akcar’s
findings,21
a lack of significance was observed between subjects and controls and with increasing
NCS severity in the current study.
Longitudinal appearance of the median nerve is seldom reported in the literature. As
previously mentioned, the carpal tunnel may not accommodate an inflamed median nerve and a
notched or hourglass appearance may be observed when the nerve is imaged longitudinally.
Studies have reported longitudinal compression sign (LCS) sensitivities ranging from 50-91.7%
and specificities ranging from 62.5-100%, concluding that LCS is a useful sonographic variable
for evaluating CTS.34,35
In concordance with these findings, over half of the subjects (52.63%)
had observed compression which did not compare to the controls (0%). Similarly, proximal
median nerve enlargement was observed in 42% of subjects and no controls. Kele also reported
enlargement of the median nerve, describing a “bulbous nerve swelling” observed in 39 of the 55
subjects with an identified compression sign.34
Distal enlargement was not found to be a
beneficial parameter as it was only observed in two subjects. The highest percentages of
compression and proximal enlargement were observed in subjects with severe CTS compared to
other severity categories.
Evaluation of intraneural vascularity has received more attention over the last decade in
the evaluation of CTS. Akcar evaluated the number of vessels observed in the median nerve
within carpal tunnel region using power Doppler, reporting vessels in 50% of subjects and none
of the controls. The authors proposed the quantification of vessels may be beneficial for CTS
severity grading.21
Mallouhi concluded vascularity contributed more than gray-scale parameters
in detecting CTS as compared to NCS, reporting the highest levels of sensitivity, PPV, NPV, and
29
overall accuracy rates were achieved with hypervascularity.22
Surprisingly, the current study
observed intraneural flow in more asymptomatic controls than in symptomatic subjects (63%
versus 53%, respectively). However, the results may be concordant with reported findings by
Evans.37
The authors observed an inverse relationship between intraneural vascular flow and
increasing severity, with peak systolic values of 3.75cm/s in symptomatic subjects and 4.26cm/s
in asymptomatic controls. It was proposed that as progressive and chronic CTS develops, a
decrease in tissue perfusion occurs, with a resultant decline in peak systole. Additional research
conducted by Evans et al.40
evaluated intraneural flow within different regions of the carpal
tunnel using spectral Doppler analysis in symptomatic subjects and asymptomatic controls.
There were no statistical differences observed between subject and control waveform
frequencies. Vascularity within the median nerve was also compared to the number of positive
provocative tests. An increase in positive provocative tests corresponded to an increase in mid-
tunnel peak systolic velocities (PSV) and a decrease in proximal tunnel PSV, however the
authors concluded there was not a clear directional relationship between provocative testing and
PSV (R2=0.01). Although strict criteria were used for determining the presence of flow in the
present study, this parameter may be better evaluated with a larger sample size to determine the
clinical significance of intraneural flow.
Restricted excursion is another area that may benefit from future research utilizing larger
sample sizes. Hough reported a reduced excursion in 57.9% of subjects and 8.1% of subjects,
also reporting a higher prevalence in the dominant arm and in those with positive provocative
testing.28
Although restricted excursion was only observed in 26.32% of subjects in the present
study, it was only identified in moderate and of severe CTS subjects (25% and 66.67%,
respectively). Also of interest, all subjects with restricted excursion had a CSAmax greater than

30
15mm2, compression and proximal enlargement signs, two or more positive provocative tests,
and the presence of both classic and nocturnal symptoms.(Appendix X) Because this was a
retrospective study, the previously established protocol for imaging controls did not include
excursion evaluations. Comparative information between subjects and controls is not available;
however the findings within the subject cohort are promising and may warrant additional
exploration.
Although the use of qualitative parameters in addition to quantitative parameters is not a
new approach, to the author’s knowledge the combination of variables used in this study is
unique to current CTS research. Qualitative parameters used to evaluate CTS include
longitudinal compression sign and echogenicity of the median nerve, typically in conjunction
with quantitative parameters, CSA being the most common.19,22,34,35
In addition to qualitative
assessments, Karadag et al.41
emphasized the importance of evaluating CTS from different
perspectives. Karadag41
and Padua20
both explored the relationships between CSA and clinical
presentations of CTS, including functional and symptom status questionnaires and provocative
testing, in addition to NCS. Both authors reported significant findings between ultrasound and
clinical presentations, as well as between ultrasound and NCS. The use of multidimensional
assessments has also been shown to increase the predictive value of sonographic detection of
CTS.17,19,21,22,34-36
Kele reported the best accuracy was received when using both qualitative and
quantitative evaluations.34
Altinok reported increased accuracy in correctly classifying CTS
severity when multiple variables were used.36
Similarly, Rempel evaluated the use of clinical
parameters to predict the likelihood of CTS, reporting the greatest predictive value when
combining the presence of classic/probable symptoms, nocturnal symptoms, and abnormal
physical examination (positive provocative testing).17

31
Severity staging is especially important for the management of patients, including the
decision to treat patients conservatively or proceed with surgical interventions. The usefulness of
sonography to evaluate CTS will not surpass NCS until a reliable method has been established to
accurately stage CTS severity. Few studies have been successful at categorizing CTS severity in
agreement with NCS. El Miedany24
and Karadag41
both observed significant differences between
severity groups (normal, mild, moderate, severe) using tiered CSA grading recommended by El
Miedany, also reporting significant correlations between abnormal electrodiagnostic testing and
ultrasound grades. Kang et al.42
revealed significant differences between controls and mild,
moderate, and severe CTS subjects when using a wrist-to-forearm median nerve area ratio
(WFR). When using the CSA at the wrist (CSA-W), a significant difference was observed
between controls and subject severity groups but this parameter did not identify a significant
difference between mild and moderate CTS subjects. While studies seem to easily differentiate
between normal and abnormal subjects, research has often failed to determine significant
differences between severity groups, especially in differentiating mild CTS from other
severities.42-45
Based on the current research, a multifaceted approach was used in this study, employing
both quantitative and qualitative parameters, evaluating the most prevalent sonographic measures
in conjunction with clinical presentations. The scoring matrix employed for US severity scoring
is a fusion of parameters inspired by research conducted by authors including El Miedany, Kele,
Hough, and Rempel. Using tiered CSA levels, qualitative longitudinal appearance and excursion
evaluations, and clinical presentations, a semi-quantitative scale has been introduced with the
particular goal of aiding severity staging. Although this pilot study has a small sample of
symptomatic subjects (n=19) evaluated by NCS and sonography, significant agreement was

32
observed between NCS and US severity (p<0.05). Ultrasound severity scoring correctly
classified 71% of mild, 75% of moderate, and 67% of severe CTS subjects according to NCS
severity.
Although the current scoring matrix correctly identified 84% of the controls as normal
(16% graded as mild), the symptomatic subjects diagnosed as normal by NCS had the most
disagreement between NCS and US. Of the two normal subjects, one was graded as mild and one
was graded as moderate. The first subject, graded as mild, did not have any positive ultrasound
indicators or positive provocative testing, but was scored as mild based on the presence of classic
and nocturnal symptoms. The normal subject graded as moderate was even more perplexing,
with a CSAmax of 18mm2, compression, and proximal enlargement.(Appendix XI)
It has been proposed by other authors that false-positive ultrasound findings may in fact
be attributed to false-negative NCS findings.19,46
Similarly, authors have concluded that subjects
with typical CTS clinical presentations and normal evaluations, either by NCS or US, should not
be precluded from a diagnosis of CTS and follow-up testing may be necessary.19,24,37,43,44,46
Mondelli43
reported 23.5% of subjects clinically diagnosed with mild CTS had negative NCS and
US tests. Similarly, Moran44
reported 28.6% of subjects with suspicion of CTS had negative
NCS results. In a study evaluating clinically diagnosed CTS subjects with normal NCS,
Rahmani19
calculated a probability of CTS ranging from approximately 35-90% depending on
the number of positive ultrasound parameters. Wong46
reported a false-positive US rate of 11-
15%, a rate comparable to generally accepted NCS false-negative rates. The authors suggested
these subjects may be better classified as false-negative NCS result rather than a false-positive
upon US.

33
Several authors have offered possible explanations for the discordance between CTS
symptoms and US or NCS evaluations.37,43,44,46
In the early stages of CTS, intermittent ischemia
caused by repetitive strain can present as paresthesia in affected individuals, occurring prior to
demyelination of the nerve. As ischemia ensues, damaged nerve-blood barriers allow capillary
leakage into the epineurium, leading to edema. Increased cross-sectional area of the median
nerve will not occur until after edema triggers the inflammation process, also triggering
hypervascularity within the area. If NCS is performed prior to demyelination, the findings will
likely be normal. Similarly, if US is performed before edema has effectively initiated the
inflammation process, ultrasound parameters will also likely be normal. It is also possible that
acute inflammation can increase CSA and vascularity prior to demyelination, potentially creating
an abnormal US examination and a normal NCS examination. Considering the mechanisms of
acute inflammation, the subject staged as normal by NCS with a CSA greater than 18mm2 may
represent an NCS false-negative, rather than an US false-positive.
The use of sonography as a first-line diagnostic test has been proposed within the
literature.15,18,24,39,44,46,47
Generally accepted advantages of sonography include wide availability,
noninvasive, well-tolerated by patients, and cost-effective. In a random post-examination survey
conducted by Visser et al.,47
60% of patients preferred sonography compared to only 5%
reporting a slight preference for EMG. Of the proponents for first-line sonography evaluations,
most concur that electrodiagnostic testing and ultrasound would be complementary, as
electrodiagnostic testing would be beneficial for the evaluation of symptomatic subjects with
normal US findings.18,39,43,44,47
Research has shown increasing the use of sonography for CTS
evaluation can provide significant reductions in cost and time.15,39,46
In Hong Kong, a 30 minute
electrodiagnostic evaluation costs $320 (U.S. dollars), compared to a $60 (U.S. dollar) 15 minute

34
sonographic examination.46
Ziswiler39
concluded the use of sonography for the initial evaluation
of patients with CTS symptoms could cut the use of EDX in half, resulting in a cost reduction of
$108 (U.S. dollars) per symptomatic wrist. While the benefits of sonography are encouraging,
the progress to sonography as a first-line examination for CTS would benefit from a universally
accepted protocol and method for staging the severity of CTS.

35
Chapter 6: Conclusion
Although the results are promising and may be of value in future research, there are
several inherent limitations. The most notable of the limitations is the small sample size. Based
on a combined subject and control sample size of 38, as well as a smaller cohort of 19
symptomatic subjects undergoing both NCS and US testing, the results obtained in this pilot
study cannot be generalized to larger populations. Additionally, because this was a convenience
sample, recruiting volunteer subjects appearing for NCS evaluation and volunteer controls
responding to flyers, the generalizability of the results is further reduced. Prospective studies
with increased recruitment are necessary to determine the clinical significance of the
multidimensional evaluation and scoring system proposed in this pilot study.
Missing parameter values was another significant limitation in this pilot study,
potentially causing an under-estimation of parameter frequency and US severity-scoring. Five
symptomatic wrists were missing data, specifically excursion (1), provocative testing (4), and
presence of classic and nocturnal symptoms (3). Pertaining to the missing symptom information,
although the nerve conduction testing was order for symptoms consistent with CTS, a completed
functional and symptom status questionnaire was not completed and these subjects also had
missing provocative testing. The individuals were mentally handicapped, with a general lack of
understanding and inability to provide information pertaining to their symptoms. Although the
missing data was a disadvantage, it should be noted that this is certainly a situation that may be
encountered in larger studies. Specific populations and settings may be unable to provide
information relevant to their care, including cognitively challenged or geriatric populations.

36
Another limitation of this pilot study is the lack of comparison between subject and
control electrodiagnostic testing. Controls did not undergo NCS evaluation due to a lack of
funding for such a venture. This would have been especially useful for asymptomatic controls
presenting with abnormal US findings presentations. As previously stated, this was a
convenience sample relying on volunteer controls from an academic setting. Three asymptomatic
controls had a CSA larger than 13mm2, one of which had a CSA larger than 15mm
2. These
subjects were all staged as mild CTS by US. Comparing the US staging, based on the enlarged
CSA values, to NCS findings may have provided valuable information. In addition to increased
sample sizes, future research would benefit from the inclusion of electrodiagnostic testing on
both symptomatic subjects and asymptomatic controls to further evaluate the accuracy of the US
scoring matrix.
Continued focus on excursion in future research is also suggested. This pilot study was a
retrospective case-control study, and control data was attained from an established database of
examinations. The original protocol did not include the evaluation of excursion, resulting in a
lack of information on excursion in healthy, asymptomatic controls. Although restricted
excursion was only observed in subjects with NCS findings diagnosing moderate or severe CTS,
there is a need for comparative studies between subjects and controls. Future studies replicating
the combination of parameters and scoring system should include the evaluation of median nerve
excursion in all individuals.
The qualitative evaluation of excursion did provide results worthy of future exploration;
however this parameter was intended to be a quantitative variable, reporting excursion rates in
millimeters. Originally, frame-by-frame analysis was proposed to evaluate distal movement of
the median nerve upon active wrist extension. Audio video interleave (AVI) files were uploaded
37
into a video processing software program, VirtualDub (version 1.9.11), used to break down the
files into individual frames. Using Microsoft Paint, the individual frames were marked with
colored dots at the carpal tunnel inlet on every fifth frame to create a point of reference.
Longitudinal segments were then color highlighted on every other frame. The individual frames
were then reassembled and evaluated. It was hypothesized that the observed pixel shifts would
allow for the angle of excursion.and forward motion to be evaluated, converting the movement
into millimeters for a quantifiable measurement. After repeated attempts, this method of analysis
was unsuccessful, and the current qualitative assessment of excursion was adopted. Although
quantitative evaluations of excursion were not successful in this pilot study, future research
should explore existing or new techniques to accurately measure excursion rates. Confirmatory
studies may indicate restricted excursion is a useful parameter to evaluate and stage the severity
of CTS.
In conclusion, significant agreement between US and NCS severities was achieved using
a multidimensional evaluation of sonographic and clinical parameters. Additional research using
the qualitative and quantitative evaluations employed in the present study may be valuable for
guiding clinical practice, and larger replicated studies are encouraged. The practicality of the
proposed system should be evaluated as this approach may provide clinicians with a holistic
approach for the initial diagnosis and severity staging of CTS.

38
Appendices
I. List of Abbreviations ……………………………………………………………...39
II. Data Worksheet …………………………………………………………………..40
III. Ultrasound Scoring Matrix ………………………………………………………41
IV. Sonographic Images ……………………………………………………………..42
V. Subject-Control Matching ………………………………………………………..45
VI. Raw Data ………………………………………………………………………...46
VII. Subject versus Control Statistical Analysis …………………………………….48
VIII. Subject Data by NCS Category ………………………………………………..49
IX. Subject Statistical Analysis by NCS Category ………………………………….50
X. Subject Ultrasound Severity Scoring …………………………………………….51
XI. Control Ultrasound Scoring ……………………………………………………..52

39
List of Abbreviations
AANEM American Association of Neuromuscular and Electrodiagnostic Medicine
ARM Right (R) or left (L) wrist
AVI Audio video interleave
BMI Body mass index
CLASS SYMP Classic symptoms
COMP Compression
CON Control
CON ID Control identification number
CSA Cross-sectional area
CSAa Cross-sectional area at the carpal tunnel inlet, at the level of the radial-ulnar joint
CSAb Cross-sectional area at mid-tunnel, at the level of the pisiform
CSAmax Largest of the inlet and mid-tunnel cross-sectional area measurement
CSA AREA DIFF Cross-sectional area difference (CSAb-CSAa)
CT Computed tomography
CTS Carpal tunnel syndrome
DIST ENLG Distal enlargement
EDX Electrodiagnostic study
EMG Electromyography
EXCURS Excursion
FSS Functional status survey
IN FLOW Intraneural vascular flow
LCS Longitudinal compression sign
MATCH Matched subject or control identification number
MRI Magnetic resonance imaging
MSK Musculoskeletal
NCS Nerve conduction study
NCS CAT Nerve conduction study severity category
NOCT SYMP Nocturnal symptoms
NPV Negative predictive value
NR No response
PPV Positive predictive value
PROV TEST Provocative testing
PRX ENLG Proximal enlargement
ROI Region of interest
ROM Range of motion
SCORE Number of positive parameters
SD Standard deviations
SSS Symptom severity survey
SUB Subject
SUB ID Subject identification number
US Ultrasound
US CAT Ultrasound severity category
VTI Velocity time integrals
WFR Wrist-to-forearm median nerve area ratio

40
DATA WORKSHEET Subject: Hand: R L Exclusion:
DOB:
Symptomatic: Y N
Exam date: Gender: M F Dominant Hand: R L
BMI:
Cross-Sectional Analysis (mm²)
CSAa
CSAb
1 1
2 2
3 3
4 4
5 5
Trimmed Average
Frame Number
Longitudinal Appearance
Compression Present Absent Excluded
Enlargement:
Distal Present Absent Excluded
Proximal Present Absent Excluded
Intraneural Flow Present Excluded
Waveforms: Total
Present Excluded
Excursion Normal Restricted Excluded
ROM:
Provocative Testing
Phalen's + -
Tinel's + -
Durkin's + -
NCS Diagnosis Normal Mild Moderate Severe

41
SCORING MATRIX
ID:
Sonographic Evaluation
CSA:
Largest CSA >10mm2 1
Largest CSA >13mm² 1
Largest CSA >15mm² 1
Longitudinal Appearance:
Compression 1
Proximal Swelling 1
Restricted Excursion 1
Total Positive US Indicators:
Clinical Examination and Symptoms
Positive provocative test 1
Classic symptoms present 1
Nocturnal symptoms present 1
Total Positive Clinical Indicators:
Total Positive Indicators:
CTS Severity
Normal 0-1
Mild 2-4
Moderate 5-7
Severe 8-9
NCS Category:

42
Sonographic Images: Cross-Sectional Area of the Median Nerve
Subject Control
Cross-sectional area of the median nerve at the level of the pisiform (CSAb), calculated using a direct trace method. CSA greater than
10mm2 considered abnormal.
MN-median nerve, Sca-scaphoid, Pis-pisiform
Pis MN
Sca

43
Sonographic Images: Longitudinal Appearance of the Median Nerve
Subject Control
Longitudinal images used to subjectively evaluate enlargement and compression of the median nerve in the carpal tunnel region.
MN-median nerve, FT-flexor tendons, Rad-radius, Lun-lunate, Cap-capitate

44
Sonographic Images: Excursion of the Median Nerve
43.121 64.121 115.121
L
C
R
MN
Individual frames (frame number located below image) from cine clip of median nerve excursion upon active wrist extension. Intraneural
reference point and anatomical landmarks used to subjectively classify excursion as normal or restricted.
MN-median nerve, R-radius, L-lunate, C-capitate

45

46

47

48

49

50

51

52

53
References
1. Gelfman R, Melton LJ, Yawn BP, et al. Long-term trends in carpal tunnel syndrome.
Neurology. 2009;72:33-41.
2. Roh YH, Chung MS, Baek GH, et al. Incidence of clinically diagnosed and surgically treated
carpal tunnel syndrome in Korea. J Hand Surg. 2010;35A:1410-1417.
3. Roquelaure Y, Ha C, Pelier-Cady M, et al. Work increases the incidence of carpal tunnel
syndrome in the general population. Muscle Nerve. 2008;37:477-482.
4. Vanderpool HE, Friis EA, Smith BS, et al. Prevalence of carpal tunnel syndrome and other
work-related musculoskeletal problems in cardiac sonography. JOM. 1993;35:604-610.
5. Schoenfeld A, Goverman J, Weiss DM, et al. Transducer user syndrome: an occupational
hazard of the ultrasonographer. European Journal of Ultrasound. 1999;10:41-45.
6. Evans KD, Roll SC, Li X, et al. A holistic evaluation of risk factors for work-related
musculoskeletal distress among asymptomatic sonographers performing neurosonology: a pilot
study. JDMS. 2010;26:64-78.
7. Pike I, Russo A, Berkowitz J, et al. The prevalence of musculoskeletal disorders among
diagnostic medical sonographers. JDMS.1997;13:219-227.
8. Evans K, Roll S, Baker J. Work-related musculoskeletal disorders (WRMSD) among
registered diagnostic medical sonographers and vascular technologists: a representative sample.
JDMS. 2009;25:287-299.

54
9. Colak A, Kutlay M, Pekkafali Z, et al. Use of sonography in carpal tunnel syndrome surgery: a
prospective study. Neurol Med Chir. 2007;47:109-115.
10. Uchiyama S, Itsubo T, Nakamura K, et al. Current concepts of carpal tunnel syndrome:
pathophysiology, treatment, and evaluation. J Orthop Sci. 2010;15:1-13.
11. Mackinnon SE. Pathophysiology of nerve compression. Hand Clin. 2002;18:231-241.
12. Bianchi S, Montet X, Martinoli C, et al. High-resolution sonography of compressive
neuropathies of the wrist. J Clin Ultrasound. 2004;32:451-461.
13. Rempel D, Dahlin L, Lundborg G. Pathophysiology of nerve compression syndromes:
response of peripheral nerves to loading. J Bone Joint Surg Am. 1999;81:1600-1610.
14. Topp KS, Boyd BS. Structure and biomechanics of peripheral nerves: nerve responses to
physical stresses and implications for physical therapist practice. Physical Therapy. 2006;86:92-
109.
15. Fowler JR, Gaughan JP, Ilyas AM. The sensitivity and specificity of ultrasound for the
diagnosis of carpal tunnel syndrome: a meta-analysis. Clin Orthop Relat Res. 2011;469:1089-
1094.
16. Kwon BC, Jung K, Baek GH. Comparison of sonography and electrodiagnostic testing in the
diagnosis of carpal tunnel syndrome. J Hand Surg. 2008;33A:65-71.
17. Rempel D, Evanoff B, Amadio PC, et al. Consensus criteria for the classification of carpal
tunnel syndrome in epidemiologic studies. Am J Public Health. 1998;88:1447-1451.

55
18. Pastare D, Therimadasamy AK, Lee E, et al. Sonography versus nerve conduction studies in
patients referred with a clinical diagnosis of carpal tunnel syndrome. J Clin Ultrasound.
2009;37:389-393.
19. Rahmani M, Ghasemi Esfe AR, Bozorg SM, et al. The ultrasonographic correlates of carpal
tunnel syndrome in patients with normal electrodiagnostic tests. Radiol Med. 2011;116:489-496.
20. Padua L, Pazzaglia C, Caliandro P, et al. Carpal tunnel syndrome: ultrasound,
neurophysiology, clinical and patient-oriented assessment. Clinical Neurophysiology.
2008;119:2064-2069.
21. Akcar N, Ozkan S, Mehmetoglu O, et al. Value of power Doppler and gray-scale US in the
diagnosis of carpal tunnel syndrome: contribution of cross-sectional area just before the tunnel
inlet as compared with the cross-sectional area at the tunnel. Korean J Radiol. 2010;11:632-639.
22. Mallouhi A, Pultzl P, Trieb T, et al. Predictors of carpal tunnel syndrome: accuracy of gray-
scale and color Doppler sonography. AJR. 2006;186:1240-1245.
23. Kaymak B, Ozcakar L, Cetin A, et al. A comparison of the benefits of sonography and
electrophysiologic measurements as predictors of symptom severity and functional status in
patients with carpal tunnel syndrome. Arch Phys Med Rehabil. 2008;89:743-748.
24. El Miedany YM, Aty SA, Ashour S. Ultrasonography versus nerve conduction study in
patients with carpal tunnel syndrome: substantive or complementary tests? Rheumatology.
2004;43:887-895.

56
25. Roll SC, Case-Smith J, Evans KD. Diagnostic accuracy of ultrasonography vs.
electromyography in carpal tunnel syndrome: a systematic review of literature. Ultrasound in
Med. & Biol. 2011;37:1539-1553.
26. Wright TW, Glowczewskie G, Wheeler D, et al. Excursion and strain of the median nerve. J
Bone Joint Surg Am. 1996;78:1897-1903.
27. Echigo A, Aoki M, Ishiai S, et al. The excursion of the median nerve during nerve gliding
exercise: an observation with high-resolution ultrasonography. J Hand Ther. 2008;21:221-228.
28. Hough AD, Moore AP, Jones MP. Reduced longitudinal excursion of the median nerve in
carpal tunnel syndrome. Arch Phys Med Rehabil. 2007;88:569-576.
29. Erel E, Dilley A, Greening J, et al. Longitudinal sliding of the median nerve in patients with
carpal tunnel syndrome. Journal of Hand Surgery. 2003;28B:439-443.
30. Dilley A, Lynn B, Greening J, et al. Quantitative in vivo studies of median nerve sliding in
response to wrist, elbow, shoulder and neck movements. Clinical Biomechanics. 2003;18:899-
907.
31. Coppetiers MW, Hough AD, Dilley A. Different nerve-gliding exercises induce different
magnitudes of median nerve longitudinal excursion: an in vivo study using dynamic ultrasound
imaging. Journal of Orthopaedic and Sports Physical Therapy. 2009;39:164-171.
32. Dilley A, Greening J, Lynn B, et al. The use of cross-correlation analysis between high-
frequency ultrasound images to measure longitudinal median nerve movement. Ultrasound in
Medicine and Biology. 2001;27:1211-1218.

57
33. Hough AD, Moore AP, Jones MP. Peripheral nerve motion measurement with spectral
Doppler sonography: a reliability study. Journal of Hand Surgery. 2000;25B:585-589.
34. Kele H, Verheggen R, Bittermann HJ, et al. The potential value of ultrasonography in the
evaluation of carpal tunnel syndrome. Neurology. 2003;61:389-391.
35. Wang LY, Leong CP, Huang YC, et al. Best diagnostic criterion in high-resolution
ultrasonography for carpal tunnel syndrome. Chang Gung Med J. 2008;31:469-476.
36. Altinok T, Baysal O, Karakas HM, et al. Ultrasonographic assessment of mild and moderate
idiopathic carpal tunnel syndrome. Clinical Radiology. 2004;59:916-925.
37. Evans KD, Roll SC, Volz KR, et al. Relationship between intraneural vascular flow
measured with sonography and carpal tunnel syndrome diagnosis based on electrodiagnostic
testing. J Ultrasound Med. 2012;31:729-736.
38. Polgar S, Thomas SA. Introduction to Research in the Health Sciences. Philadelphia, PA:
Churchill Livingstone Elsevier;2008:178.
39. Ziswiler HR, Reichenbach S, Vogelin E, et al. Diagnostic value of sonography in patients
with suspected carpal tunnel syndrome: a prospective study. Arthritis & Rheumatism.
2005;52:304-311.
40. Evans KD, Volz KR, Hutmire C, et al. Morphologic characterization of intraneural flow
associated with median nerve pathology. Journal of Diagnostic Medical Sonography.
2012;28:11-19.
41. Karadag YS, Karadag O, Cicekli E, et al. Severity of carpal tunnel syndrome assessed with
high frequency ultrasonography. Rheumatol Int. 2010;30:761-765.

58
42. Kang S, Kwon HK, Kim KH, et al. Ultrasonography of median nerve and electrophysiologic
severity in carpal tunnel syndrome. Ann Rehabil Med. 2012;36:72-79.
43. Mondelli M, Filippou G, Gallo A, et al. Diagnostic utility of ultrasonography versus nerve
conduction studies in mild carpal tunnel syndrome. Arthritis & Rheumatism.2008;59:357-366.
44. Moran LM, Perez M, Esteban A, et al. Sonographic measurement of cross-sectional area of
the median nerve in the diagnosis of carpal tunnel syndrome: correlation with nerve conduction
studies. Journal of Clinical Ultrasound. 2009;37:125-131.
45. Mohammadi A, Afshar A, Etemadi A, et al. Diagnostic value of cross-sectional area of
median nerve in grading severity of carpal tunnel syndrome. Archives of Iranian Medicine.
2010;13:516-521.
46. Wong SM, Griffith JF, Hul ACF, et al. Carpal tunnel syndrome: diagnostic usefulness of
sonography. Radiology. 2004;232:93-99.
47. Visser LH, Smidt MH, Lee ML. High-resolution sonography versus EMG in the diagnosis of
carpal tunnel syndrome. J Neurol Neurosurg Psychiatry. 2008;79:63-67.