varsha binnenwerk.indd
TRANSCRIPT


Immunosuppressive Drugs and Immune Regulation in Organ Transplantation
Varsha D.K.D. Sewgobind
The research described in this dissertation was performed at the Department of Internal
Medicine, at the Transplantation Laboratory and at the Department of Gastroenterology and
Hepatology, Erasmus University Medical Centre, Rotterdam, the Netherlands
Financial support for the publication of this thesis was kindly provided by:
Astellas Pharma B.V.
Baxter B.V.
Becton Dickinson B.V.
Boehringer Ingelheim B.V.
Bristol-Myers Squibb B.V.
Erasmus Universiteit Rotterdam
Genzyme Europe B.V.
Greiner B.V.
Nederlandse Transplantatie Vereniging
Novartis Pharma B.V.
PerkinElmer B.V.
Pfi zer B.V.
Roche Nederland B.V.
© Varsha D.K.D. Sewgobind, 2010
All rights reserved. No part of this thesis may be reproduced, stored in a retrieval system or transmit-
ted in any form or by any means without permission of the author, or when appropriate, of the
scientifi c journal in which parts of this book have been published.
ISBN: 978-90-8559-991-3
Cover design by Martin Huisman
Lay out and print by Optima Grafi sche Communicatie, Rotterdam

Immunosuppressive Drugs and Immune Regulation in Organ Transplantation
Immuunsysteem onderdrukkende Medicatie en Immuunregulatie bij Orgaantransplantatie
Proefschrift
Ter verkrijging van de graad van doctor
aan de Erasmus Universiteit Rotterdam
op gezag van de rector magnifi cus
Prof.dr. H.G. Schmidt
en volgens besluit van het College voor Promoties
De openbare verdediging zal plaatsvinden op
dinsdag 8 juni 2010 om 15.30 uur
door
Varsha Devi Kareshma Devi Sewgobind
geboren te Amsterdam

PROMOTIECOMMISSIE
Promotor : Prof.dr. W. Weimar
Overige leden : Dr. T. van Gelder
: Prof.dr. C. van Kooten
: Prof.dr. J.D. Laman
Copromotoren : Dr. C.C. Baan
: Dr. L.J.W. van der Laan

CONTENTS
Chapter 1. General Introduction and Outline of this Thesis 7
Chapter 2. Functional Analysis of CD4+CD25bright T cells in Kidney Transplant 31
Patients: Improving Suppression of Donor-Directed Responses after
Transplantation
Clinical Transplantation 22, 579-586 (2008)
Chapter 3. Generation of Donor-Specifi c Regulatory T-Cell Function in 45
Kidney Transplant Patients
Transplantation 87, 376-383 (2009)
Chapter 4. The Eff ect of Rabbit Anti-Thymocyte Globulin Induction Therapy on 63
Regulatory T cells in Kidney Transplant Patients
Nephrology Dialysis and Transplantation 24, 1635-1644 (2009)
Chapter 5. Characterization of Rabbit Anti-Thymocyte Globulins-Induced 81
CD25+ Regulatory T Cells from Cells of Patients with End Stage Renal
Disease
Transplantation 89, 655-666 (2009)
Chapter 6. The Calcineurin Inhibitor Tacrolimus Allows the Induction of Functional
CD4+CD25+ Regulatory T Cells by Rabbit Anti-Thymocyte Globulins
105
Clinical and Experimental Immunology, accepted March 2010
Chapter 7. The Jak Inhibitor CP-690,550 Preserves the Function of
CD4+CD25brightFoxP3+ Regulatory T cells and inhibits Eff ector T Cells
131
Manuscript submitted
Chapter 8. Conversion from Calcineurin Inhibitor to Mycophenolate Mofetil-Based
Immunosuppression Changes the Frequency and Phenotype of
CD4+FOXP3+ Regulatory T Cells
151
Transplantation 87, 1062-1068 (2009)
Chapter 9. 167
Summary 168
General Discussion 173
Samenvatting en Conclusie 185
Chapter 10. 197
Dankwoord/Acknowledgements 198
Curriculum Vitae Auctoris 205
PhD Portfolio 206
Abbreviations 209


Chap ter 1General Introduction and Outline of this Thesis

Chap
ter 1
8
CONTENTS GENERAL INTRODUCTION
1.1 Organ Transplantation 9
1.2 The Immune System 10
1.2.1 Transplantation Immunobiology 12
1.3 Regulatory T Cells 12
1.3.1 Regulatory T-Cell Subsets 13
1.3.2 Generation of Regulatory Cells for Therapeutic Application 17
1.4 T-Cell Activation and Targets of Immunosuppressive Drugs 18
1.5 Subclasses of Immunosuppressive Drugs 18
1.5.1 Induction Therapy 18
1.5.2 Calcineurin Inhibitors 20
1.5.3 Jak Inhibitors 20
1.5.4 Proliferation Inhibitors 21
1.5.5 Corticosteroids 21
1.6 Aim and Outline of This Thesis 22

General Introduction 9
1.1 ORGAN TRANSPLANTATION
Solid organ transplantation is during the past two decades the fi nest and most suitable treat-
ment with the best quality of life for patients with end stage organ failure. The fi rst documented
‘unrelated’ kidney transplantation was performed on June 17, 1950 in Chicago, United States
on a 44-year-old woman with polycystic kidney disease2. Unfortunately, the donated kidney
was rejected because no adequate immunosuppressive therapy was available at the time and
the development of eff ective anti-rejection drugs was years away. The fi rst successful kidney
transplantation was performed on December 23rd in 1954 from one healthy identical twin to
his twin brother who was almost dying of renal disease3. The operation succeeded and renal
function was restored in the recipient and resulted in enormous excitement in the media and
among medical professionals. One decade further, the fi rst human liver transplantation was
performed in 1963 by a surgical team led by dr. Thomas Starzl4.
The discovery and availability of potent immunosuppressive drugs that were able to prevent
rejection of the transplanted donor graft, was followed by an era of many successful solid organ
transplantations. The use of these immunosuppressive drugs resulted in acceptable graft-
survival rates in the Netherlands. The graft survival rate over 2007 was 94% after clinical kidney
transplantation with living donors, 85% after clinical kidney transplantation with deceased
donors and 76% after clinical liver transplantation (Nederlandse Transplantatie Stichting).
Nevertheless, acute rejection may occur in the fi rst 3 to 6 months after transplantation, but this
can be well treated with (steroid) anti-rejection therapy.
Although, the use of new classes of drugs and new combinations of immunosuppressive
drugs have been shown to improve short-term outcomes as they improve graft survival and
decrease the rate of acute allograft rejection in the fi rst year of transplantation, a dark side of
immunosuppressive drug therapy has emerged. There are two major caveats with prolonged
immunosuppression after organ transplantation for the patient. First, the considerable clinical
load that comprises numerous adverse eff ects conveyed to the patient and results in increased
morbidity as e.g. they increase the susceptibility for infections and malignancies, but these
also include non-immunological complications as osteoporosis, diabetes and an increase in
cardiovascular risk factors, (nephro)toxicity and even mortality5, 6 Secondly, the relatively poor
effi cacy in preventing immunologically driven chronic allograft rejection7 resulting in graft
failure after long-term usage of immunosuppressive drugs.
The side eff ects of immunosuppressive medication are due to lack of specifi city as they do
not only aff ect the cells of the immune system but also aff ect non-immune cells like parenchy-
mal cells, smooth muscle cells, etc. Therefore, therapy that specifi cally targets immune cells
involved in the reactivity against the donor graft without aff ecting cells of the immune system
that provide immunity against infections and non-immune cells is severely needed.

Chap
ter 1
10
1.2 THE IMMUNE SYSTEM
The immune system has been evolved to protect us from pathogens such as viruses and bacte-
ria. There are two types of immune responses: 1) the innate immune response, which is the fi rst
line of defense against pathogens by macrophages and phagocytic cells and 2) the adaptive
immune response, which is a specifi c immune response against particular foreign antigens (Box
1) or a specifi c pathogen. Adaptive immunity occurs during the lifetime of an individual as an
adaptation to infection with that antigen or pathogen and off ers life-long protection against
re-infection with the same pathogen. Adaptive immune responses are initiated in peripheral
lymphoid tissues (Figure 1B) after antigen presentation (Box 1).
Two major types of peripheral lymphoid tissues:
1. the spleen, that collects antigens from the blood; 2. the secondary lymph nodes, which collect antigens from sites of infection in the tissues.
Two major phases of any immune response:
1. Recognition of antigens; molecules recognized by receptors on lymphocytes in lymphoid
tissues. 2. A reaction to eradicate the antigens.
Lymphocytes circulate in the peripheral blood and can mediate immunity (20% of white blood cells in adults). They have specialized functions. Lymphocytes comprise:
1. B cells that differentiate in the fetal liver and the postnatal bone marrow and produce antibodies;
2. T cells that develop in the thymus (Fig. 1A) and recognize antigens with their T-cell receptor. T cells comprise: *CD8+ cytotoxic T cells kill virally affected cells;
*CD4+ helper T cells coordinate the immune response by direct cell- cell interactions and release cytokines which help B cells to produce
antibodies. *Regulatory T cells can control immune responses to self-antigens.
3. Natural Killer cells can lyse certain tumour cells and virus-infected cells. Antigen-presenting cells (APCs) are required by T cells to enable them to respond to antigens. Dendritic cells, macrophages and B cells recognize native antigens not processed and presented by other cells.
The cells of the innate immune system (natural killer cells, macrophages, phagocytes) play a crucial part in the initiation and subsequent direction of adaptive immune responses by T and B lymphocytes. Mixed lymphocyte reactions (MLR): in vitro assay to imitate immune responses from to patient to donor.
Major histocompatibility Complex (MHC) - Human Leucocytes Antigens (HLA, Human Variant of MHC) The function of the MHC molecules on T cells is to bind peptide fragments derived from pathogens and display them on the cell surface for recognition by the appropriate T cells.
Large numbers of T cells are specifically reactive against particular non-self or allogeneic MHC molecules resulting in a cell-mediated immune response. Alloreactivity: reactivity of immune cells of one individual against antigens from another individual. Clonal selection is the central principle of adaptive immunity and involves recognition of antigen by a particular lymphocyte; leading to proliferation (expansion) and cytokine secretion by activated T cells and differentiation into effector T cells. The clonal expansion of these effector T cells can cause acute cellular rejection.
Cytokines are the soluble mediators of immunity and defined as a large group of molecules (proteins or peptides)
involved in signaling between cells during immune responses.
Box 1. Introduction into the Immune System
Adapted from the textbooks ‘Immunology’13 and ‘Immunobiology The immune system in health and disease’14.

General Introduction 11
B
A
Figure 1. Primary and secondary lymphoid organs
(A) Location of the thymus and the spleen (primary lymphoid organs) in the human thorax, ©ADAM. (B) Structure and function of a lymph node
and its components, where antigen recognition takes place (secondary lymphoid organ), adapted from the textbook ‘Human Anatomy’1.

Chap
ter 1
12
1.2.1 Transplantation immunobiology
Immediately after solid organ transplantation, the immune system will respond to the foreign
antigens of the donor graft in order to eliminate the graft by causing rejection. Professional
antigen-presenting cells (APCs), mainly dendritic cells (DCs) from the donor will migrate from
the donor graft towards the secondary lymphoid organs in the recipient (Box 1 and Figure 1B),
where they can activate naïve T cells and resting/central memory alloreactive T cells from the
recipient (Box 1 and Figure 3A). Immune responses (Box 1) are triggered after recognition of
the allogeneic major histocompatibility complex mismatched antigens (MHC) or the human
MHC, which is called Human Leukocyte Antigens (HLA), by receptors on T cells of the recipient
(Box 1). This mode of T-cell activation by APCs of the recipient is called the direct pathway of
allorecognition. Upon activation by alloantigens, CD4+ helper T cells produce massive amounts
of the T-cell growth factor Interleukin (IL)-2 which is required for their clonal expansion and
for their diff erentiation into eff ector T cells (Teff ). The direct pathway of antigen presentation
is imitated in vitro by allogeneic mixed lymphocyte reactions (MLR) (Box 1). The major role of
APCs in rejection has been demonstrated in experimental models showing that depletion of
donor APCs can sometimes prolong graft survival8.
A second mechanism for initiating an immune response and T-cell activation is the indirect
pathway of allorecognition, which is stimulation of recipient T cells by recipient APCs that can
present peptides of donor origin8. Evidence has been provided to demonstrate the contribu-
tion of the indirect pathway to rejection in animal experimental models9-11 e.g. allogeneic skin
grafts in mice that lack MHC class II antigens are rejected rapidly11. In humans, data about the
relationship between reactivity of T cells with indirect allospecifi city and graft rejection are
lacking12. Thus, the role of the indirect pathway in rejection remains to be elucidated.
Whether via the direct or indirect pathways, both mechanisms of the immune system are
activated after organ transplantation and can mediate acute or chronic cellular graft rejection
respectively. These mechanisms that can cause an activated immune system of the recipient
indicate the need for immunosuppressive drug therapy to eliminate alloreactive eff ector T cells
from the recipient in order to prevent graft rejection.
1.3 REGULATORY T CELLS (TREG)
The immune system does not only have a defense mechanism to eliminate everything that is
foreign. It has also built-in mechanisms to maintain immune homeostasis and to prevent the
attack of healthy self-tissues. The fi rst line of self-tolerance is the elimination of self-reactive
T cells during negative selection in the thymus (Figure 1A) and B cells in the bone marrow.
However, some self-reactive T cell clones ‘escape’ central tolerance and enter the peripheral
compartment. There are several important mechanisms known by which the immune system
can achieve peripheral tolerance. Except for other mechanisms to achieve tolerance concerning

General Introduction 13
Teff cells as clonal deletion, ignorance, activation-induced cell death and anergy, the induction
of regulatory T cells may play an important role in the acquisition of peripheral tolerance15.
Treg are able to control unwanted immune responses and have been shown to play a pivotal
role in controlling autoimmunity. Their function has also been implicated in infl ammatory
diseases such as asthma and infl ammatory bowel disease16-19. A growing body of evidence
suggests that CD4+ T cells that highly express the IL-2 receptor-α chain (CD25) on their surface
have specifi city for the direct pathway and play a role in transplant ‘tolerance’. The Holy Grail
in transplantation is to achieve long-term tolerance. Tolerance refers to a state of sustained
specifi c non-responsiveness of the recipients’ immune system to donor alloantigens, allowing
long-term allograft survival in the absence of potential harmful chronic immunosuppressive
drugs. Immunological tolerance is a state of antigen-specifi c T-cell unresponsiveness’ or an
immunologic blind spot for a specifi c antigen, whereas the responses to all other antigens are
completely intact. Immunologic tolerance in the organ transplantation context is defi ned as
a durable state of antigen-specifi c unresponsiveness, induced by exposure to donor antigens
from the graft, in a patient who is otherwise fully immunologically competent20.
When there is a state of minimal immune responsiveness by active regulation of the immune
responses that are directed against the donor graft, this will automatically lead to little require-
ment for immunosuppressive drugs. Transplanted patients may benefi t from a reduction in the
dose and time of usage of the immunosuppressive drugs and even cessation after transplanta-
tion. ‘Operational tolerance’ is defi ned as long term (more than 12 months) independence from
all immunosuppression in patients with normal graft functions. Mechanisms and protocols to
actively induce ‘operational tolerance’ have already been investigated for more than 50 years
in animal experimental models21, but few papers report (liver) transplant patients that are
tolerant for their graft22-24. Therefore, skewing of the immune system to a more donor-antigen
specifi c therapy might be more promising.
1.3.1 Regulatory T-cell subsets
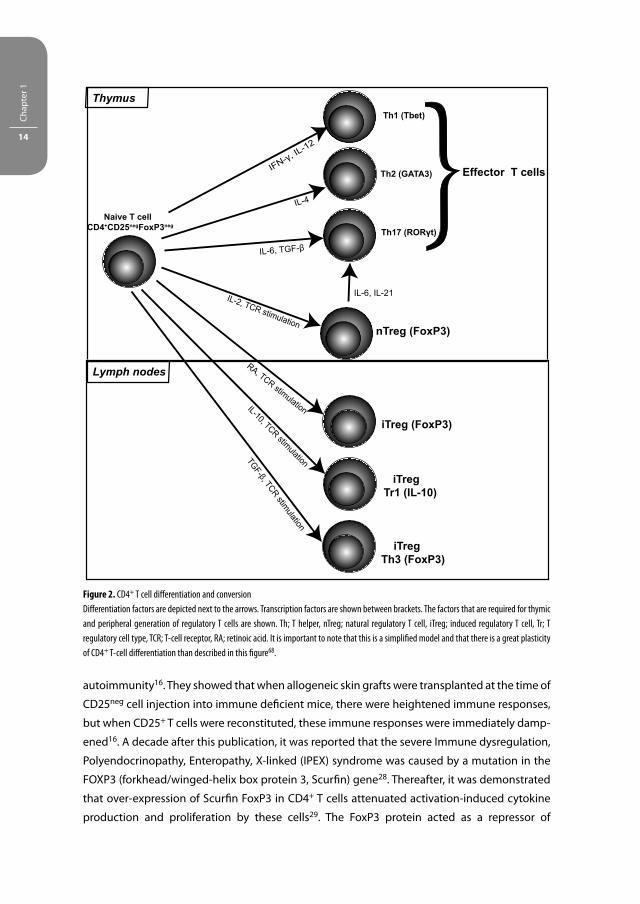
Myriad surface expression profi les have revealed several subpopulations of Treg (Figure 2). The
naturally occurring CD4+CD25+ T cells have their origin in the thymus (Figure 1A) and comprise
5-10% of total CD4+ T cells in the human peripheral blood. Their function is to control the
proliferation of CD4+ and CD8+ Teff cells.
In 1971, Gershon and Kondo were the fi rst to report the importance of suppressor T cells
as they showed the immunosuppressive eff ect of the presence of thymocytes during antigen
pre-treatment in mice25. Hall et al. showed that a subset of T ‘helper/inducer’ T cells were
responsible for the onset of specifi c unresponsiveness in rats treated with cyclosporine26. Five
years later, the same group demonstrated in cyclosporine treated rats that CD4+ T suppres-
sor cells with inhibitory capacities were induced for this unresponsiveness27. After a period
of quiescence, Sakaguchi and his colleagues provided evidence that CD25+ T cells, of which
the majority is CD4+, prevent autoimmune disease and that depletion of these cells induces
Chap
ter 1
14
autoimmunity16. They showed that when allogeneic skin grafts were transplanted at the time of
CD25neg cell injection into immune defi cient mice, there were heightened immune responses,
but when CD25+ T cells were reconstituted, these immune responses were immediately damp-
ened16. A decade after this publication, it was reported that the severe Immune dysregulation,
Polyendocrinopathy, Enteropathy, X-linked (IPEX) syndrome was caused by a mutation in the
FOXP3 (forkhead/winged-helix box protein 3, Scurfi n) gene28. Thereafter, it was demonstrated
that over-expression of Scurfi n FoxP3 in CD4+ T cells attenuated activation-induced cytokine
production and proliferation by these cells29. The FoxP3 protein acted as a repressor of
IFN-γ, IL-12
Th1 (Tbet)
Th2 (GATA3)
Th17 (RORγt)
nTreg (FoxP3)
iTreg (FoxP3)
iTregTr1 (IL-10)
Lymph nodes
IL-4
IL-6, TGF-β
IL-2, TCR stimulation
iTregTh3 (FoxP3)
RA, TCR stimulationIL-10, TCR stimulationTGF-β, TCR stimulation
Naive T cellCD4+CD25negFoxP3neg }
IL-6, IL-21
Effector T cells
Thymus
Figure 2. CD4+ T cell diff erentiation and conversion
Diff erentiation factors are depicted next to the arrows. Transcription factors are shown between brackets. The factors that are required for thymic
and peripheral generation of regulatory T cells are shown. Th; T helper, nTreg; natural regulatory T cell, iTreg; induced regulatory T cell, Tr; T
regulatory cell type, TCR; T-cell receptor, RA; retinoic acid. It is important to note that this is a simplifi ed model and that there is a great plasticity
of CD4+ T-cell diff erentiation than described in this fi gure68.

General Introduction 15
transcription and in this way regulated T-cell activation29. The breakthrough came when the
association between the CD4+CD25+ T cells and FoxP3-expression was drawn by demonstrating
that FoxP3 plays an important role in guiding the diff erentiation and function of CD4+CD25bright
T cells as they highly express this transcription factor30, 31. Now it has been revealed that FoxP3
binds to the promoters of over 700 genes and has both activating and inhibitory activities32,
33. Furthermore, it can interact with NFAT, the key regulator of T-cell activation and anergy33,
34. A few years later, human CD4+CD25brightFoxP3+ T cells were shown to downregulate the IL-7
receptor α-chain (CD127) that is highly expressed by Teff cells and memory T cells35.
Recently, it was reported that the level of FoxP3 expression and the extent of post-transla-
tional FoxP3-acetylation seems to be important factors in governing the suppressive activity of
naturally occurring Treg36, 37.
As CD4+CD25bright Treg require IL-2 for their expansion, homeostasis and function38, the
mechanism of suppression by Treg takes place via several mechanisms. The most well-known
mechanism is that they inhibit the proliferation of Teff cells by 1) the inhibition of the IL-2
production by Teff cells or 2) via scavenging of IL-2, which is one of the crucial mechanisms
of suppression to control alloreactivity39, 40. Other notorious mechanisms of suppression may
occur via interactions mediated through cell-surface molecules such as TGF-β, CTLA-4 (cyto-
toxic T lymphocyte-associated antigen-4) that can cause signaling through B7-1 and B7-2 on
DCs leading to the production of indoleamine 2,3-dioxygenase41, ICAM (intracellular adhesion
molecule), and modulators of Treg function GITR (glucocorticoid-induced TNFR-related pro-
tein) and OX40. TGF-β seems to correlate with the maintenance of FoxP3-expression. However,
FoxP3-expression by itself is not suffi cient to confer suppressive function42, 43. Moreover,
it is postulated that IFN-γ and IL-35 play a role in the paracrine suppressive mechanisms of
regulatory T cells44, 45. However, the contribution of IL-35 to regulatory T cells function remains
controversial46. Other factors include granzyme B that can be secreted by CD4+CD25bright T cells
and predominantly acts as an eff ector molecule to directly lyse autologous Teff cells and B cells
after activation47-49.
Treg are not only discharged into the periphery by the thymus, a small group of Treg has its
origin in the periphery, and is known as induced (i) Treg15 (Figure 2). Though, the contribution of
iTreg in restraining immune responses to allo-antigen in vivo is unknown, the antigen-specifi c
Treg are supposed to have potent suppressive properties in the inhibition of immune responses
against donor-antigens as has been shown in vitro. It has been demonstrated that human naïve
CD25neg T cells can diff erentiate into induced CD4+CD25+FoxP3+ T cells and CD8+CD25+FoxP3+
T cells with regulatory activities in vitro after stimulation with antigen in the presence of CD14+
monocytes50, 51. CD3/CD46-induced regulatory T cells have been shown to mediate granzyme
and perforin mediated lysis of activated Teff cells47.
Other regulatory T cell types include the CD4 and CD8 double negative (CD4negCD8neg) T
cells52, CD3+γδTCR+ T cells24, the natural killer T cells53, IL-10-producing Tr1 T cells54 (Figure 2)
and the TGF-ß-producing Th3 T cells55 (Figure 2).

Chap
ter 1
16
CD4negCD8neg Treg comprise 1-2% of peripheral blood mononuclear cells (PBMC) and are
associated with graft acceptance. They are capable of inhibiting immune responses via directly
killing Teff cells in an antigen-specifi c fashion via FASL and are CD27+56, 57. The CD3+γδTCR+ T
cells (Vδ1-type) produce massive amounts of IL-10 and were found to have a higher activation
state in tolerant patients than in healthy controls24. Levels of CD3+γδTCR+ T cells (Vδ1-type)
were increased in the peripheral blood of tolerant recipients as compared with immunosup-
pression- dependent patients or healthy controls, suggesting that these cells may have an
important function in establishing tolerance after transplantation23. They play an important
role in controlling the development of various immune pathologies and enhance allo- and
xeno-transplant survival. Moreover, in comparison with αβ-TCR+ T cells, the CD3+γδTCR+ T cells
are insensitive to the immunosuppressive drug cyclosporine A58. The invariant natural killer T
cells lyse autologous T and B cells via perforin and produce Th1 cytokines (IFN-γ and TNF-α) and
Th2 cytokines (IL-4, IL-5, IL-10 and IL-13) (Box 1). In experimental models using knockout mice
that lack iNKT cells, it has been demonstrated that they play an important immune regula-
tory role in the maintenance of transplant tolerance59. NKT levels can also be infl uenced by
immunosuppressive drugs. The combination of several classes of drugs seems to enhance the
levels of NKT cells and CD4+FasL+ T cells. In primates that received immunosuppressive therapy
consisting of both the calcineurin inhibitor tacrolimus and the lymphocyte proliferation inhibi-
tor sirolimus after kidney transplantation, increased levels were detected compared with the
tacrolimus and sirolimus treated groups alone60.
The IL-10-producing Tr1 Treg also harbor the CD4+CD25+ phenotype and have their immu-
noregulatory eff ect on APCs and T cells as they downmodulate the co-stimulatory molecules
CD80 and CD86 on APCs as well as MHC class II, indispensable for T-cell activation15.
As tolerance to food antigens (oral tolerance) might be achieved by the administration of
high antigen dose and may lead to hyporesponsiveness mediated by anergy or deletion, low
doses of antigen lead to the generation of antigen-specifi c regulatory Th3 cells that produce
TGF-β61, 62. Furthermore, TGF-β-production by Th3 cells does not necessarily always correlates
with the expression of other anti-infl ammatory cytokines as IL-4 and IL-1063. Th3-cells have
been shown to transfer tolerance in vivo and to suppress antigen-specifi c responses in vitro64.
Treg are not only present within the CD4+ T cell population, other subsets within the CD8+ T
cell population that also have (antigen-specifi c) regulatory capacities are the CD28neg T cells65.
These cells share several similarities in their molecular markers with the CD4+CD25bright T cells65
e.g. they can also express FoxP367.
To summarize, there are diff erent Treg subsets that have a diff erent origin (Figure 2) and
diverse mechanisms of action with the common purpose to regulate immune responses.
Finally, it is important to take into account that there is a great degree of fl exibility in the dif-
ferentiation options of CD4+ T cells i.e. the expression of the transcription factor Foxp3 by iTreg
may not be that stable68.

General Introduction 17
1.3.2 Generation of regulatory T cells for therapeutic application
Although the continued use of immunosuppressive drugs provides a degree of long-term
maintenance of allograft function, as mentioned earlier, fi nding new protocols to target the
activated T cells directed against donor-antigens to release the patient from the severe side
eff ects is a challenging task for transplantation immunologists.
Treg are able to restrain donor-directed immune responses in vitro and may for that purpose
be critical inducers of graft acceptance. However, natural occurring Treg are not specifi c as they
are not directed against donor-antigens and those natural occurring Treg that cross-react with
the Teff cells are present at low frequency.
The ultimate goal of transplantation may be established by increasing the frequency or
enhancing the suppressive activities of regulatory T cells. To accomplish operational tolerance,
expansion protocols have been developed to increase their number in vitro and ultimately re-
infuse them into the patient by adoptive transfer. There are two protocols of in vitro expansion;
1) antigen-specifi c69 and 2) polyclonal70. Alloantigen-specifi c Treg are supposed to provide
higher therapeutic benefi ts in solid organ transplantation compared with polyclonal Treg,
because they suppress immune responses that are directed against alloantigens and will
diminish the overall immunity against pathogens71. Unfortunately, there are major drawbacks
with the isolation, expansion and purity of these T cells in vitro. First, it is only possible to study
the suppressive capacities of CD25brightCD127-/low T cells. Although the majority of these cells
are FoxP3+, FoxP3neg cells are present in this population35. Furthermore, it has been demon-
strated that Treg may lose their CD25 and FoxP3-expression in vitro72, 73. It has been shown that
only the CD45RA (naïve) CD4+CD25bright population gives rise to a homogenous population74.
Moreover, when Treg are expanded in vitro, it is unknown whether they still contain their migra-
tory capacities in vivo and reach the place where immune activation takes place; the peripheral
lymph nodes (Figure 1B).
Other in vivo experimental transplantation studies have shown that Treg can be generated
from naïve T cells that are recruited to the allograft by conversion of CD25neg precursors into
CD25+ T cells (Figure 2)75, 76. The induction of FoxP3 expression can only take place in the pres-
ence of TCR triggering and cytokines (Figure 2) or by immunosuppressive drugs as has been
shown in experimental models50, 77-80. Whether Treg induction occurs in vivo depends on the
context in which the T-cell encounters antigen dose in terms of antigen form, antigen dose,
co-stimulation and the APC subtype71. More research needs to be done to fully characterize
the natural and adaptive regulatory T cells and to reveal their role in transplantation tolerance.
1.4 T-CELL ACTIVATION AND TARGETS OF IMMUNOSUPPRESSIVE DRUGS
T cells require three distinct signals for most optimal activation to initiate an immune response.
Signal 1 is provided by the CD3 complex on T-cell receptors that recognizes antigen on the

Chap
ter 1
18
surface of dendritic cells and transduce this signal across the cell membrane (Figure 3)81. Signal
2 is the co-stimulatory signal that is provided by dendritic cells and is delivered when CD80
and CD86 on the surface of the dendritic cells engage CD28 on T cells (Figure 3). The combina-
tion of signal 1 and 2 activates three signal transduction pathways: the calcium-calcineurin
pathway, the RAS-mitogen-activated protein (MAP) kinase pathway and the protein kinase
C-nuclear factor-κB pathway which in turn can activate i.e. the nuclear factor of activated T cells
(NFAT), activating protein 1 (AP-1), and NF-κB respectively (Figure 3). Activation of the NFAT,
AP-1 and NF-κB transcription factors trigger the expression of many molecules such as the
immunomodulator IL-2, CD154 (CD40L) and CD2581. APCs do not only trigger T-cell activation
via cell-cell contact. They produce many cytokines as e.g. IFN-γ and IL-4 that can provide signal
3 and trigger T-cell activation and diff erentiation. Next to APCs, Th cells function as a source
for cytokine production. IL-2, -4, -7, -9, -15 and 21 (cytokines of the IL-2 family) share the com-
mon γ-chain (γc) and can recruit Janus Kinase 1 and 3 (Jak3) upon autophosphorylation (Figure
3). These cytokines, in particular IL-2 and IL-15 activate the mammalian ‘target of rapamycin’
(mTOR) pathway and deliver growth signals through the phophoinositide-3-kinase that is the
major trigger for T-cell proliferation81 and diff erentiation into Teff cells. Immunosuppressive
drugs that are currently in clinical practice act on distinct pathways for T-cell activation (Figure
3) and will be outlined in the next paragraphs.
1.5 SUBCLASSES OF IMMUNOSUPPRESSIVE DRUGS
1.5.1 Induction therapy
Induction therapy consists of polyclonal or monoclonal antibodies directed against epitope(s)
on T cells. The purpose of induction therapy is to deplete or modulate T-cell responses at the
time of antigen presentation.
Rabbit anti-thymocyte globulins (rATG) are comprised of polyclonal immunoglobulins that
are purifi ed from the serum of rabbits after immunizing these animals with human thymocytes.
Induction therapy using rATG is given to patients during the fi rst days after organ transplanta-
tion to decrease the incidence of delayed graft function and to reduce the dosage of calcineurin
inhibitors during the fi rst days after transplantation. After two days of rATG-induction therapy,
transplanted patients receive maintenance therapy consisting of a calcineurin inhibitor, myco-
phenolate mofetil (MMF) and prednisone. By binding to epitopes on the surface of lymphocytes
and monocytes, rATG depletes these cells from the circulation and secondary lymphoid tissues,
thereby preventing acute rejection of the graft (Figure 3)82-84. Toxic side eff ects include throm-
bopenia, the cytokine-release syndrome, and occasional serum sickness or allergic reactions.
The IL-2 receptor is also a potential target for immunosuppressive drugs. Monoclonal antibod-
ies that bind to the CD25 antigen at the surface of activated T cells inhibit IL-2 mediated T cell
activation, which is a crucial phase in the cellular immune response of allograft rejection (Figure 3).
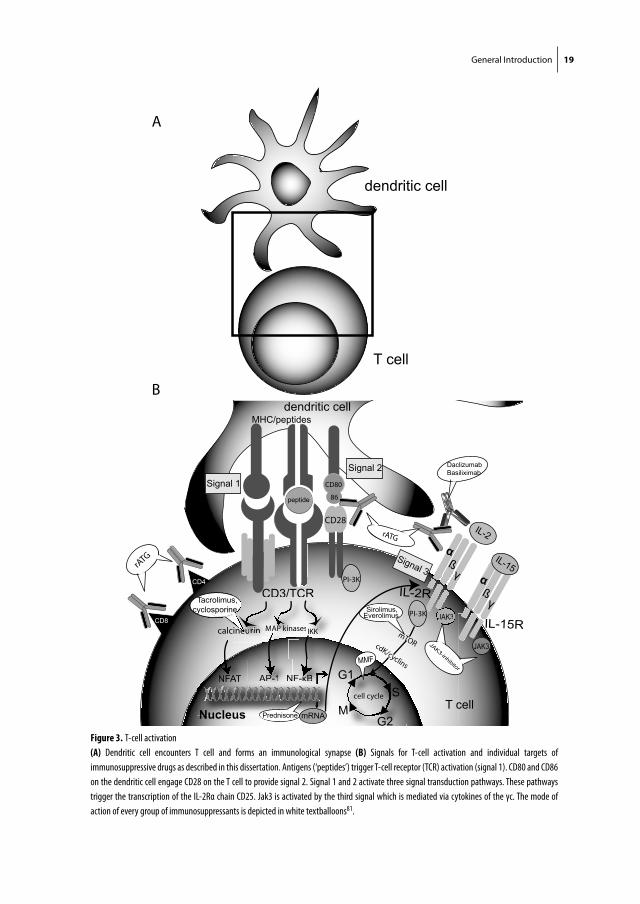
General Introduction 19
dendritic cell
T cell
αßγ
Nucleus
IL-15
IL-15R
αßγ
JAK3
JAK3
NFAT AP-1 NF-κB
Signal 1
JAK3
γγγ
N
FF
Nuucclele sususe mRNA
►►
►
►►
S
G2M
G1
CD3/TCR
dendritic cell
T cell
MHC/peptides
cell cycle
calcineurin
Signal 2
CD28
CD80
86
PI-3K
MMF
JAK3-inhibitor
rATG
Tacrolimus,cyclosporine
rATG
NFAF TAANFNFAATTAFAFFF A NAA NNAP-1 NAPA NNP 11PP
MAP kinases
D3/TC
kkinasi
CRRCRR
es sessIKKes sessIKK
F-FF-κκBκκκBB
CD3
APAP in
eeeeeee
eurin MMMMAA
peptide
CD4
CD8
DaclizumabBasiliximab
IL-2rATG
Signal 3
IL-2R
Prednisone
PI-3K
mTOR cdK/cyclins
Sirolimus, Everolimus
A
B
Figure 3. T-cell activation
(A) Dendritic cell encounters T cell and forms an immunological synapse (B) Signals for T-cell activation and individual targets of
immunosuppressive drugs as described in this dissertation. Antigens (‘peptides’) trigger T-cell receptor (TCR) activation (signal 1). CD80 and CD86
on the dendritic cell engage CD28 on the T cell to provide signal 2. Signal 1 and 2 activate three signal transduction pathways. These pathways
trigger the transcription of the IL-2Rα chain CD25. Jak3 is activated by the third signal which is mediated via cytokines of the γc. The mode of
action of every group of immunosuppressants is depicted in white textballoons81.

Chap
ter 1
20
Therefore, anti-IL-2Rα antibodies are used as induction therapy at times before but generally after
transplantation. In contrast to rATG that exist in two mixtures with a lymphocyte non-depleting
and depleting eff ect, anti-IL-2Rα antibodies are only non-depleting. Daclizumab (Zenapax-Hoff -
mann-La Roche) was the fi rst humanized mAb (~90% human and 10% murine) to the IL-2-receptor
(Figure 3). The current commercially available preparation of anti-IL-2Rα monoclonal antibodies is
the chimeric mAb (~75% human and 25% murine protein) basiliximab (Figure 3)85.
1.5.2 Calcineurin inhibitors
The introduction of cyclosporine A by Sir Roy Calne in 1980 was a revolution in the transplanta-
tion fi eld as it markedly improved patient outcomes. Cyclosporine A was and still is the corner-
stone of immunosuppression in transplantation for more than two decades. Cyclosporine A
binds to cyclophilins, which are cytoplasmic chaperone proteins of the immunophilin family,
forming a complex that engages calcineurin leading to blockade of NFAT that is required for the
transcription of the gene encoding IL-2 (Figure 3)86. Adverse eff ects of cyclosporine A include
nephrotoxicity, hypertension, hyperlidemia, gingival hyperplasia, hirsutism and tremor. More-
over, it can also induce the hemolytic-uremic syndrome and post-transplantation diabetes
mellitus81 and increases the growth of facial and body hair.
Tacrolimus engages another member of the immunophilin family, FK506 (tacrolimus)-bind-
ing protein 12 to create a complex that inhibits calcineurin with greater molar potency than
cyclosporine A81. Although there are no chemical similarities, cyclosporine A and tacrolimus
act in the same way via the prevention of translocation of the signal evoked by antigen from
the surface to the nucleus of the T cell (Figure 3). However, tacrolimus prolonged the life of
experimental organ grafts87, 88 and treatment with tacrolimus resulted in less rejection than
with cyclosporine, as indicated by several trials89, 90. Minute quantities of this compound have
extremely powerful immunosuppressive properties. Side eff ects of tacrolimus are nephrotoxic-
ity and toxic eff ects on the central nervous system and the islets of Langerhans.
1.5.3 Jak inhibitors
Upon binding of cytokines and growth factors to the cell, intracellular signaling is conducted
via the Janus family of tyrosine kinases (Jak) which consists of four kinases. Binding of cytokines
of the IL-2 family to their receptors that signal via the γc (as mentioned above) can activate the
phosphorylation of Jak3 which then phosphorylates the tyrosine residues on the receptor91.
Mutations of the γc or Jak3 have profound eff ects on the immune system and result in severe
combined immunodefi ciency (SCID) in mice. In humans, these mutations can cause X-linked
severe combined immunodefi ciency (X-SCID) syndrome92, 93 in which the T and NK-cells are
absent. When Jak3 associates with the γc, and is phosphorylated, signal transducers and acti-
vators of transcription (STAT) proteins are recruited to the Jak-γc receptor complex. Following
binding of a cytokine to its receptor, STATs are phosphorylated by activated Jaks and dimerize.
Subsequently STAT dimers translocate into the nucleus leading to gene transcription. Jak3

General Introduction 21
recruits STAT5, that can bind to the promoter region of several downstream target genes as
FOXP3 and IL-2Rα. STAT5A and STAT5B play essential roles in orchestrating immune regulation
and the development of immune cells94.
Signal 3, the cytokine-signal that initiates signaling via the Jak-STAT pathway can be blocked
by the Jak inhibitor CP-690,550 (Figure 3). It is being developed as an alternative immunosup-
pressive drug to calcineurin inhibitors in order to serve as the primary immunosuppressive
agent for preventing acute rejection in kidney allograft recipients. Currently Phase II clinical
trials with this compound are running.
1.5.4 Proliferation inhibitors
MMF and the mTOR-inhibitors sirolimus (rapamycin) and everolimus are the most commonly used
lymphocyte proliferation inhibitors. MMF is derived from mycophenolic acid (MPA) from the peni-
cillum molds. For their replication, lymphocytes require synthesis of purine and pyrimidine nucleo-
tides that are regulated by iosine monophosphate dehydrogenase (IMPDH) and dihydro-orotate
dehydrogenase (DHODH), respectively. MMF inhibits the synthesis of guanosine monophosphate
nucleotides by IMPDH and thereby blocks the purine synthesis, preventing proliferation of T and B
cells95. Its main non-immune related toxicity is gastrointestinal symptoms (mainly diarrhea), neu-
tropenia, and mild anemia. In addition, absorption of this drug may be reduced by cyclosporine.
Sirolimus and everolimus can -just as tacrolimus- bind to FK506 binding protein 12, the com-
plex that inhibits the calcineurin phosphatase and T-cell activation. The most common adverse
eff ects are hyperlipidemia, increased exposure to the toxicity eff ects of calcineurin inhibitors,
thrombocytopenia, delayed graft function and mouth ulcers. Sirolimus and everolimus both
have anti-neoplastic and arterial protective eff ects.
1.5.5 Corticosteroids
In the 1950s, hormones that can bind to glucocorticoid receptors on virtually all cells and exert
pleiotropic eff ects on multiple signaling pathways were discovered, named corticosteroids96.
Within the cell, the cortisol-glucocorticoid receptor complex moves to the nucleus and binds
as a homodimer to DNA-sequences, thereby facilitating or inhibiting transcription. Corticoste-
roids inhibit transcription factors as NF-κB and IL-2, TNF-α and IFN-γ. Furthermore, they inhibit
protein synthesis to ultimately result in the inhibition of the release of numerous cellular media-
tors, such as interleukins, prostaglandins, leukotrienes, etc. that intervene in immunological
reactions, thereby aff ecting the concentration, distribution and function of leucocytes. Because
of the diverse mechanisms of actions of the corticosteroids, they are probably one of the most
potent immunosuppressive drugs used in the setting of solid organ transplantation, as they
inhibit the function of both APCs and (predominantly CD4+) T cells at the level of proliferation
and cytokine production86.
Corticosteroids were seen as ‘miracle drugs’ by physicians that off ered a relief for a diverse
group of diseases. In 1950, dr. Philip Hench was awarded with the Nobel Prize for treatment of

Chap
ter 1
22
a patient with rheumatoid arthritis with corticosteroids. In the early 1960s, corticosteroids were
used to reverse acute rejection in a living donor kidney transplant recipient97 and physicians
all over the world quickly adopted the routine use of corticosteroids, in particular prednisone,
prednisolone or methylprednisolone into the cocktail already consisting of a calcineurin inhibi-
tor and a proliferation inhibitor that became the ‘standard’ therapy for all kidney transplantation
patients98. However, therapy with this class of immunosuppressive drugs is accompanied with
various chronic toxicities. They cause major complications as water and salt retention leading
to swelling and edema, high blood pressure, diabetes, showing that this two-edged sword has
its impact on solid-organ transplantation.
1.6 AIM AND OUTLINE OF THIS THESIS
CD4+CD25bright Treg require IL-2 for their expansion, homeostasis and function38. Inhibition of
the IL-2 pathway may therefore hamper the frequency and suppressive activities of regulatory
T cells. However, to date, the eff ect of the calcineurin inhibitor cyclosporine on the function
of CD4+CD25bright Treg remains controversial. On one hand, several publications99-102 demon-
strate a negative infl uence on the number and suppressive capacities of CD4+CD25bright Treg
e.g. cyclosporine has been shown to inhibit FOXP3 mRNA expression in MLR103. On the other
hand, evidence suggests that it does not seem to aff ect the frequency and suppressive capacity
of CD4+CD25brightFoxP3+ T cells5, 104, 105. Therefore, a study in human organ transplant recipients
in which the eff ect of calcineurin inhibitors on the suppressive activities of human peripheral
CD4+CD25bright Treg is investigated would be enlightening.
RATG has been shown to induce CD4+CD25brightFoxP3+ Treg in vitro and in peripheral cells
of healthy individuals78. Moreover, data showing that horse ATG does not have the capacity
to induce Treg106 demonstrate that Treg-induction is a species-specifi c characteristic of rabbit
ATG. Thus, the mechanisms of action of T-cell depletion agents does not seem to concentrate
fully on T cell depletion but also on the immune regulatory component that may contribute
to donor-specifi c hyporesponsiveness after solid organ transplantation. These fi ndings create
new potential for rATG to manipulate the immune system of organ transplant recipients by
inducing (donor-specifi c) Treg, as has been shown before for the mTOR inhibitors everolimus
and sirolimus107-110.
Data with regard to the eff ect of MMF on Treg are scarce. Few groups reported that MMF
does not interfere with the suppressor function of Treg100, 111. MMF has been shown to decrease
the CD25-expression on lymphocytes112. Considering that MMF does not interfere with the IL-2
signaling pathway, one can only speculate that it will not negatively aff ect Treg function. As
the cytokine signal and the downstream Jak-STAT5 pathway both are important for FoxP3-
expression and the function of Treg, the Jak inhibitor CP-690,550 might aff ect Treg.

General Introduction 23
The scarce and controversial data from (animal) experimental models and studies describing
the eff ect of immunosuppressive drugs on Treg, urges the quest for the analysis of regulatory T
cells in immune suppressed organ transplant patients. This thesis focuses on the eff ects of vari-
ous immunosuppressive drugs on the cell surface marker expression, frequency and function
of human Treg in the peripheral blood.
Chapter 2 describes the eff ect of triple therapy, consisting of cyclosporine, MMF and pred-
nisone on the suppressive capacity of natural CD4+CD25bright T cells in kidney transplant
patients at 6-24 months after transplantation. In Chapter 3, we address the infl uence of
two diff erent immunosuppressive protocols; 1) tacrolimus/rapamycin and 2) tacrolimus/
MMF in the fi rst year after clinical kidney transplantation on the generation of donor-specifi c
regulatory T-cell function. In this prospective study, we monitor the phenotype, frequency and
function of CD4+CD25brightFoxP3+ T cells in the peripheral blood of kidney transplant patients
who received these immunosuppressive therapies. The chapters 4, 5 and 6 are dedicated
to the rabbit anti-thymocyte globulins. The eff ect of rATG-induction therapy on peripheral
blood cells of kidney transplant patients is shown in chapter 4. In a prospective and controlled
study, that included kidney transplant patients who received rATG-induction therapy and
triple therapy consisting of tacrolimus, MMF and prednisone and kidney transplant patients
in the control group that received triple therapy only, we measure the phenotype and fre-
quency of CD4+CD25brightFoxP3+CD127-/low T cells and analyze their function. To elaborate
on the results of Treg induction by rATG in cells from healthy individuals as has been shown
before78, chapter 5 questions whether rATG can also induce Treg in peripheral blood cells
of patients with end-stage renal disease, who are candidates for kidney transplantation and
rATG-induction therapy. Chapter 6 investigates whether tacrolimus infl uences the induction
of CD25+ T cells by rATG. Chapter 7 describes the impact of the Jak inhibitor CP-690,550 on
peripheral CD4+CD25bright T cells and CD25-/dim Teff cells of healthy individuals according to
their STAT5 phosphorylation and their suppressive and proliferative function respectively.
Furthermore, we investigate the suppressive activities of peripheral CD25bright T cells of kidney
transplant patients who received CP-690,550 therapy, whereas CP-690,550 is present in the
suppression assays. These results will be compared with that of the CD25bright T cells from
patients in the cyclosporine (comparator) group. Chapter 8 draws attention to the infl uence
of immunosuppressants on regulatory T cells in liver transplantation. The eff ect of conversion
from a calcineurin inhibitor based immunosuppressive treatment to a MMF based treatment
on the frequency of CD4+CD25brightFoxP3+ T cells in liver transplant patients and calcineurin
inhibitor associated side eff ects are described.

Chap
ter 1
24
REFERENCES
1. McKinley, M. and O’Loughlin, V. Human Anatomy, 2nd Edition, (2007). 2. Lawler, R.H., West, J.W., Mc, N.P., Clancy, E.J. & Murphy, R.P. Homotransplantation of the kidney in the
human; supplemental report of a case. J Am Med Assoc 147, 45-46 (1951). 3. Merrill, J.P., Murray, J.E., Harrison, J.H. & Guild, W.R. Successful homotransplantation of the human
kidney between identical twins. J Am Med Assoc 160, 277-282 (1956). 4. Starzl, T.E. et al. Homotransplantation of the Liver in Humans. Surg Gynecol Obstet 117, 659-676 (1963). 5. Noris, M. et al. Regulatory T Cells and T Cell Depletion: Role of Immunosuppressive Drugs. J Am Soc
Nephrol 18, 1007-1018 (2007). 6. Golshayan, D., Buhler, L., Lechler, R.I. & Pascual, M. From current immunosuppressive strategies to
clinical tolerance of allografts. Transpl Int 20, 12-24 (2007). 7. Meier-Kriesche, H.U., Schold, J.D. & Kaplan, B. Long-term renal allograft survival: have we made
signifi cant progress or is it time to rethink our analytic and therapeutic strategies? Am J Transplant 4, 1289-1295 (2004).
8. Gould, D.S. & Auchincloss, H., Jr. Direct and indirect recognition: the role of MHC antigens in graft rejection. Immunol Today 20, 77-82 (1999).
9. Sanchez-Fueyo, A. et al. Infl uence of direct and indirect allorecognition pathways on CD4+CD25+ regulatory T-cell function in transplantation. Transpl Int 20, 534-541 (2007).
10. Benichou, G., Kant, C.D., Madsen, J. & Tocco, G. Modulation of alloreactivity to MHC-derived peptides and transplantation tolerance. Front Biosci 12, 4239-4247 (2007).
11. Auchincloss, H., Jr. et al. The role of “indirect” recognition in initiating rejection of skin grafts from major histocompatibility complex class II-defi cient mice. Proc Natl Acad Sci U S A 90, 3373-3377 (1993).
12. Waanders, M.M. et al. Monitoring of indirect allorecognition: wishful thinking or solid data? Tissue Antigens 71, 1-15 (2008).
13. Roitt, I.M., Brostoff , J. & Male, D.K. Immunology. 5th Edition Mosby International Ltd (1998). 14. Janeway, C.A., Travers, P., Walport, M. & Capra, J.D. Immunobiology The immune system in health and
disease. 4th Edition Elsevier Science Ltd/Garland Publishing (1999). 15. Buckner, J.H. & Ziegler, S.F. Regulating the immune system: the induction of regulatory T cells in the
periphery. Arthritis Res Ther 6, 215-222 (2004). 16. Sakaguchi, S., Sakaguchi, N., Asano, M., Itoh, M. & Toda, M. Immunologic self-tolerance maintained by
activated T cells expressing IL-2 receptor alpha-chains (CD25). Breakdown of a single mechanism of self-tolerance causes various autoimmune diseases. J Immunol 155, 1151-1164 (1995).
17. Vignali, D.A., Collison, L.W. & Workman, C.J. How regulatory T cells work. Nat Rev Immunol 8, 523-532 (2008).
18. Sakaguchi, S. et al. Immunologic tolerance maintained by CD25+ CD4+ regulatory T cells: their com-mon role in controlling autoimmunity, tumor immunity, and transplantation tolerance. Immunol Rev 182, 18-32 (2001).
19. Tang, Q. & Bluestone, J.A. The Foxp3+ regulatory T cell: a jack of all trades, master of regulation. Nat Immunol 9, 239-244 (2008).
20. Halloran, P.F., Bromberg, J., Kaplan, B. & Vincenti, F. Tolerance Versus Immunosuppression: A Perspec-tive. Am J Transplant 8, 1365-1366 (2008).
21. Joosten, I. & Hilbrands, L.B. Tolerantie na orgaantransplantatie: is het mogelijk en hoe stel je het vast? Ned Tijdschr Klin Chem Labgeneesk 34, 26-34 (2009).
22. Martinez-Llordella, M. et al. Using transcriptional profi ling to develop a diagnostic test of operational tolerance in liver transplant recipients. J Clin Invest 118, 2845-2857 (2008).
23. Martinez-Llordella, M. et al. Multiparameter immune profi ling of operational tolerance in liver trans-plantation. Am J Transplant 7, 309-319 (2007).
24. Koshiba, T. et al. Clinical, immunological, and pathological aspects of operational tolerance after pediatric living-donor liver transplantation. Transpl Immunol 17, 94-97 (2007).

General Introduction 25
25. Gershon, R.K. & Kondo, K. Infectious immunological tolerance. Immunology 21, 903-914 (1971). 26. Hall, B.M., Jelbart, M.E., Gurley, K.E. & Dorsch, S.E. Specifi c unresponsiveness in rats with prolonged
cardiac allograft survival after treatment with cyclosporine. Mediation of specifi c suppression by T helper/inducer cells. J Exp Med 162, 1683-1694 (1985).
27. Hall, B.M., Pearce, N.W., Gurley, K.E. & Dorsch, S.E. Specifi c unresponsiveness in rats with prolonged cardiac allograft survival after treatment with cyclosporine. III. Further characterization of the CD4+ suppressor cell and its mechanisms of action. J Exp Med 171, 141-157 (1990).
28. Bennett, C.L. et al. The immune dysregulation, polyendocrinopathy, enteropathy, X-linked syndrome (IPEX) is caused by mutations of FOXP3. Nat Genet 27, 20-21 (2001).
29. Schubert, L.A., Jeff ery, E., Zhang, Y., Ramsdell, F. & Ziegler, S.F. Scurfi n (FOXP3) acts as a repressor of transcription and regulates T cell activation. J Biol Chem 276, 37672-37679 (2001).
30. Hori, S., Nomura, T. & Sakaguchi, S. Control of regulatory T cell development by the transcription fac-tor Foxp3. Science 299, 1057-1061 (2003).
31. Fontenot, J.D., Gavin, M.A. & Rudensky, A.Y. Foxp3 programs the development and function of CD4+CD25+ regulatory T cells. Nat Immunol 4, 330-336 (2003).
32. Zheng, Y. et al. Genome-wide analysis of Foxp3 target genes in developing and mature regulatory T cells. Nature 445, 936-940 (2007).
33. Hu, H., Djuretic, I., Sundrud, M.S. & Rao, A. Transcriptional partners in regulatory T cells: Foxp3, Runx and NFAT. Trends Immunol 28, 329-332 (2007).
34. Wu, Y. et al. FOXP3 controls regulatory T cell function through cooperation with NFAT. Cell 126, 375-387 (2006).
35. Liu, W. et al. CD127 expression inversely correlates with FoxP3 and suppressive function of human CD4+ T reg cells. J Exp Med 203, 1701-1711 (2006).
36. Tao, R. et al. Deacetylase inhibition promotes the generation and function of regulatory T cells. Nat Med 13, 1299-1307 (2007).
37. Lal, G. et al. Epigenetic regulation of Foxp3 expression in regulatory T cells by DNA methylation. J Immunol 182, 259-273 (2009).
38. Furtado, G.C., Curotto de Lafaille, M.A., Kutchukhidze, N. & Lafaille, J.J. Interleukin 2 signaling is required for CD4(+) regulatory T cell function. J Exp Med 196, 851-857 (2002).
39. Thornton, A.M. & Shevach, E.M. CD4+CD25+ immunoregulatory T cells suppress polyclonal T cell activation in vitro by inhibiting interleukin 2 production. J Exp Med 188, 287-296 (1998).
40. Barthlott, T. et al. CD25+ CD4+ T cells compete with naive CD4+ T cells for IL-2 and exploit it for the induction of IL-10 production. Int Immunol 17, 279-288 (2005).
41. Tang, A.L. et al. CTLA4 expression is an indicator and regulator of steady-state CD4+ FoxP3+ T cell homeostasis. J Immunol 181, 1806-1813 (2008).
42. Gavin, M.A. et al. Single-cell analysis of normal and FOXP3-mutant human T cells: FOXP3 expression without regulatory T cell development. Proc Natl Acad Sci U S A 103, 6659-6664 (2006).
43. Tran, D.Q., Ramsey, H. & Shevach, E.M. Induction of FOXP3 expression in naive human CD4+FOXP3 T cells by T-cell receptor stimulation is transforming growth factor-beta dependent but does not confer a regulatory phenotype. Blood 110, 2983-2990 (2007).
44. Wood, K.J. & Sawitzki, B. Interferon gamma: a crucial role in the function of induced regulatory T cells in vivo. Trends Immunol 27, 183-187 (2006).
45. Collison, L.W. et al. The inhibitory cytokine IL-35 contributes to regulatory T-cell function. Nature 450, 566-569 (2007).
46. Bardel, E., Larousserie, F., Charlot-Rabiega, P., Coulomb-L’Hermine, A. & Devergne, O. Human CD4+ CD25+ Foxp3+ regulatory T cells do not constitutively express IL-35. J Immunol 181, 6898-6905 (2008).
47. Grossman, W.J. et al. Human T regulatory cells can use the perforin pathway to cause autologous target cell death. Immunity 21, 589-601 (2004).
Chap
ter 1
26
48. Gondek, D.C., Lu, L.F., Quezada, S.A., Sakaguchi, S. & Noelle, R.J. Cutting edge: contact-mediated sup-pression by CD4+CD25+ regulatory cells involves a granzyme B-dependent, perforin-independent mechanism. J Immunol 174, 1783-1786 (2005).
49. Zhao, D.M., Thornton, A.M., DiPaolo, R.J. & Shevach, E.M. Activated CD4+CD25+ T cells selectively kill B lymphocytes. Blood 107, 3925-3932 (2006).
50. Mahic, M. et al. Diff erentiation of naive CD4+ T cells into CD4+CD25+FOXP3+ regulatory T cells by continuous antigen stimulation. J Leukoc Biol 83, 1111-1117 (2008).
51. Mahic, M. et al. Generation of highly suppressive adaptive CD8(+)CD25(+)FOXP3(+) regulatory T cells by continuous antigen stimulation. Eur J Immunol 38, 640-646 (2008).
52. Zhang, Z.X., Yang, L., Young, K.J., DuTemple, B. & Zhang, L. Identifi cation of a previously unknown antigen-specifi c regulatory T cell and its mechanism of suppression. Nat Med 6, 782-789 (2000).
53. Seino, K.I. et al. Requirement for natural killer T (NKT) cells in the induction of allograft tolerance. Proc Natl Acad Sci U S A 98, 2577-2581 (2001).
54. Roncarolo, M.G. et al. Interleukin-10-secreting type 1 regulatory T cells in rodents and humans. Immu-nol Rev 212, 28-50 (2006).
55. Weiner, H.L. Oral tolerance: immune mechanisms and the generation of Th3-type TGF-beta-secreting regulatory cells. Microbes Infect 3, 947-954 (2001).
56. Ford McIntyre, M.S., Young, K.J., Gao, J., Joe, B. & Zhang, L. Cutting edge: In vivo trogocytosis as a mechanism of double negative regulatory T cell-mediated antigen-specifi c suppression. J Immunol 181, 2271-2275 (2008).
57. Chen, W., Ford, M.S., Young, K.J. & Zhang, L. The role and mechanisms of double negative regulatory T cells in the suppression of immune responses. Cell Mol Immunol 1, 328-335 (2004).
58. Lin, T. et al. Development of TCR-gamma delta CD4-CD8+ alpha alpha but not TCR-alpha beta CD4-CD8+ alpha alpha i-IEL is resistant to cyclosporin A. J Immunol 155, 4224-4230 (1995).
59. Morita, M. et al. Spontaneous tolerance involving natural killer T cells after hepatic grafting in mice. Transpl Immunol 18, 142-145 (2007).
60. Ma, A., Qi, S., Xu, D., Daloze, P. & Chen, H. Immunological evaluation of combination therapy with tacrolimus and sirolimus on long-term allograft survival in nonhuman primates. Transplant Proc 37, 150-154 (2005).
61. Whitacre, C.C., Gienapp, I.E., Orosz, C.G. & Bitar, D.M. Oral tolerance in experimental autoimmune encephalomyelitis. III. Evidence for clonal anergy. J Immunol 147, 2155-2163 (1991).
62. Melamed, D. & Friedman, A. Direct evidence for anergy in T lymphocytes tolerized by oral administra-tion of ovalbumin. Eur J Immunol 23, 935-942 (1993).
63. Weiner, H.L. Induction and mechanism of action of transforming growth factor-beta-secreting Th3 regulatory cells. Immunol Rev 182, 207-214 (2001).
64. Miller, A., Lider, O., Roberts, A.B., Sporn, M.B. & Weiner, H.L. Suppressor T cells generated by oral toler-ization to myelin basic protein suppress both in vitro and in vivo immune responses by the release of transforming growth factor beta after antigen-specifi c triggering. Proc Natl Acad Sci U S A 89, 421-425 (1992).
65. Moller, G. Do suppressor T cells exist? Scand J Immunol 27, 247-250 (1988). 66. Scotto, L. et al. Overlap between molecular markers expressed by naturally occurring CD4+CD25+
regulatory T cells and antigen specifi c CD4+CD25+ and CD8+CD28- T suppressor cells. Hum Immunol 65, 1297-1306 (2004).
67. Manavalan, J.S. et al. Alloantigen specifi c CD8+CD28- FOXP3+ T suppressor cells induce ILT3+ ILT4+ tolerogenic endothelial cells, inhibiting alloreactivity. Int Immunol 16, 1055-1068 (2004).
68. Zhou, L., Chong, M.M. & Littman, D.R. Plasticity of CD4+ T cell lineage diff erentiation. Immunity 30, 646-655 (2009).
69. Masteller, E.L., Tang, Q. & Bluestone, J.A. Antigen-specifi c regulatory T cells--ex vivo expansion and therapeutic potential. Semin Immunol 18, 103-110 (2006).

General Introduction 27
70. Hoff mann, P., Eder, R., Kunz-Schughart, L.A., Andreesen, R. & Edinger, M. Large-scale in vitro expansion of polyclonal human CD4(+)CD25high regulatory T cells. Blood 104, 895-903 (2004).
71. Sagoo, P., Lombardi, G. & Lechler, R.I. Regulatory T cells as therapeutic cells. Curr Opin Organ Transplant 13, 645-653 (2008).
72. Hoff mann, P. et al. Loss of FOXP3 expression in natural human CD4+CD25+ regulatory T cells upon repetitive in vitro stimulation. Eur J Immunol 39, 1088-1097 (2009).
73. Zhou, X. et al. Instability of the transcription factor Foxp3 leads to the generation of pathogenic memory T cells in vivo. Nat Immunol 10, 1000-1007 (2009).
74. Hoff mann, P. et al. Only the CD45RA+ subpopulation of CD4+CD25high T cells gives rise to homoge-neous regulatory T cell lines upon in vitro expansion. Blood 108, 4260-4267 (2006).
75. Kingsley, C.I., Karim, M., Bushell, A.R. & Wood, K.J. CD25+CD4+ regulatory T cells prevent graft rejec-tion: CTLA-4- and IL-10-dependent immunoregulation of alloresponses. J Immunol 168, 1080-1086 (2002).
76. Karim, M., Kingsley, C.I., Bushell, A.R., Sawitzki, B.S. & Wood, K.J. Alloantigen-induced CD25+CD4+ regulatory T cells can develop in vivo from CD25-CD4+ precursors in a thymus-independent process. J Immunol 172, 923-928 (2004).
77. Kretschmer, K. et al. Inducing and expanding regulatory T cell populations by foreign antigen. Nat Immunol 6, 1219-1227 (2005).
78. Lopez, M., Clarkson, M.R., Albin, M., Sayegh, M.H. & Najafi an, N. A novel mechanism of action for anti-thymocyte globulin: induction of CD4+CD25+Foxp3+ regulatory T cells. J Am Soc Nephrol 17, 2844-2853 (2006).
79. Gao, W. et al. Contrasting Eff ects of Cyclosporine and Rapamycin in De Novo Generation of Alloanti-gen-Specifi c Regulatory T Cells. Am J Transplant 7, 1-11 (2007).
80. Shevach, E.M., Tran, D.Q., Davidson, T.S. & Andersson, J. The critical contribution of TGF-beta to the induction of Foxp3 expression and regulatory T cell function. Eur J Immunol 38, 915-917 (2008).
81. Halloran, P.F. Immunosuppressive drugs for kidney transplantation. N Engl J Med 351, 2715-2729 (2004).
82. Preville, X. et al. Mechanisms involved in antithymocyte globulin immunosuppressive activity in a nonhuman primate model. Transplantation 71, 460-468 (2001).
83. Bonnefoy-Berard, N., Vincent, C. & Revillard, J.P. Antibodies against functional leukocyte surface molecules in polyclonal antilymphocyte and antithymocyte globulins. Transplantation 51, 669-673 (1991).
84. Bonnefoy-Berard, N., Verrier, B., Vincent, C. & Revillard, J.P. Inhibition of CD25 (IL-2R alpha) expression and T-cell proliferation by polyclonal anti-thymocyte globulins. Immunology 77, 61-67 (1992).
85. Mottershead, M. & Neuberger, J. Daclizumab. Expert Opin Biol Ther 7, 1583-1596 (2007). 86. Akl, A., Luo, S. & Wood, K.J. Induction of transplantation tolerance-the potential of regulatory T cells.
Transpl Immunol 14, 225-230 (2005). 87. Ochiai, T. et al. Eff ect of a new immunosuppressive agent, FK 506, on heterotopic cardiac allotrans-
plantation in the rat. Transplant Proc 19, 1284-1286 (1987). 88. Starzl, T.E. et al. FK 506 for liver, kidney, and pancreas transplantation. Lancet 2, 1000-1004 (1989). 89. A comparison of tacrolimus (FK 506) and cyclosporine for immunosuppression in liver transplanta-
tion. The U.S. Multicenter FK506 Liver Study Group. N Engl J Med 331, 1110-1115 (1994). 90. Randomised trial comparing tacrolimus (FK506) and cyclosporin in prevention of liver allograft rejec-
tion. European FK506 Multicentre Liver Study Group. Lancet 344, 423-428 (1994). 91. Pesu, M. et al. Therapeutic targeting of Janus kinases. Immunol Rev 223, 132-142 (2008). 92. Noguchi, M. et al. Interleukin-2 receptor gamma chain mutation results in X-linked severe combined
immunodefi ciency in humans. Cell 73, 147-157 (1993). 93. Leonard, W.J. The molecular basis of X-linked severe combined immunodefi ciency: defective cytokine
receptor signaling. Annu Rev Med 47, 229-239 (1996).

Chap
ter 1
28
94. Hennighausen, L. & Robinson, G.W. Interpretation of cytokine signaling through the transcription factors STAT5A and STAT5B. Genes Dev 22, 711-721 (2008).
95. Allison, A.C. & Eugui, E.M. Mycophenolate mofetil and its mechanisms of action. Immunopharmacol-ogy 47, 85-118 (2000).
96. Rhen, T. & Cidlowski, J.A. Antiinfl ammatory action of glucocorticoids--new mechanisms for old drugs. N Engl J Med 353, 1711-1723 (2005).
97. Goodwin, W.E., Mims, M.M. & Kaufman, J.J. Human renal transplantation III. Technical problems encountered in six cases of kidney homotransplantation. Trans Am Assoc Genitourin Surg 54, 116-125 (1962).
98. Curtis, J. Corticosteroids and kidney transplantation. Clin J Am Soc Nephrol 1, 907-908 (2006). 99. Segundo, D.S. et al. Calcineurin inhibitors, but not rapamycin, reduce percentages of
CD4+CD25+FOXP3+ regulatory T cells in renal transplant recipients. Transplantation 82, 550-557 (2006).
100. Zeiser, R. et al. Inhibition of CD4+CD25+ regulatory T-cell function by calcineurin-dependent interleu-kin-2 production. Blood 108, 390-399 (2006).
101. Demirkiran, A. et al. Decrease of CD4+CD25+ T cells in peripheral blood after liver transplantation: association with immunosuppression. Transplant Proc 37, 1194-1196 (2005).
102. Coenen, J.J., Koenen, H.J., van Rijssen, E., Hilbrands, L.B. & Joosten, I. Rapamycin, and not cyclosporin A, preserves the highly suppressive CD27+ subset of human CD4+CD25+ regulatory T cells. Blood 107, 1018-1023 (2006).
103. Baan, C.C. et al. Diff erential eff ect of calcineurin inhibitors, anti-CD25 antibodies and rapamycin on the induction of FOXP3 in human T cells. Transplantation 80, 110-117 (2005).
104. Meloni, F. et al. Peripheral CD4+ CD25+ Treg cell expansion in lung transplant recipients is not aff ected by calcineurin inhibitors. Int Immunopharmacol 6, 2002-2010 (2006).
105. Calvo-Turrubiartes, M. et al. Quantitative analysis of regulatory T cells in kidney graft recipients: A relationship with calcineurin inhibitor level. Transpl Immunol 21, 43-49 (2009).
106. Feng, X. et al. Rabbit ATG but not horse ATG promotes expansion of functional CD4+CD25highFOXP3+ regulatory T cells in vitro. Blood 111, 3675-3683 (2008).
107. Long, S.A. & Buckner, J.H. Combination of rapamycin and IL-2 increases de novo induction of human CD4(+)CD25(+)FOXP3(+) T cells. J Autoimmun 30, 293-302 (2008).
108. Coenen, J.J. et al. Rapamycin, not cyclosporine, permits thymic generation and peripheral preserva-tion of CD4+ CD25+ FoxP3+ T cells. Bone Marrow Transplant 39, 537-545 (2007).
109. Chapman, J.R. et al. Proliferation signal inhibitors in transplantation: questions at the cutting edge of everolimus therapy. Transplant Proc 39, 2937-2950 (2007).
110. Game, D.S., Hernandez-Fuentes, M.P. & Lechler, R.I. Everolimus and basiliximab permit suppression by human CD4+CD25+ cells in vitro. Am J Transplant 5, 454-464 (2005).
111. Porter, S.B. et al. Suppressor function of umbilical cord blood-derived CD4+CD25+ T-regulatory cells exposed to graft-versus-host disease drugs. Transplantation 82, 23-29 (2006).
112. Gummert, J.F., Barten, M.J., Sherwood, S.W., van Gelder, T. & Morris, R.E. Pharmacodynamics of immu-nosuppression by mycophenolic acid: inhibition of both lymphocyte proliferation and activation correlates with pharmacokinetics. J Pharmacol Exp Ther 291, 1100-1112 (1999).


Cha pter 2Functional Analysis of CD4+CD25bright T Cells in
Kidney Transplant Patients:Improving Suppression of Donor-Directed Responses
after Transplantation
Clinical Transplantation 22, 579-586 (2008)
Varsha D.K.D. Sewgobind1, 2, Luc J.W. van der Laan2, Mariska Klepper1,
Jan N.M. IJzermans2, Hugo W. Tilanus2, Willem Weimar1 and Carla C. Baan1
Departments of 1Internal Medicine and 2Surgery
Erasmus MC, University Medical Center Rotterdam, the Netherlands

Chap
ter 2
32
ABSTRACT
The role of CD4+CD25bright regulatory T cells (Treg) in controlling alloreactivity is established,
but little is known whether antigen-specifi c Treg are induced in fully immunosuppressed
kidney transplant patients. The frequency and function of CD25bright T cells of 9 stable kidney
transplant patients before and 0.5-2 yr after transplantation were measured. Patients received
triple therapy consisting of cyclosporine, MMF and prednisone. To investigate the infl uence
of transplantation and immunosuppression on Treg function, we compared their suppressive
capacities pre- and post-transplantation using mixed lymphocyte reactions (MLR) and kept the
CD25-/dim eff ector T-cell (Teff ) population constant. After transplantation, the percentage of
CD4+CD25bright T cells signifi cantly decreased from 8.5% pre-transplant to 6.9% post-transplant
(median, p=0.05). However, the lower percentage of post-transplant CD4+CD25bright T cells was
not associated with reduced, but rather improved suppressor function of these cells. The prolif-
erative response of pre-transplant Teff to donor-antigens was more profoundly suppressed by
post-transplant Treg than by pre-transplant Treg (pre-transplant 18% vs. post-transplant 55%,
median, p=0.03) and was comparable against third party antigens at a CD25bright : CD25-/dim
ratio of 1:20. In immunosuppressed kidney transplant patients, the donor-directed suppressive
capacity of CD4+CD25bright regulatory T cells improved, which may contribute to the develop-
ment of donor-specifi c hyporesponsiveness against the graft.

Improved Suppression by Regulatory T Cells after Transplantation 33
INTRODUCTION
After kidney transplantation, patients receive immunosuppressive therapy to prevent and to
treat rejection of the allograft. Triple therapy, consisting of CNIs, MMF and steroids has contrib-
uted to low rates of acute rejection1. These immunosuppressants are able to inhibit alloreactiv-
ity by suppressing the donor-directed immune responses of activated eff ector T cells2. Unfor-
tunately, the current prescribed drugs interfere with T-cell responses in a nonspecifi c manner,
resulting in adverse eff ects, e.g., they increase the susceptibility for infections and malignancies
but also non-immunological complications such as osteoporosis, diabetes and cardiovascular
problems2, 3. To decrease or even to prevent these side eff ects, a more specifi c approach to
target the donor-specifi c T cells is necessary. An option could be cell-based therapy, where
immunosuppression is mediated via cells already present in the patient. FoxP3+CD4+CD25bright
regulatory T cells (Treg) are prime candidates comprising a distinct subpopulation of T cells
that have the ability to suppress the activation of other T cells and their cytokine production
(i.e., IL-2 or IFN-γ)4-6. The contribution of Treg in the induction and maintenance of tolerance of
the graft after organ transplantation has been demonstrated in several murine models7-9 but
studies showing their involvement in operational drug-free tolerance in patients are rare10-12.
In clinically tolerant recipients the number of Treg is normal, yet decreased in kidney transplant
patients with chronic rejection10.
Although we and others previously reported that Treg may mediate donor-directed
hyporesponsiveness in kidney-transplant patients13-16, there is signifi cant concern that
immunosuppressants may infl uence the frequency or the suppressive activities of Treg, and
thus hinder the development of hyporesponsiveness2, 17, 18. The function of CD25bright T cells
is investigated by measuring the level of suppression of a Teff population in a proliferation or
cytokine suppression assay19. In such proliferation suppression assays, the read-out of Treg
function is the response of the Teff population. However, both the Treg and Teff population
itself may be aff ected by several factors such as kidney failure, uremia, dialysis, the transplant,
immunosuppressants and other various factors. These factors may aff ect the read-out of Treg
function, which is disregarded in the suppression assay. Therefore, to analyze changes in Treg
function, the Teff population should remain constant in a suppression assay.
In the present study, we investigated whether kidney transplantation infl uences the fre-
quency and allosuppressive function and specifi city of peripheral CD25bright regulatory T cells
after transplantation. To study the changes in the function of CD25bright T cells, we performed a
suppression assay in which we determined the suppression of the pre-transplant Teff popula-
tion in the presence of pre- or post-transplant Treg.

Chap
ter 2
34
MATERIALS AND METHODS
Patients
Patients were asked by informed consent for their willingness to donate blood, a procedure
that was approved by the Medical Ethical Commission (METC) of the Erasmus Medical Centre.
Heparinized peripheral blood was obtained before and 5-24 months after transplantation from
kidney transplantation patients (n=9) treated with triple therapy consisting of cyclosporine
(whole blood trough level 178 ng/mL median, ranging from 85 to 250 ng/mL), MMF and low-
dose prednisone. The median age of the patients was 59 yr, ranging from 43 to 68 years. All
patients received a kidney from a deceased donor. The serum creatinine level decreased to 147
μM/L after transplantation (median, ranging from 99 to 252 μM/L). The mismatches between
donor and recipient for HLA A-B-DR were 1.1 ± 0.6 / 1.3 ± 0.7 / 1.1 ± 0.3 (Mean ± SD), respectively.
Patients (n=18) of an additional cohort for FoxP3 staining received kidneys from a deceased
donor and were treated with triple therapy consisting of tacrolimus, MMF and prednisone.
Isolation of Peripheral Blood Lymphocytes
Peripheral blood mononuclear cells (PBMC) were isolated by density gradient centrifugation
over Ficoll-paque (density 1.077 g/mL) (Amersham Pharmacia Biotech, Uppsala, Sweden).
PBMC were washed twice with RPMI 1640 medium (BioWhittaker, Verviers, Belgium) and frozen
in RPMI 1640-DM (Gibco BRL, Scotland, UK) supplemented with 2 mM/L L-glutamine (Gibco
BRL), 100 IU/mL penicillin (Gibco BRL), 100 μg/mL streptomycin (Gibco BRL), 10% fetal bovine
serum (FBS) (BioWhittaker), and 10% dimethylsulfoxide (Merck, Schuchardt, Germany) and
stored at -140˚C until analysis.
Isolation of human CD25bright cells and fl ow cytometric analysis
Pre- and post transplantation PBMC of each patient were thawed on one day and washed twice
with FBS and RPMI-1640 supplemented with DNase (20 μg/mL; Roche Molecular Biochemicals,
Mannheim, Germany) to prevent aggregation of cells. PBMC were suspended in 10 % Human
Culture Medium (HCM), which consisted of RPMI 1640 medium with L-glutamine (Bio Whit-
taker) supplemented with 10% pooled human serum (Blood Bank, Rotterdam, the Netherlands)
and 100 IU/mL penicillin (Gibco BRL), 100 μg/mL streptomycin (Gibco BRL). The CD25bright T cells
were isolated from PBMC after incubation with anti-CD25 microbeads, Miltenyi Biotec, Bergisch
Gladbach, Germany) followed by a positive selection (POSSEL-program) on the autoMACS
(Miltenyi Biotech). The untouched residual fraction consisted of CD25-/dim T cells and was used
as responder population in the MLR. The isolated and the residual fractions were washed
and resuspended in HCM for functional analysis. The PBMC population and the isolated and
residual fractions were characterized by fl ow cytometry. The purity of the fractions used for
functional analysis was determined by fi rst measuring the percentage of CD4+CD25bright in the
PBMC population and subsequently in the isolated and residual fractions. The purity of CD25+

Improved Suppression by Regulatory T Cells after Transplantation 35
T cells in the CD25bright isolated fraction was >90%, a typical example is depicted in Figure 1A.
To determine the CD25 expression per cell, we measured the geometric mean fl uorescence
intensity (gMFI) of CD25 of the CD4+CD25bright population in the PBMC and in the CD25bright
isolated fraction. Therefore, we used CD4-PERCP (BD Biosciences, San Jose, CA, USA) and CD25-
PE epitope B (clone M-A251, BD Biosciences). Flow cytometry was performed on a four color
FACS Calibur machine with Cell Quest Pro software (BD Biosciences).
In the additional cohort consisting of 18 kidney transplant patients, PBMCs pre- and post-
transplant were isolated and fl ow cytometry was performed with the same monoclonal antibod-
ies as described above, supplemented with FoxP3-APC (clone PCH101; eBioscience, San Diego,
CA, USA). Calibration was performed at least once a week calibration with reference CaliBRITETM
beads (unlabeled/FITC/PE/PERCP/APC catalog No. 349502, BD Biosciences). Instrument settings
of the FACS Calibur machine were comparable in the period when fl ow cytometry was performed.
Proliferation assay
The proliferation capacity of the Teff , the thawed donor and third party PBMC or spleen cells
(100 μL/5x104 cells per well, in triplicate) was tested by adding phytohemagglutinin (PHA) at
a fi nal concentration of 1 μg/mL in each well. Proliferation was assessed after 72 hr incubation
at 37°C in a humidifi ed atmosphere of 5% CO2 of which 3H-thymidine (0.5 μCi/well: Amersham
Pharmacia Biotech) was added for the last 8 hr before harvesting. 3H-thymidine incorporation
into DNA was assessed using a Betaplate counter (LKB-Wallac, Turku, Finland).
Treg function was determined by MLR in which the suppressive capacity of pre- or post-
transplant CD25bright cells was measured by their ability to inhibit the proliferative response
of the pre-transplant Teff . Pre- and post-transplant Treg were co-cultured in triplicate with
pre-transplant Teff . Irradiated (40 Gy) donor spleen cells and HLA mismatched (2-2-2) third
party PBMC were used as stimulator cells (1x10⁵ cells/100 μL) and co-cultured with 5x10⁴
cells/100 μL of a mixture of CD25bright : CD25dim/- at 1:10, 1:20 and 1:40 ratios in triplicate wells
in round-bottom 96-well plates (Nunc, Roskilde, Denmark). After 7 days of incubation at 37°C
in a humidifi ed atmosphere of 5% CO2, proliferation was measured after 3H-thymidine (0.5 μCi/
well: Amersham Pharmacia Biotech) incubation for the last 16 hr before harvesting.
Calculations and statistical analysis
The median counts per minute (cpm) for each triplicate was determined and the level of sup-
pression of the Teff population by Treg at diff erent ratios was expressed as the percentage inhi-
bition of the Teff population. The percentage inhibition is calculated by applying the following
formula: [(cpm Teff ) – (cpm Teff + Treg)] / (cpm Teff ) x 100.
Statistical analysis of the fl ow cytometry and MLR data was performed using Graphpad
Prism (version 4). For the determination of levels of statistical signifi cance, the two-sided prob-
ability values according to the Wilcoxon matched pairs test or Mann Whitney U-test were used.
P values ≤ 0.05 were considered statistically signifi cant.

Chap
ter 2
36
RESULTS
Flow cytometric analysis of the CD4+CD25bright regulatory T cells before and after transplantation
The percentage of CD4+CD25bright cells of total CD4+ lymphocytes in PBMC was signifi cantly
lower after than before transplantation (pre-transplant 8.5% vs. post-Transplant 6.9% median,
p=0.05, Figure 1B). To defi ne the level of CD25 expression per cell, the gMFI of CD25 of the
CD25bright T cells was determined in the PBMC population. This was lower after transplantation,
suggesting that the IL-2α receptor (CD25) is down-regulated (p=0.03, Figure 1C). However,
instead of CD25, FoxP3 is considered to be the most reliable Treg marker20-23. In the current
CD4
CD25
PBMC CD25-/dim CD25bright
7.4% 3.6% 90%
A
B C
Figure 1. Phenotyping of CD4+CD25bright T cells by fl ow cytometry
(A) Representative example of phenotyping of CD4+CD25bright T cells. CD4+CD25bright T cells are located in the oval gate and are expressed as
the percentage of the CD4+ lymphocytes in the PBMC population. The purity of the isolated CD25bright and the residual CD25-/dim fractions is
determined by gating the CD25bright T cells. (B) The percentage of CD4+CD25bright cells of the CD4+ in PBMC samples before- and after transplant
was measured, p=0.05. (C) For the CD25-expression per cell, the gMFI of CD25 of the CD25bright cells was assessed in the PBMCs. The gMFI
signifi cantly decreased after transplantation, p=0.03. Post-Tx, post-transplantation; pre-Tx, pre-transplantation.

Improved Suppression by Regulatory T Cells after Transplantation 37
study, we were unfortunately not able to measure the FoxP3 levels because of limited material
available for fl ow cytometry. Therefore, in an additional new cohort we stained PBMC of 18
kidney transplant patients for FoxP3 and we found that 70% (median) of the CD4+CD25bright T
cells were FoxP3+ pre- and post-transplant (data to be published). We also found that 95% of
the CD4+FoxP3+ cells were located in the CD4+CD25bright population.
CD25bright T cells of both pre- and post-transplant are able to regulate allogeneic immune responses
The function of Treg and Teff before and after transplantation was studied in the MLR. In
response to irradiated donor- or third party cells, the isolated CD25bright T cells did not prolifer-
ate, a characteristic feature of Treg, data not shown. When stimulated with donor antigens,
we observed a signifi cant diff erence in the proliferative response of CD25-/dim T cells before
compared with after transplantation (Figure 2A), suggesting that the anti-donor responses of
the Teff population before and after transplantation are not the same (pre-transplant 13071
± 4114 cpm vs. post-transplant 7309 ± 4777cpm, mean ± SEM, p=0.08). When pre-transplant
Treg were reconstituted to pre-transplant Teff , it resulted in a dose-dependent inhibition of the
proliferation of CD25-/dim T cells. In contrast, when post-transplant Treg were reconstituted to
post-transplant Teff this dose-dependent inhibition was less clear (Figure 2A).
After stimulation with third party antigens, the proliferation of CD25-/dim T cells was com-
parable before and after transplantation (39647 + 13846cpm; 35941 + 9894cpm, mean + SEM
respectively), as shown in Figure 2B. The isolated Treg pre- and post transplant suppressed the
third party allogeneic response of both CD25-/dim T cells pre- and post-transplant respectively
in a dose-dependent manner (Figure 2B).
The decrease in anti-donor reactivity after transplantation, while the third party reactivity
remained comparable, suggests that the Teff population is downregulated by one or more
factors including Treg.
Post-transplant Treg inhibit the donor-directed response of pre-transplant Teff stronger than pre-transplant Treg
To control for the variability in the proliferation capacity of the Teff in the read-out of Treg function,
we subsequently determined the inhibition of the proliferative response of the pre-transplant
Teff by Treg isolated before and after transplantation. At a CD25bright : CD25-/dim ratio of 1:10,
both the pre- and post-transplant Treg were able to suppress the alloreactivity of pre-transplant
Teff when stimulated with donor- and third party antigens (Figures 3A and 3B, respectively).
However, the pre-transplant Teff seemed more suppressed by post-transplant Treg than by
pre-transplant Treg (Figures 3A and 3B). As depicted in Figure 3A, when diluting the Treg at a
CD25bright : CD25-/dim ratio of 1:20, the donor-directed proliferation of the pre-transplant Teff was
signifi cantly more suppressed in the presence of the post-Transplant Treg than in the presence
of the pre-transplant Treg (p=0.05). When comparing the proliferation of the pre-transplant Teff

Chap
ter 2
38
in response to third party alloantigens, again a comparable pattern of improved suppression
by post-transplant Treg was observed, but this did not reach statistical signifi cance (Figure 3B).
These results suggest that Treg isolated after transplantation are more potent at suppressing
the Teff of before transplantation than Treg isolated before transplantation.
A
B
Figure 2. Suppression assay
(A) MLR stimulated with donor-antigens before and after transplantation. Note the diff erence in the anti-donor response by the pre-transplant
Teff (white bars; mean ± SEM) and post-transplant Teff (dotted bars; mean ± SEM). The proliferation capacity of the post-transplant Teff cells is
lower after transplantation; therefore, inhibition by post-transplant Treg cannot be measured. (B) MLR stimulated with third party alloantigens
before and after transplantation. The proliferation of the pre- and post-transplant Teff is inhibited after reconstitution of pre- and post-transplant
Treg respectively at a CD25bright : CD25-/dim ratio of 1:10, 1:20 and 1:40 in a dose-dependent manner. Error bars represent mean ± SEM

Improved Suppression by Regulatory T Cells after Transplantation 39
Subsequently, we determined the suppressive capacity of the Treg by calculating the percentage
of inhibition of the proliferating Teff population for the individual patient. As illustrated by Figure
4A indeed, a larger percentage of proliferating pre-transplant Teff was inhibited in the presence
of post-transplant Treg than in the presence of pre-transplant Treg at a CD25bright : CD25-/dim
ratio of 1:20 (pre-transplant 18% vs. post-transplant 55%, median p=0.03). When stimulated with
third party alloantigens, the regulation of the pre-transplant Teff by pre- and post-transplant
Treg was comparable (pre-transplant 49% vs. post-transplant 37%, median, Figure 4B).
A B
Figure 3. Suppressive capacity of the CD25bright T cells on pre-transplant Teff
(A) MLR in which the suppression of the pre-transplant Teff is determined upon stimulation with donor-antigens in the presence of pre-transplant
Treg (gray bars; mean ± SEM) and post-transplant Treg (black bars; mean ± SEM) at a CD25bright : CD25-/dim ratio of 1:10 and 1:20, p=0.05. (B)
MLR stimulated with third party antigens in the presence of pre-transplant (gray bars; mean ± SEM) and post-transplant Treg (black bars; mean
± SEM) at a CD25bright : CD25-/dim ratio of 1:10 and 1:20.
A B
Figure 4. Percentage inhibition of post-transplant Teff by pre-transplant and post-transplant Treg for the individual patient (A) Percentage
inhibition of the anti-donor proliferative response of pre-transplant Teff by pre- and post-transplant Treg at a CD25bright : CD25-/dim ratio of 1:20,
p=0.03. Median is depicted pre- and post transplant. (B) Percentage inhibition of third party proliferative response of pre-transplant Teff by pre-
transplant and post-transplant Treg at a CD25bright : CD25-/dim ratio of 1:20. Median is depicted pre- and post transplant.
Chap
ter 2
40
DISCUSSION
After clinical kidney transplantation, CD4+CD25bright regulatory T cells are able to control the
anti-donor immune response. When in vitro studying the functional capacity of Treg at diff er-
ent time-points in a suppression assay, the variability in the Teff response is always left out of
consideration. The Teff population may be aff ected by several factors as for example kidney
failure, uremia, dialysis, the transplant, immunosuppressants and other various factors, as the
proliferation in response to donor-antigens decreased after transplantation (Figure 2A). Given
that the proliferation capacity of Teff is the actual read-out of Treg function, comparing Treg
function of several time-points may lead to a misinterpretation of the results.
In the present study, we excluded the variability of Teff by performing a suppression assay in
which the Teff population was kept constant and not hindered by immunosuppressive drugs.
Our results demonstrated that after transplantation, lower numbers of CD4+CD25bright T cells and
a lower CD25 expression per cell are found. However, the donor-directed suppression by Treg
improved after transplantation (Figures 3A and 4A). These donor-directed Treg might be involved
in inducing a state of donor-specifi c hyporesponsiveness in the patient on the long term.
Many experimental animal models have shown that antigen specifi c CD4+CD25bright regula-
tory T cells are involved in the induction and maintenance of tolerance after transplantation24-26.
In human T cells, Treg function can be examined by studying the indirect and direct pathway. In
a patient cohort of Salama et al. in 40% of stable renal transplant recipients, there was evidence
of an antigen-specifi c regulatory CD25+ cell population suppressing responsiveness towards
alloantigens in the indirect pathway15. Indeed, there was also evidence that in a subset of CNI-
free kidney allograft recipients long after transplantation, functional CD4+CD25bright regulatory
T cells are present in the peripheral blood that are -at least partially- responsible for the state of
proliferative donor non-responsiveness13, 16.
The post-transplant decrease in the percentage of CD4+ T cells that express CD25, and
the decrease in CD25 expression per cell can be explained by the interaction of cyclosporine,
steroids and MMF with signaling of cytokines of the IL-2-family, necessary for their homeosta-
sis27-29. In several studies it was found that CNIs reduce the number of circulating regulatory
T cells in stable transplant recipients30, 31. In addition, Noris et al. clearly demonstrated that
CD4+CD25bright regulatory T cells do not develop during CsA treatment and they suggest that
this is due to the immunosuppressive treatment2. Despite our and other in vitro data show-
ing that CNIs negatively aff ect the fraction of Treg after transplantation18, 30, 31, we found an
improvement in Treg function. Therefore, to study the role of Treg in alloreactivity it is clear that
functional analysis is critically important. Nowadays, the CD25 molecule is the most commonly
marker to isolate T cells with regulatory capacities, but FoxP3 is regarded as a more specifi c
marker to defi ne regulatory T cells, therefore we characterized the CD4+CD25bright T cells also
for their FoxP3 expression20-23. In an additional new cohort, we stained PBMC of kidney trans-
plant patients for FoxP3. We found that the CD4+CD25bright T cells pre- and post-transplantation

Improved Suppression by Regulatory T Cells after Transplantation 41
predominantly expressed FoxP3. Moreover, our isolated CD25+ T cells did not proliferate upon
stimulation with antigen and were functional, suggesting that the majority of these cells con-
sist of Treg. These data again emphasize the need of functional analysis of Treg in addition to
fl owcytometric analysis.
The improvement in Treg activity after transplantation might be due to an impaired function
of the immune system of the patient before transplantation that might be infl uenced by several
factors such as kidney failure, uremia and dialysis. Transplantation as treatment of end-stage
renal disease results in a better kidney function and may even result in a general ‘boost’ of the
immune system that in vivo is overruled by immunosuppressive drugs. After transplantation,
the immune system regains the ability to mount immune responses to foreign pathogens. This
recovered immune system triggers an anti-donor response and consequently may induce Treg
activity that is directed against donor-antigens. In vitro this potent response can be measured,
because the cells are not any more exposed to immunosuppressants.
It is unknown however, whether donor-specifi c Treg are induced de novo after transplanta-
tion or whether they act as expanded Treg that control alloactivated Teff cells after transplanta-
tion32. Accumulating evidence suggests that Treg are not only thymically-derived but can also
be induced from naïve CD25- T cells (adaptive Treg) in the periphery after low-dose antigen
stimulation24, 33.
Considering the lower percentage of CD4+CD25bright T cells after transplantation in our
study, it is not very likely that there is induction of de novo (donor-specifi c) Treg by conversion
or expansion of antigen-specifi c Treg. However, Treg activity could be improved, because the
proportion of Treg with the memory phenotype is augmented due to induction of donor-
specifi c Treg that corresponds to a smaller compartment with naïve Treg34. The proportion Treg
with the eff ector memory or central memory phenotype can be measured by fl ow cytometric
immunostaining for memory markers, such as CD27 and CD45RO.
To conclude, we report that although the frequency of Treg was even lower after than before
transplantation, their suppressive capacity after transplantation improved in comparison with
before transplantation. These Treg may be involved in the development of donor-specifi c hypo-
responsiveness after kidney transplantation, although passive mechanisms as clonal deletion
and anergy of Teff against donor-antigens still may also occur4. We, therefore hypothesize that
to investigate changes in Treg function, the proliferation of the Teff population that is infl u-
enced by several factors, should remain constant.
Having these conclusions drawn, one should take into account that the small number of
patients is a limitation of this study. Finally, since we show that donor-directed Treg are gen-
erated after transplantation, another interesting question to be investigated is whether the
time-span after transplantation has an eff ect on the existence of donor-directed regulatory T
cells after transplantation. Therefore, blood samples obtained at fi xed time points after trans-
plantation should be analyzed.

Chap
ter 2
42
REFERENCES
1. Grinyo, J.M. & Cruzado, J.M. Mycophenolate mofetil and sirolimus combination in renal transplanta-tion. Am J Transplant 6, 1991-1999 (2006).
2. Noris, M. et al. Regulatory T Cells and T Cell Depletion: Role of Immunosuppressive Drugs. J Am Soc Nephrol 18, 1007-1018 (2007).
3. Golshayan, D., Buhler, L., Lechler, R.I. & Pascual, M. From current immunosuppressive strategies to clinical tolerance of allografts. Transpl Int 20, 12-24 (2007).
4. Thornton, A.M. & Shevach, E.M. CD4+CD25+ immunoregulatory T cells suppress polyclonal T cell activation in vitro by inhibiting interleukin 2 production. J Exp Med 188, 287-296 (1998).
5. Baecher-Allan, C., Brown, J.A., Freeman, G.J. & Hafl er, D.A. CD4+CD25high regulatory cells in human peripheral blood. J Immunol 167, 1245-1253 (2001).
6. Sakaguchi, S. et al. Immunologic tolerance maintained by CD25+CD4+ regulatory T cells: their com-mon role in controlling autoimmunity, tumor immunity, and transplantation tolerance. Immunol Rev 182, 18-32 (2001).
7. Adeegbe, D., Bayer, A.L., Levy, R.B. & Malek, T.R. Cutting edge: allogeneic CD4+CD25+Foxp3+ T regulatory cells suppress autoimmunity while establishing transplantation tolerance. J Immunol 176, 7149-7153 (2006).
8. Trenado, A. et al. Recipient-type specifi c CD4+CD25+ regulatory T cells favor immune reconstitution and control graft-versus-host disease while maintaining graft-versus-leukemia. J Clin Invest 112, 1688-1696 (2003).
9. Wood, K.J. & Sakaguchi, S. Regulatory T cells in transplantation tolerance. Nat Rev Immunol 3, 199-210 (2003).
10. Louis, S. et al. Contrasting CD25hiCD4+T cells/FOXP3 patterns in chronic rejection and operational drug-free tolerance. Transplantation 81, 398-407 (2006).
11. Koshiba, T. et al. Clinical, immunological, and pathological aspects of operational tolerance after pediatric living-donor liver transplantation. Transpl Immunol 17, 94-97 (2007).
12. Yoshizawa, A. et al. The roles of CD25+CD4+ regulatory T cells in operational tolerance after living donor liver transplantation. Transplant Proc 37, 37-39 (2005).
13. Velthuis, J.H., Mol, W.M., Weimar, W. & Baan, C.C. CD4(+) CD25(bright+) Regulatory T Cells Can Mediate Donor Nonreactivity in Long-Term Immunosuppressed Kidney Allograft Patients. Am J Transplant 6, 2955-2964 (2006).
14. Game, D.S., Hernandez-Fuentes, M.P. & Lechler, R.I. Everolimus and basiliximab permit suppression by human CD4+CD25+ cells in vitro. Am J Transplant 5, 454-464 (2005).
15. Salama, A.D., Najafi an, N., Clarkson, M.R., Harmon, W.E. & Sayegh, M.H. Regulatory CD25+ T cells in human kidney transplant recipients. J Am Soc Nephrol 14, 1643-1651 (2003).
16. Wood, K.J. et al. Immunoregulatory T-cells can mediate specifi c unresponsiveness to alloantigens in vivo. Transplant Proc 33, 3829-3830 (2001).
17. Mantel, P.Y. et al. Molecular mechanisms underlying FOXP3 induction in human T cells. J Immunol 176, 3593-3602 (2006).
18. Baan, C.C. et al. Diff erential eff ect of calcineurin inhibitors, anti-CD25 antibodies and rapamycin on the induction of FOXP3 in human T cells. Transplantation 80, 110-117 (2005).
19. Baan, C.C. et al. Functional CD25bright+ alloresponsive T cells in fully immunosuppressed renal allograft recipients. Clinical Transplantation 21, 63-71 (2006).
20. Yagi, H. et al. Crucial role of FOXP3 in the development and function of human CD25+CD4+ regula-tory T cells. Int Immunol 16, 1643-1656 (2004).
21. Allan, S.E. et al. The role of 2 FOXP3 isoforms in the generation of human CD4+ Tregs. J Clin Invest 115, 3276-3284 (2005).
22. Gavin, M.A. et al. Foxp3-dependent programme of regulatory T-cell diff erentiation. Nature 15, 771-775. (2007).

Improved Suppression by Regulatory T Cells after Transplantation 43
23. Fontenot, J.D., Gavin, M.A. & Rudensky, A.Y. Foxp3 programs the development and function of CD4+CD25+ regulatory T cells. Nat Immunol 4, 330-336 (2003).
24. Nishimura, E., Sakihama, T., Setoguchi, R., Tanaka, K. & Sakaguchi, S. Induction of antigen-specifi c immunologic tolerance by in vivo and in vitro antigen-specifi c expansion of naturally arising Foxp3+CD25+CD4+ regulatory T cells. Int Immunol 16, 1189-1201 (2004).
25. Jiang, X. et al. The importance of CD25+ CD4+ regulatory T cells in mouse hepatic allograft tolerance. Liver Transpl 12, 1112-1118 (2006).
26. Hara, M. et al. IL-10 is required for regulatory T cells to mediate tolerance to alloantigens in vivo. J Immunol 166, 3789-3796 (2001).
27. Maloy, K.J. & Powrie, F. Fueling regulation: IL-2 keeps CD4+ Treg cells fi t. Nat Immunol 6, 1071-1072 (2005).
28. Fontenot, J.D., Rasmussen, J.P., Gavin, M.A. & Rudensky, A.Y. A function for interleukin 2 in Foxp3-expressing regulatory T cells. Nat Immunol 6, 1142-1151 (2005).
29. Antony, P.A. et al. Interleukin-2-dependent mechanisms of tolerance and immunity in vivo. J Immunol 176, 5255-5266 (2006).
30. San Segundo, D. et al. Calcineurin inhibitors aff ect circulating regulatory T cells in stable renal trans-plant recipients. Transplant Proc 38, 2391-2393 (2006).
31. Demirkiran, A. et al. Decrease of CD4+CD25+ T cells in peripheral blood after liver transplantation: association with immunosuppression. Transplant Proc 37, 1194-1196 (2005).
32. Walker, L.S., Chodos, A., Eggena, M., Dooms, H. & Abbas, A.K. Antigen-dependent proliferation of CD4+ CD25+ regulatory T cells in vivo. J Exp Med 198, 249-258 (2003).
33. Roncarolo, M.G. et al. Interleukin-10-secreting type 1 regulatory T cells in rodents and humans. Immu-nol Rev 212, 28-50 (2006).
34. Ruprecht, C.R. et al. Coexpression of CD25 and CD27 identifi es FoxP3+ regulatory T cells in infl amed synovia. J Exp Med 201, 1793-1803 (2005).

Cha pter 3Generation of Donor-Specifi c Regulatory T-Cell
Function in Kidney Transplant Patients
Transplantation 87, 376-383 (2009)
Thijs K. Hendrikx1, Evelien A.F.J. van Gurp1, Varsha D.K.D. Sewgobind1,2,
Wendy M. Mol1, Wenda Schoordijk1, Mariska Klepper1, Jurjen H.L. Velthuis1,
Annemarie Geel1, Jan N.M. IJzermans2, Willem Weimar1 and Carla C. Baan1
Departments of 1Internal Medicine and 2Surgery
Erasmus MC, University Medical Center Rotterdam, the Netherlands

Chap
ter 3
46
ABSTRACT
In the search for mechanisms that can induce and maintain transplant tolerance, donor-specifi c
CD4+CD25brightFoxP3+ regulatory T cells have been frequently mentioned. However, it remains
to be demonstrated, whether these cells are generated after clinical transplantation. We
prospectively analyzed the phenotype and function of peripheral regulatory CD4+CD25bright
T cells of 79 patients before, 3, 6, and 12 months after kidney transplantation. The immune
regulatory capacities of CD4+CD25bright T cells were assessed by their depletion from peripheral
blood mononuclear cells (PBMC) and in co-culture with CD25neg/dim responder T-cells in mixed
lymphocyte reactions (MLR). In the fi rst year after transplantation, the number and proportion
of CD4+CD25bright T cells signifi cantly decreased (p<0.05 and p<0.001, respectively). In the MLR,
we observed donor-specifi c hyporesponsiveness in the presence of signifi cantly increased pro-
liferation to third and fourth party-antigens, (p<0.001 and p<0.05, respectively). Furthermore,
functional analysis of CD25bright cells showed that the eff ect of depletion of these cells from
PBMC, and their suppressive capacities in co-culture with donor-antigens stimulated CD25neg/
dim responder T-cells (1:10 ratio) signifi cantly improved (p<0.01 and p<0.001, respectively).
Moreover, the diff erence between the stimulation with donor-antigens and third party-antigens
became apparent at 6 months after transplantation. These fi ndings demonstrate that donor-
specifi c CD4+CD25bright regulatory T-cell function is generated in fully immune suppressed
renal recipients in the fi rst year after transplantation.

Donorspecifi c Regulatory T Cells in Kidney Transplant Patients 47
INTRODUCTION
The ultimate challenge in organ transplantation is to achieve transplant tolerance. Although
studies describing this condition after clinical kidney transplantation (KTx) are already
extremely rare1-3, the development of tolerance in humans remains elusive. Nevertheless, the
involvement of and even cell therapy with CD4+CD25bright regulatory T cells (Treg) has been
frequently suggested3-8.
Associations between tolerance and Treg were found in immunosuppression-free liver
transplant recipients from whom the proportion and number of Treg was elevated5, 7. Also, in
a small group of operational tolerant renal recipients the level of peripheral Treg as well as
the transcription factor for Treg, FoxP3, was higher when compared with patients with chronic
rejection9, 10.
Although these fi ndings suggest an association between transplant tolerance and the pres-
ence of Treg, data providing evidence for the presence of functional donor-specifi c Treg after
transplantation are only available from stable immune suppressed kidney transplant recipi-
ents11-13. However, it remains to be demonstrated that Treg also play a role in the induction of
donor-specifi c hyporesponsiveness in patients after transplantation.
Unlike experimental animals, kidney transplant patients receive lifelong immunosuppres-
sion to prevent graft rejection. Because these regimens infl uence T cells14, they may also aff ect
the induction and function of Treg15. Particularly, because most of these drugs target the IL-2
pathway, which is crucial for the function, homeostasis and survival of CD4+CD25+FoxP3+ T
cells16-19. Thus, these immunosuppressive drugs may interfere with the development of donor-
specifi c Treg thereby impairing a potential key player responsible for graft acceptance.
Therefore, we performed a prospective study on 79 fully immunosuppressed kidney
transplant patients to determine whether donor-specifi c Treg are induced in the fi rst year after
transplantation. Understanding the dynamic features of antigen-specifi c regulatory T cells will
contribute to our understanding of the role of these cells in antidonor reactivity.

Chap
ter 3
48
MATERIALS AND METHODS
Subjects
The medical ethics committee of Erasmus Medical Centre approved the study protocol and all
patients provided informed consent (medical ethics committee number 2004-264). As part of a
multicentre trial20, patients were enrolled from March 2004 until March 2006 and follow-up was
performed for 1 year. We included 79 patients, who were equally randomized to treatment arm
1 with tacrolimus/rapamycin (n=39) or arm 2 with tacrolimus/mycophenolate mofetil (MMF,
n=40, Table 1). There were no signifi cant diff erences in patient characteristics between the two
arms of treatment at baseline. In both arms of treatment, patients received prednisone for the
fi rst 4 to 6 weeks. The dosing and aimed whole blood trough levels of the study medication
are summarized in Table 2. Peripheral blood samples were obtained within 24 hr before and 3,
6, and 12 months after KTx. Blood samples before KTx were obtained before patients received
immunosuppressive medication. In addition, blood was obtained from 17 healthy controls
(HC), consisting of 10 men and 7 women with a mean age of 52±8.6 years. These characteristics
of our HC were comparable with our patient population.
Flow cytometric analysis
Blood samples were collected in heparinized tubes and analyzed for the presence of T-cell
subsets by four-color fl ow cytometry using mAbs directly conjugated to fl uorescein isothiocya-
nate (FITC), phycoerythrin (PE), allophycocyanin (APC) or peridinin chlorophyll protein (PerCP).
One hundred microliters of blood was incubated with 10 μL of the dual mAb combinations
Table 1. Patient characteristics at baseline
Demographics Arm 1
(n=39)Arm 2
(n=40)Gender (M/F) 27 / 12 24 / 16
Age (yr) 51 ± 17 51 ± 16
Dialysis type HD/ PD/ ND 20/ 12/ 7 19/ 15/ 6
Time on dialysis (mo) 11 (0-75)* 17 (0-280)*
Origin of donor kidney
Living related/ deceased 25 / 14 27 / 13
1st KTx / >1st KTx 34 / 5 p35 / 5
HLA A mismatch 1.0 ± 0.7 0.9 ± 0.7
HLA B mismatch 1.1 ± 0.7 1.2 ± 0.7
HLA DR mismatch 1.1 ± 0.7 1.0 ± 0.7
Primary kidney disease
Immunological disease
Hypertensive nephropathy
Diabetic nephropathy
Unknown
Polycystic kidney disease
Urological disease
8
8
6
7
5
5
9
8
8
7
5
3
Mean ± SD, *Median (range), Arm 1; Tacrolimus/Rapamycin, Arm 2; Tacrolimus/MMF, HD=Hemodialysis, PD=Peritoneal Dialysis, ND=No Dialysis

Donorspecifi c Regulatory T Cells in Kidney Transplant Patients 49
CD45-FITC/CD14-PE; IgG1-FITC/IgG2b-PE; IgG1-PerCP/ IgG1-APC as isotype control. Furthermore,
we used the mAb CD3-FITC, CD4-PerCP, CD8-APC and CD25-PE. To further determine how
Treg evolve, we added a combination of CD4-PerPC/CD25-PE/CD45RO-APC/CCR7-FITC to 100
μL whole blood. The antibodies were purchased from BD Biosciences (San Jose, CA) and R&D
Systems (Abingdon, UK). After 30 min of incubation at room temperature, red blood cells were
lysed with fl uorescence-activated cell sorter solution (BD Biosciences) during 10 min. Cells
were then washed twice, and analyzed on a fl ow cytometer (FACSCalibur, BD Biosciences)
using SimulSet and CELL Quest Pro software (BD Biosciences). To establish an analysis gate that
included at least 90% of the lymphocytes, the CD45/CD14 reagent was used. At least 20,000
gated lymphocyte events were acquired from each tube. Cells with a CD45RO- phenotype were
considered to be naive cells and cells with a CD45RO+ phenotype memory cells.
Expression of FoxP3 and CD127
FoxP3 is a transcription marker for Treg and in July 2006 it was shown that the expression of
CD127 inversely correlates with FoxP3 expression and the suppressive function of Treg21. We
began the experiments on our study cohort using fresh materials before the anti-FoxP3 anti-
body became available for analysis (eBioscience, San Diego, CA, USA) and before its correlation
with CD127 was reported. Therefore, to gain insight into the expression profi le of FoxP3 and
CD127 in our patient materials, we stained peripheral blood samples of an additional cohort
of patients (n=34). These samples were taken 24 hr pre KTx and stained with CD4-PerCP (BD
Biosciences), CD25-PE (epitope B, BD PharMingen, San Diego, CA), CD127-FITC (eBioscience)
and FoxP3-APC (clone PCH101, eBioscience). Patient characteristics from this additional cohort
were comparable with our study population from Table 1.
Isolation of peripheral blood lymphocytes
Peripheral blood mononuclear cells (PBMC) were isolated from 49 mL heparinized peripheral
blood by density gradient centrifugation using Ficoll-Paque (density 1.077 g/mL; Amersham,
Uppsala, Sweden). PBMC were collected from the interphase, washed twice in Roswell Park
Table 2. Dosing and trough levels of study medication
Pre-operativePost-
operativeDay1-14
Day15-28
Day28-42
Day43-365
Tacrolimus arm 10.2
mg/kg*
0.2
mg/kg
10-15
ng/mL**
4-8
ng/mL
4-8
ng/mL
4-6
ng/mL
Sirolimus arm 1 - 6 mg 2 mg 2 mg 1 mg -
Tacrolimus arm 20.2
mg/kg
0.2
mg/kg
10-15
ng/mL
8-12
ng/mL
8-12
ng/mL
5-10
ng/mL
MMF arm 21000
mg-
2 x 1000
mg/d
2 x 500
mg/d
2 x 500
mg/d
2 x 500
mg/d
(Methyl)prednisone 500 mg*** 125 mg 20 mg 15 mg 5 mg -
*The initial daily dose is 0.2 mg/kg p.o. given in two doses (pre/postoperatively), **and then adjusted by whole blood trough levels. ***
intravenously bolus.
Chap
ter 3
50
Memorial Institute 1640 (BioWhittaker, Verviers, Belgium) and resuspended in Human Culture
Medium (HCM) consisting of Roswell Park Memorial Institute 1640-Dutch Modifi cation (Gibco,
BRL, Scotland, UK) supplemented with 10% heat inactivated pooled human serum, 4 mM
L-Glutamine (Gibco BRL), 100 IU/mL penicillin (Gibco BRL) and 100 μg/mL streptomycin (Gibco
BRL).
Isolation of CD25bright cells
After isolation, PBMC were washed once and resuspended in 45μL MACS-buff er/10x106 PBMC
prepared according to the manufacturer’s protocol (Miltenyi, Bergisch Gladbach, Germany). The
CD25bright cells were depleted from PBMC by incubating PBMC with anti-CD25 microbeads (Epi-
tope A, Miltenyi Biotec) followed by a positive selection (POSSELD-program) on the autoMACS
(Miltenyi). Cells not selected by the microbeads were referred to as the CD25neg/dim fraction11.
To control for the autoMACS procedure, 6x10⁶ PBMC were treated by the same protocol in the
absence of anti-CD25 microbeads.
Purity of the fractions was measured by fl ow cytometry using CD3-FITC, CD4-PerCP, CD8-
APC (BD Bioscience) and CD25-PE (epitope B, BD PharMingen). Phenotypical analysis of both
fractions demonstrated that the average proportion of CD4+ cells in the CD25bright fraction was
95% and in the CD25neg/dim fraction 62% (Figures 1A and B). The proportion of CD4+CD25bright
cells in the CD25bright fraction was 72% (Figure 1C) and the proportion of CD4+CD25neg/dim cells
in the CD25neg/dim fraction was 96% (Figure 1D). These proportions were not diff erent over time
and comparable with proportions measured in samples from HC (Figure 1).
Mixed Lymphocyte Reactions
In the MLR, 5x10⁴ freshly isolated patient-PBMC and CD25neg/dim cells were stimulated with
5x10⁴ irradiated (40 Gy) donor PBMC (donor-antigens) and 5x10⁴ (40 Gy) HLA A, B and DR fully
mismatched third party PBMC. Because it has been described that improved histocompatibility
between recipient and donor enhances immune regulation and graft survival after KTx22, we
also stimulated patient-PBMC and CD25neg/dim cells with 5x10⁴ (40 Gy) fourth party PBMC.
Fourth party PBMC have the same number of mismatches at the HLA A, B and DR level to the
recipient as the donor to the recipient, but the mismatches are based on diff erent antigens.
The same third party and fourth party were used for an individual patient at all analysed time
points. The MLR was performed in HCM, in triplicate, in a 96-wells round bottom plate for 7
days. At day 6, 3H-thymidine 0.5 μCi/well was added to the culture; and 16 hr later, samples
were harvested and radioactivity was measured in counts per minute (CPM) using a β-counter
(PerkinElmer, Oosterhout, the Netherlands).
Regulation of alloantigens stimulated responder cells by CD25bright cells
Regulation of proliferation by CD25bright cells was quantifi ed both by their depletion from PBMC
and in co-culture experiments with the CD25neg/dim responder cells. After depletion the increase

Donorspecifi c Regulatory T Cells in Kidney Transplant Patients 51
in proliferation refl ects the regulatory capacity of the CD25bright cells. To compare the eff ect of
depletion over time, we calculated the percentage of increase (% increase) in those cultures
where the eff ect of depletion was positive.
% Increase= CPM CD25neg/dim cells – (CPM PBMC)
CPM CD25neg/dim cells x 100
In the MLR, isolated CD25bright cells were added to CD25neg/dim responder cells at a ratio of 1:5,
1:10, 1:20, and 1:40. The eff ect was calculated as the percentage of inhibition (% IH), when the
proliferative response of alloactivated CD25neg/dim cells was more than 1000 CPM; and the eff ect
of depletion was positive.
% Inhibition= CPM CD25neg/dim cells – (CPM CD25neg/dim cells + CD25bright cells)
CPM CD25neg/dim cells x 100
A
B
C
D
Figure 1. Isolation of CD25bright cells by autoMACS
(A-B) The average proportion of CD4+ cells in the isolated CD25bright fraction was 95% and 62% in the CD25neg/dim fraction. (C) In the CD25bright
fraction, the proportion of CD4+CD25bright cells was 72%. (D) The proportion of CD4+CD25neg/dim cells in the CD25neg/dim fraction was 96%.
Proportions were not diff erent over time (ANOVA) and comparable to proportions measured in samples from healthy controls (Unpaired t test).
All data were normally distributed.

Chap
ter 3
52
Proliferation of mitogen stimulated cells
We determined the capacity of PBMC and CD25neg/dim cells (5x10⁴) to proliferate upon stimulation
with 1 μg/mL Phytohemagglutinin (PHA; Murex Biotech LTd, Kent, UK). All cultures were per-
formed in HCM, in triplicate in a 96-wells plate for 3 days. At day 2, 3H-thymidine 0.5 μCi/well was
added to the culture; and 16 hr later, the samples were harvested and radioactivity was counted.
Statistical Analysis
All calculations were performed using GraphPad Prism 4.0 or SPSS 11.5. On the basis of the dis-
tribution of the data, we performed parametric or nonparametric testing. For paired analysis, the
paired t test was performed; and to compare data from patients versus HC, we used the unpaired t
test. For nonparametric testing, the Mann Whitney U test was performed. To determine if a certain
parameter changed signifi cantly over time, One-Way ANOVA or Kruskal Wallis test was used. To
analyze several variables at a fi xed time point, Cox or linear regression analysis was performed. A
p value less than 0.05 is marked with *, p less than 0.01 with **, and p less than 0.001 with ***. For
each analysis, statistics are described more specifi cally in the appropriate table and fi gure legends.
RESULTS
Of 79 randomized patients receiving a kidney transplant, 62 (78%) completed the study and
17 (22%) were withdrawn due to adverse events. There was no diff erence between patients
treated in arm 1 (tacrolimus/rapamycin) or arm 2 (tacrolimus/MMF) for adverse events (8 vs. 9),
patient survival (97% vs. 98%), graft survival (97% vs. 93%), rejection incidence (13% vs. 10%),
or renal function (serum creatinine 119 μmol/L vs. 130 μmol/L) at one year. Blood trough levels
of the medication were within target range. The trough levels of tacrolimus were higher in arm
2 than in arm 1, which was consistent with the study protocol (Table 2). All the patients who
had rejection were treated with antirejection therapy and are therefore described separately.
Characterization of CD4+CD25bright regulatory T cells
Analysis of whole blood samples from patients and healthy controls (HC) was performed for
lymphocyte subsets, including Treg defi ned as the CD4+CD25bright T-cell population in combi-
nation with slightly less CD4 expression (Figure 2A). Flow cytometry showed that the absolute
number of Treg and their proportion, decreased within the fi rst year after KTx (Table 3 and
Figure 2B, p<0.05 and p<0.001, respectively).
We also analyzed the expression of CD45RO, CCR7, FoxP3 and CD127 by Treg. These
results revealed that the absolute number of CD4+CD25brightCD45RO+ cells (Table 3) and
their proportion decreased after KTx (p<0.05 and p=0.06, respectively). The absolute number
of CD4+CD25brightCCR7+ cells did not change in the fi rst year after transplantation (Table 3),
whereas their proportion increased (p<0.01).
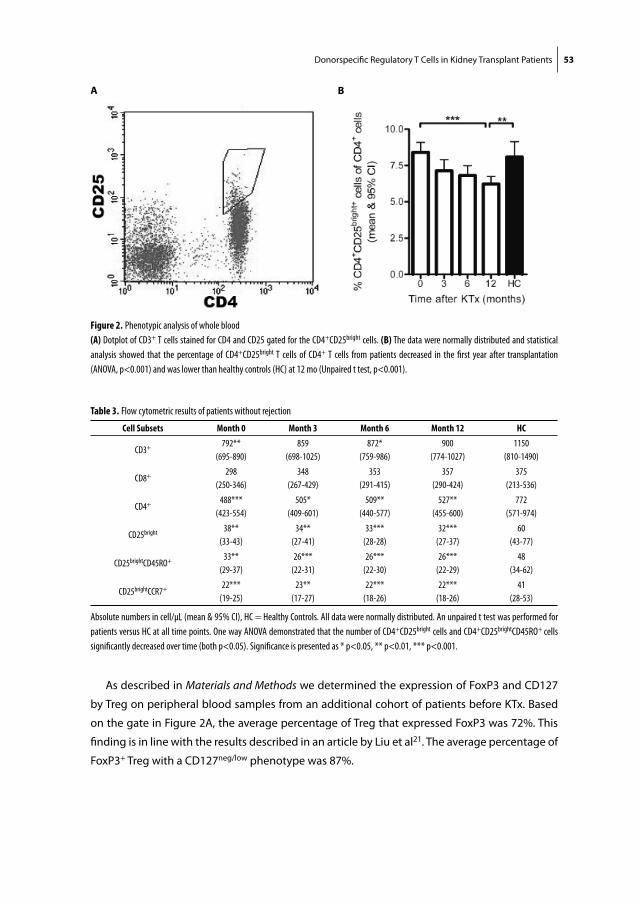
Donorspecifi c Regulatory T Cells in Kidney Transplant Patients 53
As described in Materials and Methods we determined the expression of FoxP3 and CD127
by Treg on peripheral blood samples from an additional cohort of patients before KTx. Based
on the gate in Figure 2A, the average percentage of Treg that expressed FoxP3 was 72%. This
fi nding is in line with the results described in an article by Liu et al21. The average percentage of
FoxP3+ Treg with a CD127neg/low phenotype was 87%.
A B
Figure 2. Phenotypic analysis of whole blood
(A) Dotplot of CD3+ T cells stained for CD4 and CD25 gated for the CD4+CD25bright cells. (B) The data were normally distributed and statistical
analysis showed that the percentage of CD4+CD25bright T cells of CD4+ T cells from patients decreased in the fi rst year after transplantation
(ANOVA, p<0.001) and was lower than healthy controls (HC) at 12 mo (Unpaired t test, p<0.001).
Table 3. Flow cytometric results of patients without rejection
Cell Subsets Month 0 Month 3 Month 6 Month 12 HC
CD3+792**
(695-890)
859
(698-1025)
872*
(759-986)
900
(774-1027)
1150
(810-1490)
CD8+298
(250-346)
348
(267-429)
353
(291-415)
357
(290-424)
375
(213-536)
CD4+488***
(423-554)
505*
(409-601)
509**
(440-577)
527**
(455-600)
772
(571-974)
CD25bright38**
(33-43)
34**
(27-41)
33***
(28-28)
32***
(27-37)
60
(43-77)
CD25brightCD45RO+33**
(29-37)
26***
(22-31)
26***
(22-30)
26***
(22-29)
48
(34-62)
CD25brightCCR7+22***
(19-25)
23**
(17-27)
22***
(18-26)
22***
(18-26)
41
(28-53)
Absolute numbers in cell/μL (mean & 95% CI), HC = Healthy Controls. All data were normally distributed. An unpaired t test was performed for
patients versus HC at all time points. One way ANOVA demonstrated that the number of CD4+CD25bright cells and CD4+CD25brightCD45RO+ cells
signifi cantly decreased over time (both p<0.05). Signifi cance is presented as * p<0.05, ** p<0.01, *** p<0.001.

Chap
ter 3
54
Proliferation of PBMC
The average proliferation of patient-PBMC to the mitogen PHA was more than 51000 CPM at all
tested time points and comparable with the proliferation of PBMC from HC (57000 CPM). Before
transplantation, proliferation of patient PBMC to donor-antigens, third and fourth party-anti-
gens was signifi cantly lower as compared with proliferation of PBMC from HC to alloantigens
(Figure 3, all p<0.001). After transplantation, proliferation of PBMC to donor-antigens remained
low whereas increasing proliferation to third and fourth party-antigens, was measured (Figure
3, p<0.001 and p<0.05, respectively). Thus, we observed a proportional hyporesponsiveness
towards donor-antigens.
The suppressive function of CD25bright cells
The eff ect of depletion of CD25bright cells from PBMC on direct alloresponses was determined in
MLR. Because of the limited amount of peripheral blood available from our patients, we could
not analyze the eff ect of depletion of CD25bright cells in cultures stimulated with fourth party-
antigens. After depletion of the CD25bright fraction, we observed an overall increase of the pro-
liferative response in cultures stimulated with donor-antigens and third party-antigens before
and after transplantation (Figure 4A). Before transplantation, the average eff ect of depletion on
proliferative responses of alloreactive cells was 51% on stimulation with donor-antigens and
Figure 3. Proliferation of PBMC
The data were not always normally distributed and therefore statistical analysis was based on a nonparametric distribution. Before
transplantation, proliferation of patient-PBMC to donor-antigens, third party antigens and fourth party antigens was signifi cantly lower as
compared to proliferation of PBMC from healthy controls to alloantigens (Mann Whitney U test, all p<0.001). After transplantation, proliferation
to donor-antigens remained low, while the response to third party antigens and fourth party antigens increased (Kruskal-Wallis Test, p<0.001
and p<0.05 respectively).

Donorspecifi c Regulatory T Cells in Kidney Transplant Patients 55
57% upon stimulation with third party-antigens (Figure 4B). After transplantation, the eff ect
of depletion increased signifi cantly in co-cultures stimulated with donor-antigens and less so
with third party-antigens (Figure 4B, p<0.01 and p=0.07, respectively). Furthermore, at 6 and
12 months after transplantation the % increase was higher in cultures stimulated with donor-
antigens than with third party-antigens (Figure 4B, p<0.05 and p=0.09, respectively).
The suppressive capacity of the isolated CD25bright cells on a per cell basis was determined in
co-culture experiments with CD25neg/dim responder cells. The isolated CD25bright cells did not pro-
liferate upon stimulation with allo-antigens. Co-culture experiments proved that the suppressive
eff ect of CD25bright cells on CD25neg/dim responder cells is a dose-dependent phenomenon (Fig-
ures 4C and D). Before transplantation, the capacity of CD25bright cells to suppress donor-antigens
or third party-antigens stimulated CD25neg/dim responder cells (ratio 1:10) was signifi cantly lower
when compared with HC, (both p<0.05, Figure 4E). After transplantation, the average suppressive
capacity of CD25bright T cells improved signifi cantly in cultures stimulated with donor-antigens (Fig-
ure 4E, 51%-75%, p<0.001), but not with third party-antigens (50%-57%, p=0.49). Furthermore, at
6 and 12 months after transplantation, the capacity of CD25bright cells to suppress donor-antigens
stimulated CD25neg/dim cells was signifi cantly higher than on stimulation with third party-antigens
(Figure 4E, p<0.01 and p<0.001 respectively). The results on the % inhibition at a 1:10 ratio were
comparable with the ratio of 1:5, 1:20 and 1:40, but signifi cance was lost at 1:20 and 1:40.
Rejectors versus non-rejectors
In this study, 9 out of 79 patients (11%) had a rejection episode. All rejections occurred in the
fi rst month after transplantation (median 12 days; range 3-28). Antirejection therapy consisted
of high dose solumedrol. At baseline, no diff erences were found between rejectors and non-
rejectors for clinical characteristics, fl ow cytometric results, proliferation of PBMC and the sup-
pressive function of CD25bright cells. Therefore, we found none of these factors are a predictor
for rejection before transplantation.
We analyzed the suppressive capacity of CD25bright cells from rejectors at 12 months after trans-
plantation. Our results show that this suppressive capacity in co-cultures of CD25neg/dim responder
cells stimulated with donor-antigens or third party-antigens was not diff erent from nonrejectors
at month 12. This is in line with a study from Demirkiran et al.23 on liver transplant recipients.
Immunosuppressive drugs: tacrolimus/MMF versus tacrolimus/rapamycin
We compared the two arms of treatment to determine whether therapy with tacrolimus/MMF
versus tacrolimus/rapamycin aff ected Treg diff erently. No diff erence was observed for any of
the phenotypical or functional Treg-characteristics analyzed in this study between these arms
of treatment.

Chap
ter 3
56
A B
C
D
E
Figure 4. Functional analysis of CD25bright cells
Except for the data in (A), all data were normally distributed. (A) PBMC (+) and CD25neg/dim cells (-). Depletion of CD25bright cells from PBMC
resulted in improved proliferation in donor-antigens and third party-antigens stimulated co-cultures from patients before (0) and 12 mo after
transplantation (Mann Whitney U test). (B) The eff ect of depletion was calculated as the percentage increase. After transplantation, the eff ect of
depletion increased signifi cantly in co-cultures stimulated with donor-antigens and less vigorously with third party antigens (ANOVA, p<0.01 and
p=0.07, respectively). At 6 and 12 mo, the percentage increase was higher in co-cultures stimulated with donor-antigens than with third party
antigens (paired t-test, p<0.05 and p=0.09, respectively). (C-D) In HC and patients (12 mo, third party antigens stimulated co-cultures), inhibition
of alloantigens stimulated CD25neg/dim cells by CD25bright cells proved to be dose dependent. (E) The suppressive capacity of CD25bright cells was
calculated as the percentage inhibition. Before transplantation, the percentage inhibition was signifi cantly lower in co-cultures stimulated with
donor-antigens and third party antigens when compared to HC (unpaired t test, both p<0.05). After transplantation, the percentage inhibition
increased in co-cultures stimulated with donor-antigens (ANOVA, p<0.001), but not signifi cantly with third party antigens (p=0.49). At 6 and
12 mo, the percentage inhibition was signifi cantly higher in co-cultures stimulated with donor-antigens than with third party antigens (paired t
test, p<0.01 and p<0.001, respectively).

Donorspecifi c Regulatory T Cells in Kidney Transplant Patients 57
Multivariate analysis
In a multivariate analysis the factors like gender, recipient age, dialysis type, time on dialysis,
origin of donor kidney, fi rst KTx/more than fi rst, number of HLA mismatches, primary kidney
disease, blood group, cytomegalovirus status, and the level of panel reactive antibodies before
KTx were not associated with the number, proportion, or function of CD25bright T cells on a fi xed
time point or over time.
DISCUSSION
To investigate whether donor-specifi c CD4+CD25bright regulatory T-cell function is generated in
de novo kidney transplant recipients; we prospectively analyzed their suppressive capacity in
the fi rst year after transplantation. In the MLR, depletion of CD25bright cells from PBMC, and their
capacity to suppress the proliferation of CD25neg/dim cells, demonstrated improved Treg func-
tion in the fi rst year. We also found donor-specifi c hyporesponsiveness, whereas Treg activity
was signifi cantly more donor-directed compared with third party-antigens.
Data from in vitro and animal studies indicated that immunosuppressive drugs have detri-
mental eff ects on Treg15, 17, 24. However, the development of donor-specifi c Treg in the present
study shows that the immune system can bypass these unfavorable eff ects in vivo to a certain
extent. Apart from the restored kidney function25, an explanation might be that immunosup-
pressive drugs like cyclosporine and tacrolimus do not inhibit the transcription of IL-214, an
important cytokine for the function and survival of CD4+CD25brightFoxP3+ T cells16-19. However,
the pivotal role for this cytokine was not always observed26, as other members of the IL-2 family
may compensate for the absence of IL-218, 27. This probably results from their shared signalling
through the common gamma chain (i.e. CD132), which activates the signal transducer and acti-
vator of transcription factor 5 (STAT5), and therefore induces the expression of the transcription
factor for regulatory cells FoxP38, 28, 29.
The observed donor-specifi c hyporesponsiveness as compared with the reactivity to third
and fourth party-antigens did not result from better histocompatibility between donor and
recipient22. Regulation could be another explanation. Indeed, the suppressive function of Treg
from our patients became increasingly potent to donor-antigens stimulated cultures after
transplantation. It has been reported that Treg respond dynamically to their antigenic environ-
ment in a transgenic mouse model, which showed that these regulatory T cells proliferated
in response to T-cell receptor engagement30. In the transplantation setting, the continuous
presence of donor-antigens could therefore stimulate the peripheral proliferation and accu-
mulation of Treg. Moreover, it has been reported that operationally tolerant patients have an
unexpected strongly altered T-cell receptor Vβ usage and high TCR transcript accumulation in
selected T cells31. This may explain why we found generation of donor-specifi c regulatory T cell
function and not higher Treg numbers. Also, development of potent Treg might be favoured

Chap
ter 3
58
by the lymphopaenic state of transplant patients (Table 3), because stimuli that originate from
lymphopaenia favor their homeostatic proliferation and enhance their suppressor function32.
In the present study, we measured donor-specifi c hyporesponsiveness in the direct pathway
of allorecognition, which was mediated by CD4+CD25bright Treg. In contrast, a cross-sectional
study from Game et al.33 stated that Treg do not contribute to the direct pathway of hypore-
sponsiveness in stable transplant patients. The diff erence between their fi ndings and the pres-
ent study may be explained by diff erences in immunosuppressive strategies, the lower number
of patients studied (n=12 vs. n=79) and the time after transplantation (2-20 years vs. ≤1 year,
respectively). Especially the latter may be essential, because the indirect pathway becomes
more important in the long term4. In addition, other mechanisms could be envisioned that
contribute to the measured donor-specifi c hyporesponsiveness, including anergy, ignorance
and clonal deletion of donor-specifi c eff ector T cells.
The generation of donor-specifi c Treg function occurred in the presence of immunosuppres-
sive agents that have the potential to hamper their development and suppressive function15, 24,
27. Therefore, the individual eff ect of these drugs or their combinations may still have infl uenced
the dynamics by which donor-specifi c Treg function is generated. Several studies indicated
that rapamycin does not interfere with the suppressive activity of CD4+CD25brightFoxP3+ T cells
and favors their expansion in vivo34-36, whereas MMF and calcineurin inhibitors for example,
tacrolimus prevent the expansion of these cells14, 34. Here, we did not observe a diff erence
in the eff ect of treatment with tacrolimus/rapamycin or tacrolimus/MMF on the number and
function of Treg. These fi ndings can be explained by the dominant eff ect of tacrolimus in both
arms of treatment. Especially, because calcineurin inhibitor-based treatment is associated with
decreased numbers of Treg and possibly impairs their functional development15, 24, 34, 37.
Another explanation for the observed changes in the peripheral compartment may be an
increased recruitment of Treg to secondary lymphoid tissues and the transplanted organ26, 30, 35,
38-40. CCR7 is a homing marker for the lymphoid tissues and in this study we demonstrated that
the proportion of Treg that expressed CCR7 signifi cantly increased. This suggests an increased
potential of the peripheral Treg compartment to home to lymphoid tissues41, 42. Also CCR7 is
expressed by naive T cells41, 42 and indeed fl ow cytometric analysis revealed a decreased pro-
portion of Treg with a memory phenotype, indicating an increased proportion of naive Treg.
Because it has been demonstrated that especially naive Treg give rise to potent antigen-specifi c
Treg43, their strong proportional increase may have favored the development of the observed
donor-specifi c Treg function.
In summary, we prospectively analyzed the development of peripheral CD4+CD25bright
T cells from kidney transplant recipients in the fi rst year after transplantation. Our results
demonstrated that even in the presence of full immunosuppression potent donor-specifi c
CD4+CD25bright regulatory T-cell function is generated in these patients.

Donorspecifi c Regulatory T Cells in Kidney Transplant Patients 59
ACKNOWLEDGEMENTS
The authors thank dr. Nicolle Litjens for her help with the fl ow cytometric measurements and
for her advice with the interpretation of the data.

Chap
ter 3
60
REFERENCES
1. VanBuskirk, A.M. et al. Human allograft acceptance is associated with immune regulation. J Clin Invest 106, 145-155 (2000).
2. Strober, S., Benike, C., Krishnaswamy, S., Engleman, E.G. & Grumet, F.C. Clinical transplantation toler-ance twelve years after prospective withdrawal of immunosuppressive drugs: studies of chimerism and anti-donor reactivity. Transplantation 69, 1549-1554 (2000).
3. Roussey-Kesler, G. et al. Clinical operational tolerance after kidney transplantation. Am J Transplant 6, 736-746 (2006).
4. Salama, A.D., Najafi an, N., Clarkson, M.R., Harmon, W.E. & Sayegh, M.H. Regulatory CD25+ T cells in human kidney transplant recipients. J Am Soc Nephrol 14, 1643-1651 (2003).
5. Li, Y. et al. Analyses of peripheral blood mononuclear cells in operational tolerance after pediatric living donor liver transplantation. Am J Transplant 4, 2118-2125 (2004).
6. Sakaguchi, S. Naturally arising Foxp3-expressing CD25+CD4+ regulatory T cells in immunological tolerance to self and non-self. Nat Immunol 6, 345-352 (2005).
7. Martinez-Llordella, M. et al. Multiparameter immune profi ling of operational tolerance in liver trans-plantation. Am J Transplant 7, 309-319 (2007).
8. Long, E. & Wood, K.J. Understanding FOXP3: Progress Towards Achieving Transplantation Tolerance. Transplantation 84, 459-461 (2007).
9. Louis, S. et al. Contrasting CD25hiCD4+T cells/FOXP3 patterns in chronic rejection and operational drug-free tolerance. Transplantation 81, 398-407 (2006).
10. Brouard, S. et al. Identifi cation of a peripheral blood transcriptional biomarker panel associated with operational renal allograft tolerance. Proc Natl Acad Sci U S A 104, 15448-15453 (2007).
11. Velthuis, J.H., Mol, W.M., Weimar, W. & Baan, C.C. CD4+CD25bright+ regulatory T cells can mediate donor nonreactivity in long-term immunosuppressed kidney allograft patients. Am J Transplant 6, 2955-2964 (2006).
12. Bestard, O. et al. Achieving donor-specifi c hyporesponsiveness is associated with FOXP3+ regulatory T cell recruitment in human renal allograft infi ltrates. J Immunol 179, 4901-4909 (2007).
13. Akl, A. et al. An investigation to assess the potential of CD25(high)CD4(+) T cells to regulate responses to donor alloantigens in clinically stable renal transplant recipients. Transpl Int 21, 65-73 (2008).
14. Halloran, P.F. Immunosuppressive drugs for kidney transplantation. N Engl J Med 351, 2715-2729 (2004).
15. Demirkiran, A., Hendrikx, T.K., Baan, C.C. & van der Laan, L.J. Impact of Immunosuppressive Drugs on CD4+CD25+FOXP3+ Regulatory T Cells: Does In Vitro Evidence Translate to the Clinical Setting? Transplantation 85, 783-789 (2008).
16. Thornton, A.M., Donovan, E.E., Piccirillo, C.A. & Shevach, E.M. Cutting edge: IL-2 is critically required for the in vitro activation of CD4+CD25+ T cell suppressor function. J Immunol 172, 6519-6523 (2004).
17. Baan, C.C. et al. Diff erential eff ect of calcineurin inhibitors, anti-CD25 antibodies and rapamycin on the induction of FOXP3 in human T cells. Transplantation 80, 110-117 (2005).
18. Maloy, K.J. & Powrie, F. Fueling regulation: IL-2 keeps CD4+ Treg cells fi t. Nat Immunol 6, 1071-1072 (2005).
19. D’Cruz, L.M. & Klein, L. Development and function of agonist-induced CD25+Foxp3+ regulatory T cells in the absence of interleukin 2 signaling. Nat Immunol 6, 1152-1159 (2005).
20. E. van Gurp. Renal function following kidney transplantation is equally good regardless of whether tacrolimus is combined with sirolimus or mycophenolate mofetil [abstract]. Transpl Int 20, 25 (2007).
21. Liu, W. et al. CD127 expression inversely correlates with FoxP3 and suppressive function of human CD4+ T reg cells. J Exp Med 203, 1701-1711 (2006).
22. Rodriguez, D.S. et al. Immune regulation and graft survival in kidney transplant recipients are both enhanced by human leukocyte antigen matching. Am J Transplant 4, 537-543 (2004).

Donorspecifi c Regulatory T Cells in Kidney Transplant Patients 61
23. Demirkiran, A. et al. Low circulating regulatory T-cell levels after acute rejection in liver transplanta-tion. Liver Transpl 12, 277-284 (2006).
24. Coenen, J.J. et al. Rapamycin, not cyclosporine, permits thymic generation and peripheral preserva-tion of CD4+ CD25+ FoxP3+ T cells. Bone Marrow Transplant 39, 537-545 (2007).
25. Meyer, T.W. & Hostetter, T.H. Uremia. N Engl J Med 357, 1316-1325 (2007). 26. Lohr, J., Knoechel, B. & Abbas, A.K. Regulatory T cells in the periphery. Immunol Rev 212, 149-162
(2006). 27. Yates, J. et al. The maintenance of human CD4+ CD25+ regulatory T cell function: IL-2, IL-4, IL-7 and
IL-15 preserve optimal suppressive potency in vitro. Int Immunol 19, 785-799 (2007). 28. Antov, A., Yang, L., Vig, M., Baltimore, D. & Van Parijs, L. Essential role for STAT5 signaling in CD25+CD4+
regulatory T cell homeostasis and the maintenance of self-tolerance. J Immunol 171, 3435-3441 (2003).
29. Zorn, E. et al. IL-2 regulates FOXP3 expression in human CD4+CD25+ regulatory T cells through a STAT-dependent mechanism and induces the expansion of these cells in vivo. Blood 108, 1571-1579 (2006).
30. Walker, L.S., Chodos, A., Eggena, M., Dooms, H. & Abbas, A.K. Antigen-dependent proliferation of CD4+ CD25+ regulatory T cells in vivo. J Exp Med 198, 249-258 (2003).
31. Brouard, S. et al. Operationally tolerant and minimally immunosuppressed kidney recipients display strongly altered blood T-cell clonal regulation. Am J Transplant 5, 330-340 (2005).
32. Gavin, M.A., Clarke, S.R., Negrou, E., Gallegos, A. & Rudensky, A. Homeostasis and anergy of CD4(+)CD25(+) suppressor T cells in vivo. Nat Immunol 3, 33-41 (2002).
33. Game, D.S., Hernandez-Fuentes, M.P., Chaudhry, A.N. & Lechler, R.I. CD4+CD25+ regulatory T cells do not signifi cantly contribute to direct pathway hyporesponsiveness in stable renal transplant patients. J Am Soc Nephrol 14, 1652-1661 (2003).
34. Zeiser, R. et al. Inhibition of CD4+CD25+ regulatory T-cell function by calcineurin-dependent interleu-kin-2 production. Blood 108, 390-399 (2006).
35. Coenen, J.J., Koenen, H.J., van Rijssen, E., Hilbrands, L.B. & Joosten, I. Rapamycin, and not cyclosporin A, preserves the highly suppressive CD27+ subset of human CD4+CD25+ regulatory T cells. Blood 107, 1018-1023 (2006).
36. Game, D.S., Hernandez-Fuentes, M.P. & Lechler, R.I. Everolimus and basiliximab permit suppression by human CD4+CD25+ cells in vitro. Am J Transplant 5, 454-464 (2005).
37. Gao, W. et al. Contrasting Eff ects of Cyclosporine and Rapamycin in De Novo Generation of Alloanti-gen-Specifi c Regulatory T Cells. Am J Transplant 7, 1-11 (2007).
38. Muthukumar, T. et al. Messenger RNA for FOXP3 in the urine of renal-allograft recipients. N Engl J Med 353, 2342-2351 (2005).
39. Dijke, I.E. et al. Intragraft FOXP3 mRNA expression refl ects antidonor immune reactivity in cardiac allograft patients. Transplantation 83, 1477-1484 (2007).
40. Veronese, F. et al. Pathological and clinical correlates of FOXP3+ cells in renal allografts during acute rejection. Am J Transplant 7, 914-922 (2007).
41. Valmori, D., Merlo, A., Souleimanian, N.E., Hesdorff er, C.S. & Ayyoub, M. A peripheral circulating com-partment of natural naive CD4 Tregs. J Clin Invest 115, 1953-1962 (2005).
42. Menning, A. et al. Distinctive role of CCR7 in migration and functional activity of naive- and eff ector/memory-like Treg subsets. Eur J Immunol 37, 1575-1583 (2007).
43. Hoff mann, P. et al. Only the CD45RA+ subpopulation of CD4+CD25high T cells gives rise to homoge-neous regulatory T-cell lines upon in vitro expansion. Blood 108, 4260-4267 (2006).


Cha pter 4The Eff ect of Rabbit Anti-Thymocyte Globulin
Induction Therapy on Regulatory T cells in Kidney Transplant Patients
Nephrology Dialysis and Transplantation 24, 1635-1644 (2009)
Varsha D.K.D. Sewgobind1,2, Marcia M.L. Kho1, Luc J.W. van der Laan2,
Thijs K. Hendrikx1, Thea van Dam1, Hugo W. Tilanus2, Jan N.M. IJzermans2,
Willem Weimar1 and Carla C. Baan1
Departments of 1Internal Medicine and 2Surgery
Erasmus MC, University Medical Center Rotterdam, the Netherlands

Chap
ter 4
64
ABSTRACT
Prevention of alloreactivity by rabbit Anti-Thymocyte Globulins (rATG) may not only result
from immunodepletion, but also from the induction of T cells that control allogeneic immune
responses. In the present prospective and controlled study, we investigated the eff ect of rATG
on the frequency, function and phenotype of peripheral immunoregulatory CD4+ T cells in
kidney transplant patients. After transplantation, 16 patients received ATG-induction therapy
and triple therapy consisting of tacrolimus, mycophenolate mofetil (MMF) and steroids. The
control group (n=18) received triple therapy only. By fl ow cytometry, T cells were analyzed
for CD25, FoxP3, CD127, CD45RO and CCR7. To study their suppressive capacities, CD25bright T
cells were co-cultured with CD25-/dim T cells (Teff ) in mixed lymphocyte reactions, stimulated
with donor and third party (3P)-antigens. Pre-transplant levels of FoxP3+CD127-/low T cells were
6% of CD4+ T cells. One wk post-ATG treatment, no measurable numbers of regulatory T cells
were present (p<0.01). After 4 weeks, the cell numbers of CD4+FoxP3+CD127-/low T cells slowly
reappeared and thereafter remained low (p<0.01). At 14 weeks, a signifi cant shift towards the
CD45RO+CCR7+ (central memory) phenotype within CD4+FoxP3+ T cells was observed (p<0.01).
At 26 weeks, the proliferative alloresponses of the peripheral blood mononuclear cells (PBMC)
and CD25-/dim Teff profoundly decreased compared with pre-transplant (p=0.01 and p=0.02
respectively), while the regulatory capacity of the CD25bright T cells, of which 90% consisted of
FoxP3+CD127-/low T cells, remained unaff ected. The CD25bright T cells suppressed the anti-donor
(94%) and 3P responses (93%). Our fi ndings show that rATG therapy does not spare peripheral
immunoregulatory T cells in vivo, but after regeneration preserves their suppressive activity.

rATG Induction Therapy and Regulatory T Cells 65
INTRODUCTION
Thymus-derived natural immunoregulatory CD4+ T cells do not only have important activities
in the prevention of autoimmunity1, 2, but also control immune responses towards transplanted
organs and tissues2, 3. They require IL-2 for their homeostasis, function and maintenance and
therefore highly express the IL-2 receptor α-chain, CD254. IL-2 and other members of the
IL-2 family that signal via the common γ-chain (γc; CD132) are important for the induction
of immunoregulatory CD4+ T cells5, 6. The markers most generally used to defi ne human
immunoregulatory CD4+ T cells are that they constitutively express the forkhead/winged helix
transcription factor FoxP37, 8, while they do not constitutively express the IL-7 receptor α-chain
and are therefore CD127-/low9. The majority of the immunoregulatory CD4+ T cells express the
CD45RO memory marker, GITR, CTLA-410 and the homing markers CCR7 and CD62L, both
necessary for their migration11. The proliferation of CD25-/dim Teff can be inhibited by anergic
peripheral CD4+CD25bright T cells either directly in a cell-cell contact-dependent manner12, 13
or via the suppression of the IL-2 and IFN-γ production14-16. Other molecular mechanisms of
immunoregulatory CD4+ T cell-mediated suppression are through the secretion of IL-10 and
TGF-β and via killing of the Teff directly by cytolysis17, 18.
It has been shown that immunosuppressive drugs, such as the calcineurin inhibitors
cyclosporine and tacrolimus negatively aff ect the frequency and function of CD4+CD25bright
T cells19-21. However, other agents, for instance the mTOR inhibitors and rabbit anti-thymocyte
globulins, may favour the expansion of the CD4+CD25bright T cells22-24. Induction therapy with
anti T-cell depletion strategies as rATG is used to avoid rejection or to minimize the nephrotoxic
eff ect of CNI on immediate graft function25-27. Known mechanisms of action by rATG are deple-
tion of immunocompetent cells through complement-dependent lysis or activation-associated
apoptosis28, 29, and modulation of several molecules on residual circulating leucocytes that
are involved in regulating leucocyte-endothelium adhesion and leucocyte migration, e.g. the
chemokine receptors CXCR4, CCR5 and CCR728,30. Experimental studies suggested that the
immunosuppressive activity of rATG may also result from its eff ect on CD4+CD25brightFoxP3+ T
cells by either the selective sparing of immunoregulatory CD4+ T cells or by the induction and
expansion of regulatory T cells24, 31, 32. Therefore, rATG-treatment in patients may modulate the
immune system and enhance the process leading to hyporesponsiveness towards the allograft.
Here, we characterized the frequency, function and phenotypic characteristics (e.g. FoxP3,
CD127, CD45RO and CCR7) of peripheral blood CD4+CD25bright immunoregulatory T cells of
kidney-transplant patients that received rATG induction therapy combined with triple therapy
consisting of tacrolimus, mycophenolate mofetil and steroids, prior to transplantation and at 4,
14 and 26 weeks after transplantation. Patients without rATG therapy and only triple therapy
served as controls.

Chap
ter 4
66
MATERIALS & METHODS
Patients and study design
Kidney transplant patients (n=34) were enrolled in this study. The patients (n=16) were
given one infusion of 2 mg/kg Anti-thymocyte Globulin (Rabbit) (Thymoglobulin®, Genzyme
Corporation, Cambridge, MA) each day at Day 1, 2 and 3 after transplantation followed by a
triple therapy maintenance regimen consisting of tacrolimus, MMF and prednisone. MMF and
prednisone were given from Day 1 and tacrolimus was given from Day 2 after transplantation.
A control non-rATG patient group (n=18) was given triple therapy alone. Patient characteristics
are depicted in Table 1. The patients were part of a feasibility study on a pilot for a future ran-
domized controlled trial and were included between April and August 2007. After informed
consent, peripheral blood was drawn pre-transplant and at 4, 14 and 26 weeks after transplan-
tation. The Medical Ethical Commission of the Erasmus Medical Center approved the protocol.
Flow cytometry
EDTA-blood was analyzed for the presence of T-cell subsets by four-color fl ow cytometry using
mAbs directly conjugated to fl uorescein isothiocyanate (FITC), phycoerythrin (PE), allophy-
cocyanin (APC) or peridinin chlorophyll protein (PerCP). Blood (100 μL) was incubated with
CD45-FITC/CD14-PE, IgG1-FITC/IgG2b-PE and CD19-APC. Furthermore, CD3-FITC, CD4-PerCP,
CD8-APC, and CD3/16/56-FITC/PE were also used (BD Biosciences, San Jose, CA and R&D Sys-
tems, Abingdon, UK). After 30-min incubation at RT, red blood cells were lysed. White blood
cells were washed twice, and analyzed on a fl ow cytometer (FACSCalibur) using SimulSet and
CELL Quest Pro software (BD Biosciences). The number of leucocytes was determined by the
cell counter CASY® model TT (Schärfe System GmbH, Reutlingen, Germany).
FoxP3 intracellular staining was performed according to the manufacturer’s instructions
(FoxP3-APC, clone PCH101, eBiosciences, San Diego, CA). Extracellular staining was conducted
prior to intracellular staining with FITC-conjugated CD127, IgG1, or CCR7, PERCP-conjugated
CD4 and PE-conjugated CD25 or CD45RO at 4°C for 30 min (BD Biosciences. To discriminate
between eff ector memory (CD45RO+CCR7-), central memory (CD45RO+CCR7+) and naïve
Table 1. Demographics of Kidney Transplant Patients
rATG - group Non - rATG groupPatients (n) 16 18
Recipient gender (M/F) 7/9 8/10
Recipient age at KTx 53 ± 17* 53 ± 13*
HLA Incompatibilities
HLA-A MM (number)
HLA-B MM (number)
HLA-DR MM (number)
0.8 ± 0.8*
1.2 ± 0.7*
0.9 ± 0.7*
1.0 ± 0.8*
1.3 ± 0.8*
1.1 ± 0.8*
Acute Rejection (n) 1 (6%) 3 (17%)
Infections (n) 4 (25%) 2 (11%)
*Mean ± SD

rATG Induction Therapy and Regulatory T Cells 67
(CD45RO-CCR7+) T cells, CCR7 was combined with CD45RO33. Flow cytometric analysis was
performed with at least 100 events in the gate.
Isolation of Peripheral Blood Lymphocytes
Peripheral blood mononuclear cells (PBMC) were isolated by density gradient centrifugation
over Ficoll-paque, frozen in 10% DMSO enriched RPMI 1640 medium (BioWhittaker, Verviers,
Belgium) and stored at -140˚C.
Isolation of human CD4+CD25bright T cells
PBMC were thawed and resuspended in 10% human culture medium (HCM), that consisted of
RPMI 1640 medium with L-glutamine (Bio Whittaker) supplemented with 10% pooled human
serum, 100 IU/mL penicillin and 100 μg/mL streptomycin (Gibco BRL). The CD25bright T cells were
isolated from PBMC after incubation with anti-CD25 microbeads, (Miltenyi Biotech, Bergisch
Gladbach, Germany) followed by positive selection (POSSELD-program) on the autoMACS
(Miltenyi Biotech). The untouched residual fraction consisted of > 98% of CD25-/dim Teff and was
used as responder population. Both fractions were stained with CD4-PERCP (BD Biosciences)
and CD25-PE epitope B (clone M-A251, BD Biosciences). The purity of CD25bright was > 90%.
Suppression Assay
The function of CD4+CD25bright T cells was determined by MLR in which the suppressive capac-
ity of CD25bright T cells was measured twice; fi rstly by their depletion from PBMC, and secondly
by their ability to inhibit the proliferative responses to donor and 3P antigens of the CD25-/
dim Teff . The CD25-/dim Teff were co-cultured in triplicate with and without CD25bright T cells.
Irradiated (40 Gy) donor spleen cells and HLA mismatched (2-2-2) 3P spleen-cells were used
as stimulator cells (1x10⁵ cells/100 μL) and co-cultured with 5x10⁴ cells/100 μL of a mixture of
CD25bright : CD25-/dim at 1:10, 1:20, 1:40 and 1:80 ratios in round-bottom 96-well plates (Nunc,
Roskilde, Denmark). Moreover, the CD25bright T cells were co-cultured with irradiated CD25-/
dim Teff in the presence of donor- and 3P antigens to confi rm their anergic state. After 7 days’
incubation at 37°C in a humidifi ed atmosphere of 5% CO2, the proliferation was measured after 3H-thymidine (0.5 μCi/well: Amersham Pharmacia Biotech) incubation during the last 16 hr
before harvesting. The median counts per minute (cpm) for each triplicate was determined and
the level of suppression of the CD25-/dim Teff by CD25bright T cells was calculated and expressed
as the percentage inhibition of the Teff .
Statistical analyses
Statistical analyses were performed using Graphpad Prism (v.4.03). Based on the distribution
of the data we performed non-parametric testing. For determination of the levels of statistical
signifi cance, the two-sided probability values according to the Kruskal-Wallis test, the Wilcoxon
matched pairs test and the Mann Whitney U Test was used. For comparisons within the rATG-group
Chap
ter 4
68
over time, the non-parametric Kruskal-Wallis test was used and the results were validated with
the Wilcoxon matched pairs test. To test diff erences between groups the Mann Whitney U test
(unpaired measurements) was used. Post-hoc analyses were performed using Bonferroni’s test
for multiple comparisons. P values < 0.05 were considered statistically signifi cant.
RESULTS
Patients
We observed acute rejections in three patients of the non-rATG group and in one patient of
the rATG-group within 26 weeks post-transplantation (Table 1). The number of infections was
not signifi cantly diff erent between both groups. There were no diff erences in renal function or
blood trough levels of tacrolimus between both groups in the fi rst 26 weeks. However, in the
non-rATG group, the MMF trough level was signifi cantly higher at 14 wks after transplantation
compared with the rATG-group, probably due to adjustments according to leucocyte levels.
Flow cytometry of lymphocyte subsets
After rATG-treatment we observed a signifi cant decrease in CD3+ T cells, CD3-CD16/56+ NK cells,
CD8+ T cells, CD4+ T cells, CD4+CD25bright T cells and not in CD19+B-cells compared to pre-transplant
levels in the rATG-group (p<0.01, Figure 1). The magnitude of the decrease in T cells, NK-cells, CD4+
T cells, CD4+CD25bright T cells, CD4+CD25brightFoxP3+ T cells and CD4+CD25brightFoxP3+CD127-/low
T cells was more outspoken compared to the non-rATG group (p<0.01).
After 4 weeks, the number of all cell types in both groups increased although this recovery
occurred more gradually in the rATG-group. The number of CD3+ T cells in this group remained
signifi cantly lower compared to pre-transplant levels and partial recovery was only 50% of
baseline at 26 weeks (Figure 1A). Along with the recovery of the CD4+ T cells, the CD4+CD25bright
T cells recovered only to ~30% of baseline at 26 weeks (p<0.01, Figures 1E and F, respectively).
To determine the percentage of bona fi de regulatory T cells, we further phenotyped
CD4+CD25bright T cells for the regulatory T-cell marker FoxP3. Pre-transplant, the percentage of
CD4+CD25bright T cells that expressed FoxP3 fl uctuated between individuals, though the major-
ity of the CD4+CD25bright T cells expressed FoxP3 in both groups, which is in line with the results
of Liu et al. (top 10% of CD4+CD25bright in the gate; 72% ± 2, mean ± SEM, top 5%: > 80% and top
2% > 90%)9. Therefore, the pattern of the absolute cell number of CD4+CD25brightFoxP3+ T cells
(Figure 1G) is comparable to the CD4+CD25bright T cell counts. Almost all CD4+CD25brightFoxP3+
T cells were CD127-/low (90% ± 1, mean ± SEM, Figure 1H).
At all time-points after transplantation, the cell-numbers of the CD4+, CD4+CD25bright,
CD4+CD25brightFoxP3+ and CD4+CD25brightFoxP3+CD127-/low T cells were signifi cantly lower
in the rATG group than in the non-rATG-group. In the non-rATG group, at 26 weeks, all cell
numbers returned to baseline levels (Figure 1).

rATG Induction Therapy and Regulatory T Cells 69
CD4+FoxP3+CD25brightCD127-/low
0 4 14 26
0
10
20
30
ATGNon-ATG
Time (weeks)
p<0.01
p<0.01 p=0.02p<0.01
cell
num
bers
/ μL
(mea
n ±SE
M)
T cells
0 4 14 26
0
250
500
750
1000
1250
ATGNon-ATG
Time (weeks)
p<0.01
p<0.01
cell
num
bers
/ μL
(mea
n ±SE
M)
p=0.01
NK cells
0 4 14 26
0
100
200
300
ATGNon-ATG
Time (weeks)
p=0.01
p<0.01
cell
num
bers
/ μL
(mea
n ±SE
M)
CD4+ T cells
0 4 14 26
0
100
200
300
400
500
600
ATGNon-ATG
Time (weeks)
p<0.01
p<0.01p<0.01
p<0.01
cell
num
bers
/ μL
(mea
n ±SE
M)
CD4+CD25bright
0 4 14 26
0
10
20
30
ATGNon-ATG
Time (weeks)
p<0.01
p<0.01
p<0.01
cell
num
bers
/ μL
(mea
n ±SE
M)
p=0.01
CD4+CD25brightFoxP3+
0 4 14 26
0
10
20
30
ATGNon-ATG
Time (weeks)
p<0.01
p<0.01p=0.05
p<0.01
cell
num
bers
/ μL
(mea
n ±SE
M)
A B
C
F
HG
E
D
Figure 1. Prospective analysis of PBMC and T-cell subpopulations by fl ow cytometry
Kinetics of diff erent cell types and cell subsets in the rATG treated patients (n=16, solid line) and non-rATG treated patients (n=18, dotted line).
Data are depicted as mean ± SEM. (A) T cells (B) B cells (C) NK cells (D) CD8+ T cells (E) CD4+ T cells (F) CD4+CD25bright T cells of CD4+ T cells (G)
CD4+CD25brightFoxP3+ T cells of CD4+ T cells and (H) CD4+CD25brightFoxP3+CD127-/low of CD4+ T cells. Statistically signifi cant diff erences within the
rATG group over-time were tested by Kruskal-Wallis Test and validated by the Wilcoxon matched pairs test and diff erences between the rATG- and
non-rATG groups were tested with the Mann-Whitney U Test.

Chap
ter 4
70
Suppressive capacity of CD4+CD25brightFoxP3+CD127-/low T cells
The proliferative capacity of the PBMC and the CD25-/dim Teff was analyzed in the MLR. At 14 and
26 weeks, the proliferative responses of the allo-activated PBMC population were reduced com-
pared to pre-transplant (Figures 2A and B). This phenomenon was not observed in the non-rATG
group. After depletion of the CD25bright T cells, the proliferation of the CD25-/dim Teff in response
to alloantigens showed the same pattern as the PBMC, as their proliferative capacity is aff ected by
rATG (Figures 2C and D). These fi ndings suggest that the anti-donor hyporesponsiveness can be
the result of impaired responses by eff ector T cells and suppressive actions by regulatory T cells.
Therefore, we studied the suppressive capabilities of the CD4+CD25brightFoxP3+CD127-/low
T cells at 26 weeks after rATG treatment. Due to the low number of T cells, it was not possible
to study the regulatory activities of CD25bright T cells at 4 and 14 weeks after rATG-treatment.
At 26 weeks, the number of PBMC was suffi cient and the function of the CD25bright T cells was
Anti-donor response (PBMC)
All
non-
rATG
rATG
non-
rATG
rATG
0
10000
20000
30000
40000
14 wks 26 wks pre-Tx
p=0.01p<0.01p=0.03
3 H-t
hym
idin
e in
corp
orat
ion
(cpm
) mea
n ±SE
M
Third party response (PBM C)
All
non-
rATG
rATG
non-
rATG
rATG
0
10000
20000
30000
40000
14 wks 26 wks pre-Tx
p=0.02p=0.05
3 H-t
hym
idin
e in
corp
orat
ion
(cpm
) mea
n ±SE
M
Antidonor response (CD25-/dim
)
All
non-
rATG
rATG
non-
rATG
rATG
0
10000
20000
30000
40000
50000
14 wks 26 wks pre-Tx
p=0.04 p=0.02
3 H-t
hym
idin
e in
corp
orat
ion
(cpm
) Mea
n ±SE
M
Third party response (CD25-/dim
)
All
non-
rATG
rATG
non-
rATG
rATG
0
10000
20000
30000
40000
50000
60000
70000
14 wks 26 wks pre-Tx
p=0.03p=0.04
3 H-t
hym
idin
e in
corp
orat
ion
(cpm
) Mea
n ±SE
M
A B
C D
Figure 2. Mixed lymphocyte reactions with PBMC and CD25-/dim Teff
PBMC of rATG treated patients (n=6) and non-rATG treated patients (n=6) were isolated pre-transplant (dotted bars) and at 14 and 26 weeks and
were stimulated in vitro with donor (A) and 3P spleen cells (B) in the MLR. (C) CD25-/dim T cells were stimulated in vitro with donor and (D) 3P
antigens. Proliferation is depicted as counts per minute (cpm) after 3H-Thymidine incorporation. Error bars represent mean ± SEM.

rATG Induction Therapy and Regulatory T Cells 71
measured. After depletion of the CD25bright T cells, the anti-donor and 3P proliferative responses
of the CD25-/dim Teff increased, pre- and post transplant (Figure 3). The CD25bright T cells of post-
transplant were anergic in response to donor- and 3P antigens and in the presence of irradiated
CD25-/dim Teff . Pre- and post-transplant, co-culture of CD25bright T cells and the CD25-/dim Teff
resulted in the inhibition of the anti-donor and 3P proliferative responses of the CD25-/dim Teff
in a dose-dependent manner (Figure 3). When the percentage of inhibition of the CD25-/dim Teff
response to 3P antigens was calculated at diff erent CD25bright : CD25-/dim ratios, this remained
proportionally unaltered (Figure 3). Post-transplant, the percentage of inhibition of the anti-
donor response at a 1:10 ratio was similar to the non-rATG-group (proliferation [cpm] 0:1 vs.
1:10 ; 20684 ± 11107 vs. 3142 ± 2326, mean ± SEM, percentage inhibition: 85%). These results
show that though diminished in number, the CD25bright T cells have proportionally adequate
suppressor activity after rATG-treatment, whereas the proliferative capacity of the CD25-/dim Teff
is signifi cantly aff ected by rATG.
Phenotypical characterization of CD4+FoxP3+ T cells
We subsequently quantifi ed the CD4+ regulatory T cells using an approach independent
of CD25 expression (Figure 4A). At 1 week after rATG-treatment, no measurable numbers of
CD4+FoxP3+CD127-/low T cells were present in the circulation. At 4 weeks, 5 out of 16 patients
(31%) had a suffi cient number of T cells to perform a FoxP3 staining. In the rATG-group, the
percentage of CD4+FoxP3+ T cells that had the CD127-/low phenotype did not change (89% ±
1.0, mean ± SEM) as depicted in Figure 4B, indicating that the recovered CD4+FoxP3+ T cells
harbored the phenotype of genuine regulatory T cells. After 4 weeks, along with the depletion
of CD4+ T cells in the rATG-group, the number of patients that had detectable cell numbers of
CD4+FoxP3+CD127-/low T cells increased (88%), but in each patient, the homeostatic reconstitu-
tion occurred slowly (Figure 4C).
Naïve, central memory and eff ector memory regulatory T cells
In the literature it has been described that T cells with the memory phenotype are resistant of
immunodepletion by rATG34 but in our patient cohort we did not measure any T cells imme-
diately after rATG-treatment. Hence, the percentage of CD4+CD45RO+ profoundly rose above
baseline and was higher than non-rATG group (Figure 5A). The percentage of CD4+CCR7+ mas-
sively decreased after depletion and was lower than the non-rATG group at 14 and 26 weeks
(Figure 5B).
Subsequently, we analyzed whether the recovered CD4+FoxP3+ T cells after rATG induction
were predominantly of the memory phenotype as homeostasis-driven proliferation after
immunodepletion may account for an increase in memory CD4+FoxP3+ T cells35. Therefore, we
phenotyped the CD4+FoxP3+ T cells for CD45RO and CCR7. The combination of both markers
allows a distinction between the central memory and eff ector memory T cells33, 36, 37.

Chap
ter 4
72
Within the rATG-treated patients in whom we measured CD4+FoxP3+ T cells, a shift in the
proportion of FoxP3+ cells expressing CD45RO was observed. Along with the CD4+ T cells, the
proportion of CD4+FoxP3+ T cells that expressed CD45RO+ was higher at 14 and 26 weeks com-
pared to baseline levels and higher than the non-rATG group (Figure 5C). rATG also infl uenced
the CD4+FoxP3+ T cells expressing CCR7, as the proportion of CD4+FoxP3+CCR7+ was lower than
in the non-rATG group at 14 and 26 weeks (Figure 5D).
After rATG-treatment, signifi cant diff erences were observed in the composition of the naïve
(CD45RO-CCR7+), central memory (CD45RO+CCR7+) and eff ector memory (CD45RO+CCR7-)
CD4+FoxP3+ T cell populations. At 14 and 26 weeks, the percentage of naïve T cells within the
Pre-T x
PBM
C 0:1
1:10
1:20
1:40
1:80
PBM
C 0:1
1:10
1:20
1:40
1:80
0100002000030000400005000060000700008000090000
Donor 3P
CD25bright: CD25-/dim
3 H-t
hym
idin
e in
corp
orat
ion
(cpm
) mea
n ±SE
M
p=0.03 p=0.03
57% 72% 89% 48% 89% 71% 55% 29%
26 wks
PBM
C 0:1
1:10
1:20
1:40
1:80
PBM
C 0:1
1:10
1:20
1:40
1:80
0100020003000400050006000700080009000
Donor 3P
CD25bright: CD25-/dim
p=0.06 p=0.03
3 H-t
hym
idin
e in
corp
orat
ion
(cpm
) mea
n ±SE
M
94% 90% 81% 75%
86% 93% 49% 35%
A
B
Figure 3. Suppressive capacity of regulatory T cells before and after rATG treatment in suppression assays
The ability of CD25bright T cells to suppress the anti-donor (grey bars) and 3P responses (dark gray bars) of the CD25-/dim Teff was analyzed before
and after rATG-treatment. Proliferation is depicted as counts per minute (cpm) after 3H-Thymidine incorporation and the percentage of inhibition
of the CD25-/dim eff ector T cell response (mean) is shown. (A) Suppression assay with PBMC before rATG-treatment. The anti-donor and 3P
response of the PBMC and the CD25-/dim Teff is given. After co-culture of CD25-/dim Teff and CD25bright T cells, the anti-donor and 3P responses of
the CD25-/dim Teff were inhibited in a dose-dependent manner. (B) At 26 weeks after rATG-treatment, CD25-/dim Teff were also inhibited in a dose-
dependent manner. Note that the y-axis is only 10% of the pre-transplant values. Error bars represent mean ± SEM of n=6.

rATG Induction Therapy and Regulatory T Cells 73
rATG-group was lower than pre-transplant and lower compared to the non-rATG group (Figure
5E). The fall in the proportion of naïve T cells after rATG-treatment was associated with an increase
in the proportion of the CD45RO+ memory pool that was due to an increase of the central memory
CD4+FoxP3+ T cells (Figure 5F). The percentage of eff ector memory CD4+FoxP3+ T cells remained
stable over time, but was higher than in the non-rATG group at 14 and 26 weeks (Figure 5G).
DISCUSSION
In the present prospective controlled study, we investigated the eff ect of rATG induction ther-
apy on the function and phenotype of peripheral CD4+CD25brightFoxP3+CD127-/low regulatory T
cells in KTx patients. Our fi ndings demonstrate that the CD3+ T cells, CD3-CD16/56+ NK cells, and
CD4+ T cells, but not CD19+ B cells are depleted after rATG-treatment (Figure 1). The number of T
cells steadily recovered to 50% of baseline at 26 weeks. Interestingly, the recovery the number
of CD4+T cells remained at 30% of baseline. This may be attributed by a slow regeneration and
thymic output of CD4+ T cells, which occurs more gradually in the elderly38.
FoxP3
CD127
FoxP3
CD4
9%90%
CD127-/low of CD4+FoxP3+
0 4 14 26
050 ATG
Non-ATG
Time (weeks)
70
80
90
100
perc
enta
ge(m
ean ±
SEM
)
CD4+FoxP3+CD127-/low
0 4 14 26
0
10
20
30
40
ATGNon-ATG
Time (weeks)
p<0.01
p<0.01p<0.01
p<0.01
cell
num
bers
/ μL
(mea
n ±SE
M)
A
B C
Figure 4. Characterization of regulatory T cells that are recovered after rATG treatment
(A) Representative fl ow cytometric results of CD127-/low expression within CD4+FoxP3+ T cells. About 90% of the CD4+FoxP3+ T cells have the
CD127-/low phenotype. (B) The percentage of CD127-/low of CD4+FoxP3+ T cells remained constant both in the rATG and non-rATG group. (C)
Evaluation of the kinetics of CD4+FoxP3+CD127-/low T cells before and after transplantation. Absolute cell numbers are shown. CD4+FoxP3+CD127-/
low T cells were depleted after rATG-treatment (p<0.01) and showed similar kinetics and pattern as the CD4+CD25bright T cells. Data are depicted
as mean ± SEM.

Chap
ter 4
74
CD4+CD45RO+
0 4 14 26
30
40
50
60
70
80
90
ATGNon-ATG
Time (weeks)
p<0.01p<0.01
p=0.01p<0.01
Perc
enta
ge(m
ean ±
SEM
)
CD4+CCR7+
0 4 14 26
30
40
50
60
70
80
90
ATGNon-ATG
p<0.01p<0.01
p<0.01p<0.01
Time (weeks)
perc
enta
ge(m
ean ±
SEM
)
CD4+FoxP3+CD45RO+
0 4 14 26
30
40
50
60
70
80
90
ATGNon-ATG
p<0.01 p<0.01
p<0.01p<0.01
Time (weeks)
Perc
enta
ge(m
ean ±
SEM
)
CD4+FoxP3+CCR7+
0 4 14 2630
40
50
60
70
80
90
ATGNon-ATG
Time (weeks)
p<0.01 p<0.01
perc
enta
ge(m
ean ±
SEM
)
0 4 14 26
0
10
20
30
40
50
ATGNon-ATG
p=0.02 p<0.01
p<0.01
p<0.01
Naive CD4+FoxP3+
Time (weeks)
Perc
enta
ge(m
ean ±
SEM
)
Central Memory CD4+FoxP3+
0 4 14 260
20ATGNon-ATG
Time (weeks)
p<0.01
p<0.01
20
30
40
50
Perc
enta
ge(m
ean ±
SEM
)
Effector Memory CD4+FoxP3+
0 4 14 260
10ATGNon-ATG
p<0.01 p<0.01
Time (weeks)
10
20
30
40
50
Perc
enta
ge(m
ean ±
SEM
)
A B
C D
E F
G
Figure 5. Phenotyping of the naïve, eff ector memory and central memory regulatory T cells
Longitudinal and detailed analysis of CD4+ T cells and CD4+FoxP3+ T cells in the rATG-group (solid line) and the non-rATG group (dotted line).
Within the CD4+FoxP3+ T cells the (A) CD4+CD45RO+ T cells as CD45RO+ of CD4+ (B) CD4+CCR7+ T cells as CCR7+ of CD4+ (C) CD4+FoxP3+CD45RO+
T cells as CD45RO+ of CD4+FoxP3+ (D) CD4+FoxP3+CCR7+ T cells as CCR7+ of CD4+FoxP3+ (E) Naïve (CD4+FoxP3+CD45RO-CCR7+) T cells as
CD45RO-CCR7+ of CD4+FoxP3+ (F) Central memory (CD4+FoxP3+CD45RO+CCR7+) T cells as CD45RO+CCR7+ of CD4+FoxP3+ and (G) Eff ector
memory (CD4+FoxP3+CD45RO+CCR7-) T cells as CD45RO+CCR7- of CD4+FoxP3+ were characterized. Results are expressed as the percentage of
positive cells. Error bars represent mean ± SEM.

rATG Induction Therapy and Regulatory T Cells 75
We found that the regulatory T cells whether defi ned as CD4+CD25bright, CD4+CD25brightFoxP3+,
CD4+CD25brightFoxP3+CD127-/low or CD4+FoxP3+CD127-/low T cells, were totally depleted from
the peripheral blood after rATG-treatment (Figures 1 and 4). Our results are in accordance with
Louis et al. who reported that ATG did not specifi cally spare the CD4+CD25bright T cells29.
In concert with the slow repopulation of the CD4+ T cells, the CD4+CD25bright and
CD4+FoxP3+CD127-/low T cells did not fully recover and showed an impaired homeostasis in the
fi rst 26 weeks after rATG-treatment. We found that the FoxP3 expression did not change at the
protein level after rATG treatment within 26 weeks after transplantation. Again in line with this,
it was described that the FoxP3 mRNA transcripts were not upregulated within 2 years after
transplantation29. From these data it can be concluded that regulatory and non-regulatory
CD4+ T cells show the same behavior after rATG induction therapy. Several studies with other
immunodepleting agents as e.g. Campath-1H (anti-CD52) support our and above mentioned
data by showing that the number of CD4+CD25brightFoxP3+ regulatory T cells signifi cantly
decreased after treatment and remained very low thereafter, suggesting that this eff ect is
driven by immunodepletion in general39-41.
After rATG-treatment, the proliferative capacity of the PBMC and CD25-/dim Teff markedly
decreased as shown in Figures 2 and 3. Besides general phenomena that account for the
hyporesponsiveness as anergy, clonal deletion and ignorance of donor-directed eff ector T
cells, we have several rATG-specifi c explanations for the observed hyporesponsiveness. Firstly,
the low proliferation can be attributed to a low percentage of T cells among the lymphocyte
population and the low number of CD4+ T cells within the T cell population as this resulted
in an inverse CD4+ to CD8+ ratio (Figure 1). The low number of CD4+ T cells is associated with
an inferior T-helper cell response to CD8+ T cells in comparison with before transplantation. A
second explanation is given by Preville et al. who demonstrated in non-human primates that
non-depleted CD3+ and CD4+ T cells in lymph nodes that were coated by rATG, down regulated
CD2, CD3, CD4 and CD8 molecules and had impaired responsiveness in the MLR42. Thirdly,
other studies reported that T-helper cell function is aff ected by rATG by impaired co-stimulatory
signals delivered by monocytes43 or by decreased expression of the co-stimulatory molecule
CD28 on T cells44, 45 and fourthly, by a post-transcriptional defect of CD25 expression resulting
in a reduced IL-2 response, whereas a normal IL-2 secretion is preserved43. Fifthly, as demon-
strated by Haidinger et al., the low proliferative capacities of the Teff population could also be
due to disruption of the T-cell/Antigen Presenting Cell (APC) interface by rATG46. Sixthly, rATG
triggers lysis of dendritic cells47, 48 and impairs their maturation49 and therefore DCs will not
play an active role in the antigen presentation to T cells. Here, we report another explanation
for the hyporesponsiveness of the PBMC, i.e. the partial involvement of functional regula-
tory T cells. Depletion of the CD25bright population from the PBMC resulted in an increased
proliferation and in co-culture experiments these CD25bright T cells profoundly suppressed
the anti-donor and 3P responses after rATG-treatment (Figure 3). Therefore, our main fi nding
is that rATG aff ected the function of recovered Teff whereas the suppressive activity of the

Chap
ter 4
76
newly generated regulatory T cells remained proportionally unaltered. The CD4+FoxP3+ T cells
measured in the rATG-group are probably not regenerated by the thymus as the percentage
of naïve T cells profoundly decreased as shown in Figure 5. This suggests that there could be a
transient eff ect on the regenerative capacity of thymus. As we observed a shift in the frequency
of CD4+FoxP3+CD127-/low T cells towards the central memory phenotype (Figure 5), it is likely
that the naïve CD4+FoxP3+ T cells diff erentiated into memory CD4+FoxP3+ T cells. Factors such
as donor-antigens or rabbit immunoglobulins that act as foreign antigens might contribute to
this diff erentiation. Since the increase in the proportion of CD4+FoxP3+ memory T cells was not
observed in the control group, particularly rabbit immunoglobulins must play an important
role. To our knowledge, we provide the fi rst evidence that rATG therapy in KTx patients aff ects
the function of CD25-/dim Teff and preserves CD4+CD25bright regulatory T-cell function. As one
might expect from experimental studies, the therapeutic eff ect of rATG in vivo neither arose
from the expansion of residual regulatory T cells nor from de novo generation that resulted in
an increase above baseline. Most importantly, the regulatory T cells that recovered after rATG-
treatment were able to eff ectively govern allogeneic immune responses by eff ector T cells as
before rATG-treatment.
ACKNOWLEDGEMENTS
The authors would like to thank the transplant research nurses Annemarie Geel and Hanneke
Tanck-Vernhout for the coordination of this study and for asking patients for their willingness
to participate in this study.

rATG Induction Therapy and Regulatory T Cells 77
REFERENCES
1. Sakaguchi, S. Naturally arising Foxp3-expressing CD25+CD4+ regulatory T cells in immunological tolerance to self and non-self. Nat Immunol 6, 345-352 (2005).
2. Sakaguchi, S., Sakaguchi, N., Shimizu, J. et al. Immunologic tolerance maintained by CD25+ CD4+ regulatory T cells: their common role in controlling autoimmunity, tumor immunity, and transplanta-tion tolerance. Immunol Rev 182, 18-32 (2001).
3. Albert, M.H., Liu, Y., Anasetti, C. et al. Antigen-dependent suppression of alloresponses by Foxp3-induced regulatory T cells in transplantation. Eur J Immunol 35, 2598-2607 (2005).
5. Koenen, H.J., Fasse, E., Joosten, I. IL-15 and cognate antigen successfully expand de novo-induced human antigen-specifi c regulatory CD4+ T cells that require antigen-specifi c activation for suppres-sion. J Immunol 171, 6431-6441 (2003).
6. Cookson, S., Doherty, D.G., Todryk, S. et al. Hepatic expression of IL-15 mRNA is associated with liver graft acceptance. Transpl Immunol 11, 39-48 (2003).
7. Gavin, M.A., Rasmussen, J.P., Fontenot, J.D. et al. Foxp3-dependent programme of regulatory T-cell diff erentiation. Nature 15, 771-775 (2007).
8. Fontenot, J.D., Rasmussen, J.P., Gavin, M.A. et al. A function for interleukin 2 in Foxp3-expressing regulatory T cells. Nat Immunol 6, 1142-1151 (2005).
9. Liu, W., Putnam, A.L., Xu-Yu, Z. et al. CD127 expression inversely correlates with FoxP3 and suppressive function of human CD4+ T reg cells. J Exp Med 203, 1701-1711 (2006).
10. Dieckmann, D., Plottner, H., Berchtold, S. et al. Ex vivo isolation and characterization of CD4(+)CD25(+) T cells with regulatory properties from human blood. J Exp Med 193, 1303-1310 (2001).
11. Lim, H.W., Broxmeyer, H.E., Kim, C.H. Regulation of traffi cking receptor expression in human forkhead box P3+ regulatory T cells. J Immunol 177, 840-851 (2006).
12. Sakaguchi, S., Sakaguchi, N., Asano, M. et al. Immunologic self-tolerance maintained by activated cells expressing IL-2 receptor alpha-chains (CD25). Breakdown of a single mechanism of self-tolerance causes various autoimmune diseases. J Immunol 155, 1151-1164 (1995).
13. Lombardi, G., Sidhu, S., Batchelor, R. et al. Anergic T cells as suppressor cells in vitro. Science 264, 1587-1589 (1994).
14. Maloy, K.J., Powrie, F.. Fueling regulation: IL-2 keeps CD4+ Treg cells fi t. Nat Immunol 6, 1071-1072 (2005).
15. Salama, A.D., Najafi an, N., Clarkson, M.R. et al. Regulatory CD25+ T cells in human kidney transplant recipients. J Am Soc Nephrol 14, 1643-1651 (2003).
16. Thornton, A.M., Shevach, E.M. CD4+CD25+ immunoregulatory T cells suppress polyclonal T cell activation in vitro by inhibiting interleukin 2 production. J Exp Med 188, 287-296 (1998).
17. Seddiki, N., Santner-Nanan, B., Martinson, J. et al. Expression of interleukin (IL)-2 and IL-7 receptors discriminates between human regulatory and activated T cells. J Exp Med 203, 1693-1700 (2006).
18. Grossman, W.J., Verbsky, J.W., Barchet, W. et al. Human T regulatory cells can use the perforin pathway to cause autologous target cell death. Immunity 21, 589-601 (2004).
19. Baan, C.C., van der Mast, B.J., Klepper, M. et al. Diff erential eff ect of calcineurin inhibitors, anti-CD25 antibodies and rapamycin on the induction of FOXP3 in human T cells. Transplantation 80, 110-117 (2005).
20. Segundo, D.S., Ruiz, J.C., Izquierdo, M. et al. Calcineurin inhibitors, but not rapamycin, reduce per-centages of CD4+CD25+FOXP3+ regulatory T cells in renal transplant recipients. Transplantation 82, 550-557 (2006).
21. Demirkiran, A., Kok, A., Kwekkeboom, J. et al. Decrease of CD4+CD25+ T cells in peripheral blood after liver transplantation: association with immunosuppression. Transplant Proc 37, 1194-1196 (2005).
22. Game, D.S., Hernandez-Fuentes, M.P., Lechler, R.I. Everolimus and basiliximab permit suppression by human CD4+CD25+ cells in vitro. Am J Transplant 5, 454-464 (2005).

Chap
ter 4
78
23. Coenen, J.J., Koenen, H.J., van Rijssen, E. et al. Rapamycin, not cyclosporine, permits thymic genera-tion and peripheral preservation of CD4+CD25+FoxP3+ T cells. Bone Marrow Transplant 39, 537-545 (2007).
24. Lopez, M., Clarkson., M.R., Albin, M. et al. A Novel Mechanism of Action for Anti-Thymocyte Globulin: Induction of CD4+CD25+Foxp3+ Regulatory T Cells. J Am Soc Nephrol 17, 2844-2853 (2006).
25. Benfi eld, M.R., Tejani, A., Harmon, W.E. et al. A randomized multicenter trial of OKT3 mAbs induction compared with intravenous cyclosporine in pediatric renal transplantation. Pediatr Transplant 9, 282-292 (2005).
26. Hardinger, K.L. Rabbit antithymocyte globulin induction therapy in adult renal transplantation. Pharmacotherapy 26, 1771-1783 (2006).
27. Zietse, R., van Steenberge, E.P., Hesse, C.J. et al. Single-shot, high-dose rabbit ATG for rejection prophy-laxis after kidney transplantation. Transpl Int 6, 337-340 (1993).
28. Mohty, M. Mechanisms of action of antithymocyte globulin: T-cell depletion and beyond. Leukemia 21, 1387-1394 (2007).
29. Louis, S., Audrain, M., Cantarovich, D. et al. Long-term cell monitoring of kidney recipients after an antilymphocyte globulin induction with and without steroids. Transplantation 83, 712-721 (2007).
30. Mueller, T.F. Mechanisms of Action of Thymoglobulin. Transplantation 84, S5-S10 (2007). 31. Minamimura, K., Gao, W., Maki, T. CD4+ regulatory T cells are spared from deletion by antilymphocyte
serum, a polyclonal anti-T cell antibody. J Immunol 176, 4125-4132 (2006). 32. Feng, X. et al. Rabbit ATG but not horse ATG promotes expansion of functional CD4+CD25highFOXP3+
regulatory T cells in vitro. Blood 111, 3675-3683 (2008). 33. Sallusto, F., Lenig, D., Forster, R. et al. Two subsets of memory T lymphocytes with distinct homing
potentials and eff ector functions. Nature 401, 708-712 (1999). 34. Pearl, J.P., Parris, J., Hale, D.A. et al. Immunocompetent T-cells with a memory-like phenotype are the
dominant cell type following antibody-mediated T-cell depletion. Am J Transplant 5, 465-474 (2005). 35. Neujahr, D.C., Chen, C., Huang, X. et al. Accelerated memory cell homeostasis during T cell depletion
and approaches to overcome it. J Immunol 176, 4632-4639 (2006). 36. Sallusto, F., Geginat, J., Lanzavecchia, A. Central memory and eff ector memory T cell subsets: function,
generation, and maintenance. Annu Rev Immunol 22, 745-763 (2004). 37. Tosello, V., Odunsi, K., Souleimanian, N.E. et al. Diff erential expression of CCR7 defi nes two distinct
subsets of human memory CD4+CD25+ Tregs. Clin Immunol 126, 291-302 (2008). 38. Aspinall, R., Andrew, D. Thymic involution in aging. J Clin Immunol 20, 250-256 (2000). 39. Trzonkowski, P., Zilvetti, M., Chapman, S. et al. Homeostatic repopulation by CD28-CD8+ T cells in
alemtuzumab-depleted kidney transplant recipients treated with reduced immunosuppression. Am J Transplant 8, 338-347 (2008).
40. Bloom, D.D., Chang, Z., Fechner, J.H. et al. CD4+CD25+FOXP3+ regulatory T cells increase de novo in kidney transplant patients after immunodepletion with Campath-1H. Am J Transplant 8, 793-802 (2008).
41. Pascual, J., Bloom, D., Torrealba, J. et al. Calcineurin inhibitor withdrawal after renal transplantation with alemtuzumab: clinical outcomes and eff ect on T-regulatory cells. Am J Transplant 8, 1529-1536 (2008).
42. Preville, X., Flacher, M., LeMauff , B. et al. Mechanisms involved in antithymocyte globulin immunosup-pressive activity in a nonhuman primate model. Transplantation 71, 460-468 (2001).
43. Bonnefoy-Berard, N., Verrier, B., Vincent, C. et al. Inhibition of CD25 (IL-2R alpha) expression and T-cell proliferation by polyclonal anti-thymocyte globulins. Immunology 77, 61-67 (1992).
44. Weimer, R., Staak, A., Susal, C. et al. ATG induction therapy: long-term eff ects on Th1 but not on Th2 responses. Transpl Int 18, 226-236 (2005).
45. Heitger, A., Winklehner, P., Obexer, P. et al. Defective T-helper cell function after T-cell-depleting therapy aff ecting naive and memory populations. Blood 99, 4053-4062 (2002).

rATG Induction Therapy and Regulatory T Cells 79
46. Haidinger, M., Geyeregger, R., Poglitsch, M. et al. Antithymocyte globulin impairs T-cell/antigen-presenting cell interaction: disruption of immunological synapse and conjugate formation. Trans-plantation 84, 117-121 (2007).
47. Monti, P., Allavena, P., Di Carlo, V. et al. Eff ects of anti-lymphocytes and anti-thymocytes globulin on human dendritic cells. Int Immunopharmacol 3, 189-196 (2003).
48. Fang, L., Fehse, B., Engel, M. et al. Antithymocyte globulin induces ex vivo and in vivo depletion of myeloid and plasmacytoid dendritic cells. Transplantation 79, 369-371 (2005).
49. Gillet-Hladky, S., de Carvalho, C.M., Bernaud, J. et al. Rabbit antithymocyte globulin inhibits monocyte-derived dendritic cells maturation in vitro and polarizes monocyte-derived dendritic cells towards tolerogenic dendritic cells expressing indoleamine 2,3-dioxygenase. Transplantation 82, 965-974 (2006).


Chap ter 5Characterization of Rabbit Anti-Thymocyte Globulins-
Induced CD25+ Regulatory T Cells from Cells of Patients with End Stage Renal Disease
Transplantation 89, 655-666 (2010)
Varsha D.K.D. Sewgobind1,2, Luc J.W. van der Laan2, Marcia M.L. Kho1
Rens Kraaijeveld1, Sander S. Korevaar1, Thea van Dam1, Jan N.M. IJzermans2,
Willem Weimar1 and Carla C. Baan1
Departments of 1Internal Medicine and 2Surgery
Erasmus MC, University Medical Center Rotterdam, the Netherlands

Chap
ter 5
82
ABSTRACT
Rabbit Anti-Thymocyte Globulins (rATG) are known to convert CD4+CD25negFoxP3neg T cells
from healthy individuals into CD4+CD25+FoxP3+ T cells. In this study, we investigated the eff ect
of rATG on the induction of regulatory T cells (Treg) from blood cells of patients with end-stage
renal disease who are candidates for transplantation and rATG-induction therapy. The induced
Treg were analyzed and compared with naturally occurring CD4+CD25+FoxP3+ T cells. The
CD25neg T cells of pre-transplant patients (n=7) and healthy controls (n=4) were stimulated
with rATG or control rabbit immunoglobulins for 24 hr. The phenotype of induced regulatory
T cells was examined by fl ow cytometry and their function was studied in the conventional
suppression assay. Further characterization was performed by mRNA-analyses. After 24 hr,
the percentage of CD4+CD25+FoxP3+CD127-/low T cells and CD8+CD25+FoxP3negCD127+ T cells
became higher in the rATG-treated samples compared with the rIgG-treated samples (p<0.01).
The rATG-induced CD25+ T cells, whether CD4+ or CD8+ inhibited the allogeneic responses of
CD25-/dim eff ector T cells as vigorously as natural CD25+ T cells. However, the proportion of
FoxP3+ within the top 2% rATG-induced CD4+CD25+ T cells was lower than within the natural
CD4+CD25+ T cells (11± 2% vs. 95± 5%, p<0.01). The mRNA-expression levels of IL-27, IL-10,
IFN-γ, perforin and granzyme B were markedly higher compared with natural CD25+ T cells (all
p=0.03), whereas CTLA4 (p=0.03), TGF-β (p=0.02) and RORγt (p=0.04) were lower. rATG allows
the induction of regulatory T cells from patient peripheral blood mononuclear cells (PBMC) in
vitro. In comparison with natural Treg, the rATG-induced Treg are phenotypically distinct, but
have similar regulatory activities. rATG may benefi cially contribute to the mechanisms that
control alloreactivity.

In vitro Induction of Regulatory T Cells by rATG 83
INTRODUCTION
Immunoregulatory T cells may play an important role in the suppression of both autoreactiv-
ity1 and alloreactivity2,3. Apart from the naturally occurring CD4+CD25+FoxP3+CD127-/low T cells
that comprise 2% to 7% of the peripheral CD4+ T cells, the adaptive regulatory T cells (Treg)
are a fi eld of interest, for example, the FoxP3+TGF-β-producing T helper (Th) 3 cells4 and the
FoxP3negIL-10-producing Tr1 cells that upregulate FoxP3 after antigen stimulation5.
The suppressive nature of Treg can be exploited to develop a cell-based therapy to acquire
tolerance in the setting of organ transplantation. In the past, much eff ort has been taken to
expand peripheral Treg in vitro with the ultimate goal to reinfuse them into the patient and
induce graft acceptance6, 7. However, the in vitro expansion procedure encounters major
hurdles with the specifi city and purity of the expanded cells and their migratory capacity in
vivo.
A more promising way of skewing the immune system towards Treg has been shown in
vitro and in experimental animal models with immunosuppressive drugs such as the mTOR-
inhibitors, sirolimus and everolimus8, 9; co-stimulatory inhibitors, CTLA4Ig10 and anti-CD40L11;
the inosine monophosphate inhibitor mycophenolate mofetil (MMF)12; and T-cell depletion
agents such as anti-CD3 antibody13, Campath-1H14, and the polyclonal rabbit anti-thymocyte
globulins (rATG)15-17. rATG is generally used as induction therapy for organ transplant patients to
prevent rejection18, 19. However, the in vitro induction assays to generate Treg were performed
with peripheral blood cells of healthy individuals, whereas patients that receive rATG-induction
therapy post-transplantation had end-stage renal disease (ESRD). The peripheral blood mono-
nuclear cells (PBMC) of these patients are aff ected by the toxic eff ects of, for example, uremia
that is further intensifi ed by treatment with dialysis, which may result in impaired T-cell func-
tion, despite evidence of activation markers of the immune system20-23. Therefore, these PBMC
may, thus, respond in a diff erential manner to rATG than the PBMC of healthy individuals.
In this report, we studied whether functional Treg can be induced in vitro with rATG in PBMC
of ESRD patients. Furthermore, we examined the characteristics of rATG-induced Treg and com-
pared these with the CD4+CD25+FoxP3+CD127-/low naturally occurring Treg. Our study does not
only provide a better perceptive of the phenotype and suppressive activities of induced Treg
in patients after rATG-therapy but also may have therapeutic implications for the drug-driven
induction and expansion of Treg in these patients.

Chap
ter 5
84
MATERIALS & METHODS
Regulatory T-cell induction experiments
PBMC were isolated by density gradient centrifugation over Ficoll-paque (Amersham Phar-
macia Biotech, Uppsala, Sweden) from the peripheral blood or buff y coats from 11 subjects
(n=7 patients with ESRD or n=4 healthy blood bank donors, Sanquin Blood Bank, Rotterdam,
the Netherlands). PBMC were washed twice and were then resuspended in 10% Human Cul-
ture Medium (HCM), which consisted of Roswell Park Memorial Institute 1640 medium with
L-glutamine (Bio Whittaker, Verviers, Belgium) supplemented with 10% pooled human serum
and 100 IU/mL penicillin and 100 μg/mL streptomycin (Gibco BRL, Scotland, UK). The CD25+ T
cells were depleted from the PBMC by incubation with anti-CD25 microbeads, (Miltenyi Bio-
tech, Bergisch Gladbach, Germany) followed by negative selection on the autoMACS (Miltenyi
Biotech, DEPLETE-S program). The untouched residual fraction consisted of CD25neg cells (98%).
To induce Treg with rATG, the residual CD25neg fraction was washed and resuspended in
HCM to a fi nal concentration of 5x10⁵/mL. rATG (Thymoglobulin, Genzyme Corporation, Cam-
bridge, MA) or a control polyclonal rabbit IgG antibody (rIgG, Sigma-Aldrich, St.Louis, MO) in
a fi nal concentration of 10 μg/mL was added to 12-wells plates (Greiner, Alphen a/d Rijn, the
Netherlands) for 24 and 72 hr.
Binding of rATG to lymphocytes was determined by incubation of CD25neg T cells in the pres-
ence of 10 μg/mL rATG or rIgG for 0.5 hr and 24 hr. Before fl ow cytometric analysis, cells were
washed twice with Roswell Park Memorial Institute 1640 medium.
To check the function of induced CD4+CD25+ and CD8+CD25+ T cells after 24 hr, CD3+CD4+
and CD3+CD8+ T cells were sorted with the FACSAria (BD Biosciences, San Jose, CA) on day 0
and then depleted for CD25 by autoMACS. To examine whether the induction of CD25+ Treg is
rATG-specifi c, we also stimulated CD25neg cells with CD3/CD28 Dynabeads (Dynal, Invitrogen,
Breda, the Netherlands).
Flow cytometry
Flow cytometry was performed using antibodies directly conjugated to fl uorescein isothiocya-
nate (FITC), phycoerythrin (PE), allophycocyanin (APC) or peridinin chlorophyll protein (PerCP)
and Amcyan. After incubation with rATG or rIgG, PBMC were harvested and FoxP3-intracellular
staining was performed in round-bottom 96-wells plates (Nunc, Roskilde, Denmark, 200 μL/
well) according to the manufacturer’s instructions (FoxP3-APC, clone PCH101, e-Bioscience,
San Diego, CA). Extracellular staining was conducted before intracellular staining with FITC-
conjugated CD127 (eBioscience), IgG1, PERCP-conjugated CD4, PE-conjugated CD25 epitope
B (clone M-A251, BD Biosciences, San Jose, CA), PE-conjugated CD25 and Amcyan-conjugated
CD3 at 4°C for 30 min (BD Biosciences).
In vitro Induction of Regulatory T Cells by rATG 85
For in vitro detection of rATG antibodies PE-conjugated sheep-anti-rabbit (Serotec, Oxford,
UK) was used. Isotype controls IgG1-FITC and IgG1-PE for CD25 and CD127 and IgG2a-APC were
included at each staining as controls and the Fluorescence Minus One controls24.
Intracellular staining for PE conjugated granzyme B (Sanquin, CLB) and APC-conjugated
FoxP3 was performed after extracellular staining with CD3-Amcyan, CD4-PERCP, CD25 epitope
B PE-Cy7 (clone M-A251) and CD127-FITC.
Intracellular cytokine staining was performed as described previously25, 26. In brief, during
the last 5 hr of incubation with rATG, the Protein Transport Inhibitor Monensin (BD Biosciences)
was added to the cell cultures. After extracellular staining, cells were permeabilized and then
stained with either PE-labeled IL-10 (BD Biosciences). Flow cytometry was performed on an
eight-color FACS Canto II supplemented with DIVA software (BD Biosciences).
To determine the eff ect of the depletive mechanism of rATG in vitro, an apoptosis assay
was performed on PBMC from ESRD patients. PBMC were stained for the apoptotic cell marker
Annexin V-PE according to the protocol of the manufacturer (BD Biosciences) and measured on
the FACS Canto II (BD Biosciences). The late apoptosis and necrosis marker 7-aminoactinomycin
D (7-AAD) was added to each sample 15 min before measurement. PBMC before and after
rATG treatment were also microscopically analyzed to determine the cell counts on day 0 and
after 24 hr to calculate the percentage of cells in culture after 24 hr. Trypan blue staining was
performed to determine the percentage of dead cells.
For the sorting experiments, PBMC were labeled with CD3-Amcyan, CD8-FITC and CD4-APC
(BD Biosciences). The purity of CD3+CD4+ and CD3+CD8+ T cells on day 0 after sorting on the
FACS Aria II was more than or equal to 98%.
Isolation of human natural and induced regulatory T cells and suppression assays
To test their function, CD25+ T cells were isolated from the PBMC after incubation with anti-
CD25 microbeads, (Miltenyi Biotech) followed by a positive selection (POSSELD-program) on
the autoMACS (Miltenyi Biotech). The isolated and the residual fractions were washed and
resuspended in HCM for functional analysis. The untouched residual fraction consisted for more
than or equal to 98% of CD25-/dim cells and 2% CD25bright T cells. The purity of CD25 in the CD25+
isolated fraction was more than or equal to 90%.
The function of regulatory T cells was determined by mixed lymphocyte reactions (MLR)
in which the suppressive capacity of CD25+ T cells was measured by their ability to inhibit
the proliferative response of the CD25-/dim eff ector T cells (CD25-/dim Teff ). CD25-/dim Teff were
co-cultured in triplicate with natural CD25+ T cells or with induced CD25+ T cells. Control experi-
ments were performed in which CD25-/dim Teff were co-cultured with and without the residual
fraction after isolation of the induced CD25+ T cells.
To determine the potency of the induced Treg, CD25-/dim cells of a allogeneic HLA-mis-
matched individual or of the patient were co-cultured with induced CD25+ T cells. Irradiated
(40 Gy) 2-2-2 HLA mismatched allogeneic PBMC or spleen cells were used as stimulator cells

Chap
ter 5
86
(1x10⁵ cells/100 μL) and co-cultured with 5x10⁴ cells/100 μL of a CD25+ : CD25-/dim mixture at
1:10, 1:20 and 1:40 in triplicate wells in round-bottom 96-well plates (Nunc, Roskilde, Denmark).
Moreover, the natural and rATG-induced CD25+ T cells were co-cultured with irradiated CD25−/
dim Teff in the presence of alloantigens to confi rm their anergic state.
After 7 days of incubation at 37°C in a humidifi ed atmosphere of 5% CO2, proliferation was
measured after 3H-thymidine (0.5 μCi/well: Amersham Pharmacia Biotech, Buckinghamshire,
UK) incubation for the last 16 hr before harvesting. 3H-thymidine incorporation into DNA was
assessed using a Betaplate counter (LKB-Wallac, Turku, Finland).
Before adding 3H-thymidine to the 96-wells plate in the MLR, supernatant was collected to
determine the IL-2 and IFN-γ levels. Cytokine levels (picograms per millilitre) were assessed in
duplicate by ELISA (IL-2; e-Bioscience and IFN-γ; U-CyTech Bioscience Utrecht, the Netherlands).
To investigate the role of IL-10 in the mechanism of suppression of rATG-induced CD25+ T cells,
suppression assays were performed in the absence and presence of 5 μg/mL anti-IL10 receptor
antibody (purifi ed anti-human CD210 [IL-10R] BioLegend, San Diego, CA).
Quantitative (Q) PCR
To analyze gene expression patterns, total RNA was isolated from the various cell population
using the High Pure RNA Isolation kit (Roche Applied Science, Penzberg, Germany) as described
previously27. In brief, RNA concentrations were measured with the NanoDrop (ThermoScientifi c,
Wilmington, Delaware) and cDNA was synthesized from mRNA. The mRNA expression levels of
IL-2, IFN-γ, TGF-β, IL-4, IL-10 and IL-35 [EBI3 and IL-12A], IL-27 [EBI3 and IL-27p28], GATA3, FOXP3,
RORγt, CTLA-4, GITR and the cytotoxic molecules granzyme B and perforin were analyzed. The
choice of primers and probes for GATA3, IL-4, perforin and granzyme B was defi ned using the
primer express software (Applied Biosystems, Forster City, CA). Assay-on-demand products for
the measurement of 18S (Hs99999901_s1), FOXP3 (Hs00203958_m1), RORγt (Hs00172858_m1),
CTLA-4 (Hs00175480), CD25 (Hs00166229_m1), IL-2 (Hs00174114_m1), IL-10 (Hs00174086),
EBI-3 (Hs01057148.m1), IL-27p28 (Hs00377366.m1) and IL-12A (Hs00168405.m1), IFN-γ
(Hs00174143.m1) and TGF-β (Hs00171257_m1) mRNA were designed by Applied Biosystems
(Forster City, CA). After 2 min at 50°C and 10 min 95°C, the polymerase chaine reaction was
performed by 40 cycles of 15 sec at 95°C and 1 min at 58°C (GATA-3, IL-4, Granzyme B), 59°C
(perforin 1) or 60°C (18S, FoxP3, RORγt, CTLA-4, CD25, IL-2, IL-10, EBI-3, IL-27p28, IL-12A, IFN-γ
and TGF-β) using a StepOnePlus Real-Time PCR System (Applied Biosystems). The amount of
each target molecule was quantifi ed by measuring the cycle threshold (Ct) values, which were
transformed to the number of cDNA copies (2[40-Ct]). Each run contained several negative con-
trols (no template) and the same two positive reference samples to check intra- and inter-assay
variations. The Ct values within and between experiments were all less than 0.25. The relative
concentrations of the analyzed markers were normalized to the relative concentration of the
housekeeping gene 18S that was present in each sample and multiplied by 106 because of the
lower concentration of the target gene compared with the concentration of 18S28.

In vitro Induction of Regulatory T Cells by rATG 87
Cytotoxic T lymphocyte Mediated Lysis assay
Activated CD25-/dim T cells (n=6 blood bank donors) that served as target cells were isolated
by autoMACS as described above and were stimulated with 200 IU/mL recombinant IL-2 (pro-
leukin; Chiron BV, Amsterdam, the Netherlands), 2 μg/mL of the mitogen phytohemagglutinin
(PHA) and 100 ng/mL IFN-γ (to upregulate HLA-class II, U-Cytech, the Netherlands) in 24-wells
plates (Greiner) for 7 days at 37°C. On day 7, these autologous or allogeneic target blasts (Target
[T]) were labeled with europium-diethylenetriamene pentaacetate (DTPA). HLA-class II expres-
sion by the target cells was analyzed after staining with HLA-DR FITC and CD4-PERCP by fl ow
cytometry (BD Biosciences).
For eff ector cells we used PBMC that were stimulated with allogeneic irradiated PBMC and
200 IU/mL IL-2 for 7 days at 37°C. At day 7, these activated cells (Eff ector [E]) were cocultured
in 96-wells plates for 4 hr with autologous or allogeneic target blasts and served as the nega-
tive and positive control for cytotoxicity, respectively. Natural CD25+ T cells and rATG-induced
CD25+ T cells were also used as eff ector cells and cocultured with autologous and allogeneic
target blasts at diff erent E:T ratios (40:1, 20:1, 10:1 and 5:1). After 4 hr of incubation, the plates
were centrifuged, and 20 μL of the supernatant was harvested. Enhancement solution (100 μL,
PerkinElmer, Groningen, the Netherlands) was added the wells. Fluorescence of the released
Europium was measured and expressed in counts per second. The percentage lysis was
calculated as follows: (measured E:T europium release – background europium release (0:1) /
(max. Europium release – background europium release) x100%). Maximum europium release
was measured by incubation of target cells with 1% Triton (Sigma-Aldrich, Zwijndrecht, the
Netherlands).
Statistical analyses
Statistical analysis of the fl ow cytometric and MLR data was performed using Graphpad Prism
(version 4.03). To test whether the values have normal distribution, the Kolmogorov-Smirnov
test was used. For the determination of levels of statistical signifi cance, the two-sided prob-
ability values according to the Wilcoxon matched pairs test, Mann Whitney U test or Student’s
t test were used. P values less than or equal to 0.05 were considered statistically signifi cant.
RESULTS
Binding assay of rATG on PBMC
To evaluate whether rATG changes the phenotype and function of CD25neg T cells, we fi rst
detected the binding of rATG to these T cells. To elucidate this, CD25neg T cells were incubated
for 0.5 hr and 24 hr with 1, 10 and 100 μg/mL rATG or with a rabbit IgG control antibody. In
the presence of 1 μg/mL rATG, 50% of the cells were bound to rATG already after 0.5 hr. In the
presence of 10 μg/mL, rATG was attached to all CD25neg T cells and saturation was maximal and
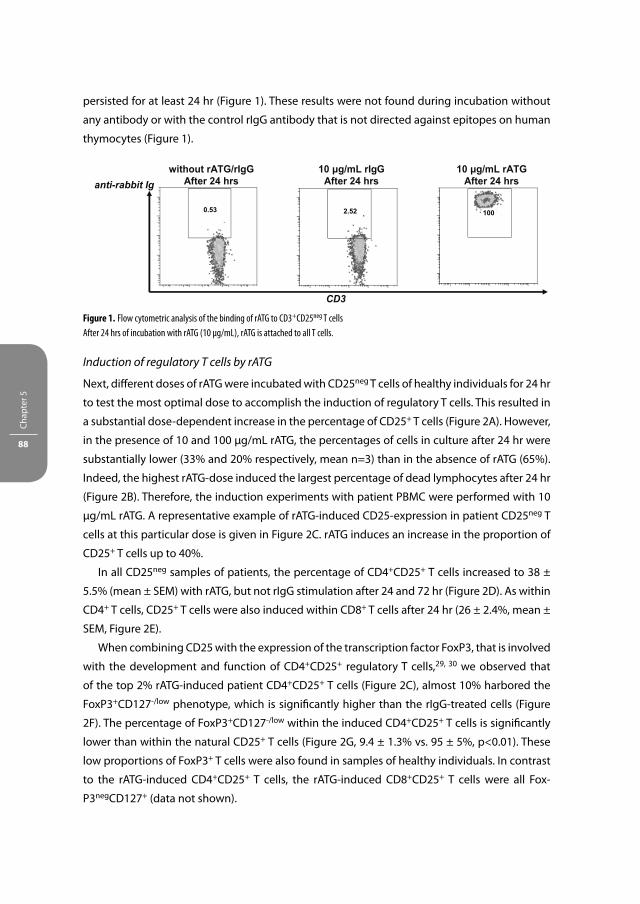
Chap
ter 5
88
persisted for at least 24 hr (Figure 1). These results were not found during incubation without
any antibody or with the control rIgG antibody that is not directed against epitopes on human
thymocytes (Figure 1).
Induction of regulatory T cells by rATG
Next, diff erent doses of rATG were incubated with CD25neg T cells of healthy individuals for 24 hr
to test the most optimal dose to accomplish the induction of regulatory T cells. This resulted in
a substantial dose-dependent increase in the percentage of CD25+ T cells (Figure 2A). However,
in the presence of 10 and 100 μg/mL rATG, the percentages of cells in culture after 24 hr were
substantially lower (33% and 20% respectively, mean n=3) than in the absence of rATG (65%).
Indeed, the highest rATG-dose induced the largest percentage of dead lymphocytes after 24 hr
(Figure 2B). Therefore, the induction experiments with patient PBMC were performed with 10
μg/mL rATG. A representative example of rATG-induced CD25-expression in patient CD25neg T
cells at this particular dose is given in Figure 2C. rATG induces an increase in the proportion of
CD25+ T cells up to 40%.
In all CD25neg samples of patients, the percentage of CD4+CD25+ T cells increased to 38 ±
5.5% (mean ± SEM) with rATG, but not rIgG stimulation after 24 and 72 hr (Figure 2D). As within
CD4+ T cells, CD25+ T cells were also induced within CD8+ T cells after 24 hr (26 ± 2.4%, mean ±
SEM, Figure 2E).
When combining CD25 with the expression of the transcription factor FoxP3, that is involved
with the development and function of CD4+CD25+ regulatory T cells,29, 30 we observed that
of the top 2% rATG-induced patient CD4+CD25+ T cells (Figure 2C), almost 10% harbored the
FoxP3+CD127-/low phenotype, which is signifi cantly higher than the rIgG-treated cells (Figure
2F). The percentage of FoxP3+CD127-/low within the induced CD4+CD25+ T cells is signifi cantly
lower than within the natural CD25+ T cells (Figure 2G, 9.4 ± 1.3% vs. 95 ± 5%, p<0.01). These
low proportions of FoxP3+ T cells were also found in samples of healthy individuals. In contrast
to the rATG-induced CD4+CD25+ T cells, the rATG-induced CD8+CD25+ T cells were all Fox-
P3negCD127+ (data not shown).
CD3
anti-rabbit Ig without rATG/rIgG
After 24 hrs 10 μg/mL rIgG
After 24 hrs 10 μg/mL rATG
After 24 hrs
1002.520.53
Figure 1. Flow cytometric analysis of the binding of rATG to CD3+CD25neg T cells
After 24 hrs of incubation with rATG (10 μg/mL), rATG is attached to all T cells.

In vitro Induction of Regulatory T Cells by rATG 89
CD4+CD25+
(healthy controls)
0 1 10 1000
15
30
45
60
75
90
T=24 hrsT=0.5 hr
rATG-dose (μg/mL)
% C
D25
+of
CD
4+
(mea
n±
SEM
)
0 μg/mL rATG After 24 hrs
100 μg/mL rATG After 24 hrs
10 μg/mL rATG After 24 hrs
7-AAD
Annexin-V
PBMC At 0 hrs
CD4+CD25neg At 0 hrs
CD4+ T cells
after 24 hrs rATG
CD4+ T cells
after 24 hrs rIgG CD25
CD4
7.43
2.11
47.73
0.24
0.47
A
B
C
Figure 2. Induction of regulatory T cells
(A) rATG dose-response curve for the induction of CD25+ T cells in healthy controls, n=3. (B) Representative example of rATG-induced cell-death.
CD25neg T cells were stimulated with 10 and 100 μg/mL rATG for 24 hrs. After 24 hrs, the percentage of 7-AAD/Annexin-V double-positive cells
was largest in the presence of 100 μg/mL. (C) One representative example of rATG-driven induction of CD25+ T cells from CD25neg T cells that were
isolated from PBMC of an ESRD-patient.
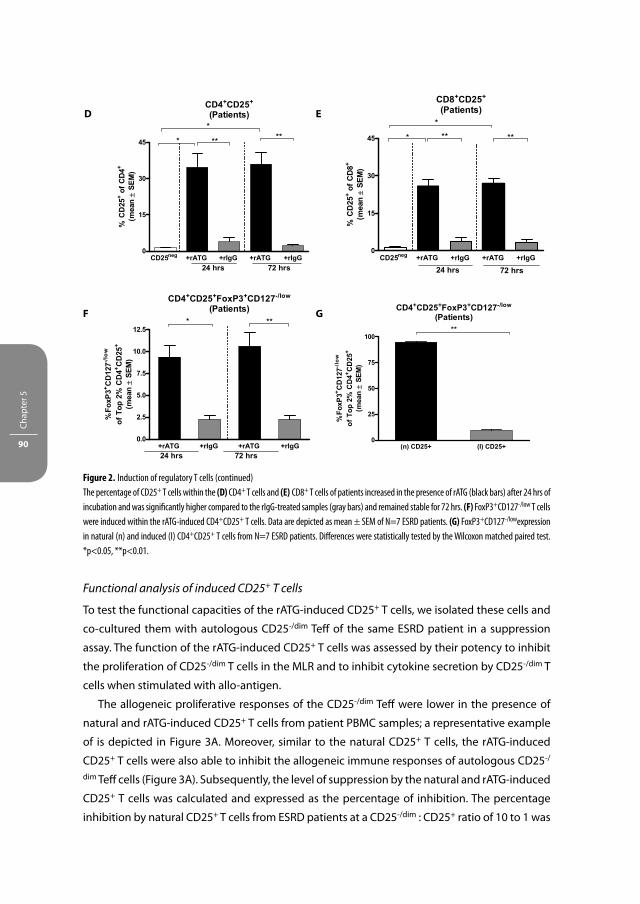
Chap
ter 5
90
Functional analysis of induced CD25+ T cells
To test the functional capacities of the rATG-induced CD25+ T cells, we isolated these cells and
co-cultured them with autologous CD25-/dim Teff of the same ESRD patient in a suppression
assay. The function of the rATG-induced CD25+ T cells was assessed by their potency to inhibit
the proliferation of CD25-/dim T cells in the MLR and to inhibit cytokine secretion by CD25-/dim T
cells when stimulated with allo-antigen.
The allogeneic proliferative responses of the CD25-/dim Teff were lower in the presence of
natural and rATG-induced CD25+ T cells from patient PBMC samples; a representative example
of is depicted in Figure 3A. Moreover, similar to the natural CD25+ T cells, the rATG-induced
CD25+ T cells were also able to inhibit the allogeneic immune responses of autologous CD25-/
dim Teff cells (Figure 3A). Subsequently, the level of suppression by the natural and rATG-induced
CD25+ T cells was calculated and expressed as the percentage of inhibition. The percentage
inhibition by natural CD25+ T cells from ESRD patients at a CD25-/dim : CD25+ ratio of 10 to 1 was
D E
GF
Figure 2. Induction of regulatory T cells (continued)
The percentage of CD25+ T cells within the (D) CD4+ T cells and (E) CD8+ T cells of patients increased in the presence of rATG (black bars) after 24 hrs of
incubation and was signifi cantly higher compared to the rIgG-treated samples (gray bars) and remained stable for 72 hrs. (F) FoxP3+CD127-/low T cells
were induced within the rATG-induced CD4+CD25+ T cells. Data are depicted as mean ± SEM of N=7 ESRD patients. (G) FoxP3+CD127-/lowexpression
in natural (n) and induced (I) CD4+CD25+ T cells from N=7 ESRD patients. Diff erences were statistically tested by the Wilcoxon matched paired test.
*p<0.05, **p<0.01.

In vitro Induction of Regulatory T Cells by rATG 91
90% (mean) and at a 20 to 1 ratio 70% (mean). These percentages did not signifi cantly diff er
from the suppression by their corresponding rATG-induced CD25+ T cells (Figure 3B). The data
obtained from PBMC of healthy controls are in line with that of ESRD patients (Figure 3C). As
an important function of natural CD25+ T cells is to inhibit the cytokine production of activated
CD25-/dim T cells in the MLR, we also examined whether the rATG-induced CD25+ T cells have
this capability. After co-culture of CD25-/dim T cells and rATG-induced CD25+ T cells, both the
IL-2 and IFN-γ production by CD25-/dim T cells in response to stimulation with allo-antigen were
indeed lower, (Figures 3D and E, respectively). Another key characteristic of natural CD25+ sup-
pressor T cells is that they do not proliferate upon stimulation with alloantigen. We found that
the rATG-induced CD25+ T cells also did not show a proliferative response upon stimulation
with alloantigen for 7 days, suggesting that the cells are anergic (487 ± 153, mean ± SEM).
Next, we questioned whether the CD4+CD25+ or CD8+CD25+ T cells account for the inhibition
that was observed by all rATG-induced CD25+ T cells. Therefore, we fi rst isolated CD4+CD25neg
and CD8+CD25neg T cells from PBMC of healthy individuals on day 0 and incubated both
populations for 24 hr with rATG or rIgG. The rATG-induced CD4+CD25+ and CD8+CD25+ T cells
inhibited the proliferative responses of autologous CD25-/dim T cells at the same magnitude
compared with the total CD25+ T cells (Figure 3F).
We further examined whether the suppressive properties of the rATG-induced CD25+ T cells
were HLA-restricted. Therefore, the inhibition of the proliferative responses on a HLA-A, -B, and
-DR 2-2-2 mismatched CD25-/dim cell population was analyzed. Interestingly, the rATG-induced
CD25+ T cells showed equal suppressive properties in the inhibition of allogeneic CD25-/dim cells
of a 2-2-2 HLA mismatched individual compared with autologous CD25-/dim cells (Figure 3G).
To address whether the induction of suppressive CD25+ T cells is rATG-specifi c, we also
stimulated CD25neg T cells with anti-CD3/CD28 for 24 hr. The anti-CD3/CD28-induced CD25+
T cells were not able to suppress allogeneic immune responses by autologous CD25-/dim cells,
showing that the induction of regulatory function is a rATG-specifi c property (Figure 3H).
The eff ect of rATG on the function of natural CD25+ T cells in mixed lymphocyte reactions
To determine the direct eff ect of rATG on the function of natural rATG-treated CD25+ T cells,
CD25-/dim cells were co-cultured with natural CD25+ T cells in a suppression assay in the absence
and presence of 10 μg/mL rATG at a CD25+ : CD25-/dim ratio of 0:1, 1:10, and 1:20. When the
CD25-/dim cells were co-cultured with the CD25+ T cells in the presence of rATG, the allogeneic
response (counts per minute: 4924 ± 1128, mean ± SEM) was proportionally inhibited in a
similar manner as in the absence of rATG (percentage of inhibition: +rATG: 58 ± 18; -rATG: 43 ±
9%). This suggests that in the presence of rATG, immunoregulatory function of the CD25+ T cells
remains proportionally intact.

Chap
ter 5
92
-/dim
CD25+
+ (n) C
D25+
+ (I) CD25
+
+ (n) C
D25+
+ (I) CD25
0
5000
10000
15000
20000
10:1 20:1
patientpr
olife
ratio
n3H
-Thy
mid
ine
(cpm
)(m
ean±
SEM
) Patients
-/dim
CD25+
+ (n) C
D25+
+ (I) C
D25 -/dim
CD25+
+ (n) C
D25+
+ (I) C
D250
25
50
75
100
10:1 20:1
Inhi
bitio
n (%
)(m
ean
± SE
M)
Healthy controls
-/dim
CD25+
+ (n) C
D25+
+ (I) CD25 -/d
im
CD25+
+ (n) C
D25+
+ (I) CD25
0
25
50
75
100
10:1 20:1
Inhi
bitio
n (%
)(m
ean
± SE
M)
IL-2 secretion
-/dim
CD25+
+ (n) C
D25+
+ (I) C
D250
5
10
15
20
25
30
35
IL-2
(pg/
mL)
IFN-γ-secretion
-/dim
CD25+
+ (n) C
D25+
+ (I) C
D250
100
200
300
400
IFN
-γ (p
g/m
L)
Healthy controls
+
(I) CD25
+
CD25+
(I) CD4
+
CD25+
(I) CD8
+
(I) CD25
+
CD25+
(I) CD4
+
CD25+
(I) CD8
0
25
50
75
100
10:1 20:1
Inhi
bitio
n (%
)(m
ean
± SE
M)
A B
C D
E F
Figure 3. Suppression assays with natural (n) and rATG-induced (I) CD25+ T cells
CD25+ T cells were isolated and co-cultured with autologous CD25-/dim cells. (A) One representative example of proliferative responses after 3H-Thymidine incorporation in counts per minute (cpm) of one ESRD patient. Proliferative responses by CD25-/dim cells after stimulation with
alloantigen (horizontally striped bars) are lower in the presence of natural (white bars) and rATG-induced (black bars) CD25+ T cells. Error bars are
mean ± SEM of each triplicate. (B) Suppressive capacities of (n) and (I) CD25+ T cells from N=5 patients, expressed as percentage of inhibition at
a 10:1 and 20:1 CD25-/dim :CD25+ ratio. (C) Percentage inhibition of (n) and (I) CD25+ T cells of N=3 healthy controls, N=3. (D) IL-2 and (E) IFN-γ
production in the MLR at a [CD25+ : CD25-/dim] ratio of 0:1 and 1:10, N=3 healthy controls. In the presence of (I) CD25+ T cells, the secretion of
these cytokines is partially inhibited. (F) rATG-induced CD4+CD25+ and CD8+CD25+ T cells from healthy controls, N=3 were isolated and tested
for their regulatory activities. Percentage of inhibition is shown.

In vitro Induction of Regulatory T Cells by rATG 93
Gene expression analysis of induced CD25+ T cells
First, we analyzed the gene-expression patterns of the rATG-induced CD25+ T cells in healthy
individuals and compared these with the natural CD25+ T cells. The rATG-induced CD25+ T cells
are characterized by low levels of FOXP3, GATA3, CTLA-4, TGF-β and IL-12A (Figure 4). High
mRNA expression levels were found for GITR, IL-10, EBI3, the heterodimeric cytokine IL-27 that
is comprised of EBI3 and a unique IL-12p35-like protein IL-27p28, IFN-γ, perforin, and granzyme
B. The latter cytotoxic molecule was abundantly expressed in the rATG-induced CD25+ T cells
compared with the natural CD25+ T cells (Figure 4A). IL-2, IL-4 and the transcription factor for
Th17-cells RORγt were undetectable. To assess whether the FAS/FAS ligand (FASL) apoptotic
pathway might be involved in the function of rATG-induced regulatory T cells, we also assessed
the mRNA expression levels of FAS and FASL in the rATG-induced CD25+ T cells; however the
mRNA-levels of both genes were not signifi cantly higher compared with the natural CD25+ T
cells and unstimulated CD25neg T cells of day 0, thereby not attributing an important role to cell
death, mediated by this pathway (Figure 4A).
Second, we assessed the mRNA expression patterns of natural CD25+ T cells in the absence
and presence of rATG. Even in the rATG-treated natural CD25+ T cells, FOXP3 and GITR were
upregulated 2-fold and IL-10, EBI3, IL-27p28, perforin and granzyme B were upregulated 10-fold
compared with the untreated natural CD25+ T cells (Figure 4B).
10:1
20:1
0
25
50
75
100Healthy controls
[allogeneic CD25-/dim T cells : rATG (I) CD25+]
Inhi
biti
on (
%)
(mea
n±
SE
M)
Suppression assay
0
5000
10000
15000
20000
[CD25+ : CD25-/dim]
(n) CD25+ T cells
CD3/CD28 activated CD25+ T cellsrATG (I) CD25+ T cells
1:10 1:20
prol
ifera
tion
3H-T
hym
idin
e (c
pm)
(Μea
n±SE
M)
G
H
Figure 3. Suppression assays with natural (n) and rATG-induced (I) CD25+ T cells (continued)
(G) Suppression assay in which rATG-induced CD25+ T cells were co-cultured with allogeneic CD25-/dim cells. (H) Representative example of
suppression assay with CD3/CD28 induced CD25+ T cells. The proliferation in the absence [CD25+ : CD25-/dim] of 0:1 and in the presence of CD25+
T cells is shown. Data are shown as mean ± SEM of each triplicate

Chap
ter 5
94
FOXP3
CD25neg (n) CD25+ (I) CD25+0
4
8
12
* **
[Fox
P3/1
8S] r
atio
*10e
6
GATA3
CD25neg (n) CD25+ (I) CD25+0.0
0.5
1.0
1.5
2.0 * **
[GA
TA3/
18S
] ra
tio*1
0e6
CTLA4
CD25neg (n) CD25+ (I) CD25+0
5
10
15 * *
[CTL
A4/1
8S]r
atio
*10e
6
GITR
CD25neg (n) CD25+ (I) CD25+0.0
0.5
1.0
1.5
2.0*
***
[GIT
R/1
8S] r
atio
*10e
6
IL-10
CD25neg (n) CD25+ (I) CD25+0
1
2
3
4
***
[IL-1
0/18
Srat
io]*
10e6
TGF-β
CD25neg (n) CD25+ (I) CD25+0
15
30
45
60
75
90 ***
[TG
F-β
/18S
] rat
io*1
0e6
EBI3
CD25neg (n) CD25+ (I) CD25+0.0
0.5
1.0
***
[EBI
3/18
S]ra
tio*1
0e6
IL-27p28
CD25neg (n) CD25+ (I) CD25+0.00
0.05
0.10
0.15
0.20
0.25 **
[IL27
p28/
18S]
rat
io*1
0e6
IL-12A
CD25neg (n) CD25+ (I) CD25+0.00
0.05
0.10
0.15
0.20
0.25 * ***
[IL12
A/18
S]ra
tio*1
0e6
IFN-γ
CD25neg (n) CD25+ (I) CD25+0.0
0.1
0.2
0.3
0.4 *
[IFN-γ /
18S]
ratio
*10e
6
Perforin
CD25neg (n) CD25+ (I) CD25+0.0
0.5
1.0
1.5
2.0
2.5 * *
[per
fori
n/18
S]r
atio
*10e
6
Granzyme B
CD25neg (n) CD25+ (I) CD25+0
1
2
3
4****
[gra
nzym
e B
/18S
] rat
io*1
0e6
FAS
CD25neg (n) CD25+ (I) CD25+0.0
0.2
0.4
0.6
0.8
1.0
1.2
1.4
[FA
S/1
8S]
ratio
*10e
6
FASL
CD25neg (n) CD25+ (I) CD25+0.00
0.01
0.02
0.03
0.04
[FA
SL/
18S
] ra
tio*1
0e6
AA
Figure 4. mRNA-profi les of regulatory T cells
(A) mRNA expression patterns of CD25neg T cells, natural (n) CD25+ T cells and rATG-induced (I) CD25+ T cells that were isolated from PBMC of
N=4 healthy controls after 24 hrs of stimulation with rATG. Gray bars represent CD25neg cells; vertically striped bars are (n) CD25+ T cells and
squared bars the (I) CD25+ T cells. Relative [target gene/18S] ratios are shown for FOXP3, GATA3, CTLA4, GITR, IL-10, TGF-β, EBI3, IL-27p28, IL-12A,
IFN-γ, perforin, granzyme B, FAS and FASL.

In vitro Induction of Regulatory T Cells by rATG 95
Flow cytometric analyses of Granzyme B and IL-10 expression and their functional signifi cance
To confi rm that granzyme B is one of the potential eff ector molecules by which the rATG-
induced CD25+ T cells regulate immune responses, we determined granzyme B expression at
the protein level on CD25+ T cells by fl ow cytometry. Again, we compared the rATG-induced
CD25+ T cells with the natural CD25+ T cells. Furthermore, the rATG-induced CD4+CD25+ T cells
were double stained for FoxP3 to examine whether rATG-induced CD4+CD25+FoxP3+CD127-/
low T cells coexpressed granzyme B. As shown in Figure 5, the proportion of rATG-induced
CD4+CD25+ (Figures 5A and B) and rATG-induced CD4+CD25+FoxP3+CD127-/low T cells (Figures
5C and D) that expressed granzyme B was signifi cantly higher compared with the natural
CD25+ T cells. Within the rATG-induced CD8+CD25+ T cells, the majority (59 ± 4.4%, mean ±
SEM) expressed granzyme B.
To check whether the rATG-induced CD25+ T cells have cytotoxic activities, we performed a
cytotoxic T lymphocyte mediated lysis assay. Natural and rATG-induced CD25+ T cells were used
FOXP3
0 24 24 +rATG0
20
40
60
80
100*
*
hrs
[Fox
P3/1
8S] r
atio
*10e
6
GITR
0 24 24 +rATG0
2
4
6
8
10
12
14*
*
hrs
[GIT
R/1
8S] r
atio
*10e
6
IL-10
0 24 24 +rATG0.0
2.5
5.0
7.5
10.0
12.5
**
hrs
[IL-1
0/18
Srat
io]*
10e6
EBI3
0 24 24 +rATG0
2
4
6 **
hrs
[EB
I3/1
8S]r
atio
*10e
6
IL-27p28
0 24 24 +rATG0.0
0.2
0.4
0.6 **
hrs
[IL27
p28/
18S
] ra
tio*1
0e6
Perforin
0 24 24 +rATG0
1
2
3
4*
*
hrs
[per
forin
/18S
]rat
io*1
0e6
Granzyme B
0 24 24 +rATG0
1
2
3
4
5
6*
*
hrs
[gra
nzym
e B
/18S
] rat
io*1
0e6
BB
Figure 4. mRNA-profi les of regulatory T cells (continued)
(B) mRNA expression patterns of (n) CD25+ T cells isolated from PBMC on day 0 and (n) CD25+ in the absence and presence of rATG-incubation.
Relative [target gene/18S] ratios are shown for FOXP3, GITR, IL-10, EBI3, IL-27p28, perforin and granzyme B. Error bars represent mean ± SEM.
Signifi cance was tested by the Mann-Whitney U Test, *p<0.05.

Chap
ter 5
96
as eff ector cells (E). Target (T) blasts were generated from autologous and allogeneic PBMC. Acti-
vated target blasts were incubated in the presence of IFN-γ to upregulate HLA-class II expression.
As shown in Figure 5E, T-cell blasts abundantly expressed HLA-class II in the presence of IFN-γ.
Alloantigen-stimulated PBMC lysed allogeneic and not the negative control; the autologous target
blasts. The natural and induced CD25+ cells showed no cytotoxicity on allogeneic blasts (Figure 5F).
Furthermore, IL-10-expression was also induced by rATG not only within the induced CD25+
T cells but also within the (n) CD25+ T cells that were stimulated with rATG and therefore, we
also verifi ed in the rATG-induced CD25+ T cells whether the IL-10 mRNA is translated into the
protein. In contrast to the mRNA, the IL-10 protein was found at low levels (<5%) in the induced
Treg compared with the natural Treg. To confi rm whether these low IL-10 protein levels have
rATG (I)CD4+CD25+
NaturalCD4+CD25+
% Granzyme B of CD4+CD25+
rIgG +
CD25+
(n) CD4
+
CD25+
rATG-(I)
CD4
0.0
2.5
5.0
7.5
10.0
12.5**
% G
ranz
yme
B
rATG (I)CD4+CD25+FoxP3+CD127-/low
NaturalCD4+CD25+FoxP3+CD127-/low
% Granzyme B ofCD4+CD25+FoxP3+CD127-/low
rIgG +
CD25+
(n) CD4
+
CD25+
rATG-(I)
CD4
0
5
10
15
20 **
% G
ranz
yme
B
A
C
B
D
Figure 5. Validation of mRNA-expression levels by fl ow cytometry
Flow cytometric analyses of granzyme B expression within natural (n) and rATG-induced (I) CD4+CD25+ and CD4+CD25+FoxP3+CD127-/low T cells.
(A) Representative example of relative granzyme B expression within (n) and (I) CD4+CD25+ T cells. Percentage of positive cells is shown by the
marker. (B) Within the rATG-induced CD4+CD25+ T cells of healthy controls, the proportion of granzyme B was signifi cantly higher compared to the
natural (n) CD25+ T cells. Mean ± SEM are shown of N= 3 healthy controls. (C) Representative example of relative granzyme B expression within
natural and rATG-induced CD4+CD25+FoxP3+CD127-/low T cells. (D) The frequency of granzyme B expression is signifi cantly higher within the
CD4+CD25+FoxP3+CD127-/low T cells compared to the natural CD4+CD25+FoxP3+CD127-/low T cells. Mean ± SEM are shown of N=3 healthy controls.

In vitro Induction of Regulatory T Cells by rATG 97
biological activity, the role of IL-10 in the mechanism of suppression by rATG-induced CD25+
T cells was studied in suppression assays that were performed in the absence and presence of
anti-IL-10 receptor antibody. In the presence of the anti-IL-10 receptor antibody, the suppres-
sive capacity by rATG-induced CD25+ T cells was not abolished, data not shown.
+IFN- γ
- IFN-γ# ce
lls 94%
37%
HLA-class II
Isotype control
CD4+ T-cell blastsE
cytotoxicity
0:1 5:1 10:1
20:1
40:1
0
10
20
30
40
Natural Treg : allogeneic targetblasts
Induced Treg : allogeneic targetblasts
allo-antigen activated PBMC : allogeneic targetblasts (positive control)allo-antigen activated PBMC : autologous targetblasts (negative control)
E: EffectorT: Target
E:T ratio
Lys
is (%
)
F
Figure 5. Validation of mRNA-expression levels by fl ow cytometry (continued)
(E) One representative example of upregulation of HLA-class II on CD4+ T cell blasts (gated on CD3+CD4+ T cells) in the presence of IFN-γ.
(F) Cytotoxicity assay with natural and induced Treg as eff ector cells (E) and europium labeled target blasts (T). Natural and induced Treg are
cocultured with allogeneic target blasts. Mean ± SEM are shown for N=6 healthy controls. Diff erences were statistically tested by the Students
t Test. **p<0.01.

Chap
ter 5
98
DISCUSSION
In this study, we examined whether rATG is able to induce functional Treg in PBMC of patients
with ESRD, who are candidates for rATG-induction therapy. The characteristics of these rATG-
induced CD25+ T cells were compared with natural CD25+ T cells.
We show that at a rATG dose of 10 μg/mL converts T cells from patients into suppressive
CD4+CD25+FoxP3+CD127-/low T cells at the same magnitude as T cells from healthy controls
(Figures 2 and 3). This indicates that the induction of CD25+ T cells is able to occur in kidney
transplant patients during and after rATG-induction therapy. Although immune cells from ESRD
patients cells are extensively exposed to the toxic eff ects of uremia and stressed by dialysis
and, therefore, do not function properly, as shown in several publications20, 21, 31, our fi ndings
demonstrate that the T cells of these patients are apparently not defective in their ability to
induce regulatory T cells after rATG-stimulation in vitro.
The top 2% rATG-induced CD4+CD25+ T cells only consisted of 10% FoxP3+CD127-/low T cells
(Figure 2), whereas others and we have reported that the top 2% of natural CD4+CD25+ T cells
consisted for more than or equal to 90% FoxP3+CD127-/low T cells32, 33. The induced CD4+CD25+
T-cell population is thus heterogeneous and comprises both FoxP3+CD127-/low T cells with
the regulatory phenotype and other T cells with the FoxP3negCD127+ phenotype. In contrast,
the rATG-induced CD8+CD25+ T cells did not express FoxP3 and were CD127+. However, the
total induced CD25+ T-cell population had profound regulatory properties that were compa-
rable with natural CD25+ T cells and were not markedly diff erent in their suppressive activities
between patients and healthy individuals (Figure 3). Moreover, the rATG-induced CD4+CD25+
and CD8+CD25+ T cells were able to eff ectively suppress the allogeneic immune responses
(Figure 3). The function of natural CD25+ T cells treated with rATG remained proportionally
unaltered.
Gene expression analyses revealed that the rATG-induced CD25+ T cells and natural CD25+ T
cells both highly express GITR. However, there were also marked diff erences. The rATG-induced
CD25+ T cells expressed EBI3, IL-10, IL-27, IFN-γ, perforin, and granzyme B compared with the
natural CD25+ T cells. The latter suggests that their mechanism of suppression may diff er from
that of natural CD25+ T cells (Figure 4). EBI3 was upregulated in the induced CD25+ T cells,
whereas the other transcript that forms the heterodimeric cytokine IL-3534, IL-12A, was not
upregulated. Natural CD25+ T cells highly expressed IL-12A but not EBI3 compared with the
CD25neg T cells; therefore IL-35 is not supposed to be a reliable marker for CD4+CD25+ Treg35.
IL-27 is encoded by IL-27p28 and EBI336. It promotes Th1-cell diff erentiation of naïve CD4+ T
cells and induces the expression of the IL-12Rβ2 gene by naïve CD4+ T cells to make these cells
responsive to IL-1234, 37. In contrast, as an attenuator of immune responses, it suppresses the
diff erentiation into Th17-cells. In its latter role, IL-27 also induces IL-10 expression38. Thus in
our study, the high IL-10 levels might be due to IL-27 production. In T cells, IL-27 induces IFN-γ,
perforin and granzyme B production and enhances CTL-activity37, 39, 40. The mRNA expression

In vitro Induction of Regulatory T Cells by rATG 99
levels of granzyme B and IL-10 were also upregulated when natural CD25+ T cells were treated
with rATG, showing that the expression of the mRNA and protein is driven by rATG. It has been
demonstrated that IL-10 was required for inducing perforin and granzyme B in human IFN-γ/
IL-10 producing CD4+ T cells that showed cytolytic activity41 and these cells could enhance
cytolytic function in activated CD8+ T cells42, 43. Cell death mediated by the FAS-FASL pathway
does not seem to play an important role according to their lower mRNA expression levels
compared with the (n) CD25+ T cells. Brown et al.44 who reported that the perforin pathway
and the granule exocytosis and not the FASL pathway are predominant in CD4+ T cells pathway
support these data. Our data show that the rATG-induced CD25+ T cells are anergic and inhibit
the proliferation and cytokine secretion of T cells and express IL-10 mRNA, but that the IL-10
pathway does not contribute to the suppressive mechanism of rATG-induced Treg. Further-
more, the rATG-induced Treg do not operate by cytotoxicity as shown in Figure 5F. There could
be two explanations for the absence of cytotoxic activity by the rATG-induced T cells. First, the
frequency of granzyme B expressing cells is lower in the rATG-induced CD4+CD25+ T cells (11%
mean, Figure 5B) than in cytotoxic CD8+ T cells or NK cells (40% of CD8+ T cells and 50% of NK
cells after stimulation)45. The frequency of granzyme B expressing cells is thus expected to be
higher to accomplish cytotoxic activity. Second, granzyme B expression in the induced regula-
tory T cells is merely a phenotypic marker of T-cell activation and is not linked to cytotoxic
activities (cell granule exocytosis). The lack of correlation between granzyme B expressing
PBMC in ELIspot and cytotoxic activities has also been found earlier by our group46 and has
been shown in other human non-cytotoxic granzyme B-expressing cells types47. In these cells
and the rATG-induced Treg, granzyme B may have other nonapoptotic functions47.
The question remains, what the driving force is behind the induction of functional suppres-
sor T cells that seems to be a unique characteristic for rATG. Nonspecifi c activation by CD3/
CD28 although perfectly able to induce FoxP3, does not lead to the generation of functional
regulatory T cells as shown by our fi ndings (Figure 3) and by others48, 49. In this study, we found
that rATG not only induces FoxP3 but also induces regulatory function independent of FoxP3 as
the rATG-induced CD8+CD25+FoxP3negCD127+ T cells. However, the rATG-induced CD8+CD25+
T cells might regulate through cytotoxic mechanisms in an irreversible manner, instead of
reversible suppression via cell-cell contact or cytokines.
It is well known that TGF-β promotes and maintains FoxP3-expression in expanded
CD4+CD25+ T cells and is required for their immunosuppressive capacity50. Addition of TGF-β
into CD4+CD25neg cells induced FoxP3+ T cells with regulatory capacities51. In our rATG-treated
cultures, activated non-Treg within the CD25neg cells on day 0 might operate as a source of
TGF-β. An additional explanation for the induction of regulatory function by rATG might be
the direct eff ect of an unspecifi ed rabbit protein present in the rATG-preparation that skews
CD25neg T cells into a regulatory phenotype52. Otherwise, a component within the rATG-mixture
could promote acetylation or inhibition of histone deacetylation through histone deacetylases
(HDACs), leading to FOXP3 transcription that may result in the generation of Treg53.

Chap
ter 5
100
Recently, we reported the phenotypical and functional analyses of CD4+CD25+FoxP3+ T cells
in the peripheral blood of rATG-treated patients32. The results obtained from the rATG-group
were compared with that of a non-rATG control group. The most important conclusions were
that the CD25+ T cells slowly recover after rATG-treatment until approximately 30% of baseline
at 6 months posttransplantation. After rATG-treatment, the function of the isolated CD25+ T
cells was proportionally comparable with before, showing that rATG treatment has an eff ect
on their numbers but does not aff ect their function. After transplantation patients receive
combination therapy consisting of rATG induction therapy, tacrolimus, MMF and steroids.
Tacrolimus, MMF or steroids may infl uence the induction of Treg by rATG. Therefore, in this
study, we determined to what extent rATG can convert T cells from ESRD patients into cells that
may control the allogeneic immune response in a clean study set up.
Taken together, we here demonstrate that cells of ESRD patients are not defective in their
ability to induce Treg after rATG-stimulation as rATG induces CD4+CD25+FoxP3+CD127-/low T
cells in PBMC of ESRD patients to the same extent as in healthy controls. This indicates that
CD25+ T cells can be induced in patients who are candidates for transplantation followed by
rATG-induction therapy. Furthermore, rATG also induces Treg within the CD8+ T-cell population
that are CD25+, but eff ectively suppress allogeneic immune responses, independently from
FoxP3. Although, diff erent in gene expression characteristics, the induced CD25+ T cells exhibit
equal suppressive potency compared with natural CD25+ T cells. Therefore, rATG may ben-
efi cially contribute to the mechanisms that control alloreactivity. These fi ndings may provide
more insight in the characterization of induced regulatory T cells after rATG induction therapy
in kidney transplant patients. More research has to be done to reveal the exact mechanism of
suppression by the rATG-induced Treg.
ACKNOWLEDGEMENTS
The authors thank Dr. Nicolle Litjens (Department of Internal Medicine, Division of Nephrol-
ogy) for her assistance with the intracellular (cytokine) staining experiments and Dr. Nicole van
Besouw for her expertise with the cytotoxicity assays.
In vitro Induction of Regulatory T Cells by rATG 101
REFERENCES
1. Sakaguchi, S., Sakaguchi, N., Asano, M., Itoh, M., Toda, M. Immunologic self-tolerance maintained by activated T cells expressing IL-2 receptor alpha-chains (CD25). Breakdown of a single mechanism of self-tolerance causes various autoimmune diseases. J Immunol 155, 1151-1164 (1995).
2. Sakaguchi, S. Naturally arising Foxp3-expressing CD25+CD4+ regulatory T cells in immunological tolerance to self and non-self. Nat Immunol 6, 345-352 (2005).
3. Sakaguchi, S., Sakaguchi, N., Shimizu, J., et al. Immunologic tolerance maintained by CD25+ CD4+ regulatory T cells: their common role in controlling autoimmunity, tumor immunity, and transplanta-tion tolerance. Immunol Rev 18, 182-132 (2001)
4. Weiner, H.L. Induction and mechanism of action of transforming growth factor-beta-secreting Th3 regulatory cells. Immunol Rev 182, 207-214 (2001).
5. Roncarolo, M.G., Gregori, S., Battaglia, M., Bacchetta, R., Fleischhauer, K., Levings, M.K. Interleukin-10-secreting type 1 regulatory T cells in rodents and humans. Immunol Rev 212, 28-50 (2006).
6. Koenen, H.J., Fasse, E., Joosten, I. IL-15 and cognate antigen successfully expand de novo-induced human antigen-specifi c regulatory CD4+ T cells that require antigen-specifi c activation for suppres-sion. J Immunol 171, 6431-6441 (2003).
7. Bacchetta, R., Sartirana, C., Levings, M.K., Bordignon, C., Narula, S., Roncarolo, M.G. Growth and expan-sion of human T regulatory type 1 cells are independent from TCR activation but require exogenous cytokines. Eur J Immunol 32, 2237-2245 (2002).
8. Long, S.A., Buckner, J.H. Combination of rapamycin and IL-2 increases de novo induction of human CD4(+)CD25(+)FOXP3(+) T cells. J Autoimmun 30, 293-302 (2008).
9. Valmori, D., Tosello, V., Souleimanian, N.E., et al. Rapamycin-mediated enrichment of T cells with regulatory activity in stimulated CD4+ T cell cultures is not due to the selective expansion of naturally occurring regulatory T cells but to the induction of regulatory functions in conventional CD4+ T cells. J Immunol 177, 944-949 (2006).
10. Oderup, C., Malm, H., Ekberg, H., et al. Costimulation blockade-induced cardiac allograft tolerance: inhibition of T cell expansion and accumulation of intragraft CD4(+)Foxp3(+) T cells. Transplantation 82, 1493-1500 (2006).
11. Taylor, P.A., Noelle, R.J., Blazar, B.R. CD4(+)CD25(+) immune regulatory cells are required for induction of tolerance to alloantigen via costimulatory blockade. J Exp Med 193, 1311-1318 (2001).
12. Demirkiran, A., Sewgobind, V.D., van der Weijde, J., et al. Conversion from calcineurin inhibitor to mycophenolate mofetil-based immunosuppression changes the frequency and phenotype of CD4+FOXP3+ regulatory T cells. Transplantation 87, 1062-1068 (2009).
13. Abraham, M., Karni, A., Dembinsky, A., et al. In vitro induction of regulatory T cells by anti-CD3 anti-body in humans. J Autoimmun 30, 21-28 (2008).
14. Watanabe, T., Masuyama, J., Sohma, Y., et al. CD52 is a novel costimulatory molecule for induction of CD4+ regulatory T cells. Clin Immunol 120, 247-259 (2006).
15. Lopez, M., Clarkson, M.R., Albin, M., Sayegh, M.H., Najafi an, N. A Novel Mechanism of Action for Anti-Thymocyte Globulin: Induction of CD4+CD25+Foxp3+ Regulatory T Cells. J Am Soc Nephrol 17, 2844-2853 (2006).
16. Feng, X., Kajigaya, S., Solomou, E.E., et al. Rabbit ATG but not horse ATG promotes expansion of func-tional CD4+CD25highFOXP3+ regulatory T cells in vitro. Blood 111, 3675-3683 (2008).
17. Preville, X., Flacher, M., LeMauff , B., et al. Mechanisms involved in antithymocyte globulin immuno-suppressive activity in a nonhuman primate model. Transplantation 71, 460-468 (2001).
18. Zietse, R, van Steenberge, EP, Hesse, CJ, Vaessen, LB, IJzermans, JN, Weimar, W. Single-shot, high-dose rabbit ATG for rejection prophylaxis after kidney transplantation. Transpl Int 6, 337-340 (1993).
19. Hardinger, K.L. Rabbit antithymocyte globulin induction therapy in adult renal transplantation. Pharmacotherapy 26, 1771-1783 (2006).
Chap
ter 5
102
20. Yoon, J.W., Gollapudi, S., Pahl, M.V., Vaziri, N.D. Naive and central memory T-cell lymphopenia in end-stage renal disease. Kidney Int 70, 371-376 (2006).
21. Yoon, J.W., Pahl, M.V., Vaziri, N.D. Spontaneous leukocyte activation and oxygen-free radical genera-tion in end-stage renal disease. Kidney Int 71, 167-172 (2007).
22. Girndt, M., Sester, U., Sester, M., Kaul, H., Kohler, H. Impaired cellular immune function in patients with end-stage renal failure. Nephrol Dial Transplant 14, 2807-2810 (1999).
23. Hendrikx, T.K., van Gurp, E.A., Mol, W.M., et al. End-stage renal failure and regulatory activities of CD4+CD25bright+FoxP3+ T-cells. Nephrol Dial Transplant 24, 1969-1978 (2009).
24. Roederer, M. Spectral compensation for fl ow cytometry: visualization artifacts, limitations, and cave-ats. Cytometry 45, 194-205 (2001).
25. Jung, T., Schauer, U., Heusser, C., Neumann, C., Rieger, C. Detection of intracellular cytokines by fl ow cytometry. J Immunol Methods 159, 197-207 (1993).
26. Litjens, N.H., Huisman, M., Hijdra, D., Lambrecht, B.M., Stittelaar, K.J., Betjes, M.G. IL-2 producing memory CD4+ T lymphocytes are closely associated with the generation of IgG-secreting plasma cells. J Immunol 181, 3665-3673 (2008).
27. Baan, C.C., van der Mast, B.J., Klepper, M., et al. Diff erential eff ect of calcineurin inhibitors, anti-CD25 antibodies and rapamycin on the induction of FOXP3 in human T cells. Transplantation 80, 110-117 (2005).
28. Bustin, S.A. Absolute quantifi cation of mRNA using real-time reverse transcription polymerase chain reaction assays. J Mol Endocrinol 25, 169-193 (2000).
29. Fontenot, J.D., Gavin, M.A., Rudensky, A.Y. Foxp3 programs the development and function of CD4+CD25+ regulatory T cells. Nat Immunol 4, 330-336 (2003).
30. Hori, S., Nomura, T., Sakaguchi, S. Control of regulatory T cell development by the transcription factor Foxp3. Science 299, 1057-1061 (2003).
31. Litjens, N.H., van Druningen, C.J., Betjes, M.G. Progressive loss of renal function is associated with activation and depletion of naive T lymphocytes. Clin Immunol 118, 83-91 (2006).
32. Sewgobind, V.D., Kho, M.M., van der Laan, L.J., et al. The eff ect of rabbit anti-thymocyte globulin induction therapy on regulatory T cells in kidney transplant patients. Nephrol Dial Transplant 24, 1635-1644 (2009).
33. Liu, W., Putnam, A.L., Xu-Yu, Z., et al. CD127 expression inversely correlates with FoxP3 and suppres-sive function of human CD4+ T reg cells. J Exp Med 203, 1701-1711 (2006).
34. Collison, L.W., Workman, C.J., Kuo, T.T., et al. The inhibitory cytokine IL-35 contributes to regulatory T-cell function. Nature 450, 566-569 (2007).
35. Bardel, E., Larousserie, F., Charlot-Rabiega, P., Coulomb-L’Hermine, A., Devergne, O. Human CD4+ CD25+ Foxp3+ regulatory T cells do not constitutively express IL-35. J Immunol 181, 6898-6905 (2008).
36. Carl, JW, Bai, XF. IL27: Its Roles in the Induction and Inhibition of Infl ammation. Int J Clin Exp Pathol 1, 117-123 (2008).
37. Morishima, N., Owaki, T., Asakawa, M., Kamiya, S., Mizuguchi, J., Yoshimoto, T. Augmentation of eff ec-tor CD8+ T cell generation with enhanced granzyme B expression by IL-27. J Immunol 175, 1686-1693 (2005).
38. Owaki, T., Asakawa, M., Kamiya, S., et al. IL-27 suppresses CD28-mediated [correction of medicated] IL-2 production through suppressor of cytokine signaling 3. J Immunol 176, 2773-2780 (2006).
39. Karpuzoglu, E., Phillips, R.A., Gogal, R.M., Jr., Ansar Ahmed, S. IFN-gamma-inducing transcription fac-tor, T-bet is upregulated by estrogen in murine splenocytes: role of IL-27 but not IL-12. Mol Immunol 44, 1808-1814 (2007).
40. Goldberg, R., Wildbaum, G., Zohar, Y., Maor, G., Karin, N. Suppression of ongoing adjuvant-induced arthritis by neutralizing the function of the p28 subunit of IL-27. J Immunol 173, 1171-1178 (2004).
41. Kawamura, K., Kadowaki, N., Kitawaki, T., Uchiyama, T. Virus-stimulated plasmacytoid dendritic cells induce CD4+ cytotoxic regulatory T cells. Blood 107, 1031-1038 (2006).
In vitro Induction of Regulatory T Cells by rATG 103
42. Chen, W.F. & Zlotnik, A. IL-10: a novel cytotoxic T cell diff erentiation factor. J Immunol 147, 528-534 (1991).
43. Fujii, S, Shimizu, K, Shimizu, T, Lotze, M.T. Interleukin-10 promotes the maintenance of antitumor CD8(+) T-cell eff ector function in situ. Blood 98, 2143-2151 (2001).
44. Brown, D.M., Kamperschroer, C., Dilzer, A.M., Roberts, D.M., Swain, S.L. IL-2 and antigen dose diff er-entially regulate perforin- and FasL-mediated cytolytic activity in antigen specifi c CD4+ T cells. Cell Immunol 257, 69-79 (2009).
45. Bratke, K., Kuepper, M., Bade, B., Virchow, J.C., Jr., Luttmann, W. Diff erential expression of human granzymes A, B, and K in natural killer cells and during CD8+ T cell diff erentiation in peripheral blood. Eur J Immunol 35, 2608-2616 (2005).
46. van Besouw, N.M., Zuijderwijk, J.M., de Kuiper, P., Ijzermans, J.N., Weimar, W., van der Mast, B.J. The granzyme B and interferon-gamma enzyme-linked immunospot assay as alternatives for cytotoxic T-lymphocyte precursor frequency after renal transplantation. Transplantation 79, 1062-1066 (2005).
47. Romero, V. & Andrade, F. Non-apoptotic functions of granzymes. Tissue Antigens 71, 409-416 (2008). 48. Wang, J., Ioan-Facsinay, A., van der Voort, E.I., Huizinga, T.W., Toes, R.E. Transient expression of FOXP3
in human activated nonregulatory CD4+ T cells. Eur J Immunol 37, 129-138 (2007). 49. Passerini, L., Allan, S.E., Battaglia, M., et al. STAT5-signaling cytokines regulate the expression of FOXP3
in CD4+CD25+ regulatory T cells and CD4+CD25- eff ector T cells. Int Immunol 20, 421-431 (2008). 50. Huber, S., Schramm, C., Lehr, H.A., et al. Cutting edge: TGF-beta signaling is required for the in vivo
expansion and immunosuppressive capacity of regulatory CD4+CD25+ T cells. J Immunol 173, 6526-6531 (2004).
51. Davidson, T.S., DiPaolo, R.J., Andersson, J., Shevach, E.M. Cutting Edge: IL-2 is essential for TGF-beta-mediated induction of Foxp3+ T regulatory cells. J Immunol 178, 4022-4026 (2007).
52. Mahic, M., Yaqub, S., Bryn, T., et al. Diff erentiation of naive CD4+ T cells into CD4+CD25+FOXP3+ regulatory T cells by continuous antigen stimulation. J Leukoc Biol 83, 1111-1117 (2008).
53. Tao, R., de Zoeten, E.F., Ozkaynak, E., et al. Deacetylase inhibition promotes the generation and func-tion of regulatory T cells. Nat Med 13, 1299-1307 (2007).


Chap ter 6The Calcineurin Inhibitor Tacrolimus Allows the
Induction of Functional CD4+CD25+ Regulatory T Cells by Rabbit Anti-Thymocyte Globulins
Clinical and Experimental Immunology, accepted March 2010
Varsha D.K.D. Sewgobind1,2*, Luc J.W. van der Laan2, Marcia M.L Kho1,
Rens Kraaijeveld1, Sander S. Korevaar1, Wendy Mol1,
Willem Weimar1, Carla C. Baan1
Departments of 1Internal Medicine and 2Surgery
Erasmus MC, University Medical Center Rotterdam, the Netherlands
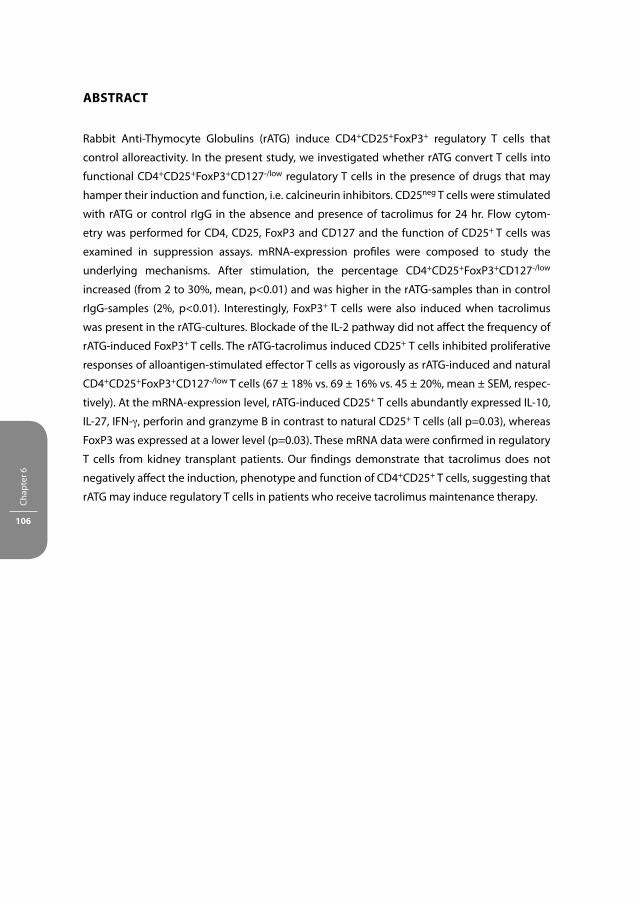
Chap
ter 6
106
ABSTRACT
Rabbit Anti-Thymocyte Globulins (rATG) induce CD4+CD25+FoxP3+ regulatory T cells that
control alloreactivity. In the present study, we investigated whether rATG convert T cells into
functional CD4+CD25+FoxP3+CD127-/low regulatory T cells in the presence of drugs that may
hamper their induction and function, i.e. calcineurin inhibitors. CD25neg T cells were stimulated
with rATG or control rIgG in the absence and presence of tacrolimus for 24 hr. Flow cytom-
etry was performed for CD4, CD25, FoxP3 and CD127 and the function of CD25+ T cells was
examined in suppression assays. mRNA-expression profi les were composed to study the
underlying mechanisms. After stimulation, the percentage CD4+CD25+FoxP3+CD127-/low
increased (from 2 to 30%, mean, p<0.01) and was higher in the rATG-samples than in control
rIgG-samples (2%, p<0.01). Interestingly, FoxP3+ T cells were also induced when tacrolimus
was present in the rATG-cultures. Blockade of the IL-2 pathway did not aff ect the frequency of
rATG-induced FoxP3+ T cells. The rATG-tacrolimus induced CD25+ T cells inhibited proliferative
responses of alloantigen-stimulated eff ector T cells as vigorously as rATG-induced and natural
CD4+CD25+FoxP3+CD127-/low T cells (67 ± 18% vs. 69 ± 16% vs. 45 ± 20%, mean ± SEM, respec-
tively). At the mRNA-expression level, rATG-induced CD25+ T cells abundantly expressed IL-10,
IL-27, IFN-γ, perforin and granzyme B in contrast to natural CD25+ T cells (all p=0.03), whereas
FoxP3 was expressed at a lower level (p=0.03). These mRNA data were confi rmed in regulatory
T cells from kidney transplant patients. Our fi ndings demonstrate that tacrolimus does not
negatively aff ect the induction, phenotype and function of CD4+CD25+ T cells, suggesting that
rATG may induce regulatory T cells in patients who receive tacrolimus maintenance therapy.

Induction of Regulatory T cells by rATG and Tacrolimus 107
INTRODUCTION
The major goal of transplantation immunobiology is to prevent alloreactivity by inducing a
state of donor-specifi c hyporesponsiveness in order to acquire graft acceptance. There are
several protocols to establish this. First, a straightforward way of inhibiting alloreactivity can
be accomplished by immunosuppressive therapy. However, a major limitation of the most
common immunosuppressive regimens is that they lack specifi city as they do not only dampen
the immune responses against the allograft. Secondly, apart from mechanisms like clonal dele-
tion, anergy, or activation induced cell death (AICD), the in vivo skewing of the immune system
towards the regulatory T cells that control alloreactivity seems to be promising in obtaining
donor-specifi c hyporesponsiveness as demonstrated in experimental transplantation models1, 2.
It is tempting to speculate that immunosuppressive drugs may also contribute to the
development of donor-specifi c hyporesponsiveness via the active induction of regulatory T
cells. Indeed, experimental studies analyzing the eff ects of various immunosuppressive agents
suggest that these drugs benefi cially contribute to immunoregulatory mechanisms3-5. For
instance, rabbit Anti-Thymocyte Globulins (rATG), which are given as induction therapy after
transplantation, convert human CD25neg T cells into functional suppressive CD4+CD25+FoxP3+
T cells in vitro5, 6.
Previously, we reported that the number of CD4+CD25bright regulatory T cells slowly and
incompletely recovered in kidney transplant recipients within 6 months after rATG-induction
therapy when given in combination with a calcineurin inhibitor and MMF7. Nevertheless, the
donor-specifi c suppressive properties of these peripheral CD4+CD25bright T cells were equiva-
lent to that of the CD4+CD25bright T cells before transplantation. In line with these results, it
has been shown that steroids do not hamper the recovery of CD4+CD25+ regulatory T cells
after treatment of kidney transplant patients with a non-depletive rATG-solution8. Moreover,
the patient group that received rATG-treatment without steroids did not show enhanced levels
of regulatory T cells after treatment. Our study and the latter implicate that CNIs might be
responsible for the lack of enhanced regulatory T cell numbers after rATG therapy compared
with pre-treatment.
As CD4+CD25+ regulatory T cells require IL-2 and other members of the IL-2 cytokine family
for their development, homeostasis and function 9-12, their frequency or function might be
aff ected by CNIs that inhibit the transcription factor NFAT required for IL-2 transcription13-15 or
by anti-IL-2 receptor antibodies (daclizumab/basiliximab) that block IL-2 signaling15. This may
imply that in patients, these agents may negatively infl uence the benefi cial eff ects of rATG on
the induction of regulatory T cells.
To understand the factors that enhance or harm the development of functional rATG-induced
regulatory T cells, we investigated the induction of rATG induced-regulatory T cells in the pres-
ence and absence of a CNI (tacrolimus), antibodies that abolish IL-2 (anti-IL-2) and that block
IL-2R signaling (daclizumab) on human peripheral blood cells. Furthermore, the rATG-treated

Chap
ter 6
108
cells were functionally analyzed and characterized according to their gene-expression patterns
to reveal their underlying mechanisms. The gene-expression profi les obtained in vitro were
verifi ed in kidney transplant patients who received rATG induction therapy and CNI mainte-
nance therapy and were compared with a non-rATG group. These fi ndings may have important
implications for understanding one of the mechanisms of action of rATG in transplanted
patients after rATG induction therapy which is followed by concomitant immunosuppression.
MATERIALS AND METHODS
Induction of regulatory T cells
PBMC were isolated by density gradient centrifugation over Ficoll-Paque (Amersham Phar-
macia Biotech, Uppsala, Sweden) from buff y coats of 5 blood bank donors (Sanquin Blood
Bank, Rotterdam). PBMC were washed twice and resuspended in 10% Human Culture Medium
(HCM), which consisted of RPMI 1640 medium with L-glutamine (Bio Whittaker, Verviers, Bel-
gium) supplemented with 10% pooled human serum and 100 IU/mL penicillin and 100 μg/
mL streptomycin (Gibco BRL). The CD25+ T cells were depleted of the PBMC by incubation with
anti-CD25 microbeads, (Miltenyi Biotech, Bergisch Gladbach, Germany) followed by negative
selection on the autoMACS (Miltenyi Biotech, DEPLETE-S program). The untouched residual
fraction consisted of CD25neg cells (>95%, Figure 1A). To induce regulatory T cells with rATG,
the residual (CD25neg) fraction was washed and resuspended in HCM to a fi nal concentration
of 5x10⁵/mL. RATG (10 μg/mL, Thymoglobulin, Genzyme Corporation, Cambridge, MA), or a
control polyclonal rabbit IgG antibody (rIgG, 10 μg/mL, Sigma-Aldrich, St. Louis, MO) was added
for 24 and 72 hr. Tacrolimus (10 ng/mL, Astellas, Tokyo, Japan), monoclonal anti-human IL-2Rα
antibody (1 μg/mL, R&D Systems, Minneapolis, MN) or anti-human IL-2 antibody (1 μg/mL, R&D
Systems) was added to the rATG-treated cultures for 24 hr.
Flow cytometry
Flow cytometry was performed using antibodies directly conjugated to fl uorescein isothiocya-
nate (FITC), phycoerythrin (PE), allophycocyanin (APC) or peridinin chlorophyll protein (PerCP)
and Amcyan. After incubation with rATG or rIgG, PBMC were harvested and FoxP3-intracellular
staining was performed according to the manufacturer’s instructions (FoxP3-APC, clone PCH101,
eBioscience, San Diego, CA). Extracellular staining was conducted prior to intracellular staining
with FITC-conjugated CD127 (eBioscience), IgG1, PERCP-conjugated CD4, PE-conjugated CD25
epitope B (clone M-A251, BD Biosciences, San Jose, CA), PE-conjugated CD25 and Amcyan-con-
jugated CD3 at 4°C for 30 min. (BD Biosciences). In a separate plate, PE-conjugated granzyme
B (Pelicluster, clone CLB-GB11, CLB, Amsterdam) was added simultaneously during incubation
with the FoxP3-antibody. Prior to this intracellular staining, extracellular staining with PE-Cy7-
conjugated CD25 epitope B (clone M-A251, BD Biosciences) and PERCP-conjugated CD4 was

Induction of Regulatory T cells by rATG and Tacrolimus 109
performed. Isotype controls IgG1-FITC and IgG1-PE for CD25 and granzyme B and CD127 and
IgG2a-APC were included at each staining as controls as well as the Fluorescence Minus One
(FMO) controls16.
Phosphospecifi c fl ow cytometry was performed according to the manufacturer’s specifi ca-
tions (BD Biosciences) on CD25neg cells (buff y coats blood bank donors, Sanquin, n=3) before
(unstimulated) and after 24 hr of rATG (10 μg/mL) and rATG-tacrolimus (10 ng/mL) stimula-
tion. PBMC and CD25neg cells (1x10⁶) that were stimulated with PMA-ionomycine 10 min at
37ºC served as the positive controls. Phosphorylation of P38 in CD3+CD4+, CD4+CD25+ and
CD4+CD25neg gated cells was determined by fi ve color fl ow cytometry using the following
antibodies: MAPK-P38-PE (clone 36/p38 pT180/pY182, BD Biosciences), CD3-PERCP, CD4-PB,
CD25-PE-Cy7 epitope B (clone M-A251, BD Biosciences). Cells were analyzed on a FACSCanto II
fl ow cytometer (BD Biosciences) for data analysis. Twenty thousand gated lymphocyte events
were acquired from each tube. Median fl uorescent intensity values (MFI) were generated by
analyzing the data with Diva 6.0 software (BD Biosciences). FMO controls and unstained control
tubes were also included16.
Isolation of human natural and induced regulatory T cells and suppression assays
To test their function, natural and induced CD25+ T cells were isolated from the PBMC after
incubation with anti-CD25 microbeads, Miltenyi Biotech) followed by a positive selection
(POSSELD-program) on the autoMACS (Miltenyi Biotech) as described before17. The isolated
and the residual fractions were washed and resuspended in HCM for functional analysis. The
untouched residual fraction consisted for > 98% of CD25-/dim eff ector cells. The purity of the
CD25+ isolated fraction was > 90%17.
The function of CD25+ T cells was determined by mixed lymphocyte reactions in which
their suppressive capacities were measured by their ability to inhibit the proliferative response
of autologous CD25neg eff ector T cells (CD25neg Teff ). CD25neg Teff were co-cultured in trip-
licate with natural CD25+ T cells or with induced CD25+ T cells. Irradiated (40 Gy) 2-2-2 HLA
mismatched allogeneic PBMC were used as stimulator cells (105 cells/100 μL) and co-cultured
with 5x10⁴ cells/100 μL of a CD25+ : CD25neg mixture at 1:10 in triplicate wells in round-bottom
96-well plates (Nunc, Roskilde, Denmark). Moreover, the natural and rATG-induced CD25+ T
cells were co-cultured with irradiated CD25−/dim Teff in the presence of alloantigens to confi rm
their anergic state.
After 7 days of incubation at 37°C in a humidifi ed atmosphere of 5% CO2, proliferation was
measured after 3H-thymidine (0.5 μCi/well: Amersham Pharmacia Biotech, Buckinghamshire,
UK) incubation for the last 16 hr before harvesting. 3H-Thymidine incorporation into DNA was
assessed using a Betaplate counter (LKB-Wallac, Turku, Finland).

Chap
ter 6
110
Patient samples
Kidney transplant patients (n=6) were enrolled in this study and were part of a feasibility study.
Patients (n=3) were given one infusion of 1.5 mg/kg Anti-thymocyte Globulin (Rabbit) (Thymo-
globulin®, Genzyme Corporation, Cambridge, MA) each day at day 1, 2 and 3 after transplan-
tation followed by a triple therapy maintenance regimen consisting of tacrolimus, MMF and
prednisone. MMF and prednisone were given from day 1 and tacrolimus was given from day
2 after transplantation. A control non-rATG group (n=3) was treated with tacrolimus, MMF and
prednisone. Heparinized blood was drawn at 12 weeks (median) post-transplant, when median
T-cell numbers were 400 T cells/μL (N=3 rATG patients). PBMC were isolated as described above
by density gradient centrifugation over Ficoll-Paque. Subsequently, CD4+CD25+CD127-/low
and CD4+CD25negCD127+ T cells were sorted with the FACSAria II (BD Biosciences) on PERCP-
conjugated 7-AAD, Pacifi c Blue-conjugated CD4, PE-Cy7-conjugated CD25 and PE-conjugated
CD127 (BD Biosciences). The purity of CD25+ within sorted cells was ≥ 98%. After isolation, T-cell
subsets were snap-frozen for PCR analyses.
Quantitative (Q) PCR
To analyze the gene expression patterns of the samples obtained from healthy individuals and
patients, the CD25neg T cells on day 0, rATG-induced and rATG-tacrolimus induced CD25+ and
CD25neg T cells after 24 hr, and natural CD25+ T cells were harvested and total RNA was isolated
using the High Pure RNA Isolation kit (Roche Applied Science, Penzberg, Germany), according
to the manufacturer’s instructions. RNA-isolation from the patient samples was performed by
extraction with phenol. In brief, cDNA was synthesized from total RNA with random primers as
described before15. Q-PCR was applied to quantify the mRNA expression levels of IL-4, RORγt,
perforin and granzyme B using the primer express software (Applied Biosystems, Forster City,
CA). Assay-on-demand products for the detection and quantifi cation of 18S (Hs99999901_s1),
CD25 (Hs00166229.m1), FOXP3 (Hs00203958_m1), IL-2 (Hs00174114.m1), IL-10 (Hs00174086.
m1), EBI-3 (Hs01057148.m1), IL27p28 (Hs00377366.m1) and IFN-γ (Hs00174143.m1) mRNA
was designed by Applied Biosystems (Forster City, CA). The PCR-reactions were performed
using a StepOnePlus Real-Time PCR System (Applied Biosystems). The amount of each target
molecule was quantifi ed by measuring the cycle threshold (Ct) values, which were transformed
to the number of cDNA copies [2(40-Ct)]18. Each run contained several negative controls (no
template) and two positive reference samples to check intra- and inter-assay variations. The
same reference samples were used in all experiments. There were no signifi cant diff erences in
Ct values of reference samples within and between the experiments (all <0.25 Ct). The relative
concentrations of the analyzed markers were normalized to the relative concentration of the
housekeeping gene 18S that was present in each sample and multiplied by 106 due to the
lower concentration of the target gene compared with the concentration of 18S18.
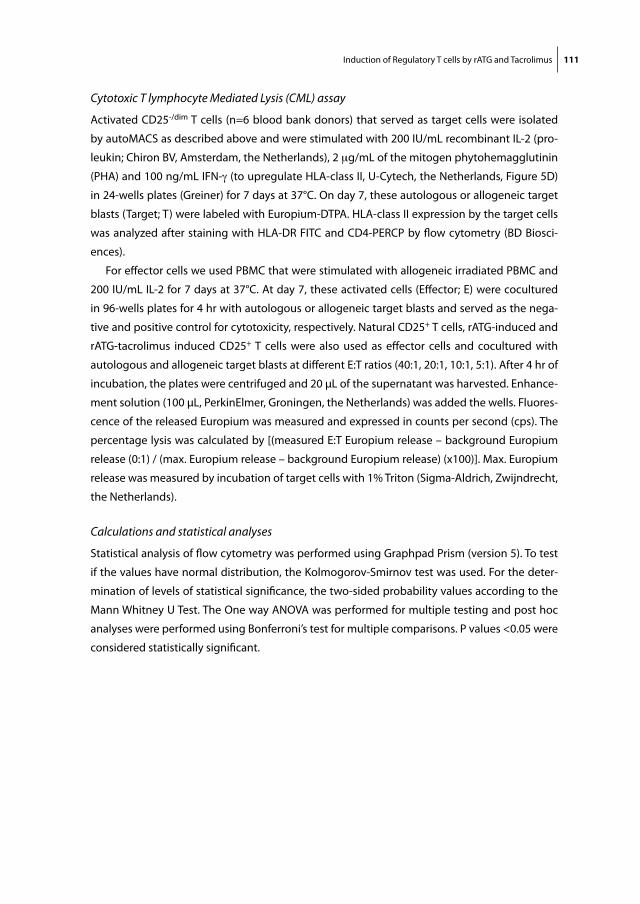
Induction of Regulatory T cells by rATG and Tacrolimus 111
Cytotoxic T lymphocyte Mediated Lysis (CML) assay
Activated CD25-/dim T cells (n=6 blood bank donors) that served as target cells were isolated
by autoMACS as described above and were stimulated with 200 IU/mL recombinant IL-2 (pro-
leukin; Chiron BV, Amsterdam, the Netherlands), 2 μg/mL of the mitogen phytohemagglutinin
(PHA) and 100 ng/mL IFN-γ (to upregulate HLA-class II, U-Cytech, the Netherlands, Figure 5D)
in 24-wells plates (Greiner) for 7 days at 37°C. On day 7, these autologous or allogeneic target
blasts (Target; T) were labeled with Europium-DTPA. HLA-class II expression by the target cells
was analyzed after staining with HLA-DR FITC and CD4-PERCP by fl ow cytometry (BD Biosci-
ences).
For eff ector cells we used PBMC that were stimulated with allogeneic irradiated PBMC and
200 IU/mL IL-2 for 7 days at 37°C. At day 7, these activated cells (Eff ector; E) were cocultured
in 96-wells plates for 4 hr with autologous or allogeneic target blasts and served as the nega-
tive and positive control for cytotoxicity, respectively. Natural CD25+ T cells, rATG-induced and
rATG-tacrolimus induced CD25+ T cells were also used as eff ector cells and cocultured with
autologous and allogeneic target blasts at diff erent E:T ratios (40:1, 20:1, 10:1, 5:1). After 4 hr of
incubation, the plates were centrifuged and 20 μL of the supernatant was harvested. Enhance-
ment solution (100 μL, PerkinElmer, Groningen, the Netherlands) was added the wells. Fluores-
cence of the released Europium was measured and expressed in counts per second (cps). The
percentage lysis was calculated by [(measured E:T Europium release – background Europium
release (0:1) / (max. Europium release – background Europium release) (x100)]. Max. Europium
release was measured by incubation of target cells with 1% Triton (Sigma-Aldrich, Zwijndrecht,
the Netherlands).
Calculations and statistical analyses
Statistical analysis of fl ow cytometry was performed using Graphpad Prism (version 5). To test
if the values have normal distribution, the Kolmogorov-Smirnov test was used. For the deter-
mination of levels of statistical signifi cance, the two-sided probability values according to the
Mann Whitney U Test. The One way ANOVA was performed for multiple testing and post hoc
analyses were performed using Bonferroni’s test for multiple comparisons. P values <0.05 were
considered statistically signifi cant.

Chap
ter 6
112
RESULTS
Induction of human CD4+CD25+FoxP3+CD127-/low regulatory T cells with rATG
We performed induction experiments with rATG by the incubation of human CD25neg T cells
that were depleted from PBMC (Figure 1A). A typical example of induced CD25-expression after
stimulation with rATG is shown in Figure 1B. CD25+ T cells were induced in the rATG-treated
samples (27% ± 1.7, mean ± SEM, n=5, Figure 1C) and the percentage CD25+ was signifi cantly
higher than in the rIgG-treated samples (2.6% ± 0.5, Figure 1C). Also, when incubated with rATG
in the presence of tacrolimus, the proportion of CD25+ T cells was signifi cantly higher than the
rIgG-treated samples (41% ± 1.6, Figure 1C), whereas tacrolimus alone had no eff ect on the
percentage of CD25+ T cells compared with the rIgG-treated samples.
To evaluate the eff ect of IL-2, we subsequently inhibited the IL-2 pathway. Incubation of
CD25neg T cell cultures in the presence of an IL-2Rα inhibitor and rATG for 24 hr also resulted in a
signifi cantly higher percentage of CD25-expressing CD4+ T cells than in the rIgG treated samples
(IL-2Rα: 21% ± 3.9 and anti-IL-2: 34% ± 8.1, Figure 1C). Next, the percentage of FoxP3+CD127-/low
T cells was assessed within the CD4+CD25+ T cells. FoxP3+CD127-/low T cells were induced within
the CD25+ T cells in all cultures with rATG (Figure 1D). The percentage of FoxP3+CD127-/low of
CD4+CD25+ T cells for the rIgG, rATG, rATG-tacrolimus, IL-2Rα and anti-IL-2 antibody were 2% ±
0.6, 30% ± 3.9, 19% ± 4.4, 27% ± 2.2 and 30% ± 3.5 respectively (Figure 1E).
It has been reported that phosphorylation P38, an important component of the Mitogen-
activated Protein Kinase (MAPK) pathway that is linked to NFAT, can be inhibited by CNI19-21.
Interestingly, P38 phophorylation is required for TGF-β induced conversion of CD4+CD25neg
cells into CD4+CD25+FoxP3+ regulatory T cells22. Therefore, we questioned whether P38 phos-
phorylation was also induced after stimulation of CD25neg cells with rATG to induce FoxP3-
expression. We found that phosphorylation was present at low level in unstimulated CD25neg
cells (Figure 2A) and increased after 10 min. of stimulation with PMA-ionomycine.
Subsequently, the phoshphorylation level of P38 was measured in the total CD4+ population
after 24 hr of incubation of CD25neg cells with rATG and rATG-tacrolimus. The phosphorylation of
P38 was increased in the rATG-treated samples and in the rATG-tacrolimus incubated samples. We
did not fi nd a diff erence in P38 phosphorylation level the between rATG- and the rATG-tacrolimus
treated samples (Figure 2B). When gated on the rATG-induced CD25+ T cells, the level of phos-
phorylated P38 was comparable with that in natural CD25+ (Figure 2C). Moreover, the level of
phosphorylated P38 was higher in natural and rATG-induced CD25+ than in CD25neg (Figure 2C).
Functional analysis of regulatory T cells
Subsequently, we studied the suppressive capacity of rATG- and rATG-tacrolimus induced
CD4+CD25+ T cells. Therefore, these induced CD4+CD25+ T cells were isolated from the total
PBMC population after 24 hr and cocultured in a suppression assay with autologous CD25neg T
cells during stimulation with alloantigen.

Induction of Regulatory T cells by rATG and Tacrolimus 113
CD
25
CD4
PBMC CD4+CD25neg
0.4%9.0% 0.4%
24 hrs rIgG 24 hrs Tacrolimus 24 hrs rATG
24 hrs rATG 24 hrs rATG 24 hrs rATG +Tacrolimus +anti IL-2Rα +anti IL-2
CD
25
CD4
1.83% 3.29% 25.54%
37.95% 17.85% 23.20%
A
B
C
Figure 1. Induction of regulatory T cells
(A) Depletion of CD25+ T cells from PBMC. (B) Incubation of CD25neg T cells with rIgG, Tacrolimus, rATG, rATG+Tacrolimus, rATG+IL-2 receptor
(R) α and rATG+anti-IL-2. Gate shows the percentage of CD25+ of CD4+ T cells. (C) Percentage of CD25+ T cells of CD4+ of n=3. Diff erences were
statistically tested by ANOVA, p<0.0001.

Chap
ter 6
114
24 hrs rATG + Tacrolimus
FoxP
3
CD127
24 hrs rATG + anti-IL-2
24 hrs rATG + anti-IL-2Rα 24 hrs rATG
31,4% 19,4% 27,7% 29,4%
10,1% 1.4%
day 0 PBMC day 0 CD25neg
FoxP
3
CD127
day 0 nCD25+ 85%
3.4%
24 hrs rIgG
FoxP
3
CD127
91%
24 hrs rATG nCD25+
D
E
Figure 1. Induction of regulatory T cells (continued)
(D) Representative example of percentage FoxP3+CD127-/low within the induced CD25+ T cells of all cultures in the presence of rATG. CD25neg cells
from PBMC (top panels) were stimulated for 24 hrs with rATG, rATG + Tacrolimus, rATG + anti-IL2Rα and rATG + anti-IL-2. After 24 hrs, induced
CD25+ T cells were gated and analysed for their FoxP3+CD127-/low expression (middle panels). Gates for positivity were set on FoxP3+CD127-/low
cells within natural (nCD25+) T cells after 24 hrs of incubation with rATG. FoxP3+CD127-/low cells were absent within CD25neg cells incubated with
control rIgG (lower panels). (E) Percentage of FoxP3+CD127-/low of induced CD25+ T cells, n=3 healthy individuals. Error bars represent mean ±
SEM. Diff erences were statistically tested by ANOVA, p<0.0001, *p<0.05, ***p<0.001.

Induction of Regulatory T cells by rATG and Tacrolimus 115
(P) P
38
CD4
Unstimulated CD4+CD25neg cells
PMA-iono stimulated CD4+CD25neg cells
rATG-stimulatedCD4+CD25neg cells
143 179 171
A
B
C
Figure 2. P38 phospho-specifi c fl ow cytometry
(A) Representative example of P38 phosphorylation levels in unstimulated, PMA-ionomycine stimulated, rATG-stimulated CD4+CD25neg
cells. Median Fluorescence intensities are depicted of phosphorylated (P) P38 in CD4+ T cells after 24 hrs. of culture (B) P38 phosphorylation
in unstimulated CD4+CD25neg cells, PMA-ionomycine stimulated CD4+CD25neg cells, rATG stimulated CD4+CD25neg cells and rATG-tacrolimus
stimulated CD4+CD25neg cells, n=3 (C) Phosphorylation of P38 in unstimulated and PMA-ionomycine stimulated natural CD4+CD25+
(nCD4+CD25+) and CD4+CD25neg cells from PBMC and rATG-induced CD4+CD25+ and CD25neg cells.

Chap
ter 6
116
After coculture with natural CD25+, rATG-induced CD25+ or rATG-tacrolimus induced CD25+
T cells, the proliferative responses by CD25neg T cells were lower (Figure 3A). The rATG-induced
CD25+ T cells that were induced in the presence or absence of tacrolimus inhibited the response
at a comparable level to natural CD25+ T cells (mean ± SEM) at a 1:10 ratio (rATG-induced CD25+:
69% ± 16, rATG-tacrolimus-induced CD25+: 67% ± 18 vs. natural CD25+: 45% ± 20, Figure 3B). The
analogous suppressive capacities of the rATG-induced and the rATG-tacrolimus-induced CD25+
T cells suggest that rATG promotes bona fi de regulatory T cells even in the presence of tacrolimus.
A key characteristic of natural CD25+ suppressor T cells is that they do not proliferate upon
stimulation with alloantigen. We found that the rATG-induced and rATG-Tacro induced CD25+
T cells also did not show a proliferative response upon stimulation with alloantigen for 7 days,
suggesting that the cells are anergic (rATG: 487 ± 153, rATG-Tacro: 369 ± 186, mean ± SEM).
Gene expression profi le of rATG-induced regulatory T cells in the absence and presence of tacrolimus
To reveal the key molecules involved in the mechanism of action of rATG tacrolimus induced
CD25+ T cells, we investigated their gene-expression profi les on these T cells and compared them
with rATG-induced and natural CD25+ T cells. The purity of CD25+ within sorted cells was ≥ 98%.
The mRNA expression of FOXP3 was signifi cantly lower in the rATG-induced and rATG-
tacrolimus induced CD25+ T cells compared with the natural CD25+ T cells (Figure 4). IL-10,
EBI3, IL-27p28, IFN-γ, perforin and Granzyme B were all abundantly expressed in the rATG- and
rATG-tacrolimus induced CD25+ T cells compared with the natural CD25+ T cells (Figure 4).
Next, we compared the profi les of the rATG-induced CD25+ T cells in the presence and
absence of tacrolimus and it appeared that the mRNA-expression of all tested genes, with the
exclusion of FOXP3 and IL-27p28, were signifi cantly higher in the rATG-(I) CD25+ T cells in the
A B
Figure 3. Suppression assays with natural (n) and rATG-Induced (I) and rATG-Tacrolimus (Tacro) Induced CD25+ T cells
(A) Proliferative responses after 3H-Thymidine incorporation are shown in counts per minute (cpm) of CD25neg T cells in response to allo-antigen
(black bar) and of CD25neg T cells in the presence of (n) CD25+ T cells (gray bar), rATG (I) (dotted bar) and rATG-Tacrolimus induced (striped bar)
CD25+ T cells. (B) Percentage inhibition of the proliferation of CD25neg T cells by (n) (gray bar), rATG-(I) (dotted bar) and rATG-Tacrolimus induced
(striped bar) CD25+ T cells. Mean ± SEM are shown for n=5 healthy individuals.

Induction of Regulatory T cells by rATG and Tacrolimus 117
presence of tacrolimus (Figure 4). Overall, the gene expression profi le of the rATG-tacrolimus
induced CD25+ T cells was comparable with the rATG-induced CD25+ T cells whereas distinct
from that of the natural CD25+ T cells (Figure 4). IL-2, IL-4 and the transcription factor for Th17-
cells RORγt were undetectable.
Figure 4. Relative mRNA expression patterns of (n) (gray bar), rATG (I) (dotted bar) and rATG-tacrolimus (I) (striped bar) CD25+ T cells for FOXP3,
IL-10, EBI3, IL27p28, IFN-γ, perforin and granzyme B for n=4 healthy individuals. Error bars represent mean ± SEM. Signifi cance was tested by
ANOVA; FOXP3; p<0.0001, IL-10; p=0.0007, EBI3; p<0.0001, IL-27p28; p=0.01, IFN-γ; p=0.0008, perforin; p<0.0001, Granzyme B; p=0.0014,
*p<0.05.

Chap
ter 6
118
Flow cytometric analyses of Granzyme B and cytotoxic activities by induced regulatory T cells
The fi nding that granzyme B mRNA levels were upregulated in the rATG-induced and >80-fold
in rATG-tacrolimus induced CD25+ T cells compared with natural CD25+ T cells, prompted us to
link the results on transcriptional level with the translational level. Therefore, we investigated
the expression of this protein in these T cells as well. The percentages and fl uorescence intensi-
ties of granzyme B+ T cells within the CD4+CD25+FoxP3+ T cells were measured to determine
co-expression of granzyme B and FoxP3. A representative example of granzyme B+ T cells
within CD4+CD25+FoxP3+ T cells is shown in Figure 5A. A considerably higher percentage was
granzyme B+ of the rATG-tacrolimus-induced CD4+CD25+FoxP3+ T cells, compared with natural
Figure 4. (continued) Relative mRNA expression patterns of (n) (gray bar), rATG (I) (dotted bar) and rATG-tacrolimus (I) (striped bar) CD25+ T
cells for FOXP3, IL-10, EBI3, IL27p28, IFN-γ, perforin and granzyme B for n=4 healthy individuals. Error bars represent mean ± SEM. Signifi cance
was tested by ANOVA; FOXP3; p<0.0001, IL-10; p=0.0007, EBI3; p<0.0001, IL-27p28; p=0.01, IFN-γ; p=0.0008, perforin; p<0.0001, Granzyme
B; p=0.0014, *p<0.05.

Induction of Regulatory T cells by rATG and Tacrolimus 119
CD4+CD25+FoxP3+ T cells (Figures 5A and B). Also the fl uorescence intensities of granzyme B
were higher in the rATG-tacrolimus and rATG-induced CD25+FoxP3+ T cells compared with the
natural CD25+FoxP3+ T cells, suggesting a higher per-cell expression (Figure 5A). The percent-
age of granzyme B+ T cells was the same between rATG and rATG-tacrolimus induced CD25+
T cell populations, whether defi ned as CD4+CD25+FoxP3+ (Figure 5B) or CD4+CD25+ T cells
(Figure 5C).
1%
672.81
18.7%
1061.07
22.4%
1253.06
Isotypecontrol
NaturalCD4+CD25+FoxP3+CD127-/low
rATG (I)CD4+CD25+FoxP3+CD127-/low
rATG-Tacro (I)CD4+CD25+FoxP3+CD127-/low
564.02
3%
A
B C
Figure 5. Flow cytometric analyses of granzyme B expression (A) within natural, rATG (I) and rATG-Tacro (I) CD25+FoxP3+CD127low T cells. The
marker represents percentage of Granzyme B positive cells. Median fl uorescence intensities of granzyme B are also depicted. (B) Percentage
granzyme B positive cells within CCD25+FoxP3+ T cells for n=3 healthy individuals and (C) percentage granzyme B positive cells within
CD4+CD25+ T cells of n=3 healthy individuals. Mean ± SEM are shown.

Chap
ter 6
120
+IFN- γ
- IFN-γ# ce
lls
94%
37%
HLA-class II
Isotype control
CD4+ T-cell blasts
cytotoxicity
0:1 5:1 10:1
20:1
40:1
0
10
20
30
40
Natural Treg : allogeneic targetblasts
Induced Treg : allogeneic targetblasts
allo-antigen activated PBMC : allogeneic targetblasts (positive control)allo-antigen activated PBMC : autologous targetblasts (negative control)
E: EffectorT: Target
E:T ratio
Lys
is (%
)
D
E
Figure 5. (continued) (D) One representative example of upregulation of HLA-class II on CD4+ T cell blasts (gated on CD3+CD4+ T cells) in the
presence of IFN-γ. (E) Cytotoxicity assay with natural, rATG and rATG-tacro Induced Treg as eff ector cells (E) and europium labeled target blasts (T).
Natural and Induced Treg are cocultured with allogeneic target blasts. Mean ± SEM are shown for N=6 healthy controls.

Induction of Regulatory T cells by rATG and Tacrolimus 121
To check whether the rATG-induced and rATG-Tacro induced CD25+ T cells have cytotoxic
activities, we performed a cytotoxic T lymphocyte mediated lysis (CML) assay. Natural, rATG-
induced and rATG-Tacro induced CD25+ T cells were used as eff ector cells (E) and Target (T)
blasts were generated in the presence of IL-2 and IFN-γ from autologous and allogeneic PBMC
and labeled with Europium. First, we checked the HLA-class II expression on T cell blasts. In
the presence of IFN-γ, T cell blasts abundantly upregulated HLA-class II (Figure 5D). Allogeneic
stimulated PBMC were able to lyse allogeneic but not autologous target blasts. The percentage
lysis of allogeneic target blasts by natural, rATG and rATG-tacro-induced CD25+ was comparable
with the autologous control, showing that they do not lyse allogeneic target blasts (Figure 5E).
Gene expression profi le of regulatory T cells in kidney transplant patients after rATG induction therapy
To confi rm expression levels found in vitro in cells from healthy individuals, the mRNA-expression
patterns of the same set of genes on CD25+ T cells from kidney transplant patients that received
rATG-induction therapy followed by maintenance therapy that consisted of tacrolimus. A non-
rATG group that received maintenance therapy alone served as control because their PBMC are
composed of only natural regulatory T cells and are not heterogeneous as expected for the rATG-
treated patients. The FACS-sorted CD4+CD25+CD127-/low T cells of patients within the rATG-group
showed signifi cantly higher expression of CD25 and FoxP3 than the same T-cell subset from
patients in the non-rATG group (Figure 6). Moreover, the mRNA-expression levels of IL-10, IL-2,
IFN-γ, perforin and Granzyme B were also highly expressed in the CD4+CD25+CD127-/low from
rATG-treated patients compared with the CD4+CD25+CD127-/low T cells from the control group
(Figure 6). The mRNA levels of IL-27p28 and EBI3 were not detectable in the patient samples.
DISCUSSION
The main mechanism of action of most immunosuppressive drugs is to downregulate immune
responses against allo-antigen by eff ector T cells. However, it became apparent that immuno-
globulins can serve as the trigger for cytokines as i.e. IL-10 or TGF-β in the microenvironment of
T cells to induce or expand regulatory T cells.
In the present study, we explored the eff ect of immunosuppressants that hamper the IL-2
pathway, on inducible regulatory T cells by rATG. We show that rATG induce CD25 and FoxP3-
expression both in the presence and absence of tacrolimus and Daclizumab (Figure 1). These
rATG-tacrolimus CD25+ T cells have the same phenotype (Figure 1) and P38-phosphorylation
levels (Figure 2), exhibit equal suppressive activities (Figure 3) and have similar gene-expression
patterns (Figure 4) compared with rATG-induced CD25+ T cells, showing that tacrolimus does
not negatively aff ect Treg induction by rATG. The gene-expression levels of rATG-induced CD25+
T cells in the presence of tacrolimus even seem to be enhanced. When the gene-expression
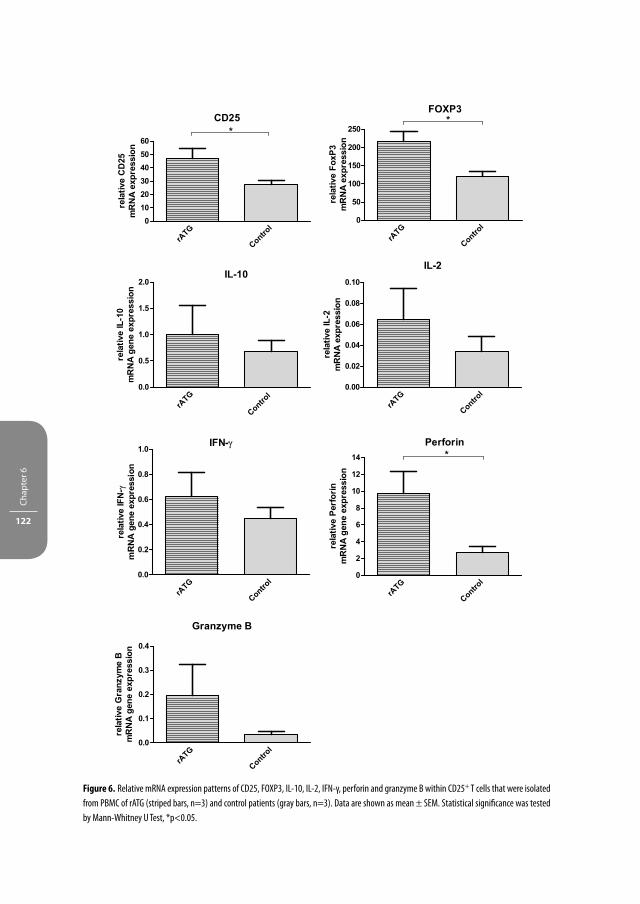
Chap
ter 6
122
Figure 6. Relative mRNA expression patterns of CD25, FOXP3, IL-10, IL-2, IFN-γ, perforin and granzyme B within CD25+ T cells that were isolated
from PBMC of rATG (striped bars, n=3) and control patients (gray bars, n=3). Data are shown as mean ± SEM. Statistical signifi cance was tested
by Mann-Whitney U Test, *p<0.05.

Induction of Regulatory T cells by rATG and Tacrolimus 123
levels were verifi ed in kidney transplant patients that received rATG-induction therapy, the in
vitro data were confi rmed (Figure 6).
As it is well known that IL-2 expands CD4+CD25brightFoxP3+ T cells in vitro23-25, the role of IL-2
in the development and homeostasis of FoxP3+ T cells with suppressive function is inconclu-
sive. Incubation of human CD4+CD25neg T cells with IL-2 does not necessarily result in induction
of CD25 or FoxP326, 27. After activation with anti-CD3/CD28 and IL-2, the FoxP3neg T cells only
transiently express FoxP3 but do not exhibit suppressive properties, showing that FoxP3 has to
be constitutively expressed to induce regulatory activity26, 28, 29. In contrary to these results, it
has been reported that FoxP3 is present in IL-2-/-, IL-2Rα-/- and IL-2Rβ-/- Treg that have regulatory
function, whereas T cells from an IL-2Rγ-/- mice do not express FoxP39. Thus in line with our
results using human cells, the direct (anti-IL-2) or indirect blockade of IL-2 (calcineurin inhibi-
tor) still permits T cell signaling by other cytokines of the common γ-chain (CD132) that may
compensate for the absence of IL-2 and may provide signals involved in the development,
homeostasis and function of regulatory T cells10. As it has been reported that blockade of the
IL-2 pathway or the expression of Th17-inducing cytokines (IL-6 and IL-23)30 may lead to the
induction of Th17 cells and not of regulatory T cells, we now show that FoxP3+regulatory T cells
are induced even in the presence of IL-2 pathway inhibitors.
Antigenic stimulation alone is suffi cient to induce conversion of conventional T cells into
regulatory T cells. This conversion even takes place at a higher rate when IL-2 is blocked, result-
ing in reduced proliferation of naïve T cells that will diff erentiate into FoxP3+ regulatory T cells31.
Regulatory T cells that can be induced in the periphery upon encounter with antigen have been
reported earlier, e.g. the FoxP3+TGF-β-producing Th3-cells and the FoxP3negIL-10-producing Tr1
cells that upregulate FoxP3 after antigen stimulation4. In our rATG-tacrolimus model, foreign
rabbit antigens may serve as TCR trigger. However, although this resulted in an increased pro-
portion of CD25, this was not associated with a higher proportion of FoxP3 positivity when the
IL-2 pathway was blocked. Thus, for the induction and development of FoxP3-expression, both
γc-cytokines and TCR stimulation are required.
Interestingly, the protein levels of other cytokines of the IL-2 family, IL-7 and IL-15 are
increased in the serum of renal allografts recipients during the early post-transplant period as
demonstrated by Simon T et al.32. These other cytokines of the IL-2 family may thus bypass the
function of IL-2 itself to facilitate a certain FoxP3 expression and may allow the induction of
regulatory T cells in the presence of a calcineurin inhibitor in vitro and in vivo as shown by our
fi ndings. IFN-γ is highly expressed by rATG-induced Treg. It has been described earlier that this
cytokine may also play a crucial role in the function of induced regulatory T cells in vivo33, 34.
Furthermore, a convincing role has been attributed to perforin and granzyme B in regulatory
T cells to mediate suppression and induce tolerance35, 36. However, the rATG- and rATG-tacro
induced Treg do not operate by cytotoxicity as shown in Figure 5E. There could be two explana-
tions for the absence of cytotoxic activity by the rATG-induced T cells. First, the frequency of
granzyme B expressing cells is lower in the rATG-induced CD4+CD25+ T cells (11% mean, Figure

Chap
ter 6
124
5C) than in cytotoxic CD8+ T cells or NK cells (40% of CD8+ T cells and 50% of NK cells after
stimulation)37. Thus, to accomplish lysis of target blasts, the frequency of granzyme B express-
ing cells should be higher. Secondly, granzyme B expression in the induced regulatory T cells
is merely a phenotypic marker of T cell activation and is not linked to cytotoxic activities (cell
granule exocytosis). The lack of correlation between granzyme B expressing PBMC in ELISPOT
and cytotoxic activities has also been found earlier by our group38 and has been shown in other
human non-cytotoxic granzyme B-expressing cells types39. In these cells and the rATG-induced
regulatory T cells, granzyme B may have other non-apoptotic functions39.
RATG-induced CD4+ and CD4+CD25+ T cells are characterized by high NFAT1-expression as
has been described by Feng et al.6. This observation clarifi es the induction of FoxP3 in these
cells, thereby conferring FOXP3-expression and regulatory activity. A disruption of the interac-
tion between FOXP3 with NFAT resulted in a graded manner with the ability of FOXP3 to repress
the expression of IL-2 and to upregulate CTLA-4 and CD2540, 41. Thus, one may speculate that by
the addition of a calcineurin inhibitor, NFAT cannot be phosphorylated and is not able to form a
complex with FoxP341, resulting in a downregulation of FOXP3. Phosphorylation of MAPK-P38,
that regulates the transcription and activation NFAT19, 20 has been shown to be necessary for the
in vitro induction of FoxP3+ regulatory T cells with TGF-β22. Our results show that the phosphory-
lation of P38 was induced in rATG-incubated cells and reached almost the same level as after
PMA-ionomycine stimulation. Considering that the NFAT and MAPK pathways interact with
each other and both pathways can be inhibited by a calcineurin inhibitor21, one would expect
that rATG-induced P38 phosphorylation is inhibited in the rATG-tacrolimus-induced Treg.
Our fi ndings show that the rATG-induced P38 phosphorylation was not inhibited in the pres-
ence of tacrolimus and FoxP3-expression was also not impaired (Figure 2B). Apparently, rATG
is such a potent stimulus of this pathway and dominates the inhibitory eff ect of tacrolimus.
Interestingly, the P38 phosphorylation level was higher within the rATG-induced CD25+ cells
than within CD25neg cells and comparable with the natural CD25+ level, showing that they are
bona fi de regulatory T cells (Figure 2C). Moreover, the suppressive capacities of rATG-tacroli-
mus-induced CD25+ T cells were the same as rATG- and natural CD25+ T cells. There are three
possible explanations for this phenomenon. Firstly, it could be that there is Ca2+-independent
transcription of IL-2 as a calcineurin inhibitor only inhibits IL-2 production for 70-80% and thus
is not the only pathway leading to proliferation42, 43, providing enough IL-2 for Treg homeosta-
sis and function. Secondly, it has been demonstrated that therapeutic levels of cyclosporine A,
do not inhibit all calcineurin that is present in the cell (only about 50%), thereby allowing strong
signals to trigger cytokine expression44-46. Thirdly, in a study with atopic dermatitis patients, the
authors reasoned that partial T cell activation to induce activation-induced cell death makes
Teff more sensitive to cyclosporine A than Treg47. This notion is supported by our fi ndings, as
tacrolimus apparently only aff ects the signaling of eff ector T cells by inhibiting their activation
and their IL-2 production. In addition, an important function of calcineurin is to prevent dele-
tion of activated T cells through the inhibition of activation-induced cell death. A CNI alleviates

Induction of Regulatory T cells by rATG and Tacrolimus 125
this inhibition by transducing a ‘stress’ activation signal into the cell that subsequently triggers
apoptosis. The stress activation signal may account for the ‘activated’ T-cell gene-expression
pattern of rATG-induced Treg in the presence of tacrolimus.
In kidney transplant patients with rATG induction therapy and CNI maintenance therapy,
regulatory T cells with the memory phenotype slowly recover after rATG-induction therapy as
reported previously7. This recovery can be attributed to homeostatic proliferation in the pres-
ence of low-dose (rabbit) antigen that triggers the output of naïve T cells by the thymus and
conversion into memory (regulatory) T cells in the periphery. The naïve and memory (regula-
tory) T cells will proliferate to refi ll the empty space. The latter phenomenon does not only
result in a recovery of regulatory T cells but may also lead to a higher regulatory T cell numbers
or FoxP3-expression compared with baseline. Indeed, in our patients the gene expression of
FoxP3 was higher than in the non-rATG control group (Figure 6).
One has to take into account that the induced FoxP3-expression in our model may not
only represent a marker for regulatory T cells, but also for T-cell activation. Our rATG-induced
CD25+ cells expressed FoxP3 at lower level (19% to 31%) than natural regulatory T cells (85%).
Furthermore, according to their mRNA-pattern they show a rather ‘activated T-cell’ phenotype.
These data emphasize that their phenotype does not fully resemble natural regulatory T
cells. However, the suppression assays show that the rATG-induced CD25+ cells and natural
regulatory T cells have comparable regulatory activities. It is therefore essential to address
whether the induced FoxP3+CD25+ T cells within the heterogeneous CD25+ T-cell population
or CD25+FoxP3neg cells exhibit suppressive activities. To date, it is not possible to study the func-
tion of human FoxP3+ T cells, because it is an intracellular marker. Thus, phenotypical analysis
or mRNA expression analysis alone is not suffi cient to classify cells into a particular T-cell subset.
It is essential to examine the function of T cells and combine these data with the phenotype
analysis as we did in the present study.
Taken together, in the present report, we show that in the presence of immunosuppressants
that indirectly inhibit IL-2 (tacrolimus) or IL-2 pathway inhibitors (anti-IL-2, anti-IL-2Rα), it is still
possible to induce regulatory T cells by rATG that are phenotypically, functionally and at the
gene-expression level identical as regulatory T cells that are induced by rATG in the absence of
these immunosuppressants. Furthermore, it remains unclear whether natural or induced regu-
latory T cells are more important in their contribution to donor-specifi c hyporesponsiveness
after transplantation. More research has to be done to characterize these rATG-induced T cells
and to fully utilize their immunosuppressive properties to promote graft-acceptance.

Chap
ter 6
126
REFERENCES
1. Waldmann, H., Adams, E., Fairchild, P. & Cobbold, S. Infectious tolerance and the long-term acceptance of transplanted tissue. Immunol Rev 212, 301-313 (2006).
2. Walker, L.S., Chodos, A., Eggena, M., Dooms, H. & Abbas, A.K. Antigen-dependent proliferation of CD4+ CD25+ regulatory T cells in vivo. J Exp Med 198, 249-258 (2003).
3. Bloom, D.D. et al. CD4+CD25+FOXP3+ regulatory T cells increase de novo in kidney transplant patients after immunodepletion with Campath-1H. Am J Transplant 8, 793-802 (2008).
4. Battaglia, M. et al. Rapamycin and interleukin-10 treatment induces T regulatory type 1 cells that mediate antigen-specifi c transplantation tolerance. Diabetes 55, 40-49 (2006).
5. Lopez, M., Clarkson, M.R., Albin, M., Sayegh, M.H. & Najafi an, N. A novel mechanism of action for anti-thymocyte globulin: induction of CD4+CD25+Foxp3+ regulatory T cells. J Am Soc Nephrol 17, 2844-2853 (2006).
6. Feng, X. et al. Rabbit ATG but not horse ATG promotes expansion of functional CD4+CD25highFOXP3+ regulatory T cells in vitro. Blood 111, 3675-3683 (2008).
7. Sewgobind, V.D. et al. The eff ect of rabbit anti-thymocyte globulin induction therapy on regulatory T cells in kidney transplant patients. Nephrol Dial Transplant 24, 1635-1644 (2009).
8. Louis, S. et al. Long-term cell monitoring of kidney recipients after an antilymphocyte globulin induc-tion with and without steroids. Transplantation 83, 712-721 (2007).
9. Fontenot, J.D., Rasmussen, J.P., Gavin, M.A. & Rudensky, A.Y. A function for interleukin 2 in Foxp3-expressing regulatory T cells. Nat Immunol 6, 1142-1151 (2005).
10. Maloy, K.J. & Powrie, F. Fueling regulation: IL-2 keeps CD4+ Treg cells fi t. Nat Immunol 6, 1071-1072 (2005).
11. Wuest, T.Y., Willette-Brown, J., Durum, S.K. & Hurwitz, A.A. The infl uence of IL-2 family cytokines on activation and function of naturally occurring regulatory T cells. J Leukoc Biol 84, 973-980 (2008).
12. Wang, H. et al. A potential side eff ect of cyclosporin A: inhibition of CD4(+)CD25(+) regulatory T cells in mice. Transplantation 82, 1484-1492 (2006).
13. Demirkiran, A. et al. Decrease of CD4+CD25+ T cells in peripheral blood after liver transplantation: association with immunosuppression. Transplant Proc 37, 1194-1196 (2005).
14. Segundo, D.S. et al. Calcineurin inhibitors, but not rapamycin, reduce percentages of CD4+CD25+FOXP3+ regulatory T cells in renal transplant recipients. Transplantation 82, 550-557 (2006).
15. Baan, C.C. et al. Diff erential eff ect of calcineurin inhibitors, anti-CD25 antibodies and rapamycin on the induction of FOXP3 in human T cells. Transplantation 80, 110-117 (2005).
16. Roederer, M. Spectral compensation for fl ow cytometry: visualization artifacts, limitations, and cave-ats. Cytometry 45, 194-205 (2001).
17. Sewgobind, V.D. et al. Functional analysis of CD4+ CD25bright T cells in kidney transplant patients: improving suppression of donor-directed responses after transplantation. Clin Transplant 22, 579-586 (2008).
18. Bustin, S.A. Absolute quantifi cation of mRNA using real-time reverse transcription polymerase chain reaction assays. J Mol Endocrinol 25, 169-193 (2000).
19. Round, J.L. et al. Scaff old protein Dlgh1 coordinates alternative p38 kinase activation, directing T cell receptor signals toward NFAT but not NF-kappaB transcription factors. Nat Immunol 8, 154-161 (2007).
20. Wu, C.C., Hsu, S.C., Shih, H.M. & Lai, M.Z. Nuclear factor of activated T cells c is a target of p38 mitogen-activated protein kinase in T cells. Mol Cell Biol 23, 6442-6454 (2003).
21. Matsuda, S. & Koyasu, S. Regulation of MAPK signaling pathways through immunophilin-ligand complex. Curr Top Med Chem 3, 1358-1367 (2003).
22. Huber, S. et al. P38 MAP kinase signaling is required for the conversion of CD4+CD25- T cells into iTreg. PLoS One 3, e3302 (2008).

Induction of Regulatory T cells by rATG and Tacrolimus 127
23. Hoff mann, P., Eder, R., Kunz-Schughart, L.A., Andreesen, R. & Edinger, M. Large-scale in vitro expansion of polyclonal human CD4(+)CD25high regulatory T cells. Blood 104, 895-903 (2004).
24. Elpek, K.G. et al. Ex vivo expansion of CD4+CD25+FoxP3+ T regulatory cells based on synergy between IL-2 and 4-1BB signaling. J Immunol 179, 7295-7304 (2007).
25. Hoff mann, P. et al. Only the CD45RA+ subpopulation of CD4+CD25high T cells gives rise to homoge-neous regulatory T-cell lines upon in vitro expansion. Blood 108, 4260-4267 (2006).
26. Wang, J., Ioan-Facsinay, A., van der Voort, E.I., Huizinga, T.W. & Toes, R.E. Transient expression of FOXP3 in human activated nonregulatory CD4+ T cells. Eur J Immunol 37, 129-138 (2007).
27. Zorn, E. et al. IL-2 regulates FOXP3 expression in human CD4+CD25+ regulatory T cells through a STAT-dependent mechanism and induces the expansion of these cells in vivo. Blood 108, 1571-1579 (2006).
28. Allan, S.E. et al. Activation-induced FOXP3 in human T eff ector cells does not suppress proliferation or cytokine production. Int Immunol 19, 345-354 (2007).
29. Zhou, X. et al. Instability of the transcription factor Foxp3 leads to the generation of pathogenic memory T cells in vivo. Nat Immunol 10, 1000-1007 (2009).
30. Kimura, A., Naka, T. & Kishimoto, T. IL-6-dependent and -independent pathways in the development of interleukin 17-producing T helper cells. Proc Natl Acad Sci U S A 104, 12099-12104 (2007).
31. Kretschmer, K. et al. Inducing and expanding regulatory T cell populations by foreign antigen. Nat Immunol 6, 1219-1227 (2005).
32. Simon, T. et al. The eff ect of ATG on cytokine and cytotoxic T-lymphocyte gene expression in renal allograft recipients during the early post-transplant period. Clin Transplant 17, 217-224 (2003).
33. Levings, M.K. et al. IFN-alpha and IL-10 induce the diff erentiation of human type 1 T regulatory cells. J Immunol 166, 5530-5539 (2001).
34. Wood, K.J. & Sawitzki, B. Interferon gamma: a crucial role in the function of induced regulatory T cells in vivo. Trends Immunol 27, 183-187 (2006).
35. Grossman, W.J. et al. Human T regulatory cells can use the perforin pathway to cause autologous target cell death. Immunity 21, 589-601 (2004).
36. Gondek, D.C. et al. Transplantation survival is maintained by granzyme B+ regulatory cells and adap-tive regulatory T cells. J Immunol 181, 4752-4760 (2008).
37. Bratke, K., Kuepper, M., Bade, B., Virchow, J.C., Jr. & Luttmann, W. Diff erential expression of human granzymes A, B, and K in natural killer cells and during CD8+ T cell diff erentiation in peripheral blood. Eur J Immunol 35, 2608-2616 (2005).
38. van Besouw, N.M. et al. The granzyme B and interferon-gamma enzyme-linked immunospot assay as alternatives for cytotoxic T-lymphocyte precursor frequency after renal transplantation. Transplanta-tion 79, 1062-1066 (2005).
39. Romero, V. & Andrade, F. Non-apoptotic functions of granzymes. Tissue Antigens 71, 409-416 (2008). 40. Mantel, P.Y. et al. Molecular mechanisms underlying FOXP3 induction in human T cells. J Immunol 176,
3593-3602 (2006). 41. Wu, Y. et al. FOXP3 controls regulatory T cell function through cooperation with NFAT. Cell 126, 375-
387 (2006). 42. Roifman, C.M., Mills, G.B., Cheung, R.K. & Gelfand, E.W. Mitogenic response of human thymocytes:
identifi cation of functional Ca2+-dependent and independent signals. Clin Exp Immunol 66, 139-149 (1986).
43. Schwarz, E.C. et al. Calcium dependence of T cell proliferation following focal stimulation. Eur J Immu-nol 37, 2723-2733 (2007).
44. Nikolic, B., Zhao, G., Swenson, K. & Sykes, M. A novel application of cyclosporine A in nonmyeloabla-tive pretransplant host conditioning for allogeneic BMT. Blood 96, 1166-1172 (2000).
45. Furtado, G.C., Curotto de Lafaille, M.A., Kutchukhidze, N. & Lafaille, J.J. Interleukin 2 signaling is required for CD4(+) regulatory T cell function. J Exp Med 196, 851-857 (2002).

Chap
ter 6
128
46. Akl, A., Luo, S. & Wood, K.J. Induction of transplantation tolerance-the potential of regulatory T cells. Transpl Immunol 14, 225-230 (2005).
47. Brandt, C., Pavlovic, V., Radbruch, A., Worm, M. & Baumgrass, R. Low-dose cyclosporine A therapy increases the regulatory T cell population in patients with atopic dermatitis. Allergy 64, 1588-1596 (2009).


Cha pter 7The Jak Inhibitor CP-690,550 Preserves the Function
of CD4+CD25brightFoxP3+ Regulatory T Cells and Inhibits Eff ector T Cells
Manuscript submitted
Varsha D.K.D. Sewgobind1,2, Monique E. Quaedackers1, Luc J.W. van der Laan2,
Rens Kraaijeveld1, Gary Chan3, Willem Weimar1 and Carla C. Baan1
Departments of 1Internal Medicine and 2Surgery
Erasmus MC, University Medical Center Rotterdam, the Netherlands3Pfi zer, Clinical R&D, New London, CT, USA
Chap
ter 7
132
ABSTRACT
The Janus kinase (jak) inhibitor CP-690,550 inhibits alloreactivity and is currently being
investigated for prevention of allograft rejection after transplantation. In this study,
we examined the eff ect of CP-690,550 on IL-2-mediated Jak/STAT5 phosphorylation by
CD4+CD25brightFoxP3+CD127-/low T cells (Treg) and CD4+CD25neg eff ector T cells (Teff ) in kidney
transplant patients. Phospho-specifi c fl ow cytometry was used to study the eff ect of CP-690,550
on IL-2-induced intracellular Signal Transducer and Activator of Transcription (STAT) 5-phos-
phorylation. IL-2 induced phosphorylation of STAT5 (P-STAT5) in both Treg and Teff , which was
signifi cantly higher for CD4+CD25bright Treg (increased by 71%, mean) than for CD4+CD25neg
Teff (increased by 42%). In the presence of 100 ng/mL CP-690,550, a clinically relevant exposure,
IL-2 induced P-STAT5 was partially inhibited in CD4+CD25bright Treg (% inhibition; 51%), while
almost blocked in the Teff (% inhibition; 84%, p=0.03). The IC50 was 2-3 times higher for Treg
(104 ng/mL) than for Teff (40 ng/mL, p=0.02). In the presence of CP-690,550, Treg exhibited
additional suppressive activities on the alloactivated proliferation of Teff (% inhibition; 56%,
mean). In addition, CD4+CD25bright Treg from kidney transplant patients receiving CP-690,550
vigorously suppressed the proliferation of Teff (% inhibition; 87%). Our fi ndings show that the
Jak inhibitor CP-690,550 eff ectively inhibits Teff function but preserves the suppressive activity
of CD4+CD25bright regulatory T cells.

The Jak Inhibitor CP-690,550 and Regulatory T Cells 133
INTRODUCTION
After organ transplantation, alloreactivity is triggered by antigen-presenting cells that activate
T cells via three signals: I. via the T-cell receptor, II. via co-stimulation and III. via the cytokine
signal1. The cytokine signal is important in the mediation of growth signals to the cell and
activates a signaling cascade that is transduced via the Janus family of kinases (Jaks). Cytokines
of the IL-2 family exert their biological functions through Jak molecules 1 and 3 and via STAT
(signal transducer and activator of transcription) transcription factors. Phosphorylation of
Jaks results in recruitment of STAT molecules to the receptor. Subsequently, STAT molecules
dimerize and then translocate into the nucleus, leading to gene transcription. These molecules
regulate multiple aspects of T-cell diff erentiation and function. Therefore, Jaks have emerged as
targets for drug development to block T-cell growth, diff erentiation, activation, and to suppress
alloreactivity2-4.
T-cell receptor triggering and IL-2/IL-15 stimulation induce FoxP3-expression in both
antigen-specifi c adaptive CD4+CD25+ regulatory T cells (Treg) and in CD4+CD25neg eff ector
T cells that requires STAT5-signaling5, 6. However, FoxP3+ regulatory T cells are distinct from
activated FoxP3+ eff ector T cells by their stable and constitutive expression of FoxP3 and by
their suppressive capacities. It has been reported that STAT5-/- mice have a dramatic reduction
in Treg7 and blockade of STAT5b in mice or a mutation in the STAT5b gene in humans results in
decreased accumulation and regulatory function of CD4+CD25bright T cells8. The IL-2Rβ-chain,
Jak3 and STAT5 are also essential for Treg development and maintenance9, 10.
The Jak inhibitor CP-690,550 is being developed for clinical organ transplantation in a cal-
cineurin (CNI)-free protocol. CP-690,550 has been shown to be a potent immunosuppressive
agent in inhibiting alloreactivity in various (animal) experimental models11-13. In a prospec-
tive Phase I study, we demonstrated that the number of peripheral blood CD4+CD25+ Treg
decreased in kidney transplant patients after CP-690,550 treatment14. The regulatory capacities
of the residual Treg remained unchanged during treatment.
The immunomodulatory eff ect of CP-690,550 on T cells can be directly measured by the
detection and quantifi cation of cytokine-induced STAT5 phosphorylation in a fl ow cytomet-
ric assay15. In this study, we investigated whether there is a diff erential inhibitory eff ect of
CP-690,550 on IL-2-activated STAT5 phosphorylation in Teff and Treg. Moreover, we analyzed
the proliferative function of Teff and the suppressive activity of CD25bright T cells in kidney
transplant patients who were part of a Phase II trial and received CP-690,550 therapy in com-
bination with basiliximab induction therapy, mycophenolate mofetil (MMF) and prednisolone.
These results were compared with a control group consisting of kidney transplant patients who
received cyclosporine instead of CP-690,550.

Chap
ter 7
134
MATERIALS & METHODS
Whole blood staining for P-STAT5 in the presence of IL-2
Whole blood samples (200 μL) were freshly obtained from healthy individuals (n=4) and stimu-
lated with culture medium (RPMI-1640) containing IL-2 at a fi nal concentration of 2000 IU/mL
(130 ng/mL) and incubated for 30 min at 37 ºC. Cells were lysed and fi xed by adding Lyse/Fix
Buff er (BD Biosciences, San Jose, CA) to the tubes at a fi nal concentration of 2% and incubated
for 10 min at 37ºC. Next, cells were washed in staining buff er (fl ow buff er with 0.5% bovine
serum albumin (BSA) and permeabilised with cold 70% methanol for 30 min on ice. Cells were
washed twice in staining buff er and resuspended in 25 μL staining-buff er.
IL-2 induced phosphorylation of STAT5 in diff erent T-cell subpopul ations was determined by
fi ve color fl ow cytometry using antibodies directly conjugated to phycoerythrin (PE), phycoery-
thrin-Cy7 (PE-Cy7) Peridinin chlorophyll protein (PerPC), allophycocyanin (APC) and Pacifi c Blue
(PB). Cells were simultaneously incubated for 30 min with the following antibodies according to
manufacturer’s specifi cations: P-STAT5 (Y694)-PE, FoxP3-APC (clone PCH101, eBiosciences, San
Diego, CA), CD3-PERCP, CD4-PB, CD25-PE-Cy7 epitope B (clone M-A251, BD Biosciences, San
Jose, CA) and CD127-FITC. Cells were then washed in fl ow buff er and analyzed on a FACSCanto
II fl ow cytometer (BD Biosciences, San Jose, CA) for data analysis. Twenty thousand gated lym-
phocyte events were acquired from each tube. Median fl uorescent intensity values (MFI) were
generated by analyzing the data with Diva 6.0 software (BD Biosciences, San Jose, CA). The
eff ect of IL-2 on STAT5 phosphorylation was calculated by the percentage P-STAT5-PE positive
cells or the median fl uorescence intensity of P-STAT5-PE of the IL-2 stimulated sample minus
the unstimulated sample (background). Fluorescence Minus One (FMO) controls and unstained
control tubes were also included.
Whole blood staining for P-STAT5 after pre-incubation with CP-690,550
Whole blood samples (200 μL) were pre-incubated for 60 min with culture medium containing
CP-690,550 at a fi nal concentration of 1, 2.5, 10, 25, 50, 100, 250 or 1000 ng/mL (provided by
Pfi zer Inc, New London, CT). Next, cells were incubated in culture medium containing IL-2 (130
ng/mL) and then the phosphofl ow cytometry protocol as described above was performed. The
percentage of inhibition of STAT5 phosphorylation was calculated at each concentration of
CP-690,550 and expressed as a percentage of the IL-2-induced STAT5 phosphorylation. Sigmoid
curves were drawn using Graphpad Prism (v.5.02) and IC50 was calculated.
Patients
Kidney transplant patients who were part of a Phase II trial (A3921030) were included in this
study. Patients (n=4) in the study group received 15 mg CP-690,550 twice daily (B.I.D) for at least
90 days after transplantation and received maintenance therapy consisting of mycophenolate
mofetil (MMF, Cellcept, Roche Laboratories, New Jersey) 500 to 1000 mg B.I.D and prednisolone

The Jak Inhibitor CP-690,550 and Regulatory T Cells 135
5 to 7.5 mg daily. Patients in the comparative group (n=3) received cyclosporine (Neoral,
Novartis Pharma BV, Basel), MMF and prednisolone. Patients in both groups received 20 mg of
basiliximab anti-CD25 monoclonal antibody induction therapy on the day of transplantation
and on day 4 after transplantation. After informed consent was obtained from the participating
patient, heparin tubes with blood were obtained 1 day before and 56 days after transplanta-
tion. The medical ethical committee of the Erasmus MC, Rotterdam approved the study.
Isolation of Peripheral Blood Lymphocytes for functional studies
Peripheral blood mononuclear cells (PBMC) were isolated by density gradient centrifugation
over Ficoll-paque from buff y coats of healthy blood bank donors (n=6, Sanquin Blood Bank,
Rotterdam, the Netherlands) and from heparinized blood of kidney transplant patients (n=7).
PBMC were then frozen in 10% DMSO enriched RPMI 1640 medium (BioWhittaker, Verviers,
Belgium) and stored at -140˚C.
Isolation of human CD25bright T cells from peripheral blood of healthy individuals
PBMC were thawed and resuspended in 10% Human Culture Medium (HCM), which consisted
of RPMI 1640 medium with L-glutamine (Bio Whittaker) supplemented with 10% pooled human
serum, 100 IU/mL penicillin and 100 μg/mL streptomycin (Gibco BRL). CD25bright T cells were
isolated from PBMC after incubation with anti-CD25 microbeads, (Miltenyi Biotech, Bergisch
Gladbach, Germany) followed by positive selection (POSSELD-program) on the autoMACS
(Miltenyi Biotech). The untouched residual fraction consisted of > 98% CD25-/dim Teff and was
used as responder population in the suppression assays. Both fractions were stained with CD4-
PERCP (BD Biosciences) and CD25-PE epitope B (clone M-A251, BD Biosciences) and the purity
of CD25bright was determined by fl ow cytometry (> 90%).
Isolation of human CD25bright T cells from peripheral blood of kidney transplant patients
All patients in the CP-690,550 group (n=4) and in the cyclosporine group (n=3) were treated
with basiliximab anti-CD25 induction therapy, MMF and prednisone maintenance therapy.
Anti-CD25 induction therapy caused shedding of the IL-2Rα-complex. Therefore, it was not
possible to isolate the CD25bright T cells on epitope A. To recover the CD25-expression on T
cells, PBMC were rested overnight in HCM with low dose IL-2 (5 ng/mL). After 24 hr, the CD25-
expression recovered to normal levels (Figure 4) and the CD25bright T cells, consisting of 85%
FoxP3+ T cells, could be isolated according to the protocol described above.
Mixed lymphocyte reactions
The eff ect of CP-690,550 on the proliferative capacity of CD25-/dim Teff from healthy individuals
was studied by mixed lymphocyte reaction. The CD25bright T cells were depleted from PBMC
and the residual CD25-/dim T cells were activated with irradiated (40 Gy) HLA mismatched

Chap
ter 7
136
(2-2-2) PBMC as stimulator cells (1x10⁵ cells/100 μL) in the presence of various CP-690,550
concentrations (10, 25, 50, 100, 250, 500 and 1000 ng/mL).
The function of CD25bright cells of healthy individuals was analyzed by their ability to inhibit
the proliferative response of alloantigen-activated CD25-/dim Teff . The CD25-/dim Teff were co-
cultured in triplicate with and without CD25bright T cells. Irradiated (40 Gy) HLA mismatched
(2-2-2) PBMC were used as stimulator cells (1x10⁵ cells/100 μL) and co-cultured with 5x10⁴
cells/100 μL of a mixture of CD25bright : CD25-/dim at an 1:5 ratio in round-bottom 96-well
plates (Nunc, Roskilde, Denmark). Suppression assays with PBMC of healthy individuals were
performed in the presence of 50 and 100 ng/mL CP-690,550 to study the eff ect of CP-690,550
on Treg function.
Suppression assays with PBMC of kidney transplant patients (n=7) were performed in the
same manner as described above but now only in the presence of 100 ng/mL CP-690,550 or
100 ng/mL cyclosporine. There were two reasons for choosing these concentrations. First, the
CP-690,550 Phase I study showed that trough plasma levels after CP-690,550 oral administra-
tion stabilized at 50 to 100 ng/mL in kidney transplant patients who received CP-690,550 30 mg
B.I.D. Secondly, from the MLRs of healthy individuals, it became apparent that the proliferative
responses of Teff exposed to CP-690,550 concentrations above 100 ng/mL were not utilizable
as a read-out for Treg function in the suppression assay (mean cpm<1000).
After incubation for 7 days at 37°C in a humidifi ed atmosphere of 5% CO2, the proliferation
was measured after 3H-thymidine (0.5 μCi/well: Amersham Pharmacia Biotech) incubation dur-
ing the last 16 hr before harvesting. The median counts per minute (cpm) for each triplicate was
determined and the level of suppression of the CD25-/dim Teff by CD25bright T cells was calculated
and expressed as the percentage inhibition of the Teff .
Statistical analysis
Statistical analysis was performed using Graphpad Prism (v.5.02). To test whether there is a
normal distribution, the Kolmogorov-Smirnov Test was used. For determination of the levels
of statistical signifi cance, the two-sided probability values according to the Wilcoxon matched
pairs test or Mann Whitney U Test were used. P values < 0.05 were considered statistically
signifi cant, without correction for multiple comparisons.
RESULTS
IL-2 induced STAT5 phosphorylation in CD4+CD25neg, CD4+CD25dim and CD4+CD25bright T cells in the absence and presence of CP-690,550
Activation of the Jak-STAT5 signaling pathway after IL-2 stimulation was examined in the
CD4+CD25neg, CD4+CD25dim and CD4+CD25bright T-cell subsets in freshly obtained peripheral
whole blood samples from healthy individuals. Approximately 57% (mean) of CD4+ T cells

The Jak Inhibitor CP-690,550 and Regulatory T Cells 137
were CD25neg T cells (of which 0.9% was FoxP3+), 38% were CD25dim T cells (8% FoxP3+) and 5%
were CD25bright T cells (84% FoxP3+, Figure 1A). Of all CD4+CD25brightFoxP3+ T cells, 90% were
CD127-/low. After 30 min of IL-2 stimulation, the percentage of P-STAT5 markedly increased in
the CD25-positive subsets, a typical example of STAT5 phosphorylation is shown in Figure 1B.
The highest proportions of P-STAT5 were found within the CD25bright T cells (mean % P-STAT5
within CD25dim: from 4 to 71%, and within CD25bright: from 12 to 83%, Figure 1C). STAT5 mol-
ecules were also phosphorylated in the CD25neg T cells (from 1 to 43%). Analogous data were
obtained when the median fl uorescence intensities (MFI) of P-STAT5 were analyzed in all CD4+
T-cell subsets (MFI of P-STAT5 within CD25neg: from 213 to 655, CD25dim: from 225 to 1108 and
CD25bright: from 200 to 1270, Figure 1D).
CD25dim
CD
25
38%
FoxP
3 Fo
xP3
CD4
FoxP
3
CD4
84%
8%
Isotype controlIg
G2a
CD4CD4
0.9%
1% 5% CD25bright
CD25neg 57%
CD4
P-ST
AT5
- IL2
+ IL2
2% 4% 12%
43%
CD25neg CD25dim CD25bright
70% 83%
213 225 200
655 1108 1270
CD4
A
B
Figure 1. IL-2 induced STAT5 phosphorylation
(A) Representative example of CD25-expression within CD4+ T cells and FoxP3-expression within the CD4+CD25neg, CD4+CD25dim and
CD4+CD25bright T cells. Gates for FoxP3-positivity are set on the isotype control (IgG2a) control. Percentages positive cells are shown within
the gates. (B) The percentage P-STAT5 within CD4+CD25neg, CD4+CD25dim and CD4+CD25bright T cells is analyzed after phospho-specifi c fl ow
cytometry on whole blood samples. Percentage positive cells are shown in the left corner of the FACS plots and median fl uorescence intensity
(MFI) is shown in the right corner.

Chap
ter 7
138
To study the eff ect of CP-690,550 on STAT5-phosphorylation and the activation status of the
CD4+CD25neg, CD4+CD25dim and CD4+CD25bright T cells, whole blood was preincubated with increas-
ing concentrations of CP-690,550 followed by IL-2 stimulation. A representative example of the
phosphofl ow cytometry of the IL-2 induced P-STAT5 and the inhibition of CP-690,550 is depicted in
Figure 2A. The IL-2 induced P-STAT5 was partially inhibited in the presence of 100 ng/mL CP-690,550
-IL-2
neg
CD25-IL
-2
dim
CD25 -IL
-2
bright
CD25 +I
L-2
neg
CD25+IL
-2
dim
CD25+IL
-2
bright
CD25
0
25
50
75
100
- IL-2 + IL-2
** *** ****
% P
-STA
T5(m
ean
SEM
)
-IL-2
neg
25 -IL
-2
dim
D25 -IL
-2
bright
25
+IL-2
neg
25 +I
L-2
dim
D25 +I
L-2
bright
25CD C CD CD C CD
0
250
500
750
1000
1250
+ IL-2- IL-2
** *** ****
MFI
P-S
TAT5
(mea
n S
EM)
D
C
Figure 1. IL-2 induced STAT5 phosphorylation (continued)
(C) Percentages P-STAT5 positive cells and (D) median fl uorescence intensities of P-STAT5 are shown within CD4+CD25neg, CD4+CD25dim and
CD4+CD25bright T cells of n=4 patients. Mean ± SEM are depicted. Diff erences are statistically tested by Mann-Whitney U Test or Wilcoxon matched
pairs Test. *p<0.05, **p<0.01.

The Jak Inhibitor CP-690,550 and Regulatory T Cells 139
(Figure 2B, mean %P-STAT5: CD25neg; from 37 to 6%, CD25dim: from 70 to 16% and CD25bright: from
81% to 40%) and almost fully inhibited (>95%) in the presence of 1000 ng/mL. Inhibition of P-STAT5
levels in unstimulated cells was not observed, showing that there is no basal level of P-STAT5 in fresh
whole blood cells (Figure 2B). CP-690,550 was able to inhibit the P-STAT5 levels in the three subsets
of all blood samples in a dose-dependent manner (Figure 2B). However, IC50 was signifi cantly higher
in CD25bright T cells (104 ng/mL, mean), compared with CD25dim (45 ng/mL, p<0.05) and CD25neg T
cells (40 ng/mL, p<0.05, Figure 2C). The same results were found with the MFI of P-STAT5 (CD25neg:
from 614 to 262, CD25dim: from 1044 to 369 and CD25bright: from 1212 to 677, Figure 2D and mean
IC50 CD25bright: 90 ng/mL vs. CD25dim: 37 ng/mL, p<0.05, vs. CD25neg: 35 ng/mL, p<0.05, Figure 2E).
+CP 1000 ng/mL
1% 3% 5% 245 260 310
+IL-2
+CP 100 ng/mL
43% 655 70% 83%
7% 16% 40%
1270
262 369 677
1108
CD25neg CD25dim CD25bright
CD4
P-ST
AT5
0+1
000 0 +1 +2
.5 +10 +25
+50+10
0+2
50+10
000
25
50
75
100
+IL-2-IL-2CD25bright
CD25dim
CD25neg
**
*
*
*
** ** * *
*
CP [ng/mL]
% P
-STA
T5(m
ean
SEM
)
A
B
Figure 2. The eff ect of CP-690,550 on IL-2 induced STAT5 phosphorylation
(A) Flow cytometric example of IL-2-induced STAT5 phosphorylation in CD4+CD25neg, CD4+CD25dim and CD4+CD25bright in the absence and
presence of 100 ng/mL and 1000 ng/mL CP-690,550. (B) Percentage positive cells of P-STAT5 at increasing doses of CP-690,550 are shown within
CD4+CD25neg, CD4+CD25dim and CD4+CD25bright for n=4 patients. Mean ± SEM are shown at each dose.

Chap
ter 7
140
% IH PSTAT5
1 10 100 1000 100000
25
50
75
100
CD25bright
CD25dim
CD25neg
104
40
45
IC50
CP [ng/mL]
% IH
of P
STAT
5*
*
0+1
000 0 +1 +2
,5 +10
+25
+50+1
00+2
50+1
000
0
500
1000
1500
2000+IL-2-IL-2
CD25bright
CD25dim
CD25neg
**
*
**
**
* * *
**
CP [ng/mL]
MFI
P-S
TAT5
(mea
n S
EM)
% IH PSTAT5 (median)
1 10 100 1000 100000
25
50
75
100
CD25bright
CD25dim
CD25neg
90
35
37
IC50
**
CP [ng/mL]
% IH
of P
STAT
5
C
D
E
Figure 2. The eff ect of CP-690,550 on IL-2 induced STAT5 phosphorylation (continued)
(C) Sigmoid curves with percentage inhibition of P-STAT5 by CP-690,550 calculated on the percentage STAT5 positive cells. The IC50
is shown for
the CD25neg, CD25dim and CD25bright T cells within CD4+ T cells. (D) Median fl uorescence intensities of P-STAT5 at increasing doses of CP-690,550.
(E) Sigmoid curve with percentage inhibition of P-STAT5 by CP-690,550 calculated on the median fl uorescence intensities. *p<0.05.

The Jak Inhibitor CP-690,550 and Regulatory T Cells 141
The eff ect of CP-690,550 on the function of Teff and Treg from healthy individuals
To study the eff ect of CP-690,550 on the proliferation of alloactivated CD25-/dim Teff from
healthy individuals, MLRs were performed. Teff were stimulated with allo-antigen for 7 days in
the presence of increasing concentrations of CP-690,550, ranging from 1 to 1000 ng/mL. Start-
ing at 50 ng/mL, CP-690,550 inhibited alloreactivity by Teff in a dose-dependent manner (mean
percentage inhibition at 50 ng/mL: 77%, 100 ng/mL: 87%, 250 ng/mL: 94%, 500 ng/mL: 95%
and 1000 ng/mL: 96%, Figure 3A). The regulatory activities of CD25bright T cells in the presence
of CP-690,550 were analyzed by suppression assays in which CD25bright T cells were co-cultured
with the Teff at a ratio of 1 to 10, respectively. The suppression assays were performed in the
presence of 50 or 100 ng/mL CP-690,550. These concentrations were most appropriate because
the maximal drug eff ect on Treg could be achieved as the Teff proliferation was not completely
inhibited. In the absence of CP-690,550, the proliferative response of allo-antigen stimulated
Teff was signifi cantly lower when cocultured with CD25bright T cells (cpm: [CD25-/dim] 31627
A B
DC
Figure 3. Functional assays with cells of healthy individuals
(A) Dose-response curve for the inhibition of proliferation of alloactivated CD25-/dim T cells by CP-690,550 in the MLR. The proliferation of CD25-/
dim T cells is shown in counts per minute (cpm) (B) Suppression assay in which alloactivated CD25-/dim T cells are cocultured without and with
CD25bright T cells. The proliferation is shown at a [CD25-/dim : CD25bright] ratio of 10:1. (C) Suppression assay in the presence of 50 ng/mL CP-690,550
and (D) 100 ng/mL CP-690,550. Data are shown for n=6 healthy individuals. Error bars represent mean ± SEM. Diff erences are statistically tested
by the Mann-Whitney U Test, *p<0.05.

Chap
ter 7
142
and [CD25-/dim + CD25bright] 9361, p<0.05, Figure 3B). In the presence of the aforementioned
CP-690,550 concentrations, Treg exerted suppression of the proliferation by Teff in response
to alloantigens (cpm at 50 ng/mL: [CD25-/dim] 7783 and [CD25-/dim + CD25bright] 3625, p<0.05
and at 100 ng/mL [CD25-/dim] 6674 and [CD25-/dim + CD25bright] 2969, p<0.05, Figure 3C and D).
These results suggest that Teff (77-87%) are more sensitive to the eff ect of clinically relevant
CP-690,550 levels than Treg (23-13% decrease in function).
The function of Teff and Treg from kidney transplant patients treated with CP-690,550
As CP-690,550 preserves Treg suppressive function in vitro, we next questioned what the eff ect
of CP-690,550 would be on PBMC of kidney transplant patients who were treated with this
agent. Pre- and post-transplant (56 days) PBMC were collected from 7 kidney transplant patients
who were part of a controlled Phase II study, with cyclosporine as comparator. All patients in
the CP-690,550 group (n=4) and in the cyclosporine group (n=3) were treated with basiliximab
anti-CD25 induction therapy, MMF and prednisone maintenance therapy. This anti-CD25 induc-
tion therapy post-transplant caused shedding of the IL-2Rα-complex, which makes isolation of
CD25bright T cells impossible. To recover the CD 25-expression of the basiliximab-treated patients
for isolation, PBMC were rested overnight in culture medium containing 5 ng/mL IL-2. After 24 hr,
the CD25-expression recovered to common levels (Figure 4) and the CD25bright T cells (consisting
of 85% FoxP3+ T cells) could then be isolated. Previously, we have shown that anti-CD25 mAb
therapy does not negatively aff ect FoxP3 protein expression and CD25bright T-cell function 16.
The proliferative capacity of Teff was studied by depletion of CD25bright T cells from the PBMC.
The proliferation in response to alloantigens was signifi cantly lower post-transplantation in both
groups, (cpm: 13073 pre-transplant to 4057 post-transplant within the CP-690,550 group, and
to 3219 post-transplant within the cyclosporine treated group, Figure 5A). The functionality of
post-transplant CD4+ T cells
post-transplant CD4+ T cells
CD
25
CD4
3% 14%
Figure 4. CD25 expression on CD4+ T cells of kidney transplant patients treated with basiliximab
CD25-expression disappeared after treatment (left plot). CD25-expression recovered after overnight incubation of PBMC in culture medium with
5 ng/mL IL-2 (right plot).

The Jak Inhibitor CP-690,550 and Regulatory T Cells 143
the suppressor cells was studied in conventional suppression assays. Pre-transplant CD25bright
T cells were able to nearly completely suppress the proliferation of pre-transplant Teff at a
Treg-to-Teff ratio of 1:5 (cpm: [CD25-/dim] 13073 and [CD25-/dim + CD25bright] 500, percentage
inhibition: 96%, Figure 5B).
We studied the eff ect of CP-690,550 on Treg function by adding this compound at various
concentrations to our system. This was done to be absolutely certain of the maximal drug eff ect
and to minimize the infl uence of other drugs on the PBMC of the patients in vivo. Clinically
relevant levels of CP-690,550 or cyclosporine were added to the suppression assays on day
0. Considering that the post-transplant Teff showed a low proliferative response (Figure 5A),
we chose to use the pre-transplant Teff as a read-out for post-transplant Treg function in the
suppression assay. The proliferation of pre-transplant Teff decreased when CP-690,550 was
added to the MLR (Figure 5C). When post-transplant CD25bright T cells isolated from CP-690,550-
treated patients were co-cultured with pre-transplant Teff exposed to CP-690,550, the prolifera-
tion was further inhibited (percentage inhibition; 85%, Figure 5C). The same set of experiments
was carried out with PBMC from patients of the cyclosporine group. As shown in Figures 5A
and D, there was a decrease in the proliferation of the pre-transplant Teff in the presence of
A
B
Figure 5. Functional assays with cells of kidney transplant patients
(A) Proliferation of alloactivated CD25-/dim T cells of pre-Tx of all patients (white bar) and post-Tx from patients of the CP-690,550 group (striped
bar) and of the cyclosporine group (squared bar). (B) Suppression assay in which alloactivated CD25-/dim T cells of pre-Tx are cocultured with Treg
(CD25bright T cells) of pre-Tx at a 5 to 1 ratio.

Chap
ter 7
144
cyclosporine. Post-transplant CD25bright T cells from cyclosporine-treated patients were able to
further inhibit these responses (percentage inhibition; 89%).
When the percentage of inhibition was calculated, there was neither a diff erence between
the suppressive capabilities post-transplant CD25bright T cells and pre-transplant CD25bright T
cells nor did we fi nd signifi cant diff erences between the groups (percentage inhibition pre-
transplant vs. post-transplant CP-690,550 group: 94% vs. 85% and cyclosporine group: 97% vs.
89%, Figure 5E).
C
D
E
Figure 5. (continued) (C) Suppression assay of PBMC from patients in the CP-690,550 group in which CD25-/dim T cells of pre-Tx are cocultured
with Treg (CD25bright T cells) of post-Tx at a 5 to 1 ratio in the presence of 100 ng/mL CP-690,550. (D) Suppression assay of PBMC from patients in
the cyclosporine group in which CD25-/dim T cells of pre-Tx are cocultured with Treg (CD25bright T cells) of post-Tx at a 5 to 1 ratio in the presence
of 100 ng/mL cyclosporine. (E) Percentage inhibition of the proliferative response of pre-Tx CD25-/dim by pre-Tx and post-Tx Treg of both groups.
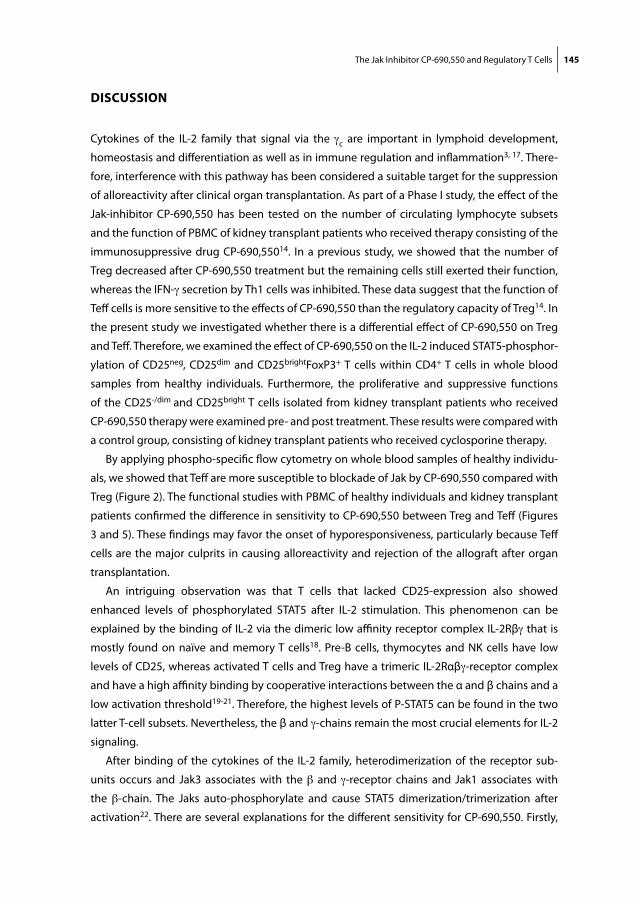
The Jak Inhibitor CP-690,550 and Regulatory T Cells 145
DISCUSSION
Cytokines of the IL-2 family that signal via the γc are important in lymphoid development,
homeostasis and diff erentiation as well as in immune regulation and infl ammation3, 17. There-
fore, interference with this pathway has been considered a suitable target for the suppression
of alloreactivity after clinical organ transplantation. As part of a Phase I study, the eff ect of the
Jak-inhibitor CP-690,550 has been tested on the number of circulating lymphocyte subsets
and the function of PBMC of kidney transplant patients who received therapy consisting of the
immunosuppressive drug CP-690,55014. In a previous study, we showed that the number of
Treg decreased after CP-690,550 treatment but the remaining cells still exerted their function,
whereas the IFN-γ secretion by Th1 cells was inhibited. These data suggest that the function of
Teff cells is more sensitive to the eff ects of CP-690,550 than the regulatory capacity of Treg14. In
the present study we investigated whether there is a diff erential eff ect of CP-690,550 on Treg
and Teff . Therefore, we examined the eff ect of CP-690,550 on the IL-2 induced STAT5-phosphor-
ylation of CD25neg, CD25dim and CD25brightFoxP3+ T cells within CD4+ T cells in whole blood
samples from healthy individuals. Furthermore, the proliferative and suppressive functions
of the CD25-/dim and CD25bright T cells isolated from kidney transplant patients who received
CP-690,550 therapy were examined pre- and post treatment. These results were compared with
a control group, consisting of kidney transplant patients who received cyclosporine therapy.
By applying phospho-specifi c fl ow cytometry on whole blood samples of healthy individu-
als, we showed that Teff are more susceptible to blockade of Jak by CP-690,550 compared with
Treg (Figure 2). The functional studies with PBMC of healthy individuals and kidney transplant
patients confi rmed the diff erence in sensitivity to CP-690,550 between Treg and Teff (Figures
3 and 5). These fi ndings may favor the onset of hyporesponsiveness, particularly because Teff
cells are the major culprits in causing alloreactivity and rejection of the allograft after organ
transplantation.
An intriguing observation was that T cells that lacked CD25-expression also showed
enhanced levels of phosphorylated STAT5 after IL-2 stimulation. This phenomenon can be
explained by the binding of IL-2 via the dimeric low affi nity receptor complex IL-2Rβγ that is
mostly found on naïve and memory T cells18. Pre-B cells, thymocytes and NK cells have low
levels of CD25, whereas activated T cells and Treg have a trimeric IL-2Rαβγ-receptor complex
and have a high affi nity binding by cooperative interactions between the α and β chains and a
low activation threshold19-21. Therefore, the highest levels of P-STAT5 can be found in the two
latter T-cell subsets. Nevertheless, the β and γ-chains remain the most crucial elements for IL-2
signaling.
After binding of the cytokines of the IL-2 family, heterodimerization of the receptor sub-
units occurs and Jak3 associates with the β and γ-receptor chains and Jak1 associates with
the β-chain. The Jaks auto-phosphorylate and cause STAT5 dimerization/trimerization after
activation22. There are several explanations for the diff erent sensitivity for CP-690,550. Firstly,

Chap
ter 7
146
by a diff erent distribution of the IL-2 α, β, and γ chains or a variation in the recruitment of Jak1
and Jak3 molecules between Treg and Teff . Treg might have more Jak3 and/or Jak1 molecules
and therefore need more CP-690,550 to inhibit all molecules23. Furthermore, it is also unclear
how many confi gurations of STAT homo- and heterodimeric complexes are present in the
Treg and Teff cells before, during and after cytokine stimulations. Secondly, it has been shown
that diff erent regions of the cytoplasmic domain of the IL-2Rβ-chain interact and couple with
distinct signaling pathways and cellular responses in Treg and Teff 24. In Teff , IL-2 stimulation
predominantly results in IFN-γ production and proliferation, whereas in Treg IL-2 is required
to induce and maintain FoxP3-expression and suppressive function. IL-2 induced STAT5
phosphorylation might not be important for Treg function, but apparently is important for Teff
function, because inhibition of the STAT5 phosphorylation by CP-690,550 results in an almost
90% decrease in proliferation of Teff , whereas Treg function is still present when only 40% of
the cells have P-STAT5. FOXP3-expression is induced by STAT5 as STAT5-tetramers are able to
bind a highly conserved binding site on the promoter region of the FOXP3-gene25. Accordingly,
Treg in our study already express FoxP3, and therefore cannot be aff ected, so only the induction
of de novo FoxP3-expression and the development of Treg are inhibited. On the other hand,
FoxP3-expression alone is not suffi cient for the acquisition of suppressive capacity, as it has
been shown that activated Teff cells can also induce FoxP3, in a STAT5-dependent manner5.
To maintain FoxP3, more pathways are necessary and apparently these pathways operate
separately. This may explain the presence of functional Treg.
Collectively, our data demonstrate that although STAT5-phosphorylation is partially inhibited
in Treg in the presence of the Jak-inhibitor CP-690,550, they still exhibited suppressive activi-
ties. Apparently, in CD25bright T cells, STAT5 phosphorylation is not (or partly) coupled with their
function, in contrast to the CD25neg and CD25dim T cells that require STAT5 phosphorylation
for their function (Figures 2, 3 and 5). It already has been reported that there is a fundamental
diff erence between allo-responsive Treg and Teff in the susceptibility to a diverse set of immu-
nosuppressive agents such as anti-CD4 mAb, rATG, anti-CD40L and the IL-2 signal inhibitor
rapamycin. These agents commonly lead to the selective expansion of antigen-specifi c natural
Treg or higher resistance of Treg than Teff to an anti-proliferative or apoptosis-inducing eff ect
of these agents26-28. According to our fi ndings, this list can be expanded with CP-690,550 and
cyclosporine. In summary, we have shown that the function of Treg is largely independent of
IL-2/Jak3/STAT5 signaling as the indirect inhibitor of the functions of IL-2, CP-690,550 and the
CNI cyclosporine both spare Treg function, whereas they eff ectively inhibit Teff STAT5 phos-
phorylation and function. Our fi ndings may have important implications in the usage of these
immunosuppressive drugs and their mechanisms in the modulation of anti-donor responses
after clinical organ transplantation.

The Jak Inhibitor CP-690,550 and Regulatory T Cells 147
REFERENCES
1. Halloran, P.F. Immunosuppressive drugs for kidney transplantation. N Engl J Med 351, 2715-2729 (2004).
2. Pesu, M. et al. Therapeutic targeting of Janus kinases. Immunol Rev 223, 132-142 (2008). 3. O’Shea, J.J., Park, H., Pesu, M., Borie, D. & Changelian, P. New strategies for immunosuppression:
interfering with cytokines by targeting the Jak/Stat pathway. Curr Opin Rheumatol 17, 305-311 (2005). 4. Ghoreschi, K., Laurence, A. & O’Shea, J.J. Janus kinases in immune cell signaling. Immunol Rev 228,
273-287 (2009). 5. Passerini, L. et al. STAT5-signaling cytokines regulate the expression of FOXP3 in CD4+CD25+ regula-
tory T cells and CD4+CD25- eff ector T cells. Int Immunol 20, 421-431 (2008). 6. Zorn, E. et al. IL-2 regulates FOXP3 expression in human CD4+CD25+ regulatory T cells through a
STAT-dependent mechanism and induces the expansion of these cells in vivo. Blood 108, 1571-1579 (2006).
7. Yao, Z. et al. Nonredundant roles for Stat5a/b in directly regulating Foxp3. Blood 109, 4368-4375 (2007).
8. Cohen, A.C. et al. Cutting edge: Decreased accumulation and regulatory function of CD4+CD25(high) T cells in human STAT5b defi ciency. J Immunol 177, 2770-2774 (2006).
9. Fontenot, J.D., Rasmussen, J.P., Gavin, M.A. & Rudensky, A.Y. A function for interleukin 2 in Foxp3-expressing regulatory T cells. Nat Immunol 6, 1142-1151 (2005).
10. Mayack, S.R. & Berg, L.J. Cutting edge: an alternative pathway of CD4+ T cell diff erentiation is induced following activation in the absence of gamma-chain-dependent cytokine signals. J Immunol 176, 2059-2063 (2006).
11. Changelian, P.S. et al. Prevention of organ allograft rejection by a specifi c Janus kinase 3 inhibitor. Science 302, 875-878 (2003).
12. Conklyn, M., Andresen, C., Changelian, P. & Kudlacz, E. The JAK3 inhibitor CP-690550 selectively reduces NK and CD8+ cell numbers in cynomolgus monkey blood following chronic oral dosing. J Leukoc Biol 76, 1248-1255 (2004).
13. Kudlacz, E. et al. The novel JAK-3 inhibitor CP-690550 is a potent immunosuppressive agent in various murine models. Am J Transplant 4, 51-57 (2004).
14. van Gurp, E.A. et al. The eff ect of the JAK inhibitor CP-690,550 on peripheral immune parameters in stable kidney allograft patients. Transplantation 87, 79-86 (2009).
15. Quaedackers, M.E. et al. Monitoring of the immunomodulatory eff ect of CP-690,550 by analysis of the JAK/STAT pathway in kidney transplant patients. Transplantation 88, 1002-1009 (2009).
16. Hendrikx, T.K., Klepper, M., Ijzermans, J., Weimar, W. & Baan, C.C. Clinical rejection and persistent immune regulation in kidney transplant patients. Transpl Immunol 21, 129-135 (2009).
17. Boulay, J.L., O’Shea, J.J. & Paul, W.E. Molecular phylogeny within type I cytokines and their cognate receptors. Immunity 19, 159-163 (2003).
18. Letourneau, S., Krieg, C., Pantaleo, G. & Boyman, O. IL-2- and CD25-dependent immunoregulatory mechanisms in the homeostasis of T-cell subsets. J Allergy Clin Immunol 123, 758-762 (2009).
19. Yu, A., Zhu, L., Altman, N.H. & Malek, T.R. A low interleukin-2 receptor signaling threshold supports the development and homeostasis of T regulatory cells. Immunity 30, 204-217 (2009).
20. Roessler, E. et al. Cooperative interactions between the interleukin 2 receptor alpha and beta chains alter the interleukin 2-binding affi nity of the receptor subunits. Proc Natl Acad Sci U S A 91, 3344-3347 (1994).
21. Varker, K.A. et al. Multiparametric fl ow cytometric analysis of signal transducer and activator of transcription 5 phosphorylation in immune cell subsets in vitro and following interleukin-2 immuno-therapy. Clin Cancer Res 12, 5850-5858 (2006).
22. Murray, P.J. The JAK-STAT signaling pathway: input and output integration. J Immunol 178, 2623-2629 (2007).

Chap
ter 7
148
23. Changelian, P.S. et al. The specifi city of JAK3 kinase inhibitors. Blood 111, 2155-2157 (2008). 24. Bensinger, S.J. et al. Distinct IL-2 receptor signaling pattern in CD4+CD25+ regulatory T cells. J Immu-
nol 172, 5287-5296 (2004). 25. Burchill, M.A., Yang, J., Vogtenhuber, C., Blazar, B.R. & Farrar, M.A. IL-2 receptor beta-dependent STAT5
activation is required for the development of Foxp3+ regulatory T cells. J Immunol 178, 280-290 (2007).
26. Nagahama, K. et al. Diff erential control of allo-antigen-specifi c regulatory T cells and eff ector T cells by anti-CD4 and other agents in establishing transplantation tolerance. Int Immunol 21, 379-391 (2009).
27. Strauss, L., Czystowska, M., Szajnik, M., Mandapathil, M. & Whiteside, T.L. Diff erential responses of human regulatory T cells (Treg) and eff ector T cells to rapamycin. PLoS One 4, e5994 (2009).
28. Lopez, M., Clarkson, M.R., Albin, M., Sayegh, M.H. & Najafi an, N. A Novel Mechanism of Action for Anti-Thymocyte Globulin: Induction of CD4+CD25+Foxp3+ Regulatory T Cells. J Am Soc Nephrol 17, 2844-2853 (2006).


Chap ter 8Conversion from Calcineurin Inhibitor to
Mycophenolate Mofetil-Based Immunosuppression Changes the Frequency and Phenotype of
CD4+FoxP3+ Regulatory T Cells
Transplantation 87, 1062-1068 (2009)
Ahmet Demirkiran1, Varsha D.K.D. Sewgobind1,2, Joyce van der Weijde1, Alice Kok1,
Carla C. Baan2, Jaap Kwekkeboom3, Hugo W. Tilanus1,
Herold J. Metselaar3* and Luc J.W. van der Laan1*
*Both authors contributed equally to this work
Departments of 1Surgery, 2Internal Medicine 3Gastroenterology&Hepatology
Erasmus MC, University Medical Center, Rotterdam, the Netherlands

Chap
ter 8
152
ABSTRACT
CD4+Foxp3+ regulatory T cells (Treg) depend on IL-2 for their function and survival. By interfer-
ing with the IL-2 production, calcineurin inhibitors (CNI) may negatively aff ect Treg. Here, we
describe the eff ects of conversion from CNI to mycophenolate mofetil (MMF) monotherapy on
renal function, and on Treg frequency and phenotype in liver transplant recipients. Patients
(n=16) with renal impairment on CNI were converted to MMF and received a single dose of
the IL-2-receptor blocking antibody (Daclizumab). Control patients (n=8) continued CNI
treatment. Renal function rapidly and signifi cantly improved after conversion. Daclizumab
treatment resulted in a 75% blocking of CD25 at one month causing a signifi cant reduction
in the percentage of CD4+CD25+ cells but not aff ecting the percentage of CD4+CD25+Foxp3+
cells. Six months after conversion to MMF, the percentage of CD4+CD25+Foxp3+ cells increased
signifi cantly by 125%. FOXP3 mRNA analysis of mononuclear cells confi rmed the enrichment
of Foxp3 in peripheral blood. Interestingly, the CD25 expression level on CD4+Foxp3+, but
not CD4+Foxp3- cells signifi cantly increased compared with preconversion. Conversion to
MMF increases the percentage and CD25 expression of CD4+Foxp3+ cells indicating that MMF
therapy can overturn the repressive eff ect of CNI on circulating Treg levels and therefore may
promote Treg-mediated suppression of alloreactivity.

Conversion from CNI to MMF in Liver Transplant Patients 153
INTRODUCTION
The checks and balances of immune reactive and immune suppressive cells likely determine
whether there is immune reactivity to donor antigens or non-responsiveness (tolerance).
Tolerance to self and foreign antigens involves the action of regulatory T cells (Treg)1, 2. These T
cells with suppressive capacities were fi rst identifi ed for their ability to prevent organ specifi c
autoimmune diseases in mice1. In experimental transplant models these cells can transfer
tolerance to donor antigens as well2. Recent studies suggest that calcineurin inhibitors (CNI,
cyclosporine A or tacrolimus), belonging to the current standard immunosuppressive therapy
after organ transplantation (Tx), interfere with the expansion, survival and possibly the function
of Treg in vitro3, 4 and in vivo5, 6. CNI are known as potent blockers of IL-2 production and it is
established that IL-2 is critically important for the survival of Treg7. This could explain why CNI
have been reported to be detrimental to both spontaneous experimental transplant tolerance
in vivo and tolerance induced by co-stimulatory blockade8, 9. The clinical use of CNI is associated
with considerable non-immunological side eff ects, most importantly renal dysfunction due to
nephrotoxicity10 but also diabetes mellitus, hyperlipidemia and hypertension.
Clinical studies have shown that conversion of CNI to immunosuppressants like rapamycin
or mycophenolate mofetil can halt or even reverse CNI associated side eff ects. In liver Tx, CNI
conversion to MMF based immune suppression improves renal function but is also associated
with a considerable risk of acute rejection11, 12. Recent studies suggest that rapamycin, unlike
CNI, does not interfere with the survival and alloantigen-driven expansion of Treg in vitro3, 4
and in vivo6. There is now accumulating evidence that the inosine monophosphate inhibitor
MMF, an IL-2 independent immunosuppressant, has similar eff ects on Treg as rapamycin. It was
shown in diff erent experimental transplant models that MMF does not interfere with Treg func-
tion and positively aff ects tolerance induction5, 9, 13.
In the present study stable liver transplantation patients were converted from CNI to MMF
monotherapy. To minimize the risk of conversion-associated acute rejection, recipients were
treated with additional induction IL-2 receptor blockade. The aim of this study was to observe
the eff ects of conversion on the frequency and phenotype of circulating CD4+Foxp3+ Treg.
After conversion to MMF, rapid eff ects on renal function as well as changes in the frequency
and CD25 expression of circulating CD4+Foxp3+ Treg were observed. Possible implications of
these changes with respect to transplant tolerance will be discussed.
Chap
ter 8
154
PATIENTS AND METHODS
Patients and study design
Liver transplant recipients transplanted at the Erasmus MC (University Medical Center Rot-
terdam) on CNI maintenance monotherapy and at least 12 months after Tx, were screened
for renal dysfunction. Renal dysfunction was defi ned based on increased serum creatinin and
blood urea nitrogen (BUN) levels and a calculated creatinin clearance of less than 60 mL/min.
To exclude other causes of renal dysfunction, ultrasound of kidneys and aorta were performed.
Only patients older than 18 years were consecutively enrolled. Exclusion criteria included
abnormal graft function (increased serum levels of aminotransferase, alkaline phosphatase,
gamma-glutamyl transferase and bilirubin, without histological signs of acute rejection), active
infection, malignancy, and a history of severe (steroid-resistant or repeated) rejection and other
causes of renal dysfunction. This study was approved by the Medical Ethical Committee of the
Erasmus MC and an appropriate informed consent was obtained from all patients.
Initially this was an open, randomized study comparing MMF-Daclizumab based regimen
with standard CNI based drug regimen. At time-point zero one infusion of 2 mg/kg bodyweight
of Dacluzimab was given intravenously and oral MMF was started at a dose of 2 g a day. CNI was
stopped at the same day. MMF dose was not adapted to trough levels. The composite primary
endpoint of this study was the improvement of renal function: decrease in serum creatinin,
BUN and increase in creatinin clearance during the fi rst 6 months after randomization. Cre-
atinin clearance was calculated with the Cockroft-Gault equation and in a subset of patients
glomerular fi ltration rate (GFR) was measured. Secondary endpoints included biopsy proven
rejection, allograft dysfunction, patient death at 6 months and graft loss at 6 months. During
the follow up, liver and renal functions were assessed on regular basis in the outpatient clinic.
When acute rejection was diagnosed intravenous methylprednisolon (Solumedrol, 3x1000mg)
was administered together with re-introduction of CNI and discontinuation of MMF. Acute
rejection was confi rmed by histological examination of liver biopsies using the Banff classifi ca-
tion. General characteristics of the study group are summarized in Table 1. For fl ow cytometric
and reverse-transcriptase polymerase chain (RT-PCR) analysis fi ve heparinized peripheral blood
samples (in total 30 mL) were obtained from all patients before and at 1, 3, and 6 months after
randomization.
Flow cytometric analysis
Peripheral Blood Mononuclear Cells were obtained by density gradient centrifugation over
Ficoll-Paque plus (Amersham Biosciences, Buckinghamshire, UK) and stored frozen at –135ºC.
After thawing, PBMC were washed twice with phosphate-buff ered saline containing 0.3%
bovine serum albumin followed by staining with primary monoclonal antibodies in phosphate-
buff ered saline/0.3% bovine serum albumin (30 min at 4 ºC). The following fl uorochrome-
conjugated monoclonal antibodies were used: CD25 (clone 2A3)-fl uorescein isothiocyanate

Conversion from CNI to MMF in Liver Transplant Patients 155
(FITC), CD25 (clone M-A251)-phycoerythrin (PE), and CD4-PerCP-Cy5.5 from Becton Dickinson
(San Jose, USA); CTLA-4-APC, CD3-fl uorecein isothiocyanate, and IgG2a-PE from Immunotech,
(Marseille, France); Foxp3-APC and isotype IgG2a-APC from eBiosciences (San Diego, USA). To
determine the level of CD25 blockade by Daclizumab, we used two diff erent clones of anti-
CD25 antibody, which bind diff erent epitopes. Antibody concentrations were titrated to obtain
the same mean fl uorescence intensity for both CD25 antibodies. In this manner, the extent of
CD25 blocking by cell-bound Daclizumab was calculated. To defi ne maximal receptor blocking
as control, 5x10⁶ PBMC were incubated with 25 μg/mL Daclizumab (10 min at 4 ºC) in vitro
before CD25 staining.
After primary incubation cells were washed, and for staining of intracellular FoxP3, the
cells were fi xed and permeabilized using fi xation/permeabilization supplied by eBiosciences.
Analysis by fl ow cytometry was performed using FACS Calibur and CELLQuest Pro software
(Becton Dickinson, San Jose, CA). The percentages of Treg were calculated as a percentage of
total CD3+CD4+ T cells. The relative CD25 expression within the FoxP3+CD4+ and FoxP3negCD4+
cell populations was calculated based on the geometric mean fl uorescence intensity for both
populations at baseline (t=0), which were considered 100%.
Quantitative RT-PCR
From PBMC (1x10⁶ cells), erythrocytes were lysed with a buff er containing ammoniumchloride,
sodium bicarbonate and EDTA by incubation for 7 min on ice. The remaining leukocyte fraction
was pelleted and resuspended in 0.5 mL TRIzol reagent (Life Technologies, GmbH, Karlsruhe,
Germany) at 4ºC. After homogenization, 20 μg poly A (Boehringer, Mannheim, Germany) was
added and the TRIzol lysates were directly stored at -80ºC. Total RNA was extracted with 160 μL
of cold chloroform-isoamylalcohol and subsequently precipitated with ice-cold 80% ethanol
(350 μL). The precipitated solution was then loaded on an RNA-isolation column from the
Table 1. Baseline patient characteristics
Study patients (n=16) Controls (n=8) p-valueMean age ± SD (yr) 60±11 66±5 NS
Gender (M/F) 8/8 3/5 NS
Mean time after Tx (yr) 9±4 7±2 NS
Indication LTx
Sclerosing Cholangitis
Alcoholic Cirrhosis
Cryptogeneic Cirrhosis
Biliary Cirrhosis
Viral Hepatitis
Acute Liver Failure
Haemangioendothelioma
3
2
3
3
2
3
0
2
2
1
1
0
1
1
NS
NS
NS
NS
NS
NS
NS
Maintenance Immunosuppression
Cyclosporine A monotherapy
Tacrolimus monotherapy
11
5
5
3
NS
NS
Tx, Transplantation; LTx, liver transplantation

Chap
ter 8
156
Qiagen RNeasy isolation kit (Qiagen, Venlo, the Netherlands) and RNA was isolated according to
the manufacturer’s instructions. Total RNA was denaturated for 10 min at 80°C and then chilled
to 4°C. First-strand cDNA synthesis was performed as previously described14. Real-time RT-PCR
was used to quantify FOXP3 mRNA. The constant region of the T cell receptor α chain (TCR-Cα)
RNA was quantifi ed to use as reference gene. The primers and probes for FOXP3 were obtained
from Assays-on-Demand Gene Expression Product and pre-developed Taqman PDAR assays
(Applied Biosystems, Forster City, CA). Each Taqman probe was labeled at the 5’ end with the
reporter dye molecule 6-carboxyfl uorescein. Five microliters cDNA was added to 20 μL PCR
mixture containing 12.5 μL Universal PCR Master Mix (Applied Biosystems), 0.625 μL primer/
probe mix and 6.875 μL H2O. The choice of primer and probe for the measurement of TCR-Cα
transcripts was as previously described14.
Amplifi cations were performed using the ABI 7700 sequence detector system (Applied
Biosystems) under the following conditions: a fi rst step of 2 min 50°C and 10 min 95°C followed
by 40 cycles of 15 sec at 95°C and 1 min at 60°C (for TCR-Cα 1 min at 58°C). The target message
was quantifi ed by measuring threshold cycle (Ct). Two negative controls (no template), and
two positive reference samples were included for each determination. Samples negative for
the TCR-Cα genes were excluded from further analysis. The relative FOXP3 expression based
on TCR-Cα was calculated using the comparative ΔΔCt formula: ΔΔCT (Ct Target – Ct TCR-Cα)
sample - (Ct Target – Ct TCR-Cα) control. The fold change was calculated using 2 –ΔΔCt.
Statistical Analysis
Statistical analysis was performed using SPSS Inc. software version 11.0 (Chicago, IL, USA).
For the clinical data the intention-to-treat analyses was used. Comparisons were performed
with Wilcoxon matched paired test or the Mann-Whitney U test. P-values less than 0.05 were
considered to be signifi cant.
RESULTS
Clinical Outcomes
Sixteen liver transplantation recipients with renal impairment on CNI were converted to MMF
immunosuppression and received a single dose of IL-2-receptor blocking antibody (Dacli-
zumab). Control group (n=8) continued CNI treatment. Two cases of acute rejection occurred
in the conversion group: one at 1 month and the other at 6 months after conversion. Rejection
was confi rmed with histologically and successfully treated with intravenous methylprednisolon
and re-introduction of CNI. Improvement of renal function was observed as early as 1 month
after conversion to MMF. Relative to baseline values, serum creatinin decreased with a mean of
16% ± 9% (SD) at 6 months after conversion (Table 2). BUN levels also signifi cantly decreased.
In the control group, serum creatinin and BUN remained unchanged. The calculated creatinin

Conversion from CNI to MMF in Liver Transplant Patients 157
clearance increased signifi cantly in the conversion group (p=0.001), whereas remaining stable
in the control group (Table 2). In seven patients in the conversion group, the GFR was measured
and showed a signifi cant increase at 6 months confi rming the improvement of renal function
(p=0.018), whereas no changes were seen in the control group (n=4). Conversion patients at 6
months (n=13) had a signifi cant lower serum bilirubin level (p=0.034), whereas this remained
unchanged in control patients (n=7; Table 2).
Changes in CD4+CD25bright T cells after conversion to MMF
To assess the eff ect of immunosuppression conversion on Treg, fl owcytometric analysis of CD4
and CD25 in PBMC was performed. A representative dot plot of CD4 and CD25 double staining
within the CD3+ T cells is shown in Figure 1A. For the detection of CD25, an antibody (clone
M-A251) was used that can bind independently from blocking by Daclizumab. One month after
conversion to MMF, CD25 expression on CD4+ T cells was signifi cantly decreased by a mean
of 64% ± 4% SEM (p<0.001; Figure 1B). In order to determine whether this down-regulation
is associated with CD25 blocking by Daclizumab, double immunostainings were performed
using dependent (i.e. does not bind in the presence of Daclizumab) and independent CD25
detection antibodies. As shown in Figure 1C, maximal CD25 blocking was observed at 1 month
after conversion (75%) and this coincided with the reduction of CD4+CD25bright T cells. Blocking
by Daclizumab was reduced to baseline levels by 6 months (Figure 1C). At 6 months, when
CD25 blocking by Daclizumab was alleviated, all conversion patients showed a more than 25%
increase in CD4+CD25bright cells. The relative levels of CD4+CD25bright cells, as a percentage of
baseline, was signifi cantly increased and also statistically signifi cant diff erent from the levels
in the control group (p=0.003; Figure 1B). The mean percentage of CD4+CD25+CTLA-4+ within
total CD3+ T cells was increased at 6 months after conversion from 2.0 ± 0.8 SEM at baseline
Table 2. Improved renal function after conversion from CNI to MMF monotherapy
Patients Baseline 1 mo 3 mo 6 mo NMean serum creatinin (μmol/L)
Control
Conversion
154±23
158±35
150±19
141±27*
150±25
143±31*
152±32
132±30*
7
13
Mean serum BUN (mmol/L)
Control
Conversion
12±2
13±4
12±2
10±3*
12±2
10±3*
11±3
9±2*
7
13
Creatinin Clearence (mL/min)
Control
Conversion
38±16
45±14
ND
ND
ND
ND
42±14
56±19*
7
13
GFR (mL/min)
Control
Conversion
44±13
39±7
ND
ND
ND
ND
44±12
46±11*
4
7
Serum Bilirubin
Control
Conversion
10±2
10±3
ND
ND
ND
ND
9±2
8±2*
7
13
Shown are the means ± SD *p< 0.05 statistical signifi cantly diff erent from baseline values.

Chap
ter 8
158
to 4.3 ± 2.4 SEM (p<0.05, data not shown). None of these changes were seen in the control
group. In sum, these data indicate that Daclizumab reduces the percentage of CD4+CD25bright T
cells whereas after 6 months conversion from CNI to MMF a signifi cant increased proportion of
circulating CD4+CD25bright cells was observed.
0 1 2 3 4 5 60
20
40
60
80
100
CNI Controls
MMF Conversion
+ ex vivo Daclizumab
Time after Conversion (Mths)
Rela
tive
CD25
Blo
ckin
g (%
)
1M 3M 6M0
100
200
300
400
500 **
1M 3M 6M0
100
200
300
400
500 CNI
MMF
Rel
ativ
e %
CD
25br
ight
of C
D4
+T
cells
(% o
f bas
elin
e)
Time after conversion
Time after conversion (Mths)
A C
B
Figure 1. Changes in percentage of CD4+CD25bright T cells after conversion to MMF monotherapy
(A) Representative dot plots of CD4+CD25bright cells within the CD3+ T-cell population. (B) Shown are the relative percentage of CD4+CD25bright
cells, as a percentage of baseline, in conversion (MMF, n=11) and control patients (CNI, n=7). At 1 mo after conversion, a median decrease of
62% ± 4 SEM in the relative percentage of CD4+CD25bright cells was observed (*p<0.001). At 6 mo, all conversion patients showed at least a
25% increase in CD4+CD25bright cells over baseline values. The median increase was 130% (*p<0.001) and was also signifi cantly diff erent from
the control group at 6 mo (p=0.003). Bar represents median and dashed lines indicate baseline levels. (C) Level of CD25 blocking by Daclizumab
on CD4+ T cells. Blocking was calculated based on diff erential staining of two CD25 detecting antibodies, one binding to the same epitope as
Daclizumab and one binding a distinct epitope. Maximum level of CD25 blocking (>75%) was observed at 1 mo and coincided with the down
regulation of CD25 expression. Blocking values returned to baseline at 6 mo after conversion (n=9). In the control group (n=5) approximately
15% CD25 blocking was observed which was unrelated to Daclizumab, but possibly related to bound IL-2.

Conversion from CNI to MMF in Liver Transplant Patients 159
Increase of CD25+Foxp3+T cells after conversion to MMF
To further confi rm the eff ect of immunosuppression conversion on Treg, additional fl ow cyto-
metric analyses were performed for Foxp3. A representative dot plot of CD25 and Foxp3 expres-
sion within the CD4+ T cells is shown in Figure 2A. The total proportion of CD25+Foxp3+ cells
within the CD4+ T cells signifi cantly increased after conversion (Figure 2B). Ten out of 11 patients
showed a more then 20% increase in the percentage of CD25+Foxp3+ cells at 6 months. After
conversion, the mean increase over baseline levels at 6 months was 125% ± 43% SD (p=0.004;
Figure 2B). Also a signifi cant diff erence was observed (p=0.007) when comparing the relative
percentage CD25+Foxp3 of conversion and control groups. No signifi cant changes from base-
line were seen in the control CNI group. RT-PCR analysis confi rmed the increase of Foxp3+ cells at
transcript level at 6 months after conversion (60% increased FOXP3 mRNA over baseline levels,
p=0.002), whereas no changes were observed in the control group. In two patients who were
withdrawn from MMF and reconverted to CNI monotherapy (at 3 and 6 months after conversion),
the proportion of Foxp3+ cells and FOXP3 mRNA expression decreased after reintroduction of
CNI (Table 3). No association was observed between the percentage of CD25+Foxp3+ cells and
the development of acute rejection. Overall, these fi ndings suggest that removal of CNI and
introduction of MMF positively aff ect the percentage of circulating CD4+CD25+Foxp3+ Treg.
4.8%
1M 3M 6M0
100
200
300
400
CNI500
600
1M 3M 6M0
100
200
300
400
*MMF500
600
Rel
ativ
e %
CD
25br
ight
Foxp
3+of
CD
4 +
(% o
f bas
elin
e)
Time after conversion
A B
Figure 2. Increase in proportion of CD25+Foxp3+ T cells after conversion to MMF
(A) Representative dot plot showing CD25+Foxp3+ cells within the CD4+ T-cell population. (B) The relative percentage of CD25+Foxp3+ cells
within the CD4+ population, as a percentage of baseline values, are shown from conversion (MMF, n=12) and control patients (CNI, n=7). No
decrease was observed at 1 mo, but the relative levels of CD25+Foxp3+ cells increased signifi cantly at 6 mo after conversion (*p=0.004) and was
also diff erent from the control group at 6 mo (p=0.008). Quantitative RT-PCR analysis of PBMC confi rmed the enrichment of Foxp3 mRNA at 6
mo after conversion (p=0.002 compared to baseline; data not shown). No signifi cant changes were observed within the control patients who
continued on CNI. Bar represents median and dashed lines indicate baseline levels.

Chap
ter 8
160
Changes in CD25 expression on Foxp3+ cells after conversion to MMF
We examined the diff erential expression of CD25 on CD4+Foxp3+ and CD4+Foxp3- cells after
conversion. The increased CD25 expression on CD4+ T cells observed at 6 months after con-
version was predominantly confi ned to CD4+Foxp3+ cells (Figure 3). The CD25 expression of
CD4+Foxp3+ cells was increased at 6 months by 140%±56 SEM (p<0.05) over baseline levels. An
increase of 56%±51 SEM in CD25 expression was observed on CD4+Foxp3- cells, but this did not
reach statistical signifi cance.
DISCUSSION
The success of solid-organ transplantation depends on the continuous administration of toxic
and antigen non-specifi c immunosuppressive drugs to prevent rejection. Currently, mainte-
nance immunosuppressive therapy in most liver transplant recipients includes a CNI. This study
shows that the percentage of CD25+Foxp3+ cells within the CD4+ T cells signifi cantly increased
after conversion from CNI to MMF (Figure 2) and in two patients it seemed to decrease again
after reconversion from MMF to CNI (Table 3). Conversion to MMF also resulted in phenotypical
changes within the Treg population. After conversion, an increase of CD25 expression level (i.e.,
Table 3. Changes in Foxp3+ cells after re-conversion to CNI in two patients
% Foxp3+ of CD4+ T cells Relative FOXP3 mRNA expression
Pre MMFAfter CNI
restartPre MMF
After CNI restart
Patient 1 2.7 6.3 3.2 67.4 208.6 103.6
Patient 2 5.2 7.7 5.0 33.7 68.3 31.0
Reconversion (patient 1 at 3 mo, patient 2 at 6 mo) from MMF to CNI decreased the percentage of CD4+Foxp3+ T cells and FOXP3 mRNA levels
Figure 3. Changes in CD25 expression on Foxp3+ cells after conversion
The relative CD25 expression was calculated based on the geometric mean fl uorescence intensity at baseline (100%). At 6 mo after conversion,
CD25 expression signifi cantly increased on Foxp3+ cells (*p<0.05) but not on Foxp3- cells. Shown is mean ± SEM of 11 conversion patients.

Conversion from CNI to MMF in Liver Transplant Patients 161
mean fl uorescence intensity) on Foxp3+ cells was observed (Figure 3) suggesting that these
cells may have become more susceptible to IL-2 signals.
IL-2 has been shown to be of critical importance for the function and survival of Treg7,15.
Immunosuppression interfering with the IL-2 pathway may therefore aff ect the suppressive
capacity and homeostasis of Treg. CNI interfere with the nuclear factor of activated T-cells
(NFAT) signaling pathway that is an important regulator of IL-2 production. Recently, a close
relationship between NFAT and FOXP3 was shown to be critical for Treg function16. By inter-
fering with this interaction, CNI are believed to inhibit Treg17. In experimental bone marrow
transplantation CsA administration inhibited Treg function in vivo by reducing IL-2 production5.
Exogenous IL-2 was shown to overturn the suppressed FoxP3 expression and the suppressive
function of Treg induced by cyclosporine A, underlining the importance of IL-2 for Treg. In this
same study it was shown that rapamycin and MMF had no detrimental eff ect on the function
of Treg, both in vitro and in vivo5. There is now accumulating evidence that MMF like rapamycin
spares Treg in their survival and function18. It was shown in diff erent experimental transplant
models that MMF does not interfere with Treg function and positively aff ect tolerance induc-
tion5, 9, 13. In the clinical setting, Segundo et al.19 recently demonstrated that the use of CNI, and
not rapamycin, is associated with a reduced percentage of circulating Treg in renal transplant
recipients. To our knowledge for the fi rst time our study shows that conversion to MMF therapy
can actually reverse the suppressive eff ect of CNI on the percentage of Treg in circulation.
In our study, we showed that the percentage of CD4+CD25+Foxp3+ Treg increased after
conversion from CNI to MMF. Interestingly, this increase was accompanied by a signifi cant
increase of CD25 expression on CD4+Foxp3+ Treg (Figure 3). However, 1 month after conver-
sion, when over 75% of CD25 is eff ectively blocked by Daclizumab (Figure 1C), CD25 expression
was signifi cantly decreased (Figure 1B), both on CD4+Foxp3+ and CD4+Foxp3- cells. The CD25
downregulation was not due to epitope blocking because the antibody used (clone M-A251)
for detection recognizes a diff erent (independent) epitope than Daclizumab. Contrarily, loss of
CD25 expression may be due to Daclizumab-associated receptor internalization or shedding.
Kreijveld et al.20 reported that during Daclizumab treatment in kidney transplant recipients
levels of Foxp3+ Treg decreased. In contrast, Kohm et al.21 showed a functional inactivation,
rather than depletion, of Treg by CD25 antibodies. These contradicting fi ndings may be due
to the intensive immunosuppressive therapy following kidney transplantation, which may act
synergistically on Treg. In our study, monotherapy with MMF in combination with one gift of
Daclizumab did not result in decreased levels of CD4+Foxp3+ Treg 1 or 3 months after con-
version, but in an increase at 6 months and beyond (data not shown) and was supported by
analysis of CD4+CD25+CTLA-4+ T cells.
The possible negative eff ect of CNI on tolerance by aff ecting Treg is accompanied with non-
immunological side eff ects, in particular nephrotoxicity, causing signifi cant morbidity. This ini-
tially randomized study shows that conversion from a CNI based immunosuppressive regimen
to MMF monotherapy improves renal function with a low risk of acute rejection, supporting
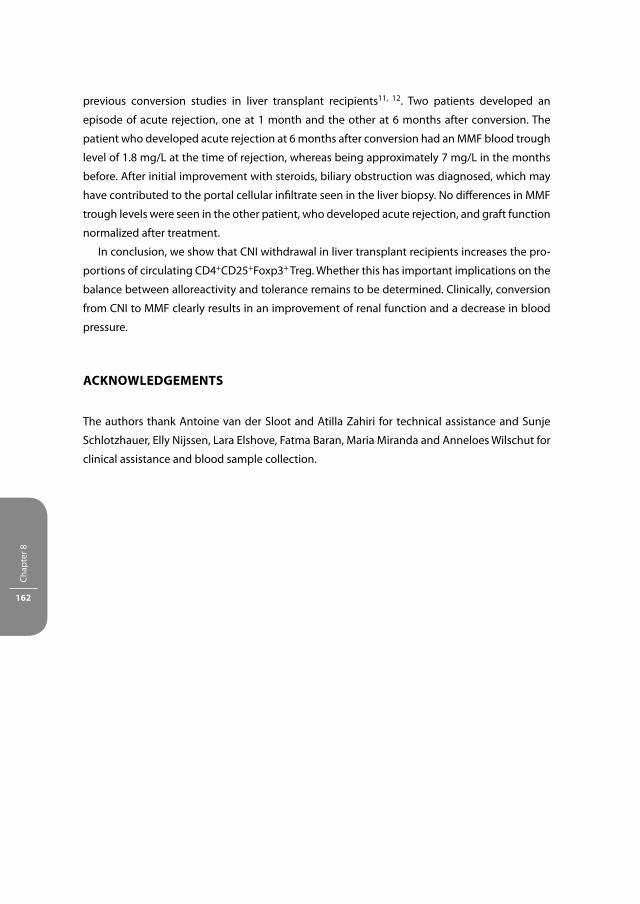
Chap
ter 8
162
previous conversion studies in liver transplant recipients11, 12. Two patients developed an
episode of acute rejection, one at 1 month and the other at 6 months after conversion. The
patient who developed acute rejection at 6 months after conversion had an MMF blood trough
level of 1.8 mg/L at the time of rejection, whereas being approximately 7 mg/L in the months
before. After initial improvement with steroids, biliary obstruction was diagnosed, which may
have contributed to the portal cellular infi ltrate seen in the liver biopsy. No diff erences in MMF
trough levels were seen in the other patient, who developed acute rejection, and graft function
normalized after treatment.
In conclusion, we show that CNI withdrawal in liver transplant recipients increases the pro-
portions of circulating CD4+CD25+Foxp3+ Treg. Whether this has important implications on the
balance between alloreactivity and tolerance remains to be determined. Clinically, conversion
from CNI to MMF clearly results in an improvement of renal function and a decrease in blood
pressure.
ACKNOWLEDGEMENTS
The authors thank Antoine van der Sloot and Atilla Zahiri for technical assistance and Sunje
Schlotzhauer, Elly Nijssen, Lara Elshove, Fatma Baran, Maria Miranda and Anneloes Wilschut for
clinical assistance and blood sample collection.

Conversion from CNI to MMF in Liver Transplant Patients 163
REFERENCES
1. Sakaguchi, S. Sakaguchi, N., Asano, M., Itoh, M., Toda, M. Immunologic self-tolerance maintained by activated T cells expressing IL-2 receptor alpha-chains (CD25). Breakdown of a single mechanism of self-tolerance causes various autoimmune diseases. J Immunol 155, 1151-1164 (1995).
2. Wood, K.J. and Sakaguchi, S. Regulatory T cells in transplantation tolerance. Nat Rev Immunol 3, 199-210 (2003).
3. Baan, C.C., van der Mast, B.J., Klepper, M., Mol, W.M., Peeters, A.M., Korevaar, S.S., et al. Diff erential eff ect of calcineurin inhibitors, anti-CD25 antibodies and rapamycin on the induction of FOXP3 in human T cells. Transplantation 80, 110-117 (2005).
4. Coenen, J.J., Koenen, H.J., van Rijssen, E., Hilbrands, L.B., Joosten, I. Rapamycin, and not cyclosporin A, preserves the highly suppressive CD27+ subset of human CD4+CD25+ regulatory T cells. Blood 107, 1018-1023 (2006).
5. Zeiser, R.S., Nguyen, V.H., Beilhack, A., Buess, M., Schulz, S., Baker, J., et al. Inhibition of CD4+CD25+ regulatory T cell function by calcineurin dependent interleukin-2 production. Blood 108, 390-399 (2006).
6. Gao, W., Lu, Y., El Essawy, B., Oukka, M., Kuchroo, V.K., Strom, T.B. Contrasting eff ects of cyclosporine and rapamycin in de novo generation of alloantigen-specifi c regulatory T cells. Am J Transplant 7, 1722-1732 (2007).
7. Zhang, H., Chua, K.S., Guimond, M., Kapoor, V., Brown, M.V., Fleisher, T.A., et al. Lymphopenia and interleukin-2 therapy alter homeostasis of CD4+CD25+ regulatory T cells. Nat Med 11, 1238-1243 (2005).
8. Smiley, S.T., Csizmadia, V., Gao, W., Turka, L.A., Hancock, W.W. Diff erential eff ects of cyclosporine A, methylprednisolone, mycophenolate, and rapamycin on CD154 induction and requirement for NFkappaB: implications for tolerance induction. Transplantation 70, 415-419 (2000).
9. Blaha, P., Bigenzahn, S., Koporc, Z., Schmid, M., Langer, F., Selzer, E., et al. The infl uence of immunosup-pressive drugs on tolerance induction through bone marrow transplantation with costimulation blockade. Blood 101, 2886-2893 (2003).
10. Porayko, M.K., Textor, S.C., Krom, R.A., Hay, J.E., Gores, G.J., Richards, T.M., et al. Nephrotoxic eff ects of primary immunosuppression with FK-506 and cyclosporine regimens after liver transplantation. Mayo Clin Proc 69, 105-111 (1994).
11. Cantarovich, M., Tzimas, G.N., Barkun, J., Deschenes, M., Alpert, E., Tchervenkov, J. Effi cacy of myco-phenolate mofetil combined with very low-dose cyclosporine microemulsion in long-term liver-transplant patients with renal dysfunction. Transplantation 76, 98-102 (2003).
12. Reich, D.J., Clavien, P.A., Hodge, E.E. Mycophenolate mofetil for renal dysfunction in liver transplant recipients on cyclosporine or tacrolimus: randomized, prospective, multicenter pilot study results. Transplantation 80, 18-25 (2005).
13. Gregori, S., Casorati, M., Amuchastegui, S., Smiroldo, S., Davalli, A.M., Adorini, L. Regulatory T cells induced by 1 alpha,25-dihydroxyvitamin D3 and mycophenolate mofetil treatment mediate trans-plantation tolerance. J Immunol 167, 1945-1953 (2001).
14. Demirkiran, A., Baan, C.C., Kok, A., Metselaar, H.J., Tilanus, H.W., van der Laan, L.J.W. Intrahepatic detec-tion of FOXP3 gene expression after liver transplantation using minimally invasive aspiration biopsy. Transplantation 83, 819-823 (2007).
15. Furtado, G.C., Curotto de Lafaille, M.A., Kutchukhidze, N., Lafaille, J.J. Interleukin 2 signaling is required for CD4(+) regulatory T cell function. J Exp Med 196, 851-857 (2002).
16. Wu, Y., Borde, M., Heissmeyer, V., Feuerer, M., Lapan, A.D., Stroud, J.C., et al. FOXP3 controls regulatory T cell function through cooperation with NFAT. Cell 126, 375-387 (2006).
17. Mantel, P.Y., Ouaked, N., Ruckert, B., Karagiannidis, C., Welz, R., Blaser, K., et al. Molecular mechanisms underlying FOXP3 induction in human T cells. J Immunol 176, 3593-3602 (2006).

Chap
ter 8
164
18. Demirkiran, A., Hendrix, T.K., Baan, C.C. and van der Laan, L.J.W. Impact of immunosuppressive drugs on CD4+CD25+FOXP3+ regulatory T cells: Does in vitro evidence translate to the clinical setting? Transplantation 85, 783-789 (2008).
19. Segundo, D.S., Ruiz, J.C., Izquierdo, M., Fernandez-Fresnedo, G., Gomez-Alamillo, C., Merino, R., et al. Calcineurin inhibitors, but not rapamycin, reduce percentages of CD4+CD25+FOXP3+ regulatory T cells in renal transplant recipients. Transplantation 82, 550-557 (2006).
20. Kreijveld, E., Koenen, H.J., Klasen, I.S., Hilbrands, L.B., Joosten, I. Following anti-CD25 treatment, a functional CD4+CD25+ regulatory T-cell pool is present in renal transplant recipients. Am J Transplant 7, 249-255 (2007).
21. Kohm, A.P., McMahon, J.S., Podojil, J.R., Begolka, W.S., DeGutes, M, Kasprowicz, D.J., et al. Cutting Edge: Anti-CD25 monoclonal antibody injection results in the functional inactivation, not depletion, of CD4+CD25+ T regulatory cells. J Immunol 176, 3301-3305 (2006).


Cha pter 9Summary
General Discussion
Samenvatting en Conclusie

Chap
ter 9
168
SUM MARY
For the last decades, solid organ transplantation is the most appropriate treatment for patients
with organ failure in terms of improving their quality of life and survival. Without any thera-
peutic interference, the immune system of the patient will reject the new organ, because it is
regarded as foreign. Acute cellular rejection can occur within several days after transplantation
and is mediated by Teff cells that will proliferate in response to antigens of the allograft. To
prevent allograft rejection, organ transplant patients need immunosuppression consisting of a
combination of immunosuppressive drugs (a calcineurin inhibitor, a proliferation inhibitor and
steroids). However, these drugs do not only suppress immune responses triggered by donor
antigens (anti-donor reactivity). They generally inhibit immune responses including those to
pathogens, leading to an increased number of infections. In particular CNIs and mTOR-inhibitors
have toxic side-eff ects to the kidneys and some classes of these immunosuppressive drugs
can cause cancer which can also be a major drawback for their long-term use. This a-specifi c
mode of action during the life long administration of immunosuppressive drugs demands a
more specifi c treatment after transplantation. However, for graft acceptance, suppression of
ongoing immune responses by immunosuppressive drugs is essential. Preferably, these drugs
must specifi cally target the donor-reactive Teff cells, which is rather complicated to establish.
The CD4+CD25brightFoxP3+CD127-/low T cells comprise an endogenous specialized subset
of T cells that govern immune responses against self-antigens and are therefore assigned
as regulatory T cells (Treg)1. These ‘suppressor’ cells may control proliferative immune
responses by eff ector T cells (Teff ) that are directed against the allograft. Next to the
CD4+CD25brightFoxP3+CD127-/low T cells, there is a diversity of Treg subsets with immunosup-
pressive activities: CD4negCD8neg T cells2, γδ-cells, natural killer T cells3, IL-10-producing Tr1 T
cells4, TGF-ß-producing Th3 T cells5 and CD8+CD25+FoxP3+ T cells. This dissertation focuses on
the role of CD4+FoxP3+CD25brightCD127neg/low T cells in transplantation patients. In addition,
the eff ect of immunosuppressive medication on their generation, characteristics and function
is studied. As an endogenous source, these Treg have a lot of potential to induce tolerance as
they can suppress the proliferation of donor-reactive Teff cells, which are held responsible for
the onset of cellular rejection of the graft after transplantation.
The main mechanism of action of the most often used immunosuppressive drugs for
transplant patients is that they directly and indirectly inhibit the proliferation of activated T
cells. These agents have diff erent targets on the T cell as they can block signal 1; T-cell receptor
triggering (CNIs) or signal 3; the cytokine signal (anti-CD25, Jak-inhibitor and mTor-inhibitor).
These immunosuppressive agents will not only exert their eff ect on activated T cells as the may
infl uence the frequency, phenotype and function of CD4+CD25brightFoxP3+CD127-/low T cells.
Recent experimental studies showed that these agents do not only hamper the function of Treg
but may also contribute to the mechanisms that control alloreactivity. Therefore it is tempting

Summary 169
to speculate that immunosuppressive drugs may even be used to manipulate the immune
system in favor of these T cells.
Little is known about the specifi c eff ects of immunosuppressive drugs on immune regulation
by Treg in humans. The central aim of this thesis is to investigate the eff ect of immunosuppres-
sive agents on immune regulation by CD4+CD25brightFoxP3+CD127-/low T cells in the peripheral
blood of organ transplant patients. The results in this dissertation may contribute to a better
understanding and may allow skewing of the immune system towards immune regulation by
a fi ne-tuned immunosuppressive therapy that is benefi cial for the patients’ Treg. An overview
of the diverse Treg subsets, the characteristics of CD4+CD25brightFoxP3+CD127-/low Treg and the
diff erent types of immunosuppressive drugs with their side-eff ects and mechanisms of action
at the cellular immunological level are described in chapter 1.
In chapter 2 we report that antigen-specifi c Treg are induced in kidney transplant patients
who received triple therapy consisting of cyclosporine, MMF and prednisone. The frequency
and function of CD25bright T cells of nine stable kidney-transplant patients before and 0.5 - 2
years after clinical kidney transplantation were measured. Within this relatively short period
after transplantation, patients can be considered as fully immune suppressed. To more accu-
rately study the function of CD25bright T cells post-transplant, we modifi ed the ‘conventional’
suppression assay in which pre-transplantation Treg function is determined by coculture with
allo-activated pre-transplantation Teff and post-transplantation Treg function by coculture with
allo-activated post-transplantation Teff . To exclude the infl uence of other confounding factors
after transplantation on the proliferation of Teff cells, which is the read-out of the suppression
assay, the suppressive capacities of Treg pre- and post transplantation were compared, whereas
the Teff population was kept constant (only of pre-transplantation). After transplantation, the
percentage of CD4+CD25bright T cells signifi cantly decreased. However, the lower percentage of
post-transplant CD4+CD25bright T cells was not associated with reduced, but rather improved
suppressor function of these cells. The proliferative response of pre-transplant Teff to donor-
antigens was more profoundly suppressed by post-transplant Treg than by pre-transplant
Treg and was comparable with third party antigens. In immune suppressed kidney transplant
patients, the donor-directed suppressive capacity of CD4+CD25bright Treg improved, which may
contribute to the development of donor-specifi c hyporesponsiveness against the graft.
In chapter 3, we questioned whether donor-specifi c CD4+CD25brightFoxP3+ cells are generated
after clinical kidney transplantation. Therefore, in a prospective study, the phenotype and
function of peripheral CD4+CD25bright T cells of patients before and 3, 6 and 12 months after
kidney transplantation were analyzed. Patients were equally randomized to treatment arm
1 with tacrolimus/rapamycin or arm 2 with tacrolimus/MMF. The immune regulatory capaci-
ties of CD4+CD25bright T cells were assessed by their depletion from PBMC and in co-culture
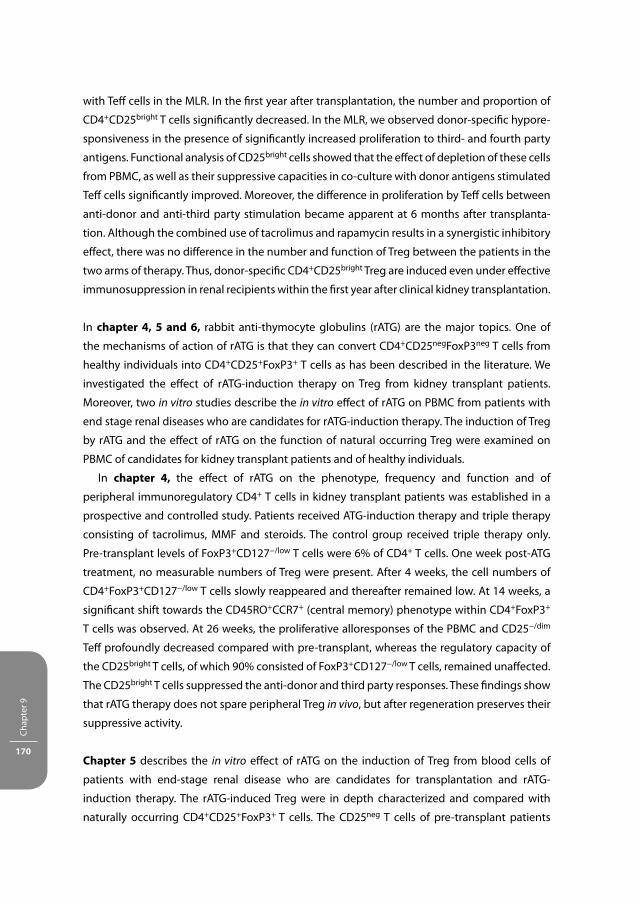
Chap
ter 9
170
with Teff cells in the MLR. In the fi rst year after transplantation, the number and proportion of
CD4+CD25bright T cells signifi cantly decreased. In the MLR, we observed donor-specifi c hypore-
sponsiveness in the presence of signifi cantly increased proliferation to third- and fourth party
antigens. Functional analysis of CD25bright cells showed that the eff ect of depletion of these cells
from PBMC, as well as their suppressive capacities in co-culture with donor antigens stimulated
Teff cells signifi cantly improved. Moreover, the diff erence in proliferation by Teff cells between
anti-donor and anti-third party stimulation became apparent at 6 months after transplanta-
tion. Although the combined use of tacrolimus and rapamycin results in a synergistic inhibitory
eff ect, there was no diff erence in the number and function of Treg between the patients in the
two arms of therapy. Thus, donor-specifi c CD4+CD25bright Treg are induced even under eff ective
immunosuppression in renal recipients within the fi rst year after clinical kidney transplantation.
In chapter 4, 5 and 6, rabbit anti-thymocyte globulins (rATG) are the major topics. One of
the mechanisms of action of rATG is that they can convert CD4+CD25negFoxP3neg T cells from
healthy individuals into CD4+CD25+FoxP3+ T cells as has been described in the literature. We
investigated the eff ect of rATG-induction therapy on Treg from kidney transplant patients.
Moreover, two in vitro studies describe the in vitro eff ect of rATG on PBMC from patients with
end stage renal diseases who are candidates for rATG-induction therapy. The induction of Treg
by rATG and the eff ect of rATG on the function of natural occurring Treg were examined on
PBMC of candidates for kidney transplant patients and of healthy individuals.
In chapter 4, the eff ect of rATG on the phenotype, frequency and function and of
peripheral immunoregulatory CD4+ T cells in kidney transplant patients was established in a
prospective and controlled study. Patients received ATG-induction therapy and triple therapy
consisting of tacrolimus, MMF and steroids. The control group received triple therapy only.
Pre-transplant levels of FoxP3+CD127−/low T cells were 6% of CD4+ T cells. One week post-ATG
treatment, no measurable numbers of Treg were present. After 4 weeks, the cell numbers of
CD4+FoxP3+CD127−/low T cells slowly reappeared and thereafter remained low. At 14 weeks, a
signifi cant shift towards the CD45RO+CCR7+ (central memory) phenotype within CD4+FoxP3+
T cells was observed. At 26 weeks, the proliferative alloresponses of the PBMC and CD25−/dim
Teff profoundly decreased compared with pre-transplant, whereas the regulatory capacity of
the CD25bright T cells, of which 90% consisted of FoxP3+CD127−/low T cells, remained unaff ected.
The CD25bright T cells suppressed the anti-donor and third party responses. These fi ndings show
that rATG therapy does not spare peripheral Treg in vivo, but after regeneration preserves their
suppressive activity.
Chapter 5 describes the in vitro eff ect of rATG on the induction of Treg from blood cells of
patients with end-stage renal disease who are candidates for transplantation and rATG-
induction therapy. The rATG-induced Treg were in depth characterized and compared with
naturally occurring CD4+CD25+FoxP3+ T cells. The CD25neg T cells of pre-transplant patients

Summary 171
and healthy controls were stimulated with rATG or control rabbit immunoglobulins (rIgG)
for 24 hr. After 24 hr of culture, the percentage of CD4+CD25+FoxP3+CD127neg/low T cells and
CD8+CD25+FoxP3negCD127+ T cells became higher in the rATG-treated samples compared with
the rIgG-treated samples. There was no diff erence between patients and healthy individuals.
The rATG-induced CD4+CD25+ and CD8+CD25+ T cells inhibited the allogeneic responses
of CD25neg/dim Teff as vigorously as natural CD4+CD25+ T cells. However, the proportion of
FoxP3+ within the top 2% rATG-induced CD4+CD25+ T cells was lower than within the natural
CD4+CD25+ T cells. The mRNA levels of IL-27, IL-10, IFN-γ, perforin and granzyme B were mark-
edly higher than in the natural CD25+ T cells, whereas CTLA4, TGF-β and RORγt were lower.
RATG allows the induction of cells with suppressive activities from patient PBMC in vitro. In
comparison with natural Treg the rATG-induced Treg are distinct on their phenotype and gene-
expression profi le, but have similar regulatory activities. Thus, rATG may benefi cially contribute
to the mechanisms that control alloreactivity.
In chapter 6, we elaborated on the in vitro Treg-induction capacity by rATG and addressed
whether rATG convert T cells into functional CD4+CD25+FoxP3+CD127neg/low T cells in the pres-
ence of drugs that may hamper their induction and function, i.e. CNIs. CD25neg T cells from
healthy individuals were stimulated with rATG or control rIgG in the absence and presence of
tacrolimus for 24 hr in culture. Interestingly, FoxP3+ T cells were also induced when tacrolimus
was present in the rATG-cultures. Blockade of the IL-2 pathway did not aff ect the frequency
of rATG-induced FoxP3+ T cells. The rATG-tacrolimus induced CD25+ T cells inhibited prolifera-
tive responses of alloantigen-stimulated Teff cells as vigorously as rATG-induced and natural
CD4+CD25+FoxP3+CD127neg/low T cells. In contrast to natural CD25+ T cells, rATG-induced CD25+
T cells abundantly expressed IL-10, IL-27, IFN-γ, perforin and granzyme B mRNA, whereas FoxP3
mRNA was expressed at a lower level. These mRNA data were confi rmed in Treg from kidney
transplant patients who received rATG induction therapy. The fi ndings of this study indicate
that tacrolimus does not aff ect the induction and function of CD4+CD25+ T cells, suggesting
that rATG may induce Treg in patients who receive tacrolimus maintenance therapy.
In chapter 7, we focused on the third signal that is required for T-cell growth and activation;
the cytokine signal. Cytokines of the IL-2 family that signal via the common γ chain activate the
Jak-STAT pathway. These cytokines are critical factors for the growth, diff erentiation and func-
tion of CD4+CD25neg/dim Teff cells and CD4+CD25bright Treg. In this study, we examined whether
CP-690,550 has an eff ect on the regulatory activity of CD4+CD25brightFoxP3+CD127-/low T cells.
The eff ect of CP-690,550 on the IL-2-induced intracellular STAT5-phosphorylation of Teff and
Treg was investigated in peripheral blood samples from healthy controls by phospho-specifi c
fl ow cytometry. The function of Teff and Treg from healthy individuals and kidney transplant
patients was examined by MLRs and suppression assays in the presence and absence of
CP-690,550. IL-2 induced phosphorylation of STAT5 was signifi cantly higher for CD4+CD25bright

Chap
ter 9
172
Treg than for CD4+CD25neg Teff . In the presence of 100 ng/mL CP-690,550, a clinically relevant
dose, the IL-2 induced P-STAT5 was partially inhibited in CD4+CD25bright Treg, whereas almost
completely blocked in the Teff . The IC50 was 2-3 times higher for Treg than for Teff cells. In the
presence of CP-690,550, the Treg exhibited additional suppressive activities on the alloactivated
proliferation of Teff . Also the CD4+CD25bright Treg from kidney transplant patients receiving
CP-690,550 therapy vigorously suppressed the proliferation of Teff . These fi ndings show that
the Jak-inhibitor CP-690,550 eff ectively inhibits Teff function but preserves the suppressive
activity of CD4+CD25bright Treg.
In chapter 8, we investigated the eff ects of conversion from CNI to IMPDH inhibitor (MMF)
monotherapy on renal function and on Treg frequency and phenotype in liver transplant recipi-
ents. Patients with renal impairment on CNI were converted to MMF and received a single dose of
IL-2-receptor blocking antibody (Daclizumab). Control patients continued CNI treatment. Renal
function rapidly and signifi cantly improved after conversion. Daclizumab treatment resulted
in blocking of CD25 at month 1 and a signifi cant reduction in the percentage of CD4+CD25+
cells but did not aff ect the percentage of CD4+CD25+Foxp3+ cells. Six months after conversion
to MMF, the percentage of CD4+CD25+Foxp3+ cells increased by 125%. FOXP3 mRNA analysis
of mononuclear cells confi rmed the enrichment of Foxp3 in peripheral blood. Interestingly,
the CD25 expression level on CD4+Foxp3+, but not CD4+Foxp3neg cells signifi cantly increased
compared with pre-conversion. Thus, conversion to MMF increases the percentage and CD25
expression of CD4+Foxp3+ cells indicating that MMF therapy can overturn the repressive eff ect
of CNI on circulating Treg levels and therefore may promote Treg-mediated suppression of
alloreactivity.

General Discussion 173
GENER AL DISCUSSION
Hyporesponsiveness to donor-antigens may occur through diff erent mechanisms including
T-cell and B-cell deletion, anergy, and immune regulation. Transplanted patients would benefi t
from immune-specifi c therapy that governs immune reactions which are specifi cally directed
against the allograft. The aspecifi c mechanisms of actions of the currently used immunosup-
pressive drugs lead to adverse reactions. Therefore, a cell based therapy specifi cally directed
against the donor graft may lead to an early onset of donor specifi c hyporesponsiveness as
compared with treatment with immunosuppressive drugs. Trials with Treg are indeed ongoing
as Tr1 cells are already infused into diabetes patients6 and used in hematopoietic stem cell
transplantation7, 8. In vitro expanded CD4+CD25+CD127- Treg have been transferred to patients
with acute or chronic graft versus host disease (GvHD) and allowed for signifi cant alleviation of
the symptoms9.
However, there are several major drawbacks with the in vitro expansion and reinfusion of
CD4+CD25brightCD127-/lowFoxP3+ T cells. First, isolation of a 100% pure FoxP3+ T cell population
is challenging due to the intracellular localization of FoxP3. Thus, surrogate surface markers
(CD25, CD127) can be used for isolation to enrich for FoxP3. Isolation of CD25brightCD127-/low T
cells seems to increase the purity for FoxP3 compared with isolation of T cells solely based on
CD25bright 10. Secondly, the culture conditions (medium, growth factors, time-span) to obtain
a high yield of donor-specifi c CD25brightCD127-/low T cells are not fully optimized yet. Thirdly,
once injected, the FoxP3-expression of the expanded cells might be unstable11 and can be lost
within an infl ammatory and activated microenvironment which may lead to the generation of
IL-17 producing cells12 or pathogenic memory T cells in vivo13.
Hence, it seems more attractive to manipulate the immune system with immunosuppressive
drugs by skewing the Teff -Treg balance towards the Treg. This can be done by in vivo generation
of Treg with current therapeutic drug regimens. Such a drug-therapy should stimulate immune
regulation by its benefi cial eff ects on Treg and would be more easily and rapidly applicable into
the clinic. It can be just a matter of reducing, adjusting and fi ne-tuning the doses of immunosup-
pressive drugs to benefi cially infl uence the Teff to Treg ratio in order to induce tolerance. With
this thesis, we aimed to reveal the eff ect of immunosuppressive agents on immune regulation
in order to fi nd the most optimal combination for a positive skewing of Treg by their induction,
expansion or sparing in organ transplant patients.
The infl uence of calcineurin inhibitors on regulatory T cells
In line with others14, 15, we show in chapter two that cyclosporine, as part of the immunosup-
pressive drug regimen of kidney transplant patients, contributes to a decrease in the frequency
of CD4+CD25bright T cells. This decline in the frequency is not only due to the CNI, but can also be
attributed to steroids. There is evidence showing that cyclosporine accounts for this decrease
in the frequency. Cyclosporine prevents the induction of FoxP3+ in the MLR16 and that it aff ects

Chap
ter 9
174
the frequency of CD4+CD25bright T cells in liver transplant patients 14, 17. Moreover, it has been
reported that cyclosporine aff ects another subset of Treg, the CD8+CD28neg T cells18. It is obvi-
ous that Treg need IL-2 to maintain their homeostasis and when the IL-2 production is blocked,
they immediately go into apoptosis.
In contrast to their frequency, we demonstrate that the function of the remaining CD25bright T
cells when analyzed ex vivo was not aff ected by the immunosuppressive therapy that included
cyclosporine, which is in line with another group18. TCR stimulation and cytokine signaling are
both required for Treg to properly exert their function. Hence, Treg function remains possible
because not all Teff cells are aff ected in their IL-2 production and there is enough IL-2 left for
Treg to exert their suppressive activities. Secondly, functional Treg are present because they
consume other cytokines of the IL-2 family, e.g. IL-15, of whom the production is calcineurin-
independent. Third, one has to take into account that there is also a small amount of calcineurin-
independent secretion of IL-2 itself that could explain the IL-2 that is present19.
Because of the inhibitory eff ect of immunosuppressive drugs and other factors on Teff cell
proliferation which is the read-out of Treg function post-transplant, we adjusted the ‘conven-
tional’ suppression assay to determine Treg function post-transplant, chapter two. The Teff of
pre-transplant was used as the read-out for Treg function post-transplant instead of the Teff
post-transplant, thereby excluding any intrinsic defect in the proliferative capacity caused by
immunosuppressive drugs. By using this diff erent suppression assay, we concluded that cyclo-
sporine does not aff ect Treg function.
An interesting future experiment could be to culture Treg in the presence of cyclosporine for
24 hr and to subsequently analyze their suppressive capacity in a suppression assay. However,
Treg probably will not survive the 24 hr of culture without TCR stimulation and may die; therefore
this can only be done in the presence of TCR-stimulation or IL-2 stimulation. Chapter seven, the
Jak-inhibitor study, also describes the eff ect of cyclosporine on the function of Treg from kidney
transplant patients treated with cyclosporine (the control group). In the presence of clinically
relevant levels of cyclosporine in the suppression assays, Treg from the cyclosporine-treated
patients were still able to additionally suppress the proliferation of the Teff cells that survived.
In this study, the results that were found in chapter two were confi rmed, as we show again that
Treg can exert their function during exposure to cyclosporine.
After analyzing the eff ect of CNI’s on the suppressive activity of Treg, we subsequently
examined their eff ect on the induction of Treg in vitro. In the literature, it has been shown that
rATG induces Treg in CD25neg cells from healthy individuals20. However, in chapter four we
stated that Treg levels did not increase in kidney patients after rATG-treatment but declined
and slowly recovered during standard immunosuppression consisting of tacrolimus, MMF and
prednisone. Considering that IL-2 is an essential growth factor that is required for the genera-
tion of Treg21, 22 we speculated that the replenishment of Treg into the peripheral compartment
of these patients might be delayed by tacrolimus that prevents Treg induction. This hypothesis
was studied in vitro by Treg-induction experiments in the presence of tacrolimus. Interestingly,

General Discussion 175
Treg were generated by rATG even in the presence of tacrolimus, anti-IL-2R antibody or anti-IL-2
antibody. The stimulatory eff ect of rATG, which includes enhanced NFAT1-expression20 is domi-
nantly present and can overturn the repressive eff ect of tacrolimus. Therefore, rATG-induction
therapy may allow the replenishment of functional Treg under standard therapy.
Furthermore, an important fi nding was that CNI therapy does not changes the phenotype
and composition of naïve/memory Treg post transplant as we observed in chapter four in the
control group for the rATG-group that received tacrolimus, MMF and prednisolone. Accord-
ing to our fi ndings, the CNI-dose that is used for organ transplant patients is deleterious for
Teff cells and does not aff ect Treg. The CNI dose can be reduced, to fi nd a proper balance that
preserves Treg numbers; however, it is questionable whether this will not lead to an increased
number of (acute) rejections. Most importantly, CNIs allow immune regulation of the remaining
Teff by Treg that are spared.
Immunosuppressive therapy and the induction of donor-specifi c regulatory T cells
In chapters two, three, and four we show that the proliferation of donor-directed immune
responses by Teff cells is signifi cantly lower than the third party immune responses after
coculture with Treg post-transplant in the suppression assay. This observation implies that
donor-specifi c Treg are generated within 1 year after transplantation under the infl uence of
maintenance therapy (consisting of a CNI or rapamycin, MMF and prednisolone). Donor-spe-
cifi c Treg are generated in the periphery and can be considered as adaptive Treg. The immune
system adapts to donor antigens by the generation of these donor-specifi c Treg. Whereas
the third party response of PBMC improves as can be seen in chapter three, the responses
against the donor are lower and remain at a stable level. Inversely, the donor-specifi c regulation
improves after transplantation, whereas the regulation of third party responses remains stable.
It is unknown whether these Treg are generated as a result of adaptation; as they may also
be characterized as natural occurring Treg that respond by cross reactivity and recognize part
of the donor-antigens as their own. For instance, Treg may suppress responses against broad
HLA-antigens (e.g. HLA-Bw4 and HLA-Bw6). On the other hand, Treg suppression might be HLA-
restricted in a way that Treg only inhibit responses that have a certain HLA- A, B or DR subtype
(e.g. if the patient has a HLA-B51-specifi city, Treg of the patient may recognize HLA-B51 that
may be present on donor (stimulator cells in the MLR). The Treg of the patient will suppress the
immune responses that are considered to be directed against these ‘self’ antigens.
In chapter four, we determined the function of the Treg present in the peripheral blood at
26 weeks after transplantation when the number of Treg in the peripheral blood was suffi cient
to isolate the induced Treg and to study their function. The Treg from patients in the rATG-group
seem to govern the donor-directed immune responses by Teff cells more vigorously than the
third party immune responses. The Treg from kidney transplant patients in the control group
(thus without rATG induction therapy) did not show this trend, indicating that rATG-induction
therapy may trigger the generation of donor-specifi c Treg.

Chap
ter 9
176
A condition for the induction of Treg is T cell receptor signaling which can be triggered by
the presence of suboptimal, low dose antigen. Furthermore, cytokines and growth factors are
also required. Thus, donor antigens that are present after transplantation and rabbit proteins
from the rATG mixture both may serve as the trigger for activation of the immune system
and the following induction of donor-specifi c adaptive Treg. Another phenomenon that may
explain the induction of donor-specifi c Treg is the homeostatic proliferation after rATG-induced
T-cell depletion in the presence of donor-antigens. This homeostatic proliferation accounted
for the massive increase in the proportion of memory FoxP3+CD45RO+ T cells that may have
generated donor-directed specifi city. Taken together, donor-specifi c regulatory T cells can be
generated during standard maintenance immunotherapy by their regeneration in the thymus
or may be induced in the presence of donor antigens in the periphery. RATG-induction therapy
may accelerate the induction of donor-specifi c Treg process by homeostatic proliferation after
immune depletion and by the induction of T cells with suppressive function.
In vitro induction of regulatory T cells by rATG
Apart from depletion of lymphocytes in vivo, rATG induces Treg in vitro20. One can speculate
about the active component in the rATG mixture that in vitro triggers the induction of CD25
and FoxP3-expression. Although this thesis is predominantly focused on FoxP3+CD25+ T cells,
interestingly, rATG also induced FoxP3negCD25neg/dim T cells with suppressive activities after 24
hr of culture (30% inhibition at a [Treg: Teff ] ratio of 1:10). Apparently, rATG confers regulatory
activity to cells in a FoxP3-independent manner.
As we demonstrate Treg induction in CD25neg cells the absence of allo-antigen stimulation,
it remains to be investigated whether there is conversion of allo-activated CD25neg Teff cells to
Treg during the 7-day MLR in the presence of rATG. If this phenomenon occurs in the MLR, it
will have a positive eff ect in the 7-day suppression assay, in which alloactivated Teff cells were
cocultured with natural Treg in the presence of rATG. Potential rATG-induced Treg may syner-
gise with the existing natural Treg in the downregulation of alloactivated Teff cells. We show in
chapter fi ve that the rATG aff ected alloactivated Teff response is additionally inhibited by Treg.
It is interesting to dissect the components of the rATG-immunoglobulins mixture. The human
thymocyte suspensions are derived from thymus fragments that were surgical waste during
cardiac surgery in children. Thymus donors must be less than 14 years old and fi t the selection
criteria. They must also be at low risk for Creutzveldt-Jacob disease and other transmissible
subacute spongiform encephalopathies. Blood samples from these donors are screened for a
number of viruses. After sensitization of specifi c pathogen-free rabbits with human thymus
fragments, γ immune globulins are purifi ed and pasteurized. The immunosuppressive product
contains cytotoxic antibodies directed against a broad array of surface antigens expressed on
T cells and adhesion molecules including CD2, CD3/TCR, CD4, CD8, CD11a, CD25, CD28, CD45,
HLA-Class I and II.

General Discussion 177
Factors that infl uence the in vivo induction of Treg include the strength of the co-stimulatory
molecules and TCR-mediated signals, microenvironmental factors and the cytokine milieu23-25.
Rabbit proteins could be the potential TCR trigger for in vitro Treg induction. Taking this into
account, we incubated human CD25neg T cells with control polyclonal rabbit immunoglobu-
lins. After 24 hr there was no induction of CD25 or FoxP3 expression. Moreover, Feng et al.20
reported that horse-ATG does not have the ability to induce or expand Treg, showing that the
part of the immunoglobulins that is arranged in a diff erent species does not stimulate the
TCR. Apparently, the variable part of the immunoglobulins that is directed against epitopes
on human T cells is responsible for TCR stimulation. For future research, it would therefore be
interesting to separate the variable from the constant part of the antibodies after purifi cation
of the antibodies from rabbits and incubate these parts separately with human CD25neg T cells
in vitro. Another idea for future research is to investigate whether a non-depleting rATG mixture
that is directed against the lymphoblastic Jurkat T-cell line is also able to induce Treg in vitro. It
has been reported that Fresenius ATG did not enhance Treg levels in kidney transplant patients
after transplantation26.
The development of immune regulation and immunoregulatory mechanisms is often elic-
ited as a feedback mechanism during alloactivation to prevent the outgrowth of aggressive Teff
cells. Thus, rATG induces CD25-expression on CD25neg cells and when they become activated,
Treg arise to downregulate this activation status. As it is well known that FoxP3 is an activa-
tion marker, one could speculate that the FoxP3-expression induced in T cells induced by rATG
functions as a T-cell activation marker. Other evidence for this statement was derived from the
mRNA expression profi les that showed that granzyme B also served as an activation marker as
the granzyme B-expression by rATG-induced CD25+ T cells did not result in cytotoxicity. In our
hands, high mRNA- and protein levels did not automatically correlate with functional activity.
To prove that Treg induction was rATG-specifi c, and not the result of a-specifi c T-cell activa-
tion, we included an essential control experiment. We showed that CD3/CD28 activated CD25+
cells did not inhibit allogeneic immune responses and that our rATG-induced CD4+CD25+ and
CD8+CD25+ T cells were able to suppress allogeneic immune responses, by not only autolo-
gous Teff cells but even allogeneic Teff cells. The latter fi nding shows that they can suppress
the proliferation of each activated T cell, independent of the HLA-specifi city. Moreover, they
suppress their cytokine production and their proliferation, which is a characteristic of natural
CD4+CD25bright Treg, indicating that there is no ‘sopping up’ or scavenging of growth factors
which is a characteristic of activated T cells.
If granzyme B is not responsible for the suppressive capacity of the rATG-induced Treg,
which molecule ìs? Besides IL-10 and granzyme B, we found that IL-27 was signifi cantly upregu-
lated. However, one of the functions of IL-27 is that it upregulates granzymes and perforins and
stimulates cytotoxicity via CD8+ T cells. Cytotoxicity may play an important role in elimination
of T cells in vivo.

Chap
ter 9
178
Future research may focus on the stability of the rATG-induced Treg that can be tested
according to the methylation-sites of FOXP3. These methylation sites are found to be a novel
target to explore within the experimental fi eld of Treg. True ‘bona fi de’ Treg can be identifi ed
in a heterogeneous population including activated T cells that transiently express FoxP3
and Treg that constitutively express FoxP327. It would therefore be interesting to unravel the
methylation-status of FoxP3 Treg-specifi c demethylated regions (TSDR) to determine whether
the expression of FoxP3 is stable or not; this could reveal something about the stability and
presence of Treg. To become Treg, T cells can be incubated with a DNA demethylation agent.
Demethylation of FOXP3 gene has been shown to increase the number of Treg in experimental
models28. Wieczorek et al. analyzed FOXP3 demethylation prior to and after rATG treatment.
According to a decline of demethylated sites in the FOXP3 gene on the DNA after rATG-treat-
ment, they found that Treg levels decreased27. They concluded that DNA Methylation Analysis
of FOXP3 can be used to quantify Treg because demethylation of the FOXP3 TSDR is a feature
of stable ‘bona fi de’ Treg27.
rATG induction therapy depletes regulatory T cells
The clinical relevance of the rATG-induced T cells with suppressive function in the presence
of high dose rATG that is given in the clinic is hard to deduce. In chapter four we reported
that the CD4+CD25brightFoxP3+CD127-/low T cells are completely depleted after three doses of
2 mg/kg rATG and slowly reappear slowly at 4 weeks after rATG-induction therapy. Their level
does not reach baseline in the fi rst 26 weeks after treatment. Other groups have demonstrated
that the recovery of CD4+ T cells can take for more than fi ve years and the levels still do not
reach baseline levels29. The origin of Treg that reappear in the peripheral blood at 14 and 26
weeks after rATG-treatment is unknown. They might be replenished by the lymphoid organs or
they might be newly thymus-derived emigrants. The idea of thymus-derived generation is sup-
ported by a study with non-human primates, in whom rATG-mediated T-cell depletion occurs
in all compartments of the body. Regeneration is only possible by the thymus which is the only
source of Treg present in the periphery.
The phenotype of the FoxP3+ T cells present in the blood after rATG-treatment changes,
as the number of naïve FoxP3+ T cells decreased after rATG-treatment and memory FoxP3+
T cells increased. This change is due to the homeostatic proliferation of memory T cells that
are replenished. Otherwise, they could be converted from naïve T cells into memory T cells
in the periphery in the presence of suboptimal doses of antigens (induction). Whether there
is induction in vivo (thus conversion from CD25negFoxP3neg T cells to CD25+FoxP3+ T cells) is
complicated to investigate in patients. We did not fi nd an increase in the proportion or absolute
numbers. Publications with enhanced Treg frequencies after rATG-induction therapy or that
demonstrate the suppressive capabilities of Treg immediately after rATG-induction therapy are
lacking. However, Treg induction is still an option when rATG is present in the body. Thus, in the
fi rst weeks after rATG-treatment, rATG may induce T cells, until it is broken down. In contrast, we

General Discussion 179
found that in between rATG-treatment and 4 weeks after treatment, T-cell depletion prevailed
and no T cells were present in the circulation, chapter four. After rigid depletion of T cells,
they start to slowly recover so conversion of Teff into Treg may occur. Although patients receive
maintenance therapy consisting of a CNI, this should not be a restriction for Treg-induction,
as clearly demonstrated in chapter fi ve. The only explanation for the absence of enhanced
Treg numbers could be the absence of components of the complement-system in vitro. RATG
eliminates peripheral blood cells by inducing cell-death via complement-dependent lysis. In
chapter fi ve, we demonstrate in vitro apoptosis of PBMC at high concentrations of rATG that
resulted in an even higher proportion of Treg among the cells that survived. In contrast, in vivo,
all T cells die after rATG-induction therapy and there is no sparing or survival (of a selective
subset) of cells. Therefore, the confounding factor is to be identifi ed.
The fi ndings described in this thesis can therefore contribute to the determination of the
right choice and dosage adjustment of immunosuppressive drugs. This dissertation may con-
tribute in making the right combination of ‘pro-tolerogenic’ drugs. According to the fi ndings
of this thesis, some recommendations for treatment of transplant patients with rATG induction
therapy can be made. First, rATG induction therapy should be given to candidates for kidney
transplantation prior to transplantation; to deplete Teff cells and to create the most optimal
circumstances for antigen-specifi c induction of Treg before infl ammation is elicited, instead
of during infl ammation. A study in which CD4+FoxP3+ regulatory T cells were quantifi ed in
kidney allograft infi ltrates showed that their proportion of CD4+ T cell infi ltrates was higher in
the borderline change and subclinical cellular rejection biopsies than in acute cellular rejection
biopsies. In the acute phase of the allogenic response, these regulatory T cells could act to
diminish the interstitial infl ammation and its associated lesions30. Secondly, if potent enough
to prevent graft rejection, patients should receive a rATG dose of <2 mg/kg (at this particular
dose, total depletion of Treg occurs), to allow Treg induction. Partial depletion might trigger
immune activation, induction of regulatory T cells and expansion of the remaining natural
Treg that survive. In this manner, Treg numbers will recover earlier because there is no harsh
immunodepletion. In particular the recovery of Treg by the thymic output and their induction
in the periphery in the presence of donor-antigens may contribute to donor-specifi c hypore-
sponsiveness, which is favorable for the patient. Moreover, in the presence of a low rATG dose,
the immune system will not be prone to (viral) infections, as with high doses but is able to cope
with these pathogens by triggering a proper immune response.
Calcineurin-free protocols and regulatory T cells
As shown by our data, Treg do not require STAT5 signaling to exert their function. Inhibition
of Jaks which results in the suppression of STAT5 phosphorylation in the presence of clinically
relevant doses of CP-690,550 does not infl uence their suppressive activities. We therefore
suggest that STAT5 signaling is only considered necessary for the induction of de novo FoxP3-
expression and thus for the generation of de novo Treg. The clinical signifi cance of CP-690,550 in

Chap
ter 9
180
the prevention of graft rejection is currently still investigated in a clinical trial phase. The results
of a randomized pilot trial with CP-690,550 (part of the phase II study) showed that treatment of
kidney transplant patients with CP-690,550 did result in clinically relevant immunosuppression
comparable with the tacrolimus control group31. If CP-690,550 prevents graft rejection and
improves graft function by the end of the trial phases, it can be considered as a drug therapy
that is ‘harmless’ to Treg function, whereas Treg frequency is aff ected. A previous paper from our
group show that Treg numbers recovered quickly after CP-690,550 therapy32. Donor-specifi c
immune regulation by the immune system is not aff ected by all immunosuppressive drugs that
are investigated in the present thesis.
To examine the impact of the Jak-inhibitor CP-690,550 on Teff and Treg subsets, we used
phospho-specifi c fl ow cytometry, chapter seven. This technique allowed us to characterize
the IL-2 induced STAT5 phosphorylation downstream of Jak in Treg and Teff cells. Furthermore,
by using this technique, we revealed diff erential levels of STAT5 phosphorylation in Treg versus
Teff in the presence of the Jak-inhibitor CP-690,550. The observed diff erence in sensitivity for
CP-690,550 in Treg versus Teff was confi rmed in functional assays.
It can be interesting to study the infl uence of an immunosuppressive drug in patients by
obtaining blood and then in vitro perform functional tests. However, one has to take into
account that the immunosuppressive drug has already exerted its eff ect on the blood cells.
Therefore, functional experiments should be performed in the presence of therapeutic concen-
trations of the drugs, or after incubation of the Treg separately for 24 hr and then tested for their
function in a suppression assay which may reveal the eff ect of these drugs on the function of
directly. In this way we are able to demonstrate that the immunosuppressive drugs can target
T cells in the concentrations that correlate with the trough levels as measured in the patients.
In chapter eight we demonstrate that the level of FoxP3+ cells increased after conversion
from a CNI to MMF. Conversion to MMF therapy can actually reverse the suppressive eff ect
of CNI on the percentage of Treg in circulation. Whether the FoxP3+ Treg in the presence of
MMF modulates anti-donor reactivity after liver transplantation is to be tested. However, in
kidney transplant patients that were converted to MMF monotherapy, the suppressive capacity
of CD4+CD25brightFoxP3+ T cells was preserved33. Rapamycin has been shown to be a benefi -
cial agent for Treg because it renders Treg less prone to apoptosis than activated Teff cells16,
34. Conversion of triple therapy consisting of tacrolimus, MMF and prednisone to rapamycin
monotherapy has been shown to increase Treg numbers in kidney transplant patients33. The
suppressive activities on the anti-donor proliferation by Treg in the presence of rapamycin
monotherapy were comparable with before conversion to rapamycin33. For rapamycin, the
preservation of Treg suppressive capacity is due to the maintenance of their FoxP3 mRNA
expression16. These results were also supported by an animal experimental model of graft
versus host disease that showed that rapamycin and MMF preserve the suppressive function
of Treg35.

General Discussion 181
Conclusion: Immunosuppressive drug therapy that promotes regulatory T cells
CNIs do not aff ect Treg function, which is most important, but do aff ect the frequency of Treg.
Yet, CNI-free protocols (CP-690,550, MMF or rapamycin) are ‘Treg-sparing’ because these pro-
tocols induce a rapid recovery of Treg, which can even result in enhanced levels compared to
baseline. This rapid recovery of functional Treg allows immune regulation when it is needed
most; early after transplantation during infl ammation and an elevated activation state of the
immune system. The combination of a T-cell depleting agent with rapamycin increase de novo
Treg, as has been reported before36. RATG induction therapy and MMF or rapamycin mainte-
nance therapy would be a Treg-promoting regimen. We show that conversion from CNI to MMF
clinically clearly results in an improvement of renal function and a decrease of blood pressure
in liver transplant patients. Conversion from a CNI to rapamycin has been reported to improve
renal function, with acceptable rates of adverse events37.
The world-wide transplantation program ‘Kidney Disease Improving Global Outcomes’
(KDIGO) and the Transplantation Society recommend -at the time of writing- anti-IL-2R induc-
tion therapy for all kidney transplantation patients in combination with maintenance therapy
consisting of a CNI and MMF38. These recommendations by the KDIGO were made from a clini-
cal point of view as they prevent graft rejection by the inhibition of alloreactivity. A (possible)
favorable eff ect of immunosuppressive drugs on immune regulation by the immune systems’
endogenous source of regulatory T cells was not explored.
The present dissertation provides two key messages. First, we show that Treg are generated
during immunosuppressive therapy which allows us to move the Teff -Treg balance from Teff
cells towards Treg with the right choice and combination of immunosuppressive agents.
Second, the research described in this thesis may also contribute in fi ne-tuning the immuno-
suppressive regimen after organ transplantation in favor of regulatory T cells in the periphery,
that are involved in donor-specifi c hyporesponsiveness. Fine-tuning implies that the dosage
given to the patient aff ects or eliminates Teff cells, whereas at the same time maintaining Treg
levels and their function. For all drugs used in this thesis, mixed lymphocyte reactions and sup-
pression assays in the presence of the immunosuppressive drug of relevance, were performed
to mimic the in vivo immune responses. A summary of the impact of the immunosuppressive
drugs on immune regulation as described in this thesis is depicted in Table 1.
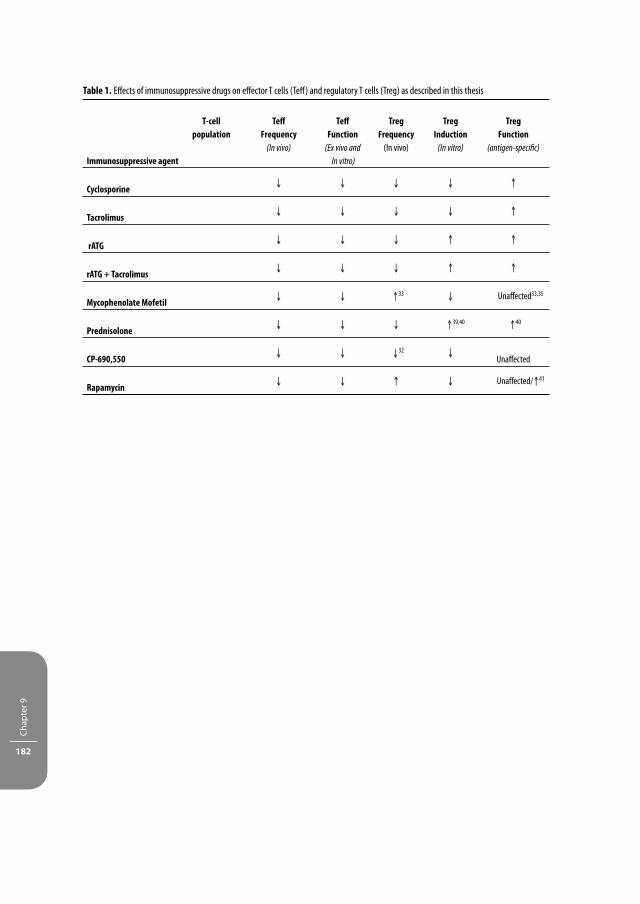
Chap
ter 9
182
Table 1. Eff ects of immunosuppressive drugs on eff ector T cells (Teff ) and regulatory T cells (Treg) as described in this thesis
Immunosuppressive agent
T-cell population
Teff Frequency
(In vivo)
Teff Function
(Ex vivo and
In vitro)
TregFrequency
(In vivo)
TregInduction
(In vitro)
TregFunction
(antigen-specifi c)
Cyclosporine↓ ↓ ↓ ↓ ↑
Tacrolimus↓ ↓ ↓ ↓ ↑
rATG↓ ↓ ↓ ↑ ↑
rATG + Tacrolimus↓ ↓ ↓ ↑ ↑
Mycophenolate Mofetil↓ ↓ ↑33 ↓ Unaff ected33,35
Prednisolone↓ ↓ ↓ ↑39,40 ↑40
CP-690,550↓ ↓ ↓32 ↓
Unaff ected
Rapamycin↓ ↓ ↑ ↓ Unaff ected/↑41

General Discussion 183
REFERENCES
1. Sakaguchi, S. et al. Immunologic tolerance maintained by CD25+ CD4+ regulatory T cells: their com-mon role in controlling autoimmunity, tumor immunity, and transplantation tolerance. Immunol Rev 182, 18-32 (2001).
2. Zhang, Z.X., Yang, L., Young, K.J., DuTemple, B. & Zhang, L. Identifi cation of a previously unknown antigen-specifi c regulatory T cell and its mechanism of suppression. Nat Med 6, 782-789 (2000).
3. Seino, K.I. et al. Requirement for natural killer T (NKT) cells in the induction of allograft tolerance. Proc Natl Acad Sci U S A 98, 2577-2581 (2001).
4. Roncarolo, M.G. et al. Interleukin-10-secreting type 1 regulatory T cells in rodents and humans. Immu-nol Rev 212, 28-50 (2006).
5. Weiner, H.L. Oral tolerance: immune mechanisms and the generation of Th3-type TGF-beta-secreting regulatory cells. Microbes Infect 3, 947-954 (2001).
6. Brusko, T. & Bluestone, J. Clinical application of regulatory T cells for treatment of type 1 diabetes and transplantation. Eur J Immunol 38, 931-934 (2008).
7. Gregori, S., Bacchetta, R., Hauben, E., Battaglia, M. & Roncarolo, M.G. Regulatory T cells: prospective for clinical application in hematopoietic stem cell transplantation. Curr Opin Hematol 12, 451-456 (2005).
8. Battaglia, M., Gregori, S., Bacchetta, R. & Roncarolo, M.G. Tr1 cells: from discovery to their clinical application. Semin Immunol 18, 120-127 (2006).
9. Trzonkowski, P., Bieniaszewska, M., Júscinska, J. et al. First-in-man clinical results of the treatment of patients with graft versus host disease with human ex vivo expanded CD4+CD25+CD127- T regula-tory cells. Clin Immunology 133, 22-26 (2009).
10. Liu, W. et al. CD127 expression inversely correlates with FoxP3 and suppressive function of human CD4+ T reg cells. J Exp Med 203, 1701-1711 (2006).
11. Hoff mann, P. et al. Loss of FOXP3 expression in natural human CD4+CD25+ regulatory T cells upon repetitive in vitro stimulation. Eur J Immunol 39, 1088-1097 (2009).
12. Koenen, H.J. et al. Human CD25highFoxp3pos regulatory T-cells diff erentiate into IL-17 producing cells. Blood 112, 2340-2352 (2008).
13. Zhou, X. et al. Instability of the transcription factor Foxp3 leads to the generation of pathogenic memory T cells in vivo. Nat Immunol 10, 1000-1007 (2009).
14. Demirkiran, A. et al. Decrease of CD4+CD25+ T cells in peripheral blood after liver transplantation: association with immunosuppression. Transplant Proc 37, 1194-1196 (2005).
15. San Segundo, D. et al. Calcineurin inhibitors aff ect circulating regulatory T cells in stable renal trans-plant recipients. Transplant Proc 38, 2391-2393 (2006).
16. Baan, C.C. et al. Diff erential eff ect of calcineurin inhibitors, anti-CD25 antibodies and rapamycin on the induction of FOXP3 in human T cells. Transplantation 80, 110-117 (2005).
17. San Segundo, D., Fabrega, E., Lopez-Hoyos, M. & Pons, F. Reduced numbers of blood natural regula-tory T cells in stable liver transplant recipients with high levels of calcineurin inhibitors. Transplant Proc 39, 2290-2292 (2007).
18. Calvo-Turrubiartes, M. et al. Quantitative analysis of regulatory T cells in kidney graft recipients: A relationship with calcineurin inhibitor level. Transpl Immunol 21, 43-49 (2009).
19. Roifman, C.M., Mills, G.B., Cheung, R.K. & Gelfand, E.W. Mitogenic response of human thymocytes: identifi cation of functional Ca2+-dependent and independent signals. Clin Exp Immunol 66, 139-149 (1986).
20. Feng, X. et al. Rabbit ATG but not horse ATG promotes expansion of functional CD4+CD25highFOXP3+ regulatory T cells in vitro. Blood 111, 3675-3683 (2008).
21. Fontenot, J.D., Rasmussen, J.P., Gavin, M.A. & Rudensky, A.Y. A function for interleukin 2 in Foxp3-expressing regulatory T cells. Nat Immunol 6, 1142-1151 (2005).
22. Maloy, K.J. & Powrie, F. Fueling regulation: IL-2 keeps CD4+ Treg cells fi t. Nat Immunol 6, 1071-1072 (2005).

Chap
ter 9
184
23. Zhou, L., Chong, M.M. & Littman, D.R. Plasticity of CD4+ T cell lineage diff erentiation. Immunity 30, 646-655 (2009).
24. Josefowicz, S.Z. & Rudensky, A. Control of regulatory T cell lineage commitment and maintenance. Immunity 30, 616-625 (2009).
25. Curotto de Lafaille, M.A. & Lafaille, J.J. Natural and adaptive foxp3+ regulatory T cells: more of the same or a division of labor? Immunity 30, 626-635 (2009).
26. Louis, S. et al. Long-term cell monitoring of kidney recipients after an antilymphocyte globulin induc-tion with and without steroids. Transplantation 83, 712-721 (2007).
27. Wieczorek, G. et al. Quantitative DNA methylation analysis of FOXP3 as a new method for counting regulatory T cells in peripheral blood and solid tissue. Cancer Res 69, 599-608 (2009).
28. Zheng, Q. et al. Induction of Foxp3 demethylation increases regulatory CD4(+)CD25 (+) T cells and prevents the occurrence of diabetes in mice. J Mol Med 87, 1191-1205 (2009).
29. Martins, L. et al. Long-term eff ects of ATG therapy on lymphocyte subsets. Transplant Proc 33, 2186-2187 (2001).
30. Tafl in, C. et al. Regulatory T cells in kidney allograft infi ltrates correlate with initial infl ammation and graft function. Transplantation 89, 194-199.
31. Busque, S. et al. Calcineurin-inhibitor-free immunosuppression based on the JAK inhibitor CP-690,550: a pilot study in de novo kidney allograft recipients. Am J Transplant 9, 1936-1945 (2009).
32. van Gurp, E.A. et al. The eff ect of the JAK inhibitor CP-690,550 on peripheral immune parameters in stable kidney allograft patients. Transplantation 87, 79-86 (2009).
33. Hendrikx, T.K. et al. Monotherapy rapamycin allows an increase of CD4 CD25 FoxP3 T cells in renal recipients. Transpl Int 22, 884-891 (2009).
34. Strauss, L., Czystowska, M., Szajnik, M., Mandapathil, M. & Whiteside, T.L. Diff erential responses of human regulatory T cells (Treg) and eff ector T cells to rapamycin. PLoS One 4, e5994 (2009).
35. Zeiser, R. et al. Inhibition of CD4+CD25+ regulatory T-cell function by calcineurin-dependent interleu-kin-2 production. Blood 108, 390-399 (2006).
36. Bloom, D.D. et al. CD4+ CD25+ FOXP3+ regulatory T cells increase de novo in kidney transplant patients after immunodepletion with Campath-1H. Am J Transplant 8, 793-802 (2008).
37. Egbuna, O.I. et al. Outcomes with conversion from calcineurin inhibitors to sirolimus after renal trans-plantation in the context of steroid withdrawal or steroid continuation. Transplantation 88, 684-692 (2009).
38. Kidney Disease: Improving Global Outcomes Transplant Work, G. KDIGO clinical practice guideline for the care of kidney transplant recipients. Am J Transplant 9 Suppl 3, S1-155 (2009).
39. Karagiannidis, C. et al. Glucocorticoids upregulate FOXP3 expression and regulatory T cells in asthma. J Allergy Clin Immunol 114, 1425-1433 (2004).
40. Chen, X., Oppenheim, J.J., Winkler-Pickett, R.T., Ortaldo, J.R. & Howard, O.M. Glucocorticoid ampli-fi es IL-2-dependent expansion of functional FoxP3(+)CD4(+)CD25(+) T regulatory cells in vivo and enhances their capacity to suppress EAE. Eur J Immunol 36, 2139-2149 (2006).
41. Battaglia, M. et al. Rapamycin and interleukin-10 treatment induces T regulatory type 1 cells that mediate antigen-specifi c transplantation tolerance. Diabetes 55, 40-49 (2006).

Samenvatting 185
SAME NVATTING
Orgaantransplantatie is de ultieme behandelingsmogelijkheid voor patiënten met een falend
orgaan. Het probleem dat zich echter voordoet na orgaantransplantatie is dat het immuunsys-
teem van de patiënt het nieuwe orgaan echter als lichaamsvreemd ziet en het transplantaat
daarom kan afstoten. Sir Peter Medawar heeft in 1944 in een huidtransplantatiemodel in het
konijn ontdekt dat transplantaatafstoting een verworven activiteit is van het immuunsysteem1.
In 1945, leidde een transplantatie bij tweelingkalveren met een gemeenschappelijke placenta
en daardoor dezelfde weefselkenmerken, tot het besef dat orgaantransplantatie alleen kan
slagen, indien de immuunreactie van de ontvanger tegen het transplantaat kan worden voor-
komen of onderdrukt2. Dit werd bevestigd door de eerste succesvolle niertransplantatie bij de
mens, bij een eeneiige tweeling, waar donor en ontvanger ook identiek waren voor hun weef-
selkenmerken3. Tussen niet-identieke personen is naast een zo groot mogelijke overeenkomst
tussen weefselkenmerken van donor en ontvanger, onderdrukking van de immuunreactie bij
de ontvanger noodzakelijk.
De ontdekking van de eerste geneesmiddelen die immuunreacties tegen het transplantaat
onderdrukken (ook wel immunosuppressiva genoemd), zorgden ervoor dat goede trans-
plantaatoverleving niet alleen voorkwam bij transplantaties tussen familieleden. Door betere
weefseltyperingen en het voortgaande onderzoek naar nieuwe en eff ectievere immunosup-
pressieve geneesmiddelen, werd het ook mogelijk om transplantaties tussen niet-verwante
personen te verrichten4.
Immuunreacties worden gemedieerd door T cellen van het immuunsysteem, een gespeci-
aliseerde groep cellen die in de thymus wordt gegenereerd (Figuur 1 introduction) en zich via
de bloedbaan verplaatst via de lymfebanen naar de lymfeklieren, of naar het bolwerk van T
cellen in de milt. In de lymfeklieren komen T cellen in aanraking met partikels (antigenen) die
afkomstig zijn van bacteriën en virussen. Omdat deze antigenen lichaamsvreemd zijn, zullen T
cellen hierop reageren door een immuunreactie op gang te brengen. Zo zorgen zij ervoor dat
alles wat lichaamsvreemd is, verwijderd wordt uit het lichaam. In een immuunreactie krijgen
T cellen door middel van antigenen het signaal om in actie te komen (raken geactiveerd) en
gaan vervolgens interleukine-2 (IL-2) produceren; een groeifactor dat zij nodig hebben voor
hun groei (proliferatie) en rijping (diff erentiatie). Door de massale productie en consumptie
van IL-2 worden T cellen gestimuleerd om zich te vermenigvuldigen (expanderen) en om uit te
rijpen tot zogenaamde ‘eff ector’ T cellen (T-eff ). Deze T-eff cellen vallen vervolgens bacteriën en
virussen aan, waardoor infecties voorkomen worden. De natuurlijke functie van T cellen van het
immuunsysteem is dus een eerstegraads verdediging tegen schadelijke bacteriën en virussen4,5.
Na orgaantransplantatie worden antigenen die afkomstig zijn van het donororgaan
gepresenteerd aan T cellen. Door de immuunreactie die optreedt tegen deze donorantigenen
worden de donorcellen afkomstig van het donororgaan opgeruimd waardoor het transplan-
taat wordt afgestoten. Het optreden van acute transplantaatafstoting door T cellen (cellulaire

Chap
ter 9
186
afstoting) binnen de eerste weken tot maanden na transplantatie is onder andere afhankelijk
van de intensiteit van de immuunreacties die afhangt van de mate van overeenkomst van de
weefselkenmerken tussen donor en ontvanger4. Het optreden van acute cellulaire transplan-
taatafstoting wordt eveneens sterk bepaald door de immunosuppressieve behandeling van de
ontvanger na transplantatie. Om te onderzoeken wat het eff ect van een bepaald geneesmiddel
op het immuunsysteem is, bootsen we in het laboratorium immuunreacties na met ‘mixed
lymfocyten reacties’ (MLR). Perifere bloed cellen (PBMC), waar zich T cellen in bevinden, worden
uit het bloed van de patiënt geïsoleerd en gestimuleerd met PBMC uit het bloed van een
levende donor of T cellen uit de milt van een overleden donor. In een MLR wordt alleen naar de
reactiviteit van patiënt op donor gekeken en niet andersom. Dit wordt bereikt door de PBMC
van de donor te bestralen zodat ze het vermogen om te delen kwijtraken en alleen de T cellen
van de patiënt kunnen delen. De mate van reactiviteit van patiënt op donor wordt bepaald aan
de hand van de T-cel groei van de patiënt.
De ontwikkeling van de calcineurine remmer cyclosporine A, dat de IL-2 productie remt,
en door Sir Roy Calne in 1980 als eerste getest werd, was een ware doorbraak in het trans-
plantatieveld, aangezien dit de patiënt en transplantaatoverleving enorm heeft verbeterd6,7.
Orgaantransplantatiepatiënten worden sindsdien vaak behandeld met standaardtherapie;
een combinatie van de meest eff ectieve geneesmiddelen die transplantaatafstoting kunnen
voorkomen. Deze combinatietherapie bestaat tegenwoordig uit een calcineurine remmer
(cyclosporine A of het nog nieuwere tacrolimus), T-cel groei remmer (mycofenolaat mofetil;
MMF of sirolimus/rapamycin of everolimus) en steroide; (prednisolon). Steroïden zijn erg
krachtig doordat zij aangrijpen op diverse processen, waaronder de T-cel groei, activatie en
de productie van groei- en ontstekingsfactoren (cytokines)8. Ook veroorzaken zij celdood en
scheiden ze bepaalde factoren uit die de ontstekingsreactie dempen8. Standaardtherapie
wordt bij niertransplantatiepatiënten met een verhoogd risico op transplantaatafstoting
(patiënten die getransplanteerd worden met een nier van een overleden donor) vooraf
gegaan door inductie therapie, bestaande uit anti-thymocyten immunoglobulines (ATG).
Deze immunoglobulines worden opwekt in konijnen waarbij immuuncellen afkomstig van
thymi van kinderen zijn ingespoten. Afhankelijk van de dosis- zorgt ATG ervoor dat (alle) T
cellen in het lichaam vernietigd worden zodat zij geen immuunreacties op gang brengen.
Om zijn eff ectieve werkingsmechanisme wordt ATG ook gegeven als afstotingstherapie.
Na orgaantransplantatie worden patiënten vele jaren tot decennia behandeld met
standaardtherapie. Helaas remmen immunosuppressiva ook de natuurlijke functies van het
immuunsysteem waaronder de afweer tegen bacteriën en virussen, waardoor patiënten een
verhoogd risico op infecties oplopen. Naast deze bijwerkingen zijn er ook allerlei andere scha-
delijke neveneff ecten en op de lange termijn is er een verhoogd risico op tumoren. Ook zijn
in het bijzonder de calcineurine remmers schadelijk voor de nieren. Door de ernst van de vele
bijwerkingen, de lange termijn symptomen en de nierschade is gezocht naar een vervangend
immunosuppressivum dat wel net zo eff ectief is in het voorkomen van transplantaatafstoting,
Samenvatting 187
maar minder bijwerkingen heeft. Het geneesmiddel CP-690,550 is een dergelijk immunosup-
pressivum waarvan onderzocht wordt of ter vervanging van calcineurine remmers kan worden
gebruikt. CP-690,550 onderdrukt de gevoeligheid van T cellen voor IL-2, zodat dit niet ‘geconsu-
meerd’ kan worden en T cellen dus geremd worden in de groei en rijping9.
Door de talrijke en ernstige bijwerkingen van de huidige immunosuppressiva, wordt ook
veel onderzoek verricht naar alternatieve behandelmethodes die heel gericht T cellen aanpak-
ken die specifi ek op het transplantaat reageren en betrokken zijn bij afstoting. Een van die
alternatieve behandelmethodes om acceptatie van het orgaan te bereiken zou kunnen liggen
in de functie van een gespecialiseerde groep T cellen van het immuunsysteem; de regulatoire
T cellen (T-reg). Er zijn verschillende groepen van T-reg. Echter, de CD4+CD25bright T cellen heb-
ben een hoge behoefte aan IL-2 en laten zich daarom op basis van hun uiterlijke kenmerken
typeren door een verhoogde (bright) aanwezigheid van de IL-2α receptor (CD25) op het celop-
pervlak10. Een receptor is te vergelijken met een sleutelgat waar maar een specifi eke sleutel
in past. IL-2 functioneert als sleutel voor CD25 en door binding van IL-2 aan het CD25 eiwit
kan de T cel externe signalen die het via IL-2 ontvangt doorgeven aan de binnenzijde van de
cel. Bovendien maakt ruim 90% van de CD4+CD25bright T cellen grote hoeveelheden Foxp311-13
en CTLA414 aan; twee belangrijke eiwitten die zich in de celkern bevinden en CD4+CD25bright
T cellen nodig hebben om hun functie uit te oefenen. Ook kenmerken deze cellen zich door
afwezigheid van de receptor (CD127) voor de groeifactor interleukine-7, dat zich wel bevindt
op alle andere T cellen15. In verschillende dierexperimentele modellen is aangetoond dat
CD4+CD25brightFoxp3+CD127-/low T cellen zich onderscheiden van de overige T cellen doordat
zij immuunresponsen die gericht zijn tegen lichaamseigen weefsel onderdrukken16.
In de mens is aangetoond dat deze immuunonderdrukkende regulatoire eigenschappen een
belangrijke rol spelen in het voorkomen van auto-immuunziekten waarbij het immuunappa-
raat verstoord is en zich richt tegen lichaamseigen weefsel. In het laboratorium (in vitro) is door
middel van suppressie assays (Figuur 1) aangetoond dat deze CD4+CD25brightFoxp3+CD127-/low
T cellen immuunresponsen (celdeling en o.a. de IL-2 productie van T-eff cellen17) onderdrukken
door middel van cel-cel contact met T-eff cellen. Andere subgroepen van T-reg onderdrukken
immuunreacties van T-eff cellen doordat zij veel van een bepaald anti-ontstekingseiwit pro-
duceren dat de T-eff groei remt. Zo produceren de Th3-cellen TGF-β18 en de Tr1 cellen IL-1019.
Mogelijk kunnen de CD4+CD25brightFoxp3+CD127-/low T cellen ook na orgaantransplantatie op
een specifi eke manier immuunreacties onderdrukken die gericht zijn tegen het transplantaat.
Aangezien de afweeronderdrukkende medicijnen de groei en rijping van T cellen belemmeren,
is onze hypothese dat deze geneesmiddelen mogelijk ook het aantal en immuunregulatoire
functie van CD4+CD25brightFoxP3+CD127-/low T cellen beïnvloeden.
Onderzoek naar T-reg vindt vooral plaats in het laboratorium en met proefdieren. Er is maar
zeer weinig bekend over de specifi eke eff ecten van immunosuppressiva op de immuunregula-
tie in patiënten die een orgaantransplantatie ondergaan. Dierexperimentele modellen hebben
aangetoond dat ATG het ontstaan van T-reg juist gunstig beïnvloeden. Inductie therapie met

Chap
ter 9
188
ATG kan mede hierdoor acceptatie van het donororgaan bij patiënten bevorderen. CP-690,550
grijpt aan op de signaaltransductie route die belangrijk is voor de groei van T cellen. Door op
moleculair niveau de werking van dit geneesmiddel te bestuderen, zouden we misschien een
verschil in gevoeligheid voor dit geneesmiddel tussen T-reg en T-eff kunnen aantonen.
In dit promotieonderzoek hebben wij het eff ect van verschillende immunosuppressiva op
de uiterlijke kenmerken (het fenotype) en de functie van T-reg in nier- en levertransplantatie-
patiënten bestudeerd. Dit hebben wij enerzijds onderzocht in prospectieve studies waarbij de
CD4+CD25brightFoxP3+CD127-/low T cellen aan de hand van hun uiterlijke kenmerken en functie
in kaart zijn gebracht. Anderzijds hebben wij ook in vitro onderzoek gedaan naar de werkings-
mechanismen van de immunosuppressiva op cellulair en moleculair niveau. De doelstelling
van deze dissertatie is om te streven naar een therapie voor transplantatiepatiënten waarbij
het aantal en de functie van T-reg niet worden aangetast of zelfs toeneemt en de functie wordt
versterkt. T-reg onderdrukken dan de immuunreactiviteit door T-eff cellen die gericht is tegen
het transplantaat, terwijl de afweer tegen infectieuze bacteriën en virussen behouden blijft.
In hoofdstuk 2 onderzoeken wij of donorspecifi eke T-reg geïnduceerd worden in patiënten
met standaardtherapie bestaande uit cyclosporine, MMF en prednison. Om dit te onderzoeken
hebben wij het percentage CD25bright T cellen van het totale aantal CD4+ T cellen gemeten
in het bloed van stabiele niertransplantatiepatiënten op 0.5-2 jaar na niertransplantatie. In
deze periode na transplantatie kregen deze patiënten de volledige standaardtherapie in
dezelfde doses als waarmee begonnen is, wat betekent dat de mate van immunosuppressie
gelijk is aan kort na transplantatie. Naast het fenotype hebben we ook de functie van T-reg
bestudeerd door middel van suppressie assays. In een zogenaamde ‘conventionele’ suppressie
assay wordt de functie van pretransplantatie T-reg bepaald door deze in een kweek te brengen
met de T-eff cellen van pretransplantatie en de functie van posttransplantatie T-reg door deze
in kweek te brengen met de T-eff cellen van posttransplantatie. De groei van T-eff cellen die
gericht is tegen donorcellen of tegen 3e partij cellen wordt in af- en aanwezigheid van T-reg
bepaald. Derde partij cellen zijn afkomstig van een individu die volledig verschilt in zijn weef-
seltypering van de patiënt. In aanwezigheid van T-reg verwachten we dat de groei van T-eff
cellen onderdrukt wordt. De T-eff cellen van post transplantatie staan echter onder invloed
van verschillende ‘stress’ factoren waaronder donorantigenen, immunosuppressiva etc., die
de groei en vitaliteit van deze T-eff cellen belemmeren. Daarom hebben we in hoofdstuk
2 om de functie van T-reg posttransplantatie te bepalen de conventionele suppressie assay
aangepast. De functie van T-reg posttransplantatie is nu bepaald door de remming op de groei
van T-eff cellen van pretransplantatie te meten, waarvan we weten dat deze beter groeien dan
posttransplantatie T-eff cellen op donor- en 3e partij cellen. Na transplantatie hebben we een
daling in het aantal CD4+CD25bright T cellen gevonden. Echter, functioneel gezien waren de
T-reg van posttransplantatie in staat om de immuunresponsen tegen de donor nog sterker
te onderdrukken dan de T-reg van pretransplantatie. Er was geen verschil in de remming door

Samenvatting 189
T-reg van posttransplantatie op de T-eff groei tegen donorcellen of 3e partijcellen. Uit deze
resultaten concluderen wij dat T-reg posttransplantatie in het lichaam betrokken zijn bij het
onderdrukken van donorspecifi eke immuunreacties tegen het donororgaan.
In hoofdstuk 3 is getracht uit te zoeken of na klinische niertransplantatie donorspeci-
fi eke CD4+CD25brightFoxP3+ T cellen ontstaan die de specifi eke immuun reacties tegen het
donororgaan kunnen onderdrukken. In een prospectieve studie is het fenotype en de functie
van CD4+CD25bright T cellen geanalyseerd op 3, 6 en 12 maanden na niertransplantatie. De
patiënten zijn gerandomiseerd in verschillende behandelgroepen; arm 1 staat op tacrolimus
en rapamycin therapie en arm 2 op tacrolimus en MMF therapie. De immuunregulatoire
capaciteit van CD4+CD25bright T cellen is op twee manieren bepaald. Ten eerste, door ze te
isoleren uit PBMC en dan de respons tegen donor- en 3e partij cellen vóór en na isolatie te
meten. Ten tweede door de geïsoleerde CD25bright T cellen in verschillende radio’s met T-eff
cellen in cocultuur te brengen zoals in een conventionele suppressie assay gedaan wordt. In
het eerste jaar na transplantatie was er een signifi cante daling in het absolute aantal en het
percentage CD4+CD25bright T cellen. In de MLR was er een donorspecifi eke hyporesponsiviteit
van patiënten PBMC die gestimuleerd werden met donorcellen en een signifi cante toename in
de groei bij stimulatie met 3e partij- en 4e partijcellen. Zoals eerder gesteld, onderdrukken T-reg
de immuunreacties van T-eff cellen. T cellen in PBMC kunnen we indelen in een niet-delende
T-reg populatie en een delende T-eff populatie. Functionele analyse van CD25bright T cellen
toonde aan dat de groei van T cellen toeneemt als zij verwijderd zijn uit de PBMC populatie.
Deze toename in de groei werd signifi cant groter in de tijd. In suppressie assays verbeterde de
suppressieve capaciteit van T-reg zichtbaar signifi cant in de tijd. Bovendien werd het verschil
in T-eff groei op donor en 3e partij cellen evenals de remming hiervan door T-reg zichtbaar op
6 maanden na transplantatie. Hoewel tacrolimus en rapamycin dezelfde aangrijpingspunten
hebben op T cellen, zagen we geen verschil in de beide armen van therapie. Uit hoofdstuk
3 concluderen we dat in niertransplantatiepatiënten onder invloed van immunosuppressieve
therapie donorspecifi eke CD4+CD25bright T cellen worden geïnduceerd in het eerste jaar na
klinische niertransplantatie.
In de hoofdstukken 4, 5 en 6 staan konijn anti-thymocyten globulines centraal. In de litera-
tuur is beschreven dat ATG CD4+CD25brightFoxP3+ T cellen kan vormen uit humane CD25neg
T-eff cellen. Dit in vitro fenomeen zou zeer gunstig zijn voor de patiënt, omdat deze door ATG-
gestuurde inductie van T-reg in de patiënt kan zorgen voor een toename van (donorspecifi eke)
T-reg ten koste van T-eff cellen die zorgen voor transplantaatafstoting.
In hoofdstuk 4 beschrijven wij in een prospectieve studie het eff ect van ATG-inductie
therapie op het fenotype, de frequentie en de functie van perifere immunoregulatoire
CD4+CD25brightFoxP3+CD127-/low T cellen in niertransplantatiepatiënten. De studiegroep
werd behandeld met ATG-inductie therapie, tacrolimus, MMF en steroïden. De resultaten
van de studiegroep zijn vergeleken met die van een controlegroep zonder ATG-inductie the-
rapie. Pretransplantatie vertoonde 6% van de CD4+ T cellen in het bloed het FoxP3+CD127-/

Chap
ter 9
190
low fenotype. Op 1 week na transplantatie en ATG-inductie therapie waren geen meetbare
CD4+FoxP3+CD127-/low T cellen meer aanwezig. Na 4 weken vond langzaam herstel plaats
van dit aantal, maar in de eerste 26 weken na ATG-behandeling bleef het aantal signifi cant
lager dan vóór transplantatie. Op 14 weken observeerden we binnen de CD4+FoxP3+ T cel-
len een signifi cante verschuiving naar het CD45RO+CCR7+ (central memory) fenotype. Bij het
analyseren van de functie van PBMC en T-eff cellen zagen we op 26 weken na transplantatie
een signifi cante afname in de groei van PBMC en T-eff cellen tegen donor- en 3e partij cellen
bij patiënten in de ATG-groep vergeleken bij pretransplantatie. De CD25bright T cellen waarvan
90% uit FoxP3+CD127-/low T cellen bestaat, konden deze immuunreacties goed onderdrukken.
Op basis van deze resultaten concluderen wij dat ATG-inductie therapie T-eff cellen en T-reg
elimineert uit het bloed en lichaam, maar dat de T-reg die na regeneratie aanwezig zijn in het
bloed hun suppressieve activiteit behouden.
We vroegen ons aan de hand van deze resultaten af waarom de T-reg aantallen niet juist ver-
hoogd waren na ATG-behandeling omdat in vitro is aangetoond dat ATG T-reg kan genereren.
Onze hypothese was dan ook dat de T-eff cellen van pretransplantatie bij patiënten met eindsta-
dium nierfalen dusdanig verstoord zijn in hun functie, dat zij het vermogen om in een T-reg te
veranderen wellicht verloren hebben. In een in vitro studie beschreven in hoofdstuk 5 hebben
we daarom T-reg inductie bestudeerd in patiënten met eindstadium nierfalen die kandidaat
zijn voor niertransplantatie en ATG-inductie therapie. De ATG-geïnduceerde T-reg hebben we
gekarakteriseerd en vergeleken met natuurlijke CD4+CD25brightFoxP3+CD127-/low T cellen die in
het bloed aanwezig zijn voor transplantatie en door de thymus zijn gevormd. CD25neg cellen
afkomstig uit PBMC zijn voor 24 uur geïncubeerd met ATG of met controle immunoglobuli-
nes uit een konijn die niet gericht zijn tegen humane thymocyten. De ATG-geïnduceerde
CD4+CD25+ en CD8+CD25+ waren -in dezelfde mate als natuurlijke CD4+CD25bright T cellen- in
staat om de groei van T-eff cellen tegen 3e partij cellen te onderdrukken. Echter, het percentage
FoxP3 binnen de top 2% van deze geïnduceerde CD25+ T cellen was signifi cant lager dan in de
natuurlijke CD4+CD25bright cellen. Tenslotte hebben we de expressie van een aantal moleculen
gekwantifi ceerd die aanwezig zijn in natuurlijke CD4+CD25bright T cellen of die wellicht iets
onthullen over het mechanisme dat ATG-geïnduceerde T-reg uitoefenen. Voordat een eiwit
ontstaat, wordt eerst messenger RNA (mRNA) gevormd, dat van het gen in het DNA afkomt.
mRNA is dus een soort tussenstadium dat noodzakelijk is om van het gen in het DNA een eiwit
te genereren. De mRNA-niveaus van IL-10, IL-27 IFN-γ, perforine en granzyme B (de laatste 4
eiwitten veroorzaken celschade, ‘cytotoxiciteit’ genaamd) waren hoger in ATG-geïnduceerde
T-reg dan in natuurlijke CD25bright T cellen, terwijl de mRNA-expressie van CTLA4, TGF-β en
RORγt lager was. Er kan dus gesteld worden dat ATG in vitro functionele T-reg uit CD25neg
cellen van patiënten met eindstadium nierfalen induceert. Ten opzichte van natuurlijke T-reg
hebben deze geïnduceerde T-reg een verschillend fenotype, en overeenkomsten en verschil-
len op mRNA profi elen. De regulatoire activiteit is echter vergelijkbaar. ATG draagt dus bij aan
Samenvatting 191
de mechanismen die de immuunreactiviteit temperen en daarom kan de hierboven gestelde
hypothese kan dus worden verworpen.
Als T-reg inductie mogelijk is in patiënten met eindstadium nierfalen, was onze volgende
hypothese dat wellicht de immunosuppressieve therapie die gecombineerd wordt met ATG-
inductie therapie verantwoordelijk is voor het uitblijven van T-reg inductie in onze niertrans-
plantatiepatiënten. In de literatuur wordt gesproken over het belang van IL-2 voor de generatie,
homeostase en functie van T-reg. Daarom zouden calcineurine remmers, die de IL-2 productie
onderdrukken, mogelijk ook de inductie van T-reg kunnen verstoren. In hoofdstuk 6 vroegen
wij ons af of ATG T cellen naar T-reg kan converteren in aanwezigheid van geneesmiddelen
die hun inductie en functie kunnen beïnvloeden zoals calcineurine remmers. Om dit te onder-
zoeken hebben wij CD25neg cellen uit PBMC van gezonde individuen geïncubeerd met ATG of
controle immunoglobulines voor een periode van 24-uur, maar nu in aan- en afwezigheid van
tacrolimus. Opmerkelijk genoeg werden er ook FoxP3+ T cellen geïnduceerd in aanwezigheid
van tacrolimus. Blokkade van het eff ect van IL-2 op T cellen (d.m.v. anti-CD25 en anti-IL-2 anti-
lichamen) beïnvloedde de frequentie van ATG-geïnduceerde FoxP3+ T cellen ook niet. De ATG-
tacrolimus geïnduceerde CD25+ T cellen beschikten over voldoende suppressieve capaciteit
om de groei van T-eff cellen te onderdrukken die gestimuleerd zijn met bestraalde cellen van
een ander individu. Echter, in tegenstelling tot de natuurlijke CD25bright T cellen, vertoonden
deze geïnduceerde T-reg hoge expressie van IL-10, IL-27, IFN-γ, perforine en granzyme B, terwijl
FoxP3 signifi cant lager tot expressie werd gebracht. Deze mRNA resultaten zijn bevestigd in
niertransplantatiepatiënten die ATG-inductie therapie hebben gekregen na transplantatie. De
bevindingen zoals beschreven in deze studie hebben geleid tot de volgende conclusie. Tacro-
limus heeft geen negatief eff ect op de inductie en functie van ATG-geïnduceerde CD4+CD25+
T cellen en mogelijk induceert ATG ook T-reg in patiënten die behandeld worden met een
combinatie van ATG-inductie therapie en tacrolimus.
In hoofdstuk 7 hebben wij ons gefocust op de signalen die van buitenaf aan de T cel wor-
den gegeven en noodzakelijk zijn voor T cel groei en activatie. Deze signalen zijn afkomstig
van groeifactoren en cytokines. Voornamelijk de signalen van IL-2 zijn belangrijk voor de groei,
diff erentiatie en functie van T-eff cellen en T-reg. Cytokines van de IL-2 familie hebben allen
hun eigen bindingsreceptor op het celoppervlak, maar in de cel maken zij allen gebruik van
dezelfde γ-receptor, waardoor het signaal van buitenaf door alle groeifactoren van de IL-2
familie op dezelfde manier de cel door geleid wordt. Eenmaal in de cel, wordt het signaal door
de cel geleid via Janus Kinasen (Jak) eiwitten die aan het γ-gedeelte binden. Deze Jaks geven
het signaal door aan STAT (Signal Transducers and Activators of Transcription) eiwitten die het
signaal daarna naar de celkern leiden. Jak-STAT signalering leidt tot de vorming van nieuwe
eiwitten die de T cel nodig heeft voor zijn groei en functie. In deze studie hebben we onder-
zocht of de Jak-remmer CP-690,550 de regulatoire activiteit van CD4+CD25brightFoxP3+CD127-/
low T cellen beïnvloed. De Jak-activiteit in aan- en afwezigheid van de Jak-remmer hebben we
bepaald aan de hand van de activatie (fosforylatie) van STAT5. Kwantifi catie van gefosforyleerd

Chap
ter 9
192
STAT5 geeft een indicatie van de activatie status van Jak3 en kan dus worden gebruikt om het
inhiberende eff ect van CP-690,550 te bepalen. Met behulp van ‘fosfo-specifi eke fl ow cytome-
trie’ hebben we de gefosforyleerde eiwitten in kaart gebracht. Om T-reg functie te bepalen zijn
suppressie assays in af- en aanwezigheid van CP-690,550 uitgevoerd met het materiaal van
gezonde individuen en niertransplantatiepatiënten die CP-690,550 therapie hebben gekregen
gedurende 29 dagen na transplantatie en daarnaast anti-CD25 inductie therapie, MMF en pred-
nison. Een controlegroep kreeg standaardtherapie bestaande uit anti-CD25 inductie therapie,
cyclosporine, MMF en prednisone.
De IL-2 geïnduceerde fosforylatie van STAT5 was signifi cant hoger in de CD4+CD25bright T cel-
len dan in CD25-/dim T-eff cellen. In aanwezigheid van een klinische relevante dosis CP-690,550
van 100 ng/mL, werd deze IL-2 geïnduceerde STAT5 fosforylatie gedeeltelijk geremd in de
CD4+CD25bright T cellen, terwijl deze bijna geheel geremd werd in CD25-/dim T-eff cellen. De
dosis waarbij 50% remming van de STAT fosforylatie optreedt, de IC50 was 2-3x hoger voor
T-reg dan voor CD25-/dim T-eff cellen. De groei van T-eff cellen in respons op bestraalde PBMC
van een ander individu werd dosisafhankelijk geremd door CP-690,550. Onder invloed van kli-
nische relevante doses van CP-690,550 waren T-reg in staat om deze groei van T-eff cellen nog
meer te onderdrukken. De suppressieve capaciteit van T-reg van niertransplantatiepatiënten
die behandeld zijn met CP-690,550 is vergelijkbaar met die van voor transplantatie, en met de
suppressieve capaciteit van T-reg van patiënten uit de controlegroep. Deze bevindingen laten
zien dat de Jakremmer CP-690,550 op eff ectieve wijze T-eff groei onderdrukt en tegelijkertijd
de suppressieve activiteit van T-reg behoudt.
Hoofdstuk 8 beschrijft het eff ect van conversie van immunosuppressieve geneesmiddelen
na levertransplantatie. In deze studie betreft het de conversie van een calcineurine remmer naar
de T-cel proliferatieremmer MMF na transplantatie. Patiënten met slechte nierfunctie werden
geconverteerd naar MMF en ontvingen ook een dosis van de IL-2 receptor blocking antilichaam
Daclizumab. Controle patiënten continueerden de behandeling met de calcineurine remmer.
Daclizumab behandeling resulteerde in afdekking van het IL-2 bindende deel van de CD25
moleculen op 1 maand na transplantatie. Wanneer CD25-expressie gekwantifi ceerd werd aan
de hand van het IL-2 onafhankelijke gedeelte, waarbij IL-2 binding geen beperkende factor
is voor de kwantifi catie van CD25, bleek dat er een signifi cante daling was in het percentage
CD4+CD25+ T cellen. Echter, er was geen daling in het aantal CD4+FoxP3+ cellen. Zes maanden
na MMF-conversie nam het percentage CD4+CD25brightFoxP3+ T cellen zelfs toe met 125%.
mRNA-analyse van FOXP3 bevestigde deze verrijking van FoxP3 in het perifere bloed. Opmer-
kelijk genoeg steeg na MMF-conversie het aantal CD25-moleculen per cel op CD4+FoxP3+ cel-
len, maar niet op CD4+FoxP3neg cellen vergeleken bij pre-conversie. Op deze manier zorgt MMF
therapie voor herstel van circulerende T-reg aantallen in het bloed na het onderdrukkende
eff ect van calcineurine remmers. Door dit eff ect kan MMF therapie dus mogelijk de T-reg-
gemedieerde suppressie van immuunreactiviteit tegen het transplantaat kunnen bevorderen.

Conclusie 193
CONCLUSIE
Immunosuppressieve therapie wordt vaak gekozen op basis van de mate van eff ectiviteit in de
preventie van transplantaatafstoting en de minste bijwerkingen. Deze medicatie is niet speci-
fi ek gericht tegen de immuunreacties tegen het transplantaat, maar ook tegen immuunreacties
tegen bacteriën en virussen. Regulatoire T cellen zijn juist in staat om die immuunresponsen
die gericht zijn tegen het transplantaat te onderdrukken. Er valt dus winst te behalen voor de
patiënt als de regulatie van immuunreacties tegen het transplantaat niet negatief en mogelijk
zelfs positief wordt beïnvloed door de immunosuppressieve therapie. Met behulp van immu-
nosuppressieve geneesmiddelen die T-reg-aantallen of T-regfunctie stimuleren, is het mogelijk
om het immuunsysteem te sturen richting donorspecifi eke immuunregulatie. De (combinatie
van) immuunosuppressieve geneesmiddelen die wij hebben onderzocht, vertonen geen
nadelig eff ect op de functie van regulatoire T cellen. Donorspecifi eke regulatoire T cellen
ontstaan in het eerste jaar na transplantatie onder standaardtherapie. ATG-inductie therapie
in combinatie met rapamycine, CP-690,550 of MMF kan de aanmaak van deze donorspecifi eke
regulatoire T cellen wellicht versnellen. In de toekomst zouden we deze immunosuppressiva
kunnen gebruiken om het immuunsysteem actief te sturen in de richting van donorspecifi eke
regulatoire T cellen.
Chap
ter 9
194
REFERENTIES
1. Medawar, P.B. The behaviour and fate of skin autografts and skin homografts in rabbits: A report to the War Wounds Committee of the Medical Research Council. J Anat 78, 176-199 (1944).
2. Owen, R.D. Immunogenetic Consequences of Vascular Anastomoses between Bovine Twins. Science 102, 400-401 (1945).
3. Guild, W.R., Harrison, J.H., Merrill, J.P. & Murray, J. Successful homotransplantation of the kidney in an identical twin. Trans Am Clin Climatol Assoc 67, 167-173 (1955).
4. Benner, R., van Dongen, J.J.M., van Ewijk, W. & Haaijman, J.J. Medische Immunologie (1996). 5. Janeway, C.A., Travers, P., Walport, M. & Capra, J.D. Immunobiology The immune system in health and
disease. 4th Edition Elsevier Science Ltd/Garland Publishing (1999). 6. Calne, R.Y. Cyclosporin. Nephron 26, 57-63 (1980). 7. Calne, R.Y. et al. Cyclosporin A in organ transplantation. Adv Nephrol Necker Hosp 10, 335-347 (1981). 8. Curtis, J. Corticosteroids and kidney transplantation. Clin J Am Soc Nephrol 1, 907-908 (2006). 9. Changelian, P.S. et al. Prevention of organ allograft rejection by a specifi c Janus kinase 3 inhibitor.
Science 302, 875-878 (2003). 10. Sakaguchi, S., Sakaguchi, N., Asano, M., Itoh, M. & Toda, M. Immunologic self-tolerance maintained by
activated T cells expressing IL-2 receptor alpha-chains (CD25). Breakdown of a single mechanism of self-tolerance causes various autoimmune diseases. J Immunol 155, 1151-1164 (1995).
11. Fontenot, J.D., Gavin, M.A. & Rudensky, A.Y. Foxp3 programs the development and function of CD4+CD25+ regulatory T cells. Nat Immunol 4, 330-336 (2003).
12. Gavin, M.A. et al. Foxp3-dependent programme of regulatory T-cell diff erentiation. Nature 15, 771-775. (2007).
13. Hori, S., Nomura, T. & Sakaguchi, S. Control of regulatory T cell development by the transcription fac-tor Foxp3. Science 299, 1057-1061 (2003).
14. Tang, A.L. et al. CTLA4 expression is an indicator and regulator of steady-state CD4+ FoxP3+ T cell homeostasis. J Immunol 181, 1806-1813 (2008).
15. Seddiki, N. et al. Expression of interleukin (IL)-2 and IL-7 receptors discriminates between human regulatory and activated T cells. J Exp Med 203, 1693-1700 (2006).
16. Sakaguchi, S. et al. Immunologic tolerance maintained by CD25+ CD4+ regulatory T cells: their com-mon role in controlling autoimmunity, tumor immunity, and transplantation tolerance. Immunol Rev 182, 18-32 (2001).
17. Thornton, A.M. & Shevach, E.M. CD4+CD25+ immunoregulatory T cells suppress polyclonal T cell activation in vitro by inhibiting interleukin 2 production. J Exp Med 188, 287-296 (1998).
18. Weiner, H.L. Oral tolerance: immune mechanisms and the generation of Th3-type TGF-beta-secreting regulatory cells. Microbes Infect 3, 947-954 (2001).
19. Levings, M.K. et al. IFN-alpha and IL-10 induce the diff erentiation of human type 1 T regulatory cells. J Immunol 166, 5530-5539 (2001).


Cha pter 10
Dankwoord/Acknowledgements
Curriculum Vitae Auctoris
PhD Portfolio
Abbreviations

Chap
ter 1
0
198
DANKW OORD/ACKNOWLEDGEMENTS
‘A goal without a plan is just a wish’(Antoine de Saint-Exúpiry, schrijver)
Wat een heerlijk gevoel; mijn proefschrift is af!!!
Een proefschrift verdedigen doe je alleen, maar de totstandkoming van een proefschrift is het
resultaat van een vruchtbare samenwerking met vele anderen. Ik ben alle mensen die aan dit
proefschrift een bijdrage hebben geleverd daarom zeer dankbaar; zonder hun hulp was het
niet gelukt om dit proefschrift te schrijven binnen de tijd die ik voor ogen had.
Prof.dr. W. Weimar, promotor. Beste professor Weimar, hartelijk dank dat ik mijn promotieon-
derzoek op uw afdeling heb mogen verrichten en voor het vertrouwen in mij als Amsterdamse
in Rotterdam! Ook ben ik u dankbaar voor de goede begeleiding, waaronder de kritische input
bij abstracts, manuscripten en presentaties. Ik waardeer dat u altijd oprecht geïnteresseerd was
wanneer ik langskwam en met heldere oplossingen kwam als ik door de bomen het bos niet
meer zag. Uiteraard wil ik u ook bedanken voor het mogelijk maken van de gezellige labweek-
enden!
Dr. C.C. Baan, co-promotor transplantatielab. Beste Carla, ik voelde mij tijdens het sollicitatie-
gesprek met jou en Luc al best op mijn gemak. Gelukkig hadden jullie er ook een goed gevoel
over en kon ik mijn promotietraject de daaropvolgende vier jaar op het transplantatielab
vormgeven. Nu, aan het eind van dit traject, kan ik op vier mooie jaren terugkijken, waarin
ik het uitstekend naar mijn zin heb gehad. Bedankt voor het vertrouwen in mij en voor het
aandachtig doorlezen van mijn abstracts en manuscripten, maar ook voor die extra duwtjes nèt
wanneer ik ze nodig had. Onze samenwerking heeft zijn vruchten afgeworpen in de vorm van
dit proefschrift en de vele presentaties die ik op congressen over de hele wereld heb mogen
geven! Bedankt voor de mogelijkheid om deze unieke ervaringen op te doen!
Dr. L.J.W. van der Laan, co-promotor levertransplantatie/heelkunde. Beste Luc, het was echt een
unieke kans voor mij om op het gebied van nier- èn levertransplantatie te werken en begeleid
te worden door maar liefst twee copromotoren! Ik ben jou dankbaar voor de goede begeleiding
en heb veel van je geleerd. Je complimenten na afl oop van mijn presentaties op congressen en
je bemoedigende woorden; ‘het komt helemaal goed’ (als een paper was afgewezen); ‘mooi,
er is weer een paper geaccepteerd’ (als we revisie hadden) en ‘dit is echt hartstikke leuk, hier
zit echt wat in’ (als ik nieuwe resultaten van een n=1 liet zien) waren altijd zeer welkom, dank
daarvoor! Ook wil ik je bedanken voor de waardevolle ervaringen die ik heb opgedaan in het
maag- darm- lever (MDL) lab en de banden die daarbij zijn gelegd met ‘de MDL’ers’!

Dankwoord/Acknowledgements 199
Graag bedank ik de leden van de kleine commissie dr. T. van Gelder, Prof.dr. C. van Kooten en
Prof.dr. J.D. Laman voor het beoordelen van dit proefschrift en voor hun deelname aan de
openbare verdediging hiervan.
De leden van de grote commissie wil ik graag bedanken voor hun deelname aan de openbare
verdediging. Prof.dr. H.W. Tilanus, ik wil u bedanken voor de enthousiaste reacties op mijn
abstracts en na afl oop van mijn presentaties op de stafdag heelkunde. Prof.dr. J.N.M. IJzermans,
bedankt voor de positieve reacties op mijn abstracts en manuscripten en uiteraard ook voor de
complimenten na afl oop van mijn presentaties. Dr. J. Kwekkeboom, beste Jaap, ik bewonder je
passie en enthousiasme voor het onderzoek en je kennis hieromtrent. Dank voor je adviezen bij
het rATG-onderzoek, waarbij we de link hebben getrokken met het IVIG onderzoek.
Ik wil alle co-auteurs graag bedanken voor hun medewerking aan dit proefschrift.
Mariska klepper, analist. Lieve Mariska, van jou heb ik geleerd hoe je steriel moet werken in een
fl owkast en de hele celkweek! Je uitleg was altijd zeer helder, dank daarvoor! Ik kon altijd met
mijn technische vragen bij jou terecht! Onze samenwerking heeft tot mijn eerste artikel geleid.
Ook bedankt voor de gezelligheid op de labweekenden en tijdens de bootcongressen!
Drs. Marcia Kho, nefroloog. Beste Marcia, ik heb veel van je geleerd over de niertransplanta-
tiepatienten en de medicatie die zij krijgen. Je medewerking aan de rATG-studie maakte het
mogelijk om alle in vitro experimenten op het lab te doen, daar ben ik je zeer dankbaar voor!
Onze samenwerking heeft geleid tot drie prachtige artikelen, waarvoor mijn dank!
Thea van Dam, analist. Lieve Thea, bedankt voor je inzet bij de ATG-studie. Er werd aan de
lopende band getransplanteerd en wij moesten steeds bloed verzamelen, data invoeren, tests
inzetten en meten. Deze noeste arbeid heeft geleid tot twee prachtige artikelen, dus samen
hebben we het toch mooi voorelkaar gekregen en daar mogen we best trots op zijn! Heel erg
bedankt voor je hulp; zonder jou was het allemaal niet gelukt!
Sander Korevaar, analist. Beste Sander, dank voor al je hulp met het PCRen en voor het uitvoe-
ren van de cytotoxiciteits assays. Zonder jouw hulp was mijn proefschrift lang niet zo mooi
geworden! Ik waardeer je geduld en de precisie waarmee je de experimenten doet. Daardoor
kon ik echt een beroep op je doen als er een deadline naderde. Ook bedankt voor de gezel-
ligheid tijdens koffi e- en theepauzes en de plezierige momenten tijdens labweekenden en
congressen!
Chap
ter 1
0
200
Wendy Mol, analist. Beste Wendy, ik waardeer je hulp bij de mRNA isolaties en het PCRen. De
resultaten van de experimenten die jij hebt gedaan waren echt essentieel en hebben het ATG
artikel nog mooier gemaakt!
Thijs Hendrikx, AIO. Beste Thijs, dank voor je bijdrage aan de ATG-studie! Ik vond het leuk
om mee te werken aan de RESTORE studie en daardoor ben ik ook co-auteur op jouw paper
geworden! Wij zijn drie jaar lang kamergenoten geweest en deelden onze gezamenlijke passie
voor Tregs, die vaak het onderwerp van de vele stimulerende discussies waren die we hebben
gevoerd. Dank voor alle gezelligheid op de AIO-kamer! Ik waardeer je stimulans van tijd tot tijd
en de goede gesprekken op momenten dat ik die nodig had. Suc6 in Europa met de farmaceut!
Monique Quaedackers, postdoc. Lieve Monique, aka ‘Mo’, heel erg bedankt voor je adviezen
omtrent het CP-690,550 project; van het labwerk tot aan de abstracts, de presentaties en het
manuscript. Ik vond onze samenwerking altijd erg prettig, omdat ik eindeloos met jou kon
brainstormen en discussiëren over het werk. Daarbuiten ben jij gewoon een leuk mens en kon
ik met jou ook heerlijk kletsen over niet-werkgerelateerde onderwerpen. Tijdens de congressen
hebben we ons ook altijd prima vermaakt. Ik vond het erg jammer dat je wegging, maar wel
leuk dat je het nu helemaal naar je zin hebt in Amsterdam! We gaan gauw weer eens uiteten!
I want to acknowledge Gary Chan from Pfi zer Boston. Thank you very much for providing us
the CP-690,550 compound for the in vitro experiments and for critically reading and editing the
CP-690,550 manuscript! Your comments really improved the manuscript! I also appreciate the
nice compliments about my presentations on congresses. Thank you very much for that!
Paranimfen
Meindert Crop, AIO. Beste Meindert, wij zijn in hetzelfde jaar begonnen met onze projecten!
Samen hebben we dan ook veel meegemaakt op het lab. Met jou kon ik van begin tot eind
alles bespreken omdat we steeds dezelfde fases in ons AIO-traject ingingen. Dank voor alle
goede gesprekken! Ook dank voor de tips and trics om met behulp van verschillende comput-
erprogramma’s mijn fi guren nog mooier te maken! Samen hebben we ook veel plezier gemaakt
op menig congres en labweekend! De lunchpauzes in het Sophia met jou, ‘Mo’ en ‘Ho’ waren
altijd erg gezellig, maar hadden soms ook wel een therapeutische werking in de vorm van het
dagelijkse klaag’uurtje’! Super dat je mijn paranimf wilt zijn op deze belangrijke dag! Ik wens je
alvast veel suc6 met jouw promotie!
Rens Kraaijeveld, analist. Beste Rens, in mijn tweede jaar kwam jij erbij op het lab. Al vrij snel
startte onze samenwerking en werd jij mijn rechterhand op het ATG-project. We deden samen
echt megagrote experimenten op het lab die soms tot ’s avonds laat duurde. Echter, met een
fl inke dosis humor kwam het werk af zonder dat we er erg in hadden. Met mijn ambitie en jouw
Dankwoord/Acknowledgements 201
enthousiasme en inzet lukte het vrijwel altijd om er iets moois van te maken; om precies te zijn
drie artikelen. Super dat ik anytime op jouw hulp kon rekenen, thanks daarvoor! Erg leuk dat jij
vandaag aan mijn andere zijde staat als paranimf!
Collega promovendi
Esmé en Jeroen, jullie waren altijd erg behulpzaam op de AIO-kamer, dank daarvoor. Ik kon met
al mijn vragen over het werk bij jullie als oudere AIOs terecht en daar heb ik veel van geleerd.
Ook tijdens de congressen hebben we veel plezier gemaakt! Het ga jullie goed! Martijn Verkade
bedankt voor de fi losofi sche gesprekken die mijn kijk op de wereld even deden veranderen.
Martijn Demmers, dankzij jou bleef ik helemaal op de hoogte van de actualiteit! Jij bent de
vrolijke noot op de kamer; blijf deze vasthouden! Dank voor je gezelligheid! Anne, leuk dat je
nog wat met ATG gaat doen! Succes met het onderzoek, maar dat komt wel goed met jouw
enthousiasme! Anja thanks for the chit-chats about the future and good luck with your project!
Annelies jij stapte de wereld van de Tregs binnen en behandelde je cellen net zo goed als je
patiënten! Dank voor de gezelligheid en suc6 in de kliniek! Perikles, it was always fun with you in
the room. You were always very straightforward, which I could appreciate! Good luck in Greece!
Transplantatielab
Nicole, bedankt voor je nuttige adviezen en suggesties tijdens de werk- en projectbesprekin-
gen. Ook bedankt voor je hulp bij de laatste loodjes; met name het direct inschakelen van
analytische hulp toen de druk zijn hoogtepunt bereikte en er veel werk in korte tijd af moest
komen; dit betekent echt veel voor mij! Martin Hoogduijn, aka ‘Ho’, jij was altijd in voor een goed
gesprek, en dat waardeer ik zeer. Dank voor je goede ideëen tijdens werk- en projectbesprekin-
gen en thanks voor de gezelligheid tijdens lunchpauzes en congressen! Wenda, bedankt voor
het inwerken op de FACS en het meedenken bij de analyses; ik heb er veel van geleerd! Dankzij
jouw rappe bestellingen waren de monoklonalen altijd op voorraad en konden we er fl ink
tegenaan met onze experimenten, dank daarvoor! Joke, jij bent altijd erg behulpzaam geweest;
ik kon jou altijd alles vragen op het lab. Als je het mij vraagt ben jij echt onmisbaar voor het lab!
Ik wil je ook bedanken voor de gezelligheid op congressen en labweekenden! Ronella, dank
voor je uitleg en hulp met de cytotoxiciteits assays, maar ook dank voor de gezelligheid op de
bootcongressen en labborrels! Annemiek, bedankt voor je hulp bij de laatste loodjes. Het deed
mij goed, dat je even wilde bijspringen! Ook dank voor al je suggesties bij de mRNA isolaties en
PCRs! Marjolein, dank voor je vriendelijkheid en interesse, dat vond ik erg fi jn, suc6 verder! Elly,
jij bent een leuk mens; altijd vrolijk! Dank voor de (brabantse) gezelligheid op het lab! André, ik
waardeer jouw vriendelijkheid en behulpzaamheid, het ga je goed! Nicolle, jou kan ik eigenlijk
niet genoeg bedanken! Je hebt mij geholpen met analyses, metingen, referenties en protocol-
len. Ook mocht ik weleens stofj es van jou lenen; dank daarvoor. Suc6 met je onderzoek! Dat er
nog meer mooie papers mogen komen!

Chap
ter 1
0
202
Jurjen Velthuis. Beste Jurjen, toen ik net op het lab was begonnen vond ik jou maar een strenge
leermeester. FACSen, MACSen, overal werd ik bij op de vingers gekeken; ‘zorg ervoor dat je het
apparaat HELEMAAL onder de knie hebt’ kreeg ik te horen. Later, toen ik ’s avonds laat weleens
alleen achter de FACS of MACS zat, realiseerde ik mij de waarde van die uitspraken; dank voor
deze wijze lessen; ze zijn goed tot mij doorgedrongen! Ik vond je oprechte interesse in mijn
Treg project erg fi jn en ik wil je daarom ook bedanken voor je betrokkenheid en je ideeën, maar
ook voor de goede gesprekken tijdens de treinreizen. Het ga je goed Jurjen!
Martin Huisman. Beste Martin, wij zijn tegelijkertijd begonnen op het transplantatielab en dat
creëerde een band tussen ons. We maakten altijd veel plezier op het lab. Helaas ging jij na twee
jaar weg; naar een ander lab in het EMC. We bleven contact houden en hebben nog steeds
regelmatig een update! Dank voor deze vriendschap en natuurlijk heel erg bedankt voor het
ontwerpen van de prachtige cover van dit proefschrift!
Nefrologen
Dr. Michiel Betjes, dr. Ajda Rowshani en drs. Jacqueline van de Wetering, ik wil jullie heel erg
bedanken voor de nuttige suggesties omtrent mijn project bij de werk- en projectbesprekin-
gen. De discussies die wij tijdens deze besprekingen gevoerd hebben, waren erg leerzaam en
stimulerend.
Researchverpleegkundigen
Annemarie Geel en Hanneke Tanck-Vernhout, bedankt voor jullie inzet bij de ATG-studie. In het
bijzonder het coördineren van de afspraken van de patiënten en natuurlijk het bloedprikken.
Annemarie ook bedankt voor de gezelligheid tijdens het labweekend in Berlijn, je peptalks en
bemoedigende woorden!
Nierpolikliniek
Marja, Heidi en Sylvana bedankt voor het bewaren van de bloedbuizen. Ik kon altijd op jullie
rekenen! Mijn dank gaat ook uit naar de prikzusters voor het prikken van de patiënten!
De dames van de D-vleugel die altijd in zijn voor een praatje, wil ik bedanken voor hun betrok-
kenheid en interesse!
Alle orgaantransplantatie patiënten en bloedbankdonoren wil ik uiteraard ook hartelijk
bedanken voor hun medewerking aan de verschillende studies die beschreven staan in dit
proefschrift. Zonder hen was het niet mogelijk geweest om dit boekje te schrijven.

Dankwoord/Acknowledgements 203
Tregmeeting
Mark, André, Janneke, Fleur en Colin bedankt voor de interesse, de goede ideeën, waardevolle
tips en de vele discussies over Tregs, waar ik veel van geleerd heb.
Maag-, Darm, Leverlab (MDL)
Ieder lab heeft zijn eigen cultuur, zo ook het MDL-lab. Ik heb er veel geleerd in de tijd dat ik
er zat en later kon ik er altijd terecht als ik iets wilde lenen. Ik wil alle MDL’ers bedanken voor
hun input tijdens presentaties op stafvergaderingen, researchbesprekingen etc. en vooral voor
alle gezelligheid tijdens borrels en congressen! Lieve Alice, jij hebt mij in de eerste maanden
wegwijs gemaakt op het MDL-lab en je hebt mij de FoxP3-kleuringen en het FACSen geleerd!
Helaas vertrok jij kort daarna. Mij staat nog bij dat jij altijd goedgehumeurd en goedlachs was.
Bedankt voor de fi jne samenwerking! Anthonie, al sinds mijn inwerkperiode op het MDL-lab
was jij altijd bereid om een handje te helpen. Ik kon altijd met alle vragen bij jou terecht. Ook
dank voor je hulp bij het sorten van de Tregs! Patrick, jij was altijd erg behulpzaam en je dacht
vaak met mij mee! Bedankt daarvoor! Suc6 met jouw promotie! Het wordt vast een prachtig
boekje! Brenda, bedankt voor de gezelligheid op borrels congressen! Suc6 met je carrière!
Angela, Suomi, Özlem en Viviana; bedankt voor alle plezierige momenten tijdens congressen
en suc6 met het afronden van jullie promotietraject! In het bijzonder wil ik Thanya bedanken
voor het meedenken over de ATG in vitro studie; dit was zeer nuttig! Ook dank voor alle gezel-
ligheid op congressen; waarbij ik onze excursie naar de Niagara Watervallen nooit zal vergeten!
Prof.dr. Herald Metselaar, bedankt voor de brainstormsessie over mijn project omtrent lever-
transplantaties. Helaas is het bij een brainstormsessie gebleven. Lara; dank voor je coördinatie
van de PROTECT-studie en het verzamelen van de klinische data.
De labdag ‘crew’ 2007
Piet Kramer, Bas, Lisette, Martin Kroos, Arnold en Katy. Ik vond het erg gezellig om in 2007
met jullie samen de labdag te organiseren. Het is ons gelukt om er een geslaagde dag van te
maken! Een speciaal dankwoord richt ik aan Lisette; dank voor alle waardevolle tips omtrent
mijn promotie en voor mijn carrière daarna! Suc6 verder als postdoc!
Prof.dr. Andries Hoitsma, ik heb veel bewondering voor u als goeroe in de transplantatiewereld.
Bedankt voor de mooie en bemoedigende woorden op congressen. Toen ik nog maar 2 jaar
oud was, promoveerde u op de behandeling van afstoting na niertransplantatie met rATG
therapie! Hartelijk dank voor uw proefschrift met èchte handtekening!

Chap
ter 1
0
204
Vrienden/familie
Lieve Junita, aka ‘girly girl’; wij kennen elkaar sinds mijn afstudeeronderzoek in Leiden; jij
studeerde biomedische wetenschappen in Leiden. Het klikte vanaf het begin erg goed tussen
ons; we zijn allebei vrij ‘down-to-earth’ (doe maar gewoon, dan doe je al gek genoeg) en we
kunnen heerlijk babbelen over girls-stuff (!). Ik kan altijd erg lachen met jou! Veel suc6 in de
farmaceutische wereld en dat onze vriendschap nog lang mag voortbestaan!
Beste Vishal, als goede vriend en AIO in het Sophia kinderziekenhuis heb je mij (als Amster-
damse) ervan weten te overtuigen om op een project in Rotterdam te solliciteren. Dank voor
deze stimulans! Ik vond het altijd fi jn om met jou te kletsen over alle AIO perikelen en natuurlijk
ook over de vele andere onderwerpen die de revue passeerden als we weer eens uren aan de
telefoon hingen! Suc6 met jouw promotie!
Mijn vriendinnen Sabriena, Hajar, Iris en Chiu Ting. Lieve meiden, we zijn allemaal (soms let-
terlijk) een andere kant op gegaan na onze studie, maar we wisselen nog regelmatig onze
ervaringen uit en het is fi jn dat ik met jullie echt over vanalles en nog wat kan kletsen! Ik wil
jullie graag bedanken voor deze vriendschap, waarvan we dit jaar het 10-jarig jubileum vieren!
Op naar de volgende 10 jaar!
Lieve pa, jij was altijd geïnteresseerd in mijn promotietraject en je begreep door je werk in het
ziekenhuis ook goed wat promoveren inhield. Ik kon daardoor altijd de verschillende facet-
ten van mijn promotietraject met jou bespreken, dat was erg fi jn. Bedankt voor je hulp bij de
stellingen en voor je bemoedigende woorden. Ik heb dan ook echt goed doorgezet en het
resultaat ligt hier!
Dit proefschrift draag ik op aan mijn moeder, die mij altijd heeft gesteund. Zonder haar steun
had ik dit niet kunnen bereiken. Lieve mam, jij hebt mij geleerd in mijzelf te geloven en zelfver-
zekerd door het leven te gaan; daar ben ik je erg dankbaar voor. Jouw zorg voor mij begon
’s ochtends vroeg bij het opstaan (ontbijtje) en ging weer verder als ik ’s avonds thuiskwam
(avondeten), elke dag weer opnieuw. Ook kan ik altijd alles met jou bespreken en je om advies
vragen en dat doet mij goed! Dank voor je onuitputtelijke steun en liefde! Mam, ik weet dat
je trots bent op mij; maar ik ben ook trots op jou, omdat ik de sterke vrouw in jou bewonder!
Varsha

Curriculum Vitae Auctoris 205
CURRICULU M VITAE AUCTORIS
Varsha Devi Kareshma Devi was born in Amsterdam on the 1st of November 1982. In 2000 she
completed secondary school (Atheneum) at the Fons Vitae Lyceum in Amsterdam and started
with the study Medical Biology at the University of Amsterdam. In 2004, she wrote the literature
essay ‘Immunopathology and Treatment of Acute Humoral Graft Rejection after Renal Trans-
plantation’ which was supervised by Prof.dr. R.J.M. ten Berge of the Department of Nephrology
of the Academic Medical Centre in Amsterdam and Prof.dr. R. Aalberse of the Sanquin Blood
Bank in Amsterdam. In 2005, she performed her graduation research project at the Department
of Cardiology of the University Medical Center in Leiden that was supervised by Prof.dr. A. van
der Laarse, where she studied the genetic predisposition of restenosis in the coronory arteries
of the heart in patients with a sudden heart attack. By the end of 2005 she graduated and
obtained her Master of Science degree. She started in 2006 with her PhD research project at the
transplantation laboratory at the Department of Internal Medicine (Supervisors: Prof.dr. Willem
Weimar and Dr. Carla C. Baan) in collaboration with the Department of Surgery (Supervisor:
Dr. Luc J.W. van der Laan) of the Erasmus Medical Centre in Rotterdam. In her PhD project she
investigated the infl uence of clinical kidney- and liver transplantation and immunosuppressive
drugs on the frequency and function of CD4+CD25bright regulatory T cells in the blood. The
results of this work are described in this thesis. During her PhD period she presented her work
on several national and international congresses, even in the land ‘Down Under’. In 2009, she
got the opportunity to present part of her work during the ‘late-breaking’ session on the Ameri-
can Transplant Congress, where only high potential fi ndings with a great clinical relevance are
presented. Since May 2010, she works as an ‘In-house Clinical Research Associate’ at Genzyme
Europe B.V. in Almere.

Chap
ter 1
0
206
PHD PO RTFOLIO
Summary of PhD training and teaching activities
Name PhD student: Varsha D.K.D. Sewgobind
Erasmus MC Department : Internal Medicine/Transplantation laboratory/Surgery
Research School: Molecular Medicine/NIHES
PhD period: Jan 2006 – Mrt 2010
Promotor: Prof.dr. W. Weimar
Co-promotors: Dr. C.C. Baan/Dr. L.J.W. van der Laan
General academic skills Year
- Research Integrity 2006
- Stralingshygiëne 5B 2006
Research skills
- Statistics (Classical Methods of Data Analysis, CC02, NIHES) 2006
In-depth courses
- Advanced Course in Molecular Immunology (Postgraduate School of Molecular Medicine) 2007
- Basiscursus Regelgeving en Organisatie voor Klinisch Onderzoekers (Good Clinical Practice) 2009
Presentations
- Oral, Annual meeting Nederlandse Vereniging voor Immunologie, Noordwijkerhout 2006
- Oral, 11th Molecular Medicine Day, Rotterdam 2007
- Oral, 7th American Transplant Congress, San Francisco, USA 2007
- Poster, ‘Top 10 Best Poster’, 13th European Society of Transplantation Congress,
Prague, Czech Republic
2007
- Poster, Wetenschapsdagen Internal Medicine Erasmus MC, Antwerpen, Belgium 2008
- Poster, European Scientifi c Conferences Meeting, London, UK 2008
- Oral, 20e Bootcongres, Nederlandse Transplantatie Vereniging, Zeewolde 2008
- Oral, 8th American Transplant Congress, Toronto, Canada 2008
- Oral, XXII International Congress of the Transplantation Society, Sydney, Australia 2008
- Poster, Wetenschapsdagen Internal Medicine Erasmus MC, Antwerpen, Belgium 2009
- Oral, 21e Bootcongres, Nederlandse Transplantatie Vereniging Zeewolde 2009
- Oral, III Basic Science Meeting ESOT, Brussels, Belgium 2009
- Oral, ‘late-breaking’ session’ 9thAmerican Transplant Congress, Boston, USA 2009
- Poster, 9thAmerican Transplant Congress, Boston, USA 2009

PhD Portfolio 207
- Oral, 14th European Society of Transplantation Congress, Paris, France 2009
- Oral, Wetenschapsdagen Internal Medicine Erasmus MC, Antwerpen, Belgium 2010
- Oral, 22e Bootcongres, Nederlandse Transplantatie Vereniging, Rotterdam 2010
(Inter)national conferences
- 18e Bootcongres, Nederlandse Transplantatie Vereniging 2006
- Annual meeting, Nederlandse Vereniging voor Immunologie 2006
- 19e Bootcongres, Nederlandse Transplantatie Vereniging 2007
- 7th American Transplant Congress, San Francisco, USA 2007
- 20e Bootcongres, Nederlandse Transplantatie Vereniging 2008
- 8th American Transplant Congress, Toronto, Canada 2008
- European Scientifi c Conferences Meeting, London 2008
- XXII International Congress of the Transplantation Society, Sydney, Australia 2008
- III Basic Science Meeting European Society of Transplantation, Brussels, Belgium 2009
- 21e Bootcongres, Nederlandse Transplantatie Vereniging 2009
- 9th American Transplant Congress, Boston, USA 2009
- 14th European Society of Transplantation Congress, Paris, France 2009
Seminars and workshops
- MolMed Masterclass mucosal immunology, ‘Imaging tolerance and Tregs in vivo’, Erasmus MC 2008
- Klinisch Review Symposium Nederlands Transplantatie Vereniging, Utrecht 2006
- Klinisch Review Symposium Nederlands Transplantatie Vereniging, Utrecht 2007
- Klinisch Review Symposium Nederlands Transplantatie Vereniging, Utrecht 2008
-‘Tolerance induction in Transplantation’, LIFI minisymposium, LUMC, Leiden 2008
Other
- Internal presentations at the Departments of:
Nefrologie, 2006
Maag- darm- lever (MDL) ziekten, -
‘Stafdag’ Heelkunde 2009

Chap
ter 1
0
208
Grants
- Travelgrant Novartis B.V. (t.b.v ATC) 2007
- Travelgrant Nederlandse Transplantatie Vereniging (t.b.v Bootcongres NTV) 2008
- Travelgrant Genzyme B.V. (t.b.v ATC) 2008
- Travelgrant Novartis B.V. (t.b.v ICTS) 2008
- Travelgrant Nederlands Vereniging voor Immunologie (t.b.v Basic Science ESOT/TTS) 2009
- Travelgrant Novartis B.V. (t.b.v ATC) 2009
Excursions
- Member of the Transplantation laboratory ‘Labweekend’ Organising Committee 2006
- Member of the Internal Medicine ‘Labday’ Organising Committee 2007
Other
- Invited article for Daniel den Hoed, ‘Cancer Magazine’ (Molecular Medicine School) 2007

Abbreviations 209
ABBREV IATIONS
APC Allophycocyanin
BSA Bovine Serum Albumin
CML Cytotoxic T lymphocyte Mediated Lysis
CNI Calcineurin Inhibitor
CPM Counts per Minute
CsA Cyclosporine A
FITC Fluorescein Isothiocyanate
FMO Fluorescence Minus One
γc gamma chain
gMFI geometric Mean Fluorescence Intensity
HC Healthy Controls
HCM Human Culture Medium
HLA Human Leukocyte Antigens
IH Inhibition
Jak Janus family of tyrosine kinases
KTx Kidney Transplantation
MACS Magnetic Cell Sorting
MFI Median Fluorescence Intensity
MLR Mixed Lymphocyte Reaction
MMF Mycophenolate Mofetil
PBMC Peripheral Blood Mononuclear Cells
PE Phycoerythrin
PERCP Peridinin chlorophyll protein
PHA Phytohemagglutinin
post-Tx post-transplantation
pre-Tx pre-transplantation
P-STAT5 phosphorylated STAT5
rATG Rabbit Anti-Thymocyte Globulins
rIgG Rabbit Immunoglobulins
SD Standard Deviation
SEM Standard Error of the Mean
STAT Signal Transducer and Activator of Transcription
Teff Eff ector T cells
Treg Regulatory T cells
Tx Transplantation
