ventilation of vehicles used for carriage of acetylene
TRANSCRIPT
Prepared by the Health and Safety Laboratory for the Health and Safety Executive 2014
Health and Safety Executive
Ventilation of vehicles used for carriage of acetylene
RR1027Research Report

C J Saunders, A Thorpe, Dr M Ivings, Dr J-P Gorce, S Bennett, S Stagg and J HodgesHealth and Safety LaboratoryHarpur HillBuxtonDerbyshire SK17 9JN
Following a fatality caused by an acetylene gas explosion involving a van carrying oxy-acetylene welding equipment, HSE commissioned research to investigate foreseeable gas leak rates, vehicle ventilation rates and possible vehicle modifications that would increase the ventilation rate and hence help to mitigate the explosion risk.
The experimental and modelling study showed that older vans are likely to be considerably leakier that newer better sealed vans. A five-fold increase in ventilation rate was predicted between the best and worst sealed vans tested.
For a small gas leak, which is likely to be emitted from a poorly fitting joint or a small hole in a pipe, indications were that for a medium sized transit van, air change rates greater than about 1 hr-1 will lead to gas concentrations typically less than 50% of the lower explosion limit (LEL) for acetylene. The ventilation rate required increases to 6 air changes per hour for larger leaks, such as those produced by a leaking cylinder valve.The minimum wind speed required to generate these ventilation rates fell significantly with the introduction of roof ventilators and side vents.
This report and the work it describes were funded by the Health and Safety Executive (HSE). Its contents, including any opinions and/or conclusions expressed, are those of the authors alone and do not necessarily reflect HSE policy.
Ventilation of vehicles used for carriage of acetylene
HSE Books
Health and Safety Executive

© Crown copyright 2014
First published 2014
You may reuse this information (not including logos) free of charge in any format or medium, under the terms of the Open Government Licence. To view the licence visit www.nationalarchives.gov.uk/doc/open-government-licence/, write to the Information Policy Team, The National Archives, Kew, London TW9 4DU, or email [email protected].
Some images and illustrations may not be owned by the Crown so cannot be reproduced without permission of the copyright owner. Enquiries should be sent to [email protected].
Acknowledgements
The authors would like to thank Engineering and Fire and Explosions Teams at HSL for the use of their facilities during the experimental stages of this project.
ii
iii
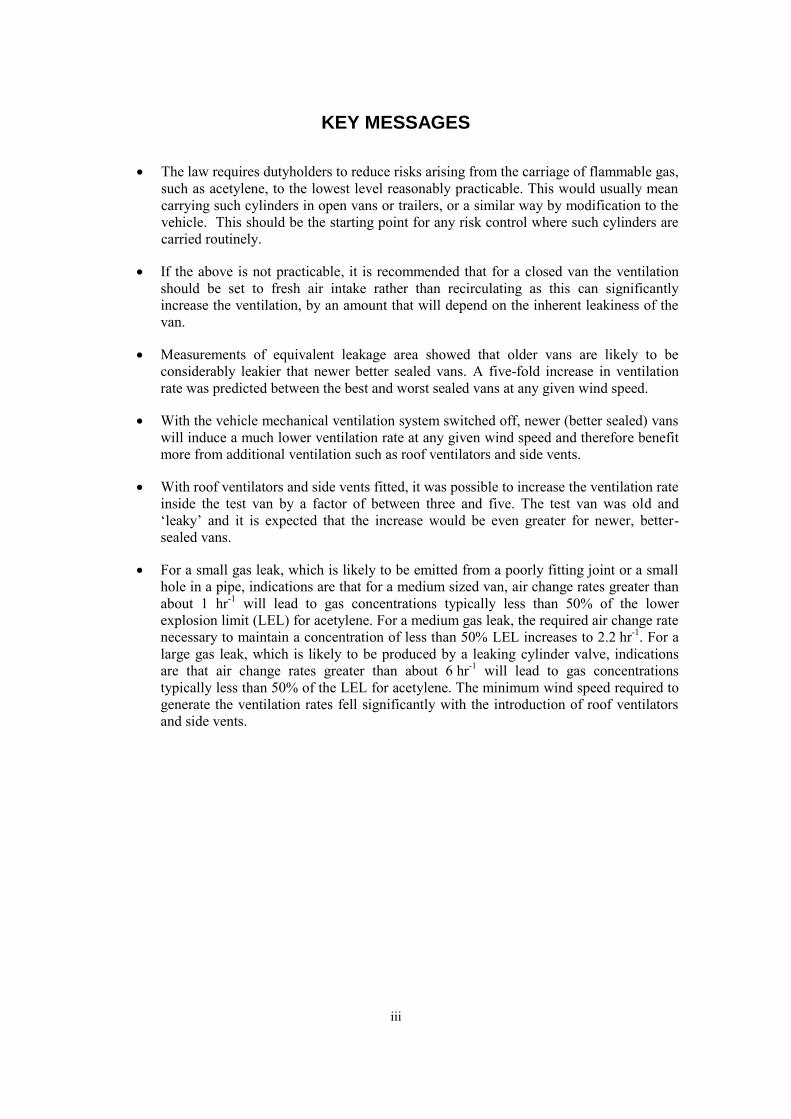
KEY MESSAGES
The law requires dutyholders to reduce risks arising from the carriage of flammable gas, such as acetylene, to the lowest level reasonably practicable. This would usually mean carrying such cylinders in open vans or trailers, or a similar way by modification to the vehicle. This should be the starting point for any risk control where such cylinders are carried routinely.
If the above is not practicable, it is recommended that for a closed van the ventilation should be set to fresh air intake rather than recirculating as this can significantly increase the ventilation, by an amount that will depend on the inherent leakiness of the van.
Measurements of equivalent leakage area showed that older vans are likely to be considerably leakier that newer better sealed vans. A five-fold increase in ventilation rate was predicted between the best and worst sealed vans at any given wind speed.
With the vehicle mechanical ventilation system switched off, newer (better sealed) vans will induce a much lower ventilation rate at any given wind speed and therefore benefit more from additional ventilation such as roof ventilators and side vents.
With roof ventilators and side vents fitted, it was possible to increase the ventilation rate inside the test van by a factor of between three and five. The test van was old and ‘leaky’ and it is expected that the increase would be even greater for newer, better-sealed vans.
For a small gas leak, which is likely to be emitted from a poorly fitting joint or a small hole in a pipe, indications are that for a medium sized van, air change rates greater than about 1 hr-1 will lead to gas concentrations typically less than 50% of the lower explosion limit (LEL) for acetylene. For a medium gas leak, the required air change rate necessary to maintain a concentration of less than 50% LEL increases to 2.2 hr-1. For a large gas leak, which is likely to be produced by a leaking cylinder valve, indications are that air change rates greater than about 6 hr-1 will lead to gas concentrations typically less than 50% of the LEL for acetylene. The minimum wind speed required to generate the ventilation rates fell significantly with the introduction of roof ventilators and side vents.
iv
EXECUTIVE SUMMARY
Background
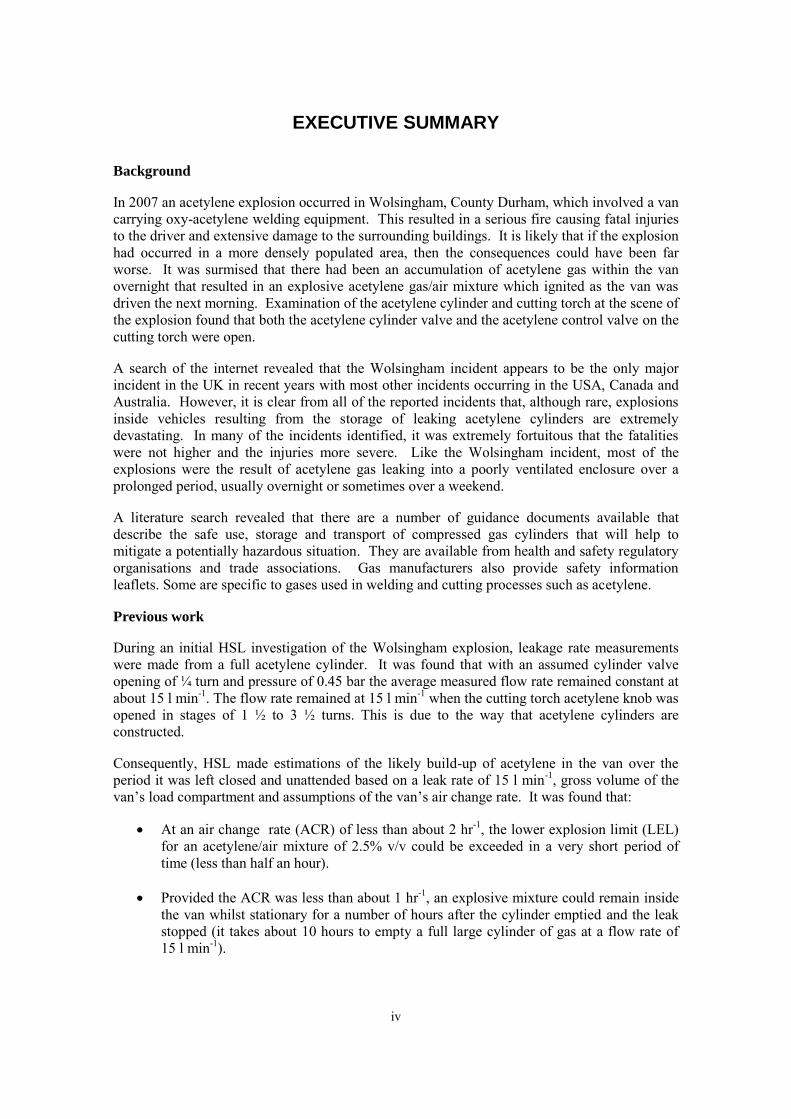
In 2007 an acetylene explosion occurred in Wolsingham, County Durham, which involved a van carrying oxy-acetylene welding equipment. This resulted in a serious fire causing fatal injuries to the driver and extensive damage to the surrounding buildings. It is likely that if the explosion had occurred in a more densely populated area, then the consequences could have been far worse. It was surmised that there had been an accumulation of acetylene gas within the van overnight that resulted in an explosive acetylene gas/air mixture which ignited as the van was driven the next morning. Examination of the acetylene cylinder and cutting torch at the scene of the explosion found that both the acetylene cylinder valve and the acetylene control valve on the cutting torch were open.
A search of the internet revealed that the Wolsingham incident appears to be the only major incident in the UK in recent years with most other incidents occurring in the USA, Canada and Australia. However, it is clear from all of the reported incidents that, although rare, explosions inside vehicles resulting from the storage of leaking acetylene cylinders are extremely devastating. In many of the incidents identified, it was extremely fortuitous that the fatalities were not higher and the injuries more severe. Like the Wolsingham incident, most of the explosions were the result of acetylene gas leaking into a poorly ventilated enclosure over a prolonged period, usually overnight or sometimes over a weekend.
A literature search revealed that there are a number of guidance documents available that describe the safe use, storage and transport of compressed gas cylinders that will help to mitigate a potentially hazardous situation. They are available from health and safety regulatory organisations and trade associations. Gas manufacturers also provide safety information leaflets. Some are specific to gases used in welding and cutting processes such as acetylene.
Previous work
During an initial HSL investigation of the Wolsingham explosion, leakage rate measurements were made from a full acetylene cylinder. It was found that with an assumed cylinder valve opening of ¼ turn and pressure of 0.45 bar the average measured flow rate remained constant at about 15 l min-1. The flow rate remained at 15 l min-1 when the cutting torch acetylene knob was opened in stages of 1 ½ to 3 ½ turns. This is due to the way that acetylene cylinders are constructed.
Consequently, HSL made estimations of the likely build-up of acetylene in the van over the period it was left closed and unattended based on a leak rate of 15 l min-1, gross volume of the van’s load compartment and assumptions of the van’s air change rate. It was found that:
At an air change rate (ACR) of less than about 2 hr-1, the lower explosion limit (LEL) for an acetylene/air mixture of 2.5% v/v could be exceeded in a very short period of time (less than half an hour).
Provided the ACR was less than about 1 hr-1, an explosive mixture could remain inside the van whilst stationary for a number of hours after the cylinder emptied and the leak stopped (it takes about 10 hours to empty a full large cylinder of gas at a flow rate of 15 l min-1).

v
Current work
Following on from this, HSE decided that further research was required to determine: what is a likely foreseeable leak rate; what is the ventilation rate of a typical van; what amount of ventilation is required to control a foreseeable leak?
The aim of the current work was therefore to determine the ventilation characteristics of a selection of commonly used closed vans during simulated releases of acetylene. To meet this aim the following objectives were agreed:
Determine typical leak rates that are likely to occur from acetylene cylinders and associated hoses and torches
Carry out ventilation measurements and flow modelling of closed vans in order to determine their ventilation characteristics
Measure simulated leak rates under varying conditions including worst case (low air change rate conditions) i.e. a vehicle parked inside a building
Investigate the effectiveness of improvements to the vehicle ventilation
In order to increase knowledge and to feed into the current project, a review of the literature was carried out to identify any scientific papers written over the last 20 years that describe measurements of vehicle ventilation. The result was that although many of the papers were not directly applicable to the current project (since they focus on cars rather than vans), some of the measurement methodologies described were applicable.
Subsequently, a number of vans were tested to determine their leakage characteristics. A full range of tests was carried out on one main test van (a medium sized van). Limited tests were also carried out on a selection of vans from different manufacturers with the aim of extrapolating the data from the main test vehicle using theoretical models described in the literature. All the tests were carried out with the vehicle cabin ventilation system switched off and set to either ‘fresh air’ or ‘recirculation’ mode. The tests consisted of:
Differential pressure tests (carried out on all vans): These involved passing air through the interior of the vans to determine the ‘Equivalent Leakage Area’ (ELA). Although ELA is not claimed to represent reality, it allows the “leakiness” of different vehicles to be compared.
Flow visualisation tests (carried out on the test van): smoke was released inside the van and any smoke that escaped was used to identify any adventitious openings.
Tracer gas tests (carried out on the test van): these were carried out to determine van ventilation rates. Tests were carried out with the van located indoors and outdoors (exposed and secluded) for a number of wind conditions and using different van ventilation settings. Wind speed and direction were logged throughout the tests.
Simulated leaks (carried out on the test van): these were carried out using a tracer gas as a surrogate for acetylene. Two leak sizes (and gas release rates) and two leak positions were studied. Tests were carried out both indoors and outdoors in order to test at a range of vehicle ACRs to determine if (and how quickly) the lower explosion limit (LEL) was reached.
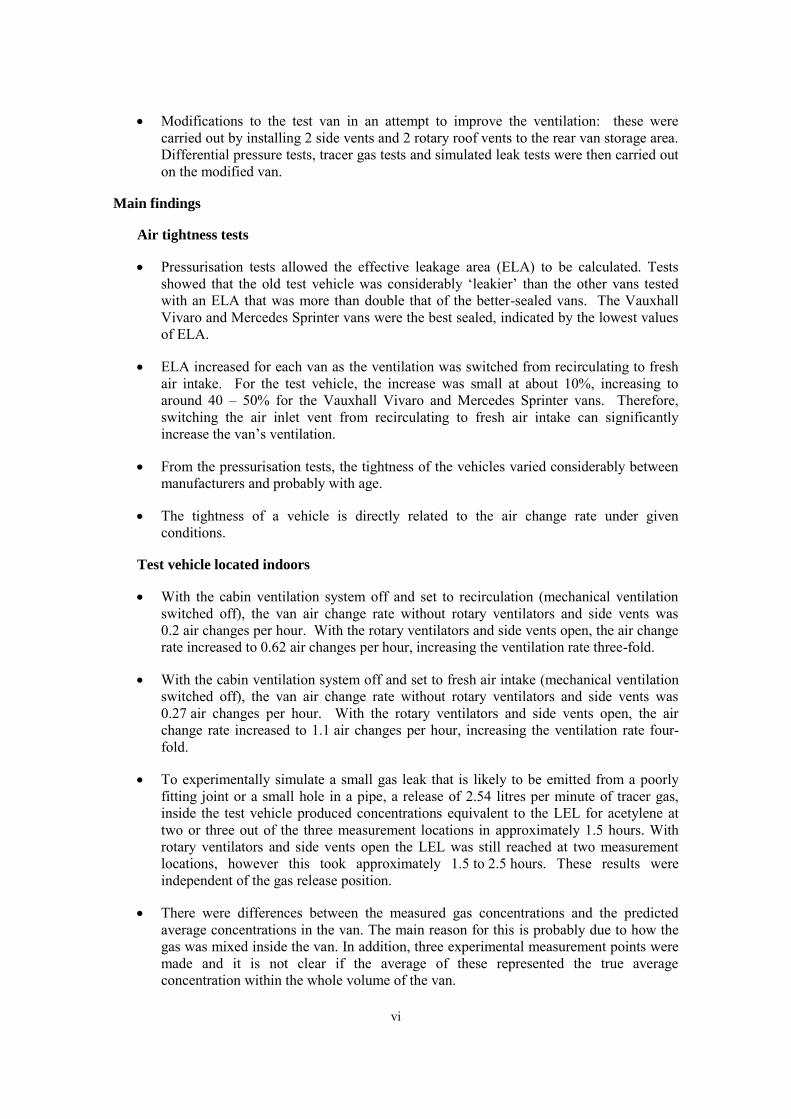
vi
Modifications to the test van in an attempt to improve the ventilation: these were carried out by installing 2 side vents and 2 rotary roof vents to the rear van storage area. Differential pressure tests, tracer gas tests and simulated leak tests were then carried out on the modified van.
Main findings
Air tightness tests
Pressurisation tests allowed the effective leakage area (ELA) to be calculated. Tests showed that the old test vehicle was considerably ‘leakier’ than the other vans tested with an ELA that was more than double that of the better-sealed vans. The Vauxhall Vivaro and Mercedes Sprinter vans were the best sealed, indicated by the lowest values of ELA.
ELA increased for each van as the ventilation was switched from recirculating to fresh air intake. For the test vehicle, the increase was small at about 10%, increasing to around 40 – 50% for the Vauxhall Vivaro and Mercedes Sprinter vans. Therefore, switching the air inlet vent from recirculating to fresh air intake can significantly increase the van’s ventilation.
From the pressurisation tests, the tightness of the vehicles varied considerably between manufacturers and probably with age.
The tightness of a vehicle is directly related to the air change rate under given conditions.
Test vehicle located indoors
With the cabin ventilation system off and set to recirculation (mechanical ventilation switched off), the van air change rate without rotary ventilators and side vents was 0.2 air changes per hour. With the rotary ventilators and side vents open, the air change rate increased to 0.62 air changes per hour, increasing the ventilation rate three-fold.
With the cabin ventilation system off and set to fresh air intake (mechanical ventilation switched off), the van air change rate without rotary ventilators and side vents was 0.27 air changes per hour. With the rotary ventilators and side vents open, the air change rate increased to 1.1 air changes per hour, increasing the ventilation rate four-fold.
To experimentally simulate a small gas leak that is likely to be emitted from a poorly fitting joint or a small hole in a pipe, a release of 2.54 litres per minute of tracer gas, inside the test vehicle produced concentrations equivalent to the LEL for acetylene at two or three out of the three measurement locations in approximately 1.5 hours. With rotary ventilators and side vents open the LEL was still reached at two measurement locations, however this took approximately 1.5 to 2.5 hours. These results were independent of the gas release position.
There were differences between the measured gas concentrations and the predicted average concentrations in the van. The main reason for this is probably due to how the gas was mixed inside the van. In addition, three experimental measurement points were made and it is not clear if the average of these represented the true average concentration within the whole volume of the van.
vii
The predicted gas concentrations within the van, based on measured air change rates, and contrary to the above measurements, showed the average gas concentration is calculated to reach approximately 70 – 85% of the LEL if no additional ventilation is fitted. With roof ventilators and side grilles fitted to the van the gas concentration is calculated to reach approximately 30 – 50% of the LEL i.e. the additional ventilation reduces the gas concentration by about half.
A large leak of 15 litres per minute, which could be produced by an acetylene cylinder left open a ¼ of a turn and the torch open, produced a concentration inside the vehicle equivalent to the LEL within 13 minutes at two out of the three measurement locations regardless of whether rotary ventilators and side vents were open or closed. For this release rate, the average gas concentration within the van is calculated to reach the LEL within 24 to 27 minutes depending on whether or not there is additional ventilation.
The above results are based on measurements using the test van, which was found to be ‘leakier’ than newer, better-sealed vans. Therefore, in other vans and for the same gas release rate, higher gas concentrations are expected and the provision of additional ventilation, such as side vents or rotary ventilators will help to reduce the likelihood of flammable concentrations occurring within the van.
Test vehicle located outside
With the test van parked outdoors and in an exposed location, the addition of rotary ventilators and side vents increased the air change rate by a factor of about 3 to 5 depending on the van orientation relative to the wind.
For a gas release rate of 2.54 litres per minute and wind speed in the range 1.5 to 8 m s-1 (3.3 to 18 mph), the average concentration at the three measurement locations inside the van reached between approximately 7 and 30% of the LEL for acetylene. This depended on the location of the van (exposed or sheltered) and the orientation of the van relative to the wind. With additional ventilation, the concentration was between 4 and 13% of the LEL for a similar wind speed range.
Based on the air change rates during the tests with no additional ventilation, the calculated average gas concentration inside the test vehicle would reach approximately 18 to 26% of the LEL for acetylene for the same release rate and range of conditions considered in the experimental tests. With the introduction of additional ventilation, the concentration within the test vehicle would reach approximately 3 to 12% of the LEL. These values are very similar to the experimental gas concentration measurements.
Applying the above experimental gas release rate and wind speed range to the predicted air change rate data for the best-sealed van, the average concentration in the van is estimated to lie between 25 and 160% of the LEL. This is for the vehicle positioned side on to the wind and is likely to be higher for other van orientations.
The experimental data and calculations of average gas concentrations within the test van suggests that across the range of tests considered (van in exposed and sheltered locations) with the rotary ventilators and side vents open, the average concentration inside the van was reduced by 50% or more. Note that this is a ‘leaky’ old van and the difference should be more significant in a newer better-sealed van.
For a higher gas release rate of approximately 15 litres per minute with the van parked in a sheltered location, the concentration inside the van reached the LEL within 22 to 30
viii
minutes with the rotary ventilators and side vents shut. With the rotary ventilators and side vents open the concentration inside the van was much more stratified and only reached the LEL at the top measurement position.
Based on the measured ventilation rate during the test, the calculated average gas concentration in the van reaches the LEL in about 28 minutes with the rotary ventilators and side vents shut. With the rotary ventilators and side vents open the average concentration in the van would be expected to reach a maximum of approximately 40% of the LEL.
General
For a given release of flammable gas within a van, the average concentration in the van will scale linearly with the reciprocal of the ventilation rate, i.e if the ventilation rate is doubled then the average gas concentration will be halved.
A release of about 2.54 litres per minute of acetylene has been considered in this study to assess the effectiveness of van ventilation for diluting credible releases that may occur from time to time. This leak rate has been chosen based on a standard hole size commonly used in Hazardous Area Classification.
The gas release experiments in the van indicate that the gas is often (but not always) stratified, with concentrations often similar at the top and centre of the van, but usually considerably lower near to the floor. The degree of stratification will depend upon the release position and the induced ventilation rate.
ix
CONTENTS PAGE
1. INTRODUCTION .................................................................... 1
1.1 Background 1 1.2 Previous work carried out at HSL 1 1.3 Aims and objectives of current work 2
2. KNOWLEDGE REVIEW ......................................................... 3
2.1 General 3 2.2 Literature search methodology 3 2.3 Peer reviewed papers 4 2.4 Guidance documents 7
2.5 Incidents of vehicle explosions caused by leaking acetylene cylinders 10 2.6 Summary of knowledge review 13 2.7 Average wind speeds in the UK 15
3. METHODOLOGY ................................................................. 17
3.1 Approach to the experimental study 17 3.2 Flow visualisation 21 3.3 Pressure tests 22 3.4 Air change rates 25 3.5 Modelling adequate ventilation 27 3.6 Leakage tests 30 3.7 Ventilation modifications to the test vehicle 31
4. RESULTS............................................................................. 34
4.1 Flow visualisation 34 4.2 Pressure tests 37 4.3 Air change rates 42 4.4 Gas release tests (experimental) 53 4.5 Gas release modelling 56
5. DISCUSSION ....................................................................... 59
5.1 Smoke tests 59
5.2 Pressure tests 59 5.3 Air change rates 60 5.4 Gas release modelling 63 5.5 Gas release tests (experimental) 64
6. CONCLUSIONS ................................................................... 66
6.1 Air tightness tests 66 6.2 Test vehicle located indoors 66 6.3 Test vehicle located outside 67 6.4 General 68
7. REFERENCES ..................................................................... 69

1
1. INTRODUCTION
1.1 BACKGROUND
In 2007 an acetylene explosion occurred in Wolsingham, County Durham, which involved a van carrying oxy-acetylene welding equipment. This resulted in a serious fire and extensive damage to the surrounding buildings. The driver of the van suffered fatal injuries. One possible explanation for the incident was there had been an accumulation of acetylene within the van overnight that resulted in an explosive acetylene gas/air mixture which ignited as the van was driven the next morning. The lower explosion limit (LEL) for an acetylene/air mixture is 2.5 % v/v. Examination of the acetylene cylinder and cutting torch at the scene of the explosion found that both the acetylene cylinder valve and the acetylene control valve on the cutting torch were open. It is likely that if the explosion had occurred in a more densely populated area, then the consequences could have been far worse.
Following the resulting coroner’s inquest, the coroner asked the Health and Safety Executive (HSE) to provide guidance that was readily available and easily understandable on the transportation of acetylene cylinders, with particular reference to the need for adequate ventilation.
1.2 PREVIOUS WORK CARRIED OUT AT HSL
As part of HSL’s initial investigation of this acetylene explosion, Hodges (2007) describes leakage rate measurements made from a full acetylene cylinder identical to the one in the explosion (typically containing 5 kg of saturated gas - capacity of 8.73m3 (free air conditions)) of dimensions 103 cm high x 28 cm diameter. With an assumed cylinder valve opening of ¼ turn and pressure of 0.45 bar he found that with the acetylene knob fully open (torch, hoses and flashback arrestor connected to an unused acetylene regulator recovered from the scene of the accident) the average measured flow rate was approximately 15 l min-1. Also, as the cutting torch acetylene knob was opened in stages of 1 1/2 to 3 1/2 turns it was found that there was no significant change in the flow rate with different valve openings and remained at about 15 l min-
1 (as in the fully open case). At this flow rate he estimated that it would take ~ 10 hours to empty a full cylinder.
Pritchard (2008), in a letter report to HSE, made estimations of the likely build-up of acetylene in the van over the period it was left closed and unattended and gave an opinion on whether the blast damage caused by the explosion was consistent with an acetylene explosion within the van. He based his estimates of acetylene build-up inside the van on the measurements of leak rate (15 l min-1), gross volume of the van’s load compartment previously made by Hodges (2007) and estimations of the van’s air change rate (ACR - quoted as air changes per hour) based on measurements made by Fletcher and Saunders (1994). Based on these assumptions he concluded:
At an ACR of less than about 2 hr-1, the lower explosion limit (LEL) for an acetylene/air mixture of 2.5% v/v could be exceeded in a very short period of time (less than half an hour).
The minimum leakage rates that would result in the acetylene concentration reaching the LEL over the period that the van was left unattended (11.5 hours) were 1.6, 3.2 and 6.3 l min-1 at air changes (ACH) of 0.5, 1 and 2 respectively.
2
Provided the ACR was less than about 1 hr-1, an explosive mixture could have remained inside the van whilst stationary for a number of hours after the cylinder emptied and the leak stopped.
At an ACR of 15 hr-1 (estimated from work by Fletcher and Saunders (1994) for a vehicle moving at 30 mph), the acetylene concentration in the van would fall rapidly in minutes to below the LEL. However, this was too long for the driver who had only driven for a minute or two from his house to where the explosion occurred.
1.3 AIMS AND OBJECTIVES OF CURRENT WORK
Following on from the work by Prichard (2008) where the build-up of acetylene gas inside a van was predicted, HSE decided that further research was required to determine:
What is a foreseeable leak rate? E.g. what is the likely leak rate from: open valves; splits/holes in pipes; poor seals etc.?
What is the ventilation rate of a typical van (previous measurements had been carried out inside cars)?
What amount of ventilation is required to control a foreseeable leak?
The aim of the current work was therefore to determine the ventilation effectiveness of a selection of commonly used closed vans during simulated releases of acetylene. To meet this aim the following objectives were agreed:
Determine typical leak rates from acetylene cylinders
Carry out ventilation measurements and flow modelling of closed vans in order to determine their ventilation characteristics
Measure simulated leak rates under varying conditions including the worst case (low air change rate conditions) i.e. a vehicle parked inside a building
Investigate the effectiveness of improvements to the vehicle ventilation
3
2. KNOWLEDGE REVIEW
2.1 GENERAL
It would appear that there has been little published research on the measurement of ventilation within vehicles, especially vans that are often used to transport cylinders of flammable gas. HSL were aware of only two papers on this subject and so it was decided to carry out a literature search of peer reviewed papers to identify if there has been any other relevant work carried out and reported. This would help to avoid duplication of work and also the information gained would feed into the test methodology for the current project.
In addition to peer reviewed papers there are a significant number of guidance documents available which address carriage of cylinders in vehicles e.g. guidance published by the British Compressed Gas Association (BCGA) and the HSE. These were reviewed and summarised to highlight current guidance. Other guidance, containing information on ventilation of spaces other than vehicles was also reviewed, as this may be relevant. For example, area classification work carried out at HSL (Ivings et al, 2008) was of interest even though the subject matter is natural gas releases in indoor rooms. In addition, the standard describing the code of practice for ventilation principles and designing for natural ventilation (BS 5925, 1991) was included in the review.
Finally an internet search of vehicle explosion incidents caused by leaking acetylene cylinders was carried out to give an indication of the nature and extent of the problem.
2.2 LITERATURE SEARCH METHODOLOGY
A set of key words was defined to perform the literature search. These included:
Ventilat*(-ion, -ate, -ated) Ventilat*(-ion, -ate, -ated) + Acetylene Compressed gas Cylinder Vehicle Van Automobile Car Motor vehicles
The above list were also combined with the terms ‘Ventilat*(-ion, -ate, -ated)’ and/or with ‘Stationary’ and/or ‘moving’.
Acetylene Acetylene + enclosed + ventilation Release Explosion risk Area classification Leakage
These terms were formatted into a viable search strategy by the HSE search team in consultation with the authors.
4
A number of databases including Web of Science (WoS), Oshrom, and Dialog were searched. In addition, the authors performed a search of the internet. These searches resulted in 59 relevant articles including: 15 peer reviewed papers, 24 guidance documents, 3 HSL reports, 15 explosion incident reports and 2 standards documents. The full texts of the documents were obtained and included in the review.
2.3 PEER REVIEWED PAPERS
There have been a relatively limited number of studies on the measurement of the ventilation rates within vehicles and those that have been carried out generally address car ventilation rather than vans. The majority of the studies are concerned with the effects of vehicle ventilation on the quality of air that the driver breathes in. However, some of the measurement methods are still applicable to the present study.
Petersen and Sabersky (1975) made measurements of air change rate (ACR) and pollutants inside a car under typical driving conditions during the summer months in Los Angeles (USA). ACRs were measured by using CO2 as the tracer gas. Although the work did not include an extensive study on factors influencing ACRs inside vehicles, it did show that with the vehicles’ air conditioning unit set to maximum, the ACR increased with increasing vehicle speed.
In a study to determine the degree of protection afforded by a vehicle during a release of toxic gas or vapour, Fletcher and Saunders (1994) measured the rate of air infiltrating into stationary and moving vehicles. Firstly, for stationary vehicles, they carried out measurements on vehicles under both positive and negative pressures to determine their leakage characteristics with the air intake vents open and closed. They also used a tracer gas (SF6) decay method to determine ACRs in the vehicles for different wind speeds and directions. ACRs (measured as air changes per hour) typically between 1 – 10 hr-1 were observed for wind speeds between 1 – 10 m s-1. They also found that wind approaching from the side of the vehicle induced a significantly higher air infiltration rate than when from the front or rear when the car vents were closed. With the car vents open the wind direction had no observed effect and the air change rate was higher than with the vents closed. The authors were also able to evaluate a constant from one vehicle that enabled infiltration rates to be determined for other vehicles in terms of leakage characteristics and wind conditions. They also measured air change rates inside a vehicle driven at constant speeds of between 35 and 70 mph (15.6 – 31.3 m s-1) to mimic an escape though a stationary cloud of gas. Although the variation of ACR with speed was similar to that for the stationary vehicle in a moving airflow, a higher ACR was found for a moving vehicle than would be predicted for the stationary vehicle, using leakage characteristics.
Ott et al (1994) carried out a study of carbon monoxide exposures inside motor vehicles during 88 standardized drives on a major urban highway in the USA. As part of this study, they measured the ACR inside the vehicle. They found that with the windows opened in a standard position (driver’s window fully open, passenger window open 3 inches and all other windows closed) the ACR was approximately 60 – 120 hr-1 at a travelling speed of 20 mph (8.9 m s-1). With the windows closed, the ACR was 13 hr-1 at 20 mph and with the vehicle stationary was 1.4 hr-1.
In a study of air quality inside the passenger compartment of a bus, Conceição et al (1997) reported measurements of ACR. They describe a contaminant-removing ventilation system comprising an air extract duct running the length of the bus that was designed to increase the ACR and hence improve the air quality inside the bus. ACR measurements were determined by using nitrous oxide as the tracer gas. Their results show that in an unmodified bus, typical ACRs were about 3.7 hr-1 when travelling at a speed of 80 km hr-1 (22.2 m s-1). With the ventilation system installed and with the bus travelling at approximately the same speed, the air
5
change rates increased to 12 – 13 hr-1. When stationary the ACR was low at 1.5 – 2.1 hr-1. With the bus’ forced ventilation system switched on, the ACR was similar irrespective of whether the bus was stationary or moving being typically 13 – 16 hr-1.
Park et al (1998) measured ACRs with 4 different ventilation conditions in 3 types of stationary automobiles. They measured the decay in CO2 concentration inside the car to determine the ACR. The measured ACRs ranged between 1 and 3 hr-1 with the car windows closed and no mechanical ventilation, between 1.8 and 3.7 hr-1 for windows closed with the fan set on recirculation, between 13.3 and 26 hr-1 for windows open with no mechanical ventilation and between 36.2 and 47.5 hr-1 for windows closed with the fan set on fresh air supply. They also found that ACRs were higher for the older automobiles with the windows closed and no ventilation. Unlike Fletcher and Saunders (1994) they observed no influence of wind speed on the air change rate with the windows closed and the fan turned off. However, when the window was open they found that the ACR was greatly affected by wind speed. The authors also observed a very low ACR of 0.2 hr-1 when one of the automobiles was parked inside an underground garage with virtually no air movement.
Offermann et al (2002) carried out measurements of exposure to environmental tobacco smoke inside a moving minivan under three different ventilation scenarios i.e. with the driver’s window open/ventilation off, windows closed/ventilation on, and windows closed/ventilation off. They also measured the ACR using the tracer gas decay method for these scenarios. The measured ACR with the windows closed and the ventilation off was 4.9 hr-1. With the windows closed and the ventilation on, the ACR increased to 60 hr-1. With the windows open and the ventilation off the ACR increased further to 70 hr-1. The speed of the vehicle ranged from 0 – 40 km hr-1, with an approximate average speed of 30 km hr-1Nakagawa et al (2007) carried out measurements of CO2 and VOC concentration emitted by people inside the compartment of a 5-person capacity car with the aim of investigating the quality of air. CO2 concentration was measured both inside and outside the car compartment when both stationary and moving and also with the car ventilation system operating in fresh air mode and air recirculation mode. In all cases the car windows were closed. The authors describe a method of determining the car ventilation rate from measurements of CO2 emission rate, indoor and outdoor concentration of CO2 and the interior volume of the car compartment. Their results show that the measured ventilation rate inside the car compartment during fresh air intake ventilation mode was approximately 130 m3 hr-1 (ACR approximately 43 hr-1) and that during re-circulation mode was 10 m3 hr-1 (ACR approximately 3.5 hr-1). The ventilation rate during driving was close to that when the vehicle was stationary, similar to conclusions found by Conceição et al (1997).
As part of a study to estimate in-vehicle pollutant concentrations from second-hand cigarette smoke, Ott et al (2007) measured the ACR of motor vehicles, both when stationary and moving, under different ventilation conditions and window positions. The authors used a CO2 tracer gas decay method to determine more than 100 ACRs inside four different motor vehicles. They found that with the vehicle parked in a partially enclosed garage, the fan off, and the windows closed, the ACR was less than 1 hr-1 and increased to 6.5 hr-1 with one window fully open. When driven, the vehicle speed, window position, ventilation system and air conditioning setting were found to affect the ACR. With a vehicle moving, windows closed and the ventilation system turned off (or the air conditioning set to maximum), they found that the ACR was less than 6.6 hr-1 at speeds ranging from 20 to 72 mph (8.9 – 32 ms-1). They also observed that opening a single window by 3” (approximately 75 mm) increased the ACR by 8 – 16 times. For one vehicle, turning on the ventilation or air conditioning increased the ACR significantly, but this was independent of the vehicle speed. They observed that for two vehicles with the air conditioning, fan and recirculation switched off, this gave the same passive ventilation setup described by Fletcher and Saunders (1994) and resulted in similar relationship between vehicle
6
velocity and the measured ACR. ACRs between approximately 3 and 58 hr-1 were measured at vehicle speed ranging from 15 to 72 mph (6.7 ms-1 to 32 ms-1).
In a study to determine air pollution inside parked new cars, Guang-Shan Zhang et al (2008) carried out measurements of selected pollutants and air quality inside 802 different types of new cars under unoccupied stationary conditions. As part of the air quality evaluation, ventilation rates were also determined for selected vehicles. In-vehicle monitoring was conducted inside a well-ventilated and air conditioned underground car park within Beijing’s city limits. The tracer gas decay method was used to determine ACRs using carbon dioxide as the tracer gas. They found that ACRs varied from <0.01 to 0.63 hr-1 depending on the make and model of car.
Knibbs et al (2009) made specific measurements of ACR and flow rate in a range of passenger vehicles representative of those driven on Australian roads, when both stationary and travelling at speed, and under a range of ventilation settings with the windows closed. They quantified ACRs in six vehicles ranging in age from 18 years to less than 1 year, at three vehicle speeds and under four different ventilation settings. Measurements of vehicle ventilation were carried out using the SF6 tracer gas concentration decay method at low ACRs and a constant injection technique using SF6 was used for the measurement of high ACRs. The authors found that in stationary vehicles with the ventilation set to fresh air intake and the fan set to the lowest speed, the measured flows varied from 96 - 155 m3 hr-1. This increased to 225 – 300 m3 hr-1 when the fan speed was increased to second highest. When driven at a speed of 60 km hr-1 (16.7 ms-1) the range of airflow values with the fan on the lowest setting was between 147 – 245 m3 hr-1. This increased to 271 – 343 m3 hr-1 at the higher fan speed. They found that the airflow increased linearly with increasing vehicle speed. This finding is different from both Conceição et al (1997) and Nakagawa et al (2007) who did not find any appreciable increase in ACR versus driving speed with the vehicle fan on.
With the vehicle stationary, the fan switched off, vents closed and the air intake switched to recirculation (termed infiltration mode), the authors found that there was a moderate tendency for the ACR to increase with increasing external wind speed from 0.14 to 1.8 hr-1. With the same ventilation settings but with the vehicles moving the ACR increased linearly with increasing speed although there was a wide spread in values depending on the vehicle type ranging from 1 – 33.1 hr-1 (at 60 km hr-1 (16.7 m s-1)) to 2.6 – 47.3 hr-1 (at 110 km hr-1, equivalent to 30.6 ms-1). This illustrates the variation in leakage or air infiltration that can occur depending on the air tightness of the vehicle. With the vehicles stationary, but the ventilation set to recirculation and fan switched on, the authors found that the ACR was less than 1 hr-1 in all but one case. When moving, the measured air change rates were very similar to those measured with the ventilation adjusted to infiltration. This suggests that there is little evidence to indicate any additional outdoor air is brought into the vehicles by the car ventilation system under a recirculation setting. Increasing the fan speed appeared to moderately accentuate infiltration shown by a slightly higher ACR. The authors conclude that the results of the study generally agree well with other previously published studies for similar closed window cases.
In the most recent study, Scott et al (2011) carried out measurements of ACRs inside cars. They tested a large number of cars in order to develop robust predictive models of air change rates during ventilation recirculation conditions as a simple function of readily available information. They measured ACRs at three speeds for each of 59 Californian vehicles, chosen to represent different sizes, ages, vehicle types and manufacturer - the largest study of its kind to date. ACRs were determined from measurements of CO2 concentration inside and outside the vehicle. Large differences in measured ACRs were observed from vehicle-to-vehicle as was the strong dependence on speed for any given vehicle. Measurements made with the fan on in ‘fresh air mode’ gave ACRs from approximately 20 to greater than 100 hr-1. From the measurements of ACRs the authors were able to develop a predictive model that can estimate the ACR of a
7
vehicle based on easily obtainable parameters such as: car age, mileage, speed and a term called “manufacturers adjustment”.
2.4 GUIDANCE DOCUMENTS
In order to reduce the risk of a gas explosion occurring inside vehicles used to transport and/or store flammable gas cylinders, it is essential the chances of a gas leak and accumulation are minimised. In the event that a leak does occur it is then important that the vehicle is adequately ventilated to reduce the likelihood of the gas/air mixture reaching an explosive concentration.
There are a number of guidance documents available describing the safe use, storage and transport of compressed gas cylinders. They are available from health and safety regulatory organisations, such as the HSE and trade associations such as the BCGA and the European Industrial Gases Association (EIGA). Gas manufacturers such as BOC and Air Products Ltd also provide safety information leaflets. Some are specific to gases used in welding and cutting processes, such as acetylene.
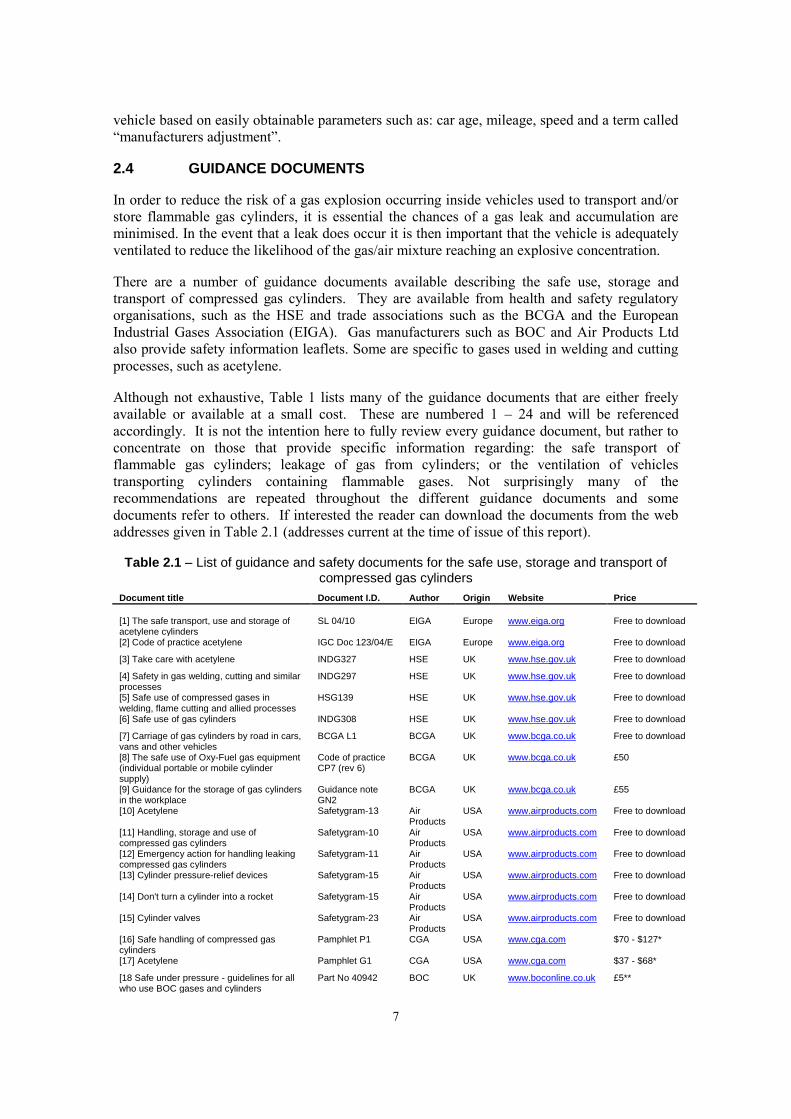
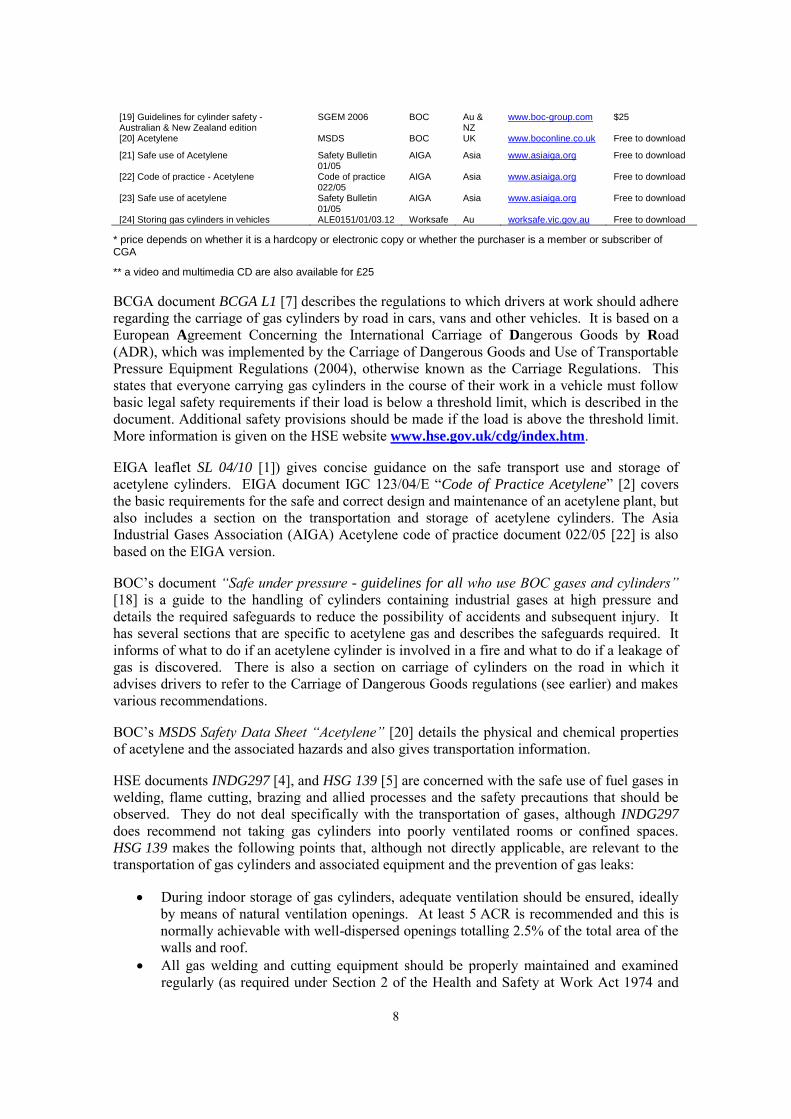
Although not exhaustive, Table 1 lists many of the guidance documents that are either freely available or available at a small cost. These are numbered 1 – 24 and will be referenced accordingly. It is not the intention here to fully review every guidance document, but rather to concentrate on those that provide specific information regarding: the safe transport of flammable gas cylinders; leakage of gas from cylinders; or the ventilation of vehicles transporting cylinders containing flammable gases. Not surprisingly many of the recommendations are repeated throughout the different guidance documents and some documents refer to others. If interested the reader can download the documents from the web addresses given in Table 2.1 (addresses current at the time of issue of this report).
Table 2.1 – List of guidance and safety documents for the safe use, storage and transport of compressed gas cylinders
Document title Document I.D. Author Origin Website Price
[1] The safe transport, use and storage of acetylene cylinders
SL 04/10 EIGA Europe www.eiga.org Free to download
[2] Code of practice acetylene IGC Doc 123/04/E EIGA Europe www.eiga.org Free to download
[3] Take care with acetylene INDG327 HSE UK www.hse.gov.uk Free to download
[4] Safety in gas welding, cutting and similar processes
INDG297 HSE UK www.hse.gov.uk Free to download
[5] Safe use of compressed gases in welding, flame cutting and allied processes
HSG139 HSE UK www.hse.gov.uk Free to download
[6] Safe use of gas cylinders INDG308 HSE UK www.hse.gov.uk Free to download
[7] Carriage of gas cylinders by road in cars, vans and other vehicles
BCGA L1 BCGA UK www.bcga.co.uk Free to download
[8] The safe use of Oxy-Fuel gas equipment (individual portable or mobile cylinder supply)
Code of practice CP7 (rev 6)
BCGA UK www.bcga.co.uk £50
[9] Guidance for the storage of gas cylinders in the workplace
Guidance note GN2
BCGA UK www.bcga.co.uk £55
[10] Acetylene Safetygram-13 Air Products
USA www.airproducts.com Free to download
[11] Handling, storage and use of compressed gas cylinders
Safetygram-10 Air Products
USA www.airproducts.com Free to download
[12] Emergency action for handling leaking compressed gas cylinders
Safetygram-11 Air Products
USA www.airproducts.com Free to download
[13] Cylinder pressure-relief devices Safetygram-15 Air Products
USA www.airproducts.com Free to download
[14] Don't turn a cylinder into a rocket Safetygram-15 Air Products
USA www.airproducts.com Free to download
[15] Cylinder valves Safetygram-23 Air Products
USA www.airproducts.com Free to download
[16] Safe handling of compressed gas cylinders
Pamphlet P1 CGA USA www.cga.com $70 - $127*
[17] Acetylene Pamphlet G1 CGA USA www.cga.com $37 - $68*
[18 Safe under pressure - guidelines for all who use BOC gases and cylinders
Part No 40942 BOC UK www.boconline.co.uk £5**
8
[19] Guidelines for cylinder safety - Australian & New Zealand edition
SGEM 2006 BOC Au & NZ
www.boc-group.com $25
[20] Acetylene MSDS BOC UK www.boconline.co.uk Free to download
[21] Safe use of Acetylene Safety Bulletin 01/05
AIGA Asia www.asiaiga.org Free to download
[22] Code of practice - Acetylene Code of practice 022/05
AIGA Asia www.asiaiga.org Free to download
[23] Safe use of acetylene [24] Storing gas cylinders in vehicles
Safety Bulletin 01/05 ALE0151/01/03.12
AIGA Worksafe
Asia Au
www.asiaiga.org worksafe.vic.gov.au
Free to download Free to download
* price depends on whether it is a hardcopy or electronic copy or whether the purchaser is a member or subscriber of CGA
** a video and multimedia CD are also available for £25
BCGA document BCGA L1 [7] describes the regulations to which drivers at work should adhere regarding the carriage of gas cylinders by road in cars, vans and other vehicles. It is based on a European Agreement Concerning the International Carriage of Dangerous Goods by Road (ADR), which was implemented by the Carriage of Dangerous Goods and Use of Transportable Pressure Equipment Regulations (2004), otherwise known as the Carriage Regulations. This states that everyone carrying gas cylinders in the course of their work in a vehicle must follow basic legal safety requirements if their load is below a threshold limit, which is described in the document. Additional safety provisions should be made if the load is above the threshold limit. More information is given on the HSE website www.hse.gov.uk/cdg/index.htm.
EIGA leaflet SL 04/10 [1]) gives concise guidance on the safe transport use and storage of acetylene cylinders. EIGA document IGC 123/04/E “Code of Practice Acetylene” [2] covers the basic requirements for the safe and correct design and maintenance of an acetylene plant, but also includes a section on the transportation and storage of acetylene cylinders. The Asia Industrial Gases Association (AIGA) Acetylene code of practice document 022/05 [22] is also based on the EIGA version.
BOC’s document “Safe under pressure - guidelines for all who use BOC gases and cylinders” [18] is a guide to the handling of cylinders containing industrial gases at high pressure and details the required safeguards to reduce the possibility of accidents and subsequent injury. It has several sections that are specific to acetylene gas and describes the safeguards required. It informs of what to do if an acetylene cylinder is involved in a fire and what to do if a leakage of gas is discovered. There is also a section on carriage of cylinders on the road in which it advises drivers to refer to the Carriage of Dangerous Goods regulations (see earlier) and makes various recommendations.
BOC’s MSDS Safety Data Sheet “Acetylene” [20] details the physical and chemical properties of acetylene and the associated hazards and also gives transportation information.
HSE documents INDG297 [4], and HSG 139 [5] are concerned with the safe use of fuel gases in welding, flame cutting, brazing and allied processes and the safety precautions that should be observed. They do not deal specifically with the transportation of gases, although INDG297
does recommend not taking gas cylinders into poorly ventilated rooms or confined spaces. HSG 139 makes the following points that, although not directly applicable, are relevant to the transportation of gas cylinders and associated equipment and the prevention of gas leaks:
During indoor storage of gas cylinders, adequate ventilation should be ensured, ideally by means of natural ventilation openings. At least 5 ACR is recommended and this is normally achievable with well-dispersed openings totalling 2.5% of the total area of the walls and roof.
All gas welding and cutting equipment should be properly maintained and examined regularly (as required under Section 2 of the Health and Safety at Work Act 1974 and
9
regulation 6 of the Provision and Use of Work Equipment Regulations 1998). In order to reduce the possibility of gas leaks it recommends that periodically: the equipment should be tested for gas tightness using leak detection products; hoses should be checked for cracking, cuts and abrasion; non-return valves should be checked for faults; regulators should be checked for internal leakage and damage to the ‘bull nose’ connections.
The frequency of maintenance examinations should depend on the frequency of use of the equipment and the conditions under which it is used. Any defective component should be replaced or repaired by a competent person using suitable parts.
HSE document INDG327 [3] is aimed at workers who use acetylene for welding, cutting and similar processes and provides information on the fire and explosion hazards of acetylene. It deals specifically with the problem of flashback and how to prevent it from occurring. HSE document INDG308 [6] addresses the safe use of gas cylinders and covers areas such as: uses of cylinders; the main hazards of using gas cylinders; and the main causes of accidents. It also describes how to reduce risks when using gas cylinders, including a section on reducing risks during transportation.
BCGA document BCGA CP 7 [8] is concerned with the safe use of oxy-fuel gas equipment (individual portable or mobile cylinder supply) and does not specifically address the hazards raised during transportation. It does, however, recommend that cylinders are stored in a vertical position in an area with constant and thorough ventilation. It also makes the following points that are relevant to the prevention of gas leaks.
Cylinder pressure regulators should conform to the correct standards (BS EN ISO 2503, BS EN ISO 7291), are fit for purpose and should be regularly inspected. Regulators showing signs of damage or that have exceeded their expiry date should be replaced.
Hoses and assemblies that connect the torch to the cylinder regulator should conform to the relevant standards (BS EN ISO 3821, BS EN 560, BS EN 730-2, BS EN 1256 and BS EN 561) and be fit for purpose. They should be of a composition that is compatible with the gas and pressures with which they are to be used. Hoses should be regularly inspected and replaced if they show signs of damage.
Worksafe document ALE0151/01/03.12 [24] provides advice about how to manage the risk of explosion from leaking portable flammable gas cylinders inside work vehicles. In addition to many of the safety and control measures described in other documents, it also describes the use of ventilated cabinets if flammable gas cylinders are stored or transported inside closed vehicles. Closed-type vehicles are defined as vans, utilities and other vehicles that have cargo areas with restricted natural air movement and ventilation. A design of ventilated cabinet is described, the main features being:
One or more permanent vents or drains are positioned at the bottom of the cabinet (either floor or side), with an internal diameter of at least 25mm
Vents are located so they cannot be blocked when the cylinders are in the cabinet A way of securing cylinders in an upright and stable position is provided (e.g. straps) A visible flammable gas label is placed on the outside Regular inspections and maintenance of door seals and vents are carried out.
10
2.5 INCIDENTS OF VEHICLE EXPLOSIONS CAUSED BY LEAKING ACETYLENE CYLINDERS
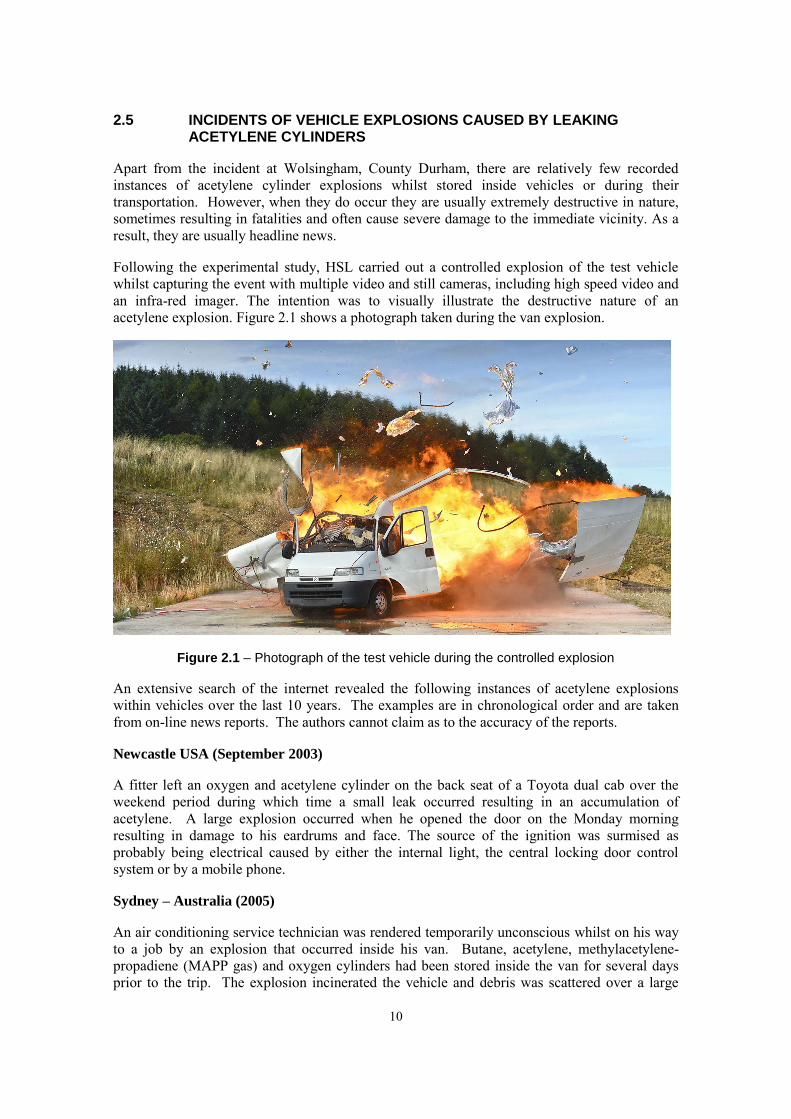
Apart from the incident at Wolsingham, County Durham, there are relatively few recorded instances of acetylene cylinder explosions whilst stored inside vehicles or during their transportation. However, when they do occur they are usually extremely destructive in nature, sometimes resulting in fatalities and often cause severe damage to the immediate vicinity. As a result, they are usually headline news.
Following the experimental study, HSL carried out a controlled explosion of the test vehicle whilst capturing the event with multiple video and still cameras, including high speed video and an infra-red imager. The intention was to visually illustrate the destructive nature of an acetylene explosion. Figure 2.1 shows a photograph taken during the van explosion.
Figure 2.1 – Photograph of the test vehicle during the controlled explosion
An extensive search of the internet revealed the following instances of acetylene explosions within vehicles over the last 10 years. The examples are in chronological order and are taken from on-line news reports. The authors cannot claim as to the accuracy of the reports.
Newcastle USA (September 2003)
A fitter left an oxygen and acetylene cylinder on the back seat of a Toyota dual cab over the weekend period during which time a small leak occurred resulting in an accumulation of acetylene. A large explosion occurred when he opened the door on the Monday morning resulting in damage to his eardrums and face. The source of the ignition was surmised as probably being electrical caused by either the internal light, the central locking door control system or by a mobile phone.
Sydney – Australia (2005)
An air conditioning service technician was rendered temporarily unconscious whilst on his way to a job by an explosion that occurred inside his van. Butane, acetylene, methylacetylene-propadiene (MAPP gas) and oxygen cylinders had been stored inside the van for several days prior to the trip. The explosion incinerated the vehicle and debris was scattered over a large
11
area. The technician suffered concussion, lacerations to his hands and damage to his hearing. The most likely cause of the explosion was the ignition of acetylene gas since a deficit was found in the acetylene cylinder. Also, although the vehicle was not airtight, the employers had not provided adequate ventilation for the storage of dangerous gases. As a result, the manufacturer fitted wind powered rotary ventilator into the roofs of new vehicles in addition to low-level floor vents to aid ventilation.
Cincinnati – USA (October 2008)
A driver was hospitalised when his car exploded on a residential street in Cincinnati. The likely cause of the explosion was a leaking acetylene gas cylinder located on the back seat, which had been stored in the car overnight creating an explosive atmosphere. This was ignited as the driver started his car as he left home for work in the morning. The car was totally destroyed and the blast from the explosion blew out the windows of at least two homes located either side of the car. Debris was projected several hundred feet in all directions.
Chelsea Heights – Melbourne, Australia (October 2009)
Two apprentice plumbers escaped injury when their bosses’ VW transporter van exploded as it was opened. The blast from the explosion damaged two houses and caused eight more to be evacuated. It is thought that the blast was caused by a leaking acetylene cylinder stored inside a cabinet in the van that had created an explosive atmosphere and which was probably ignited by an electrical spark produced when the car’s central locking system was operated. The van was totally destroyed in the explosion.
Canada (December 2011)
A man survived a massive acetylene gas explosion that occurred inside his Toyota FJ Cruiser, escaping with only minor injuries. The truck had been parked inside a garage overnight and it was thought that the cylinder valve had been knocked during transportation causing it to open slightly resulting in a leak of acetylene gas into the truck and garage. The next morning upon smelling the leaked acetylene, the man opened the garage door to clear the gas and then drove the truck out of the garage into the street. When he opened the electric windows to let more fresh air into the vehicle, the electric signal triggered an explosion that tore the vehicle apart.
Mulgrave – Melbourne, Australia (December 2011)
A 25 year old refrigerator technician died when his van was destroyed in an acetylene gas explosion as he was about to leave home for work at about 6.45am. The blast shattered windows in nearby homes and sprayed debris for 200 m in all directions and several smaller explosions erupted. It is believed that about six gas cylinders were kept inside the van and a leak from one of the cylinders caused the explosion but the source of ignition was not confirmed.
Darwin – Australia (December 2011)
Just days after the incident that occurred in Mulgrave, a 24-year old refrigeration technician was killed instantly after an acetylene gas bottle, stored in a rear load space inside his Toyota HiAce van, ignited and exploded as the van was started early in the morning. The huge explosion is thought to have set off other bottles inside the van that completely destroyed the vehicle and caused damage to the home and surroundings.
12
Hereford, Texas – USA (February 2012)
A man died from injuries sustained after his pickup truck exploded as he attempted to start it. The car was engulfed in flames when authorities arrived at the scene. It is believed that two 2-foot long cylinders of acetylene in the truck’s cab had leaked resulting in an explosive build-up of acetylene gas.
Stoneham, Boston - USA (January 2013)
A car exploded in a crowded parking lot as a woman unlocked the car and opened the boot. Her boyfriend, a plumber, had left his welding rig inside the vehicle's boot while the couple went shopping. During this time a slow leak from an acetylene cylinder had filled the whole interior with gas which had ignited when the car remote was operated. The car was destroyed but nobody was killed.
Greeley Colorado – USA (February 2013)
A man suffered injuries to his face, scalp and upper torso and a broken leg after a cylinder filled with acetylene exploded in the boot of his car. He and a friend had been driving beforehand and heard the cylinder, rolling around in the boot. The man had returned to the car later to get some laundry out of the boot when the cylinder exploded. Debris from the explosion was strewn 170 feet around the car.
Southfield – USA (March 2013)
A 55-year old man who had smelled acetylene gas after he started his car, tried to exit the car, but it exploded. The man was injured and nearby houses shook due to the force of the blast. It was discovered that a leaking acetylene cylinder stored inside the car was the cause of the explosion.
Vancouver – Canada (May 2013)
A leaking acetylene cylinder stored inside a car exploded, resulting in the car being completely destroyed and severe damage to nearby apartment buildings. The car owner (a plumber) was walking toward his car at 6:50 a.m. when he triggered the remote ignition, which ignited acetylene gas that had accumulated inside the car. He was uninjured, but two men who were driving past at the time of the explosion suffered minor injuries.
Jersey City - USA (July 2013)
Two men were hospitalised when a leaking acetylene cylinder stored in the boot of a car exploded as the car boot was opened. A second man who was walking near the car at the time of the explosion was also injured in the blast. The cause of the ignition has not been identified.
Virginia Beach – USA (August 2013)
A massive explosion occurred when a heating and air conditioning contractor leaving for work at about 7 a.m. unlocked the door on his truck. The man was unhurt, but debris from the blast was hurled into neighbours’ yards. The man had stored an acetylene cylinder in the truck and it was concluded that gas had escaped overnight and ignited when the key fob was pressed.
13
Amarillo – USA (November 2013)
Leaking gas from an acetylene cylinder stored inside the boot of a vehicle caused an explosion at an Amarillo apartment complex that was heard several streets away. No serious injuries were reported.
2.6 SUMMARY OF KNOWLEDGE REVIEW
2.6.1 Peer reviewed papers
The literature review has identified several scientific papers describing measurements of vehicle ventilation carried out over the last 20 years. Although many of the papers are not directly applicable to the current project (since they focus on cars rather than vans), some of the measurement methodologies described may be applicable for the current work.
The current work is mainly concerned with investigating the worst case scenario that is likely to lead to a rapid build-up of gas i.e. that of a stationary vehicle with windows closed and extractor fan switched off (resulting in low ventilation rates). This is the scenario that likely resulted in the Wolsingham incident and many of the explosions identified in Section 2.5. Table 2.2 summarises ventilation measurements made under such conditions, taken from the reviewed papers. In addition, some general common comments can be made:
ACR varies with make and model and probably the age of the vehicle
ACR increases with increasing air movement over the envelope of the vehicle (generated by the wind effects on a stationary vehicle or by the vehicle moving)
Closing the vehicle vents, or switching the selector to recirculation mode, decreased the vehicle ventilation rate
Opening windows, even by a small amount, significantly increased the vehicle ventilation rate, both with the vehicle stationary and moving
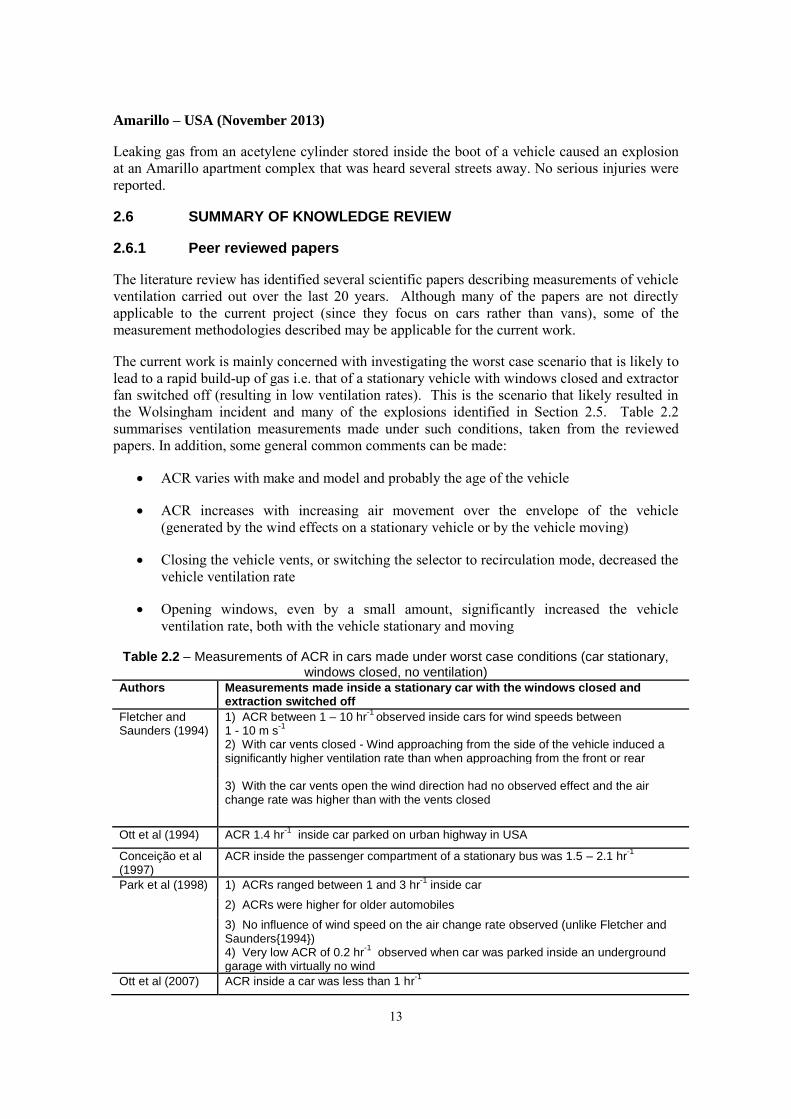
Table 2.2 – Measurements of ACR in cars made under worst case conditions (car stationary, windows closed, no ventilation)
Authors Measurements made inside a stationary car with the windows closed and extraction switched off
Fletcher and Saunders (1994)
1) ACR between 1 – 10 hr-1
observed inside cars for wind speeds between 1 - 10 m s
-1
2) With car vents closed - Wind approaching from the side of the vehicle induced a significantly higher ventilation rate than when approaching from the front or rear
3) With the car vents open the wind direction had no observed effect and the air
change rate was higher than with the vents closed
Ott et al (1994) ACR 1.4 hr-1
inside car parked on urban highway in USA
Conceição et al (1997)
ACR inside the passenger compartment of a stationary bus was 1.5 – 2.1 hr-1
Park et al (1998) 1) ACRs ranged between 1 and 3 hr-1
inside car
2) ACRs were higher for older automobiles
3) No influence of wind speed on the air change rate observed (unlike Fletcher and Saunders{1994})
4) Very low ACR of 0.2 hr-1
observed when car was parked inside an underground garage with virtually no wind
Ott et al (2007) ACR inside a car was less than 1 hr-1
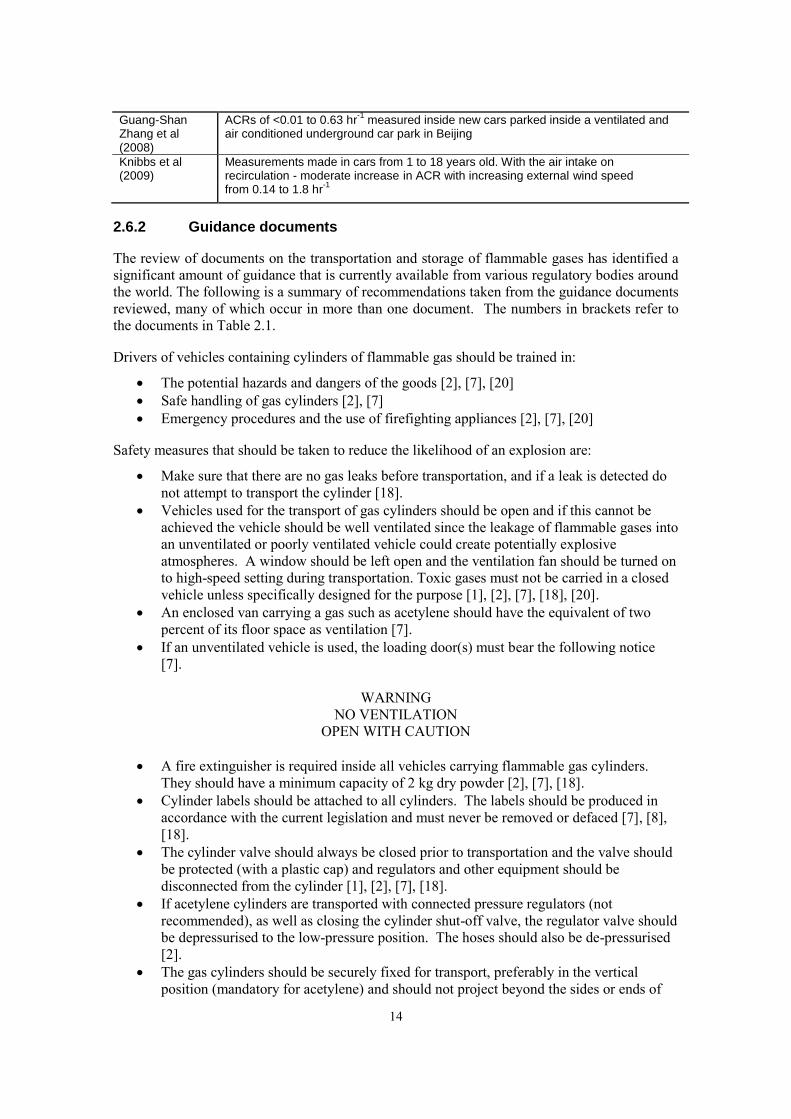
14
Guang-Shan Zhang et al (2008)
ACRs of <0.01 to 0.63 hr-1
measured inside new cars parked inside a ventilated and air conditioned underground car park in Beijing
Knibbs et al (2009)
Measurements made in cars from 1 to 18 years old. With the air intake on recirculation - moderate increase in ACR with increasing external wind speed
from 0.14 to 1.8 hr-1
2.6.2 Guidance documents
The review of documents on the transportation and storage of flammable gases has identified a significant amount of guidance that is currently available from various regulatory bodies around the world. The following is a summary of recommendations taken from the guidance documents reviewed, many of which occur in more than one document. The numbers in brackets refer to the documents in Table 2.1.
Drivers of vehicles containing cylinders of flammable gas should be trained in:
The potential hazards and dangers of the goods [2], [7], [20] Safe handling of gas cylinders [2], [7] Emergency procedures and the use of firefighting appliances [2], [7], [20]
Safety measures that should be taken to reduce the likelihood of an explosion are:
Make sure that there are no gas leaks before transportation, and if a leak is detected do not attempt to transport the cylinder [18].
Vehicles used for the transport of gas cylinders should be open and if this cannot be achieved the vehicle should be well ventilated since the leakage of flammable gases into an unventilated or poorly ventilated vehicle could create potentially explosive atmospheres. A window should be left open and the ventilation fan should be turned on to high-speed setting during transportation. Toxic gases must not be carried in a closed vehicle unless specifically designed for the purpose [1], [2], [7], [18], [20].
An enclosed van carrying a gas such as acetylene should have the equivalent of two percent of its floor space as ventilation [7].
If an unventilated vehicle is used, the loading door(s) must bear the following notice [7].
WARNING
NO VENTILATION OPEN WITH CAUTION
A fire extinguisher is required inside all vehicles carrying flammable gas cylinders.
They should have a minimum capacity of 2 kg dry powder [2], [7], [18]. Cylinder labels should be attached to all cylinders. The labels should be produced in
accordance with the current legislation and must never be removed or defaced [7], [8], [18].
The cylinder valve should always be closed prior to transportation and the valve should be protected (with a plastic cap) and regulators and other equipment should be disconnected from the cylinder [1], [2], [7], [18].
If acetylene cylinders are transported with connected pressure regulators (not recommended), as well as closing the cylinder shut-off valve, the regulator valve should be depressurised to the low-pressure position. The hoses should also be de-pressurised [2].
The gas cylinders should be securely fixed for transport, preferably in the vertical position (mandatory for acetylene) and should not project beyond the sides or ends of
15
the vehicle. Ideally they should be separated from the driver’s compartment [1], [2], [7], [18], [20].
When the destination is reached, the cylinder(s) should be removed as soon as possible from the vehicle i.e. they should not be used or stored inside the vehicle for long periods (more than 1 hour) [1], [18].
Acetylene cylinders should not be transported together with highly flammable loads [2]. There should be no smoking when flammable gases are being transported [1], [18]. If a leak is suspected in transit (acetylene has a distinctive garlic like odour), the driver
should stop, park in a safe place, check and if necessary phone for assistance. Phone the fire brigade in an emergency and advise them of the number of cylinders and their contents [18].
Additional safety provisions should be made if the vehicle load is above the threshold limit. [7]. More information is given on the HSE website www.hse.gov.uk/cdg/index.htm
If gas cylinders are stored or transported inside a closed-type vehicle with poor ventilation, a separate ventilated gas storage cabinet should be considered [24].
2.6.3 Incidents of vehicle explosions
The van explosion in Wolsingham appears to be the only major incident in the UK in recent years. According to results of the internet search, most other incidents have occurred in the USA, Canada and Australia.
It is clear from all of the reported incidents that although rare, explosions inside vehicles resulting from the storage of leaking acetylene cylinders are extremely devastating. In many of the incidents identified it was extremely fortuitous that the fatalities were not higher and the injuries more severe. Most of the explosions were the result of acetylene gas leaking into a poorly ventilated enclosure over a long period of time (overnight or sometimes over the weekend). Clearly if the guidance described in Section 2.6.2 had been followed then many (if not all) of these incidents could have been avoided.
2.7 AVERAGE WIND SPEEDS IN THE UK
As stated in the above sections, the ventilation rate of a stationary van depends primarily upon the prevailing wind speed. Wind speeds in the UK vary depending upon location, local topography and height from the ground. Information from the met office website states that the yearly average wind speed in the UK during the period between 1981 and 2010 was 12.4 knots (6.4 m s-1) measured at a height of 10 m. At heights less that 10 m the wind speed will be normally less and will depend upon the local terrain. For example, using information from BS 5925, the estimated average undisturbed wind speed in urban areas would be closer to an average of 2.7 m s-1 at a height of 2 m.
Figure 2.2, taken from the Met office website, shows a flooded wind speed contour plot of the UK giving the annual average wind speed in knots at 10 m between 1981 and 2010. Whilst the ‘knot’ is not the official SI unit for speed, the ‘knot’ is widely used and accepted, as is miles per hour (mph). This report quotes wind speed units as meters per second (m s-1), which is the SI unit for speed. It is useful therefore to know that 1 m s-1 is equivalent to 2.2 mph or 1.94 knots.

16
Figure 2.2 – Annual average wind speed in the UK between 1981 and 2010
17
3. METHODOLOGY
3.1 APPROACH TO THE EXPERIMENTAL STUDY
3.1.1 Available Vehicles
As there were a range of medium/large vans with closed rear storage available on the market, it was important to gain information on as wide a variety as possible but for practical and costs reasons it was also necessary to limit the number of vehicles that were considered. Therefore, the following approach was taken:
1) Only consider medium/large vans
2) Determine the range of vans available on the market
3) Identify which manufacturers (if any) shared the same vehicle ‘platform’ thus resulting in the same vehicle being rebadged by different manufacturers
4) Carry out a range of tests on:
a) A van purchased specifically for the project
b) Existing HSL site vans
c) A selection of rented vans identified in (2)
From task 2 above, it was clear that many of the vans were available in a range of sizes. Most manufacturers offered a choice of three roof heights: high roof (HR), medium roof (MR) and low roof (LR). There was usually a choice between at least three lengths: long wheelbase (LWB), medium wheelbase (MWB) and short wheelbase (SWB) with some manufacturers producing an extra-long wheelbase or an extra high roof. It should be noted that the length of one class of vehicle from one manufacturer would almost certainly be different in both height and length to another.
Vehicles also came fitted with a bulkhead to separate the cabin area from the load area. These are designed to provide additional vehicle security and to prevent cargo entering the cabin area in the event of an accident. However, whilst the bulkheads provide physical separation, they are not air tight and therefore there will be an interchange of air between the cabin and the load area; this was evidenced during the smoke flow visualisation, pressure tests and tracer gas tests.
Common features that may affect ventilation included two hinged front doors, a near-side sliding side door and two rear hinged doors.
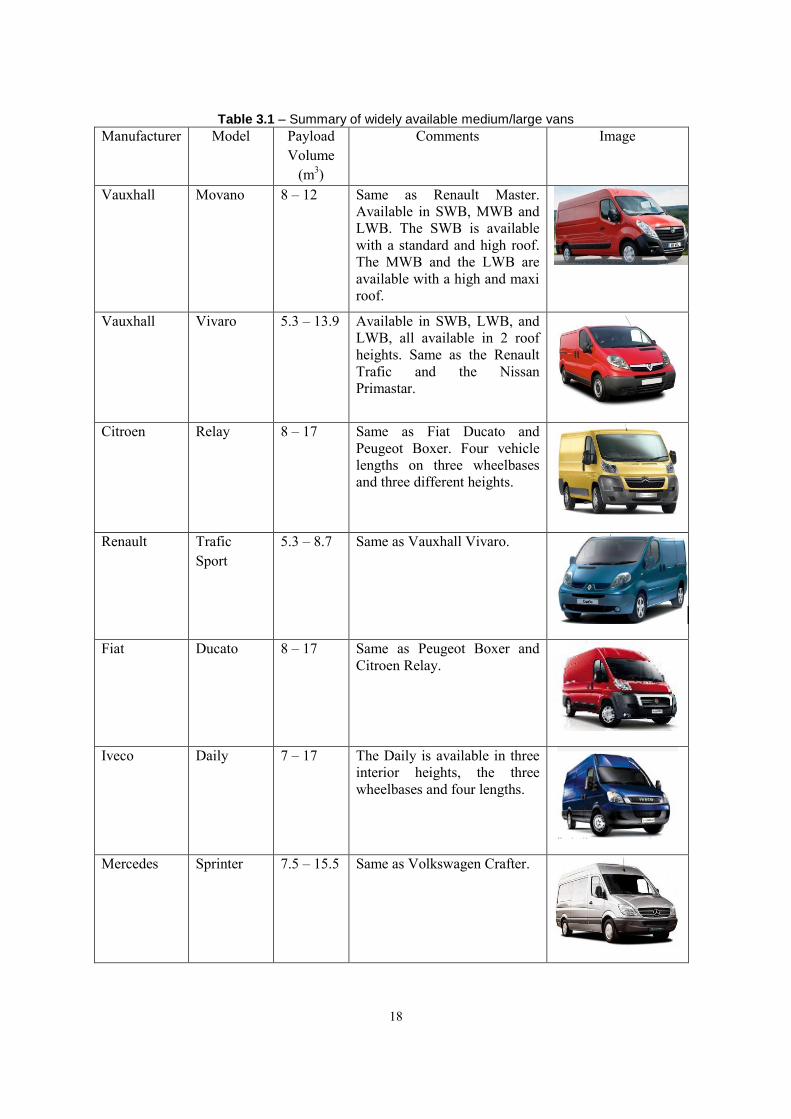
A summary of the vans commercially available is given in Table 3.1.
18
Table 3.1 – Summary of widely available medium/large vans
Manufacturer Model Payload Volume
(m3)
Comments Image
Vauxhall Movano 8 – 12
Same as Renault Master. Available in SWB, MWB and LWB. The SWB is available with a standard and high roof. The MWB and the LWB are available with a high and maxi roof.
Vauxhall Vivaro 5.3 – 13.9 Available in SWB, LWB, and LWB, all available in 2 roof heights. Same as the Renault Trafic and the Nissan Primastar.
Citroen Relay 8 – 17 Same as Fiat Ducato and Peugeot Boxer. Four vehicle lengths on three wheelbases and three different heights.
Renault Trafic Sport
5.3 – 8.7 Same as Vauxhall Vivaro.
Fiat Ducato 8 – 17 Same as Peugeot Boxer and Citroen Relay.
Iveco Daily 7 – 17 The Daily is available in three interior heights, the three wheelbases and four lengths.
Mercedes Sprinter 7.5 – 15.5 Same as Volkswagen Crafter.
19
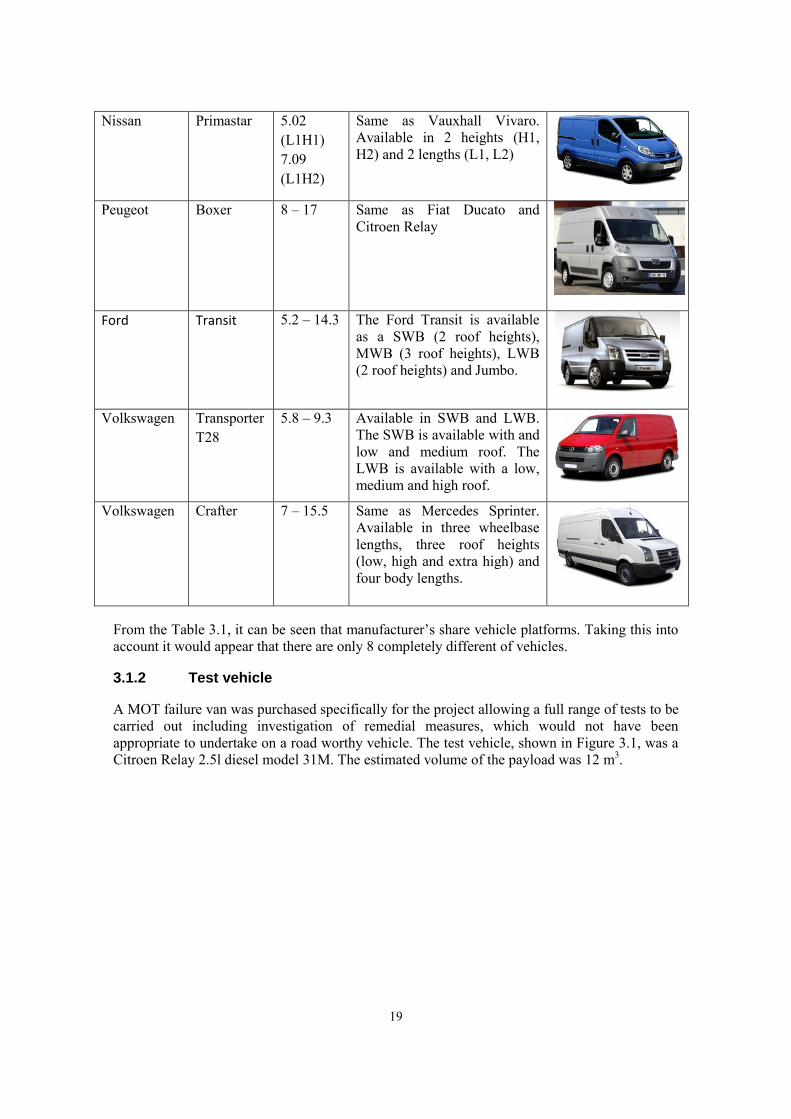
Nissan Primastar 5.02 (L1H1) 7.09 (L1H2)
Same as Vauxhall Vivaro. Available in 2 heights (H1, H2) and 2 lengths (L1, L2)
Peugeot Boxer 8 – 17 Same as Fiat Ducato and Citroen Relay
Ford Transit 5.2 – 14.3 The Ford Transit is available as a SWB (2 roof heights), MWB (3 roof heights), LWB (2 roof heights) and Jumbo.
Volkswagen Transporter T28
5.8 – 9.3 Available in SWB and LWB. The SWB is available with and low and medium roof. The LWB is available with a low, medium and high roof.
Volkswagen Crafter 7 – 15.5
Same as Mercedes Sprinter. Available in three wheelbase lengths, three roof heights (low, high and extra high) and four body lengths.
From the Table 3.1, it can be seen that manufacturer’s share vehicle platforms. Taking this into account it would appear that there are only 8 completely different of vehicles.
3.1.2 Test vehicle
A MOT failure van was purchased specifically for the project allowing a full range of tests to be carried out including investigation of remedial measures, which would not have been appropriate to undertake on a road worthy vehicle. The test vehicle, shown in Figure 3.1, was a Citroen Relay 2.5l diesel model 31M. The estimated volume of the payload was 12 m3.

20
Figure 3.1 – Test vehicle - Citroen Relay 31M 2.5 l diesel
The following tests were carried out using the test vehicle:
Flow visualisation tests – to identify leakage paths between the interior of the vehicle and the outside
Pressure tests – to determine how ‘leaky’ the vehicle was
Air change measurements
Simulated gas leakage tests
A controlled van explosion designed to mimic an explosion that may occur in a real situation where a leak has occurred and the accumulated gas cloud ignited
Of the above tests, the pressure tests were deemed not to be intrusive with little or no risk of damage to the vehicles. Therefore, this was the only test that was carried out on the HSL site vehicles and hire vehicles.
3.1.3 HSL site vehicles
Two HSL site vehicles were included in the study, both Vauxhall Vivaros but of different ages. The oldest vehicle was manufactured in 2006 and had an estimated payload of 7.7 m3. In addition to the standard specification, the van had two wind driven rotary ventilators fitted in the roof (manufactured by Flettner). The second vehicle was manufactured in 2009 and had a slightly smaller estimated payload at 7.4 m3.
2.5 m
21
3.1.4 Hire vehicles
It was generally not possible to specify a particular hire vehicle as the companies tended to group the vehicles by type and therefore could not guarantee a particular make and model. Nevertheless, 2 different vans were rented. Both were manufactured in 2010, one was a Ford Transit 350 and had a payload of 14 m3, similar to the Citroen test vehicle, the other was a Mercedes Sprinter and had the largest payload of the vehicles tested at 17.8 m3.
It should be noted that the estimation of payload volume was only an approximation derived from the measured internal dimensions of the van.
As expected, all the vehicles had a fan driven ventilation system capable of supplying both fresh air and recirculated air to the cabin via air vents located in the driver’s cabin. Some of the vents could be adjusted, both in terms of flow direction and air quantity. Nevertheless, the main method of adjusting the air flow to the cabin was using the vehicle fan speed control, which could be powered when the ignition switch was on. However, as this research study is mainly focussed on stationary closed vehicles, it has been assumed that the ignition would be off and therefore all tests have been carried out with the mechanical fan ventilation system switched off and all windows closed.
All vehicles tested had two opening front windows, and as seen from Section 2.3, opening windows, even by a small amount, significantly increases the natural ventilation rate of a vehicle. For the purpose of this research project it has been assumed that the windows would be closed.
3.2 FLOW VISUALISATION
The differential pressure test method described in Section 3.3 provides information on the leakage characteristics of the vehicles under test i.e. how leaky they are. However, it does not provide any information on the location of the leaks and apart from the obvious areas around the door seals where leakage could take place, other openings can be difficult to identify solely by visual inspection. Therefore, to visualise air movement and leakage paths, smoke was released into the test van using a Concept Colt 4 smoke machine that generates a cloud of smoke comprising of condensed Glycol droplets (mean droplet size of around 0.3 µm).
Once released, the doors were closed and the van was pressurised to encourage the smoke to leak out through any openings. The location of any leaks was determined using a high intensity “dust lamp” to illuminate the escaping smoke. MDHS 82 guidance document (HSE, 1997) describes the use of the dust lamp for identifying airborne particles. When used correctly it is a simple but effective tool that can be used to gain an understanding of aerosol emissions.
Smoke escaping from the van was filmed using a high definition video camera, the position of which was adjusted throughout a test in order to obtain the clearest images. After the tests were complete, video grabs (still images) of the smoke escaping from the van were taken from the video footage. This was considered better than taking single photos since the whole of the test was recorded and the clearest images could be selected from the video footage.
All of the smoke tests were carried out inside HSL’s “Burn Hall”, a facility that is normally used to study the properties of fires. The Burn Hall was chosen since it was more than large enough to accommodate the van, has a powerful extraction system, and also does not have smoke detection meaning that there was not an issue with smoke leaking out of the van triggering an alarm. Also, the Burn Hall does not have any windows and so once the lights were turned off the van was in almost total darkness which was ideal for creating the contrast required to visualise any escaping smoke.
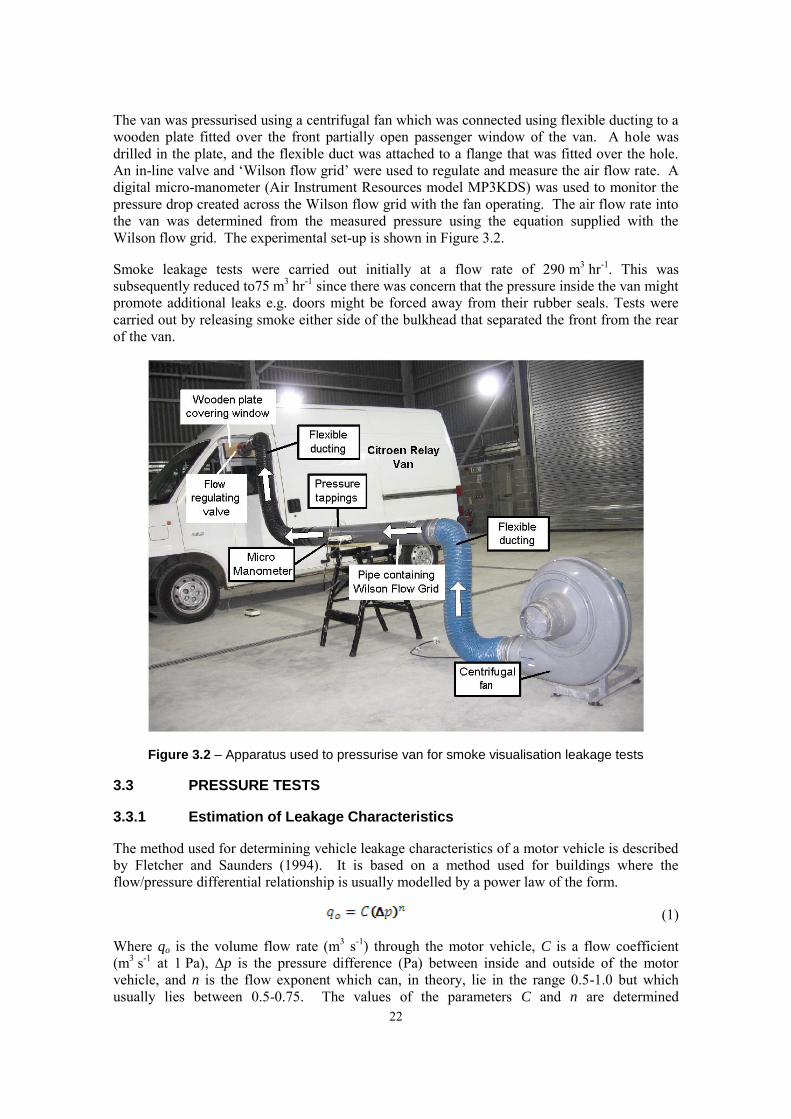
22
The van was pressurised using a centrifugal fan which was connected using flexible ducting to a wooden plate fitted over the front partially open passenger window of the van. A hole was drilled in the plate, and the flexible duct was attached to a flange that was fitted over the hole. An in-line valve and ‘Wilson flow grid’ were used to regulate and measure the air flow rate. A digital micro-manometer (Air Instrument Resources model MP3KDS) was used to monitor the pressure drop created across the Wilson flow grid with the fan operating. The air flow rate into the van was determined from the measured pressure using the equation supplied with the Wilson flow grid. The experimental set-up is shown in Figure 3.2.
Smoke leakage tests were carried out initially at a flow rate of 290 m3 hr-1. This was subsequently reduced to75 m3 hr-1 since there was concern that the pressure inside the van might promote additional leaks e.g. doors might be forced away from their rubber seals. Tests were carried out by releasing smoke either side of the bulkhead that separated the front from the rear of the van.
Figure 3.2 – Apparatus used to pressurise van for smoke visualisation leakage tests
3.3 PRESSURE TESTS
3.3.1 Estimation of Leakage Characteristics
The method used for determining vehicle leakage characteristics of a motor vehicle is described by Fletcher and Saunders (1994). It is based on a method used for buildings where the flow/pressure differential relationship is usually modelled by a power law of the form.
(1)
Where qo is the volume flow rate (m3 s-1) through the motor vehicle, C is a flow coefficient (m3 s-1 at 1 Pa), Δp is the pressure difference (Pa) between inside and outside of the motor vehicle, and n is the flow exponent which can, in theory, lie in the range 0.5-1.0 but which usually lies between 0.5-0.75. The values of the parameters C and n are determined
23
experimentally from flow/pressure measurements and describe the leakage characteristics over the range of pressure differences examined. In practice, the leakage of air through a motor vehicle can take place through numerous openings. An equivalent leakage area (ELA) can be used as a measure of the total leakage area. It is calculated as the area of a sharp edged orifice for which n=0.5, which would pass the same volume flow rate as the motor vehicle at a given pressure differential. A value of the pressure difference (Δpref) must therefore be stated when ELA data are presented. In this report all ELAs are quoted at 4 Pa, which is the usual pressure difference. ELA is then given by:
(2)
Where Cd is a discharge coefficient and ρ is the density of air (kg m-3). Using qo from Equation 1 gives:
(3)
The internal pressure can be positive or negative relative to atmospheric pressure. Whilst this may not have a large effect on measurements made in buildings, it could be significant for motor vehicles where doors may be pulled onto or pushed away from rubber seals or where there are devices which act as flap valves to facilitate the closing of doors. The value of the power 0.5 in Equation 2 is that which is used for a sharp edged orifice; it would therefore seem appropriate to choose a value of Cd which corresponds to this value. i.e. Cd = 0.6. In reality the opening would consist of an ensemble of long thin twisting cracks (usually of considerable depth compared with their height), holes, tubes etc. Therefore, the ELA is not claimed to represent reality but refers only to an assumed sharp-edged orifice. It is useful, however, in determining the comparative “leakiness” of vehicles.
3.3.2 Measurement of van leakage
Volume flow rate and pressure differential measurements were made on the 5 vans described in Sections 3.1.2 to 3.1.4. The measurements were carried out inside HSL’s engineering lab, which was large enough to accommodate each of the vans tested. Initial measurements were made on the test van with the experimental air supply/extract pipe connected to the window as described in Section 3.2 and shown in Figure 3.2. A pressure tapping was inserted into the wooden plate covering the window so that the static pressure inside the van could be measured using a micro-manometer (Air Instrument Resources model MP3KDS). The volume flow rate into or out of each van was increased and measured using the Wilson flow grid, for van pressures up to 55 Pa. The flow rate and van pressure data were then plotted against each other using logarithmic scales with static pressure on the x axis and flow rate on the y axis. A power curve was then fitted to the data. Using Equation 1, the flow coefficient C was calculated from the slope of the graph and the flow exponent n was calculated from the power function of x (the static pressure of the van). The equivalent leakage area (ELA) was calculated using Equation 3.
A difference in ELA was observed depending on whether the static pressure was measured in the front or rear of the load carrying area of the van. This was thought to be due to the development of a pressure difference across the bulkhead that separated the driver’s cab from the load area. Therefore, the measurements were repeated on the test van with the bulkhead removed. However, it would not have been possible to remove the bulkhead from the hire vans and so it was decided that, in order to take measurements at the rear of the van i.e. the position
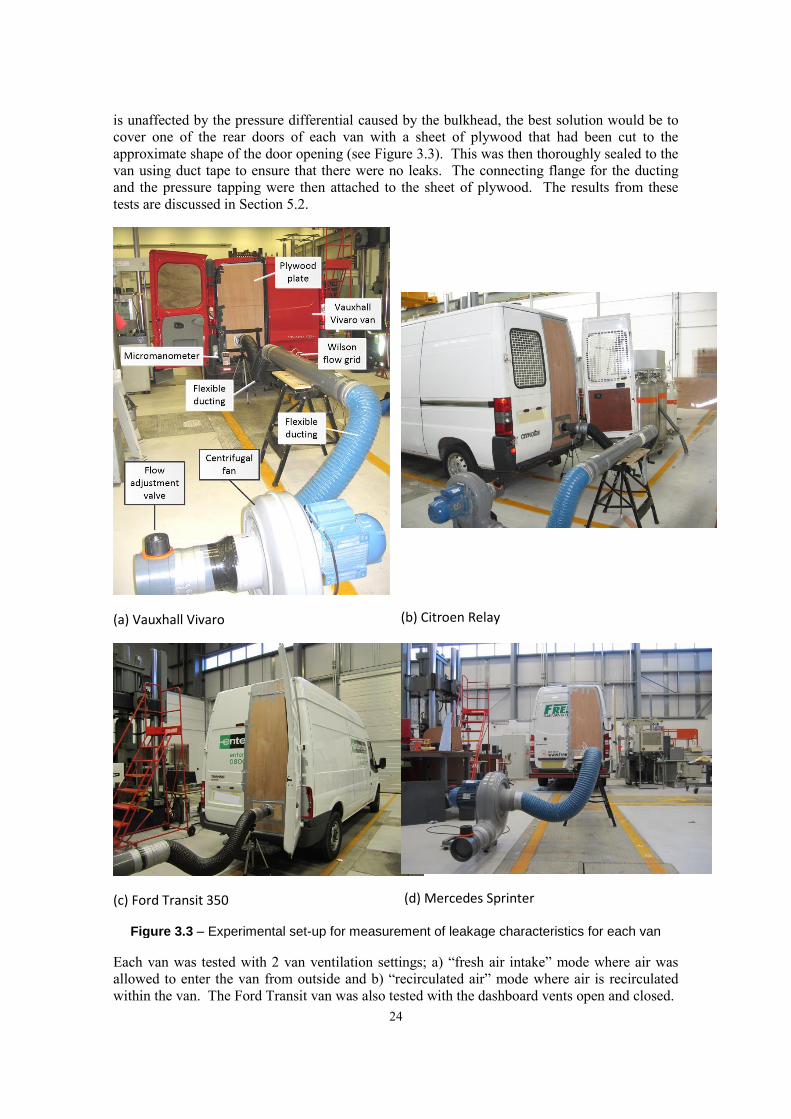
24
is unaffected by the pressure differential caused by the bulkhead, the best solution would be to cover one of the rear doors of each van with a sheet of plywood that had been cut to the approximate shape of the door opening (see Figure 3.3). This was then thoroughly sealed to the van using duct tape to ensure that there were no leaks. The connecting flange for the ducting and the pressure tapping were then attached to the sheet of plywood. The results from these tests are discussed in Section 5.2.
(a) (a) Vauxhall Vivaro
(b) Citroen Relay
(c) Ford Transit 350
(d) Mercedes Sprinter
Figure 3.3 – Experimental set-up for measurement of leakage characteristics for each van
Each van was tested with 2 van ventilation settings; a) “fresh air intake” mode where air was allowed to enter the van from outside and b) “recirculated air” mode where air is recirculated within the van. The Ford Transit van was also tested with the dashboard vents open and closed.
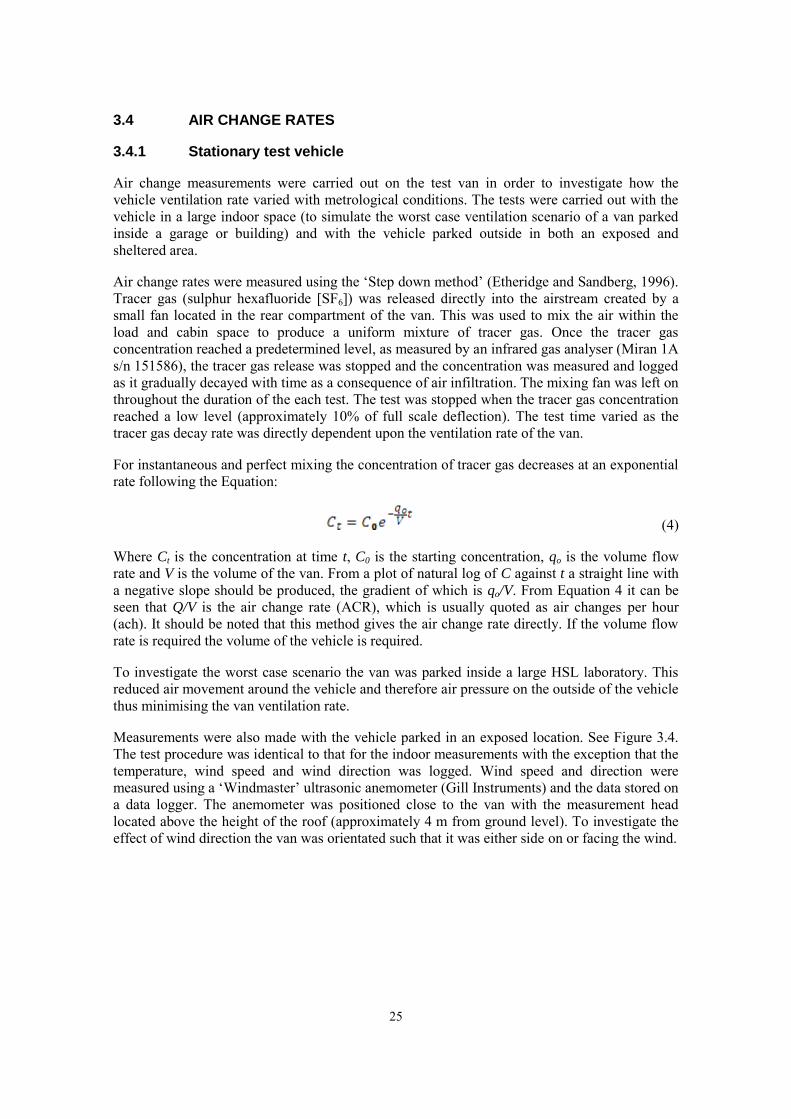
25
3.4 AIR CHANGE RATES
3.4.1 Stationary test vehicle
Air change measurements were carried out on the test van in order to investigate how the vehicle ventilation rate varied with metrological conditions. The tests were carried out with the vehicle in a large indoor space (to simulate the worst case ventilation scenario of a van parked inside a garage or building) and with the vehicle parked outside in both an exposed and sheltered area.
Air change rates were measured using the ‘Step down method’ (Etheridge and Sandberg, 1996). Tracer gas (sulphur hexafluoride [SF6]) was released directly into the airstream created by a small fan located in the rear compartment of the van. This was used to mix the air within the load and cabin space to produce a uniform mixture of tracer gas. Once the tracer gas concentration reached a predetermined level, as measured by an infrared gas analyser (Miran 1A s/n 151586), the tracer gas release was stopped and the concentration was measured and logged as it gradually decayed with time as a consequence of air infiltration. The mixing fan was left on throughout the duration of the each test. The test was stopped when the tracer gas concentration reached a low level (approximately 10% of full scale deflection). The test time varied as the tracer gas decay rate was directly dependent upon the ventilation rate of the van.
For instantaneous and perfect mixing the concentration of tracer gas decreases at an exponential rate following the Equation:
(4)
Where Ct is the concentration at time t, C0 is the starting concentration, qo is the volume flow rate and V is the volume of the van. From a plot of natural log of C against t a straight line with a negative slope should be produced, the gradient of which is qo/V. From Equation 4 it can be seen that Q/V is the air change rate (ACR), which is usually quoted as air changes per hour (ach). It should be noted that this method gives the air change rate directly. If the volume flow rate is required the volume of the vehicle is required.
To investigate the worst case scenario the van was parked inside a large HSL laboratory. This reduced air movement around the vehicle and therefore air pressure on the outside of the vehicle thus minimising the van ventilation rate.
Measurements were also made with the vehicle parked in an exposed location. See Figure 3.4. The test procedure was identical to that for the indoor measurements with the exception that the temperature, wind speed and wind direction was logged. Wind speed and direction were measured using a ‘Windmaster’ ultrasonic anemometer (Gill Instruments) and the data stored on a data logger. The anemometer was positioned close to the van with the measurement head located above the height of the roof (approximately 4 m from ground level). To investigate the effect of wind direction the van was orientated such that it was either side on or facing the wind.
26
Figure 3.4 – Photo of the test vehicle parked in an exposed location. The ultrasonic anemometer can be seen to the right of the picture.
Due to solar gain it is possible for temperatures inside a vehicle to be significantly higher than outside. This could lead to temperature stratification and increase the ventilation rate (known as the ‘stack’ effect). However, as the internal height of the van was relatively low it was thought that this would not be significant, as suggested by Fletcher and Saunders (1994). Nevertheless for a selection of tests the temperature inside and outside of the vehicle was logged.
3.4.2 Moving vehicle
To investigate the effect on the vehicle air change rate when the vehicle was moving, a single test was carried out. The test vehicle was driven round the HSL site ring road as close to a constant speed as possible which gave an average speed of 13.6 mph (6.1 m s-1). This was calculated by recording the distance travelled and the time it took to cover this distance. During the test an air change rate measurement, as described in Section 3.4.1, was carried out.
3.4.3 Theoretical predictions
Although ACR measurements were only carried out on the test van, Fletcher and Saunders (1994) describe a method of calculating ACR from the estimation of leakage characteristics (ELA, C and n) described in Section 3.3.1. Where measured, the temperature difference between the inside and outside of the vans was usually small. This means that any air flow that infiltrates into the van will only depend on wind effects. The relationship between air flow rate through the van and the external wind speed is given in Equation 5.
(5)
27
Where qo is the volume flow rate (m3 s-1), C is the flow coefficient (m3 s-1), n is the flow exponent, Vs is the wind speed, ρ is the density of air (kg m-3) and K is a constant. The ACR can be determined by multiplying Equation 5 by [3600/volume of the vehicle]. The value of K was evaluated by rearranging Equation 5 using the data obtained from the Citroen Relay van with the air intake vents open and the van side-on to the wind. C and n were taken as the averages of the respective pressurisation and depressurisation values given in Tables 4.1 and 4.2. By inserting the values of C and n for the other vehicles into Equation 5 and using the measured volumes of the vehicles, it was possible to calculate the variation of ACR with wind speed.
The calculation of K for the Citroen Relay van and the calculated ACRs as a function of wind speed for the other vans is given in Section 4.3.3.
3.5 MODELLING ADEQUATE VENTILATION
3.5.1 Approach
In this Section an assessment is made of the ventilation rate required to dilute a release down to a level that can be deemed to be safe. While in theory any amount of flammable gas between the lower and upper flammable limits can be ignited and lead to the generation of an overpressure as well as a thermal hazard, clearly there is a lower limit below which the hazard posed by the ignition of the gas can be deemed to be negligible. A number of alternative methods could be used for defining this lower limit. An approach that has been adopted for the purposes of Hazardous Area Classification is defined in the international standard IEC 60079:10-1. This criterion has subsequently been validated for releases of natural gas through a joint industry project carried out at HSL (Ivings et al., 2008). The simplicity of the approach and the fact that it has been validated through experiments makes it suitable for this current work. Although validation of this criterion hasn’t been carried out for gases other than natural gas, it still provides a reasonable estimate of when a gas cloud can be deemed to pose a hazard.
The approach is based on a gas cloud volume, Vz, which is defined to be the volume of gas whose average concentration is half1 the LEL. The release is then deemed to pose an insignificant hazard if the volume Vz is less than 0.1 m3. If the enclosure volume is less than 10 m3, then this criterion is modified such that Vz should be less than one hundredth of the enclosure volume. In summary the criterion is:
(6)
Where V is the enclosure volume.
A relatively simple approach that can be used for calculating the gas cloud volume Vz is to use the Quadvent model described by Webber et al. (2011). In summary this model provides the gas cloud volume Vz as a function of the steady state average concentration in the enclosure C (see below) and can be written as:
(7) 1 Strictly speaking this is the definition of Vz for secondary releases (i.e. a release that is unlikely to occur during
normal operation), for primary releases (a release that is likely to occur periodically or occasionally during normal
operation) Vz is based on the gas cloud with an average concentration of one quarter LEL.
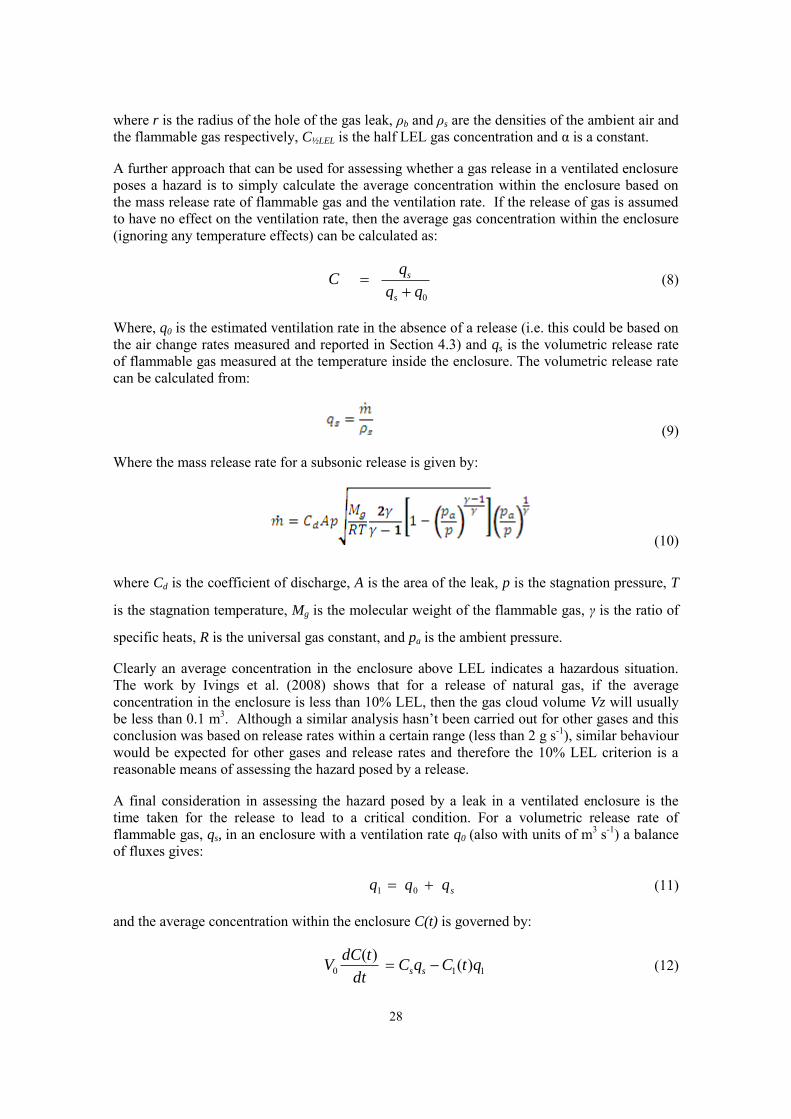
28
where r is the radius of the hole of the gas leak, ρb and ρs are the densities of the ambient air and the flammable gas respectively, C½LEL is the half LEL gas concentration and α is a constant.
A further approach that can be used for assessing whether a gas release in a ventilated enclosure poses a hazard is to simply calculate the average concentration within the enclosure based on the mass release rate of flammable gas and the ventilation rate. If the release of gas is assumed to have no effect on the ventilation rate, then the average gas concentration within the enclosure (ignoring any temperature effects) can be calculated as:
0qq
qC
s
s
(8)
Where, q0 is the estimated ventilation rate in the absence of a release (i.e. this could be based on the air change rates measured and reported in Section 4.3) and qs is the volumetric release rate of flammable gas measured at the temperature inside the enclosure. The volumetric release rate can be calculated from:
(9)
Where the mass release rate for a subsonic release is given by:
(10)
where Cd is the coefficient of discharge, A is the area of the leak, p is the stagnation pressure, T
is the stagnation temperature, Mg is the molecular weight of the flammable gas, γ is the ratio of
specific heats, R is the universal gas constant, and pa is the ambient pressure.
Clearly an average concentration in the enclosure above LEL indicates a hazardous situation. The work by Ivings et al. (2008) shows that for a release of natural gas, if the average concentration in the enclosure is less than 10% LEL, then the gas cloud volume Vz will usually be less than 0.1 m3. Although a similar analysis hasn’t been carried out for other gases and this conclusion was based on release rates within a certain range (less than 2 g s-1), similar behaviour would be expected for other gases and release rates and therefore the 10% LEL criterion is a reasonable means of assessing the hazard posed by a release.
A final consideration in assessing the hazard posed by a leak in a ventilated enclosure is the time taken for the release to lead to a critical condition. For a volumetric release rate of flammable gas, qs, in an enclosure with a ventilation rate q0 (also with units of m3 s-1) a balance of fluxes gives:
sqqq 01 (11)
and the average concentration within the enclosure C(t) is governed by:
110 )()(qtCqC
dt
tdCV ss (12)
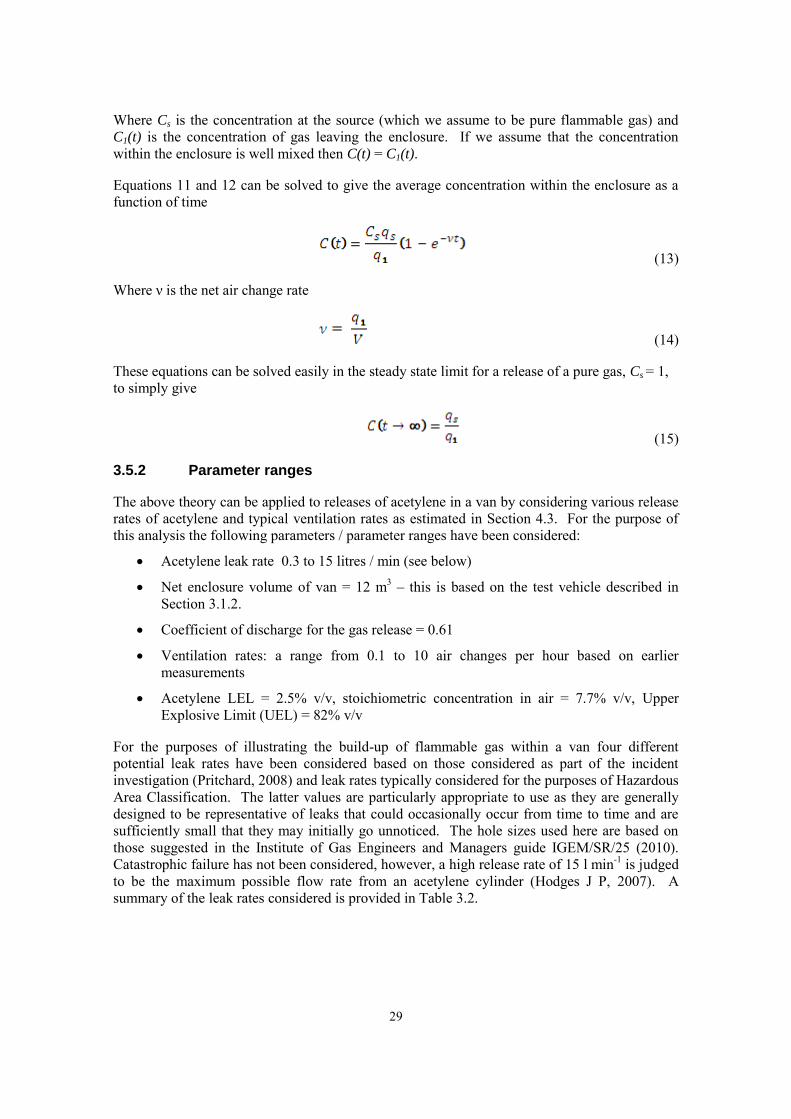
29
Where Cs is the concentration at the source (which we assume to be pure flammable gas) and C1(t) is the concentration of gas leaving the enclosure. If we assume that the concentration within the enclosure is well mixed then C(t) = C1(t).
Equations 11 and 12 can be solved to give the average concentration within the enclosure as a function of time
(13)
Where ν is the net air change rate
(14)
These equations can be solved easily in the steady state limit for a release of a pure gas, Cs = 1, to simply give
(15)
3.5.2 Parameter ranges
The above theory can be applied to releases of acetylene in a van by considering various release rates of acetylene and typical ventilation rates as estimated in Section 4.3. For the purpose of this analysis the following parameters / parameter ranges have been considered:
Acetylene leak rate 0.3 to 15 litres / min (see below)
Net enclosure volume of van = 12 m3 – this is based on the test vehicle described in Section 3.1.2.
Coefficient of discharge for the gas release = 0.61
Ventilation rates: a range from 0.1 to 10 air changes per hour based on earlier measurements
Acetylene LEL = 2.5% v/v, stoichiometric concentration in air = 7.7% v/v, Upper Explosive Limit (UEL) = 82% v/v
For the purposes of illustrating the build-up of flammable gas within a van four different potential leak rates have been considered based on those considered as part of the incident investigation (Pritchard, 2008) and leak rates typically considered for the purposes of Hazardous Area Classification. The latter values are particularly appropriate to use as they are generally designed to be representative of leaks that could occasionally occur from time to time and are sufficiently small that they may initially go unnoticed. The hole sizes used here are based on those suggested in the Institute of Gas Engineers and Managers guide IGEM/SR/25 (2010). Catastrophic failure has not been considered, however, a high release rate of 15 l min-1 is judged to be the maximum possible flow rate from an acetylene cylinder (Hodges J P, 2007). A summary of the leak rates considered is provided in Table 3.2.
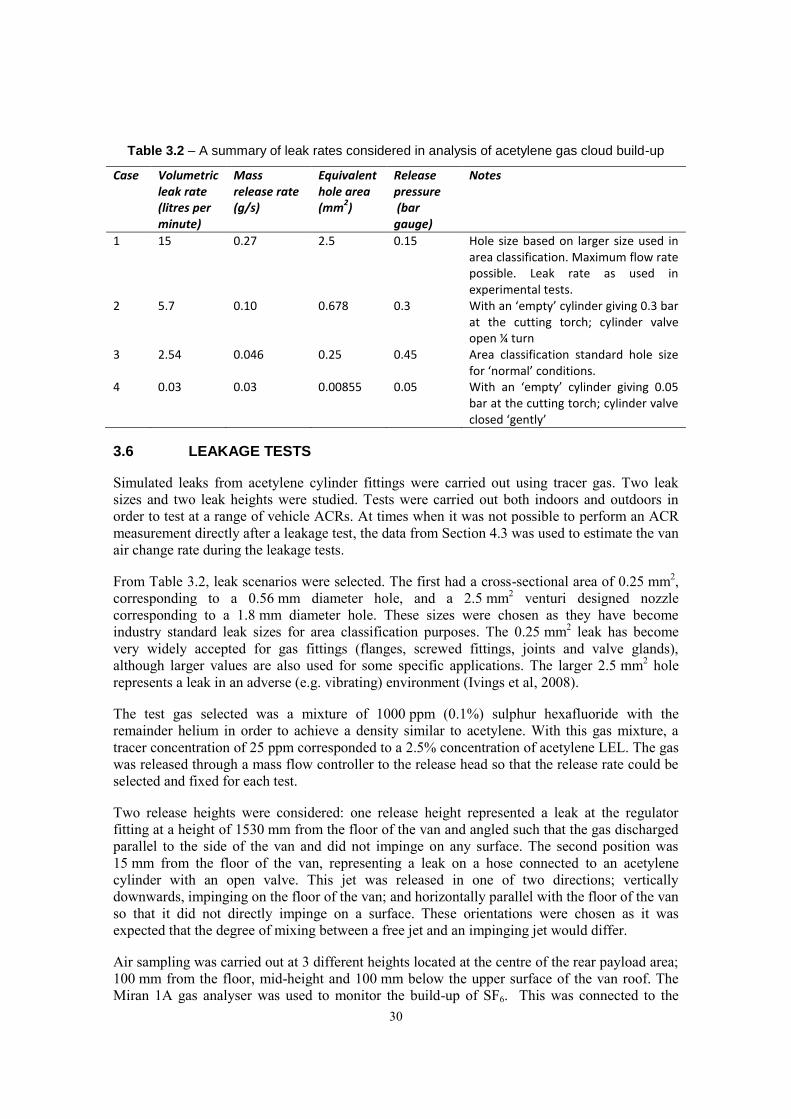
30
Table 3.2 – A summary of leak rates considered in analysis of acetylene gas cloud build-up
Case Volumetric leak rate (litres per minute)
Mass release rate (g/s)
Equivalent hole area (mm
2)
Release pressure (bar gauge)
Notes
1 15 0.27 2.5 0.15 Hole size based on larger size used in area classification. Maximum flow rate possible. Leak rate as used in experimental tests.
2 5.7 0.10 0.678 0.3 With an ‘empty’ cylinder giving 0.3 bar at the cutting torch; cylinder valve open ¼ turn
3 2.54 0.046 0.25 0.45 Area classification standard hole size for ‘normal’ conditions.
4 0.03 0.03 0.00855 0.05 With an ‘empty’ cylinder giving 0.05 bar at the cutting torch; cylinder valve closed ‘gently’
3.6 LEAKAGE TESTS
Simulated leaks from acetylene cylinder fittings were carried out using tracer gas. Two leak sizes and two leak heights were studied. Tests were carried out both indoors and outdoors in order to test at a range of vehicle ACRs. At times when it was not possible to perform an ACR measurement directly after a leakage test, the data from Section 4.3 was used to estimate the van air change rate during the leakage tests.
From Table 3.2, leak scenarios were selected. The first had a cross-sectional area of 0.25 mm2, corresponding to a 0.56 mm diameter hole, and a 2.5 mm2 venturi designed nozzle corresponding to a 1.8 mm diameter hole. These sizes were chosen as they have become industry standard leak sizes for area classification purposes. The 0.25 mm2 leak has become very widely accepted for gas fittings (flanges, screwed fittings, joints and valve glands), although larger values are also used for some specific applications. The larger 2.5 mm2 hole represents a leak in an adverse (e.g. vibrating) environment (Ivings et al, 2008).
The test gas selected was a mixture of 1000 ppm (0.1%) sulphur hexafluoride with the remainder helium in order to achieve a density similar to acetylene. With this gas mixture, a tracer concentration of 25 ppm corresponded to a 2.5% concentration of acetylene LEL. The gas was released through a mass flow controller to the release head so that the release rate could be selected and fixed for each test.
Two release heights were considered: one release height represented a leak at the regulator fitting at a height of 1530 mm from the floor of the van and angled such that the gas discharged parallel to the side of the van and did not impinge on any surface. The second position was 15 mm from the floor of the van, representing a leak on a hose connected to an acetylene cylinder with an open valve. This jet was released in one of two directions; vertically downwards, impinging on the floor of the van; and horizontally parallel with the floor of the van so that it did not directly impinge on a surface. These orientations were chosen as it was expected that the degree of mixing between a free jet and an impinging jet would differ.
Air sampling was carried out at 3 different heights located at the centre of the rear payload area; 100 mm from the floor, mid-height and 100 mm below the upper surface of the van roof. The Miran 1A gas analyser was used to monitor the build-up of SF6. This was connected to the
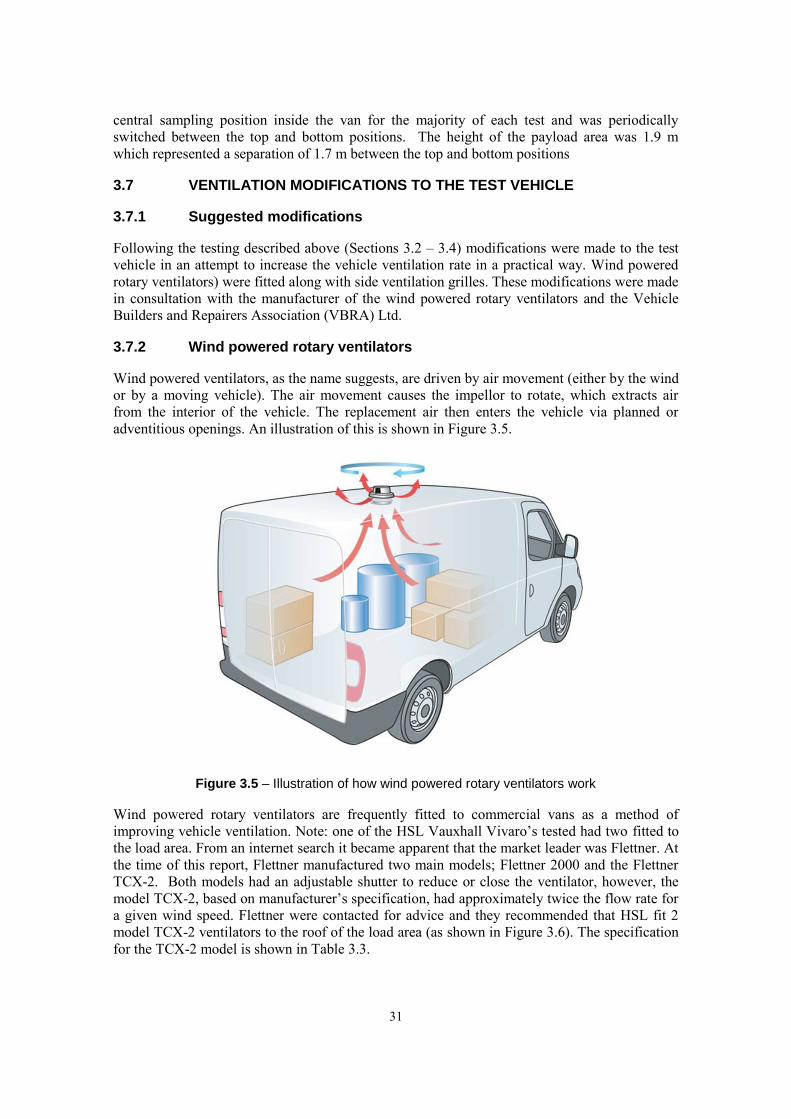
31
central sampling position inside the van for the majority of each test and was periodically switched between the top and bottom positions. The height of the payload area was 1.9 m which represented a separation of 1.7 m between the top and bottom positions
3.7 VENTILATION MODIFICATIONS TO THE TEST VEHICLE
3.7.1 Suggested modifications
Following the testing described above (Sections 3.2 – 3.4) modifications were made to the test vehicle in an attempt to increase the vehicle ventilation rate in a practical way. Wind powered rotary ventilators) were fitted along with side ventilation grilles. These modifications were made in consultation with the manufacturer of the wind powered rotary ventilators and the Vehicle Builders and Repairers Association (VBRA) Ltd.
3.7.2 Wind powered rotary ventilators
Wind powered ventilators, as the name suggests, are driven by air movement (either by the wind or by a moving vehicle). The air movement causes the impellor to rotate, which extracts air from the interior of the vehicle. The replacement air then enters the vehicle via planned or adventitious openings. An illustration of this is shown in Figure 3.5.
Figure 3.5 – Illustration of how wind powered rotary ventilators work
Wind powered rotary ventilators are frequently fitted to commercial vans as a method of improving vehicle ventilation. Note: one of the HSL Vauxhall Vivaro’s tested had two fitted to the load area. From an internet search it became apparent that the market leader was Flettner. At the time of this report, Flettner manufactured two main models; Flettner 2000 and the Flettner TCX-2. Both models had an adjustable shutter to reduce or close the ventilator, however, the model TCX-2, based on manufacturer’s specification, had approximately twice the flow rate for a given wind speed. Flettner were contacted for advice and they recommended that HSL fit 2 model TCX-2 ventilators to the roof of the load area (as shown in Figure 3.6). The specification for the TCX-2 model is shown in Table 3.3.

32
Figure 3.6 – Test vehicle showing wind powered rotary ventilators and side grille vents
Table 3.3 – Manufacturer’s specification of the Flettner TCX-2 Wind powered rotary ventilators
Wind Speed Air extraction rate
mph m s-1 m3hr-1
10 4.5 30.7
20 8.9 62.9
30 13.4 98.6
40 17.9 137.3
50 22.4 173.3
60 26.8 214.0
70 31.3 253.1
3.7.3 Ventilation grilles
Flettner advised that no further planned openings were necessary. However, HSL was also in contact with the VBRA. The VBRA recommended that in addition to the roof ventilators, 2 ventilation grilles should be fitted to the test vehicle; one either side of the load area, close to the bottom of the vehicle and just behind the driver’s cabin with a corresponding grille fitted to the inside of the opening.
Whilst it may be true that a vehicle will have sufficient unplanned gaps in the bodywork, including around doors, it was thought prudent to plan the replacement air. Therefore, the recommendation by the VBRA to fit grilles was taken.
Metal grilles were selected with overall dimensions of 305 mm by 228 mm. Each grille had 36 horizontal slots, each with some weather protection. The dimensions of each slot were approximately 81 mm long by 4 mm high and tapered at the ends. The open area of the whole grill was estimated to be 0.01 m2 (14 %). A photograph of one of the grilles is shown in Figure 3.7 whilst Figure 3.6 shows the ventilation grilles fitted to the test vehicle..
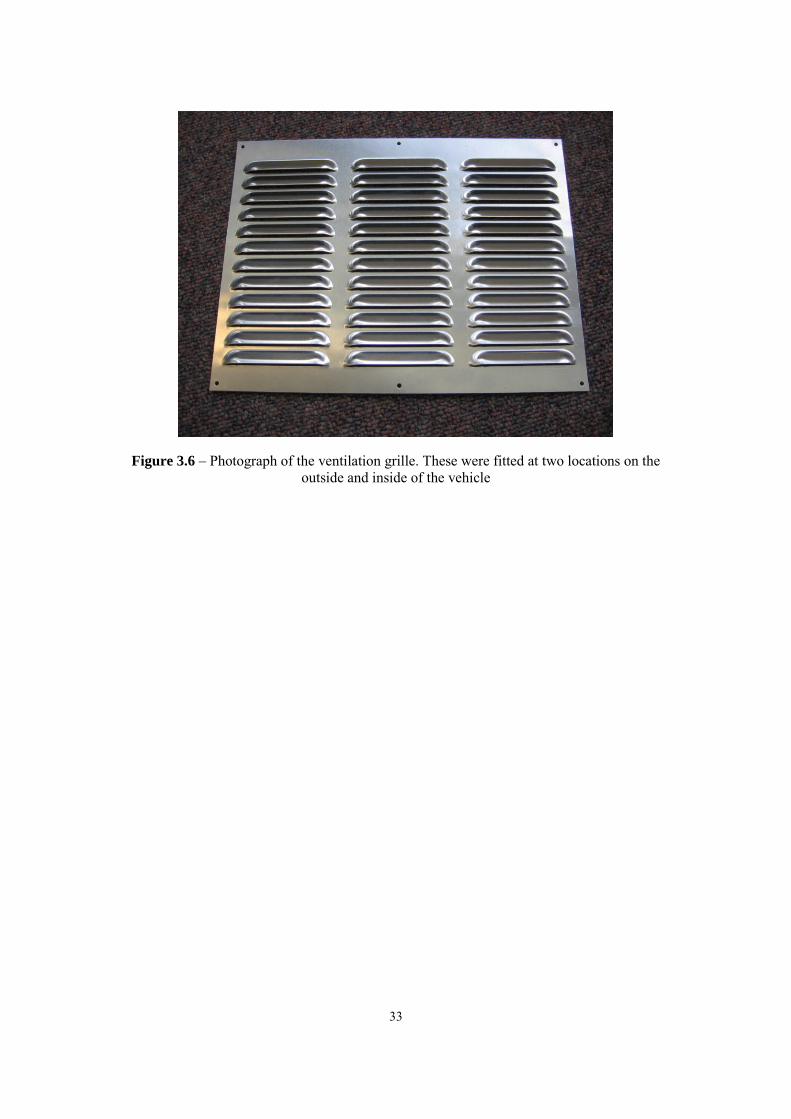
33
Figure 3.6 – Photograph of the ventilation grille. These were fitted at two locations on the outside and inside of the vehicle
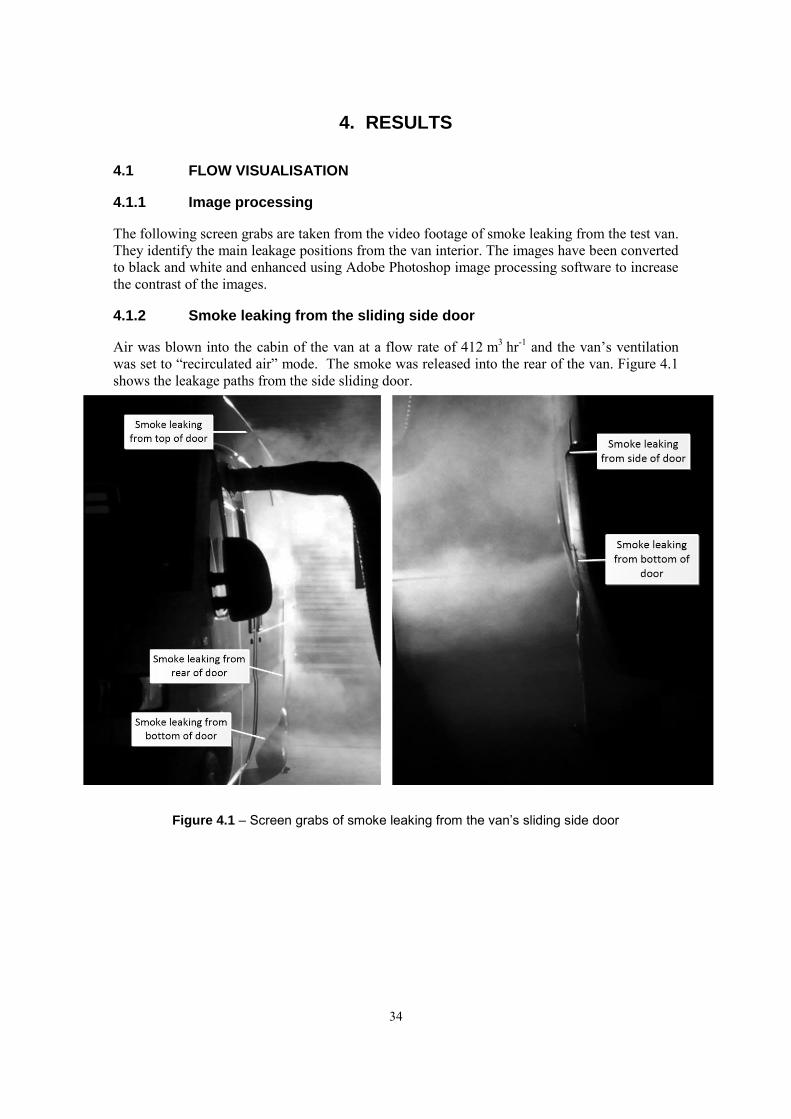
34
4. RESULTS
4.1 FLOW VISUALISATION
4.1.1 Image processing
The following screen grabs are taken from the video footage of smoke leaking from the test van. They identify the main leakage positions from the van interior. The images have been converted to black and white and enhanced using Adobe Photoshop image processing software to increase the contrast of the images.
4.1.2 Smoke leaking from the sliding side door
Air was blown into the cabin of the van at a flow rate of 412 m3 hr-1 and the van’s ventilation was set to “recirculated air” mode. The smoke was released into the rear of the van. Figure 4.1 shows the leakage paths from the side sliding door.
Figure 4.1 – Screen grabs of smoke leaking from the van’s sliding side door
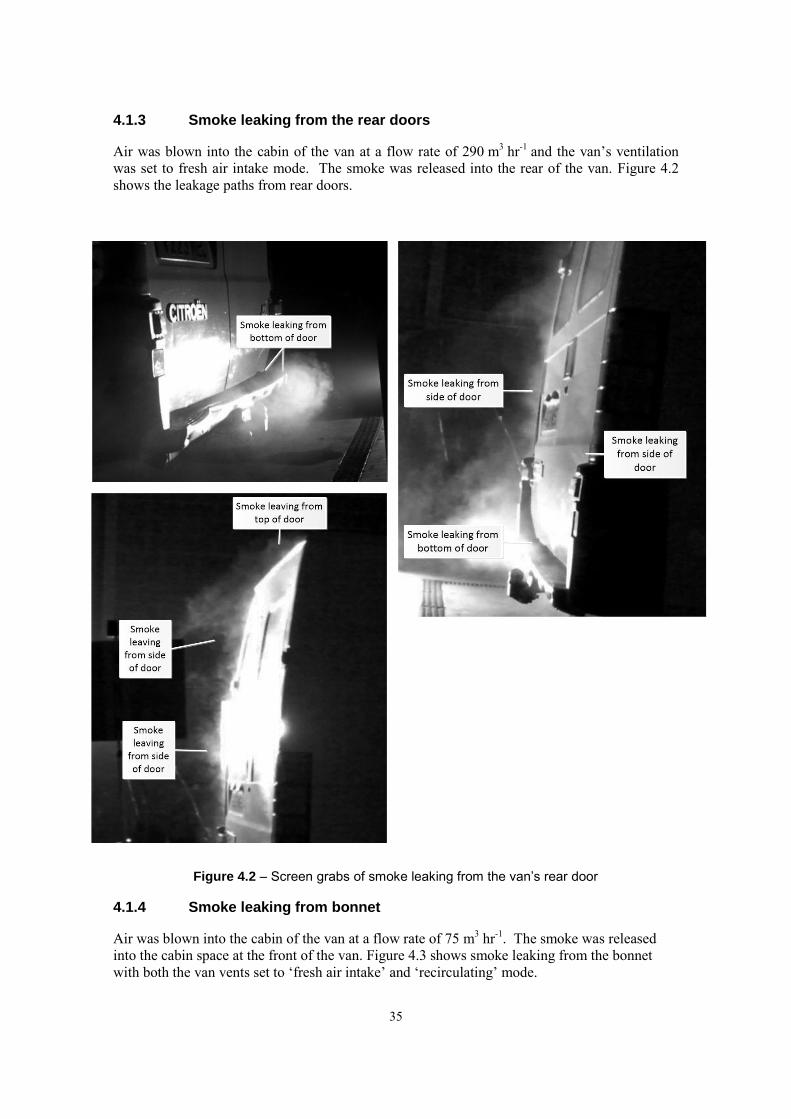
35
4.1.3 Smoke leaking from the rear doors
Air was blown into the cabin of the van at a flow rate of 290 m3 hr-1 and the van’s ventilation was set to fresh air intake mode. The smoke was released into the rear of the van. Figure 4.2 shows the leakage paths from rear doors.
Figure 4.2 – Screen grabs of smoke leaking from the van’s rear door
4.1.4 Smoke leaking from bonnet
Air was blown into the cabin of the van at a flow rate of 75 m3 hr-1. The smoke was released into the cabin space at the front of the van. Figure 4.3 shows smoke leaking from the bonnet with both the van vents set to ‘fresh air intake’ and ‘recirculating’ mode.
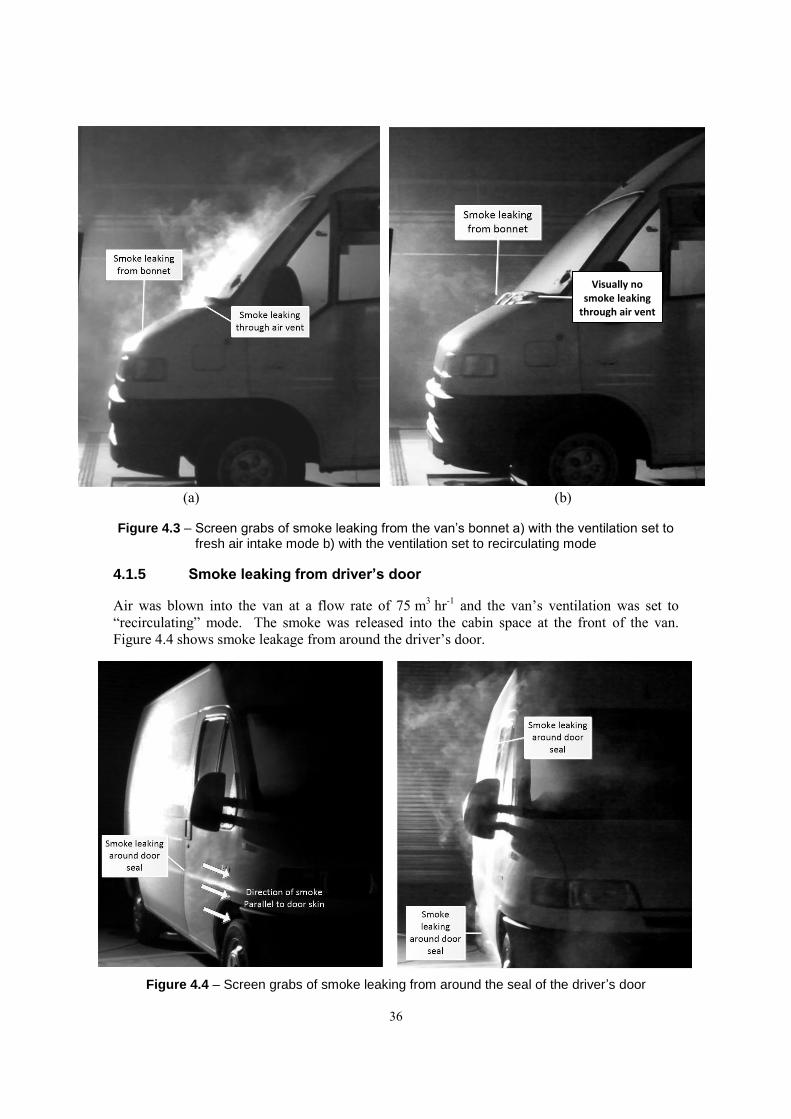
36
(a) (b)
Figure 4.3 – Screen grabs of smoke leaking from the van’s bonnet a) with the ventilation set to fresh air intake mode b) with the ventilation set to recirculating mode
4.1.5 Smoke leaking from driver’s door
Air was blown into the van at a flow rate of 75 m3 hr-1 and the van’s ventilation was set to “recirculating” mode. The smoke was released into the cabin space at the front of the van. Figure 4.4 shows smoke leakage from around the driver’s door.
Figure 4.4 – Screen grabs of smoke leaking from around the seal of the driver’s door
Visually no smoke leaking
through air vent
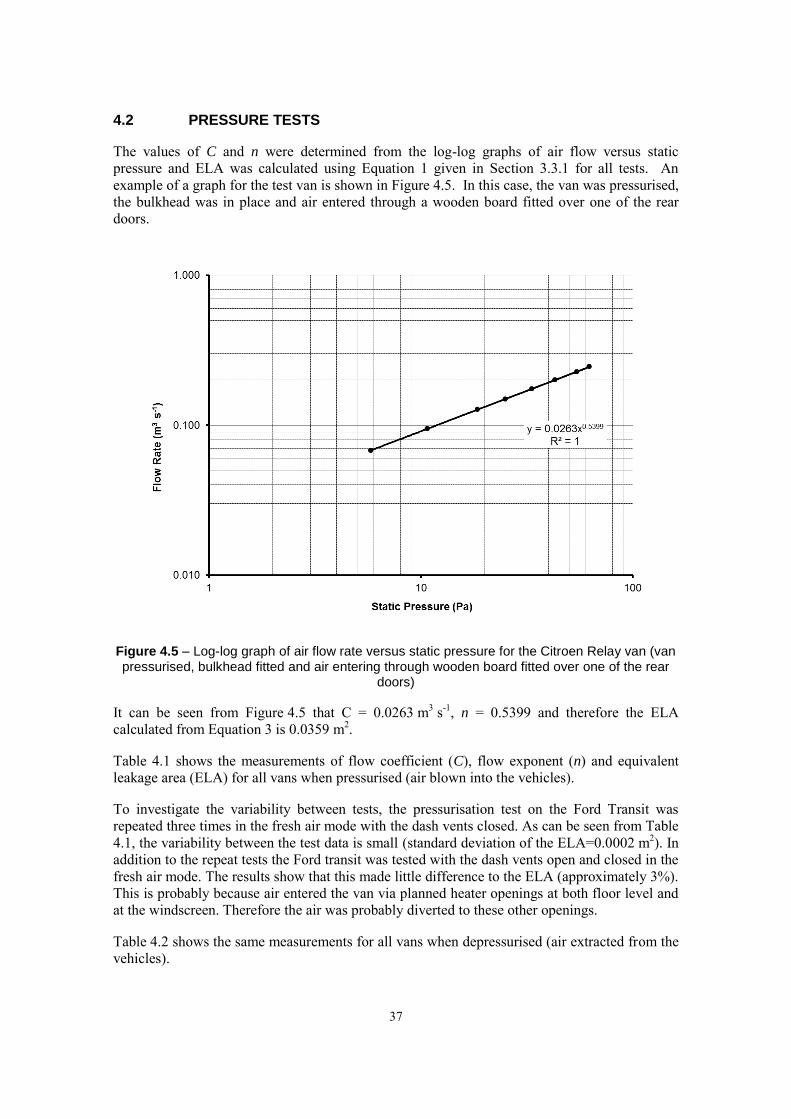
37
4.2 PRESSURE TESTS
The values of C and n were determined from the log-log graphs of air flow versus static pressure and ELA was calculated using Equation 1 given in Section 3.3.1 for all tests. An example of a graph for the test van is shown in Figure 4.5. In this case, the van was pressurised, the bulkhead was in place and air entered through a wooden board fitted over one of the rear doors.
Figure 4.5 – Log-log graph of air flow rate versus static pressure for the Citroen Relay van (van pressurised, bulkhead fitted and air entering through wooden board fitted over one of the rear
doors)
It can be seen from Figure 4.5 that C = 0.0263 m3 s-1, n = 0.5399 and therefore the ELA calculated from Equation 3 is 0.0359 m2.
Table 4.1 shows the measurements of flow coefficient (C), flow exponent (n) and equivalent leakage area (ELA) for all vans when pressurised (air blown into the vehicles).
To investigate the variability between tests, the pressurisation test on the Ford Transit was repeated three times in the fresh air mode with the dash vents closed. As can be seen from Table 4.1, the variability between the test data is small (standard deviation of the ELA=0.0002 m2). In addition to the repeat tests the Ford transit was tested with the dash vents open and closed in the fresh air mode. The results show that this made little difference to the ELA (approximately 3%). This is probably because air entered the van via planned heater openings at both floor level and at the windscreen. Therefore the air was probably diverted to these other openings.
Table 4.2 shows the same measurements for all vans when depressurised (air extracted from the vehicles).
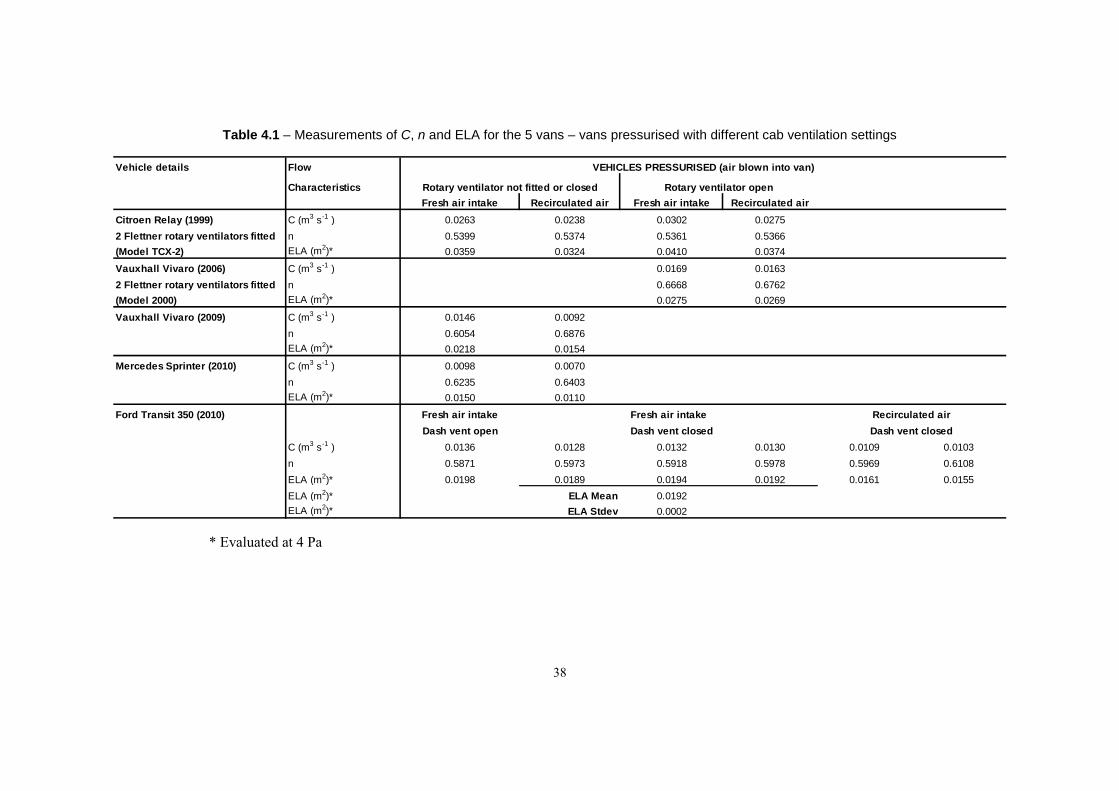
38
Table 4.1 – Measurements of C, n and ELA for the 5 vans – vans pressurised with different cab ventilation settings
Vehicle details Flow
Characteristics
Fresh air intake Recirculated air Fresh air intake Recirculated air
Citroen Relay (1999) C (m3 s-1 ) 0.0263 0.0238 0.0302 0.0275
2 Flettner rotary ventilators fitted n 0.5399 0.5374 0.5361 0.5366
(Model TCX-2) ELA (m2)* 0.0359 0.0324 0.0410 0.0374
Vauxhall Vivaro (2006) C (m3 s-1 ) 0.0169 0.0163
2 Flettner rotary ventilators fitted n 0.6668 0.6762
(Model 2000) ELA (m2)* 0.0275 0.0269
Vauxhall Vivaro (2009) C (m3 s-1 ) 0.0146 0.0092
n 0.6054 0.6876
ELA (m2)* 0.0218 0.0154
Mercedes Sprinter (2010) C (m3 s-1 ) 0.0098 0.0070
n 0.6235 0.6403
ELA (m2)* 0.0150 0.0110
Ford Transit 350 (2010) Fresh air intake
Dash vent open Dash vent closed
C (m3 s-1 ) 0.0136 0.0128 0.0132 0.0130 0.0109 0.0103
n 0.5871 0.5973 0.5918 0.5978 0.5969 0.6108
ELA (m2)* 0.0198 0.0189 0.0194 0.0192 0.0161 0.0155
ELA (m2)* ELA Mean 0.0192
ELA (m2)* ELA Stdev 0.0002
Fresh air intake Recirculated air
Dash vent closed
VEHICLES PRESSURISED (air blown into van)
Rotary ventilator not fitted or closed Rotary ventilator open
* Evaluated at 4 Pa
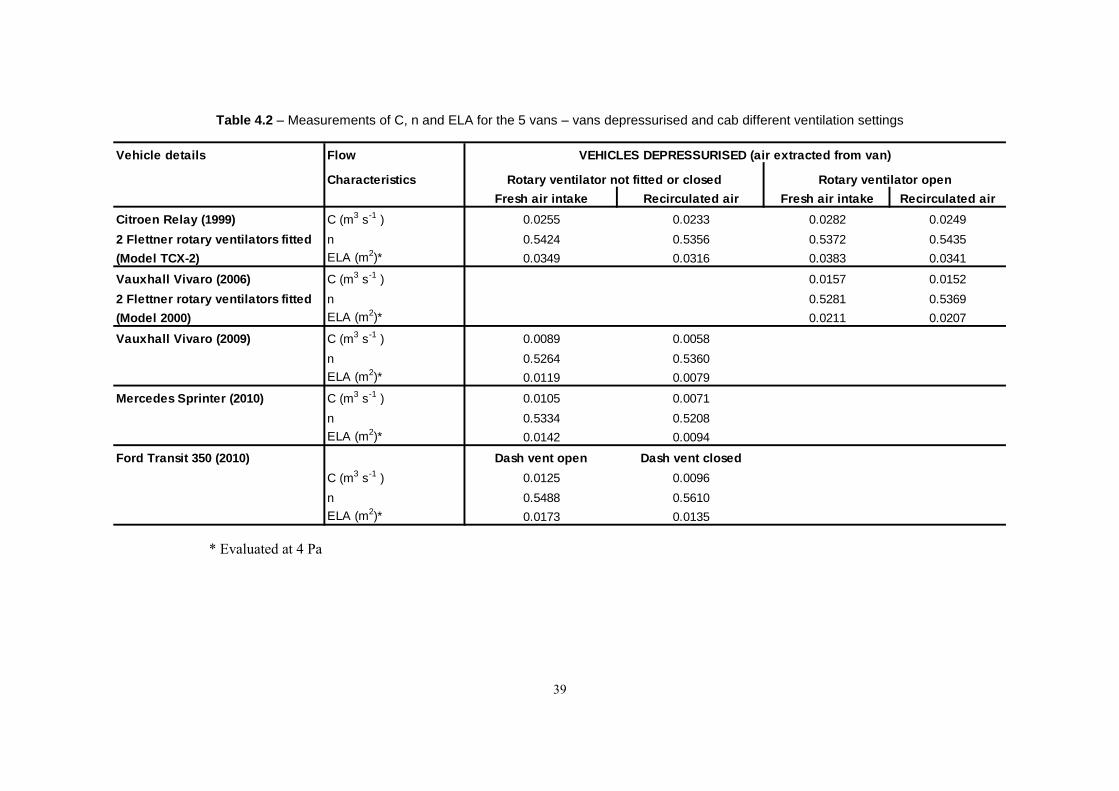
39
Table 4.2 – Measurements of C, n and ELA for the 5 vans – vans depressurised and cab different ventilation settings
Vehicle details Flow
Characteristics
Fresh air intake Recirculated air Fresh air intake Recirculated air
Citroen Relay (1999) C (m3 s-1 ) 0.0255 0.0233 0.0282 0.0249
2 Flettner rotary ventilators fitted n 0.5424 0.5356 0.5372 0.5435
(Model TCX-2) ELA (m2)* 0.0349 0.0316 0.0383 0.0341
Vauxhall Vivaro (2006) C (m3 s-1 ) 0.0157 0.0152
2 Flettner rotary ventilators fitted n 0.5281 0.5369
(Model 2000) ELA (m2)* 0.0211 0.0207
Vauxhall Vivaro (2009) C (m3 s-1 ) 0.0089 0.0058
n 0.5264 0.5360
ELA (m2)* 0.0119 0.0079
Mercedes Sprinter (2010) C (m3 s-1 ) 0.0105 0.0071
n 0.5334 0.5208
ELA (m2)* 0.0142 0.0094
Ford Transit 350 (2010) Dash vent open Dash vent closed
C (m3 s-1 ) 0.0125 0.0096
n 0.5488 0.5610
ELA (m2)* 0.0173 0.0135
VEHICLES DEPRESSURISED (air extracted from van)
Rotary ventilator not fitted or closed Rotary ventilator open
* Evaluated at 4 Pa
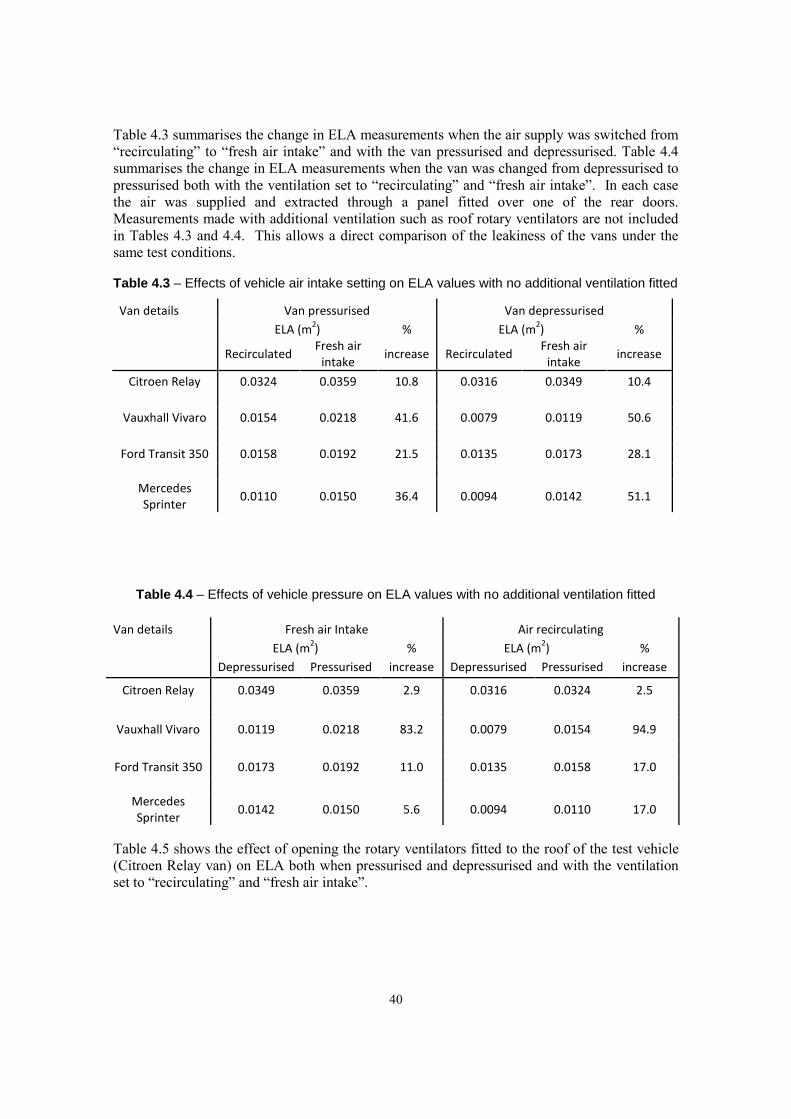
40
Table 4.3 summarises the change in ELA measurements when the air supply was switched from “recirculating” to “fresh air intake” and with the van pressurised and depressurised. Table 4.4 summarises the change in ELA measurements when the van was changed from depressurised to pressurised both with the ventilation set to “recirculating” and “fresh air intake”. In each case the air was supplied and extracted through a panel fitted over one of the rear doors. Measurements made with additional ventilation such as roof rotary ventilators are not included in Tables 4.3 and 4.4. This allows a direct comparison of the leakiness of the vans under the same test conditions.
Table 4.3 – Effects of vehicle air intake setting on ELA values with no additional ventilation fitted
Van details Van pressurised Van depressurised
ELA (m2) % ELA (m
2) %
Recirculated
Fresh air intake
increase Recirculated Fresh air
intake increase
Citroen Relay 0.0324 0.0359 10.8 0.0316 0.0349 10.4
Vauxhall Vivaro 0.0154 0.0218 41.6 0.0079 0.0119 50.6
Ford Transit 350 0.0158 0.0192 21.5 0.0135 0.0173 28.1
Mercedes Sprinter
0.0110 0.0150 36.4 0.0094 0.0142 51.1
Table 4.4 – Effects of vehicle pressure on ELA values with no additional ventilation fitted
Table 4.5 shows the effect of opening the rotary ventilators fitted to the roof of the test vehicle (Citroen Relay van) on ELA both when pressurised and depressurised and with the ventilation set to “recirculating” and “fresh air intake”.
Van details Fresh air Intake Air recirculating
ELA (m2) % ELA (m
2) %
Depressurised Pressurised increase Depressurised Pressurised increase
Citroen Relay 0.0349 0.0359 2.9 0.0316 0.0324 2.5
Vauxhall Vivaro 0.0119 0.0218 83.2 0.0079 0.0154 94.9
Ford Transit 350 0.0173 0.0192 11.0 0.0135 0.0158 17.0
Mercedes Sprinter
0.0142 0.0150 5.6 0.0094 0.0110 17.0
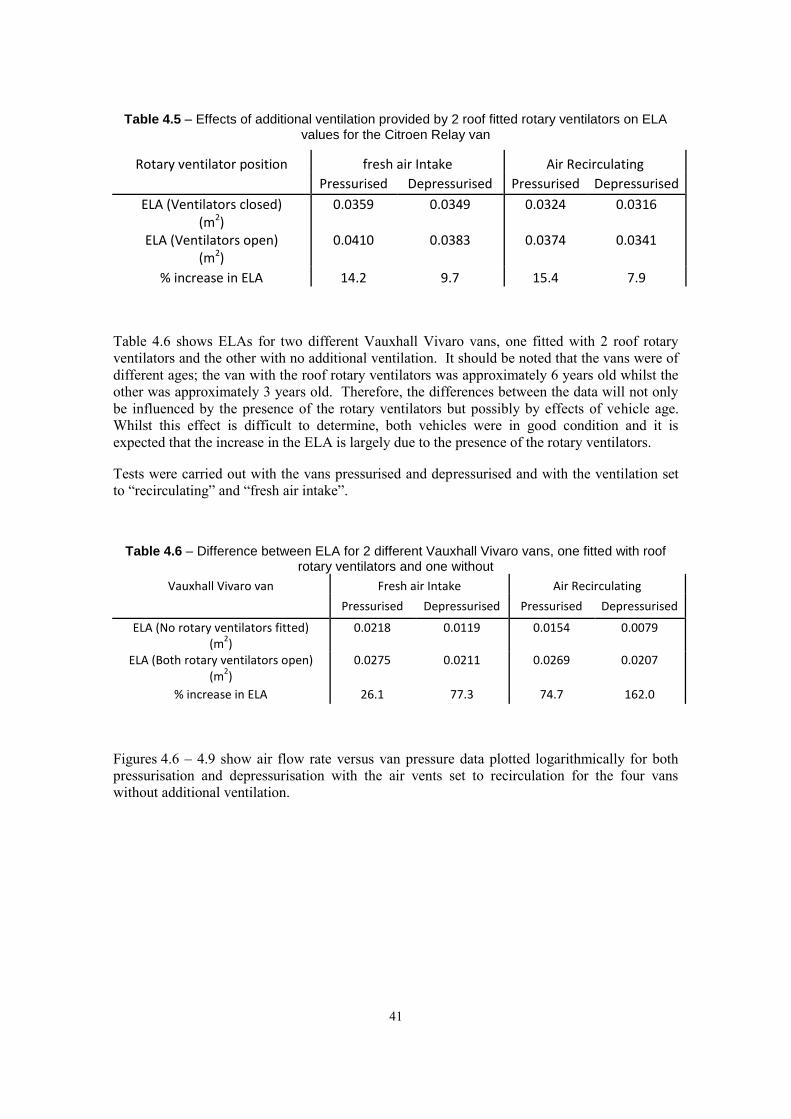
41
Table 4.5 – Effects of additional ventilation provided by 2 roof fitted rotary ventilators on ELA values for the Citroen Relay van
Rotary ventilator position fresh air Intake Air Recirculating
Pressurised Depressurised Pressurised Depressurised
ELA (Ventilators closed) (m2)
0.0359 0.0349 0.0324 0.0316
ELA (Ventilators open) (m2)
0.0410 0.0383 0.0374 0.0341
% increase in ELA 14.2 9.7 15.4 7.9
Table 4.6 shows ELAs for two different Vauxhall Vivaro vans, one fitted with 2 roof rotary ventilators and the other with no additional ventilation. It should be noted that the vans were of different ages; the van with the roof rotary ventilators was approximately 6 years old whilst the other was approximately 3 years old. Therefore, the differences between the data will not only be influenced by the presence of the rotary ventilators but possibly by effects of vehicle age. Whilst this effect is difficult to determine, both vehicles were in good condition and it is expected that the increase in the ELA is largely due to the presence of the rotary ventilators.
Tests were carried out with the vans pressurised and depressurised and with the ventilation set to “recirculating” and “fresh air intake”.
Table 4.6 – Difference between ELA for 2 different Vauxhall Vivaro vans, one fitted with roof rotary ventilators and one without
Vauxhall Vivaro van Fresh air Intake Air Recirculating
Pressurised Depressurised Pressurised Depressurised
ELA (No rotary ventilators fitted) (m
2)
0.0218 0.0119 0.0154 0.0079
ELA (Both rotary ventilators open) (m
2)
0.0275 0.0211 0.0269 0.0207
% increase in ELA 26.1 77.3 74.7 162.0
Figures 4.6 – 4.9 show air flow rate versus van pressure data plotted logarithmically for both pressurisation and depressurisation with the air vents set to recirculation for the four vans without additional ventilation.
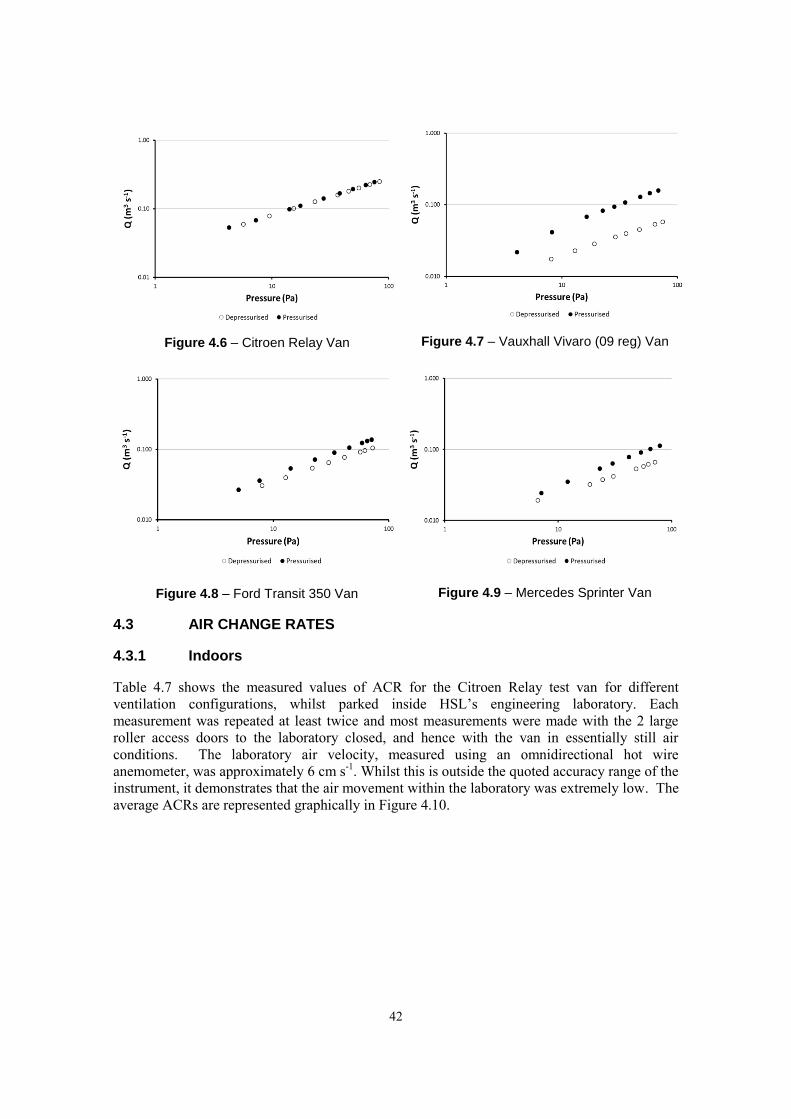
42
Figure 4.6 – Citroen Relay Van
Figure 4.7 – Vauxhall Vivaro (09 reg) Van
Figure 4.8 – Ford Transit 350 Van
Figure 4.9 – Mercedes Sprinter Van
4.3 AIR CHANGE RATES
4.3.1 Indoors
Table 4.7 shows the measured values of ACR for the Citroen Relay test van for different ventilation configurations, whilst parked inside HSL’s engineering laboratory. Each measurement was repeated at least twice and most measurements were made with the 2 large roller access doors to the laboratory closed, and hence with the van in essentially still air conditions. The laboratory air velocity, measured using an omnidirectional hot wire anemometer, was approximately 6 cm s-1. Whilst this is outside the quoted accuracy range of the instrument, it demonstrates that the air movement within the laboratory was extremely low. The average ACRs are represented graphically in Figure 4.10.

43
Table 4.7 – Air change rates measured inside the test van with different ventilation settings
Test number Ventilation setting Rotary ventilator Ventilation grilles ACR R
2
Intake Recirc Open Closed Open Closed (hr-1
)
1 X X X 0.23 0.9903
X X X 0.16 0.9647
Average 0.20
2 X X X 0.25 0.9403
X X X 0.29 0.9946
Average 0.27
3 X X X 0.3 0.9946
X X X 0.26 0.9989
X X X 0.26 0.9967
Average 0.27
4 X X X 1.17 0.9939
X X X 0.55 0.9964
X X X 0.62 0.9992
X X X 0.53 0.9970
Average 0.57
5 X X X 0.65 0.9977
X X X 0.59 0.9984
X X X 0.66 0.9982
X X X 0.54 0.9969
Average 0.61
6 X X X 0.67 0.9997
X X X 0.64 0.9997
X X X 0.56 0.9998
Average 0.62
7 X X X 0.96 0.9987
X X X 0.96 0.9951
X X X 1.39 0.9948
X X X 0.96 0.9913
Average 1.10
Shaded cells indicate measurements of ACR with roller door to laboratory opened for an unknown period – these ACR values have not been included in the average ACR calculations.
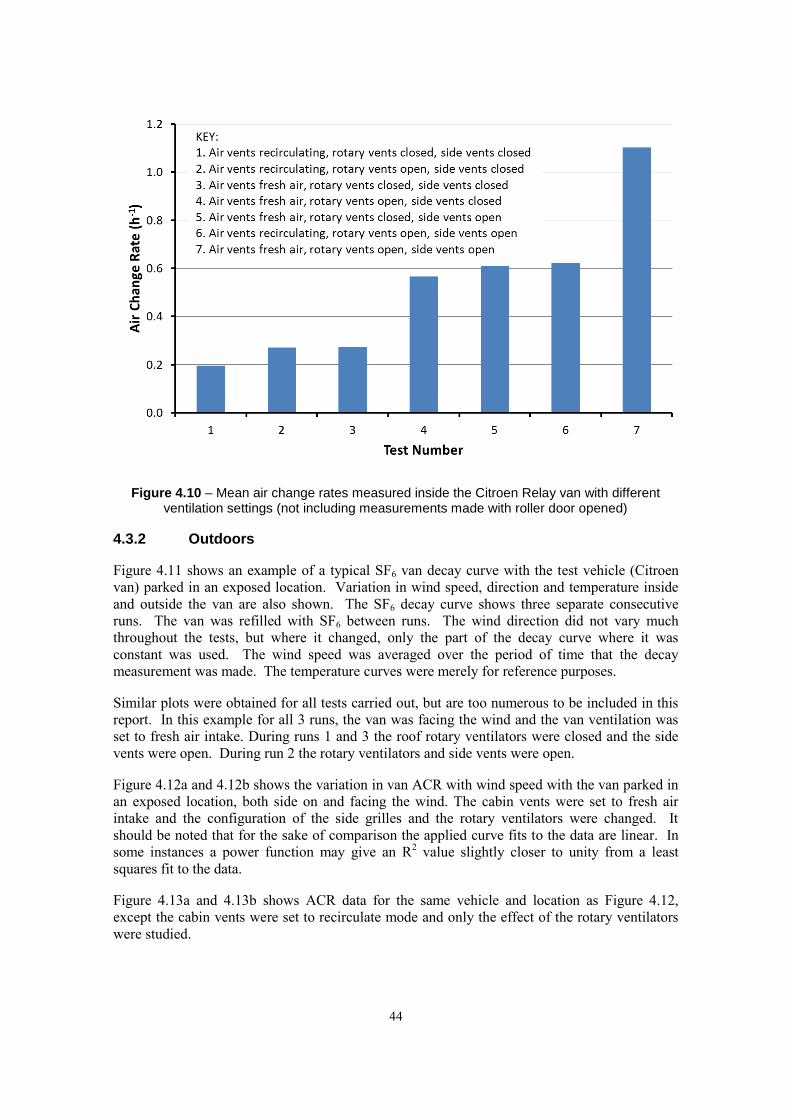
44
Figure 4.10 – Mean air change rates measured inside the Citroen Relay van with different ventilation settings (not including measurements made with roller door opened)
4.3.2 Outdoors
Figure 4.11 shows an example of a typical SF6 van decay curve with the test vehicle (Citroen van) parked in an exposed location. Variation in wind speed, direction and temperature inside and outside the van are also shown. The SF6 decay curve shows three separate consecutive runs. The van was refilled with SF6 between runs. The wind direction did not vary much throughout the tests, but where it changed, only the part of the decay curve where it was constant was used. The wind speed was averaged over the period of time that the decay measurement was made. The temperature curves were merely for reference purposes.
Similar plots were obtained for all tests carried out, but are too numerous to be included in this report. In this example for all 3 runs, the van was facing the wind and the van ventilation was set to fresh air intake. During runs 1 and 3 the roof rotary ventilators were closed and the side vents were open. During run 2 the rotary ventilators and side vents were open.
Figure 4.12a and 4.12b shows the variation in van ACR with wind speed with the van parked in an exposed location, both side on and facing the wind. The cabin vents were set to fresh air intake and the configuration of the side grilles and the rotary ventilators were changed. It should be noted that for the sake of comparison the applied curve fits to the data are linear. In some instances a power function may give an R2 value slightly closer to unity from a least squares fit to the data.
Figure 4.13a and 4.13b shows ACR data for the same vehicle and location as Figure 4.12, except the cabin vents were set to recirculate mode and only the effect of the rotary ventilators were studied.
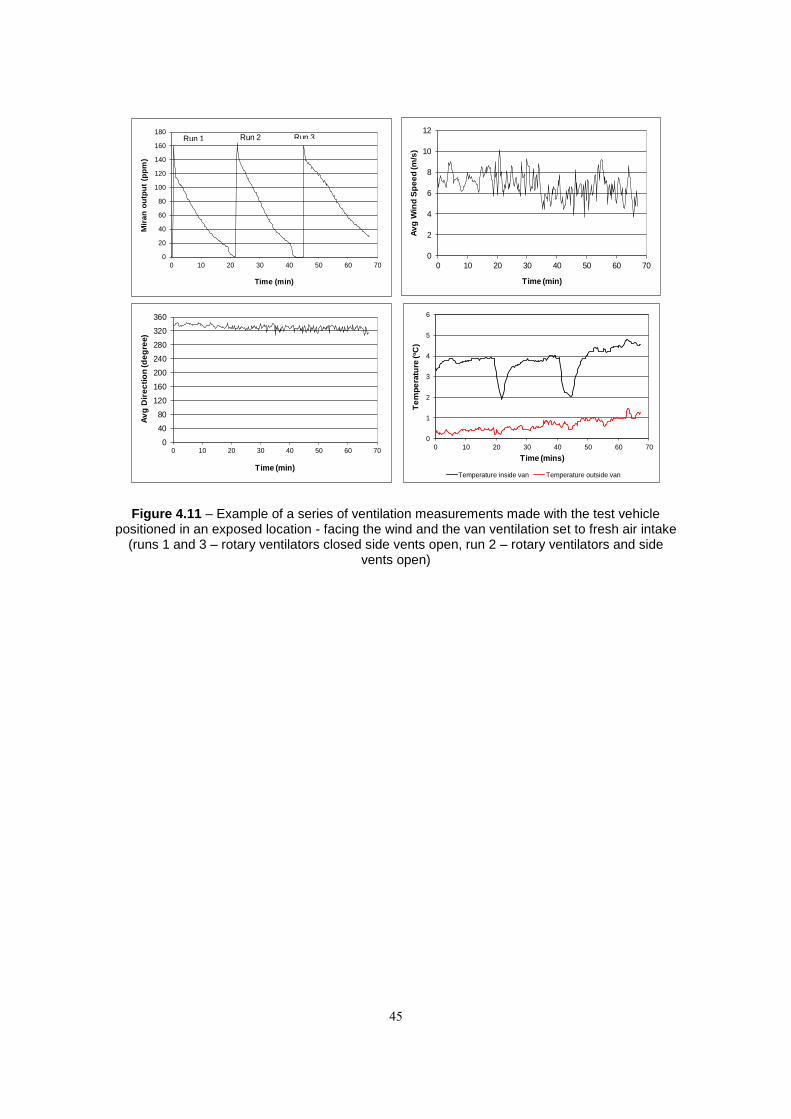
45
0
20
40
60
80
100
120
140
160
180
0 10 20 30 40 50 60 70
Mir
an
ou
tpu
t (p
pm
)
Time (min)
Run 1 Run 2 Run 3
0
2
4
6
8
10
12
0 10 20 30 40 50 60 70
Av
g W
ind
Sp
ee
d (m
/s)
Time (min)
0
40
80
120
160
200
240
280
320
360
0 10 20 30 40 50 60 70
Av
g D
ire
cti
on
(d
eg
ree)
Time (min)
0
1
2
3
4
5
6
0 10 20 30 40 50 60 70
Te
mp
era
ture
(oC
)
Time (mins)
Temperature inside van Temperature outside van
Figure 4.11 – Example of a series of ventilation measurements made with the test vehicle positioned in an exposed location - facing the wind and the van ventilation set to fresh air intake
(runs 1 and 3 – rotary ventilators closed side vents open, run 2 – rotary ventilators and side vents open)
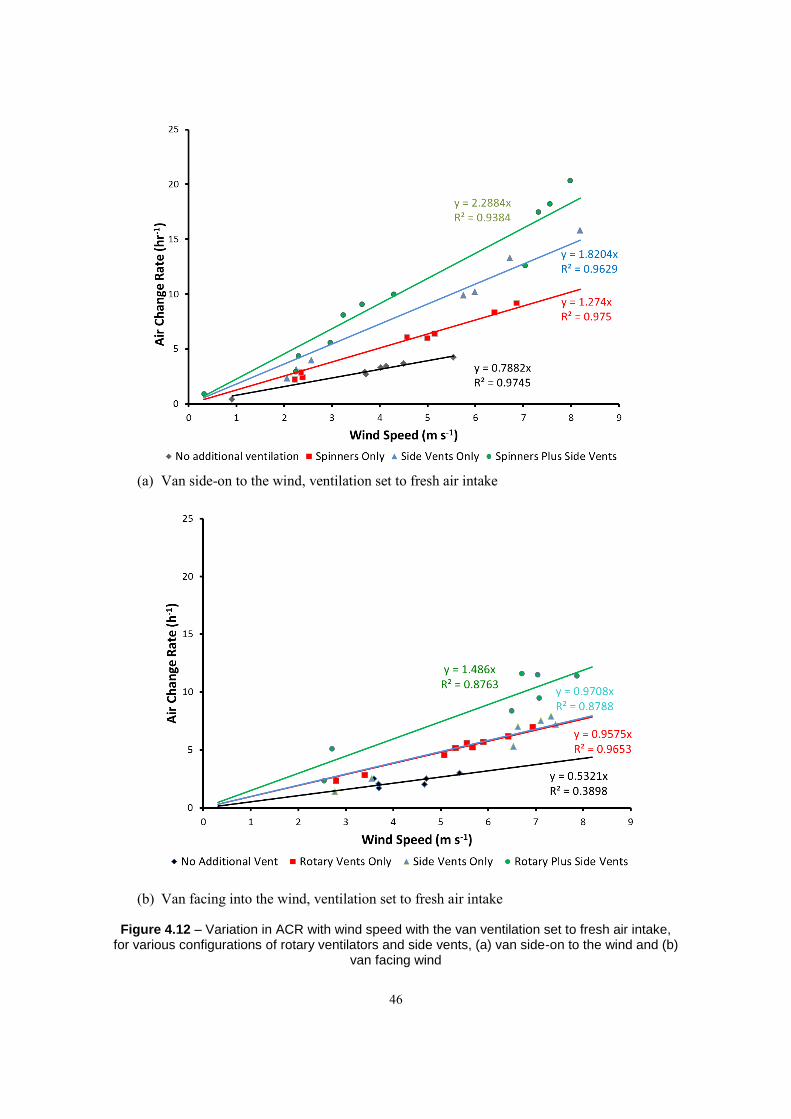
46
(a) Van side-on to the wind, ventilation set to fresh air intake
(b) Van facing into the wind, ventilation set to fresh air intake
Figure 4.12 – Variation in ACR with wind speed with the van ventilation set to fresh air intake, for various configurations of rotary ventilators and side vents, (a) van side-on to the wind and (b)
van facing wind
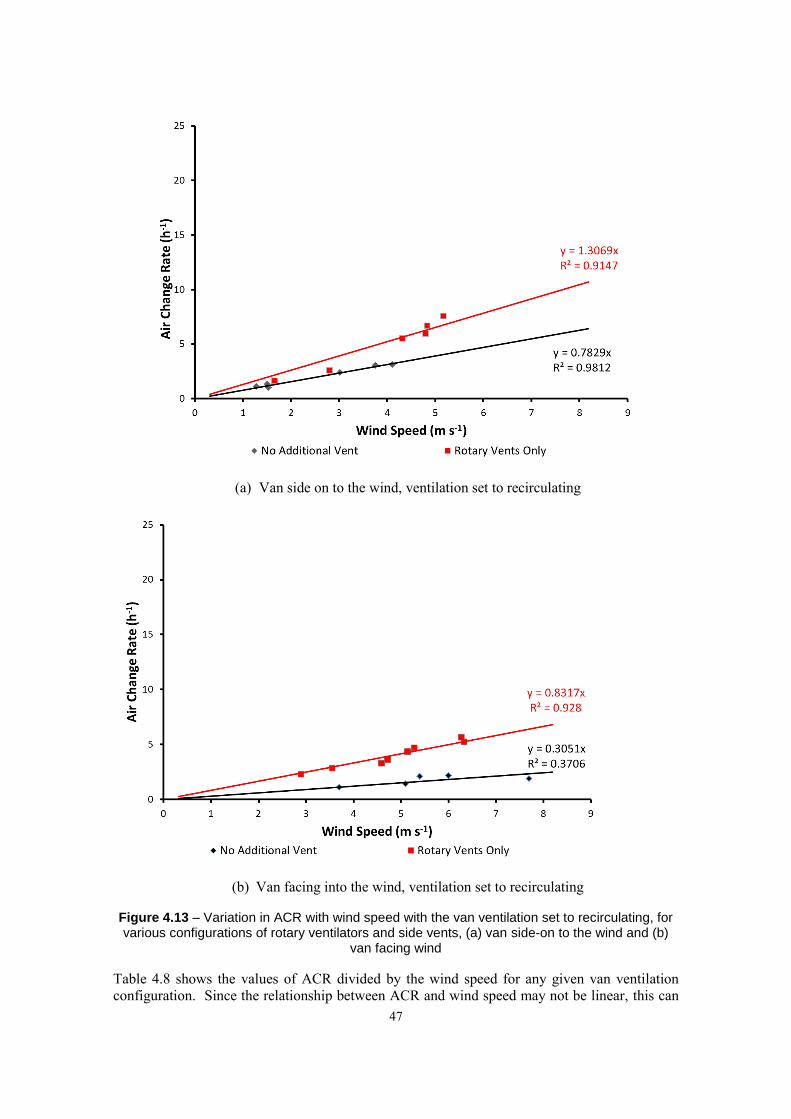
47
(a) Van side on to the wind, ventilation set to recirculating
(b) Van facing into the wind, ventilation set to recirculating
Figure 4.13 – Variation in ACR with wind speed with the van ventilation set to recirculating, for various configurations of rotary ventilators and side vents, (a) van side-on to the wind and (b)
van facing wind
Table 4.8 shows the values of ACR divided by the wind speed for any given van ventilation configuration. Since the relationship between ACR and wind speed may not be linear, this can

48
vary with changing velocity and is indicated by the values of coefficient of variation (COV) i.e. no change in relationship with velocity would give a COV of 0. However, the table serves to indicate the effects of changing the ventilation configuration of the van.
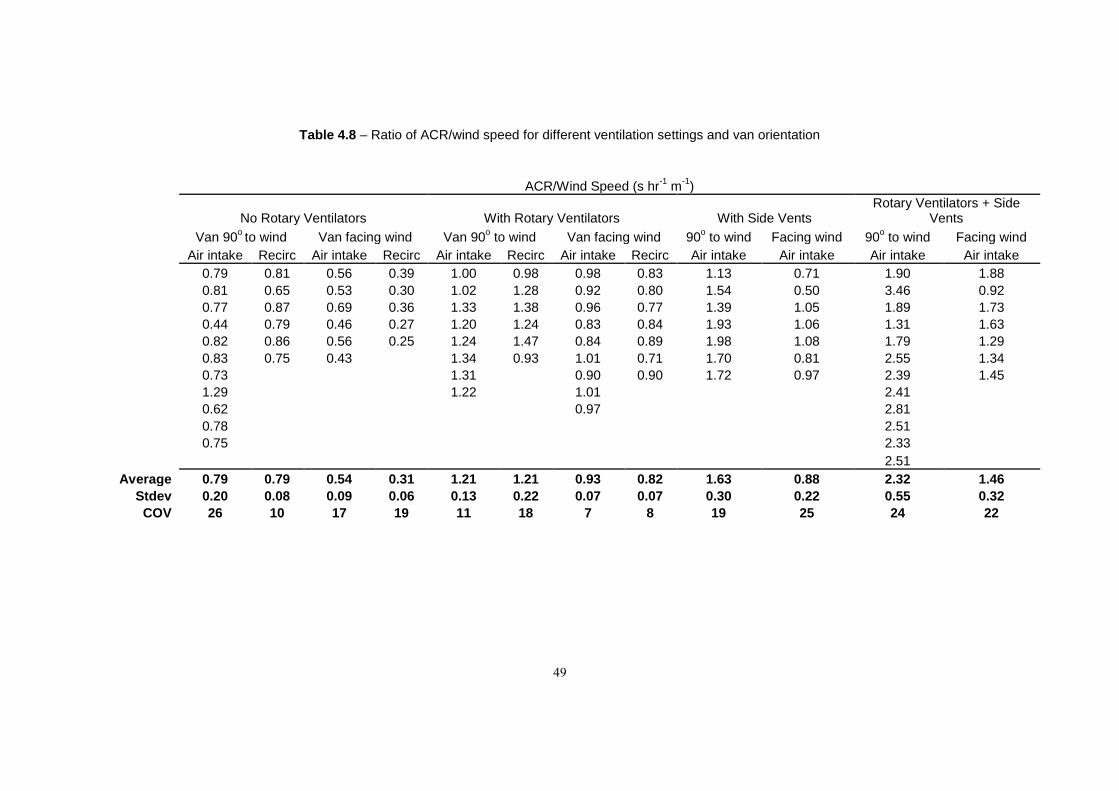
49
Table 4.8 – Ratio of ACR/wind speed for different ventilation settings and van orientation
ACR/Wind Speed (s hr
-1 m
-1)
No Rotary Ventilators With Rotary Ventilators With Side Vents Rotary Ventilators + Side
Vents
Van 90o to wind Van facing wind Van 90
o to wind Van facing wind 90
o to wind Facing wind 90
o to wind Facing wind
Air intake Recirc Air intake Recirc Air intake Recirc Air intake Recirc Air intake Air intake Air intake Air intake
0.79 0.81 0.56 0.39 1.00 0.98 0.98 0.83 1.13 0.71 1.90 1.88
0.81 0.65 0.53 0.30 1.02 1.28 0.92 0.80 1.54 0.50 3.46 0.92
0.77 0.87 0.69 0.36 1.33 1.38 0.96 0.77 1.39 1.05 1.89 1.73
0.44 0.79 0.46 0.27 1.20 1.24 0.83 0.84 1.93 1.06 1.31 1.63
0.82 0.86 0.56 0.25 1.24 1.47 0.84 0.89 1.98 1.08 1.79 1.29
0.83 0.75 0.43 1.34 0.93 1.01 0.71 1.70 0.81 2.55 1.34
0.73 1.31 0.90 0.90 1.72 0.97 2.39 1.45
1.29 1.22 1.01 2.41
0.62 0.97 2.81
0.78 2.51
0.75 2.33
2.51
Average 0.79 0.79 0.54 0.31 1.21 1.21 0.93 0.82 1.63 0.88 2.32 1.46
Stdev 0.20 0.08 0.09 0.06 0.13 0.22 0.07 0.07 0.30 0.22 0.55 0.32
COV 26 10 17 19 11 18 7 8 19 25 24 22
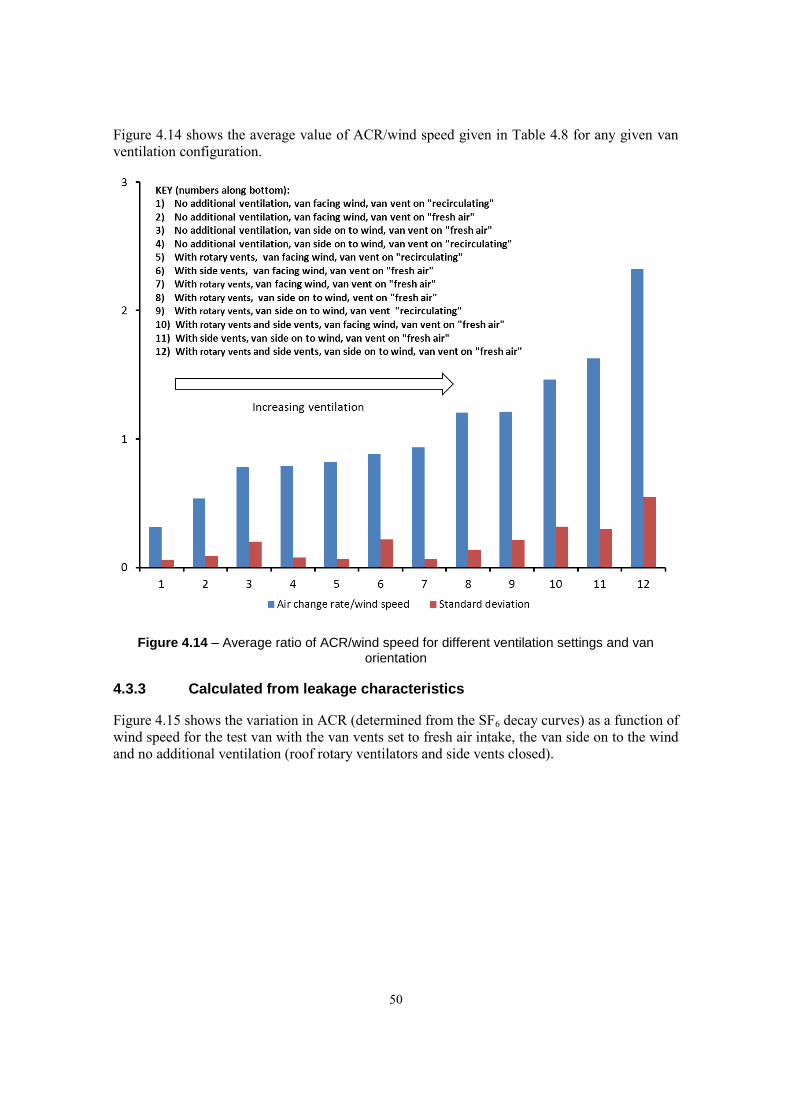
50
Figure 4.14 shows the average value of ACR/wind speed given in Table 4.8 for any given van ventilation configuration.
Figure 4.14 – Average ratio of ACR/wind speed for different ventilation settings and van orientation
4.3.3 Calculated from leakage characteristics
Figure 4.15 shows the variation in ACR (determined from the SF6 decay curves) as a function of wind speed for the test van with the van vents set to fresh air intake, the van side on to the wind and no additional ventilation (roof rotary ventilators and side vents closed).
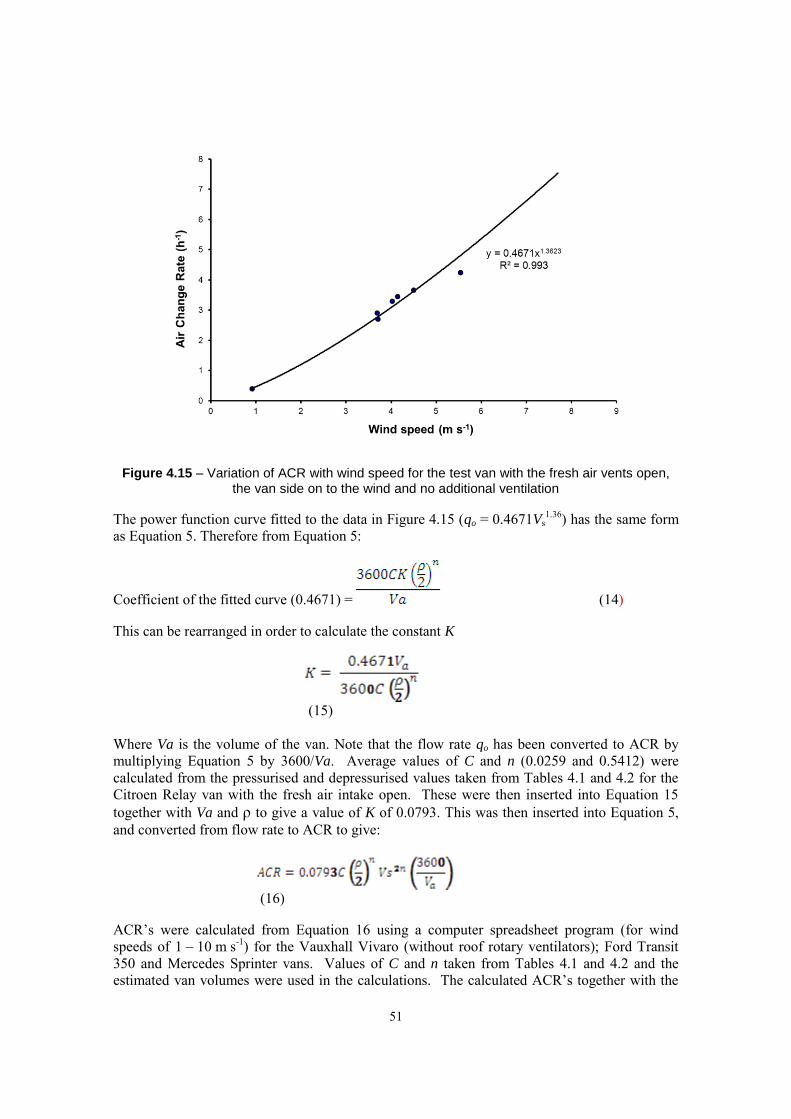
51
Figure 4.15 – Variation of ACR with wind speed for the test van with the fresh air vents open, the van side on to the wind and no additional ventilation
The power function curve fitted to the data in Figure 4.15 (qo = 0.4671Vs1.36) has the same form
as Equation 5. Therefore from Equation 5:
Coefficient of the fitted curve (0.4671) = (14)
This can be rearranged in order to calculate the constant K
(15)
Where Va is the volume of the van. Note that the flow rate qo has been converted to ACR by multiplying Equation 5 by 3600/Va. Average values of C and n (0.0259 and 0.5412) were calculated from the pressurised and depressurised values taken from Tables 4.1 and 4.2 for the Citroen Relay van with the fresh air intake open. These were then inserted into Equation 15 together with Va and ρ to give a value of K of 0.0793. This was then inserted into Equation 5, and converted from flow rate to ACR to give:
(16)
ACR’s were calculated from Equation 16 using a computer spreadsheet program (for wind speeds of 1 – 10 m s-1) for the Vauxhall Vivaro (without roof rotary ventilators); Ford Transit 350 and Mercedes Sprinter vans. Values of C and n taken from Tables 4.1 and 4.2 and the estimated van volumes were used in the calculations. The calculated ACR’s together with the
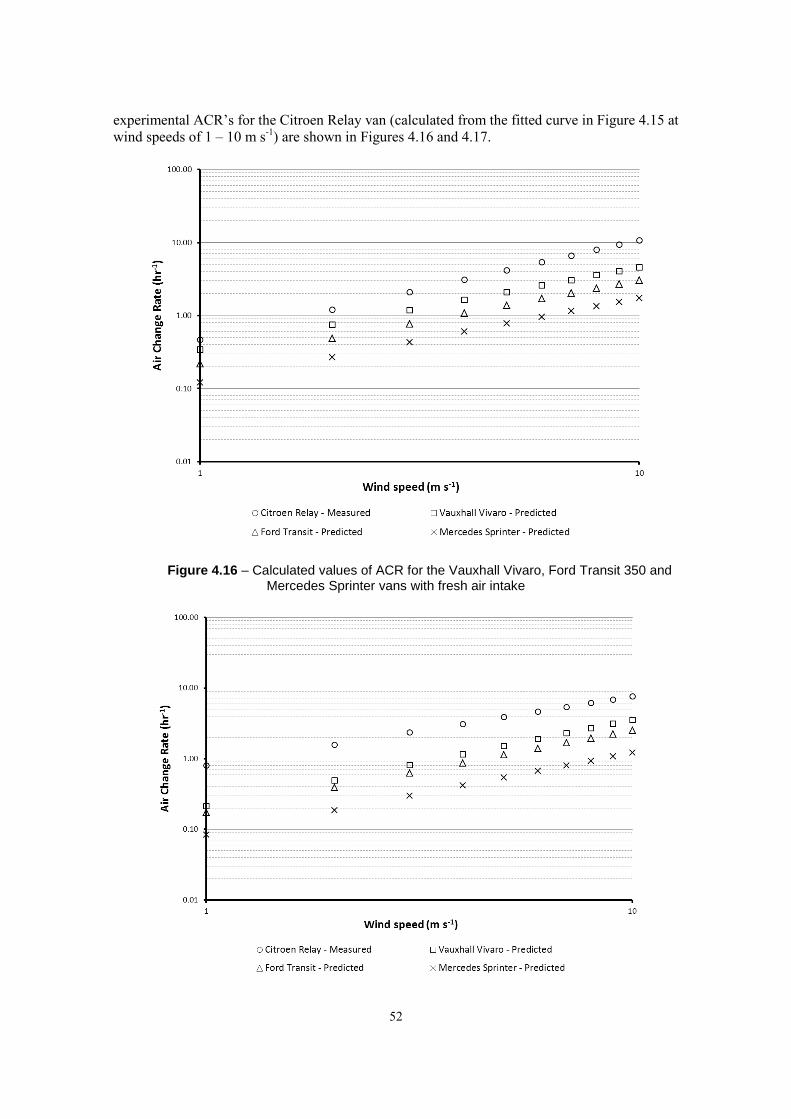
52
experimental ACR’s for the Citroen Relay van (calculated from the fitted curve in Figure 4.15 at wind speeds of 1 – 10 m s-1) are shown in Figures 4.16 and 4.17.
Figure 4.16 – Calculated values of ACR for the Vauxhall Vivaro, Ford Transit 350 and Mercedes Sprinter vans with fresh air intake
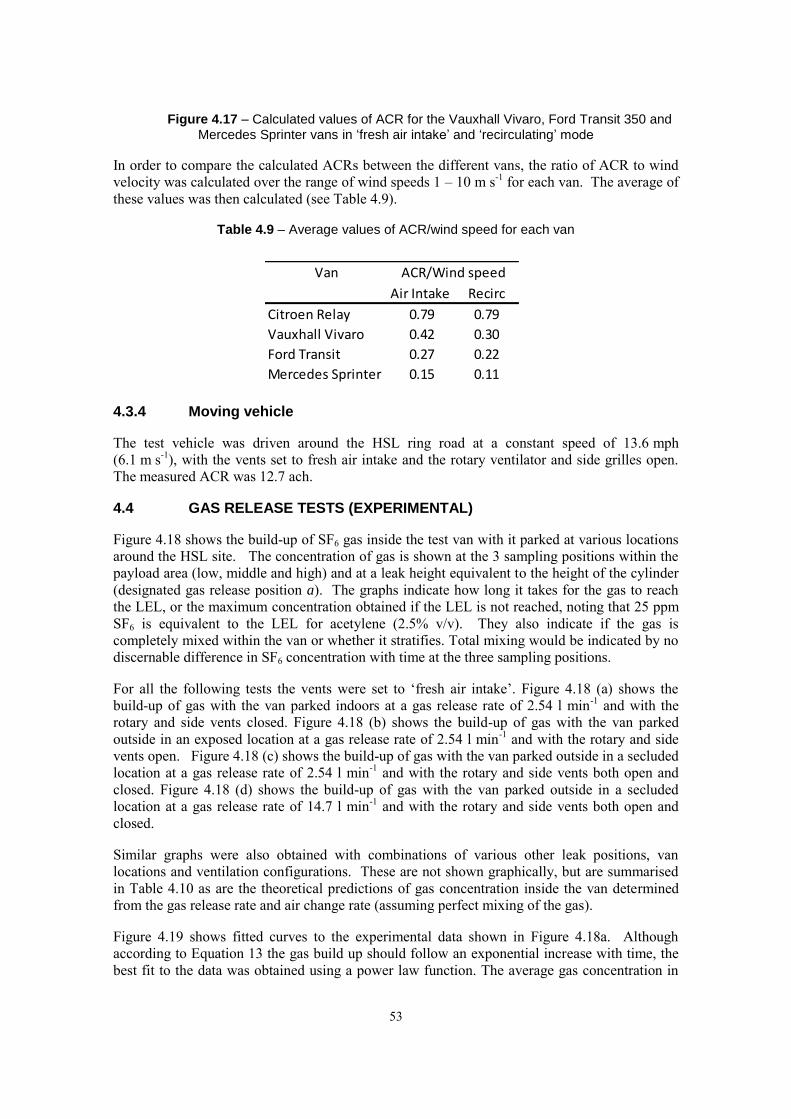
53
Van
Air Intake Recirc
Citroen Relay 0.79 0.79
Vauxhall Vivaro 0.42 0.30
Ford Transit 0.27 0.22
Mercedes Sprinter 0.15 0.11
ACR/Wind speed
Figure 4.17 – Calculated values of ACR for the Vauxhall Vivaro, Ford Transit 350 and Mercedes Sprinter vans in ‘fresh air intake’ and ‘recirculating’ mode
In order to compare the calculated ACRs between the different vans, the ratio of ACR to wind velocity was calculated over the range of wind speeds 1 – 10 m s-1 for each van. The average of these values was then calculated (see Table 4.9).
Table 4.9 – Average values of ACR/wind speed for each van
4.3.4 Moving vehicle
The test vehicle was driven around the HSL ring road at a constant speed of 13.6 mph (6.1 m s-1), with the vents set to fresh air intake and the rotary ventilator and side grilles open. The measured ACR was 12.7 ach.
4.4 GAS RELEASE TESTS (EXPERIMENTAL)
Figure 4.18 shows the build-up of SF6 gas inside the test van with it parked at various locations around the HSL site. The concentration of gas is shown at the 3 sampling positions within the payload area (low, middle and high) and at a leak height equivalent to the height of the cylinder (designated gas release position a). The graphs indicate how long it takes for the gas to reach the LEL, or the maximum concentration obtained if the LEL is not reached, noting that 25 ppm SF6 is equivalent to the LEL for acetylene (2.5% v/v). They also indicate if the gas is completely mixed within the van or whether it stratifies. Total mixing would be indicated by no discernable difference in SF6 concentration with time at the three sampling positions.
For all the following tests the vents were set to ‘fresh air intake’. Figure 4.18 (a) shows the build-up of gas with the van parked indoors at a gas release rate of 2.54 l min-1 and with the rotary and side vents closed. Figure 4.18 (b) shows the build-up of gas with the van parked outside in an exposed location at a gas release rate of 2.54 l min-1 and with the rotary and side vents open. Figure 4.18 (c) shows the build-up of gas with the van parked outside in a secluded location at a gas release rate of 2.54 l min-1 and with the rotary and side vents both open and closed. Figure 4.18 (d) shows the build-up of gas with the van parked outside in a secluded location at a gas release rate of 14.7 l min-1 and with the rotary and side vents both open and closed.
Similar graphs were also obtained with combinations of various other leak positions, van locations and ventilation configurations. These are not shown graphically, but are summarised in Table 4.10 as are the theoretical predictions of gas concentration inside the van determined from the gas release rate and air change rate (assuming perfect mixing of the gas).
Figure 4.19 shows fitted curves to the experimental data shown in Figure 4.18a. Although according to Equation 13 the gas build up should follow an exponential increase with time, the best fit to the data was obtained using a power law function. The average gas concentration in
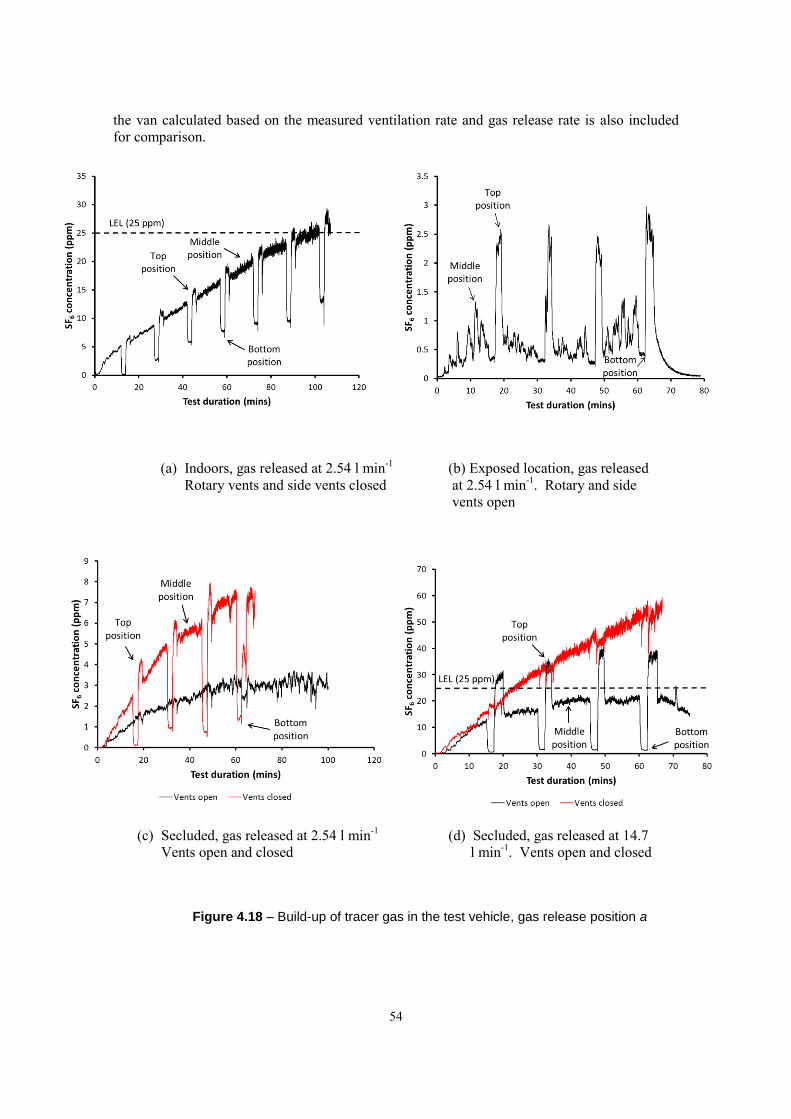
54
the van calculated based on the measured ventilation rate and gas release rate is also included for comparison.
(a) Indoors, gas released at 2.54 l min-1 (b) Exposed location, gas released
Rotary vents and side vents closed at 2.54 l min-1. Rotary and side vents open
(c) Secluded, gas released at 2.54 l min-1 (d) Secluded, gas released at 14.7
Vents open and closed l min-1. Vents open and closed
Figure 4.18 – Build-up of tracer gas in the test vehicle, gas release position a
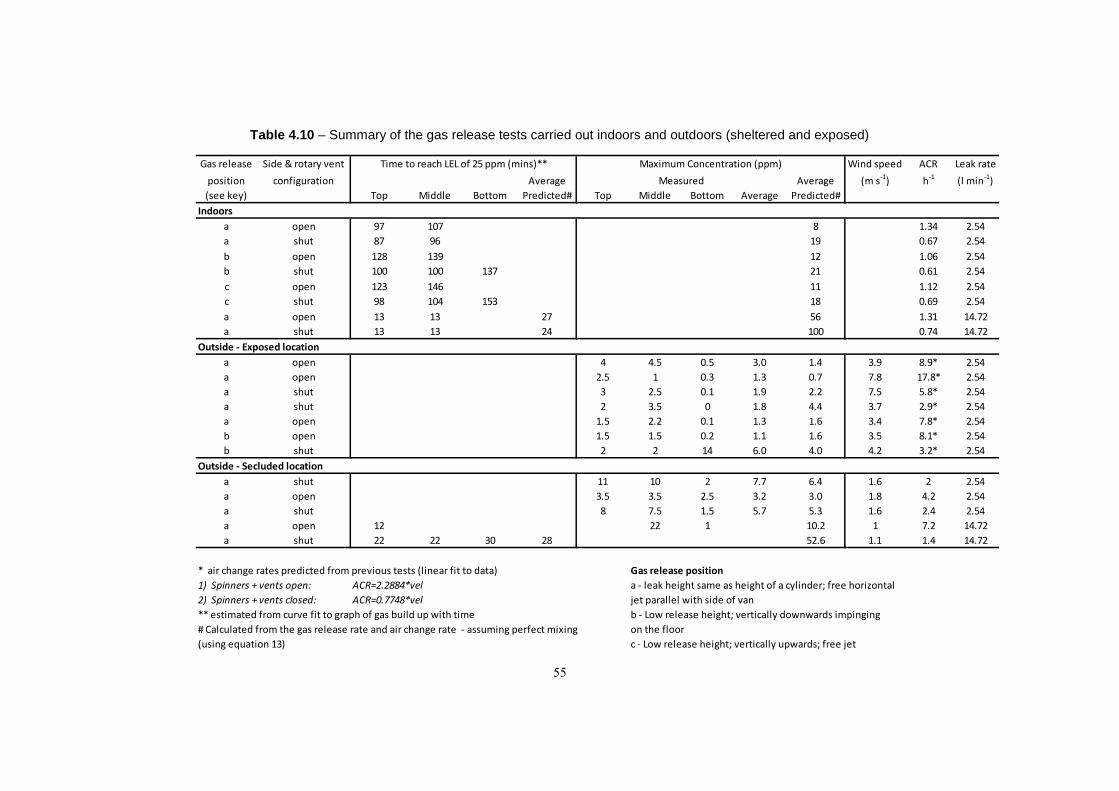
55
Gas release Side & rotary vent Wind speed ACR Leak rate
position configuration Average Average (m s-1) h-1 (l min-1)
(see key) Top Middle Bottom Predicted# Top Middle Bottom Average Predicted#
Indoors
a open 97 107 8 1.34 2.54
a shut 87 96 19 0.67 2.54
b open 128 139 12 1.06 2.54
b shut 100 100 137 21 0.61 2.54
c open 123 146 11 1.12 2.54
c shut 98 104 153 18 0.69 2.54
a open 13 13 27 56 1.31 14.72
a shut 13 13 24 100 0.74 14.72
Outside - Exposed location
a open 4 4.5 0.5 3.0 1.4 3.9 8.9* 2.54
a open 2.5 1 0.3 1.3 0.7 7.8 17.8* 2.54
a shut 3 2.5 0.1 1.9 2.2 7.5 5.8* 2.54
a shut 2 3.5 0 1.8 4.4 3.7 2.9* 2.54
a open 1.5 2.2 0.1 1.3 1.6 3.4 7.8* 2.54
b open 1.5 1.5 0.2 1.1 1.6 3.5 8.1* 2.54
b shut 2 2 14 6.0 4.0 4.2 3.2* 2.54
Outside - Secluded location
a shut 11 10 2 7.7 6.4 1.6 2 2.54
a open 3.5 3.5 2.5 3.2 3.0 1.8 4.2 2.54
a shut 8 7.5 1.5 5.7 5.3 1.6 2.4 2.54
a open 12 22 1 10.2 1 7.2 14.72
a shut 22 22 30 28 52.6 1.1 1.4 14.72
* air change rates predicted from previous tests (linear fit to data) Gas release position
1) Spinners + vents open: ACR=2.2884*vel a - leak height same as height of a cylinder; free horizontal
2) Spinners + vents closed: ACR=0.7748*vel jet parallel with side of van
** estimated from curve fit to graph of gas build up with time b - Low release height; vertically downwards impinging
# Calculated from the gas release rate and air change rate - assuming perfect mixing on the floor
(using equation 13) c - Low release height; vertically upwards; free jet
Maximum Concentration (ppm)
Measured
Time to reach LEL of 25 ppm (mins)**
Table 4.10 – Summary of the gas release tests carried out indoors and outdoors (sheltered and exposed)
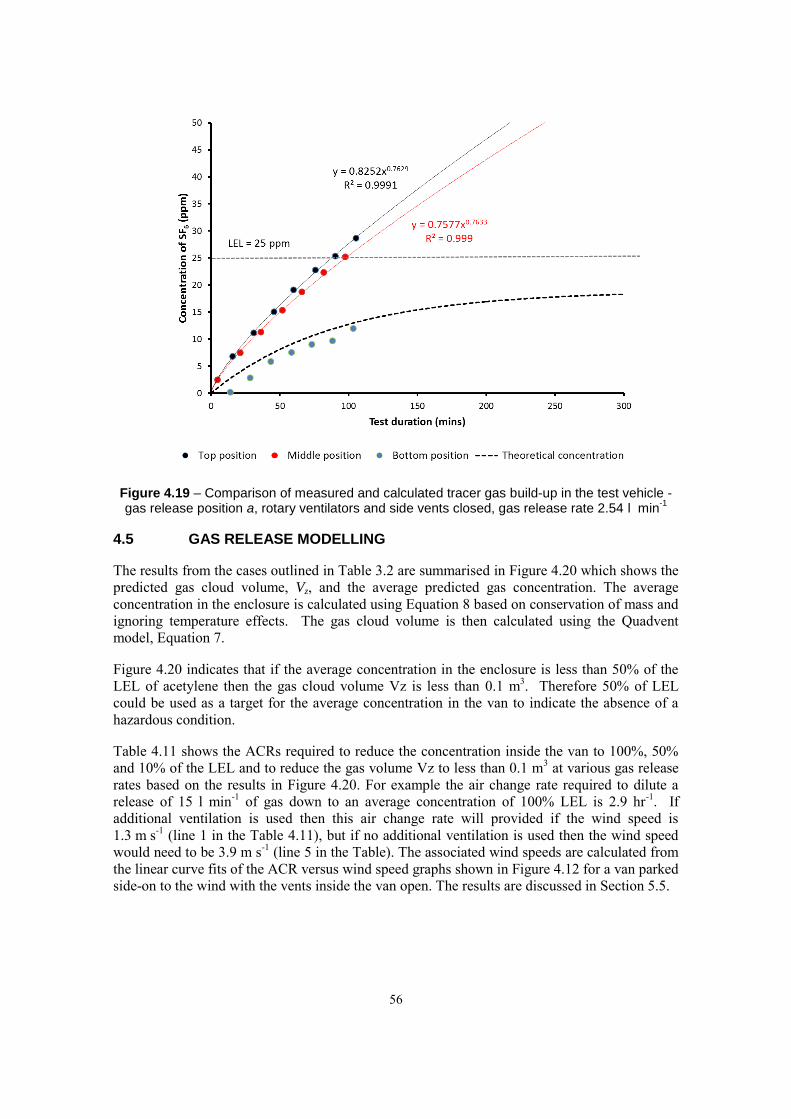
56
Figure 4.19 – Comparison of measured and calculated tracer gas build-up in the test vehicle - gas release position a, rotary ventilators and side vents closed, gas release rate 2.54 l min
-1
4.5 GAS RELEASE MODELLING
The results from the cases outlined in Table 3.2 are summarised in Figure 4.20 which shows the predicted gas cloud volume, Vz, and the average predicted gas concentration. The average concentration in the enclosure is calculated using Equation 8 based on conservation of mass and ignoring temperature effects. The gas cloud volume is then calculated using the Quadvent model, Equation 7.
Figure 4.20 indicates that if the average concentration in the enclosure is less than 50% of the LEL of acetylene then the gas cloud volume Vz is less than 0.1 m3. Therefore 50% of LEL could be used as a target for the average concentration in the van to indicate the absence of a hazardous condition.
Table 4.11 shows the ACRs required to reduce the concentration inside the van to 100%, 50% and 10% of the LEL and to reduce the gas volume Vz to less than 0.1 m3 at various gas release rates based on the results in Figure 4.20. For example the air change rate required to dilute a release of 15 l min-1 of gas down to an average concentration of 100% LEL is 2.9 hr-1. If additional ventilation is used then this air change rate will provided if the wind speed is 1.3 m s-1 (line 1 in the Table 4.11), but if no additional ventilation is used then the wind speed would need to be 3.9 m s-1 (line 5 in the Table). The associated wind speeds are calculated from the linear curve fits of the ACR versus wind speed graphs shown in Figure 4.12 for a van parked side-on to the wind with the vents inside the van open. The results are discussed in Section 5.5.
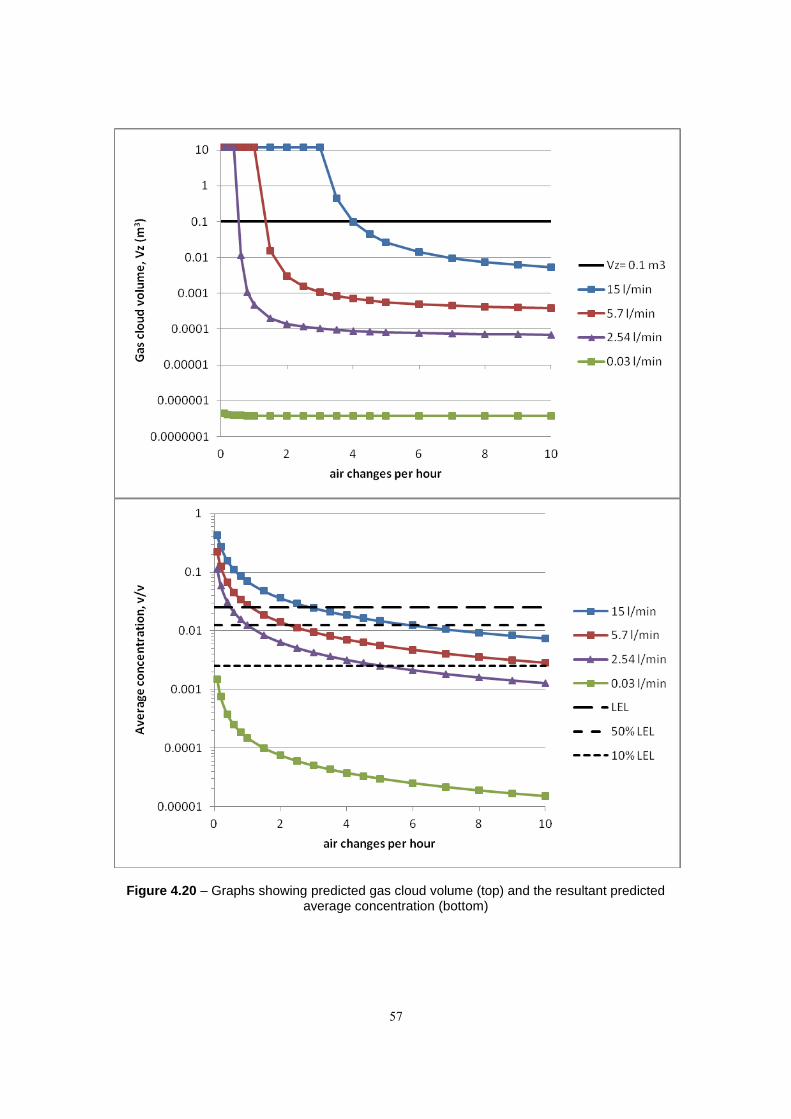
57
Figure 4.20 – Graphs showing predicted gas cloud volume (top) and the resultant predicted average concentration (bottom)

58
Table 4.11 – Van air change rates and associated wind speeds required to reduce gas build up to specified levels
Minimum ACR and wind speed required to achieve the following
Gas Release
rate Additional ventilation
100% LEL 50% LEL 10% LEL Gas vol (Vz) = 0.1 m
3
(l min
-1)
(rotary vents and
grilles) ACR (hr
-1)
Wind speed (m s
-1)
ACR (hr
-1)
Wind speed (m s
-1)
ACR (hr
-1)
Wind speed (m s
-1)
ACR (hr
-1)
Wind speed (m s
-1)
15 Yes 2.9 1.3 5.9 2.6 30 13.1 4.0 1.7
5.7 Yes 1.1 0.5 2.2 1.2 11.4 5.0 1.3 0.7
2.54 Yes 0.5 0.2 1.0 0.4 5.1 2.2 0.6 0.3
0.03 Yes <0.1 - <0.1 - <0.1 - <0.1 -
15 No 2.9 3.7 5.9 7.5 30 38.1 4.0 5.1
5.7 No 1.1 1.4 2.2 2.8 11.4 14.5 1.3 1.6
2.54 No 0.5 0.6 1.0 1.3 5.1 6.5 0.6 0.8
0.03 No <0.1 - <0.1 - <0.1 - <0.1 -
* Wind speed predicted from previous tests (linear fit to data)
1) Rotary ventilators + side grilles open: Wind speed = ACR/2.2884
2) Rotary ventilators + side grilles closed: Wind speed = ACR/0.7882
Vents inside van open
Van parked side-on to wind
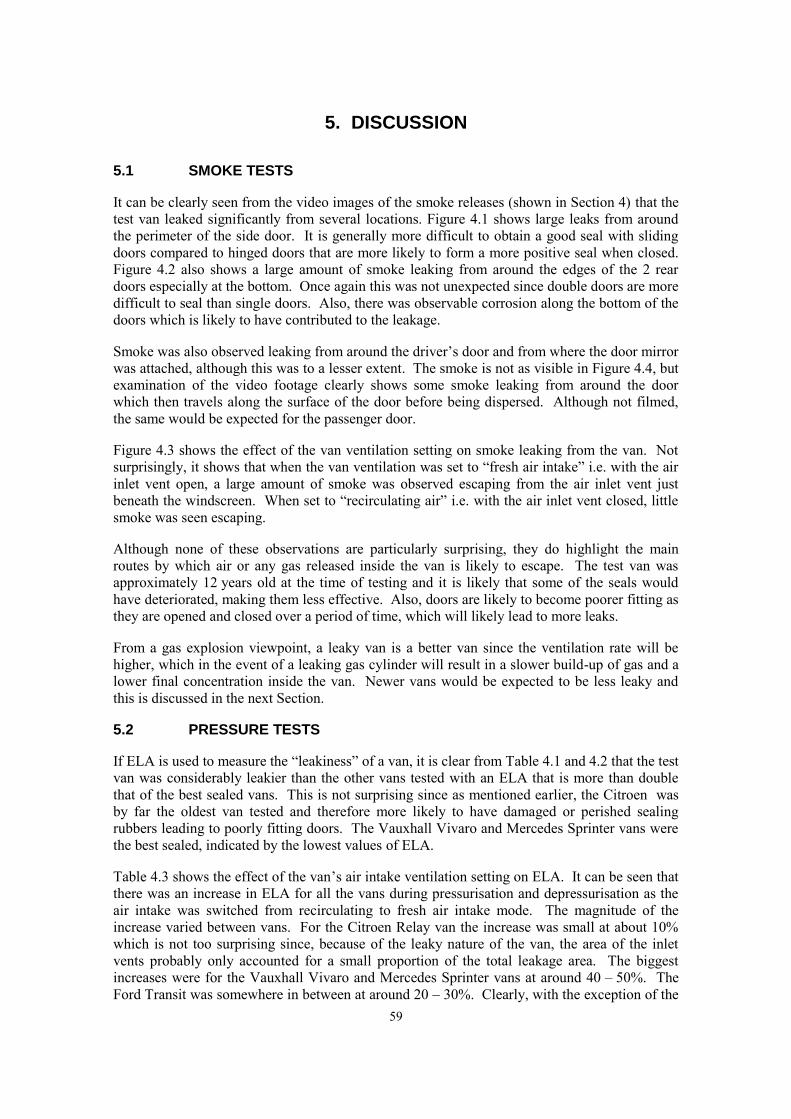
59
5. DISCUSSION
5.1 SMOKE TESTS
It can be clearly seen from the video images of the smoke releases (shown in Section 4) that the test van leaked significantly from several locations. Figure 4.1 shows large leaks from around the perimeter of the side door. It is generally more difficult to obtain a good seal with sliding doors compared to hinged doors that are more likely to form a more positive seal when closed. Figure 4.2 also shows a large amount of smoke leaking from around the edges of the 2 rear doors especially at the bottom. Once again this was not unexpected since double doors are more difficult to seal than single doors. Also, there was observable corrosion along the bottom of the doors which is likely to have contributed to the leakage.
Smoke was also observed leaking from around the driver’s door and from where the door mirror was attached, although this was to a lesser extent. The smoke is not as visible in Figure 4.4, but examination of the video footage clearly shows some smoke leaking from around the door which then travels along the surface of the door before being dispersed. Although not filmed, the same would be expected for the passenger door.
Figure 4.3 shows the effect of the van ventilation setting on smoke leaking from the van. Not surprisingly, it shows that when the van ventilation was set to “fresh air intake” i.e. with the air inlet vent open, a large amount of smoke was observed escaping from the air inlet vent just beneath the windscreen. When set to “recirculating air” i.e. with the air inlet vent closed, little smoke was seen escaping.
Although none of these observations are particularly surprising, they do highlight the main routes by which air or any gas released inside the van is likely to escape. The test van was approximately 12 years old at the time of testing and it is likely that some of the seals would have deteriorated, making them less effective. Also, doors are likely to become poorer fitting as they are opened and closed over a period of time, which will likely lead to more leaks.
From a gas explosion viewpoint, a leaky van is a better van since the ventilation rate will be higher, which in the event of a leaking gas cylinder will result in a slower build-up of gas and a lower final concentration inside the van. Newer vans would be expected to be less leaky and this is discussed in the next Section.
5.2 PRESSURE TESTS
If ELA is used to measure the “leakiness” of a van, it is clear from Table 4.1 and 4.2 that the test van was considerably leakier than the other vans tested with an ELA that is more than double that of the best sealed vans. This is not surprising since as mentioned earlier, the Citroen was by far the oldest van tested and therefore more likely to have damaged or perished sealing rubbers leading to poorly fitting doors. The Vauxhall Vivaro and Mercedes Sprinter vans were the best sealed, indicated by the lowest values of ELA.
Table 4.3 shows the effect of the van’s air intake ventilation setting on ELA. It can be seen that there was an increase in ELA for all the vans during pressurisation and depressurisation as the air intake was switched from recirculating to fresh air intake mode. The magnitude of the increase varied between vans. For the Citroen Relay van the increase was small at about 10% which is not too surprising since, because of the leaky nature of the van, the area of the inlet vents probably only accounted for a small proportion of the total leakage area. The biggest increases were for the Vauxhall Vivaro and Mercedes Sprinter vans at around 40 – 50%. The Ford Transit was somewhere in between at around 20 – 30%. Clearly, with the exception of the
60
test van, switching the air inlet vent from recirculating to air intake can significantly increase the van’s ventilation with the fan switched off.
Measurement of ELA during pressurisation and depressurisation is an indicator of the condition of the door seals etc. i.e. vans with good seals will show a significant reduction in ELA during depressurisation. Table 4.4 shows the effects of pressurising and depressurising the vans on ELA. It can be seen that the percentage increase in ELA during pressurisation compared to depressurisation was minimal in most instances (3 – 17%) with the exception of the Vauxhall Vivaro van which showed an increase of about 83 - 95%. This would seem to indicate that the rubber seals around the doors were more effective than the other vans.
Table 4.5 shows the effect of fitting additional ventilation in the form of 2 roof rotary ventilators to the test Van on ELA. It can be seen that with the rotary ventilators open, ventilation set to either fresh air intake or recirculating and with the van pressurised and depressurised, there was only a relatively small increase in the ELA of about 8 – 15% compared to when the rotary ventilators were closed. This is not surprising considering the inherently leaky nature of the van. It is likely that rotary ventilators would have had a bigger effect if fitted in the other vans that were better sealed. This is indicated in Table 4.8 where an increase in ELA of approximately 26 – 160% was observed with rotary ventilators fitted depending on the ventilation settings and whether the van was under positive or negative pressure during the tests. The biggest increase of approximately 160% was observed with the van tested under negative pressure and with van ventilation set to recirculating mode. Clearly, then the inclusion of rotary ventilators will be beneficial by simply increasing the ELA. However, they will increase ventilation further as they spin thus providing forced ventilation inside the van. This will increase with increasing external wind speed which may be caused by external weather conditions and/or movement of the van as it is driven. This will be discussed further in Section 5.3.2.
Under conditions of depressurisation it is likely that a vehicle’s doors would be pulled onto the rubber seals making the vehicle “tighter” whilst under pressurisation the opposite would occur. Therefore, as expected the observed flow rates at any given pressure difference were higher for pressurisation than for depressurisation in all instances apart from the Citroen Relay van as shown in Figures 4.6 – 4.9. This confirms the likely poor condition of the Citroen’s sealing. The biggest difference in pressure was observed for the Vauxhall Vivaro which confirms that there was probably particularly good sealing on this van.
From a gas explosion viewpoint, a leaky van is better since the air ventilation rate will be higher, which in the event of a leaking gas cylinder will result in a slower build-up of gas and a lower final concentration inside the van.
5.3 AIR CHANGE RATES
5.3.1 Indoors
Although the measured ACRs were low with the van located indoors, Figure 4.10 shows that there was still a noticeable difference in the ventilation as the various parameters were changed. For example, with minimum ventilation (air vents set to recirculating, roof rotary ventilators and side vents closed) the ACR was 0.20 hr-1. With maximum ventilation (air intake mode, rotary ventilators and side vents open), the ACR increased nearly six-fold to 1.1 hr-1.
With the ventilation set to air intake mode, and the rotary ventilators and the side ventilation grilles closed, the mean ACR was 0.27 hr-1. Opening the rotary ventilators or the side grilles gave very similar increases in the ACR, which effectively doubled from 0.27 hr-1 to

61
approximately 0.6 hr-1. With both rotary ventilators and grilles open the ACR almost doubled again to 1.1 hr-1.
Clearly, this will have a significant effect on the speed at which gas concentration builds up inside the van in the event of an accidental release.
Not surprisingly, the rotary roof ventilators did not spin whilst the van was located indoors due to relatively low air movements. The increase in ACR when the rotary ventilators were open was purely due to an increase in the ELA created by the additional openings, as was the case with the side grille vents.
5.3.2 Outdoors
Figure 4.12 shows an increase in ACR with increasing wind speed and increasing amounts of van ventilation. A linear curve fit has been applied to the data using least squares analysis and the R2 values indicate a reasonable fit to the data. In some instances a power law curve fit gave R2 values that were slightly closer to 1 (with 1 being a perfect fit to the data). However, for the purposes of comparing the effects of van ventilation on ACR it was decided to use a linear curve fit. It can be seen that there was a better fit to the data with the van side on to the wind than with the van facing the wind (higher values of R2).
From Figure 4.12 it is clear that for any given wind speed the ACR was lower with the van facing rather than side on to the wind; this is the same finding as Fletcher and Saunders (1994) and is likely linked to the aerodynamic design of vehicles in general. With the van side on to the wind the pressure drop across the vehicle will be higher due to the large flat side presented to the wind. This will cause a ‘suction’ effect on the downstream side of the van thus increasing the ventilation rate.
With the van side on to the wind there was a clear difference in ACR between the various ventilation settings. The lowest ACR, as expected, was with no additional ventilation, next was with the rotary ventilators open, then the side grilles open and the highest ventilation rate was with both the rotary and side vents open.
With the van facing the wind, the effect of the various ventilation settings on the ACR was in the same order as when the van was side on to the wind except the rotary ventilators and the side vents performed almost identically (see tests 6 and 7 in Figure 4.14). This finding is the same as when the vehicle was parked indoors. With the van side on to the wind, in the exposed location, it is likely that the side vents had a greater effect than the rotary ventilators as the wind was blowing directly at the one of the side vents. This is indicated by an increased ACR shown by tests 8 and 11 in Figure 4.14.
With the vehicle parked side on to the wind, the van vents set to recirculate and with no additional ventilation (Figure 4.13a), the fit to the ACR data is extremely similar to the fit to the ACR data (Figure 4.12a) when the vehicle vents were set to ‘fresh air intake’ (the slope of the linear fits differ by less than 1%). Comparing the same graphs but with the rotary ventilators open gives a similar picture; the gradient of the slopes are within 3%. This suggests that with the vehicle positioned in this orientation to the wind, the setting of the cabin vents (fresh air intake or recirculating) does not appear to affect the ACR.
Comparing Figure 4.12b and 4.13b, when the vehicle was positioned facing the wind, and the vehicle vents set to recirculate, the ACRs were lower than with the vents set to fresh air intake (the slope of the fit was approximately half). However, when the rotary ventilators were opened the comparison is much closer with only a 13% difference. This suggests that as the rotary
62
ventilators are positioned on the roof of the vehicle the performance of the ventilators is less sensitive to the direction of the wind.
Table 4.8 shows that with the van side on to the wind and the maximum amount of ventilation applied (rotary ventilators and side vents open, van ventilation set to fresh air mode), the average ratio of ACR to wind speed was 2.32 (standard deviation = 0.55). With minimum ventilation (rotary ventilators and side grilles closed, van ventilation set to recirculating) the average ratio of ACR to wind speed was 0.79 (standard deviation = 0.08). This equates to an increase in ACR from minimum ventilation configuration to maximum ventilation of about 3 at any given wind speed.
Likewise with the van facing the wind and the maximum amount of ventilation applied, the average ratio of ACR to wind speed was 1.46 (standard deviation = 0.32). With minimum ventilation the average ratio of ACR to wind speed was 0.31 (standard deviation = 0.06). This equates to an increase in ACR from minimum ventilation configuration to maximum ventilation of about 5 at any given wind speed. From these measurements, the effect of wind direction relative to the van was estimated. With maximum ventilation, the increase in ACR when the van was moved from facing to side on to the wind was about 1.6 at any given wind speed. With minimum ventilation, the increase in ACR was about 2.5 at any given wind speed.
With the van ventilation set to ‘fresh air intake’ and the van positioned side on to wind, the average ratio of ACR to wind speed with and without rotary ventilators was 1.21 and 0.79 respectively. This represents an increase in ACR of about 50%. With the van ventilation set to ‘fresh air intake’ and the van positioned facing the wind, the average ratio of ACR to wind speed with and without rotary ventilators was 0.93 and 0.54 respectively. This represents an increase in ACR of about 70%.
With the van ventilation set to ‘recirculating’ and the van positioned side on to the wind the average ratio of ACR to wind speed with and without rotary ventilators was 1.21 and 0.79 respectively, the same as for ‘fresh air intake’ mode. This represents an increase in ACR of about 50%. With the van ventilation set to ‘recirculating’ and the van positioned facing the wind the average ratio of ACR to wind speed with and without rotary ventilators was 0.82 and 0.31 respectively. This represents an increase in ACR of about 160%.
5.3.3 Moving vehicle
As noted in Fletcher and Saunders (1994), the case of a moving vehicle in relatively still air is not physically comparable to a stationary vehicle in a moving air stream. There are 2 major differences with the vehicle moving:
1. There is a relative speed between the underside of the vehicle and the road. The speed of this air will be greater than when the vehicle is stationary.
2. With the engine cooling fan and other pulleys running, there may be an increased air movement under the bonnet and close to the ventilation inlets. This may have a greater impact on the ventilation at low speeds.
Both of the above may increase the ventilation rate. However, a comparison can be made with the data obtained on ACR for a moving vehicle with Figure 4.12b, which shows the experimental data with the test vehicle facing into the wind and the vents set to fresh air intake mode. From the equation of the straight line fit to the data with the rotary and side vents open and using the speed of the vehicle measured (6.1 m s-1) the air change rate can be estimated. This gives 9.1 ach, which, as expected, is lower than the measured value of 12.7 ach (approximately 30% lower).
63
Whilst a single data point does not allow a full comparison of an ACR with a vehicle moving and stationary, the suggestion is that if anything the ACR is likely to be higher for a moving vehicle. Whilst Fletcher and Saunders (1994) studied cars, their data also showed this.
5.3.4 Calculated
It can be seen from Figures 4.16 and 4.17 that there is a significant difference in the calculated ACRs for the different vans without additional ventilation fitted. The test van is clearly the most ventilated van followed by the Vauxhall Vivaro, Ford Transit, and finally the Mercedes Sprinter. From Table 4.9 it can be seen that on average the test van had an ACR that was 5.4 – 7.2 times higher than the Mercedes Sprinter. The ACR for the Vauxhall Vivaro was approximately 3 times as high and the Ford Transit was approximately 2 times higher than the Mercedes at any given wind speed. One reason for the Mercedes’ low ACR is probably the large volume of the van (17.8 m3) combined with air-tight door seals. Despite the Vauxhall Vivaro having good seals, as discussed in Section 5.2, the ACR was still quite high, probably because of the smaller volume of the van (7.4 m3).
5.4 GAS RELEASE MODELLING
5.4.1 General
From Figure 4.20, the ACR required to reduce the volume of the gas release to <0.1 m3 and the gas concentration inside the van to 100%, 50% and 10% of the LEL for different leak scenarios (and leaks rates) was determined. These are summarised in Table 4.11 and are discussed below. The predicted gas concentrations did not always agree with the experimental measurements and this is discussed in Section 5.5.
5.4.2 Case 1 - Acetylene leak rate = 15 l min-1
This is the maximum possible leak rate that one could envisage coming from an acetylene cylinder e.g. with the cylinder valve and torch valves open. At this release rate the leak is highly likely to be audible. The results show that a relatively high ACR would be required to dilute the release down to a safe level. An ACR of greater than 4 ach would limit the gas cloud volume down to below 0.1 m3. Air change rates of greater than 2.9 and 5.9 ach would be required to dilute the average concentration down to below LEL and 50% LEL respectively. About 30 ach would be required to dilute the average concentration down to below 10% LEL.
5.4.3 Case 2 - Acetylene leak rate = 5.7 l min-1
An ACR greater than about 1.3 ach would limit the gas cloud volume Vz to below 0.1 m3. ACRs greater than 1.1 and 2.2 ach would be required to dilute the average concentration down to below LEL and 50% LEL respectively. A wind speed of 5 m s-1 (with vents closed) or a 1.7 m s-1 with the vents open. About 11.4 ach would be required to dilute the average concentration down to below 10% LEL.
5.4.4 Case 3 - Acetylene leak rate = 2.54 l min-1
This leak size has been adopted as an industry standard leak (hole) size for area classification purposes (Ivings et al (2008). In this instance an ACR greater than about 0.54 ach would limit the gas cloud volume Vz to below 0.1 m3. ACRs greater than 0.5 and 1 ach would be required to dilute the average concentration down to below LEL and 50% LEL respectively. Approximately 5 ach would be required to dilute the average concentration down to below 10% LEL.
64
5.4.5 Case 4 - Acetylene leak rate = 0.03 l min-1
For realistic ACRs (greater than 0.1 ach) the gas cloud volume is very small (much smaller than 0.1 m3). Only very low ACRs of 0.0076 and 0.15 ach would be required to dilute the average concentration down to LEL and 50% LEL respectively. Since the lowest measurements of ACR inside the van (lowest ventilation settings) were around 0.2 ach it is highly unlikely that a hazardous concentration of gas will ever occur for such a low release rate.
5.5 GAS RELEASE TESTS (EXPERIMENTAL)
5.5.1 Test vehicle located indoors
Table 4.10 shows that a release of 2.54 l min-1 (produced using the standard leak modelled in case 3, see Table 3.2) of tracer gas at leak position a and with no additional ventilation produced a concentration inside the test vehicle equivalent to the LEL for acetylene (25 ppm of SF6 in the tests) in approximately 1.5 hours at the top and middle positions within the van. The LEL was not reached at the bottom position for the length of the test. This is also shown graphically in Figure 4.18a. With additional rotary ventilators and side vents installed the LEL was still reached at the top and middle positions but approximately 10 minutes later. The measurements still demonstrated stratification and once again, the LEL was not reached at the bottom position.
Using the same release rate at leak position b and with no additional ventilation gave a more uniform gas concentration within the van and the LEL for acetylene was reached in just over 1.5 hours at the top and middle positions and just over 2 hours at the bottom position. With additional rotary ventilators and side vents installed, the LEL was reached at the top and middle positions within approximately 2 hours. The gas showed some stratification and the LEL was not reached at the bottom position during the test.
Using the same release rate of 2.54 l min-1 at leak position c and with no additional ventilation gave a reasonably uniform gas concentration within the van and the LEL for acetylene was reached in approximately 1.5 – 2.5 hours. With additional rotary ventilators and side vents installed the LEL was reached at the top and middle positions within approximately 2.5 hours. The gas showed some stratification and the LEL was not reached at the bottom position during the test.
From Table 4.10, it appears that the experimental concentration measurements are not consistent with the predicted average concentrations within the van. Based on the measured ventilation rates for a van indoors (ranging from about 0.6 to 1.3 hr-1) the average concentration in the van for a release rate of 2.54 l min-1 is not expected to exceed the LEL. (Although with a ventilation rate at the lower end of this range, i.e. with the vents closed, the average gas concentration is expected to approach the LEL). With the side vents and rotary spinners open, giving rise to an air change rate of about 1.3 hr-1, should give an average concentration within the van of approximately 50% of the LEL.
The main reason for the differences in measured gas concentrations and predicted average concentrations in the van is probably due mainly to how the gas was mixed inside the van. Only three point gas concentration measurements were made and it is therefore not clear how well an average of these three values represents the average concentration within the whole van volume. The experiments clearly showed that the gas was stratified within the van with higher concentrations in the middle and top of the van and often significantly lower concentrations at the lowest measurement point. In addition, as well as being stratified vertically it is likely that the gas was also not uniform along the length of the payload area, although this was not investigated.
65
Using a release rate of 14.7 l min-1 of tracer gas at leak position a produced a concentration inside the test vehicle equivalent to the LEL in approximately 13 minutes at the top and middle positions within the van, both with and without any additional ventilation. The LEL was not reached at the bottom position for the length of the test. At this gas release rate, with the rotary ventilators and side vents closed (ACR = 0.7 hr-1) and open (ACR = 1.3 hr-1) a mass balance of gas concentration in the van would indicate that an average concentration in the van of the LEL would be reached within 24 – 27 minutes respectively as shown in Table 4.10.
5.5.2 Test vehicle located outside (exposed)
Table 4.10 shows that at a release rate of 2.54 l min-1, and wind speeds in the range 3.4 to 8 m s-1 the gas concentration inside the van ranged from an equivalent of 0.4 – 56% of the LEL of acetylene (0.1 to 14 ppm of SF6 in the tests) depending on the gas release position, (a or b) the sampling position and whether additional ventilation was used. It should be noted that the value of 56% LEL was high compared to all of the other measurements with the next highest being 18% LEL. This may be because at this gas release position (position b) the gas jet impinged on the floor and spread towards the lowest sampling position. This was with the additional side and rotary vents closed. When the vents were opened the same effect was not observed and in fact the gas concentration at the lowest sampling position was very low. This may be because of air entering through the side vents that rapidly diluted the gas at the lowest sampling position.
It is also apparent from Table 4.10 that the average of the concentrations at the 3 sampling positions was broadly consistent with the calculated values.
5.5.3 Test vehicle located outside (secluded)
Table 4.10 shows that at a gas release rate of 2.54 l min-1 and a wind speed of approximately 1.8 m s-1, the gas concentration ranged from an equivalent of 6 – 44% of the LEL of acetylene (1.5 to 11 ppm of SF6 in the tests) depending on the sampling position and whether additional ventilation was used.
The highest average measured concentration (average of the concentration at the 3 sampling positions) was 31% of the LEL (7.7 ppm) and was obtained with no additional ventilation. An example is shown graphically in Figure 4.18c both with and without the use of additional ventilation. The average of the maximum measured concentrations at the 3 sampling positions was close to the calculated average gas concentrations within the van, as shown in Table 4.10.
For a gas release rate of 14.7 l min-1 the concentration inside the van reached the LEL at all three measurement positions within 22 – 30 minutes with the rotary ventilators and side vents shut. This compares to a predicted time of 28 minutes and a final gas concentration of approximately 200% of the LEL. With the rotary ventilators and side vents open the concentration inside the van was much more stratified, with only the concentration at the upper measurement position reaching the LEL. This occurred 12 minutes into the test. At the middle position, the final concentration equated to about 90% of the LEL (22 ppm of SF6) and at the lowest position only about 4% of the LEL (1 ppm of SF6) was reached. The theoretically predicted maximum concentration was about 40% of the LEL.
5.5.4 Effects of rotary ventilators and side vents
The data suggests that with the rotary ventilators and side vents open, the average concentration inside the van was approximately 40% lower than with the rotary ventilators and vents closed. Note that this is a ‘leaky’ old van and the difference could well be greater in newer more “air tight” vans.
66
6. CONCLUSIONS
6.1 AIR TIGHTNESS TESTS
Pressurisation tests allowed the effective leakage area (ELA) to be calculated. Tests showed that the old test vehicle was considerably ‘leakier’ than the other vans tested with an ELA that was more than double that of the better-sealed vans. The Vauxhall Vivaro and Mercedes Sprinter vans were the best sealed, indicated by the lowest values of ELA.
ELA increased for each van as the ventilation was switched from recirculating to fresh air intake. For the test vehicle, the increase was small at about 10%, increasing to around 40 – 50% for the Vauxhall Vivaro and Mercedes Sprinter vans. Therefore, switching the air inlet vent from recirculating to fresh air intake can significantly increase the van’s ventilation.
From the pressurisation tests, the tightness of the vehicles varied considerably between manufacturers and probably with age.
The tightness of a vehicle is directly related to the air change rate under given conditions.
6.2 TEST VEHICLE LOCATED INDOORS
With the cabin ventilation set to recirculation (mechanical ventilation switched off), the van air change rate without rotary ventilators and side vents was 0.2 air changes per hour. With the rotary ventilators and side vents open, the air change rate increased to 0.62 air changes per hour, increasing the ventilation rate three-fold.
With the cabin ventilation set to fresh air intake (mechanical ventilation switched off), the van air change rate without rotary ventilators and side vents was 0.27 air changes per hour. With the rotary ventilators and side vents open, the air change rate increased to 1.1 air changes per hour, increasing the ventilation rate four-fold.
A release of 2.54 litres per minute of tracer gas inside the test vehicle produced concentrations equivalent to the LEL for acetylene at two or three out of the three measurement locations in approximately 1.5 hours. With rotary ventilators and side vents open the LEL was still reached at two measurement locations, however this took approximately 1.5 to 2.5 hours. These results were independent of the gas release position.
Based on measured air change rates, and contrary to the above measurements, the average gas concentration within the van is calculated to reach approximately 70 – 85% of the LEL if no additional ventilation is fitted. With roof ventilators and side grilles fitted to the van the gas concentration is calculated to reach approximately 30 – 50% of the LEL i.e. the additional ventilation reduces the gas concentration by about half.
A large leak of 15 litres per minute, which could be produced by an acetylene cylinder left open a ¼ of a turn and the torch open, produced a concentration inside the vehicle equivalent to the LEL within 13 minutes at two out of the three measurement locations regardless of whether rotary ventilators and side vents were open or closed. For this
67
release rate, the average gas concentration within the van is calculated to reach the LEL within 24 to 27 minutes depending on whether or not there is additional ventilation.
The above results are based on measurements using the test van, which was found to be ‘leakier’ than newer, better-sealed vans. Therefore, in other vans and for the same gas release rate, higher gas concentrations are expected and the provision of additional ventilation, such as side vents or rotary ventilators will help to reduce the likelihood of flammable concentrations occurring within the van.
6.3 TEST VEHICLE LOCATED OUTSIDE
With the test van parked outdoors, the addition of rotary ventilators and side vents increased the air change rate by a factor of about 3 to 5 depending on the van orientation relative to the wind.
For a gas release rate of 2.5 litres per minute and wind speed in the range 1.5 to 8 m s-1, the average concentration at the three measurement locations inside the van reached between approximately 7 and 30% of the LEL for acetylene. This depended on the location of the van (exposed or sheltered) and the orientation of the van relative to the wind. With additional ventilation, the concentration was between 4 and 13% of the LEL for a similar wind speed range.
Based on the air change rates during the tests with no additional ventilation, the calculated average gas concentration inside the test vehicle would reach approximately 18 to 26% of the LEL for acetylene for the same release rate and range of conditions considered in the experimental tests. With the introduction of additional ventilation, the concentration within the test vehicle would reach approximately 3 to 12% of the LEL. These values are very similar to the experimental gas concentration measurements.
Applying the above experimental gas release rate and wind speed range to the predicted air change rate data for the best-sealed van, the average concentration in the van is estimated to lie between 25 and 160% of the LEL. This is for the vehicle positioned side on to the wind and is likely to be higher for other van orientations.
The experimental data and calculations of average gas concentrations within the test van suggests that across the range of tests considered with the rotary ventilators and side vents open, the average concentration inside the van was reduced by 50% or more. Note that this is a ‘leaky’ old van and the difference should be more significant in a newer better-sealed van.
For a higher gas release rate of approximately 15 litres per minute with the van parked in a sheltered location, the concentration inside the van reached the LEL at all three measurement positions within 22 to 30 minutes with the rotary ventilators and side vents shut. With the rotary ventilators and side vents open the concentration inside the van was much more stratified and only reached the LEL at the top measurement position, although it was reached 12 minutes into the test.
Based on the measured ventilation rate during the test, the calculated average gas concentration in the van reaches the LEL in about 28 minutes with the rotary ventilators and side vents shut. With the rotary ventilators and side vents open the average concentration in the van would be expected to reach a maximum of approximately 40% of the LEL.
68
6.4 GENERAL
For a given release of flammable gas within a van, the average concentration in the van will scale linearly with the reciprocal of the ventilation rate, i.e if the ventilation rate is doubled then the average gas concentration will be halved.
A release of about 2.54 litres per minute of acetylene has been considered in this study to assess the effectiveness of van ventilation for diluting credible releases that may occur from time to time. This leak rate has been chosen based on a standard hole size commonly used in Hazardous Area Classification.
The gas release experiments in the van indicate that the gas is often (but not always) stratified, with concentrations often similar at the top and centre of the van, but usually considerably lower near to the floor. The degree of stratification will depend upon the release position and the induced ventilation rate.
69
7. REFERENCES
Conceição E Z E, Silva M C G, and Viegas D X (1997): Air quality inside the passenger compartment of a bus. J Expos Anal and Env Epid, 7(4), pp 521 – 534.
Etheridge, D. & Sandberg, M. (1996). Building Ventilation: Theory and Measurement, John Wiley & Sons, New York, USA
Fletcher B and Saunders C J. (1994): Air change rates in stationary and moving vehicles. J Hazardous Materials, pp 234 – 25.
Hodges J P (2007): Examination of oxy-acetylene welding equipment and Ford Transit van involved in an explosion at Wolsingham, County Durham. HSL letter report XS/LET/07/17
Knibbs L D, de Dear R J, Atkinson S E (2009): Field study of air change and flow rate in six automobiles. Indoor air, 19, pp 303-313
IEC 60079-10-1. (2008). Electrical apparatus for explosive gas atmospheres. Part 10. Classification of hazardous areas.
IGEM (2010), Hazardous area classification of Natural Gas installations, IGEM/SR/25 Edition 2, Communication 1748, IGEM
Ivings M.J., Clarke S., Gant S.E., Fletcher B., Heather A., Pocock D.J., Pritchard D.K., Santon R. and Saunders C.J., (2008): Area Classification for secondary releases from low pressure natural gas systems. Health and Safety Executive Research Report RR630 http://www.hse.gov.uk/research/rrhtm/rr630.htm
MDHS 82 (1997): The dust lamp: A simple tool for observing the presence of airborne particles. HSE books.
Nakagawa J., Iwashita G., Yoshinami Y., Nagayama H., and Yokoyama Y (2007): Fundamental study on the ventilation rate and VOCs concentration in the car compartment. The 6th International Conference on Indoor Air Quality, Ventilation & Energy Conservation in Buildings IAQVEC 2007, Oct. 28 - 31 2007, Sendai, Japan
Offermann F J, Colfer R, Radzinski P, and Robertson J (2002): Exposure to environmental tobacco smoke in an automobile. Proceedings of the 9th International Conference on indoor air quality and climate. Monterey CA, Paper No 2C3pl.
Ott W., Switzer P and Willits N (1994): Carbon monoxide exposures inside an automobile travelling on an urban arterial highway. J. Air Waste Manage. Assoc. 44: 1010-1018.
Ott, W., Klepeis, N and Switzer, P. (2008): Air change rates of motor vehicles and in-vehicle pollutant concentrations from secondhand smoke, J. Expo. Sci. Environ. Epidemiol, 18, pp 312-325.
Peteresen G A and Sabersky R H (1975): Measurements of pollutants inside an automobile. J Air Pollut. Control Assoc, 25, pp 1028 -1032.
Park J., Spengler J D, Yoon D, Dumyahn T, Lee K, and Ozkayak H (1998): Measurement of air exchange rate of stationary vehicles and estimation of in vehicle exposure. J Expo Anal Environ Epidemiol: 8(1), pp 65–78.

70
Pritchard D K. (2008): Van explosion at Wolsingham: Assessment of a likely acetylene explosion. HSL letter report XS/LET/07/29
Scott A F., Hudda N., Sioutas C and Delfino R J. (2011): Predictive model for vehicle air exchange rates based on a large representative sample. Environ Sci and Technol. pp 3569 – 3575
Webber D.M, Ivings M.J and Santon R C ‘Ventilation theory and dispersion modelling applied to hazardous area classification’ Journal of Loss Prevention in the Process Industries, 24, 612-21, 2011.
Zhang G S, Li T T, Luo M, Lui J F, Liu Z R, and Bai Y H (2008): Air pollution in the microenvironment of parked new cars. Building Environ, 43 315 – 319

Published by the Health and Safety Executive 010/14
Ventilation of vehicles used for carriage of acetylene
Health and Safety Executive
RR1027
www.hse.gov.uk
Following a fatality caused by an acetylene gas explosion involving a van carrying oxy-acetylene welding equipment, HSE commissioned research to investigate foreseeable gas leak rates, vehicle ventilation rates and possible vehicle modifications that would increase the ventilation rate and hence help to mitigate the explosion risk.
The experimental and modelling study showed that older vans are likely to be considerably leakier that newer better sealed vans. A five-fold increase in ventilation rate was predicted between the best and worst sealed vans tested.
For a small gas leak, which is likely to be emitted from a poorly fitting joint or a small hole in a pipe, indications were that for a medium sized transit van, air change rates greater than about 1 hr-1 will lead to gas concentrations typically less than 50% of the lower explosion limit (LEL) for acetylene. The ventilation rate required increases to 6 air changes per hour for larger leaks, such as those produced by a leaking cylinder valve.The minimum wind speed required to generate these ventilation rates fell significantly with the introduction of roof ventilators and side vents.
This report and the work it describes were funded by the Health and Safety Executive (HSE). Its contents, including any opinions and/or conclusions expressed, are those of the authors alone and do not necessarily reflect HSE policy.