clincancerres.aacrjournals.orgclincancerres.aacrjournals.org/content/suppl/2015/05/15/... · web...
TRANSCRIPT

Supplemental Information
MEK inhibitor PD-0325901 overcomes resistance to PI3K/mTOR inhibitor PF-5212384
and potentiates anti-tumor effects in human head and neck squamous cell carcinoma
Suresh Mohan1,2,4, Robert Vander Broek1,2,4, Sujay Shah1, Danielle F. Eytan1,2, Matthew L.
Pierce1,3, Sophie G. Carlson1, Jamie F. Coupar1, Jialing Zhang1, Hui Cheng1, Zhong Chen1*, and
Carter Van Waes1*
1Tumor Biology Section, Head and Neck Surgery Branch, National Institute on Deafness and
Other Communication Disorders, NIH; 2NIH Medical Research Scholars Program; Bethesda,
MD, USA; 3Department of Otolaryngology–Head and Neck Surgery, Georgetown University
Hospital, Washington, DC, USA; 4Both authors contributed equally to this work.
*Corresponding author: Carter Van Waes, MD, PhD, NIDCD/NIH, Building 10/CRC, 4-2732,
10 Center Drive, Bethesda, MD 20892. Email: [email protected]. Phone: 301-402-4216.
Fax: 301-402-1140. Or Zhong Chen, MD, PhD, NIDCD/NIH, Building 10/5D55, 10 Center
Drive, Bethesda, MD 20892. Email: [email protected]. Phone: 301-435-2073. Fax: 301-596-
4643.
1
Supplemental Table 1. Tumor, treatment, and outcome characteristics of human HNSCC lines ____________________________________________________________________________________________________________Cell line Age Sex Stage TNM Primary site Prior Tx Status Survival (M) ------------------------------------------------------------------------------------------------------------------------------------------------------------------
HPV (-) PIK3CA wt UM-SCC 1 72 M I T1N0M0 FOM R DWOD 15UM-SCC 6 37 M II T2N0M0 BOT N LTFUM-SCC 9 72 F II T2N0M0 Anterior tongue R DOD 15UM-SCC 11A 65 M V T2N2aM0 Epiglottis N DOD 14 UM-SCC 11B Persistent Supraglottic C
disease LarynxUM-SCC 22A 59 F III T2N1M0 Hypopharynx N DOD 10UM-SCC 22B Metastasis LN metastasis NUM-SCC 38 60 M IV T2N2aM0 Tonsillar pillar N DOD 11UM-SCC 46 57 F III NA Larynx R, S DOD 6UM-SCC 74A 50 M III T3N0M0 BOT R, C, S DOD 14UM-SCC 74B Recurrence Intraoral S, C
HPV (-) PIK3CA (H1047R mt) CAL-33 69 M NA NA Anterior Tongue NA DOD 13Detroit562 NA F IV Metastasis Pharynx NA NA NA
HPV (+) PIK3CA wtUM-SCC 47 53 M III T3N1M0 Lateral tongue N NA 8 UM-SCC 104 56 M IV T4N2BM0 Anterior FOM S,S,C,R DOD 24UM-SCC 105 50 M IV T4N0M0 Larynx N NED NAUPCI-SCC-90 46 M III T2N1M0 BOT N DOD 22UPCI-SCC-152 47 M (recurrence UPCI-SCC-90) SUPCI-SCC-154 54 M IV T4N2 BOT N LTFUD-SCC-2 58 M IV T1N3M0 Hypopharynx NA DOD NA93VU147T 58 M IV T4N2M0 FOM NA NA NA_______________________________________________________________________________________________________
2

Genotype verified UM-SCC, UPCI, UD-SCC-2, and 93VU lines were kindly provided by Drs. Thomas E Carey with permission of
originating scientists, and characteristics are as described from previous supplementary references (1-4). Cal33 and Detroit562 lines
were provided by Dr. J. Silvio Gutkind, National Institute of Dental and Craniofacial Research. Abbreviations: UM, University of
Michigan; UPCI, University of Pittsburgh Cancer Institute; UD, University of Dusseldorf; VU, Vrije University, Amsterdam; TNM,
tumor-node-metastasis (staging system); Primary site, origin of the primary tumor. Prior therapy, therapy given before the specimen
used for culture was obtained. Survival, time in months from diagnosis to last follow up. FOM, floor of mouth; BOT, base of tongue;
LN, lymph nodes; R, radiation; S, surgery; C, chemotherapy; N, no treatment; DOD, died with disease; DWOD, died without disease.
LTF, lost to follow-up; NED: no evidence of disease; AWD: alive with disease; wt, mt: wildtype, mutant; NA: not available.
3

Supplementary Figure 1
Supplementary Figure 1. Boxplots of IC50s for 11 HPV- cell lines (red) and 8 HPV+ lines (cyan;
Supplementary Table 1). IC50 levels were significantly higher for most HPV- cell lines relative
to HPV+ lines, P-value = 0.021 by two sample t-test (Supplementary Methods). Dark horizontal
lines represent the median, with the box representing the 25th and 75th percentiles. The whiskers
indicate the lowest datum still within 1.5 interquartile range (IQR) of the lower quartile, and the
highest datum still within 1.5 IQR of the upper quartile, and outliers represented by dots that are
either 3 × IQR or more above the top box (third quartile) or 3 × IQR or more below the bottom
box (first quartile).
4

Supplemental Figure 2
Supplementary Figure 2. PF-384 effects on PI3K/mTOR, and MAPK/ERK pathways in
UMSCC-46. UMSCC-46 cells were treated with 200nM PF-384 or 0.01% DMSO as a control,
and cell lysates were obtained 6, 12, 24 and 48 hours after treatment. Half way prior to
collection, 20 ng/mL TNF-α was added to the corresponding plates. Western blots were
performed on harvested whole cell lysates, and the blots were visualized on the Odyssey Imaging
System using Odyssey Image Studio Software (Li-Cor) or using enhanced chemoluminescence
(ECL). Protein bands were quantified relative to the corresponding untreated control and beta-
actin loading control.
5

Supplemental Figure 3
Supplementary Figure 3 PF-384 effects on IKK-dependent phosphorylation of NF-B p65
protein in UM-SCC-1 and 46. Cells were treated with 200nM PF-384 or 0.01% DMSO diluent
in media as a control for 6, 12, 24 and 48 hours, and midway to collection, TNF-α (20 ng/mL) or
control diluent was added. Western blots were performed on harvested whole cell lysates, and
the blots were visualized on the Odyssey Imaging System using Odyssey Image Studio Software
(Li-Cor) or using enhanced chemoluminescence (ECL). Protein bands were quantified relative to
the corresponding untreated control and beta-actin loading control.
6

Supplementary Figure 4
Supplementary Figure 4. Effects of PIK3CA knockdown on PI3K-AKT pathway and NF-
B signaling in UMSCC-1 and 46. UMSCC-1 and 46 cells were transiently transfected with
PIK3CA and control siRNA for 72 hours, and RNA were harvested. PIK3CA expression was
measured by quantitative RT-PCR, and 18s was used as a control. (A) PIK3CA siRNA
significantly reduced PIK3CA expression as compared with control siRNA. (B) UMSCC-1 and
46 were transiently transfected with PIK3CA siRNA, and whole cell lysates were harvested at 72
hours after transfection. PIK3CA siRNA significantly decreased protein expression and
7

phosphorylation of molecules in PI3K-AKT pathway. Beta-actin was used as the control. *p <
0.05. Error bars: SD.
8

Supplementary Figure 5
Supplementary Figure 5. Effects of PF-384 and PD-901 treatment on weights of mice
bearing UMSCC-1 xenografts. 5x10⁶ UMSCC-1 cells were implanted s.c. into the right hind
flanks of SCID/NCr-Balb/c mice. Tumors were palpable 12 days post-inoculation and mice were
randomized into one of four treatment groups (vehicle control n=18, 10 mg/kg PF-384 Q4D
n=18, 1.5 mg/kg PD-901 QD n=19, or Combination, n=19) and treated for a period of 21 days,
as shown. The trend in limited weight gain among mice treated with PD901 alone or in
combination did not reach statistical significance. Error bars: SEM.
9

Supplementary Figure 6
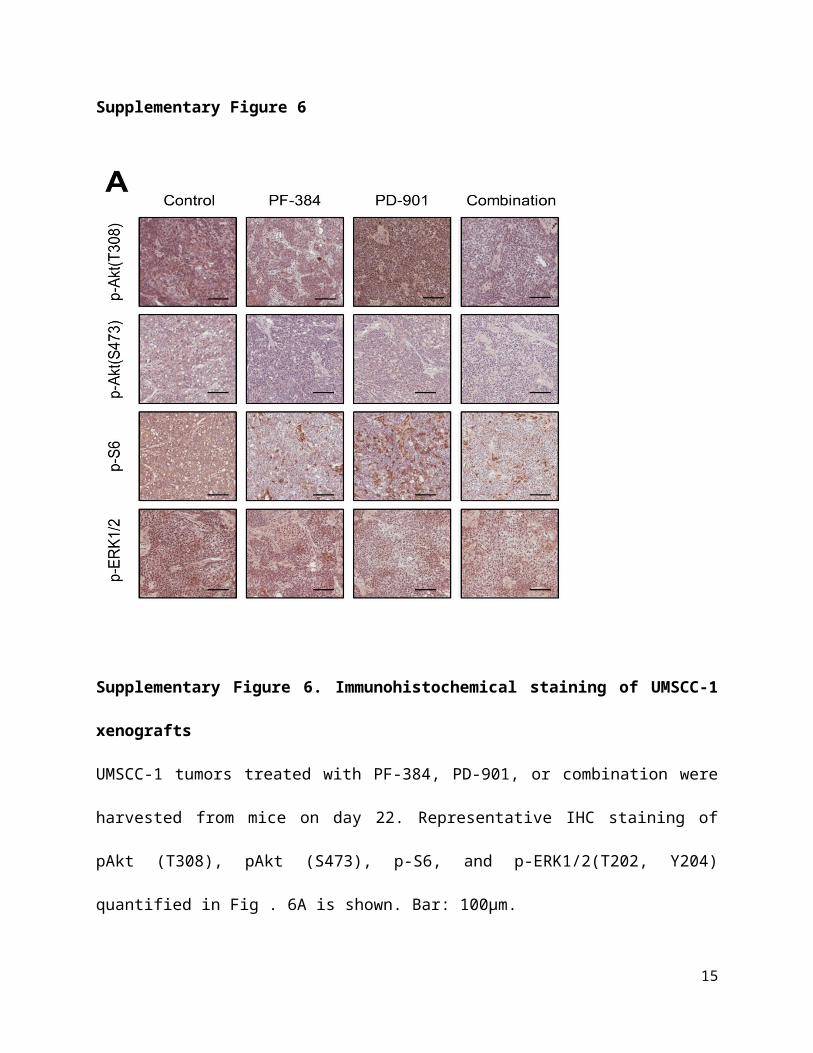
Supplementary Figure 6. Immunohistochemical staining of UMSCC-1 xenografts
UMSCC-1 tumors treated with PF-384, PD-901, or combination were harvested from mice on
day 22. Representative IHC staining of pAkt (T308), pAkt (S473), p-S6, and p-ERK1/2(T202,
Y204) quantified in Fig . 6A is shown. Bar: 100µm.
10

Supplementary Figure 7
Supplementary Figure 7. Schematic of PI3K/Akt/mTOR and MEK/ERK pathways and
targets of PF-384 and PD-901
Model of known components of Growth Factor Receptor, PI3K/AKT/mTOR and MEK-ERK
pathways and targets of PF-384 and PD-901. PF-384 inhibits PI3K and mTORC1/2, and PD-901
inhibits MEK activation of ERK, (red lines). Activating (arrows) and inhibitory (blocking)
signals implicated in the PI3K/mTOR and MEK/ERK pathway signaling. Cross-talk between the
pathways may promote co-activation. Direct and cross-signaling between pathways leads to the
transactivation of transcription factors NF-κB and AP-1, as well as enhanced translation of
cytokines IL-8 and VEGF. Each pathway has broad downstream effects that promote cell
growth, proliferation, and survival.
11

Supplemental Materials and Methods
Cell lines and cell culture
The origin of the HNSCC cell lines (Supplemental Table 1) were authenticated by
genotyping using the Profiler Plus PCR Amplification Kit (Invitrogen, Carlsbad, California,
USA) in accord with the manufacturer’s protocol. The 10 loci D3S1358, D5S818, D7S820,
D8S1179, D13S317, D18S51, D21S11, FGA, vWA, and AMEL were analyzed as described (1-
4), and preserved in frozen stocks that were used within 3 months of culture. HPV- UM-SCC
lines were maintained in MEM (Gibco, Carlsbad, CA) supplemented with 10% fetal calf serum
(Gibco), 1% penicillin/streptomycin (Gibco), and 1% L-glutamine (Gibco). Detroit-562 and
CAL-33 were maintained in DMEM (Gibco) supplemented with 10% fetal calf serum (Gibco)
and 1% antibiotic antimycotic solution (#5955, Sigma Aldrich, St. Louis, MO). Cultures were
incubated at 37° C with 5% CO2. HPV+ cell lines UD-SCC-2 and 93VU147T were cultured in
MEM (Invitrogen, Carlsbad, CA) containing 10% FCS (Sigma, St Louis, MO), 2 mM glutamine
(Invitrogen), 0.1 mM MEM nonessential amino acids (Invitrogen) and 0.005% gentamycin. The
remaining cell lines were cultured in DMEM (Invitrogen) containing the same additives as
described above.
Therapeutic agents
PF-384 was resuspended to a stock solution of 1 mM in dimethyl sulfoxide (DMSO)
(Sigma Aldrich, St. Louis, MO) for in vitro experiments and formulated at 1 mg/mL in 0.25%
lactic acid/5% dextrose to deliver 10 mg/kg for in vivo experiments. PD-901 was resuspended at
1 mM stock in DMSO for in vitro studies and formulated in 0.5% Hydroxypropylmethylcellulose
12

(Sigma Aldrich) and 0.2% Tween-80 (Sigma Aldrich) in water for 1.5 mg/kg delivery for in vivo
studies.
Reagents, antibodies, and plasmids
Recombinant human TNF-α is from R&D Systems (#210-TA, Minneapolis, MN) and
WST-1 Cell Proliferation Reagent is from Roche (#11644807001, Indianapolis, IN). Primary
antibodies for immunoblotting were diluted at 1:1000 in Odyssey blocking buffer (Li-Cor
Biosciences, Lincoln, NE). Antibodies purchased from Cell Signaling Technology (Danvers,
MA) include: phopho-Akt Ser473 (#4060S), phospho-Akt Thr308 (#2965S), pan Akt (#2920S),
phospho-S6 Ser240/244 (#2215S), Ribosomal S6 (#2217S), PI3K p110α (#4249S), phospho-NF-
κB p65 (#3033S), NF-κB p65 (#3034), phospo-ERK1/2 Thr202/Tyr204 (#4370) and ERK1/2
(4695). Anti-actin (#MAB1501) was diluted at 1:5000 and purchased from EMD Millipore
(Billerica, MA). Goat anti-mouse (#926-32210) and goat anti-rabbit (#926-68071) IRDye
secondary antibodies were diluted at 1:5000 in Odyssey blocking buffer and purchased from Li-
Cor Biosciences.
For immunohistochemistry, primary antibodies used were the same as listed above at
1:50 dilution in 3% bovine serum albumin (A9418, Sigma Aldrich)/phosphate-buffered saline
(10010023, Gibco). Additionally, phospo-ERK1/2 (sc-16982-R, Santa Cruz Biotech, Santa
Cruz, CA), CD31 (550274, BD Biosciences, San Jose, CA) and Ki-67 (#9027, Cell Signaling
Technology) were used for IHC. Biotinylated Goat Anti-Rabbit, or Goat Anti-Mouse IgG (#BA-
1000, -9200 Vector Laboratories, Burlingame, CA) were used as secondary antibodies at 1:100
dilution in 3% BSA/PBS solution.
13

The luciferase reporter plasmid with 5xNF-κB consensus binding sites was purchased
from Stratagene (La Jolla, CA). The luciferase plasmids containing IL-8 promoter sequence
with serial deletions or point mutations were generously provided by Dr. Naofumi Mukaida
(Kanazawa University, Kanazawa, Japan). The AP-1 luciferase reporter was obtained from Dr.
Nancy Colburn (National Cancer Institute, Bethesda, MD).
XTT cell proliferation assay
UMSCC cells were plated in 96-well plates at predetermined densities for each cell line
based on respective doubling times and log-phase growth patterns after 96 hours. After 24 hours
for cell attachment, cells were treated with 0.01% DMSO control or one of nine concentrations
of PF-384 (1, 10, 25, 50, 100, 250, 500, 1000, and 5000 nM). 72 hours after treatment, cell
density was measured by sodium 3’-[1-(phenylaminocarbonyl)-3,4-tetrazolium]-bis (4-methoxy-
6-nitro) benzene sulfonic acid hydrate (XTT) Cell Proliferation Kits (Roche #11465015001) at
450 nm with 570 nm wavelength correction on a µQuant Microplate Reader (Bio-Tek
Instruments, Winooski, VT). Each cell line and dilution was assayed in six replicates and data
are presented as the mean +/- standard deviation.
Flow cytometric analysis of cell cycle and apoptosis
UMSCC cells were plated in 15 cm2 plates and allowed to adhere overnight. Over the
following 24, 48, and 72 hours, cells were treated with 0.01% DMSO control or 200 nM PF-384.
For cell cycle analysis, cells were harvested, counted, and stored in Cycletest Plus DNA Reagent
Kit buffer (BD Biosciences #340242). Thirty minutes to one hour prior to analyzing on a FACS
14
Canto flow cytometer (BD, Franklin Lakes, NJ), cells were stained with propidium iodide
according to manufacturer’s instructions.
Transient siRNA transfection
SMARTpool ON-TARGETplus PIK3CA (#L-003018), AKT1 (#L-003000), or Non-
Targeting pool (#D-001810) siRNA (Thermo Scientific, Lafayette, CO) were complexed with
Lipofectamine RNAiMAX transfection reagent (Invitrogen, Carlsbad, CA) at 80 pmol/well for
6-well plates, 20 pmol/well for 24-well plates, and 3 pmol/well for 96-well plates in Opti-MEM
reduced-serum media (Invitrogen) per manufacturer’s instructions. UMSCC cells were reverse
transfected at 1.5 x 10⁵ cells/well for 6-well plates, 5 x 10⁴ cells/well for 24-well plates, and 7.0 x
103 cells/well for 96-well plates, and cultured for 72 hours in 2 mL, 500 uL, or 100 uL of
antibiotic-free MEM media per well, respectively.
Real-time quantitative polymerase chain reaction
RNA isolation was performed on cells in log phase growth using the RNeasy Mini Kit
from Qiagen (Santa Clarita, CA) according to manufacturer’s instructions. cDNA synthesis was
performed using the High-capacity cDNA Reverse Transcription Kit from Applied Biosciences
(Foster City, CA) according to manufacturer’s instructions. TaqMan Gene Expression RT-PCR
primers and probes were synthesized by Applied Biosystems (#4331182, PIK3CA
Hs00907957_m1, AKT1 Hs00178289_m1, 18S Hs03003631_g1, IL-8 Hs00174103_m1, Human
TNF-α Hs99999043_m1). Amplification was carried out using 30 ng of cDNA combined with
primers and TaqMan Univeral Master Mix (Applied Biosystems) in an ABI Prism 7700
15

Sequence Detection System (Applied Biosystems). Enzymes were activated for 2 minutes at 50°
C and 10 minutes at 95° C, followed by 40 cycles of 15 seconds at 95° and 1 minute at 60° C.
Luciferase gene reporters
UMSCC-1 or -46 cells were plated in triplicate into 24-well plates at a density of 5 x 10⁴
cells per well in 500 uL of MEM media without antibiotics. For assays using PIK3CA and AKT1
siRNA knockdown, oligonucleotides were reverse transfected into UMSCC cells at the time of
plating using Lipofectamine RNAiMAX tranfection reagent and Opti-MEM reduced-serum
media from Invitrogen (Carlsbad, CA), following manufacturer’s instructions. The next day,
cells were transfected for five hours with Lipofectamine 2000 (Invitrogen) containing 0.3 µg
reporter plasmid/well in Opti-MEM media. Following reporter transfection, cells were exposed
to fresh media with 0.01% DMSO or 50, 100, or 200 nM PF-384 for 48 hours. In conditions of
TNF-α stimulation, cells were exposed to TNF-α 16 hours prior to final collection. One hour
prior to final collection, 10% WST-1 reagent was added to each well and colorimetric
quantification was performed at 450-570 nm on a Bio-Tek spectrophotometer. Cell lysates were
harvested with Applied Biosystems Tropix Lysis Solution (#T2074). Reporter activity was read
on a Wallac VICTOR2 1420 Multilabel Counter (Perkin Elmer, Waltham, MA) using the
Applied Biosystems Dual-Light System (#T1003, T1004, T1005) for combined detection of
firefly luciferase and β-galactosidase. Luciferase activity was adjusted to β-galactosidase and
WST-1, though all the data presented are WST-1 normalized.
Western blots
16

For immunoblots with siRNA knockdown, whole cell lysates were collected 72 hours
after siRNA transfection. For immunoblots with PF-384 treatment, UMSCC cells were plated
and allowed to adhere overnight. The following day, 200 nM PF-384 or 0.01% DMSO was
added to the culture media. 3, 6, 12, and 24 hours after PF-384 treatment (corresponding to 6,
12, 24, and 48 hour timepoints), 20 ng/mL TNF-α was added to half of the plates. For whole cell
lysate collection, UMSCC cells were collected at 70-80% confluence and lysed in NP-40 buffer
(Invitrogen #FNN0021) supplemented with 1% Halt protease inhibitor (#1860932) and 1% Halt
phosphatase inhibitor (#78428) cocktails from Thermo Scientific (Waltham, MA). Lysates were
vortexed, sonicated, centrifuged, and frozen at -80° C prior to use. Protein quantitation was
performed using the Pierce BCA Protein Assay Kit (#23227) according to manufacturer’s
instructions (Thermo Scientific). 25 micrograms of each sample was denatured and loaded into
4-12% gradient Bis-Tris gels (Invitrogen). Gels were then inserted into an XCell surelock Mini-
Cell (Invitrogen) and run at 150V for approximately 1.5 hours. Following electrophoresis,
proteins were transferred for 6 minutes to PVDF membranes using the Invitrogen iBlot system,
according to the manufacturer’s standard protocol. Membranes were blocked for one hour in
Odyssey blocking buffer (Li-Cor) and primary antibodies were prepared as outlined previously.
Secondary goat antibodies carrying an infrared dye were prepared as previously described, and
incubated for 30 minutes to 1 hour. The signal was subsequently visualized on the Odyssey
Imaging System (Li-Cor) using Odyssey Image Studio Software (Li-Cor). For HRP conjugated
secondary antibodies, we used enhanced chemiluminescence (ECL) with SuperSignal West Dura
Extended Duration Substrate (#34075, Thermo Scientific) exposure for 30 seconds prior to
developing with Blue Sensitive X-ray Film (#DBMFB57, Dbio, College Park, MD).
17

Enzyme-linked immunosorbent assay
UMSCC cells were plated at 200,000 cells per well in 6-well plates and allowed to adhere
overnight. The following day, cells were treated with 200 nM PF-384, 100 nM PD-901, both, or
0.01% DMSO control. 16 hours prior to harvest, half of the wells were treated with 20 ng/mL
TNF-α. At 24 and 48 hours post-drug treatment, conditioned media was collected and cells were
counted for each treatment condition. Conditioned media was then centrifuged and supernatant
was aliquoted and frozen at -80° C for later use in ELISAs. Samples were diluted in appropriate
calibrator diluent at 1:2 for IL-8. VEGF conditioned media was undiluted. Samples were then
incubated on pre-coated plates according to the instructions in Quantikine IL-8 (#D8000C) and
VEGF (#DVE00) Immunoassay kits from R&D Systems (Minneapolis, MN). Colorimetric
quantitation was performed at 450-570 nM on microplate spectrophotometer. Experiments were
performed in triplicate, samples were assayed in triplicate, and data is presented as the mean
normalized to cell number +/- standard deviation.
HNSCC xenograft and immunohistochemistry studies
5 x 10⁶ UMSCC-1 or -46 cells were injected subcutaneously in 0.2 mL blank MEM
media, and tumors became palpable 10-14 days post-inoculation. The mice were randomized into
different treatment groups based on tumor sizes. PF-384 was formulated at 1 mg/mL in 5%
dextrose/0.25% lactic acid solution and dosed for three weeks on a Tuesday/Friday schedule in
0.2 mL tail vein injections. PD-901 was formulated at 0.16875 mg/ml in 0.5%
Hydroxypropylmethylcellulose/0.2% tween-80 and dosed once daily for 21 days in 0.2 ml oral
gavages. Tumor diameters were measured three times a week in two dimensions using electronic
calipers, and tumor volume was calculated using V= 0.5 (L x W x W).
18

Immunohistochemical analyses of tumors
For immunohistochemistry studies, tumors were harvested and embedded in optimal
cutting temperature (O.C.T.) compound for cryosectioning, and snap-frozen for analysis of
molecular markers. Terminal deoxyribonucleotidyl transferase-mediated dUTP nick end labeling
(TUNEL) assay was performed on paraformaldehyde-fixed tissue sections per manufacturer
directions using the in situ cell death detection kit (#11684817910, Roche).
Immunohistochemical staining and quantification of slides with tumor from control or drug-
treated mice were performed using a previously described method (Herzog 2013).
Tissue lysis for RT-PCR RNA isolation
UMSCC-1 xenograft tumors were homogenized using the Tissue Lyser II (Qiagen). 30
mg sections of frozen tumor were disrupted with 5 mm steel beads at 30 Hz for 5 minutes before
proceeding to RNA isolation as described above.
Statistical analysis for comparison of HPV- and HPV+ sensitivity to PF-384
The statistical analyses were conducted using R version 3.0.3 software (The R Foundation for
Statistical Computing) (5). To compare IC50 level for PF384 between HPV- and HPV+ lines,
the boxplots (6) were created and used for depiction of group difference and identification of
outliers. The difference of IC50 between HPV- and HPV+ lines was analyzed using two sample
t-test assuming unequal variance. P values of less than 0.05 were considered statistically
significant.
19

References
1. Brenner JC, Graham MP, Kumar B, Saunders LM, Kupfer R, Lyons RH, et al.,
Genotyping of 73 UM-SCC head and neck squamous cell carcinoma cell lines. Head
Neck. 2010;32:417-26.
2. Zhao M, Sano D, Pickering CR, Jasser SA, Henderson YC, Clayman GL, Sturgis EM,
Ow TJ, Lotan R, Carey TE, Sacks PG, Grandis JR, Sidransky D, Heldin NE, Myers JN.
Assembly and initial characterization of a panel of 85 genomically validated cell lines
from diverse head and neck tumor sites. Clin Cancer Res. 2011;17:7248-64.
3. Olthof NC, Huebbers CU, Kolligs J, Henfling M, Ramaekers FC, Cornet I, van Lent-
Albrechts JA, Stegmann AP, Silling S, Wieland U, Carey TE, Walline HM, Gollin SM,
Hoffmann TK, de Winter J, Kremer B, Klussmann JP, Speel EJ. Viral load, gene
expression and mapping of viral integration sites in HPV16-associated HNSCC cell
lines. Int J Cancer. 2015 Mar 1;136(5):E207-18.
4. Owen JH, Graham MP, Chinn SB, Darr OF, Chepeha DB, Wolf GT, Bradford CR,
Carey TE, Prince ME. A novel method of cell line establishment utilizing fluorescence-
activated cell sorting resulting in six new head and neck squamous cell carcinoma lines.
Head Neck. 2015 Feb 9. doi: 10.1002/hed.24019. [Epub ahead of print]
5. R Core Team (2014). R: A language and environment for statistical computing. R
Foundation for Statistical Computing, Vienna, Austria. ISBN 3-900051-07-0, URL
http://www.R-project.org/.
6. Wickham, H. (2009). ggplot2: elegant graphics for data analysis. New York, Springer.
20