virtual inertia from ups systems - lut
TRANSCRIPT

Lappeenranta University of Technology
Degree Program in Electrical Engineering
Matias Hansson
VIRTUAL INERTIA FROM UPS SYSTEMS
Examiners : Professor Samuli Honkapuro
Professor Pertti Silventoinen
Supervisors: Professor Samuli Honkapuro
Professor Pertti Silventoinen
Application Engineer Juha Ulvinen

ii
TIIVISTELMÄ
Sähköverkot ovat hiljalleen muuttumassa ja siirtymässä kohti tehoelektroniikka-liitäntäistä
sähköntuotantoa, joka johtuu siirtymisestä kohti uusiutuvia energialähteitä. Tämä muutos
aiheuttaa generaattoreiden pyörivien massojen korvaamisen tehoelektroniikalla, mikä
aiheuttaa sähköverkon inertian pienentymisen. Tämä johtaa herkästi taajuusvaihteluihin
tilanteissa, joissa tuotanto ja kulutus eivät ole täysin tasapainossa ja nopeille häiriöreserveille
tulee entistä enemmän tarvetta. Työn tarkoitus on analysoida UPSien käyttömahdollisuuksia
korvaamaan poistuvaa inertiaa virtuaalisella inertialla.
Tätä varten eri sähköverkkojen taajuusdataa on analysoitu ja verrattu UPSien tekniseen
suorituskykyyn. Työn perusteella voidaan todeta, että moderni UPS on teknisiltä
ominaisuuksiltaan käytettävissä virtuaalisen inertian tuottamiseen ja yleisimmin käytetyt
energiavarastot ovat siihen soveltuvia kapasiteetiltaan ja ominaisuuksiltaan. Kehitystarpeet
koskevat pääasiassa UPS-ohjelmistoa ja virtuaalisen inertian algoritmin kehittämistä.
Työssä analysoiduissa sähkömarkkinoissa ei ole virtuaalisen inertian markkinatuotetta,
mutta vastaavia nopeita häiriöreservejä verrataan ja niiden perusteella arvioidaan
virtuaalisen inertian ominaisuuksia ja kompensaatiorakennetta. Liiketaloudellinen arvio
inertiatuotteen käyttöönoton kannattavuudesta tehdään perustuen vastaaviin
häiriöreserveihin.
UPS-laitteiden sekundäärikäyttö virtuaalisen inertian tuottamiseen on liiketaloudellisesti
houkutteleva mahdollisuus UPS-laitteen omistajalle. Vuosittaiset aktivoinnit ovat
lukumäärältään pieniä ja niiden kesto on hyvin lyhyt. Tämän takia UPSin akuston
kokonaiskapasiteettiin nähden purkaustehot ovat pieniä ja kriittiselle kuormalle aiheutuvat
riskit ovat pienet. Suurimmat riskit johtuvat ohjelmiston kasvavasta monimutkaisuudesta,
mutta riskit voidaan minimoida kattavalla esitestauksella.

iii
ABSTRACT
The electrical networks are changing globally towards an increasingly converter-connected
power generation caused by the shift towards renewable energy sources. This will lead to
the rotating masses of the network to be replaced by static power electronics which contain
no rotating inertia. The electrical grids will become increasingly sensitive to imbalances
between the generation and consumption. The need for fast acting frequency reserves will
increase in the future. The goal of this thesis is to analyze the potential of dual-purposing
UPSs to provide virtual inertia to the electrical grid.
To determine this technical possibility the frequency data of different geographical grids
were analyzed and compared to the technical capabilities of modern bi-directional double
conversion UPSs. The UPS hardware is found the be technically capable of providing the
frequency response and the commonly used battery solutions are viable options. The
development needs are mainly software based and the inertia algorithm will need to be
developed to the UPS.
The current fast frequency response services are compared for different grids and the virtual
inertia product requirements are estimated based on other similar services. A business case
for the potential benefits and risks for the UPS owner is presented with calculations for
earnings potential, and activation times and durations per year for different parameters of
the virtual inertia algorithms.
The calculations show that it is financially interesting for the owner of the UPS device to
participate in the virtual inertia market. The activation times during a year are very limited
and compared to the total available battery capacity for a normal UPS system, the discharged
capacity during a frequency event is extremely low. The risks for the critical load are mainly
related to the increased complexity of the UPS software. A thorough testing of all possible
scenarios during a frequency event is required, as well as making sure that the UPS will in
all situations prioritize protecting the critical load.
1
TABLE OF CONTENTS
1 INTRODUCTION ............................................................................................ 5
1.1 OBJECTIVE OF THE THESIS ....................................................................................... 5
1.2 STRUCTURE OF THE THESIS ..................................................................................... 6
2 GRID INERTIA AND FREQUENCY STABILITY ........................................... 7
2.1 ROTATING MACHINES AND INERTIA ........................................................................ 8
2.2 NORDIC ELECTRICAL NETWORK ............................................................................ 11
2.3 RENEWABLE ENERGY SOURCES ............................................................................. 13
2.4 CRITICAL LEVELS OF INERTIA ............................................................................... 15
2.5 FREQUENCY STABILITY IN DIFFERENT GEOGRAPHICAL POWER GRIDS ................... 17
2.6 PREDICTION ON FUTURE INERTIA LEVELS .............................................................. 21
3 VIRTUAL INERTIA RESPONSE FROM UPS SYSTEMS ............................. 23
3.1 DOUBLE CONVERSION UPS ................................................................................... 23
3.2 REQUIREMENTS FOR THE UPS ELECTRONICS ........................................................ 25
3.3 UPS-AS-A-RESERVE ............................................................................................. 26
3.4 VIRTUAL INERTIA ALGORITHMS ............................................................................ 28
3.4.1 Measuring RoCoF ............................................................................................ 28 3.4.2 Droop control .................................................................................................. 32
3.4.3 Derivative control ............................................................................................ 35 3.4.4 Combination of droop and derivative control ................................................. 36 3.4.5 SM emulation control ....................................................................................... 36
3.5 ENERGY STORAGES ............................................................................................... 38
3.5.1 Batteries ........................................................................................................... 38 3.5.2 Supercapacitors ............................................................................................... 40 3.5.3 Required battery capacity and impact on batteries from virtual inertia ......... 42
4 ELECTRICITY MARKET AND FAST RESPONSE PRODUCTS .................. 44
4.1 FREQUENCY RESPONSE MONITORING .................................................................... 44
4.2 ENHANCED FREQUENCY RESPONSE ....................................................................... 45
4.3 FAST FREQUENCY RESPONSE ................................................................................ 46

2
5 BUSINESS CASE ........................................................................................... 49
5.1 PRODUCT DEVELOPMENT REQUIREMENTS ............................................................. 49
5.2 VIRTUAL INERTIA PRODUCT .................................................................................. 51
5.3 RETURN POTENTIAL .............................................................................................. 52
5.4 RISKS FOR THE CRITICAL LOAD ............................................................................. 56
6 SUMMARY AND CONCLUSIONS ................................................................ 59
REFERENCES ...................................................................................................... 61

3
Abbreviations and Acronyms
AC Alternating Current
AEMO Australian Energy Market Operator
BESS Battery Energy Storage Solutions
CAN Controller Area Network
COCOMO Constructive Cost Model
DC Direct Current
DQ Direct quadrature
EDLC Electrochemical Double Layer Capacitors
ENTSO-E European Network of Transmission System Operators
EU European Union
FCAS Frequency Control Ancillary Services
FCR Frequency Containment Reserve
FCR-D Frequency Containment Reserve for Disturbances
FCR-N Frequency Containment Reserve for Normal Operation
FFR Fast Frequency Response
FRR Frequency Restoration Reserve
HV High Voltage
HVDC High Voltage Direct Current
IGBT Insulated Gate Bipolar Transistor
Li-Ion Lithium Ion
LV Low Voltage
PV Photovoltaic
PLL Phase locked loop
PWM Pulse Width Modulated
RES Renewable Energy Source
RoCoF Rate of Change of Frequency
SG Synchronous Generator
SM Synchronous Machine
TSO Transmission System Operator
UPS Uninterruptible Power Supply
UPSaaR UPS-as-a-Reserve
VIE Virtual Inertia Emulation
VRLA Valve Regulated Lead-Acid
VSC Voltage Source Converter

4
Symbols
𝐷p Droop slope
H Inertia constant
𝐻i Inertia of a single machine
𝐻sys Total system inertia
J Inertia of the machine
𝑘𝑎 Proportional gain
Kd Damping constant
p Converter output power
𝑝∗ Power setpoint
𝑝 Measured power with Low-Pass Filter
𝑝emulate Derivative control output power
𝑆𝑛 Rated power of the machine
𝑆Ni Rated power of machine i
𝑆𝑛𝑠𝑦𝑠 Base power for the system
𝜔𝑛 Rated nominal angular speed of the rotor
𝜔 Angular frequency
𝜔 ∗ Angular frequency setpoint
𝜔c Cutoff angular frequency
∆𝜔𝑛 Change of frequency
∆𝑃L Load change
∆𝑃i Power of individual machine
5
1 INTRODUCTION
The energy system is changing rapidly, and this development will accelerate in the near
future because of the need to decrease CO2 emissions and the usage of fossil fuels in power
generation. This will lead to an increased amount of power generation through renewable
energy sources such as solar and wind power. These forms of power generation have in
common that they are connected to the network via power electronics and not by traditional
synchronous generators. The shift from generators to power electronics will lead to a
decreased amount of rotational mass in power generation which will directly affect the
amount of rotational inertia in the power system. The amount of inertia is related to the
stability of the electrical power system in situations of power plant failures, large changes in
the total load and similar dynamic changes.
The change in the generation mix will require a change in the types and quantities of
frequency containment reserves. In the past the rate of change of frequency has been resisted
by the rotational inertia, but in the future this must be done by other means. There are many
projects being introduced that use ESS (energy storage system), solar inverters or wind
power inverters to provide quick frequency response in the form of FFR (Fast Frequency
Response) or virtual inertia. [1] [2] [3] [4]
UPS systems have a similar capability to participate in the frequency containment reserve.
Currently this can be done by either FCR-D or FCR-N types of reserve capacity [5]. This
does not however have an effect on the inertia of the power system and will not directly
affect the rate of change of the frequency which is critical to the stability of the electrical
grid.
1.1 Objective of the thesis
This thesis will explore the possibility of using UPSs as a source of virtual inertia. The thesis
will explore different algorithms that have been proposed to similar inverter-based energy
storage systems. Also, different battery types and energy requirements will be compared to
study the possibility of using supercapacitors as an energy source. Finally, the electricity
market will be analyzed to predict what kind of electricity market products could be in place

6
for the virtual inertia and if this functionality can be financially attractive for the UPS maker
and end users to implement into the UPS systems.
1.2 Structure of the thesis
Chapter 2 is a literature study on the behavior of synchronous machines during normal
network frequency variations and a disturbance in the network. Trough mathematical
equations the inertia constant can be calculated for a single machine and for the whole grid.
The chapter also compares different geographical grids and the frequency stability as well
as future predictions on inertia levels in networks when renewable power sources are
increased.
Chapter 3 is a study of the current generation of UPS devices and their compatibility for
providing virtual inertia to the power grid. The chapter is a literature study of the available
algorithms for inertial response from converters and a review of DC energy sources that are
usable for the inertia response. The chapter also gives an overview of the current primary
response solutions that are available from modern UPS systems in the form of UPS-as-a-
Reserve.
The fourth chapter is a review of the electrical market and fast frequency response products
in different electrical networks. The technical specifications and financial compensation
structure are compared for the available fast frequency response products. From the available
information the virtual inertia product features and compensation are estimated.
The fifth chapter is a business case analysis on the technical requirements for developing the
virtual inertia product as well as the financial attractiveness for owners of UPS devices
capable of operating in the inertia market and other fast frequency response markets. The
chapter studies the risks that are involved in using the UPS device for secondary functions
such as virtual inertia or other fast frequency responses.

7
2 GRID INERTIA AND FREQUENCY STABILITY
At all times, the electrical network must maintain instantaneous balance between generation
and consumption. The frequency will drop if consumption is larger than generation and rise,
if the opposite scenario happens. This thesis concentrates on the sudden changes in the
balance of the network and how these changes impact the frequency with a RoCoF (Rate of
Change of Frequency) which is directly related to the inertia of the network. Inertia is defined
as “The property of a rotating rigid body, such as the rotor of an alternator, such that it
maintains its state of uniform rotational motion and angular momentum unless an external
torque is applied” [6].
In high inertia electrical systems, the speed of the frequency change is low because the inertia
will resist any change in the frequency during a sudden shift in the balance between
generation and consumption. When the inertia is decreased, the amount of kinetic energy to
resist the change of frequency is also decreased, and this will cause a steeper drop in the
frequency. This chapter will give a brief introduction to the inertia of rotating machines and
how the shift from traditional rotating generators towards renewable energy sources will
decrease the system inertia. The current state and future changes of the Nordic electrical
network is shown related to the inertia.
The electrical grids for UK, Ireland and Nordics are compared by calculating the number of
times and duration that the frequency has dropped below a certain limit, and how many times
the RoCoF has reached a certain value during a year. This will give a good understanding
on the need for activating the virtual inertia with certain parameters for minimum frequency
and frequency change response.
Virtual inertia is defined by Entso-E as “The facility provided by a power park module or
HVDC system to replace the effect of inertia of a synchronous power generating module to
a prescribed level of performance” [6]. In this thesis virtual inertia is defined as a synthetic
inertia response to a fault event with appropriate power and speed to counter the RoCoF and
maximum frequency drop.

8
2.1 Rotating machines and inertia
The majority of the current power generation is produced by generators, which are
synchronous machines. The source of the generation can be nuclear, coal, hydropower, gas
or other forms of traditional power generation which all have in common a rotating mass
producing the electricity and thus they have kinetic energy. The combined inertia of the
power grid is contained in the rotating masses of these synchronous machines.
The electrical grid frequency is controlled with the rotor speed of SGs (Synchronous
Generator). Changes in the frequency is caused by an imbalance between the generation,
which is the mechanical input power, and consumption, which is the electrical output power.
The inertia of a single machine can be expressed with the equation [1]
𝐻i =
1
2
𝐽𝜔𝑛2
𝑆𝑛 [𝑠]
[1]
Where
J is the inertia of the machine [kgm2],
𝜔𝑛 is the nominal angular speed of the rotor [rad/s],
𝑆𝑛 is the nominal power of the synchronous machine [VA].
The inertia constant H is normally between 2-10 s for generating units and represents the
combined inertia of the generator and turbine [7]. The synchronous electrical grid is a
distributed system with generating units spread over the grid and connected to other
synchronous grids with HVDC (High Voltage Direct Current) connections. The HVDC links
between power areas do not share the inertia between the connected systems, however the
DC link could be used to generate virtual inertia similarly to other inverted based energy
sources [8]. Based on these facts the total inertia of the synchronous electrical network can
be expressed with the equation

9
𝐻sys =
∑ 𝐻i𝑛𝑖=1 𝑆Ni𝑆𝑛𝑠𝑦𝑠
[𝑠] [2]
Where
n is the sum of motors and generators,
𝑆Ni is the rated power of machine i [VA],
𝑆𝑛𝑠𝑦𝑠 is the base power for the system [VA].
Before the actual inertial response there is an electromagnetic response stage where the
electromagnetic power is released from the magnetic field of the SGs. In this stage the
generators closest to the location of the impact, meaning with the lowest impedance path,
will take the biggest share of the load [9]. The duration of the active power during this stage
is approximately 1/3 of a second [10]. After the electromagnetic stage the generators are
experiencing the change of its rotational speed and the rotor angles begin changing. During
this stage there are some oscillations between the generators and the frequency will be
different in different parts of the electrical system. The oscillations will start to fade away
within a few seconds because of grid losses, rotor windings and other factors, after which
the frequency will become unified for all units in the grid.
After this stage the actual inertial response is activating, and the mechanical energy is
released from the rotating masses. The frequency will start to decrease as determined by
the difference between the mechanical input power and electrical output power of the
generators. The RoCoF at this stage is given by equation 3.
∆𝜔𝑛 = −
∆𝑃L2𝐻sys
[3]
Where ∆𝑃𝐿 is the load change [W].
If the primary reserves would not activate, the rate of frequency change would continue to
drop with the above equation until a blackout of the system happened. Each individual
machine will supply power correlated to the inertia of the SG, total system inertia and the
load change.
10
The power of each individual machine can be calculated with the equation
∆𝑃i =
Hi
𝐻sys× ∆𝑃L
[4]
From the equation, it can be seen that the power output does not depend on the location of
the SG in the inertial stage, which is opposite as in the situation with electromagnetic
stage. During the inertial response the sources of inertia are in synchronization and the
imbalance between generation and output electrical power is seen by all sources
simultaneously. In the inertial stage the output power of each generator is dependent on the
size of the unit and therefore the kinetic energy of the rotational mass [9].
The size of the total inertia in the grid and its effect on the frequency deviation have been
studied in several papers [11] [9]. In a study made by Germán Claudio Tarnowski [9], the
effect of decreasing inertia in the system has been simulated with the results shown in
Figure 1. From the figure it can be observed that when the inertia is decreased by 20%, the
peak frequency deviation is increased by approximately 9% [9].

11
Figure 1. Graph shows the increase in the frequency deviation in relation to the reduction of the system inertia constant
[9].
2.2 Nordic electrical network
The electrical network in the Nordics is maintained at a constant frequency of 50 Hz +- 0,01.
If the frequency drops below or above the above limits, reserves are activated to compensate
the change of frequency. These reserves are frequency-controlled reserves FCR-D
(Frequency containment Reserve for Disturbance) and FCR-N (Frequency containment
Reserve for Normal operation). FCR-D is activated in the event of the frequency falling
below 49,9 Hz and is fully activated when the frequency reaches 49,5 Hz. The required
activation time is 5 seconds from the disturbance until 50% power, 30 seconds until 100 %
power. FCR-N is activated when the frequency is between 49,9-50,1 Hz and is relative to
the frequency deviation. Required activation time is 3 minutes until 100% power. As seen
from the activation time, the primary reserves need sufficient time to react to the frequency
deviation, and this is where the inertia of the system plays a critical role. The rate of change
of frequency cannot be too large, otherwise the reserves do not have time to react properly
and a system wide blackout is possible [12].

12
The control graph for FCR-N activation is shown in Figure 2.
Figure 2 FCR-N control diagram [12].

13
Figure 3 FCR-D control diagram [12].
The Nordics do not have faster reserves as a product at this time but the need for a fast
frequency response has been identified and the product could be implemented already in
2020 [11].
2.3 Renewable energy sources
European Union has a goal of reaching a renewable energy production of 20 % by 2020 and
27% by 2030 [13]. The share of renewables in the Nordics will be much higher than the
average target in the EU, ranging from 38% in Finland to 49% in Sweden [13]. These
renewable energy sources will directly replace synchronous generators and the kinetic
energy of the network will be reduced at the same rate. The variation in wind power
production will also increase amount of needed reserves and research shows that 2,5-4% of
the installed wind capacity is needed as reserves [9].

14
With renewable energy sources there are no directly coupled mechanical rotating masses
such as with SGs. The blades of wind power plants are rotating masses, but they generate
electrical power through a generator which is connected to the network through power
electronics and the blades do not generate any kinetic energy seen to the electrical grid. The
purpose of the power electronic converter is to maintain a stable frequency in the output
regardless of the wind turbine rotating speed. During slow winds the wind turbine still needs
to generate the same frequency and a converter is required to keep it steady. Photovoltaic
power plants do not contain any mechanical energy and they are completely built from static
electronics such as photovoltaic panels and converters. The inertia seen to the power grid
from these power plants is zero.
There are many articles and projects that propose the use of wind and photovoltaic power
plants to create virtual inertia through the inverter and most likely these will be successfully
implemented [1], [4], [9], [10], [14]–[16]. The articles for wind power concentrate on using
the rotary energy of certain types of wind power plants to control the frequency by a similar
method as SGs use to respond to the frequency variation with rotating inertia. This method
requires careful dimensioning of the wind power plant and an algorithm for estimating the
available kinetic energy in the blades of the rotor in different scenarios of available wind
energy. Photovoltaic power plants can be used for frequency support by oversizing the
capacity of the power plant to leave room for frequency response, but this leaves a part of
the photovoltaic capacity unused most of the time. Another method is to add energy storage
to the PV power plant either to work in parallel with the solar modules or as a separate
inverter feeding the grid.

15
2.4 Critical levels of inertia
The critical level of required inertia in the system is defined by the RoCoF limit and the
reaction speed of reserves to the frequency disturbance. In extreme situations a high RoCoF
might even cause tripping of protection relays [15]. The inertia is not constant and varies
according to the type of energy production, which might be more converter-based production
during the summer from solar and wind power. From Figure 4 the variation in the kinetic
energy can be seen very clearly. The risk area is during the summer when the kinetic energy
is the lowest and the frequency is the most vulnerable to sudden changes in the production
or large load changes.
Figure 4 Kinetic Energy (GWs) in the Nordics from 2009 to 2015 [17].
16
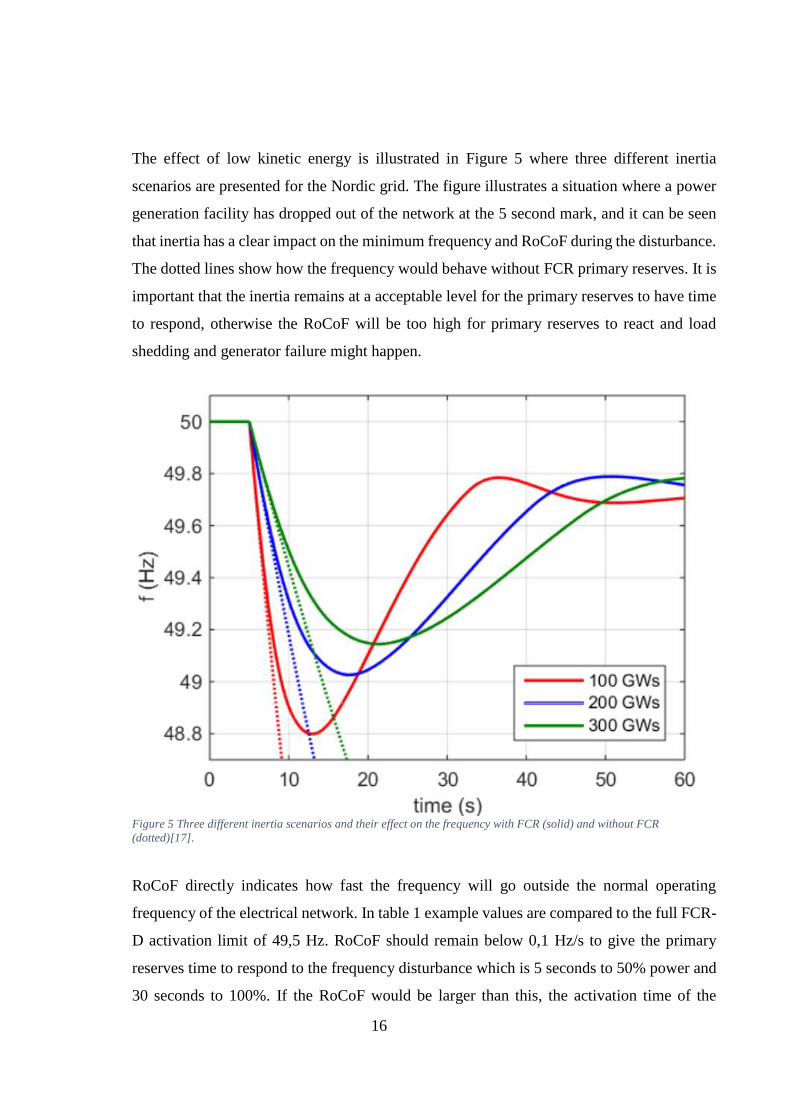
The effect of low kinetic energy is illustrated in Figure 5 where three different inertia
scenarios are presented for the Nordic grid. The figure illustrates a situation where a power
generation facility has dropped out of the network at the 5 second mark, and it can be seen
that inertia has a clear impact on the minimum frequency and RoCoF during the disturbance.
The dotted lines show how the frequency would behave without FCR primary reserves. It is
important that the inertia remains at a acceptable level for the primary reserves to have time
to respond, otherwise the RoCoF will be too high for primary reserves to react and load
shedding and generator failure might happen.
Figure 5 Three different inertia scenarios and their effect on the frequency with FCR (solid) and without FCR
(dotted)[17].
RoCoF directly indicates how fast the frequency will go outside the normal operating
frequency of the electrical network. In table 1 example values are compared to the full FCR-
D activation limit of 49,5 Hz. RoCoF should remain below 0,1 Hz/s to give the primary
reserves time to respond to the frequency disturbance which is 5 seconds to 50% power and
30 seconds to 100%. If the RoCoF would be larger than this, the activation time of the

17
reserves must be adjusted to compensate the faster time to reach the limit of activation
frequency.
Table 1 RoCoF and the time to reach 49,5 Hz.
RoCoF (Hz/s) Time to reach 49,5 Hz (s)
0,01 50
0,03 16,7
0,05 10
0,1 5
1 0,5
2 0,25
The RoCoF withstand limits for generating units have been proposed by ENTSO-E to be
the following [18]
- ±2 Hz/s for moving average of 500 ms window
- ±1,5 Hz/s for moving average of 1000 ms window
- ±1,25 Hz/s for moving average of 2000 ms window
The above limits are for short time windows and if the RoCoF would be 2 Hz/s for the full
duration of the frequency drop, the reserves would not have time to respond the event and a
blackout would be possible.
2.5 Frequency stability in different geographical power grids
The frequency stability profile varies in different electrical power grids depending on the
type of the generating profile, which affects the inertia of the network. In this chapter the
frequency stability is analyzed from the frequency data based on times and duration that the
frequency has been under certain value. The RoCoF for 1 second intervals of the same
frequency data has also been analyzed and plotted in the following figures.
In Figure 6 the frequency statistics have been plotted for the UK for the year 2017. From the
same data, RoCoF was plotted for 1 second intervals in figures 7 and 8, where both the rising
and falling RoCoF values are shown.

18
Figure 6. Frequency statistics for the UK in 2017 with total times below limits, longest time below limits and average time
below limits.
Figure 7. Dropping RoCoF statistics from the UK in 2017 January to December.

19
Figure 8. Rising RoCoF statistics from the UK in 2017 January to December.
The same information was gathered from the Nordic grid and in figure 9 the frequency
statistics are shown for 2017. The frequency statistics are found in the yearly frequency
quality analysis report from Fingrid [19]. The RoCoF values were calculated and analyzed
from the frequency history data that is downloadable from the Fingrid website [20]. The
dropping and rising RoCoF values are plotted in figures 10 and 11. Some frequency data for
August and October 2017 from Fingrid were incomplete and measurements were missing.
The RoCoF statistics were calculated for the rest of the year and values were averaged to fill
in the missing data.

20
Figure 9. Frequency statistics for the Nordics in 2017 with total times below limits, longest time below limits and average
time below limits [19].
Figure 10. Dropping RoCoF statistics from the Nordics in 2017 January to December.
21
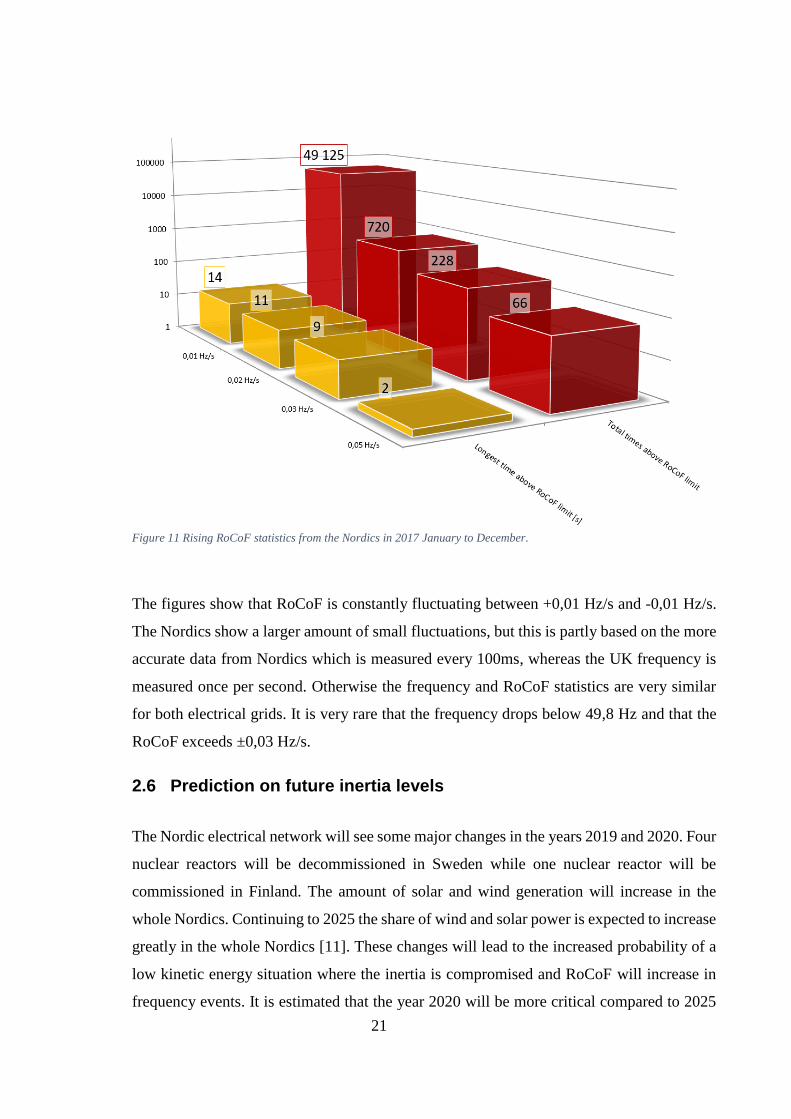
Figure 11 Rising RoCoF statistics from the Nordics in 2017 January to December.
The figures show that RoCoF is constantly fluctuating between +0,01 Hz/s and -0,01 Hz/s.
The Nordics show a larger amount of small fluctuations, but this is partly based on the more
accurate data from Nordics which is measured every 100ms, whereas the UK frequency is
measured once per second. Otherwise the frequency and RoCoF statistics are very similar
for both electrical grids. It is very rare that the frequency drops below 49,8 Hz and that the
RoCoF exceeds ±0,03 Hz/s.
2.6 Prediction on future inertia levels
The Nordic electrical network will see some major changes in the years 2019 and 2020. Four
nuclear reactors will be decommissioned in Sweden while one nuclear reactor will be
commissioned in Finland. The amount of solar and wind generation will increase in the
whole Nordics. Continuing to 2025 the share of wind and solar power is expected to increase
greatly in the whole Nordics [11]. These changes will lead to the increased probability of a
low kinetic energy situation where the inertia is compromised and RoCoF will increase in
frequency events. It is estimated that the year 2020 will be more critical compared to 2025
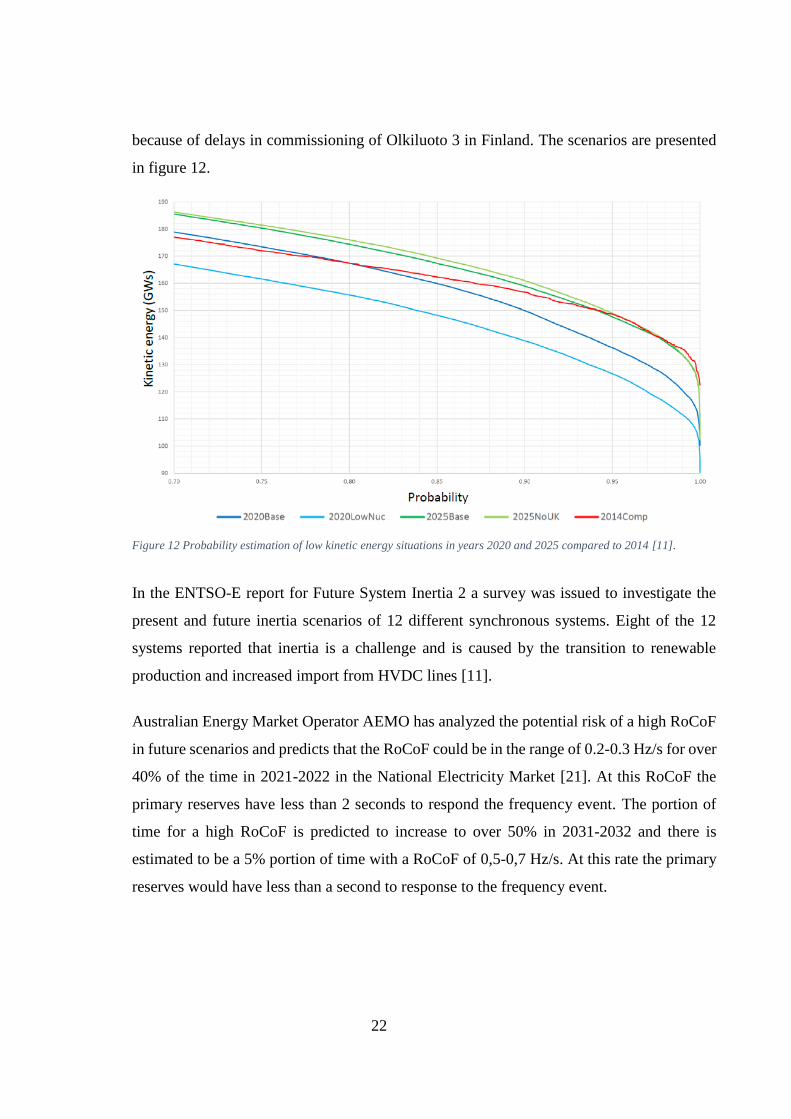
22
because of delays in commissioning of Olkiluoto 3 in Finland. The scenarios are presented
in figure 12.
Figure 12 Probability estimation of low kinetic energy situations in years 2020 and 2025 compared to 2014 [11].
In the ENTSO-E report for Future System Inertia 2 a survey was issued to investigate the
present and future inertia scenarios of 12 different synchronous systems. Eight of the 12
systems reported that inertia is a challenge and is caused by the transition to renewable
production and increased import from HVDC lines [11].
Australian Energy Market Operator AEMO has analyzed the potential risk of a high RoCoF
in future scenarios and predicts that the RoCoF could be in the range of 0.2-0.3 Hz/s for over
40% of the time in 2021-2022 in the National Electricity Market [21]. At this RoCoF the
primary reserves have less than 2 seconds to respond the frequency event. The portion of
time for a high RoCoF is predicted to increase to over 50% in 2031-2032 and there is
estimated to be a 5% portion of time with a RoCoF of 0,5-0,7 Hz/s. At this rate the primary
reserves would have less than a second to response to the frequency event.

23
3 VIRTUAL INERTIA RESPONSE FROM UPS SYSTEMS
The technical feasibility of using UPSs for providing virtual inertia is reviewed in this
chapter. The thesis concentrates on Double Conversion UPS devices which are so called
Online UPSs. The technology of modern UPS devices is reviewed and the technical
requirements for UPSs providing virtual inertia is explained. UPSs can already be used for
providing frequency response for the primary frequency reserves and it is introduced in this
chapter. The most common algorithms for the virtual inertia response are introduced and
compared and the technical challenge with measuring the frequency changes in the network
are presented.
The most common battery solutions for UPSs are VRLA (Voltage Regulated Lead Acid)
batteries whereas Lithium-ion batteries are slowly becoming a valid option caused by the
advancement of technology and decreasing prices. Both solutions have been thoroughly
analyzed and compared in other theses and articles, so they are only briefly mentioned in
this chapter, see for instance [22] and [23]. More emphasis has been put on comparing
supercapacitors as an energy source since they have become a valid option for short backup
times for UPSs and have some interesting benefits which could be valid for the virtual inertia
product.
3.1 Double conversion UPS
The primary function of an UPS is to supply uninterruptible power to critical loads in
industrial, healthcare, datacenter, commercial building and other critical applications. The
inclusion of frequency response as a potential secondary function shall not under any
circumstances jeopardize the primary function and cause risk to the critical load. It is crucial
to investigate all possible scenarios for fault behavior when assessing the risk for the primary
function, such as battery capacity depletion, battery converter fault, communication errors
and other worst-case scenarios.
Online double conversion UPSs are converting AC to DC and back to AC for the output.
The rectifier converts the mains AC voltage into DC- voltage for the DC-link. Between the
DC-link and batteries is a DC-DC buck-boost converter which is used to charge and

24
discharge the batteries and convert the voltage of the DC-source into a suitable level for the
DC-link. The benefit of the converter is the elimination of DC voltage ripple which is present
in the DC-link. In older UPS models the batteries were directly coupled to the DC-link and
were exposed to the voltage ripple which accelerated the aging of the batteries. From the
DC-link the inverter uses PWM (Pulse Width Modulated) switching to produce the output
voltage, which is filtered into pure sinewave with a LC-filter. Modern UPSs use IGBT
(Insulated Gate Bipolar Transistor) converters which are highly controllable with software
and this makes it possible to perform the virtual inertia operations very flexibly. The
schematic drawing for the bi-directional IGBT UPS is seen in Figure 13.
Figure 13. Block diagram for a bi-directional double conversion UPS.
The suggested virtual inertia algorithm may be adopted to UPS devices that are operating in
double conversion mode and have bi-directional converters capable of supplying power
towards the grid in parallel with supplying power to the critical load. All Eaton Premium
UPSs have this feature since they all have the technical capability to participate in FCR
25
market. Technically the virtual inertia could be adopted to unidirectional converters, but the
available capacity would be limited to the size of the critical load, since that would be the
amount of power being limited or controlled by the UPS. Bi-directional UPSs can supply
the full nominal power of the UPS to the grid, even if the load is very small.
Even UPSs without any external converter control can be used for frequency response since
the most basic type of frequency response is load shedding, and the UPS input breakers can
simply be opened, and the load is supplied from the batteries and is no longer visible in the
grid as power consumption. This approach has severe limitations and unwarranted risks,
because any fault in the battery system will cause a blackout to the load. It is much safer to
be able to have the input breakers closed and energized in case of an issue with the battery
source. Using this rudimentary approach for load shedding with critical loads is not in line
with the principle of not risking the primary UPS function in any secondary usage situations.
3.2 Requirements for the UPS electronics
Online UPS devices with controllable bi-directional converters are suitable for creating
virtual inertia to the grid. High speed of the converter control is essential to be able to respond
to the frequency event quickly after detection and react with an appropriate power response.
Eaton UPSs have been used for frequency response for FCR-D and FCR-N markets and this
capability is described in the following chapter. The speed of the UPSaaR (UPS-as-a-
Reserve) response was found to be below 3 cycles in laboratory tests [5] which gives time
to assess the need and size of the response in reaction to the frequency and RoCoF during
the frequency disturbance. The fastest possible reaction speed to a frequency event is not
always desirable, since there needs to be a dead zone where the frequency can vary as it
normally does in the power grid [21]. With a slower response an accurate measurement of
the event is possible and unnecessary activations of the virtual inertia algorithm can be
avoided.
RoCoF in the grid is in a constant oscillating mode between negative and positive when the
consumption and generation is not in balance. As with primary reserves, inertia helps with
upwards and downwards regulation of the frequency and this can also apply to virtual inertia.

26
If the virtual inertia needs to be symmetric in both directions the challenge will be the
downward regulation. This is caused by typically limited charging capability of DC/DC
converters and the challenge with keeping batteries at a partial charge, especially with
supercapacitors which have a small storage capacity to begin with. The charging capacity
can be boosted by using a larger battery converter or by using a redundant system with extra
power modules for increased charger capacity and added reliability. If the virtual inertia is
only up-regulating, the full nominal capacity of the UPS can be used, and the charging
capacity of batteries is not an issue.
Other requirements for the UPS electronics are bi-directional converters, accurate
measurement of frequency and its changes and sufficient computing power. The computing
power is required to calculate the frequency RoCoF or in other words derivate of the
frequency change. If the SM emulation approach is chosen, then the real-time emulation of
SM parameters is required to simulate the frequency response behavior.
The UPS also needs to identify a situation when the network is in an islanded mode to avoid
a situation where the UPS would continue to feed power to the grid when the grid is offline.
This scenario might arise if a large bank of virtual inertia UPSs, say a datacenter, would feed
power towards the grid which is in islanded mode and the whole power is absorbed by a
suitably sized load. This might cause a risk of backfeeding power to a network which would
be assumed to be offline when doing reparations and other maintenance work. The UPSs can
be equipped with passive and active islanding detection methods which would limit the risk
of islanding mode. These methods are widely used in converter-based generation[24]. If the
inertia algorithm is programmed with a specific maximum duration for feeding the power,
for example 10 seconds, then the risk of continuous power backfeeding is eliminated.
3.3 UPS-as-a-Reserve
Eaton Premium UPS devices have the ability to participate in primary frequency response in
the form of FCR-D and FCR-N, FFR (Fast Frequency response), EFR (Enhanced Frequency
Response), FCAS (Frequency Control Ancillary Services) and other similar responses [25].
The idea behind the technology is to use excess battery capacity of UPS systems in

27
datacenters and similar locations that usually have redundant UPS systems which contain by
requirement large battery capacities. The owner of the UPS can participate in the reserve
market directly with the TSO (Transmission System Operator) if the offered capacity is large
enough, which is usually 1 MW. The more common approach is to offer the UPSaaR
capacity through an aggregator who combines several smaller sources of UPS power and
offers the virtual power plant to the TSO. In the Nordics, Fortum is the aggregator with the
smart energy solutions Fortum Spring [26].
The technology is based on Eaton Online UPS devices which have bi-directional converters.
During a frequency event the TSO or aggregator will send a request to the UPS through the
CAN (Controller Area Network) protocol or an internal frequency measurement will
calculate the request if the activation frequency is reached. Before activating the response,
the UPS internal logic will determine if there is sufficient battery capacity available and if
the UPS is capable of feeding the required power for the frequency response. If these
conditions are met and total load is below the requested power of the frequency response,
the UPS will feed power from the battery to load and grid.
The motivation of the customer for participating in the FCR-market is financial and
ecological. The compensation is based on the availability and not actual usage, therefore
during normal grid conditions the amount of frequency response events are quite low and
the UPS will remain in a normal operating mode. The other motivation for UPSaaR
participation is ecological, meaning that the change towards renewable energy will require
more reserves in the grid and the datacenters can contribute to this development. It has a
positive effect on the environment and the company brand.
The speed of the response has been measured at Eaton test laboratory and during an actual
frequency event while conducting a pilot project in Norway. The activation was extremely
fast in the laboratory test, within one cycle the UPS was feeding energy to the grid in reaction
to the command for the frequency response and full stabilization took approximately 3 cycles
[5]. In the pilot project in Norway the UPS was the fastest reserve to activate during the
frequency event which was the disconnection of Olkiluoto 2 nuclear power plant [27]

28
3.4 Virtual inertia algorithms
There are several papers on different algorithms for fast frequency response adaptation to
inverters such as wind, solar and BESS (Battery Energy Storage Solutions) [1] [2] [3] [4].
In this chapter droop control, derivative control and SM emulation are reviewed and
compared. Droop control and derivative control have been proposed for FFR and in that
sense virtual inertia and FFR may be difficult to separate as technologies. Synchronous
machine emulation has additional merits since it will most closely emulate the inertia of
rotating machines and will theoretically most closely replace the diminishing inertia from
the grid but has some major drawbacks in complexity and unwanted behavior during normal
grid situations.
3.4.1 Measuring RoCoF
RoCoF is a critical measurement when controlling virtual inertia. There are challenges with
accurately measuring RoCoF because of different disturbances in the electrical network. If
the power quality of the network is poor such as with transients, harmonics, noise or fault
events, the measured results of RoCoF may be highly distorted [28]. There is also no
standardization for the testing procedure of RoCoF, but this has been suggested and is under
evaluation [29].
There are several types of RoCoF measurement of which one includes a double derivative
calculation from the phase and frequency. This will lead to a highly amplified measurement
error in the case of poor power quality. Careful filtering design is needed to mitigate the
error and create a reliable inertia response in response to the RoCoF and not cause overshoot
or oscillation. Another type of RoCoF measurement is to calculate the period of the sine
wave by calculating the time between zero crossing of the voltage as can be seen from figure
14 [29]. In zero crossing measurements distortions are problematic since zero crossings are
easily influenced by power quality issues and false measurements are frequent.
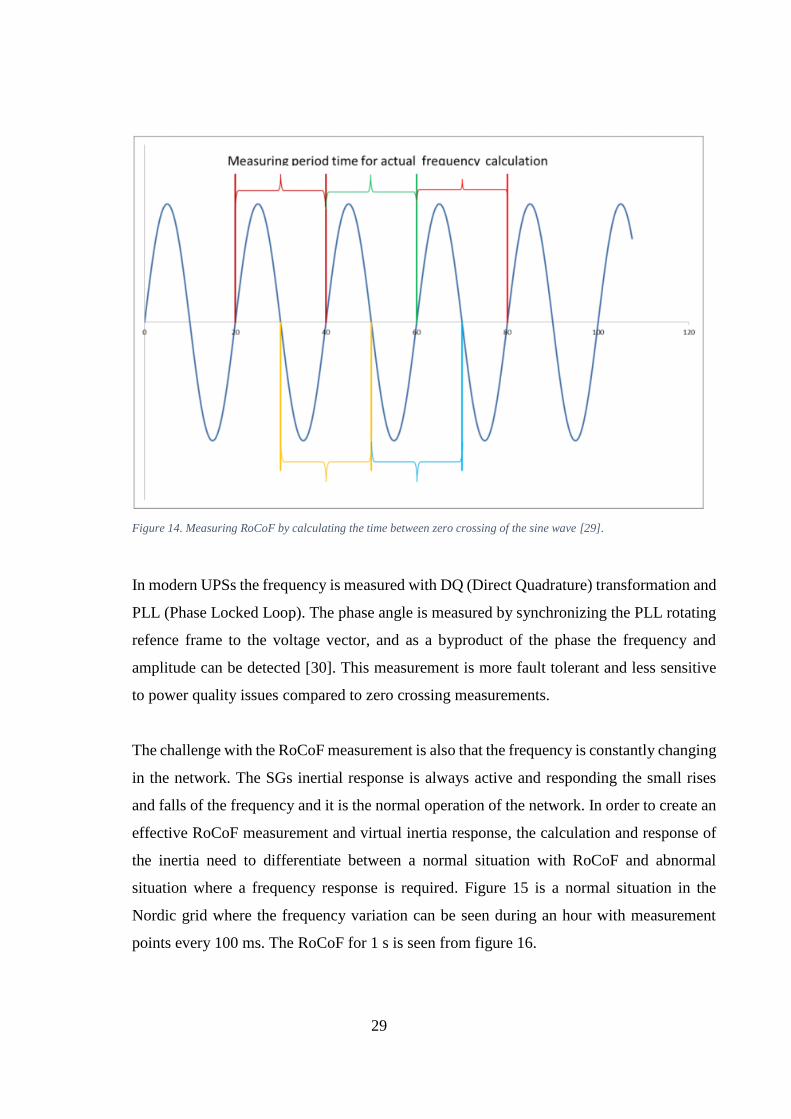
29
Figure 14. Measuring RoCoF by calculating the time between zero crossing of the sine wave [29].
In modern UPSs the frequency is measured with DQ (Direct Quadrature) transformation and
PLL (Phase Locked Loop). The phase angle is measured by synchronizing the PLL rotating
refence frame to the voltage vector, and as a byproduct of the phase the frequency and
amplitude can be detected [30]. This measurement is more fault tolerant and less sensitive
to power quality issues compared to zero crossing measurements.
The challenge with the RoCoF measurement is also that the frequency is constantly changing
in the network. The SGs inertial response is always active and responding the small rises
and falls of the frequency and it is the normal operation of the network. In order to create an
effective RoCoF measurement and virtual inertia response, the calculation and response of
the inertia need to differentiate between a normal situation with RoCoF and abnormal
situation where a frequency response is required. Figure 15 is a normal situation in the
Nordic grid where the frequency variation can be seen during an hour with measurement
points every 100 ms. The RoCoF for 1 s is seen from figure 16.

30
Figure 15. Frequency variation during a normal hour 17.7.2018 8:30-9:30.
Figure 16. RoCoF for 1 second intervals during a normal hour 17.7.2018 8:30-9:30.
Figure 17 shows the frequency behavior during a major fault in the grid. On 18.7.2018 8:57
Olkiluoto 2 nuclear power plant was disconnected from the network due to a transformer
fault outside the reactor [31]. This caused approximately 890 MW of power to be
disconnected and caused a major dip in the frequency before the primary reserves had time
49,55
49,65
49,75
49,85
49,95
50,05
50,15
8:3
1:4
78
:33
:35
8:3
5:2
38
:37
:10
8:3
8:5
88
:40
:46
8:4
2:3
38
:44
:21
8:4
6:0
98
:47
:57
8:4
9:4
48
:51
:32
8:5
3:2
08
:55
:07
8:5
6:5
58
:58
:43
9:0
0:3
09
:02
:18
9:0
4:0
69
:05
:53
9:0
7:4
19
:09
:29
9:1
1:1
79
:13
:04
9:1
4:5
29
:16
:40
9:1
8:2
79
:20
:15
9:2
2:0
39
:23
:51
9:2
5:3
89
:27
:26
9:2
9:1
4
Mea
sure
d f
req
uen
cy (
Hz)
Time (hh:mm:ss)
-0,05
-0,03
-0,01
0,01
0,03
0,05
8:3
1:5
08
:33
:41
8:3
5:3
28
:37
:23
8:3
9:1
58
:41
:05
8:4
2:5
68
:44
:47
8:4
6:3
98
:48
:29
8:5
0:2
08
:52
:11
8:5
4:0
28
:55
:53
8:5
7:4
48
:59
:36
9:0
1:2
69
:03
:17
9:0
5:0
89
:07
:00
9:0
8:5
09
:10
:41
9:1
2:3
39
:14
:23
9:1
6:1
49
:18
:05
9:1
9:5
79
:21
:47
9:2
3:3
89
:25
:29
9:2
7:2
09
:29
:11
Mea
sure
d R
oC
oF
(Hz/
s)
Time (hh:mm:ss)
31
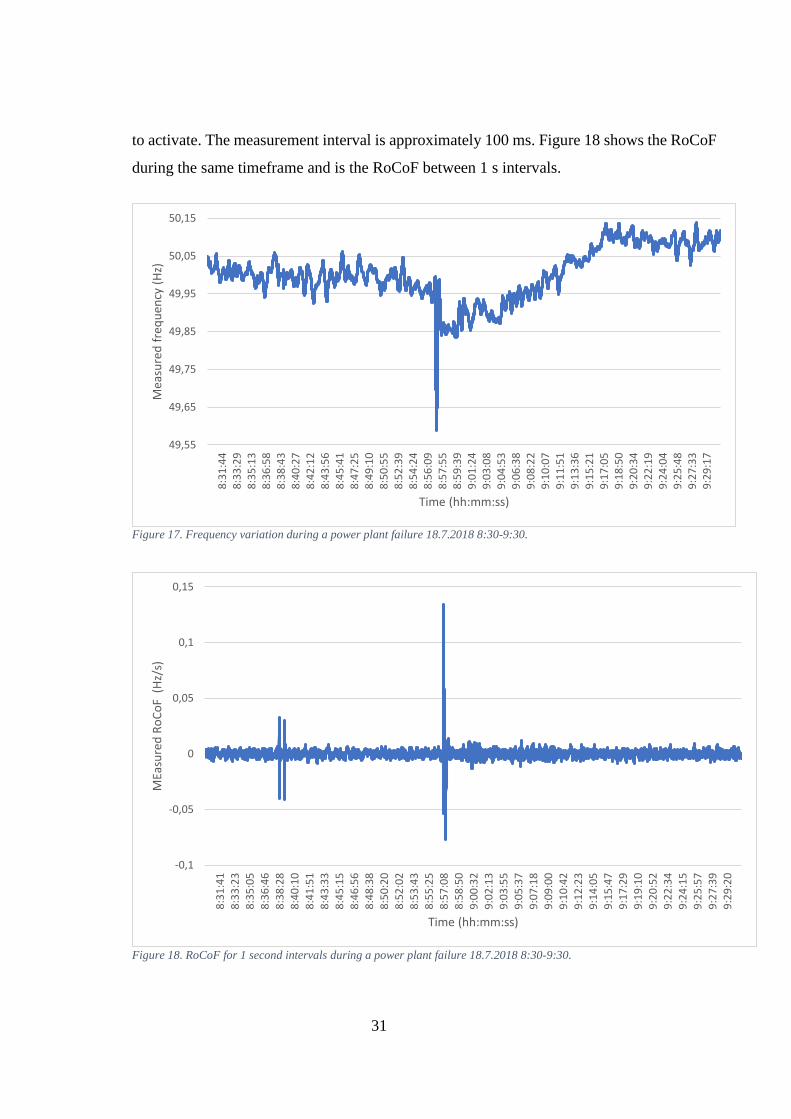
to activate. The measurement interval is approximately 100 ms. Figure 18 shows the RoCoF
during the same timeframe and is the RoCoF between 1 s intervals.
Figure 17. Frequency variation during a power plant failure 18.7.2018 8:30-9:30.
Figure 18. RoCoF for 1 second intervals during a power plant failure 18.7.2018 8:30-9:30.
49,55
49,65
49,75
49,85
49,95
50,05
50,158
:31
:44
8:3
3:2
98
:35
:13
8:3
6:5
88
:38
:43
8:4
0:2
78
:42
:12
8:4
3:5
68
:45
:41
8:4
7:2
58
:49
:10
8:5
0:5
58
:52
:39
8:5
4:2
48
:56
:09
8:5
7:5
58
:59
:39
9:0
1:2
49
:03
:08
9:0
4:5
39
:06
:38
9:0
8:2
29
:10
:07
9:1
1:5
19
:13
:36
9:1
5:2
19
:17
:05
9:1
8:5
09
:20
:34
9:2
2:1
99
:24
:04
9:2
5:4
89
:27
:33
9:2
9:1
7
Mea
sure
d f
req
uen
cy (
Hz)
Time (hh:mm:ss)
-0,1
-0,05
0
0,05
0,1
0,15
8:3
1:4
18
:33
:23
8:3
5:0
58
:36
:46
8:3
8:2
88
:40
:10
8:4
1:5
18
:43
:33
8:4
5:1
58
:46
:56
8:4
8:3
88
:50
:20
8:5
2:0
28
:53
:43
8:5
5:2
58
:57
:08
8:5
8:5
09
:00
:32
9:0
2:1
39
:03
:55
9:0
5:3
79
:07
:18
9:0
9:0
09
:10
:42
9:1
2:2
39
:14
:05
9:1
5:4
79
:17
:29
9:1
9:1
09
:20
:52
9:2
2:3
49
:24
:15
9:2
5:5
79
:27
:39
9:2
9:2
0
MEa
sure
d R
oC
oF
(H
z/s)
Time (hh:mm:ss)
32
The frequency event is shown more closely in figure 19 for the duration of the frequency dip
and restoration. The frequency falls to 49,6 Hz in approximately 6 seconds from the
beginning of the frequency drop but does not fall linearly. This indicates that the generators
in the network respond to the event and during this time the frequency will be different if
measured in different parts of the grid as explained in chapter 2.
Figure 19. Frequency during the frequency event measured in seconds from the beginning of the frequency event.
It can be noted that during normal operations frequency has varied between 49,85-50,05 and
RoCoF stays mostly within +-0,01 Hz/s. During the frequency disturbance in figure 17 and
19 the frequency has dropped to 49,5 Hz, which is the limit of 100% activation in FCR-D.
The RoCoF has reached a maximum of -0,07 Hz/s and +0,14 Hz/s.
3.4.2 Droop control
Droop Control is an acknowledged control method for parallel converters and they
somewhat emulate the typical frequency control of a synchronous machine. The droop
factors can be adjusted to enable the converters to share the load evenly. A similar type of
load sharing algorithm is used in Eaton parallel control scheme, where the UPSs can operate
in parallel by adjusting the phase angle of the output in relation to the output power and its
change rate[32].
The following equation can be used for the droop control
𝜔 = 𝜔∗ + 𝐷p(𝑝∗ − 𝑝 ) [5]
49,3
49,4
49,5
49,6
49,7
49,8
49,9
50
50,1
0,1
0,7
1,3
1,9
2,5
3,1
3,7
4,3
4,9
5,5
6,1
6,7
7,3
7,9
8,5
9,1
9,7
10
,3
10
,9
11
,5
12
,1
12
,7
13
,3
13
,9
14
,5
15
,1
15
,7
16
,3
16
,9
17
,5
18
,1
18
,7
19
,3
19
,9
Mea
sure
d f
req
uec
ny
(Hz)
Time (s)
33
where 𝐷p is the droop slope, 𝜔 ∗ is the angular frequency setpoint, 𝑝∗ is the power setpoint,
𝜔 is the output angular frequency. Power measurement p is filtered with a first-order Low-
Pass Filter, which can be calculated with equation 6.
𝑝 =𝜔c
𝜔c + 𝑠𝑝 [6]
Where 𝜔c is the cutoff angular frequency.
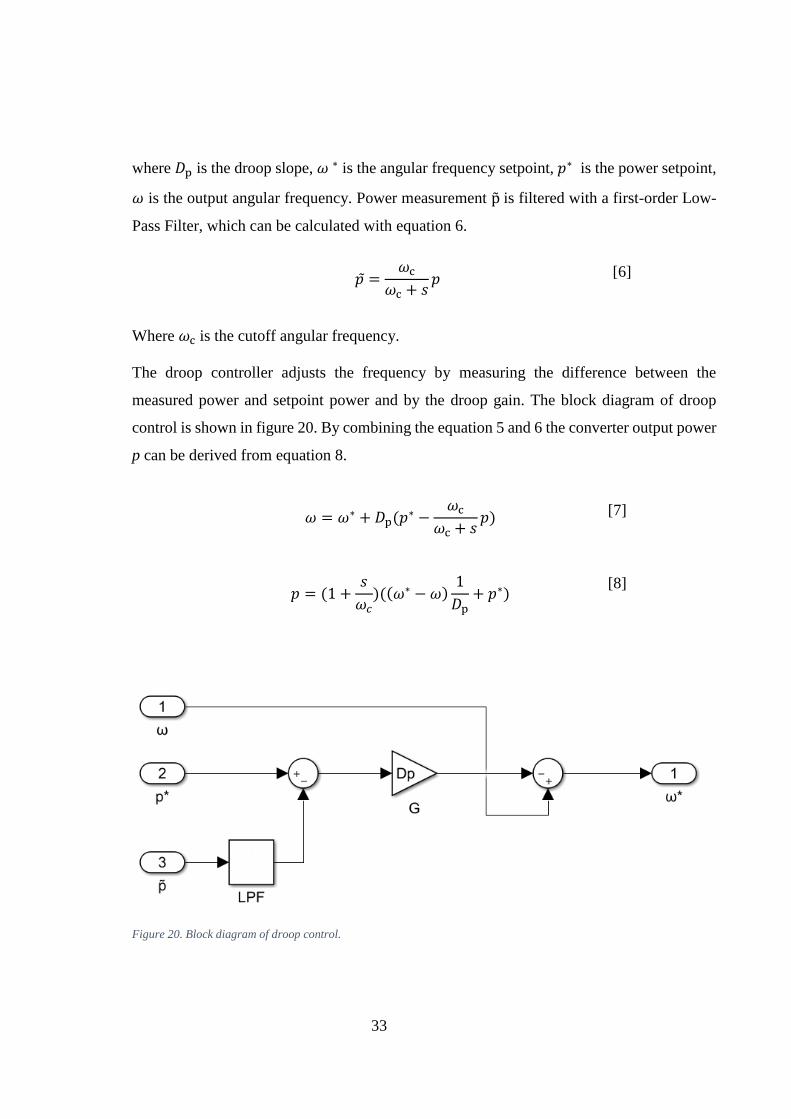
The droop controller adjusts the frequency by measuring the difference between the
measured power and setpoint power and by the droop gain. The block diagram of droop
control is shown in figure 20. By combining the equation 5 and 6 the converter output power
p can be derived from equation 8.
𝜔 = 𝜔∗ + 𝐷p(𝑝∗ −
𝜔c
𝜔c + 𝑠𝑝) [7]
𝑝 = (1 +
𝑠
𝜔𝑐)((𝜔∗ − 𝜔)
1
𝐷p+ 𝑝∗)
[8]
Figure 20. Block diagram of droop control.
34
The challenge with droop control is the static response, since it does not activate fully until
the frequency reaches the minimum setpoint and it has only a small effect on the RoCoF in
the beginning of the frequency event. The droop control will not affect the frequency in a
similar way as the inertial response of synchronous machines, which affects mostly the
RoCoF. Therefore, using only a droop response does not replicate the lost inertia in the
network in a way that would largely improve the RoCoF. Droop control is however
beneficial for improving the minimum frequency during the disturbance and it can be used
in combination with other techniques, which is shown in this chapter.
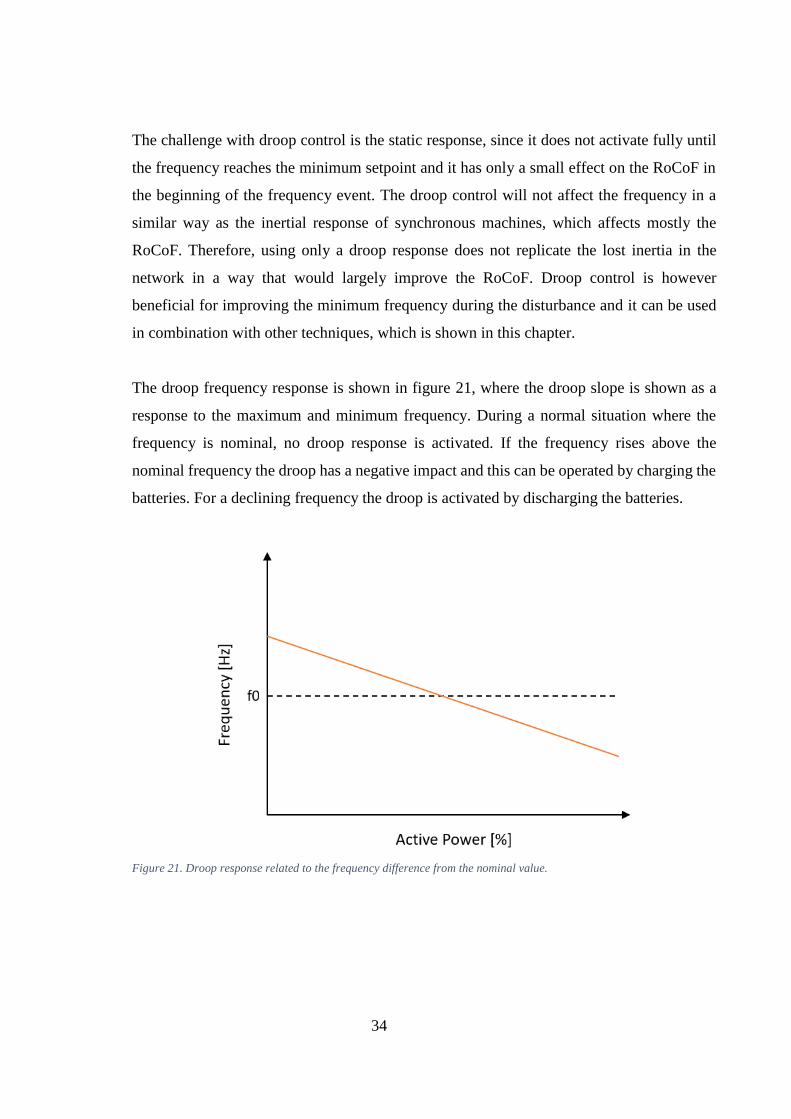
The droop frequency response is shown in figure 21, where the droop slope is shown as a
response to the maximum and minimum frequency. During a normal situation where the
frequency is nominal, no droop response is activated. If the frequency rises above the
nominal frequency the droop has a negative impact and this can be operated by charging the
batteries. For a declining frequency the droop is activated by discharging the batteries.
Figure 21. Droop response related to the frequency difference from the nominal value.

35
3.4.3 Derivative control
The derivative control is a control method that responds directly to the RoCoF. This type of
control is very sensitive to power quality issues since the frequency might experience large
changes in a short period that are caused by distortion or disturbances in the local grid, that
are normal in an electrical system with poor power quality. The derivative control reacts to
the d/dt of the frequency, so the measurement will need to be exact.
One possible solution is a centralized measurement system that issues the command to
distributed sources of virtual inertia to respond with a power proportional to the RoCoF. The
challenge with this method is the speed of activation. The activation signal and response
from the UPSs is affected by data transfer issues compared to the solution where the UPS
measures the signal locally and activates the frequency response immediately. In low inertia
networks where the RoCoF might be high the speed of the response is increasingly
important, and a distributed measurement and activation algorithm will likely be necessary.
Different methods for derivative control have been proposed, where one solution is an
algorithm for a HVDC (High Voltage Direct Current) link that was published in the article
by Rakhshani et al. [33]. In this solution the challenge with the frequency measurement was
improved by adding a low pass filter for clearing out some of the noise.
The control algorithm for the power output for a derivative control is based on the equation
𝑝emulate = ka𝜔
∗d(∆𝜔)
dt
[10]
Where 𝑘a is the proportional gain, 𝜔∗ is the frequency setpoint, 𝜔 is the measured angular
frequency. By adding a low pass filter some of the noise can be removed in the frequency
measurement. The suggested block diagram is as in Figure 22.

36
Figure 22. Block diagram for derivative control.
From chapter 2 where different RoCoF values, times, and durations were listed for UK and
the Nordics it can be seen that the derivative control parameters should be set outside the
normal variations of the frequency, where the activation times would be very low. The
derivative control should include a rule to not respond when the frequency is above the
nominal value, for example when the frequency has risen above 50 Hz and is dropping
rapidly back towards the nominal frequency.
3.4.4 Combination of droop and derivative control
In the master thesis from Aalborg it was simulated that a combination of 25% derivative and
75% droop presented the best results for frequency response by minimizing the RoCoF while
maintaining a high minimum frequency during the frequency event [3]. This combination
gives the benefit of a faster response to the frequency event by activating to the derivative
of the frequency drop and full activation if the frequency reaches a minimum limit. This
combination should be investigated more closely when choosing the optimal algorithm for
the UPS inertia.
3.4.5 SM emulation control
Virtual inertia emulation (VIE) is designed to emulate the properties of synchronous
machines (SM), which have favorable properties for the grid stability. The VIE models are
based on mathematical models of the SM dynamic behavior. These models give the voltage
and frequency reference signal to the converters. The complete internal model of SM
emulation has fully emulated the stator, rotor and mechanical details of the machine. A

37
simpler approach is to emulate the mechanical or rotational inertia which will determine the
voltage and frequency reference signal.
Several concepts exist of VIE and they have been presented in literature [34]. The models
are called Virtual SM, synchronous voltage source converters (VSC), virtual synchronous
generator and synchronous converter. All of the models are based on the swing equation,
which is defined as
2𝐻𝜔 =
𝑝∗ − 𝑝
𝜔− 𝐾d(𝜔 − 𝜔 ∗)
[11]
where H and Kd stand for the inertia and damping constants, 𝑝∗ and 𝜔∗ stands for power and
angular frequency setpoints, 𝜔 stands for the VSC output angular frequency. From the
equation it can be seen that VIE has a droop model which is based on the frequency deviation
between the setpoint and measured frequency and with setpoint power and measured power.
[34]
The challenge with using a SM model for the virtual inertia control is that the electrical
network is in a constantly changing state and the generators are responding to the change
with an inertial response almost 100% of the time. If the SM model is implemented in the
UPS with accurate simulated machine model, the same effect would happen with the UPS
system. This would lead to very high utilization of the DC energy source and would lead to
an unwanted behavior of the UPS, since the batteries would constantly be stressed. The
financial attractiveness of the virtual inertia product would drop because of the aging of the
batteries and the high usage of converters, which could lead to higher risks for the critical
load.
The benefits of the realistic modeling of SM’s compared to other inertia algorithms are not
high enough for justifying the negative financial and operative risks for the user. If there
would be a dead zone within the normal variations of the frequency SM modeling could
propose interesting benefits for the frequency control. However, the added complexity of
modelling a SM could raise the risk of software bugs and failures that could compromise the
critical loads

38
3.5 Energy storages
In this chapter the most common battery types, VRLA and Li-ion batteries are reviewed and
the usability for virtual inertia is estimated based on the properties. The other type of energy
source covered for UPSs are supercapacitors, which have interesting benefits for cyclical
usage and short discharge periods.
3.5.1 Batteries
The most commonly used battery type in UPS systems are VRLA (Voltage Regulated Lead
Acid) batteries because they are inexpensive and well suited for discharge periods of tens of
minutes and the technology is tested and reliable. A disadvantage with VRLA batteries is
that they are sensitive to ambient temperatures and should be installed in spaces with climate
control and a stable temperature of 20-25 °C. Another downside with VRLA batteries is the
number of cycles that the batteries can be discharged, which drops quite fast if the batteries
are discharged fully. Normally the UPS batteries only a discharged a limited time per year
during power outages, which are rare in most electrical networks, so the number of cycles is
not an issue. The situation changes a bit if the UPS has a secondary function where the
batteries are discharged constantly, for example when using the UPS as a reserve in FCR-N
markets, which requires an almost constant cycling of batteries. The typical number of cycles
for VRLA batteries is shown in figure 23. From the figure it can be seen that for most cases
the number of cycles is over 1000 because the UPS typically is discharged for a short
duration.

39
Figure 23. Number of cycles for VRLA batteries compared to the depth of discharge (100% 50% and 30% [35]).
Up to this point the UPS battery option has almost always been VRLA, but Li-ion batteries
are increasingly interesting for customers because of the reduced price and increased
availability of suppliers and different technologies. The benefits of Li-ion batteries are the
higher number of cycles, the high energy density which means a lighter and smaller battery
system and the durability in high temperatures. These factors make Li-ion batteries ideal for
secondary UPS functions such as the UPSaaR for FCR-N market. They will withstand the
constant charge and discharge and the decreased cost will make it attractive for customers
to invest in the Li-Ion technology. There are many different Lithium-ion chemistries and
they are usually classified based on the cathode material. These include:
Lithium manganese oxide (LMO), Lithium iron phosphate (LFP), Lithium titanium oxide
(LTO), Lithium-nickel manganese cobalt oxide (NMC), Nickel cobalt alumina (NCA),
Lithium cobalt oxide (LCO)[35].
For the virtual inertia usage, the battery type is not necessarily so critical, because the
discharge times per year will be limited and the discharge depth is extremely low, since the
duration of the discharge will only be seconds. This will cause a depth of discharge of a
fraction of the total capacity, which will enable a very high number of cycles for both VRLA
and Li-ion.

40
3.5.2 Supercapacitors
Supercapacitors have a much higher capacitance than other capacitors, up to 100 times
compared to electrolytic capacitors. The benefits of supercapacitors include a much higher
charge and discharge rate, a higher tolerance of discharge and charge cycles and a long
lifetime even in high temperatures. Supercapacitors can be used in UPS systems as a battery
replacement if the required backup time is low (1-30 seconds), ambient temperature is high,
or the discharge cycling is expected to be high. Compared to VRLA and Li-ion batteries,
supercapacitors can be discharged millions of times which is virtually unlimited in the case
of UPSs.
Supercapacitors are interesting products for the virtual inertia application because of the low
amount of energy discharged during the frequency response. A study done by Gauthier
Delille et al. for an isolated electrical grid in the French Islands of Guadeloupe shows the
usefulness of supercapacitors for generating virtual inertia in a power system with a large
share of solar and wind generation with the peak load of the Island being in the range of 115-
435 MW [36]. The study shows that the ROCOF can be decreased by introducing several
500 kW distributed energy storage systems with a capacitor bank of 61,9 F. When
comparing the scenarios with 12% and 30% renewable energy source penetration there was
a clear impact on the need for load shedding during a transient caused by generating units
tripping. The study modeled the dynamic support with three operating modes; power and
frequency droop, time derivative of frequency and charging and standby mode. It was shown
that charging should be avoided by some tens of minutes after the frequency event to ensure
that the power system is no longer weakened. The end of the dynamic support must have a
ramp down from full power to zero in order to avoid creating imbalances in the system. All
of the above attributes could easily be programmed in the UPS inertial response.
Las Palmas Islands has a similar system with Supercapacitors as frequency support during
disturbances [37]. The systems consist of a 5 MW 20 MWs ultracapacitor power bank and
DC-DC converter and AC-DC converter to feed the grid. The capacity of the supercapacitor
power banks is 55,5 F with a voltage of 1080 VDC. The results are shown in figure 24 where
a 2,5 MW generator has tripped in the network with a total of installed capacity of 105,5
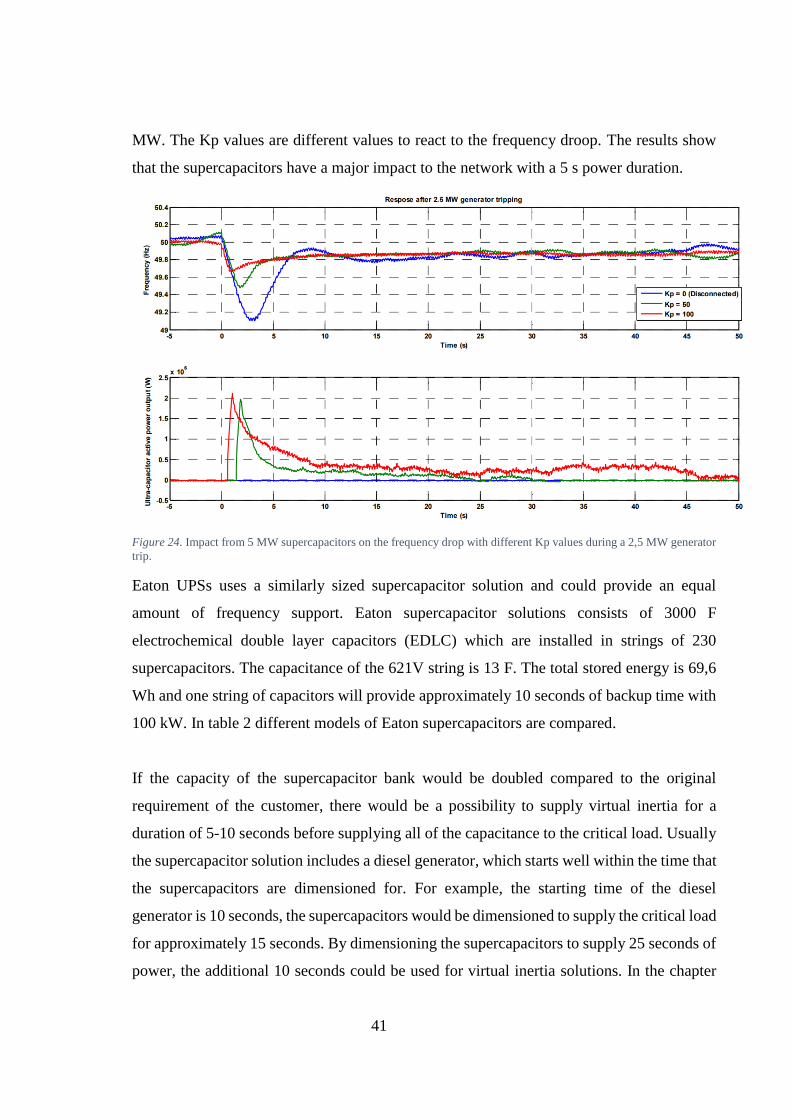
41
MW. The Kp values are different values to react to the frequency droop. The results show
that the supercapacitors have a major impact to the network with a 5 s power duration.
Figure 24. Impact from 5 MW supercapacitors on the frequency drop with different Kp values during a 2,5 MW generator
trip.
Eaton UPSs uses a similarly sized supercapacitor solution and could provide an equal
amount of frequency support. Eaton supercapacitor solutions consists of 3000 F
electrochemical double layer capacitors (EDLC) which are installed in strings of 230
supercapacitors. The capacitance of the 621V string is 13 F. The total stored energy is 69,6
Wh and one string of capacitors will provide approximately 10 seconds of backup time with
100 kW. In table 2 different models of Eaton supercapacitors are compared.
If the capacity of the supercapacitor bank would be doubled compared to the original
requirement of the customer, there would be a possibility to supply virtual inertia for a
duration of 5-10 seconds before supplying all of the capacitance to the critical load. Usually
the supercapacitor solution includes a diesel generator, which starts well within the time that
the supercapacitors are dimensioned for. For example, the starting time of the diesel
generator is 10 seconds, the supercapacitors would be dimensioned to supply the critical load
for approximately 15 seconds. By dimensioning the supercapacitors to supply 25 seconds of
power, the additional 10 seconds could be used for virtual inertia solutions. In the chapter

42
for the business case study the calculation is done by comparing the minimum required
supercapacitor storage and adding the extra capacity for frequency support.
Table 2 Techical specifications of Eaton Supercapacitors [38].
Capacitance (F) Part Number Maximum working voltage (V)
Maximum initial ESR (mΩ)
Stored energy (Wh)
3000 XL60-2R7308W-R 2.7 0.23 3.0
3400 XL60-2R9348W-R 2.85 0.23 3,8
The price for the XL60-2R9348W-R supercapacitor was found to be on Mouser website 52
€/ pc, hence the total price for one string of 230 capacitors would be 12 075 € [39]. The
supercapacitors need to be installed in a suitable cabinet and cabling, protection and other
accessories need to be included as well. The capacity of one string is as mentioned above 10
s for a 100 kW load. This value is used to calculate the financial benefit of purchasing
additional capacity to participate in the virtual inertia market.
3.5.3 Required battery capacity and impact on batteries from virtual inertia
The required battery capacity when using virtual inertia depends on the activation time for
primary reserves and the amount of inertia in the system. The inertia constant of synchronous
generators is typically in the range of 2-10 s as mentioned in the chapter for rotating
machines and system inertia. If the virtual inertia would be exactly similar as true inertia,
the required battery capacity would be below 10 s. The number of activations and usage of
batteries depend also on the algorithm and the sensitivity of the virtual inertia activation. The
quality of the electrical network obviously has a large impact on the activation times similar
to other reserves.
In table 3 the different activation times for primary reserves is listed for the Nordic grid,
Australian grid [40], New Zealand, National Grid in Great Britain and Eirgrid in Ireland. As
can be observed from the table, the time for primary frequency response ranges from 5 to 10
seconds. The activation times are similar in most electrical systems and this is partly based

43
on the fact that the inertia constant of most synchronous generators is 2-10s. The same value
can be used to estimate the required capacity from virtual inertia which can be assumed to
be maximum of 10 seconds.
Table 3. Primary reserve activation time for different geographical electrical grids.
Electricity Market
Primary reserves time to activation
50 % 100 %
Nordic Grid 5 s 30 s
National Electricity Market (AUS) 6 s 6 s
New Zealand 6 s 6 s
National Grid (UK) 10 s 10 s
Eirgrid (Ireland) 5 s 5 s
The duration of the activation is very short if the energy bank is a battery, such as Li-Ion or
VRLA. No capacity calculations are even required when assessing the usability of the UPS
system to supply virtual inertia when Li-Ion or VRLA batteries are considered. The
activation times need to be considered when assessing the lifetime impact from the inertial
response. However, if the energy storage solution is supercapacitors, careful calculations are
needed to assess the required number of supercapacitors to provide an inertial response so
that the critical load is protected in case that the frequency event leads to a blackout in the
electrical grid.

44
4 ELECTRICITY MARKET AND FAST RESPONSE PRODUCTS
The electricity markets studied in this thesis do not yet have a market product in place for
virtual inertia. The issue has been identified and TSOs are doing research on the matter [11],
[21]. Several markets have however introduced a type of fast frequency reserve to
compensate for the decreasing inertia with a faster response than the primary reserves. This
chapter is a literature study on the fast frequency reserves that are available in different
electrical grids, such as UK, Ireland and Australia. Entso-E defines fast frequency reserves
as “a system service that delivers a fast power change to mitigate the effect of reduced inertial
response, so that frequency stability can be maintained” [11]. In this chapter the products are
FFR (Fast Frequency Response) and EFR (Enhanced Frequency Response).
4.1 Frequency response monitoring
In the case of UPSaaR the monitoring and reporting of the primary frequency response is
straightforward, because the TSO or the aggregator will issue the command for the reserves
to activate and will receive the activation duration and time to activation immediately from
the unit. With virtual inertia the monitoring is more challenging, since the activation time
and activation duration is much shorter. This requires an independent activation and response
from the unit and the activations should be automatically logged and sent to the TSO or
aggregator.
The same type of communication unit as with UPSaaR could be used to issue the command
for the UPS to participate in the virtual inertia market. The virtual inertia functionality would
be activated, and the UPS would be ready for frequency response if needed. If an aggregator
is involved, they should have the ability to activate and de-active the virtual inertia
depending on if the UPS should participate in the inertia market at a certain time. This
depends on if the aggregator has offered the virtual inertia capacity for a certain time and if
the offer has been accepted on the market.
Many customers are worried about cyber security and any outside communication that can
control the UPS can be seen as a risk to the critical load. The commands that can be issued

45
to the UPS should be limited to activation and de-activation of the virtual inertia. Then the
UPS will independently decide if the command can be accepted. The risk with
communication protocols is that the UPS could be manipulated to activate too frequently or
in an unwanted manner and risk the critical load.
4.2 Enhanced frequency response
National grid in the UK has introduced Enhanced Frequency Response (EFR) to provide a
fast dynamic response during disturbances [41]. It is similar to FFR but has a longer
activation duration of 15 minutes and is bi-directional with a symmetrical sized positive and
negative control in parallel.
There are two different EFR services available:
- Service 1 (wide band)
- Service 2 (narrow band)
Activation limit is ±0,05 Hz for the wide band service 1 and ±0,015 Hz for the narrow band
service 2. The EFR service requirements include that the frequency change is detected within
500 ms and full contracted active power is to be provided within 1 s. Charging of batteries
is allowed within the dead-band.
The average tender prices for EFR in 2017-2018 have been listed in Table 4. The information
is available at the National Grid EFR market information website[41].
Table 4- Average tender prices for EFR service 1 (wide band) and service 2 (narrow band).
Year
Service 1 (Wide band) Service 2 (Narrow band)
Average price of tender £/MWh per annum
2018 11,96 20,89
2017 19,6 20,91
Considering the limitations of the UPS battery charger power, the amount of available EFR
capacity in the UPSs is around 10-30% of the nominal UPS power. This estimation is based
on a review of datasheet from UPS manufacturers which states that the maximum charging
current is in the range of 10-30% of the nominal power [42]–[44]. The activation times for
46
EFR are considerably high as can be seen from chapter 2 for the frequency statistics in the
UK.
4.3 Fast Frequency Response
FFR is a service that many transmission system operators are starting to implement
especially in isolated grids with a high share of renewables. The main features of FFR are
that it is activated very rapidly when the frequency reaches a certain limit and the response
is active only for a short duration.
The Australian TSO AEMO has planned to implement FFR into the electrical market in
response to the volatility of the frequency [11]. The operator sees an opportunity to utilize
many inverter-connected sources to generate FFR in the future and UPSs are certainly one
of the possibilities. In the article AEMO separates the inertia and FFR as different services
and describes the FFR as a way to restore the frequency, but without slowing RoCoF in the
same way as inertia. The same conclusion was made by the study [45] which states that FFR
improves the minimum frequency and slightly improves the RoCoF, but not as efficiently as
inertia.
The Nordic TSOs have plans to implement the FFR service already in 2020 according to a
statement made by Fingrid [46]. The technical requirements, product definition and
coordination between FFR and primary frequency reserves are not yet available. According
to the Entso-E article [11], the activation of the response might even be a combination
between minimum frequency and RoCoF, which would separate it from the other FFR
services.
Ireland has a similar FFR product available for the fast frequency response and it is operated
by EirGrid and SONI (System Operator of Northern Ireland). The frequency response
duration is 2-10 s and payment is based on the product of tariff, scalars and available volume
(Payment = Tariff x Scalars x Available volume) [47]. The scalars include technical qualities
such as products, performance and scarcity and all give a different multiplier for the total
payment. For example, the speed of the FFR response will give a higher multiplier for fast
response and this is very attractive in the case of UPS systems. Another scalar is the

47
frequency point where the unit responds to the frequency event, so it is possible to optimize
the UPS response to frequency events in a very adjustable fashion. In figure 25 the scalar
value for different activation speeds is listed and in figure 26 the response frequency limit.
Figure 25. Product scalar for activation time for the FFR service. A faster response will increase the scalar and the
compensation for the service.
Figure 26. Product scalar for minimum frequency when the service is triggered with a higher scalar for a higher activation
frequency.

48
The recommended tariffs are listed in table 5, from which the rate of FFR is 2.16 € / MWh.
If the scalar values for only speed and frequency limits are taken into consideration the UPS
could easily respond to the 1 second activation whereas the frequency limit could be 49,8
Hz, which brings a modest amount of activations per year, as could be seen from chapter 2.
These would enable multipliers of 1,67 and 0,85 to be used, a total of 1,42. The potential for
earnings would be 26.868€/MW per annum.
Table 5 Rates of payment in Ireland for different frequency response services.

49
5 BUSINESS CASE
In this chapter the development cost is roughly estimated using a simple model for software
development calculations. The virtual inertia product parameters and market structure is
estimated based on existing fast response products. The return potential is calculated with
the estimated values for different combinations of market products. Finally, the chapter
includes a risk assessment for the critical load when using the virtual inertia function.
5.1 Product development requirements
The Eaton UPSs are technically capable virtual inertia implementation without any major
changes in the basic hardware. The changes are software based and the communication
between the UPS and TSO must be developed, but since it has already been developed for
the UPSaaR product, only minor changes are required.
Software development is needed and will require the most contribution from research and
development to create the virtual inertia capability. Constructive Cost Model (COCOMO) is
a simple cost estimation model for software development and it can be used to roughly
estimate the required man-months and development time for the software [48]. COCOMO
has been criticized for being too inaccurate [49] but nevertheless it can be helpful for doing
a rough estimate on the required resources for development. The following equations can be
used to calculate the man-months and development time in months.
𝑀𝑀 = 𝑎 ∗ 𝐾𝐿𝑂𝐶𝑏 [12]
𝑇𝐷𝐸𝑉 = 2,5 ∗ 𝑀𝑀𝑐 [13]
Where
MM is man-months,
KLOC is estimated number of delivered lines expressed in thousands,
TDEV is development time in months,
a, b and c are constants based on the class of software product as can be seen in table 6.

50
Table 6. Constants for calculating the man-months required for developing software in with various classes of products.
Software project ab bb cb
Organic 2.4 1.05 0.38
Semi-detached 3.0 1.12 0.35
Embedded 3.6 1.20 0.32
The software class can be assumed as organic, since the description of this class is that it
includes 2-50 KLOC, it is a small project with little time-constraints. In figure 27 the
estimated man-months is plotted for the different styles of projects.
Figure 27. Required man-months for delivered lines in thousands with different types of software projects.
After the hardware and software development have been finished a testing setup needs to be
developed. This will include building a test environment for the product with an input feed
capable of simulating a frequency event in the network such as generator failure or a large
loss of load. The testing method should include simulations with different scenarios
involving various amount of inertia and RoCoF. Dynamic changes in the UPS load should
also be tested when the inertial response is active, such as a load short circuit or large load
changes. The testing phase and development phases are interacting to find the optimal values
and inputs for the algorithm, so the estimated time frame is challenging to predict.
0,0
5,0
10,0
15,0
20,0
25,0
30,0
1 2 3 4 5
Req
uir
ed m
an-m
on
ths
Estimate number of delivered lines (thousands)
Organic Semi-detached Embedded

51
After the testing phase has been completed and the final product and algorithm is fully
implemented in the UPS, the final validation process can begin. It will include
documentation, verification of performance, safety and productizing the final virtual inertia
UPS product for commercial use. The information for man-hours and actual costs for
different development stages involves internal trade secrets that are not publishable in this
thesis. However, the lack of such detailed information does not hinder the reader from
understanding the essential content.
5.2 Virtual inertia product
The electricity markets studied in this thesis do not currently have in place a specific virtual
inertia product. There are many articles that speculate on the need of such as product, but no
specific solution has yet been developed [2][3][11][21].
The inertia product would have to be the first response to a frequency event and would
immediately react to the RoCoF and minimum frequency. The response activation time and
speed of the response from 0 to 100 % power would need to be rapid. The challenge of the
instantaneous response was described in chapter 3 requirements for the UPS electronics. The
reserve must be able to handle the frequency disturbances such as transients and distortions
in the local electrical network, which can be caused by switching devices, synchronous
machine magnetizing currents and similar dynamic changes. The duration of the response
would be such that the primary reserves have time to activate. It would be recommendable
to have soft ramp when ending the response to avoid more sudden changes in the network.
Since the market product is not yet available, the compensation structure can only be
speculated at this time. The compensation structure would need to be based on availability
of the inertia and not activation times, which is a similar compensation structure as primary
reserves and fast response products. Possibly the compensation could be based upon the
actual power of the inertia constant. The inertia constant was introduced in chapter 2 which
described how the inertia constant was calculated for rotating machines. This approach
brings up the question that how virtual inertia and actual inertia can be separated, and would
the compensation be issued also for idle generators that have real rotating inertia. The
52
environmentally friendly approach would in this scenario be nullified quite effectively, since
disposing of idle generators is one of the reasons for the decreasing inertia in the electrical
network.
The closest reference that is available for virtual inertia are the fast response products FFR
and EFR. They have similar properties for activation speed and quantity of activation per
year. If it is assumed that FFR and EFR can be taken as references to the pricing of the inertia
product, then it can be estimated that the compensation is in the range of 25 k€/MW per
annum in the Nordics, in Britain and Ireland in the range of 25-30 k€/MW per annum.
5.3 Return potential
The return potential for participating in the virtual inertia market is calculated with the help
of market information for other fast response products. The capacity of the UPS is split into
two parts. One is the full nominal power with only up-regulation and the other calculation is
done with the possibility that the virtual inertia product will be a symmetrical response with
upwards and downwards regulation.
The compensation for the virtual inertia product is based on FFR and EFR, with the
hypothesis that symmetrical regulation with both upwards and downwards response the
compensation would be approximately 50 % higher. The downward response is limited by
the battery charger to approximately 20 % of the nominal power, which is based on UPS
datasheets [42]–[44]. Figure 28 shows the return potential for these two options.

53
Figure 28. Return potential for virtual inertia for up-regulation and symmetrical regulation. The symmetrical regulation
potential is lower because of the charging power limitations.
In chapter 3 the specifications and prices for supercapacitors were listed and the hypothesis
was made that it can be beneficial to invest in an oversized capacitor bank to be able to
participate in the inertia market. From the above values it can be determined that this
investment is mildly interesting since the earning potential for 100 kW is approximately 2,5
k€ annually and the cost for 100 kW of supercapacitors for 10 s backup time was priced at
approximately 12-13 k€. The payback time for such an investment would be 5 years without
taking into consideration inflation or other factors.
The benefit with using converters and batteries is the possibility to offer the same UPS
capacity to fast response markets and primary reserve markets. The virtual inertia and similar
fast responses with a short response duration and infrequent activations are basically free
money for the owner of the UPS. The discharged capacity is so small that they can easily
offer the remaining capacity to other markets as well, such as FCR-D in the Nordics and
POR (Primary Operating Reserve) in Ireland, which will activate after the virtual inertia
response has ended. In this manner it is possible to earn revenue from several frequency
response services.

54
In figures 29 and 30 calculations have been made on the basis that bids have been offered to
several markets and the virtual inertia is up-regulating. In Ireland one could participate in
the POR (Primary Operating Reserve), which has a requirement of maintaining the power
output for 15 seconds and SOR (Secondary Operating Reserve), which has the requirement
of power output for 90 seconds [47]. The values from table 5 are used for the compensation
calculations in figure 29 for Ireland.
Figure 29. Return potential in Ireland per year for offering 100 kW, 500 kW and 1000 kW capacity to virtual inertia market,
virtual inertia + POR and virtual inertia + POR + SOR.
In the Nordics one could participate on top of the virtual inertia product to the FCR-D
market. The average market price between 2015-2018 of 35 k€/MW per annum is used for
the calculations[47]. Figure 30 show the earning potential per year for offering capacity to
different markets.
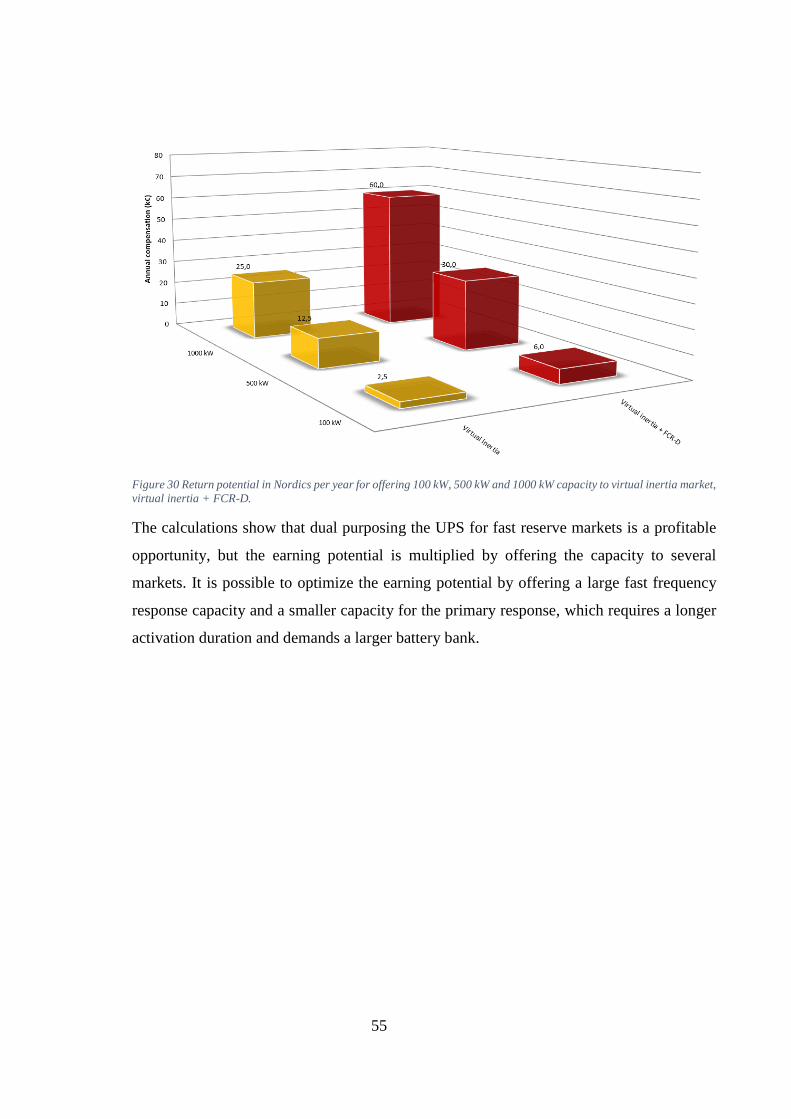
55
Figure 30 Return potential in Nordics per year for offering 100 kW, 500 kW and 1000 kW capacity to virtual inertia market,
virtual inertia + FCR-D.
The calculations show that dual purposing the UPS for fast reserve markets is a profitable
opportunity, but the earning potential is multiplied by offering the capacity to several
markets. It is possible to optimize the earning potential by offering a large fast frequency
response capacity and a smaller capacity for the primary response, which requires a longer
activation duration and demands a larger battery bank.

56
5.4 Risks for the critical load
The purpose of the UPS is to protect the critical load from external power quality issues and
the usage of the secondary application of virtual inertia cannot cause any risk of load loss.
The argument against using UPSs for secondary functions such as UPSaaR, FFR, virtual
inertia or similar reserves is that during these disturbances the UPS shall be used only for
securing the critical loads for which it is originally acquired, and not to compromise the
reliability with additional complex operations.
The primary function of the UPS is activated when there is a fault in the electrical network
of the building or in the local distribution network. The secondary function (virtual inertia)
is activated when there is an imbalance between the generation and consumption on the level
of the synchronous electrical grid. These are two separate events and the grid usually
recovers from small disturbances which would activate the secondary function. It is highly
unlikely that the grid scale disturbance and the local failure would be happening at the same
time. If there is an issue with the energy storage bank and the UPS must return to Online
mode from the secondary function, then it is only beneficial that the functionality is tested
in steady intervals.
The added complexity of adding the virtual inertia algorithm to the UPS control architecture
is the actual risk when using the UPS for secondary functions. If the programming and testing
phases are executed carefully, the risk of unforeseen behavior in the algorithm is small. The
risk for the primary function can also be caused by excess usage of the battery capacity,
which would compromise the critical load during a power outage when the batteries are
needed. This risk can be eliminated by setting limits for the minimum voltage in the DC
circuit which would disable the virtual inertia algorithm until the batteries are charged back
to an acceptable capacity. Another risk with using the secondary function is a dynamic
situation in the critical load such as a short circuit, where the UPS would need to feed short
circuit current to isolate the fault so that other operational loads are not affected. This needs
to be tested in the verification stage of the virtual inertia product and estimate how the
dynamic situation affects the behavior if at the same time the UPS supplies virtual inertia to
the grid.

57
In table 7 the average number of discharges and discharge times per day have been calculated
for the UK grid based on the RoCoF data presented in chapter 2. Table 8 shows the average
number and average duration of discharges per day for the minimum frequency limits.
Table 7. Average number and duration of discharges per day related to the RoCoF values in the UK.
UK grid -0,01 Hz/s -0,02 Hz/s -0,03 Hz/s -0,05 Hz/s
Average number of discharges per day 46,1 2,4 0,5 0,2
Average discharge time per day [s] 67,2 3,2 0,7 0,2
0,01 Hz/s 0,02 Hz/s 0,03 Hz/s 0,05 Hz/s
Average number of discharges per day 33,0 2,3 0,3 0,1
Average discharge time per day [s] 39,6 2,4 0,4 0,1
±0,01 Hz/s ±0,02 Hz/s ±0,03 Hz/s ±0,05 Hz/s
Total number of discharges per day 79,2 4,7 0,8 0,3
Total average discharge time per day [s] 106,9 5,6 1,1 0,3
Table 8. Average number and duration of discharges per day related to the minimum frequency values in the UK.
UK grid 49,9 Hz/s 49,8 Hz/s
Average number of discharges per day 125,3 0,8
Average discharge time per day [s] 2405,7 9,3
In Table 9 the average number of discharges and discharge times per day have been
calculated for the Nordic grid based on the RoCoF data presented in chapter 2. Table 10
shows the average number and average duration of discharges per day for the minimum
frequency limits.
Table 9 Average number and duration of discharges per day related to the RoCoF values in the Nordics.
Nordic grid -0,01 Hz/s -0,02 Hz/s -0,03 Hz/s -0,05 Hz/s
Average number of discharges per day 113,1 1,7 0,6 0,1
Average discharge time per day [s] 35,1 1,4 0,6 0,1
0,01 Hz/s 0,02 Hz/s 0,03 Hz/s 0,05 Hz/s
Average number of discharges per day 134,6 2,0 0,6 0,2
Average discharge time per day [s] 43,1 1,4 0,6 0,1
±0,01 Hz/s ±0,02 Hz/s ±0,03 Hz/s ±0,05 Hz/s
Total number of discharges per day 247,7 3,7 1,3 0,3
Total average discharge time per day [s] 78,1 2,9 1,2 0,2

58
Table 10 Average number and duration of discharges per day related to the minimum frequency values in the Nordics.
Nordic grid 49,9 Hz/s 49,8 Hz/s
Average number of discharges per day 89,2 0,3
Average discharge time per day [s] 892,0 1,2
From these statistics it can be noted that the difference between normal variations and rare
events is large. The activation times would be less than one per day if the minimum
frequency would be 49,8 Hz and RoCoF limit -0,05 Hz/s. Compared to the requirements
from several TSOs and the equipment RoCoF withstand limits, the activation limit of -0,05
Hz/s would be sufficient [28][18]. The battery usage per day would be very low, even with
a RoCoF limit of 0,02 Hz/s it would be only a few seconds per day at average. The battery
lifetime would not be compromised since the discharged capacity is minimal with these
values. Based on these parameters the risk for the critical load is not caused by the response
activation count or depth of discharge.

59
6 SUMMARY AND CONCLUSIONS
This thesis was a study on the possibility of using virtual inertia from UPSs to compensate
the loss of rotating inertia in the power grid caused by the shift from traditional power
generators towards converter-based renewable energy sources. The frequency data available
from Nordics and UK were analyzed to show the frequency statistics and RoCoF statistics
for 2017. From these values it was seen that outside normal frequency variations the
frequency events were equally low in the Nordics and UK, and the virtual inertia response
times can be estimated to be low. The variations in the frequency will however likely
increase in the future and the trend was shown for the Nordic grid.
Modern double-conversion UPS devices were found to be capable of providing virtual
inertia response as long as they include bi-directional converters and sufficient converter
control capabilities. Other requirements were accurate and reliable frequency and RoCoF
measurements to avoid false activations and to enable a rapid response to frequency events.
The virtual inertia algorithms presented were droop control, derivative control and
synchronous machine emulation. These algorithms should be analyzed in more detail in
future research, but it was estimated that the most interesting algorithm is the combination
of derivative and droop, which improves the minimum frequency and RoCoF without any
major drawbacks.
The battery solutions for UPSs are compared and supercapacitors are found to be an
interesting possibility for fast frequency responses. The effect of virtual inertia on storage
capacity is very small if the algorithm is designed optimally and supercapacitors could be
used for frequency support, despite the low capacity. VRLA and Lithium-ion batteries can
both be utilized, and the wear caused by the virtual inertia response with the suggested
activation parameters is low.
The development needs for the virtual inertia implementation is mainly software based since
the hardware is already capable of primary frequency response. The importance of thorough
testing and validation is emphasized in order to eliminate the risks for the critical load in
dynamic situations. The virtual inertia market product requirements and compensation

60
structure was estimated based on other fast frequency response products such as FFR and
EFR. It was estimated that the compensation for virtual inertia would be in a similar range.
The return potential for the virtual inertia was estimated to be 25 k€ per annum in Ireland
and Nordics for 1 MW of UPS capacity with up-regulation. Symmetrical regulation was
estimated to be priced higher, but the limited charging capacity of UPSs will limit the amount
of usable power in a down-regulation scenario to approximately 20 % of the nominal
capacity. There is also an interesting opportunity to offer the same UPS capacity to fast
frequency response and primary reserve markets simultaneously. This would increase the
earning potential to 70 k€ per annum in Ireland and 60 k€ per annum in the Nordics for 1
MW of UPS capacity.
The risk for the critical load was estimated to be caused by the increased complexity of the
UPS software when using virtual inertia algorithms and not by the actual frequency response
event. The primary and secondary functions of the UPS are separate events and it is highly
unlikely that they would happen simultaneously. The frequency and RoCoF statistics were
analyzed and the daily activation times were shown to be 1-2 per day and would not inflict
a risk for battery failure or capacity degradation.
Inertia is required to keep the network stable in the future when converter-based generation
will increase. The UPSs can be reliably used for primary frequency response and it has been
demonstrated by several pilot projects. The modern UPSs have a potential for contributing
to a faster frequency response or inertial response which will stabilize the network without
the need for installing dedicated frequency response sources. In future research when the
virtual inertia product will become commercially available, the algorithm should be
developed based on the activation parameters issued by the transmission network operator.

REFERENCES
[1] A. Alahaivaia and M. Lehtonen, “Sizing of a photo voltaic-storage system for power
system frequency support,” in 2017 14th International Conference on the European
Energy Market (EEM), Dresden, Germany, 2017, pp. 1–6.
[2] “Lithium-ion Batteries for providing Virtual Inertia." [Online]. Available:
http://integrationworkshops.org/crete/wp-
content/uploads/sites/13/2018/05/7A_5_TENE18_059_paper_Beushausen_Lennart.p
df. [Accessed: 17-Feb-2019].
[3] V. Knap, R. Sinha, M. Swierczynski, D.-I. Stroe, and S. Chaudhary, “Grid inertial
response with Lithium-ion battery energy storage systems,” in 2014 IEEE 23rd
International Symposium on Industrial Electronics (ISIE), Istanbul, Turkey, 2014, pp.
1817–1822.
[4] J. Fang, X. Li, and Y. Tang, “Grid-connected power converters with distributed
virtual power system inertia,” in 2017 IEEE Energy Conversion Congress and
Exposition (ECCE), Cincinnati, OH, 2017, pp. 4267–4273.
[5] I. Alaperä, S. Honkapuro, and J. Paananen, “Data centers as a source of dynamic
flexibility in smart girds,” Applied Energy, vol. 229, pp. 69–79, Nov. 2018.
[6] “Pages - Glossary.” [Online]. Available: https://docstore.entsoe.eu/data/data-
portal/glossary/Pages/home.aspx. [Accessed: 16-Oct-2018].
[7] P. Kundur, “Power system stability and control.” [Online]. Available:
http://www.elcom-
hu.com/Electrical/Power%20System%20Stability/%5Bprabha%20kundur%5D%20po
wer%20system%20stability%20and%20control.pdf. [Accessed: 04-Jan-2019].
[8] “HVDC Inertia provision,” SINTEF. [Online]. Available:
http://www.sintef.no/en/projects/hvdc-inertia-provision/. [Accessed: 05-Jan-2019].
[9] G. Claudio, “Coordinated Frequency Control of Wind Turbines in Power Systems
with High Wind Power Penetration,” p. 289, 2011.
[10] M. Altin, R. Teodorescu, B. B. Jensen, U. D. Annakkage, F. Iov, and P. C. Kjaer,
“Methodology for assessment of inertial response from wind power plants,” in 2012
IEEE Power and Energy Society General Meeting, San Diego, CA, 2012, pp. 1–8.
[11] E. Ørum et al. ‘Future System Inertia 2.’
[12] “Fingrid taajuusohjattu-kaytto--ja-hairioreservi.” [Online]. Available:
https://www.fingrid.fi/sahkomarkkinat/reservit-ja-saatosahko/taajuusohjattu-kaytto--
ja-hairioreservi/. [Accessed: 01-Dec-2018].
[13] “https://ec.europa.eu/energy/en/topics/renewable-energy.” [Online]. Available:
https://ec.europa.eu/energy/en/topics/renewable-energy. [Accessed: 06-Dec-2018].
[14] J. Alipoor, Y. Miura, and T. Ise, “Distributed generation grid integration using virtual
synchronous generator with adoptive virtual inertia,” in 2013 IEEE Energy
Conversion Congress and Exposition, Denver, CO, USA, 2013, pp. 4546–4552.
[15] J. Fang, H. Li, Y. Tang, and F. Blaabjerg, “Distributed Power System Virtual Inertia
Implemented by Grid-Connected Power Converters,” IEEE Transactions on Power
Electronics, vol. 33, no. 10, pp. 8488–8499, Oct. 2018.
[16] D. Duckwitz and B. Fischer, “Modeling and Design of $df/dt$ -Based Inertia Control
for Power Converters,” IEEE Journal of Emerging and Selected Topics in Power
Electronics, vol. 5, no. 4, pp. 1553–1564, Dec. 2017.

[17] E. Ørum et al., ‘Future System Inertia.’ [Online]. Available:
https://docstore.entsoe.eu/Documents/Publications/SOC/Nordic/Nordic_report_Futur
e_System_Inertia.pdf.
[18] C. Broderick, “Rate of Change of Frequency (RoCoF) withstand capability.”
[Online]. Available:
https://docstore.entsoe.eu/Documents/Network%20codes%20documents/NC%20RfG
/IGD_RoCoF_withstand_capability_final.pdf.
[19] Fingrid, “Frequency quality analysis,” 2017. [Online]. Available:
https://www.fingrid.fi/globalassets/dokumentit/fi/kantaverkko/suomen-
sahkojarjestelma/frequency_quality_analysis_2017.pdf. [Accessed: 16-Feb-2019].
[20] “Taajuus - historiatieto - Fingridin avoin data.” [Online]. Available:
https://data.fingrid.fi/fi/dataset/frequency-historical-data. [Accessed: 16-Feb-2019].
[21] “Fast frequency response in the NEM.” [Online]. Available:
https://www.aemo.com.au/-
/media/Files/Electricity/NEM/Security_and_Reliability/Reports/2017/FFR-Working-
Paper---Final.pdf. [Accessed: 23-Nov-2018].” .
[22] A. Stan, M. Świerczyński, D. Stroe, R. Teodorescu, and S. J. Andreasen, “Lithium
ion battery chemistries from renewable energy storage to automotive and back-up
power applications — An overview,” in 2014 International Conference on
Optimization of Electrical and Electronic Equipment (OPTIM), 2014, pp. 713–720.
[23] J. Ulvinen, “Double-Conversion Uninterruptible Power Supplies as Energy Storages
in the Low-Voltage Grid,” p. 105.
[24] A. Abokhalil, A. Awan, and A.-R. Al-Qawasmi, “Comparative Study of Passive and
Active Islanding Detection Methods for PV Grid-Connected Systems,” Sustainability,
vol. 10, no. 6, p. 1798, May 2018.
[25] “https://powerquality.eaton.com/EMEA/UPSaaR/default.asp.” [Online]. Available:
https://powerquality.eaton.com/EMEA/UPSaaR/default.asp. [Accessed: 11-Dec-
2018].
[26] “Fortum Spring | Fortum.” [Online]. Available: https://www.fortum.com/products-
and-services/smart-energy-solutions/virtual-battery-spring. [Accessed: 14-Jan-2019].
[27] “Fast Frequency Reserves 2018 - pilot for raske frekvensreserver.” [Online].
Available:
https://www.statnett.no/contentassets/250c2da4dd564f269ac0679424fdfcfc/evaluerin
g-av-raske-frekvensreserver.pdf. [Accessed: 24-Feb-2019].
[28] “Standard tests and requirements for rate-of-change of frequency (ROCOF)
measurements in smart grids.” [Online]. Available: http://www.euramet.org/project-
15nrm04. [Accessed: 23-Dec-2018].
[29] “RoCoF Alternative Solutions Technology Assessment.” [Online]. Available:
http://www.eirgridgroup.com/site-files/library/EirGrid/RoCoF-Alternative-Solutions-
Technology-Assessment-Phase-1-DNV-GL-Report_.pdf. [Accessed: 03-Jan-2019].
[30] “Phase locked loop and synchronization methods for gridinterfaced converters: a
review.” [Online]. Available: http://pe.org.pl/articles/2011/4/48.pdf. [Accessed: 12-
Feb-2019].
[31] “Muuntaja paloi Olkiluodon ydinvoimalan edustalla – kakkosreaktori putosi
valtakunnan sähköverkosta,” Yle Uutiset. [Online]. Available: https://yle.fi/uutiset/3-
10310514. [Accessed: 06-Jan-2019].
[32] “UPS Paralleling - Powerware Hot Sync Technology | Eaton.” [Online]. Available:
https://powerquality.eaton.com/Suomi/Technology-Applications/Technology-
Leadership/FI-ups-paralleling.asp. [Accessed: 26-Feb-2019].
[33] P. Rodriguez, E. Rakhshani, A. Mir Cantarellas, and D. Remon, “Analysis of
derivative control based virtual inertia in multi-area high-voltage direct current
interconnected power systems,” IET Generation, Transmission & Distribution, vol.
10, no. 6, pp. 1458–1469, Apr. 2016.
[34] R. Ofir, U. Markovic, P. Aristidou, and G. Hug, “Droop vs. virtual inertia:
Comparison from the perspective of converter operation mode,” in 2018 IEEE
International Energy Conference (ENERGYCON), Limassol, 2018, pp. 1–6.
[35] “UPS Battery Systems.” [Online]. Available:
https://library.e.abb.com/public/4273d7e6a4134cb3afc4bcfa288e2356/UPS%20Batter
y%20Systems_EN.pdf. [Accessed: 16-Feb-2019].
[36] G. Delille, B. Francois, and G. Malarange, “Dynamic Frequency Control Support by
Energy Storage to Reduce the Impact of Wind and Solar Generation on Isolated
Power System’s Inertia,” IEEE Transactions on Sustainable Energy, vol. 3, no. 4, pp.
931–939, Oct. 2012.
[37] “Canary Islands Benefit from Enhanced Grids,” Transmission & Distribution World,
27-Jan-2015. [Online]. Available: https://www.tdworld.com/renewables/canary-
islands-benefit-enhanced-grids. [Accessed: 08-Jan-2019].
[38] “eaton-xl60-supercapacitors-cylindrical-cells-data-sheet.pdf.” .
[39] “Eaton Supercapacitors / Ultracapacitors | Mouser Europe.” [Online]. Available:
https://eu.mouser.com/Search/Refine?Ntk=P_MarCom&Ntt=130775079. [Accessed:
19-Jan-2019].
[40] “Guide to Ancillary Services in the National Electricity Market.” [Online]. Available:
https://www.aemo.com.au/-/media/Files/PDF/Guide-to-Ancillary-Services-in-the-
National-Electricity-Market.pdf. [Accessed: 19-Jan-2019].
[41] “Enhanced frequency response (EFR) | National Grid ESO.” [Online]. Available:
https://www.nationalgrideso.com/balancing-services/frequency-response-
services/enhanced-frequency-response-efr. [Accessed: 24-Jan-2019].
[42] “Eaton 93PM UPS Technical Specifications.” [Online]. Available:
https://powerquality.eaton.com/Indonesia/Products-services/Backup-Power-
UPS/93PM-UPS/93PM-specs.asp?cx=37. [Accessed: 24-Feb-2019].
[43] “Power Xpert 9395M UPS Technical Specs.” [Online]. Available:
https://powerquality.eaton.com/products-services/backup-power-ups/9395m-
ups/9395m-specs.asp?cx=3. [Accessed: 24-Feb-2019].
[44] “Schneider SymmetraTM PX 250/500 kW 400/480 V Technical Specifications.”
[Online]. Available: https://download.schneider-
electric.com/files?p_enDocType=Specification+guide&p_File_Name=MBPN-
9QECL6_R3_EN.pdf&p_Doc_Ref=APC_MBPN-9QECL6_EN.
[45] R. Eriksson, N. Modig, and K. Elkington, “Synthetic inertia versus fast frequency
response: a definition,” IET Renewable Power Generation, vol. 12, no. 5, pp. 507–
514, Apr. 2018.
[46] L. Minna, “Sähköjärjestelmän matalan inertian hallinta.” [Online]. Available:
https://www.fingrid.fi/globalassets/dokumentit/fi/yhtio/toimikunnat/180612-
sahkojarjestelman-matalan-inertian-hallinta.pdf. [Accessed: 16-Oct-2018].
[47] “DS3 Consultations and Publications.” [Online]. Available:
http://www.eirgridgroup.com/how-the-grid-works/ds3-programme/ds3-consultations-
and-pub/. [Accessed: 24-Jan-2019].
[48] “Software Engineering | COCOMO Model,” GeeksforGeeks, 13-Apr-2018. [Online].
Available: https://www.geeksforgeeks.org/software-engineering-cocomo-model/.
[Accessed: 17-Feb-2019].
[49] “The Shape of Code » COCOMO: Not worth serious attention.” [Online]. Available:
http://shape-of-code.coding-guidelines.com/2016/05/19/cocomo-how-not-to-fit-a-
model-to-data/. [Accessed: 01-Jan-2019].
[50] “Taajuusohjattu käyttö- ja häiriöreservi (FCR-N ja FCR-D), vuosimarkkinahankinta
ja toteutuneet tuntikaupat,” Fingrid. [Online]. Available:
https://www.fingrid.fi/sahkomarkkinat/reservit-ja-
saatosahko/reservimarkkinainformaatio/Taajuusohjattu-kaytto-ja-hairioreservi-
vuosimarkkinahankinta-ja-toteutuneet-tuntikaupat/. [Accessed: 18-Feb-2019].