visualizing temporal evolution of networks jae-wook ahn, awalin sopan, catherine plaisant, meirav...
TRANSCRIPT

HCIL Symposium 2011
Visualizing Temporal Evolution of Networks
Jae-wook Ahn, Awalin Sopan, Catherine Plaisant, Meirav Taieb-maimon, and Ben Shneiderman
{jahn,awalin,plaisant,ben}@cs.umd.edu; [email protected]
Human Computer Interaction LabUniversity of Maryland
5/26/11
HCIL Symposium 2011 2
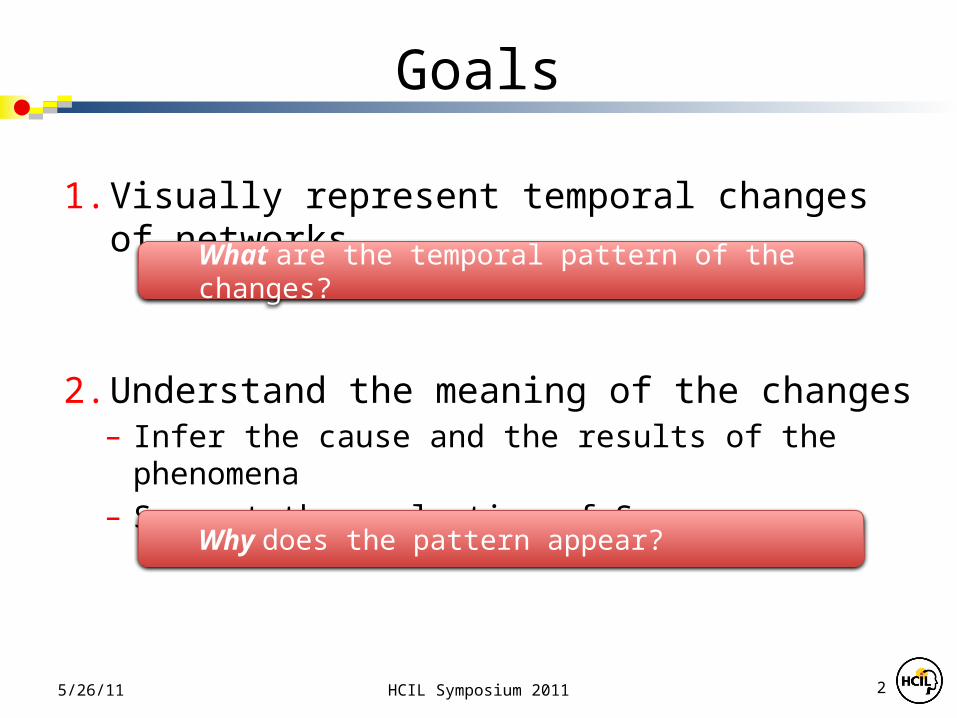
Goals
1. Visually represent temporal changes of networks
2. Understand the meaning of the changes– Infer the cause and the results of the phenomena– Support the evaluation of Success
5/26/11
What are the temporal pattern of the changes?
Why does the pattern appear?

HCIL Symposium 2011 3
What to Visualize?
• Nation of Neighbors– Collaboration with a social community service– http://www.nationofneighbors.com
• Temporal evolution of social activities– Conversation (Post & Reply network)– Crime report– Invitation network to the service
• Additional variables for inferential analysis
5/26/11
HCIL Symposium 2011 4
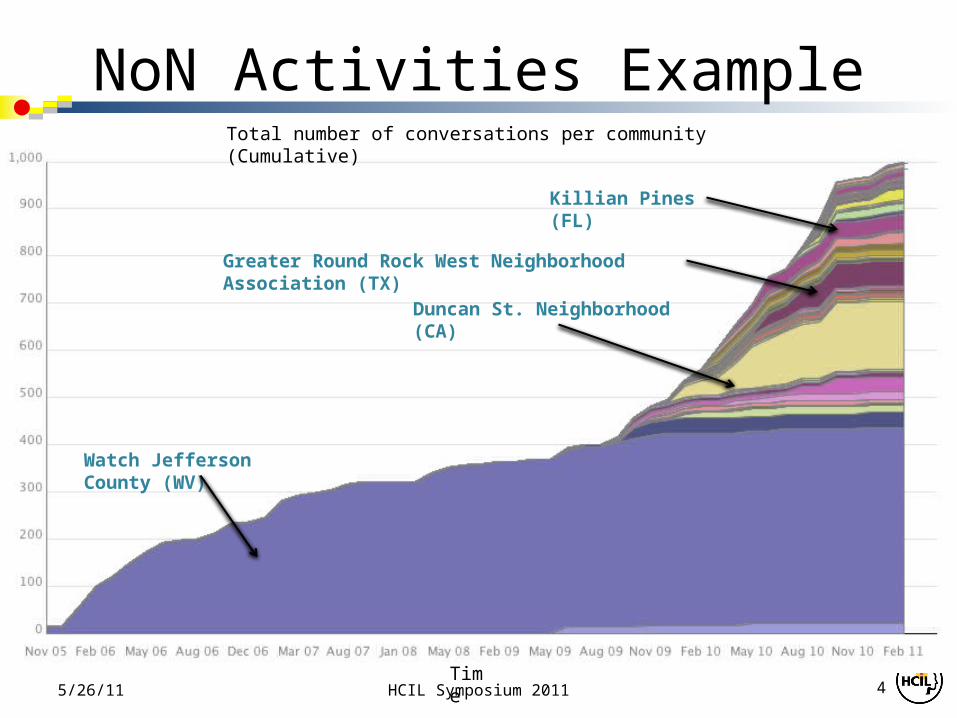
NoN Activities ExampleTotal number of conversations per community (Cumulative)
5/26/11Time
Watch Jefferson County (WV)
Duncan St. Neighborhood (CA)
Greater Round Rock West Neighborhood Association (TX)
Killian Pines (FL)
HCIL Symposium 2011 5
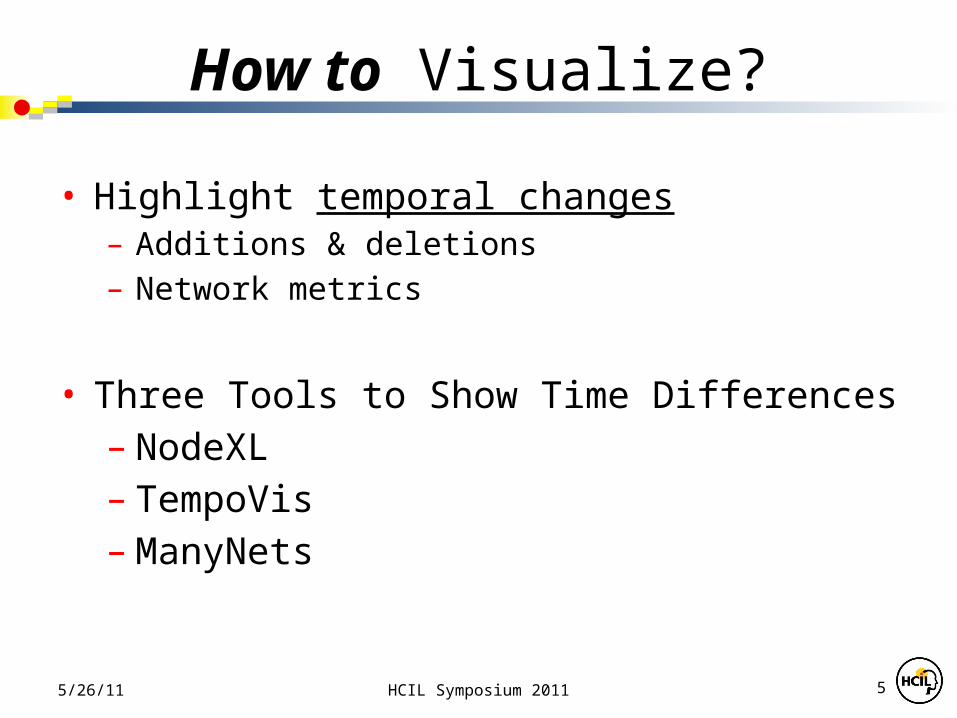
How to Visualize?
• Highlight temporal changes– Additions & deletions– Network metrics
• Three Tools to Show Time Differences– NodeXL– TempoVis– ManyNets
5/26/11
HCIL Symposium 2011 6
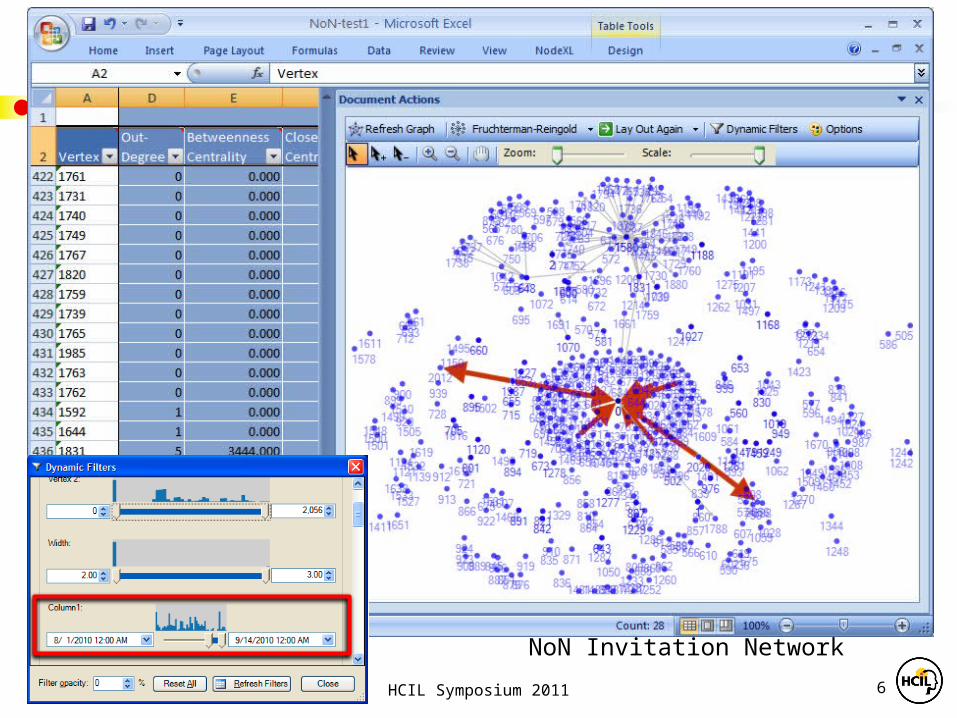
NodeXL www.codeplex.com/nodexl
5/26/11
NoN Invitation Network
HCIL Symposium 2011 7
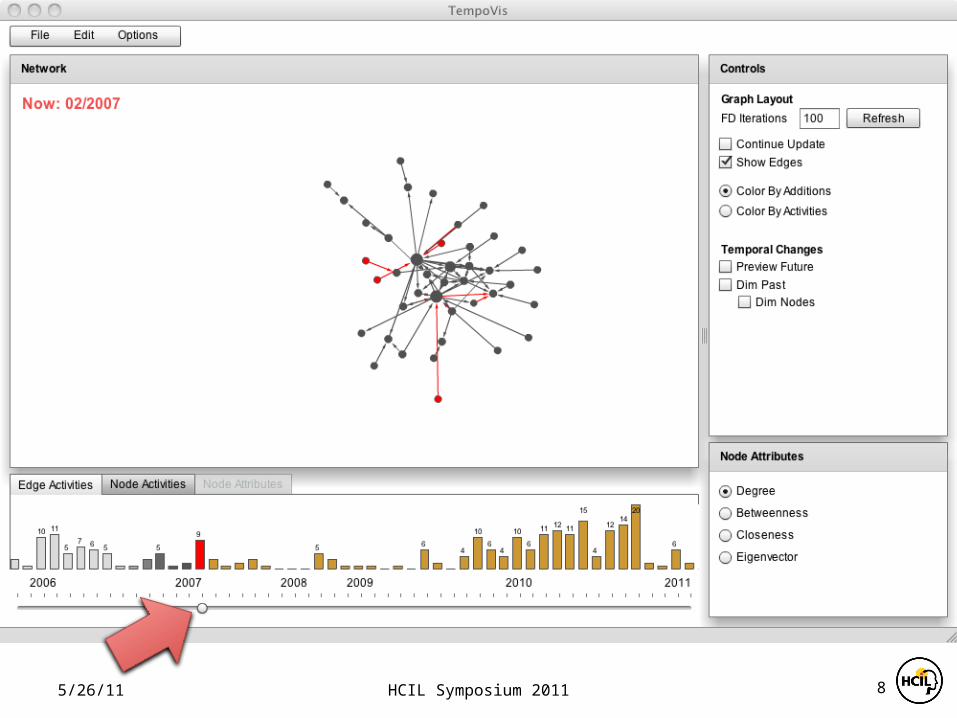
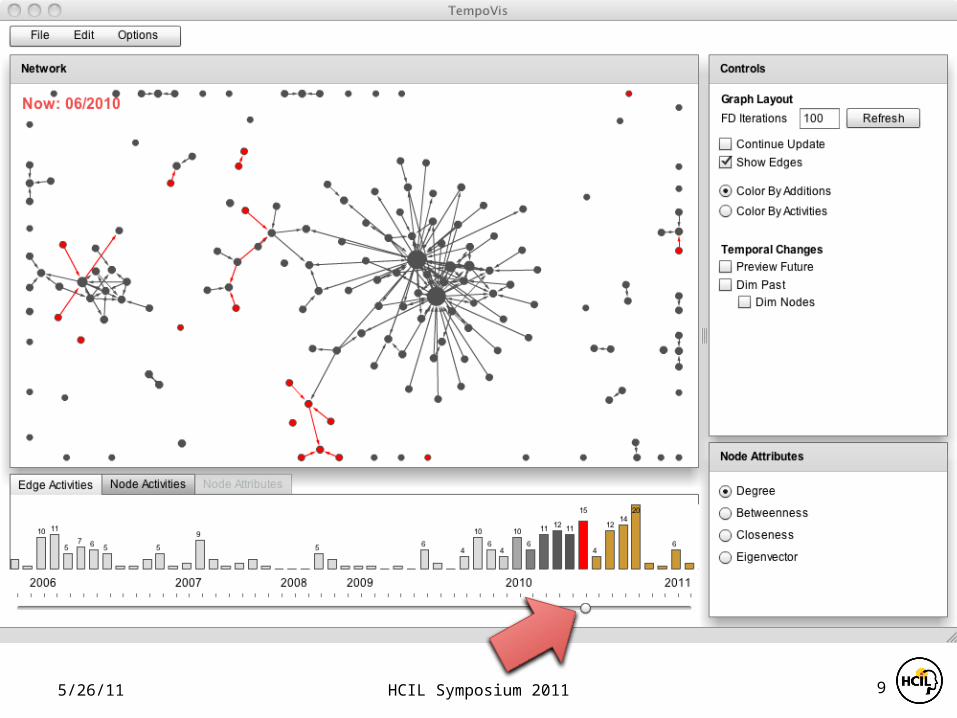
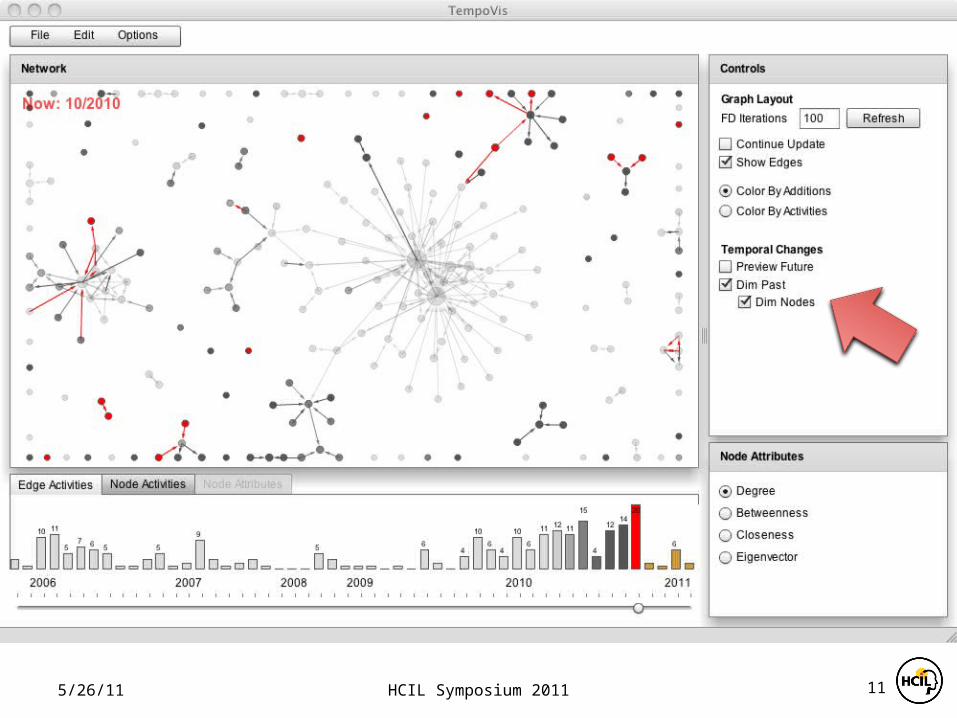
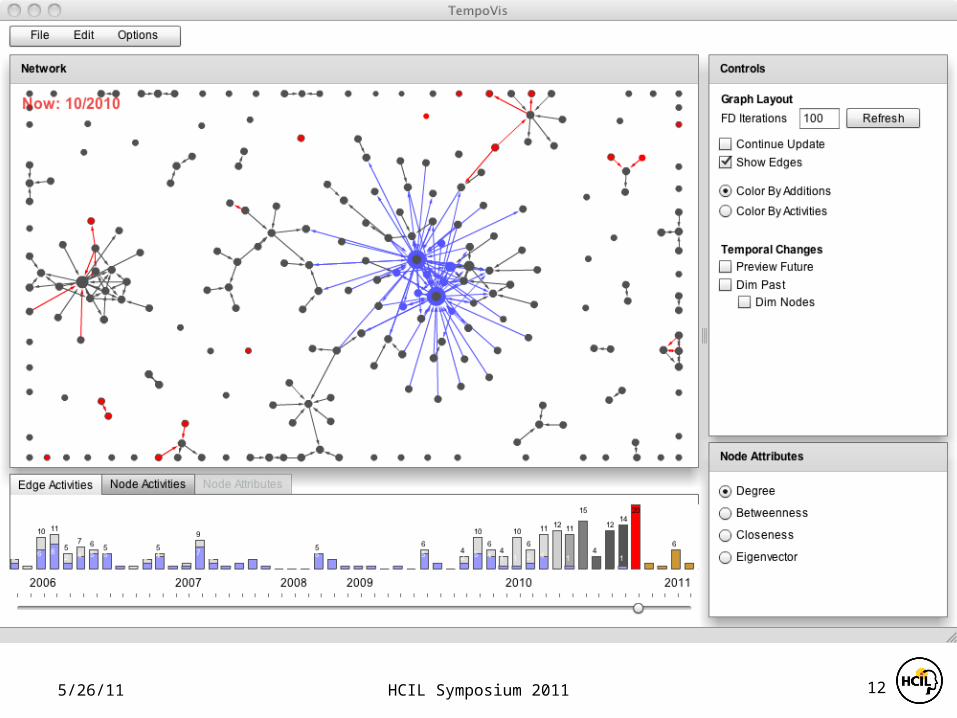
TempoVis
• Combines node/link diagram + timeline visualizations– Navigation with a “Time Slider”– Marquee-selection of sub-groups
• Shows addition and aging of node/links
5/26/11
HCIL Symposium 2011 85/26/11
HCIL Symposium 2011 95/26/11

HCIL Symposium 2011 105/26/11
HCIL Symposium 2011 115/26/11
HCIL Symposium 2011 125/26/11
HCIL Symposium 2011 13
ManyNets
5/26/11
Visualize many networks simultaneously

ManyNets
Post Reply Report
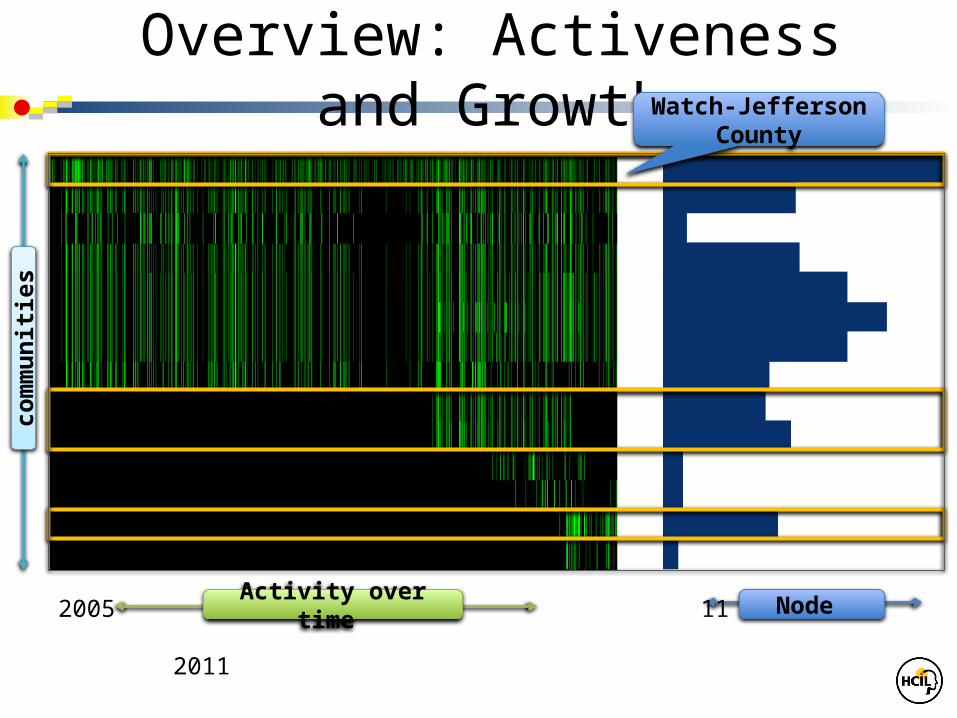
Overview: Activeness and Growth
2005 2011 11 76Activity over time Node
Watch-Jefferson County
com
mun
ities
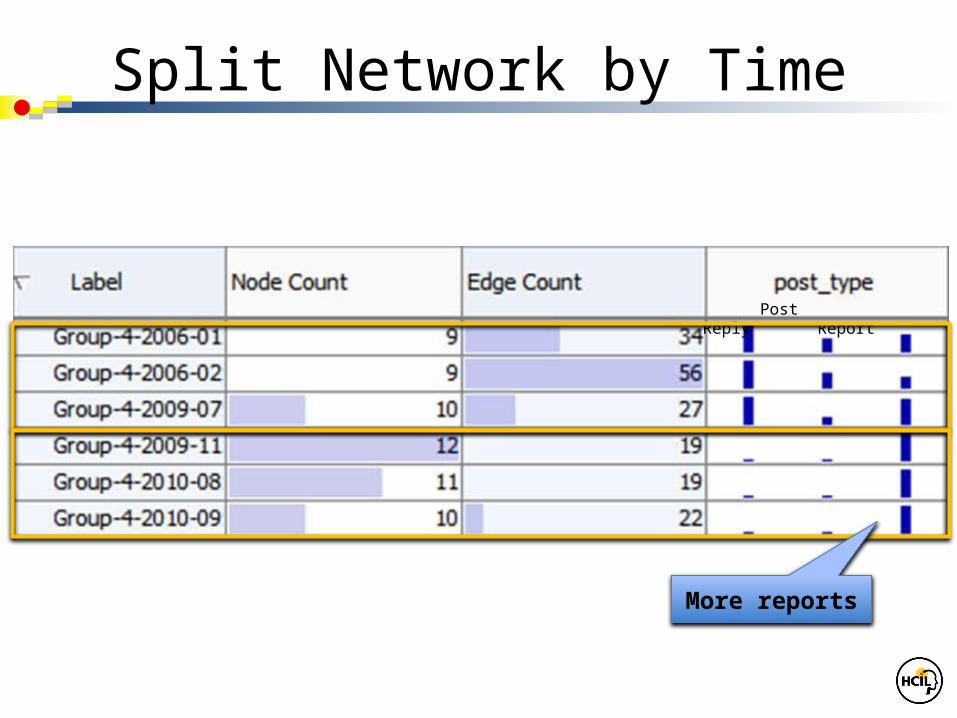
Split Network by Time
Post Reply Report
More reports
HCIL Symposium 2011 17
ManyNets Features
• Quick overview of networks
• Analyze activity patterns over time
• Identify groups and outliers
• Identify similar communities
5/26/11
HCIL Symposium 2011 18
Take Away Message
• Temporal network visualization • Social network (e.g. NoN) data
• Goals– Visually represent temporal changes of networks– Understand the meaning of the changes
• Three visualization tools Different benefits!
5/26/11
HCIL Symposium 2011 19
Acknowledgements• ManyNets development
– Manuel Freire• NodeXL
– Microsoft External Research• Support
– National Science Foundation grant IIS0968521– National Science Foundation-Computing Research Association
Computing Innovation Fellow– Lockheed Martin
• Comments & Feedbacks– Nation of Neighbors team, Art Hanson, Derek Hansen, Mark Smith,
Adam Perer, PJ Rey, and Alan Neustadtlhttp://www.cs.umd.edu/hcil/NON
5/26/11